terrestrial laser scanners self-calibration study: …
TRANSCRIPT
TERRESTRIAL LASER SCANNERS SELF-CALIBRATION STUDY: DATUM
CONSTRAINTS ANALYSES FOR NETWORK CONFIGURATIONS
Mohd Azwan Abbasa, Halim Setanb, Zulkepli Majidb, Albert K. Chongc, Lau Chong Luhb, Khairulnizam M. Idrisb, Mohd Farid
Mohd Ariffb
aDepartment of Surveying Science & Geomatics, Universiti Teknologi MARA, Arau, Perlis, Malaysia bDepartment of Geomatic Engineering, Universiti Teknologi Malaysia, Skudai, Johor, Malaysia
c Department of Geomatic Engineering, University of Southern Queensland, Australia
KEY WORDS: Terrestrial laser scanner, self-calibration, network configuration, datum constraints
ABSTRACT:
Similar to other electronic instruments, terrestrial laser scanner (TLS) can also inherent with various systematic errors coming from
different sources. Self-calibration technique is a method available to investigate these errors for TLS which were adopted from
photogrammetry technique. According to the photogrammetry principle, the selection of datum constraints can cause different types
of parameter correlations. However, the network configuration applied by TLS and photogrammetry calibrations are quite different,
thus, this study has investigated the significant of photogrammetry datum constraints principle in TLS self-calibration. To ensure that
the assessment is thorough, the datum constraints analyses were carried out using three variant network configurations: 1) minimum
number of scan stations; 2) minimum number of surfaces for targets distribution; and 3) minimum number of point targets. Based on
graphical and statistical, the analyses of datum constraints selection indicated that the parameter correlations obtained are
significantly similar. In addition, the analysis has demonstrated that network configuration is a very crucial factor to reduce the
correlation between the calculated parameters.
1. INTRODUCTION
With the speed and accuracy, TLS has been widely used for
numerous applications including accurate measurements. They
are used for a variety of applications that demand sub-
centimetre geometric accuracy such as landslide monitoring
(Syahmi et al., 2011; Wan Aziz et al., 2012), structural
deformation measurement (Gordon and Lichti, 2007; Rönnholm
et al., 2009), dam monitoring (González-Aguilera et al., 2008),
automobile dimensioning (González-Jorge et al., 2012) and
highway clearance measurement (Riveiro et al., 2013), among
others.
TLS instruments are complex tools with many moving parts
whose relative positions can change over time depending on
use, handling frequency and care. Quality assurance (QA) is
therefore a critical process to maximize the accuracy by
investigate and model the systematic errors consisted in TLS
measurement. The investigation procedure can be performed by
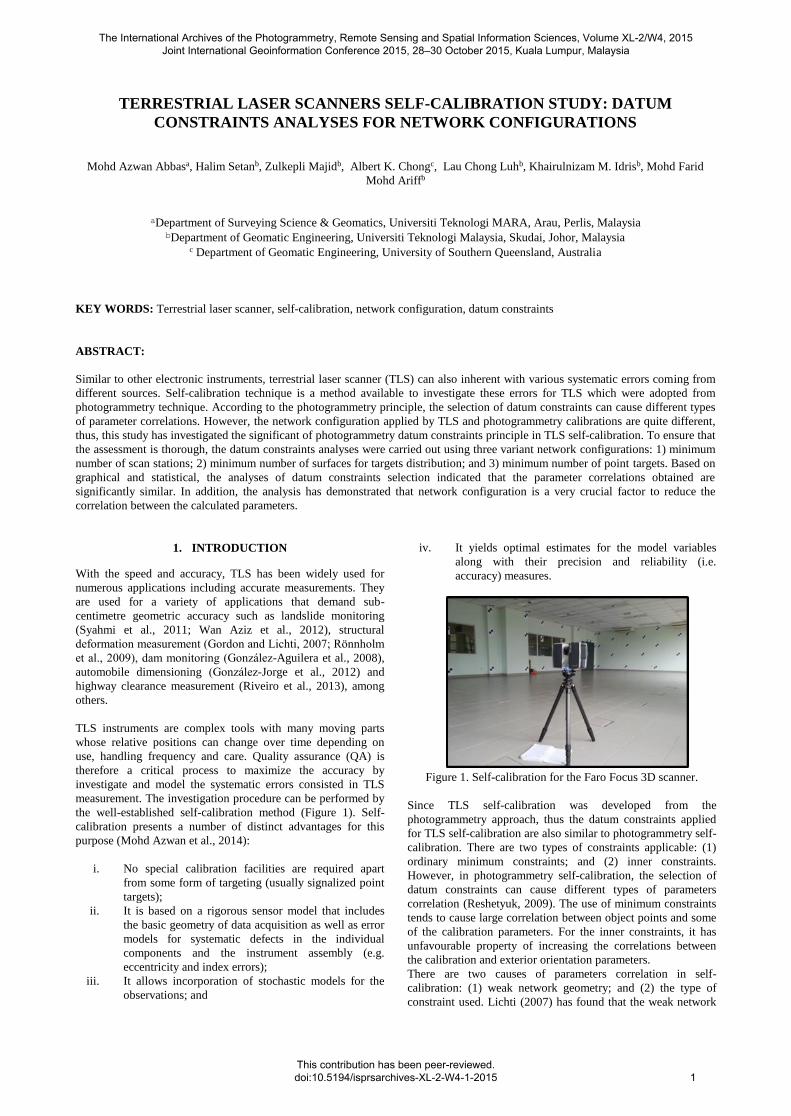
the well-established self-calibration method (Figure 1). Self-
calibration presents a number of distinct advantages for this
purpose (Mohd Azwan et al., 2014):
i. No special calibration facilities are required apart
from some form of targeting (usually signalized point
targets);
ii. It is based on a rigorous sensor model that includes
the basic geometry of data acquisition as well as error
models for systematic defects in the individual
components and the instrument assembly (e.g.
eccentricity and index errors);
iii. It allows incorporation of stochastic models for the
observations; and
iv. It yields optimal estimates for the model variables
along with their precision and reliability (i.e.
accuracy) measures.
Figure 1. Self-calibration for the Faro Focus 3D scanner.
Since TLS self-calibration was developed from the
photogrammetry approach, thus the datum constraints applied
for TLS self-calibration are also similar to photogrammetry self-
calibration. There are two types of constraints applicable: (1)
ordinary minimum constraints; and (2) inner constraints.
However, in photogrammetry self-calibration, the selection of
datum constraints can cause different types of parameters
correlation (Reshetyuk, 2009). The use of minimum constraints
tends to cause large correlation between object points and some
of the calibration parameters. For the inner constraints, it has
unfavourable property of increasing the correlations between
the calibration and exterior orientation parameters.
There are two causes of parameters correlation in self-
calibration: (1) weak network geometry; and (2) the type of
constraint used. Lichti (2007) has found that the weak network
The International Archives of the Photogrammetry, Remote Sensing and Spatial Information Sciences, Volume XL-2/W4, 2015Joint International Geoinformation Conference 2015, 28–30 October 2015, Kuala Lumpur, Malaysia
This contribution has been peer-reviewed.doi:10.5194/isprsarchives-XL-2-W4-1-2015 1
geometry (e.g. limitation size of calibration field and
distribution of range) can caused high correlations between
calibration parameters and exterior orientation parameters as
well as object points. According to the photogrammetry
principle, the later (2) causes can lead to different types of
parameters correlation. However, network configurations (e.g.
targets distribution, size of calibration field and positions of the
sensor) required for the self-calibration of TLS (Figure 1) and
photogrammetry (Figure 2) are different. Thus, it is quite
interesting to investigate whether the photogrammetry principle
for the later (2) causes of parameters correlation is applicable
for TLS self-calibration.
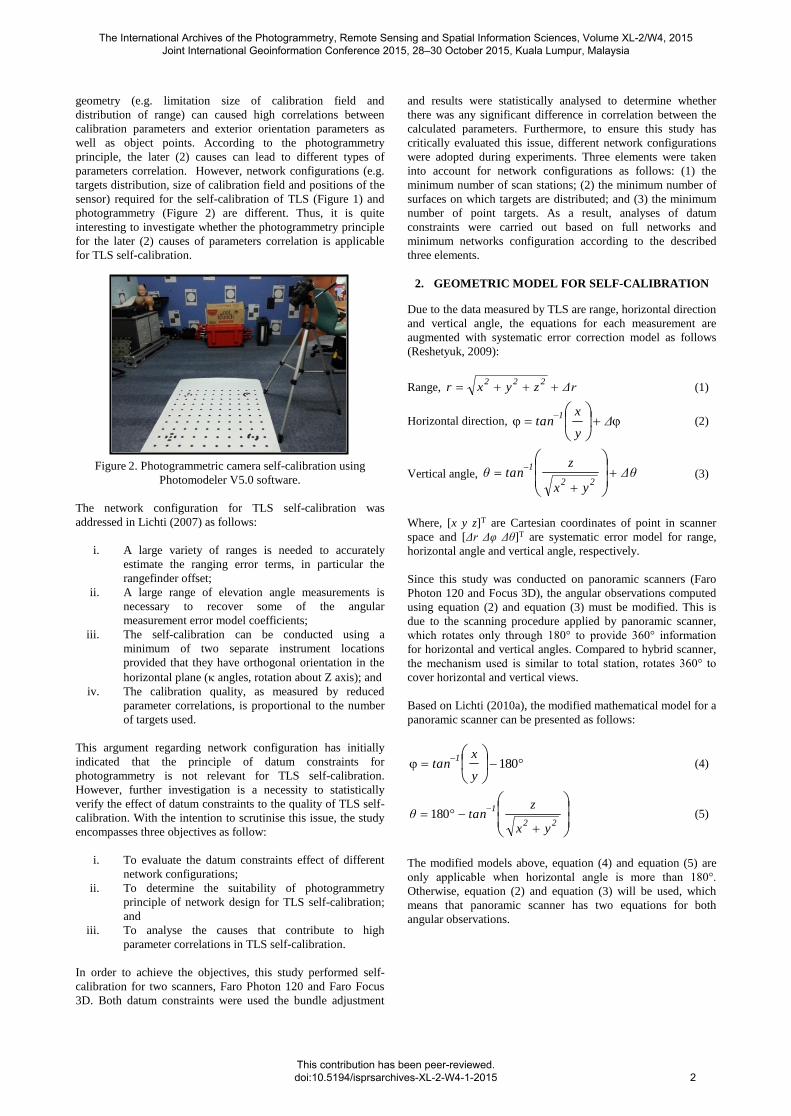
Figure 2. Photogrammetric camera self-calibration using
Photomodeler V5.0 software.
The network configuration for TLS self-calibration was
addressed in Lichti (2007) as follows:
i. A large variety of ranges is needed to accurately
estimate the ranging error terms, in particular the
rangefinder offset;
ii. A large range of elevation angle measurements is
necessary to recover some of the angular
measurement error model coefficients;
iii. The self-calibration can be conducted using a
minimum of two separate instrument locations
provided that they have orthogonal orientation in the
horizontal plane ( angles, rotation about Z axis); and
iv. The calibration quality, as measured by reduced
parameter correlations, is proportional to the number
of targets used.
This argument regarding network configuration has initially
indicated that the principle of datum constraints for
photogrammetry is not relevant for TLS self-calibration.
However, further investigation is a necessity to statistically
verify the effect of datum constraints to the quality of TLS self-
calibration. With the intention to scrutinise this issue, the study
encompasses three objectives as follow:
i. To evaluate the datum constraints effect of different
network configurations;
ii. To determine the suitability of photogrammetry
principle of network design for TLS self-calibration;
and
iii. To analyse the causes that contribute to high
parameter correlations in TLS self-calibration.
In order to achieve the objectives, this study performed self-
calibration for two scanners, Faro Photon 120 and Faro Focus
3D. Both datum constraints were used the bundle adjustment
and results were statistically analysed to determine whether
there was any significant difference in correlation between the
calculated parameters. Furthermore, to ensure this study has
critically evaluated this issue, different network configurations
were adopted during experiments. Three elements were taken
into account for network configurations as follows: (1) the
minimum number of scan stations; (2) the minimum number of
surfaces on which targets are distributed; and (3) the minimum
number of point targets. As a result, analyses of datum
constraints were carried out based on full networks and
minimum networks configuration according to the described
three elements.
2. GEOMETRIC MODEL FOR SELF-CALIBRATION
Due to the data measured by TLS are range, horizontal direction
and vertical angle, the equations for each measurement are
augmented with systematic error correction model as follows
(Reshetyuk, 2009):
Range, Δrzyxr222 (1)
Horizontal direction,
Δ
y
xtan
1 (2)
Vertical angle, Δθyx
ztanθ
22
1
(3)
Where, [x y z]T are Cartesian coordinates of point in scanner
space and [Δr Δφ Δθ]T are systematic error model for range,
horizontal angle and vertical angle, respectively.
Since this study was conducted on panoramic scanners (Faro
Photon 120 and Focus 3D), the angular observations computed
using equation (2) and equation (3) must be modified. This is
due to the scanning procedure applied by panoramic scanner,
which rotates only through 180° to provide 360° information
for horizontal and vertical angles. Compared to hybrid scanner,
the mechanism used is similar to total station, rotates 360° to
cover horizontal and vertical views.
Based on Lichti (2010a), the modified mathematical model for a
panoramic scanner can be presented as follows:
180
y
xtan
1 (4)
22
1
yx
ztanθ 180
(5)
The modified models above, equation (4) and equation (5) are
only applicable when horizontal angle is more than 180°.
Otherwise, equation (2) and equation (3) will be used, which
means that panoramic scanner has two equations for both
angular observations.
The International Archives of the Photogrammetry, Remote Sensing and Spatial Information Sciences, Volume XL-2/W4, 2015Joint International Geoinformation Conference 2015, 28–30 October 2015, Kuala Lumpur, Malaysia
This contribution has been peer-reviewed.doi:10.5194/isprsarchives-XL-2-W4-1-2015
2
3. EXPERIMENTS
According to Lichti (2007), the numbers and distribution of
targets can affect the results of TLS self-calibration. Thus, with
the aim to investigate the concrete evidence of the effect of
datum constraints in TLS self-calibration, this study has
employed several variations of network configurations as
follows:
i. Full network configurations using all targets (138 and
134 for Faro Photon 120 and Faro Focus 3D,
respectively), all surfaces (e.g. four walls and a
ceiling) and 7 scan stations;
ii. Minimum number of scan stations (e.g. two stations);
iii. Minimum number of surfaces (e.g. two surfaces); and
iv. Minimum number of targets with seventy percent
reduction.
Through statistical analysis, the parameter correlations extracted
from each network configuration were evaluated. The results
obtained concluded whether the photogrammetry principle
regarding datum constraints is applicable for TLS self-
calibration.
3.1 Methodology
In this study, a self-calibration was performed using two
panoramic scanners, Faro Photon 120 and Faro Focus 3D. The
calibration was carried out at two different laboratories with
roughly similar dimensions, except the length of the room,
15.5m (length) x 9m (width) x 3m (height) for Faro Photon 120
and 15m length for Faro Focus 3D. The full network
configurations were adopted based on Lichti (2007) conditions
to ensure the quality of the obtained results is optimal.
Due to the used of different calibration laboratories, there was
slightly different in number of targets used, 138 for Faro Photon
120 and 134 for Faro Focus 3D. All targets were well-
distributed on the four walls and ceiling. Since the aims of the
study is to evaluate the affect of datum constraints selection,
which focuses on parameter correlations obtained, thus, small
differences in laboratories size and targets distribution can be
neglected.
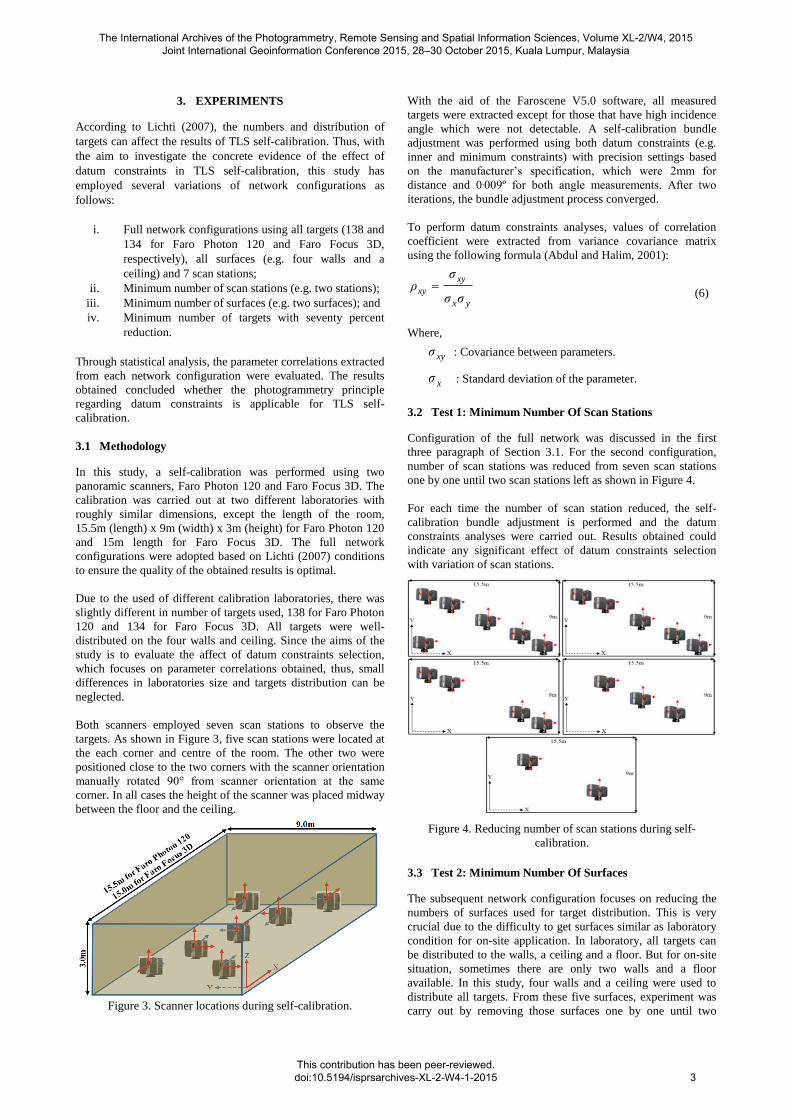
Both scanners employed seven scan stations to observe the
targets. As shown in Figure 3, five scan stations were located at
the each corner and centre of the room. The other two were
positioned close to the two corners with the scanner orientation
manually rotated 90° from scanner orientation at the same
corner. In all cases the height of the scanner was placed midway
between the floor and the ceiling.
Figure 3. Scanner locations during self-calibration.
With the aid of the Faroscene V5.0 software, all measured
targets were extracted except for those that have high incidence
angle which were not detectable. A self-calibration bundle
adjustment was performed using both datum constraints (e.g.
inner and minimum constraints) with precision settings based
on the manufacturer’s specification, which were 2mm for
distance and 0.009º for both angle measurements. After two
iterations, the bundle adjustment process converged.
To perform datum constraints analyses, values of correlation
coefficient were extracted from variance covariance matrix
using the following formula (Abdul and Halim, 2001):
yx
xy
xyσσ
σρ
(6)
Where,
xyσ : Covariance between parameters.
xσ : Standard deviation of the parameter.
3.2 Test 1: Minimum Number Of Scan Stations
Configuration of the full network was discussed in the first
three paragraph of Section 3.1. For the second configuration,
number of scan stations was reduced from seven scan stations
one by one until two scan stations left as shown in Figure 4.
For each time the number of scan station reduced, the self-
calibration bundle adjustment is performed and the datum
constraints analyses were carried out. Results obtained could
indicate any significant effect of datum constraints selection
with variation of scan stations.
Figure 4. Reducing number of scan stations during self-
calibration.
3.3 Test 2: Minimum Number Of Surfaces
The subsequent network configuration focuses on reducing the
numbers of surfaces used for target distribution. This is very
crucial due to the difficulty to get surfaces similar as laboratory
condition for on-site application. In laboratory, all targets can
be distributed to the walls, a ceiling and a floor. But for on-site
situation, sometimes there are only two walls and a floor
available. In this study, four walls and a ceiling were used to
distribute all targets. From these five surfaces, experiment was
carry out by removing those surfaces one by one until two
The International Archives of the Photogrammetry, Remote Sensing and Spatial Information Sciences, Volume XL-2/W4, 2015Joint International Geoinformation Conference 2015, 28–30 October 2015, Kuala Lumpur, Malaysia
This contribution has been peer-reviewed.doi:10.5194/isprsarchives-XL-2-W4-1-2015
3
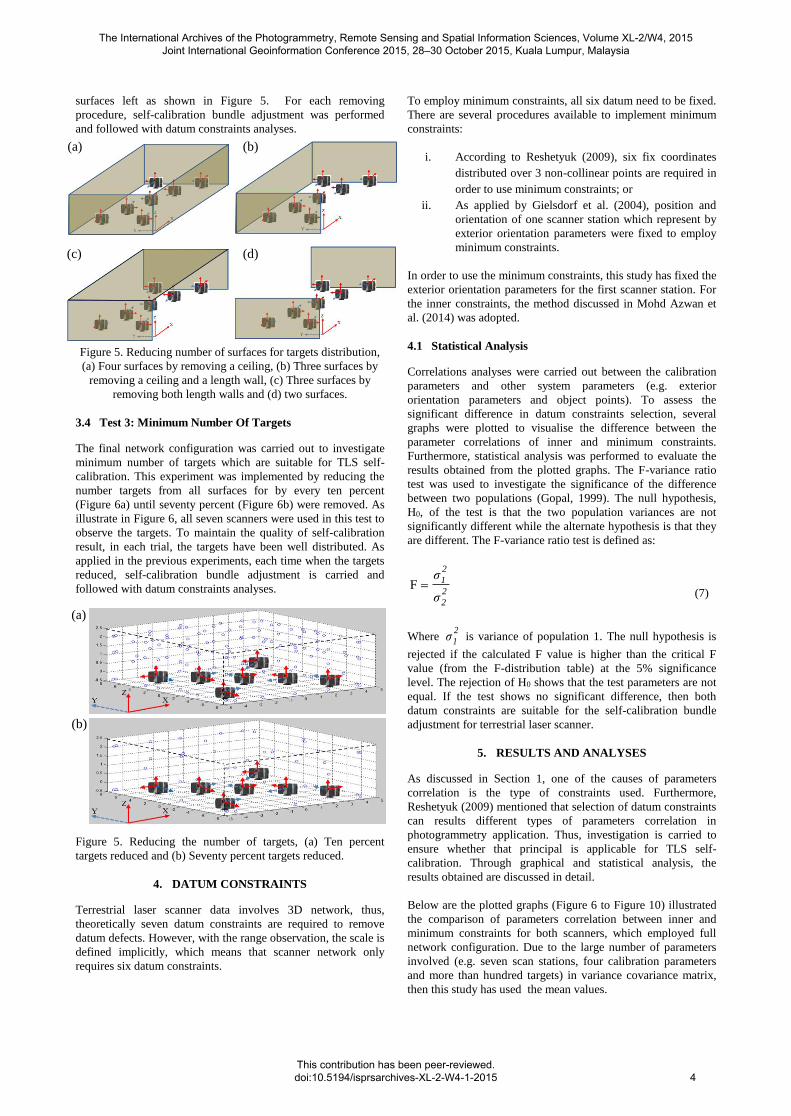
surfaces left as shown in Figure 5. For each removing
procedure, self-calibration bundle adjustment was performed
and followed with datum constraints analyses.
Figure 5. Reducing number of surfaces for targets distribution,
(a) Four surfaces by removing a ceiling, (b) Three surfaces by
removing a ceiling and a length wall, (c) Three surfaces by
removing both length walls and (d) two surfaces.
3.4 Test 3: Minimum Number Of Targets
The final network configuration was carried out to investigate
minimum number of targets which are suitable for TLS self-
calibration. This experiment was implemented by reducing the
number targets from all surfaces for by every ten percent
(Figure 6a) until seventy percent (Figure 6b) were removed. As
illustrate in Figure 6, all seven scanners were used in this test to
observe the targets. To maintain the quality of self-calibration
result, in each trial, the targets have been well distributed. As
applied in the previous experiments, each time when the targets
reduced, self-calibration bundle adjustment is carried and
followed with datum constraints analyses.
Figure 5. Reducing the number of targets, (a) Ten percent
targets reduced and (b) Seventy percent targets reduced.
4. DATUM CONSTRAINTS
Terrestrial laser scanner data involves 3D network, thus,
theoretically seven datum constraints are required to remove
datum defects. However, with the range observation, the scale is
defined implicitly, which means that scanner network only
requires six datum constraints.
To employ minimum constraints, all six datum need to be fixed.
There are several procedures available to implement minimum
constraints:
i. According to Reshetyuk (2009), six fix coordinates
distributed over 3 non-collinear points are required in
order to use minimum constraints; or
ii. As applied by Gielsdorf et al. (2004), position and
orientation of one scanner station which represent by
exterior orientation parameters were fixed to employ
minimum constraints.
In order to use the minimum constraints, this study has fixed the
exterior orientation parameters for the first scanner station. For
the inner constraints, the method discussed in Mohd Azwan et
al. (2014) was adopted.
4.1 Statistical Analysis
Correlations analyses were carried out between the calibration
parameters and other system parameters (e.g. exterior
orientation parameters and object points). To assess the
significant difference in datum constraints selection, several
graphs were plotted to visualise the difference between the
parameter correlations of inner and minimum constraints.
Furthermore, statistical analysis was performed to evaluate the
results obtained from the plotted graphs. The F-variance ratio
test was used to investigate the significance of the difference
between two populations (Gopal, 1999). The null hypothesis,
H0, of the test is that the two population variances are not
significantly different while the alternate hypothesis is that they
are different. The F-variance ratio test is defined as:
2
2
2
1
σ
σF
(7)
Where 2
1σ is variance of population 1. The null hypothesis is
rejected if the calculated F value is higher than the critical F
value (from the F-distribution table) at the 5% significance
level. The rejection of H0 shows that the test parameters are not
equal. If the test shows no significant difference, then both
datum constraints are suitable for the self-calibration bundle
adjustment for terrestrial laser scanner.
5. RESULTS AND ANALYSES
As discussed in Section 1, one of the causes of parameters
correlation is the type of constraints used. Furthermore,
Reshetyuk (2009) mentioned that selection of datum constraints
can results different types of parameters correlation in
photogrammetry application. Thus, investigation is carried to
ensure whether that principal is applicable for TLS self-
calibration. Through graphical and statistical analysis, the
results obtained are discussed in detail.
Below are the plotted graphs (Figure 6 to Figure 10) illustrated
the comparison of parameters correlation between inner and
minimum constraints for both scanners, which employed full
network configuration. Due to the large number of parameters
involved (e.g. seven scan stations, four calibration parameters
and more than hundred targets) in variance covariance matrix,
then this study has used the mean values.
(a)
(c) (d)
(b)
(a)
(b)
The International Archives of the Photogrammetry, Remote Sensing and Spatial Information Sciences, Volume XL-2/W4, 2015Joint International Geoinformation Conference 2015, 28–30 October 2015, Kuala Lumpur, Malaysia
This contribution has been peer-reviewed.doi:10.5194/isprsarchives-XL-2-W4-1-2015
4
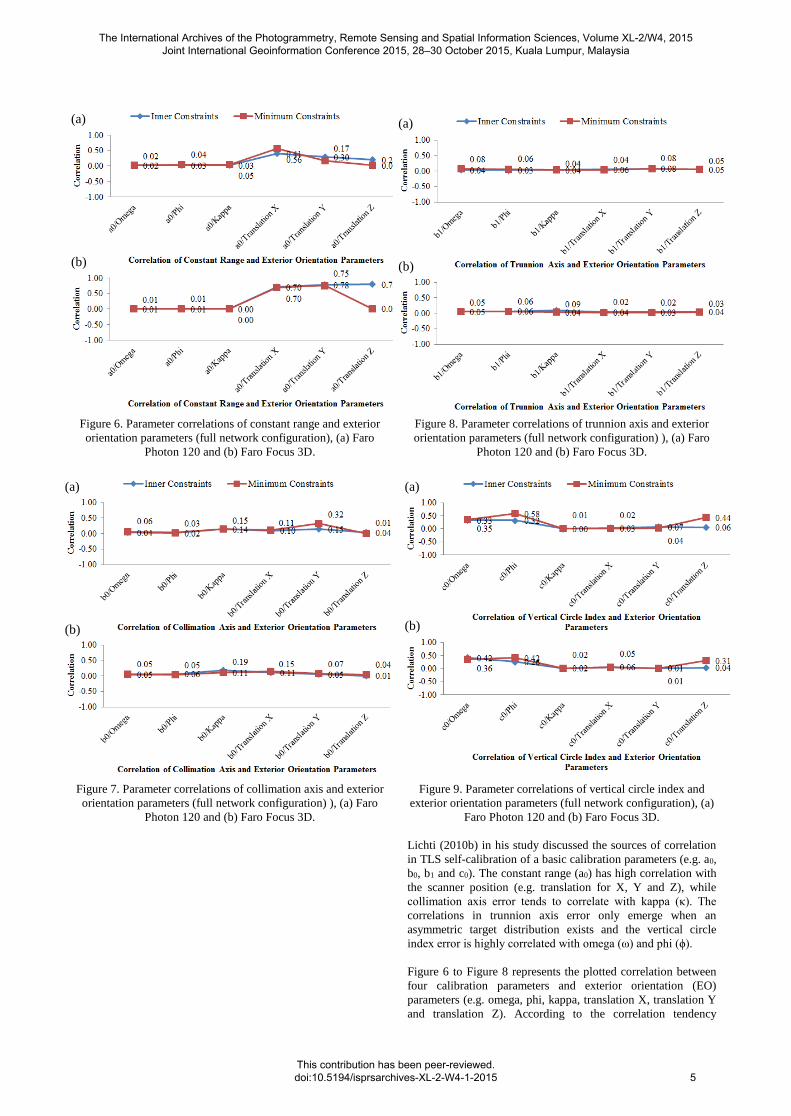
Figure 6. Parameter correlations of constant range and exterior
orientation parameters (full network configuration), (a) Faro
Photon 120 and (b) Faro Focus 3D.
Figure 7. Parameter correlations of collimation axis and exterior
orientation parameters (full network configuration) ), (a) Faro
Photon 120 and (b) Faro Focus 3D.
Figure 8. Parameter correlations of trunnion axis and exterior
orientation parameters (full network configuration) ), (a) Faro
Photon 120 and (b) Faro Focus 3D.
Figure 9. Parameter correlations of vertical circle index and
exterior orientation parameters (full network configuration), (a)
Faro Photon 120 and (b) Faro Focus 3D.
Lichti (2010b) in his study discussed the sources of correlation
in TLS self-calibration of a basic calibration parameters (e.g. a0,
b0, b1 and c0). The constant range (a0) has high correlation with
the scanner position (e.g. translation for X, Y and Z), while
collimation axis error tends to correlate with kappa (κ). The
correlations in trunnion axis error only emerge when an
asymmetric target distribution exists and the vertical circle
index error is highly correlated with omega (ω) and phi (ϕ).
Figure 6 to Figure 8 represents the plotted correlation between
four calibration parameters and exterior orientation (EO)
parameters (e.g. omega, phi, kappa, translation X, translation Y
and translation Z). According to the correlation tendency
(a)
(b)
(a)
(b)
(a)
(b)
(a)
(b)
The International Archives of the Photogrammetry, Remote Sensing and Spatial Information Sciences, Volume XL-2/W4, 2015Joint International Geoinformation Conference 2015, 28–30 October 2015, Kuala Lumpur, Malaysia
This contribution has been peer-reviewed.doi:10.5194/isprsarchives-XL-2-W4-1-2015
5

described in Lichti (2010b), similar trends have been illustrated
in Figure 6 until Figure 8. As the aim of this study is to
investigate the datum constraints effect in TLS self-calibration,
each graph provides the comparison of parameter correlation
yielded from using inner (blue line) and minimum (red line)
constraints.
Figure 10. Parameter correlations of calibration parameters
and object points (full network configuration), (a) Faro
Photon 120 and (b) Faro Focus 3D.
Figure 10 is depicting the correlation of calibration parameters
with object points. Through the visual evaluation, initial
conclusion can be made that the parameter correlation
produced from both datum constraints are significantly
similar. Although there are several outliers presented with
maximum differences are 0.38 (between vertical circle index,
c0 and translation Z in Figure 9a) for Faro Photon 120 and
0.77 (between constant range, a0 and translation Z in Figure
6b) for Faro Focus 3D. However, these large discrepancies
can be considered as uncertainty due to the minor differences
shown by the other scanner, which are 0.27 in Figure 9b (for
Faro Focus 3D) and 0.18 in Figure 6a (for Faro Photon 120).
Through statistical analysis, F-variance ratio test has
mathematically proved the similarity of results obtained.
Table 1. F-variance ratio test for full network configuration.
Table 1 shows that in all cases, with 95% confidence level, the
calculated F is smaller than critical F, which indicates the
acceptation of null hypothesis (H0). In other words, comparison
of parameters correlation calculated from using inner and
minimum constraints have demonstrated a significant similarity.
Since this is the results of full network which have employed
very strong network geometry, thus, the good findings is
expected.
With the intention to investigate the robustness conclusion
regarding similarity of the correlation results yielded from both
datum constraints, this study has carried out similar analysis for
different type of network configurations. The first configuration
is by reducing the number of scan stations. For each stations
configuration, statistical analysis is performed as depicted in
Table 2. For all cases, the calculated F for both scanners are
smaller than critical F. In other words, the null hypothesis are
accepted which mean no significant difference between both
datum constraints.
Table 2. F-variance ratio test for different stations
configurations.
Through different surfaces configurations experiment, the
datum constraints analysis was again performed. Outcomes of
F-variance ratio test were organised in the Table 3 for four
different types of surfaces configurations. Values of calculated
F for all circumstances have indicated the acceptance of null
hypothesis, which also has increase the certainty of previous
conclusion, there is no significant effect in datum constraints
selection.
For the final configuration, different number of targets
distribution, F-variance ratio test has concretely proved that
there is no significant effect in parameter correlations from the
datum constraints selection. As shown in Table 4, the null
hypotheses have again statistically verified the significant
similarity of both datum constraints.
Parameter
Correlations
Calculated F for Faro >/< Critical F
Photon 120 Focus 3D
a0 / EO 0.09 0.35 < 5.05
b0 / EO 0.42 0.001 < 5.05
b1 / EO 0.01 2.50 < 5.05
c0 / EO 0.69 0.33 < 5.05
CP / OP 0.01 0.01 < 9.28
Configuration Parameter
Correlations
Calculated F for
Faro: >/<
Critical
F Photon
120
Focus
3D
6 Stations
a0 / EO 0.07 0.22 < 5.05
b0 / EO 0.18 0.00 < 5.05
b1 / EO 0.16 2.48 < 5.05
c0 / EO 0.71 0.27 < 5.05
CP / OP 0.86 0.01 < 9.28
5 Stations
a0 / EO 0.05 0.13 < 5.05
b0 / EO 0.37 0.01 < 5.05
b1 / EO 0.00 2.80 < 5.05
c0 / EO 0.63 0.28 < 5.05
CP / OP 0.86 0.02 < 9.28
4 Stations
a0 / EO 0.17 0.26 < 5.05
b0 / EO 0.32 0.00 < 5.05
b1 / EO 0.21 2.08 < 5.05
c0 / EO 0.77 0.82 < 5.05
CP / OP 0.75 0.02 < 9.28
3 Stations
a0 / EO 0.06 0.07 < 5.05
b0 / EO 0.00 0.33 < 5.05
b1 / EO 1.63 0.73 < 5.05
c0 / EO 0.47 1.28 < 5.05
CP / OP 0.19 0.02 < 9.28
2 Stations
a0 / EO 0.14 0.27 < 5.05
b0 / EO 0.11 0.03 < 5.05
b1 / EO 0.15 0.39 < 5.05
c0 / EO 0.15 0.48 < 5.05
CP / OP 0.11 0.11 < 9.28
(a)
(b)
The International Archives of the Photogrammetry, Remote Sensing and Spatial Information Sciences, Volume XL-2/W4, 2015Joint International Geoinformation Conference 2015, 28–30 October 2015, Kuala Lumpur, Malaysia
This contribution has been peer-reviewed.doi:10.5194/isprsarchives-XL-2-W4-1-2015
6
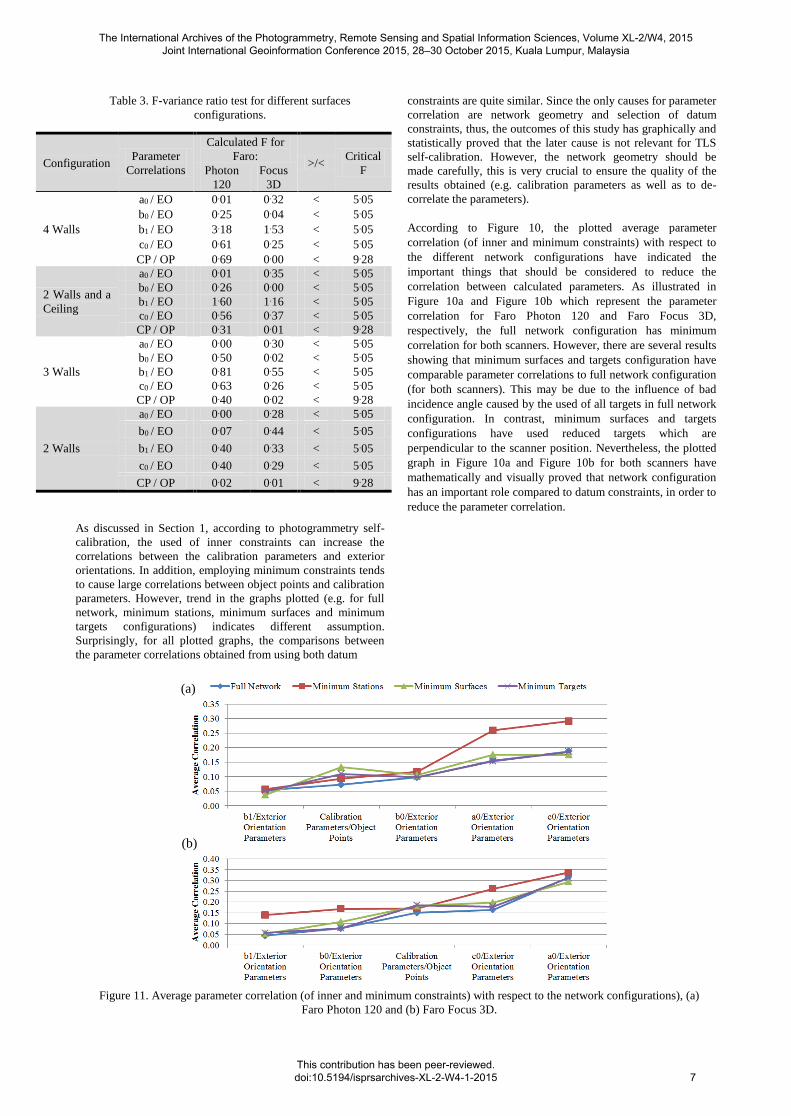
Table 3. F-variance ratio test for different surfaces
configurations.
As discussed in Section 1, according to photogrammetry self-
calibration, the used of inner constraints can increase the
correlations between the calibration parameters and exterior
orientations. In addition, employing minimum constraints tends
to cause large correlations between object points and calibration
parameters. However, trend in the graphs plotted (e.g. for full
network, minimum stations, minimum surfaces and minimum
targets configurations) indicates different assumption.
Surprisingly, for all plotted graphs, the comparisons between
the parameter correlations obtained from using both datum
constraints are quite similar. Since the only causes for parameter
correlation are network geometry and selection of datum
constraints, thus, the outcomes of this study has graphically and
statistically proved that the later cause is not relevant for TLS
self-calibration. However, the network geometry should be
made carefully, this is very crucial to ensure the quality of the
results obtained (e.g. calibration parameters as well as to de-
correlate the parameters).
According to Figure 10, the plotted average parameter
correlation (of inner and minimum constraints) with respect to
the different network configurations have indicated the
important things that should be considered to reduce the
correlation between calculated parameters. As illustrated in
Figure 10a and Figure 10b which represent the parameter
correlation for Faro Photon 120 and Faro Focus 3D,
respectively, the full network configuration has minimum
correlation for both scanners. However, there are several results
showing that minimum surfaces and targets configuration have
comparable parameter correlations to full network configuration
(for both scanners). This may be due to the influence of bad
incidence angle caused by the used of all targets in full network
configuration. In contrast, minimum surfaces and targets
configurations have used reduced targets which are
perpendicular to the scanner position. Nevertheless, the plotted
graph in Figure 10a and Figure 10b for both scanners have
mathematically and visually proved that network configuration
has an important role compared to datum constraints, in order to
reduce the parameter correlation.
Configuration Parameter
Correlations
Calculated F for
Faro: >/<
Critical
F Photon
120
Focus
3D
4 Walls
a0 / EO 0.01 0.32 < 5.05
b0 / EO 0.25 0.04 < 5.05
b1 / EO 3.18 1.53 < 5.05
c0 / EO 0.61 0.25 < 5.05
CP / OP 0.69 0.00 < 9.28
2 Walls and a
Ceiling
a0 / EO 0.01 0.35 < 5.05
b0 / EO 0.26 0.00 < 5.05
b1 / EO 1.60 1.16 < 5.05
c0 / EO 0.56 0.37 < 5.05
CP / OP 0.31 0.01 < 9.28
3 Walls
a0 / EO 0.00 0.30 < 5.05
b0 / EO 0.50 0.02 < 5.05
b1 / EO 0.81 0.55 < 5.05
c0 / EO 0.63 0.26 < 5.05
CP / OP 0.40 0.02 < 9.28
2 Walls
a0 / EO 0.00 0.28 < 5.05
b0 / EO 0.07 0.44 < 5.05
b1 / EO 0.40 0.33 < 5.05
c0 / EO 0.40 0.29 < 5.05
CP / OP 0.02 0.01 < 9.28
(a)
(b)
Figure 11. Average parameter correlation (of inner and minimum constraints) with respect to the network configurations), (a)
Faro Photon 120 and (b) Faro Focus 3D.
The International Archives of the Photogrammetry, Remote Sensing and Spatial Information Sciences, Volume XL-2/W4, 2015Joint International Geoinformation Conference 2015, 28–30 October 2015, Kuala Lumpur, Malaysia
This contribution has been peer-reviewed.doi:10.5194/isprsarchives-XL-2-W4-1-2015
7

Table 4. F-variance ratio test for different targets configurations.
6. CONCLUSIONS
A self-calibration procedure used for TLS calibration was
originally adapted from photogrammetry technique, however
the photogrammetry network configuration is not suitable for
TLS application. This is due to the observables and
measurement technique implemented by both photogrammetry
and TLS are different. Therefore, further investigation was
carried out to evaluate whether similar effect in datum
constraints selection for photogrammetry is relevant for TLS.
Graphical and statistical analyses were employed to examine
any significant differences in the parameter correlations
obtained from inner or minimum constraints.
To ensure that the investigation is thoroughly executed, the
datum constraints analyses were carried out using three variant
network configurations: 1) minimum number of scan stations,
2) minimum number of surfaces for targets distribution, and 3)
minimum number of point targets. The datum constraints
analyses for all network configurations have indicated that the
selection of datum constraints does not affect the values of
parameter correlations. Both inner and minimum constraints can
provide significantly similar parameter correlations.
Nevertheless, the network configuration is a very crucial
procedure to ensure that the correlation between the calculated
parameters can be reduced.
Since both scanners employed in this study are using panoramic
system, it is quite interesting to implement similar analysis for
the hybrid system scanner. Furthermore, the measurement
mechanism used in panoramic and hybrid scanners are different,
thus, further research will focus on the investigation of datum
constraints effect for the hybrid scanner.
ACKNOWLEDGEMENTS
The present research was made possible through a guide from
Professor Doctor Derek D. Lichti from University of Calgary in
helping to build the bundle adjustment program. Special thanks
goes to Ministry of Higher Education (MoHE) and
Photogrammetry & Laser Scanning Research Group,
INFOCOMM Research Alliance, UTM for the facility and
technical support in this project. Authors also would like to
acknowledge the Universiti Teknologi MARA (UiTM) for the
financial support for my PhD study.
REFERENCES
Abdul, W. I. and Halim, S., 2001. Pelarasan Ukur. Dewan
Bahasa dan Pustaka, Kuala Lumpur. 385 pages: 5-9.
Brian, F., Catherine, L. C. and Robert, R., 2004. Investigation
on Laser Scanners. IWAA2004, CERN, Geneva.
Fraser, C. S., 1996. Network Design. In Close Photogrammetry
and Machine Vision (Eds. by K. B. Atkinson). Whittles
Publishing, Roseleigh House, Latheronwheel, Scotland, UK.
371 pages: 256-279.
Gielsdorf, F., Rietdorf, A. and Gruendig, L., 2004. A Concept
for the Calibration of Terrestrial Laser Scanners. TS26
Positioning and Measurement Technologies and Practices II-
Laser Scanning and Photogrammetry. FIG Working Week
2004, Athens, Greece: 1-10.
González-Aguilera, D. Gómez-Lahoz, J. and Sánchez, J., 2008.
A new approach for structural monitoring of large dams with a
three-dimensional laser scanner. Sensors, 8 (9): 5866-5883.
González-Jorge, H., Riveiro, B., Arias, P. and Armesto, J.,
2012. Photogrammetry and laser scanner technology applied to
length measurements in car testing laboratories. Measurement
45: 354-363.
Gopal, K. K., 1999. 100 Statistical Test. Thousand Oaks,
California: SAGE Publications Ltd. 215 pages: 37-38.
Gordon, S.J. and Lichti, D.D., 2007. Modeling terrestrial laser
scanner data for precise structural deformation measurement.
ASCE Journal of Surveying Engineering. 133 (2): 72-80.
Lichti, D. D., 2007. Error Modelling, Calibration and Analysis
of an AM-CW Terrestrial Laser Scanner System. ISPRS Journal
of Photogrammetry & Remote Sensing 61: 307-324.
Lichti, D. D., 2010a. A Review of Geometric Models and Self-
Calibration Methods for Terrestrial Laser Scanner. Bol. Ciȇnc.
Geod., sec. Artigos, Curitiba, 2010:3-19.
Configuration Parameter
Correlations
Calculated F for
Faro: >/<
Critical
F Photon
120
Focus
3D
10% Targets
Reduction
a0 / EO 0.07 0.35 < 5.05
b0 / EO 0.20 0.00 < 5.05
b1 / EO 0.53 3.07 < 5.05
c0 / EO 0.61 0.30 < 5.05
CP / OP 0.52 0.01 < 9.28
20% Targets
Reduction
a0 / EO 0.08 0.36 < 5.05
b0 / EO 0.27 0.00 < 5.05
b1 / EO 0.27 2.98 < 5.05
c0 / EO 0.61 0.33 < 5.05
CP / OP 0.45 0.01 < 9.28
30% Targets
Reduction
a0 / EO 0.10 0.36 < 5.05
b0 / EO 0.39 0.04 < 5.05
b1 / EO 0.29 2.10 < 5.05
c0 / EO 0.62 0.35 < 5.05
CP / OP 0.61 0.02 < 9.28
40% Targets
Reduction
a0 / EO 0.09 0.35 < 5.05
b0 / EO 0.28 0.05 < 5.05
b1 / EO 0.52 1.73 < 5.05
c0 / EO 0.56 0.29 < 5.05
CP / OP 0.58 0.01 < 9.28
50% Targets
Reduction
a0 / EO 0.09 0.36 < 5.05
b0 / EO 0.27 0.10 < 5.05
b1 / EO 1.22 1.21 < 5.05
c0 / EO 0.55 0.29 < 5.05
CP / OP 0.30 0.02 < 9.28
60% Targets
Reduction
a0 / EO 0.08 0.35 < 5.05
b0 / EO 0.18 0.01 < 5.05
b1 / EO 0.61 0.17 < 5.05
c0 / EO 0.56 0.23 < 5.05
CP / OP 0.27 0.02 < 9.28
70% Targets
Reduction
a0 / EO 0.10 0.34 < 5.05
b0 / EO 0.14 0.00 < 5.05
b1 / EO 0.01 0.20 < 5.05
c0 / EO 0.71 0.20 < 5.05
CP / OP 0.30 0.01 < 9.28
The International Archives of the Photogrammetry, Remote Sensing and Spatial Information Sciences, Volume XL-2/W4, 2015Joint International Geoinformation Conference 2015, 28–30 October 2015, Kuala Lumpur, Malaysia
This contribution has been peer-reviewed.doi:10.5194/isprsarchives-XL-2-W4-1-2015
8
Lichti, D.D., 2010b. Terrestrial Laser Scanner Self Calibration:
Correlation Sources and Their Mitigation. ISPRS Journal of
Photogrammetry & Remote Sensing 65: 93-102.
Mohd Azwan, A., Halim, S., Zulkepli, M., Albert K. C.,
Khairulnizam, M. I. and Anuar, A.. 2013. Calibration and
Accuracy Assessment of Leica ScanStation C10 Terrestrial
Laser Scanner. Development in Multidimensional Spatial Data
Models, Springer Lecture Notes in Geoinformation and
Cartography (LNG&C), March 2013: 33-47.
Mohd Azwan, A., Lichti, D. D., Albert K. C., Halim, S. and
Zulkepli, M. 2014. An On-Site Approach for the Self-
Calibration of Terrestrial Laser Scanner. Measurement 52: 111-
123.
Reshetyuk, Y., 2009. Self-Calibration and Direct
Georeferencing in Terrestrial Laser Scanning. Doctoral Thesis
in Infrastructure, Royal Institute of Technology (KTH),
Stockholm, Sweden. 162 pages: 68-69.
Riveiro B., González-Jorge H., Varela M. and Jauregui D.V.,
2013. Validation of terrestrial laser scanning and
photogrammetry techniques for the measurement of vertical
underclearance and beam geometry in structural inspection of
bridges. Measurement (46): 184-794.
Rönnholm, P., Nuikka, M., Suominen, A., Salo, P., Hyyppä, H.,
Pöntinen, P., Haggrén, H., Vermeer, M., Puttonen, J., Hirsi, H.,
Kukko, A., Kaartinen, H., Hyyppä, J. and Jaakkola, A., 2009.
Comparison of measurement techniques and static theory
applied to concrete beam deformation. The Photogrammetric
Record, 24(128): 351-371.
Syahmi, M. Z., Wan Aziz, W. A., Zulkarnaini, M. A., Anuar, A.
and Othman, Z., 2011. The Movement Detection on the
Landslide Surface by Using Terrestrial Laser Scanning. Control
and System Graduate Research Colloquium (ICSGRC), 2011
IEEE, Shah Alam, Selangor.
Wan Aziz, W. A., Khairul, N. T. and Anuar, A., 2012. Slope
Gradient Analysis at Different Resolution Using Terrestrial
Laser Scanner. Signal Processing and its Applications (CSPA),
2012 IEEE 8th International Colloquium, Melaka.
The International Archives of the Photogrammetry, Remote Sensing and Spatial Information Sciences, Volume XL-2/W4, 2015Joint International Geoinformation Conference 2015, 28–30 October 2015, Kuala Lumpur, Malaysia
This contribution has been peer-reviewed.doi:10.5194/isprsarchives-XL-2-W4-1-2015
9