term 2 2011 volume 48 - mav - the mathematical...
TRANSCRIPT

Remember Martin Gardner? Five Interesting Puzzles
Your Secret Footy Tipping Weapon
My Web Site: CensusAtSchool
Mathematical Modelling
Vo
lum
e 48
Ter
m 2
201
1
ISSN 0157 - 759X Registered by Australia Post - Publication No. VGB 0254
Vin
culu
m

TI-Nspire TI-Navigator™ helps teachers in the classroom by;
ßProvidingaccesstostudentsTI-Nspiredevicesinrealtime
ßAutomaticallygradingquizzes,testandrecordingeachstudent’sprogress
ßIncreasingstudentengagementbytailoringindividualisedworklessonsinthesameclass
ßAllowinganystudentbethepresenterandsharetheirworkingswithotherstudents
ßSendingandreceivinglessons,homework,quizzesandtestswirelessly
*TI-Navigator™isaninteractivewirelessnetwork
YourPassion.OurTechnology.StudentSuccess.FordetailstelephoneAustralia1300 138 140,NewZealand0800 770 [email protected]://education.ti.com/asiapacific G
OTO
WO
TEX4
883
02/1
1
NEW TI-Nspire™ Navigator™ system*
NEW TI-Nspire™ Navigator™ system*
…allows you to see what your students are thinking.
…allows you to see what your students are thinking.

Get to know the fx-82AU PLUS
All-new learning manual for
teachers and students
Simple mathematical tasks with concise how-to
sequences, images and screenshots
For more details visit www.casio.edu.shriro.com.au or call 1300 768 112
FREEto all mathematic teachers in the
CASIO Top Schools Program
SH003ManualFlyer_v2.indd 1 9/12/10 2:20:27 PM

Vin
culu
m
In this issue
Volu
me
48
Te
rm 2
20
11
Vinculum may contain paid advertisements for third party products and services. Third party advertisements are not endorsements or recommendations by The Mathematical Association of Victoria of the products or services offered. The MAV does not make any representation as to the accuracy or suitability of any of the information contained in those advertisements. The MAV takes no responsibility for the content of the ads, promises made, or the quality/reliability of the products or services offered in all advertisements.
For more information about advertising in Vinculum, please contact the Mathematical Association of Victoria (MAV) office.
The opinions expressed in this journal do not necessarily reflect the position, opinions, policy or endorsement by the MAV, and unless otherwise noted, should not be interpreted as the official position of Council.
THE MATHEMATICALASSOCIATION OF VICTORIA
EditorRoger WalterEditorial BoardJill Brown John Gough Marj Horne David Leigh-Lancaster David ShallcrossCover imageThis image is from Martin Gardner’s The Colossal Book of Short Puzzles and Problems. What is the minimum number of circles you need to remove so that the centres of all remaining circles form no equilateral triangles? Read more about Martin Gardner on page 4.ProductionPublishing Solutions Pty Ltd www.publishing-solutions.com.auContributions and CorrespondenceThe Editor, Roger Walter C/- MAVEmail: [email protected] and Journal SubscriptionsChief Executive Officer, Simon PryorEmail: [email protected] Mathematical Association of Victoria Cliveden 61 Blyth Street Brunswick VIC 3056Tel: +613 9380 2399Fax: +613 9389 0399Email: [email protected]: www.mav.vic.edu.auABN: 34 004 892 755
3 Editorial
4 Remember Martin GardnerRobert Money
7 Join the MAV on Facebook
8 Dominance Matrices: Your Secret Weapon in Footy TippingRoger Walter
10 Probabilistic and Gaussian Football TippingDavid Dowe
13 My Web Site: CensusAtSchoolJean Arnott
17 Stop Teaching Calculating, Start Teaching MathsLinda Shardlow
20 Mathematical Modelling and ApplicationsGloria Stillman & Jill Brown
3
V I N C U L U M VOLUME 48 TERM 2 2011
Editorial
effectively. Developing a new curriculum is only a very small part of the scene. Fleshing it out in terms of teaching practice and techniques, materials and resources, is what is going to determine how effective it becomes. Victoria in general and the MAV in particular have always taken the initiative in developing innovative and useful programmes and materials, and there is no reason why we should not continue to be active contributors and innovators, now nationwide and in the context of the Australian Curriculum.
Finally, what of the future? Our mobility and worldview are becoming more and more international. I have also spent time preparing materials for the International Baccalaureate. The ‘IB’ is an international course which covers years K–12 and produces a qualification which is accepted in Universities worldwide. Wikipedia lists 63 Australian schools which are currently offering the International Baccalaureate. Ultimately our view must be to have a vision for world-wide courses and curricula not only in Mathematics but in other core subjects.
With this thought in mind, I would also like to take this opportunity to recommend a conference organised by ICTMA, an international community of teachers whose focus is the teaching of modelling and applications. Melbourne is fortunate in hosting their 2011 biennial conference. With the conference, there will be a Modelling Challenge for students. Details can be found at the bottom of page 12. This will be a great opportunity for teachers and students to exchange ideas beyond our immediate borders.
CorrectionIn ‘How many pieces in a pi?’ (last issue) the value of k in Ramanujan’s formula for calculating π to 14m decimal places should be
k = 426 880 10 005.
I’m not sure how the plus sign found its way into the formula, as the correct formula was provided by the author. — Ed.
Victoria and the MAV have always taken the initiative in developing innovative and useful programmes and materials, and there is no reason why we should not continue to be active contributors and innovators in the context of an Australian Curriculum.
Viva the Australian CurriculumSeveral years ago some close friends of ours had to relocate to Perth, through work. At the end of the year their son was completing grade six in Victoria. The following year, he began year eight in Perth. It was a difficult and challenging year, but he was able to cope. Two years later, after completing year nine in WA, he returned to Victoria — to do year nine in Victoria the following year! Of course, this was less than challenging, and the observation of his parents, was that this experience made it less needful and therefore more difficult to maintain good working habits. He is now beginning year twelve, and will probably complete VCE successfully, but in the words of his father, “It could have been done better!” These days we live in a very mobile society, and this kind of movement is not uncommon. Our workforce has become very mobile, probably increasingly so.
With the national curriculum now on the way, I believe we will be doing it better. It is not my intention to focus on the content of the Australian curriculum, I will leave that to our many excellent contributors. The focus is simply on the fact that because it is now a reality, there are benefits it should bring to education in Australia, and mathematics education in particular.
Besides this obvious point, there are other benefits.
In my experience working with publishers of textbooks and other resources, as it is uneconomical to produce materials for a smaller market, it is the states with smaller populations which miss out on resources for their specific curricula. Now we are moving towards a nationwide curriculum, materials can be produced for use nationwide. This has immediate benefits for the smaller states.
This has additional benefits. As authors and publishers theoretically now only need to produce one set of resources, you would hope that the extra time generated would result in a greater variety of resources, as well as more resources for specific needs. For example, a resource for gifted and talented students may not be viable for Victoria, but may very well be able to be produced nationwide. And these additional resources would be useful and relevant to all states, not just those with the biggest populations.
Having one curriculum also means all educators in Australia can contribute to making it work
Roger Walter
V I N C U L U M VOLUME 48 TERM 2 2011
4
Can you find other iterations leading to a conjecture similar to the Collatz Conjecture? Can you find Narcissic numbers for other manipulations of digits?
Robert Money —Rob is currently a maths consultant. Since retiring from Footscray City College, he has written for America’s Choice and worked with teachers in schools in Melbourne.
Remember Martin Gardner
Martin Gardner died on May 22 last year, aged 95. He is most famous for his contribution to recreational mathematics through his monthly column in Scientific American over 25 years starting from 1956. In addition he made significant contributions to magic, philosophy, children’s literature and debunking pseudoscience. He wrote 60 books, including four after his 90th birthday.
Here is a small selection of Gardner’s problems, chosen with a focus on number puzzles for middle school students.
1. Magic with a matrix (Martin Gardner, in Scientific American, January 1957)
The matrix below has a special property.
19 8 11 25 7
12 1 4 18 0
16 5 8 22 4
21 10 13 27 9
14 3 6 20 2
Choose five numbers from the matrix, making sure that one number is chosen from each row and one number is chosen from each column. Then find the sum of the five numbers chosen.
There are 25 different ways in which you can choose your five numbers, yet the sum of the five numbers will always be 57. Check to see.
Once you have learnt the trick you can make up your own magic matrix. Give it to someone else to solve and see if they get the same answer as you.
2. Kaprekar’s Constant (from Martin Gardner’s ‘Doctor Matrix’ columns)
Start with any four digits, for example 9, 9, 1 and 8.
Arrange them to make the largest and the smallest numbers, for example 9981 and 1899.
Find the difference between these two numbers. Here 9981 – 1899 = 8082.
Use the four digits of the answer to repeat the process. Keep repeating.
Where does it end? How many other 4-digit starting numbers end at the same point?
3. The Collatz Conjecture (Martin Gardner, in Scientific American, June 1972)
Start by choosing any natural number. If it is odd then multiply by 3 and add 1. If it is even, halve it.
Repeat this process until you reach the number 1.
Investigate the Collatz Conjecture: that you always reach the number 1, no matter which natural number you started with.
4. Magic Rectangle (Gardner wrote a lot about magic squares)
Place the numbers from 1 to 15 in the 3 × 5 table so that each row has the same sum and each column has the same sum.
Check your answer with other students. How many different solutions are there?
The next magic rectangles to look for could be the 3 × 7 rectangle or the 5 × 7 rectangle.
5. Narcissistic Numbers (from Martin Gardner’s ‘Doctor Matrix’ columns)
Narcissistic numbers are the numbers you end up with if you keep repeating the process of using the sum of the cubes of their digits to get the next number.
For example, starting with 24,
23 + 43 = 8 + 64 = 7273 + 23 = 343 + 8 = 35133 + 53 + 13 = 27 + 125 + 1 = 15313 + 53 + 33 = 1 + 125 + 27 = 153
So 153 is a narcissistic number.
What other narcissistic numbers are produced by this process?
Does this process always produce a narcissistic number, no matter what number you start with?
Work in your group to test all the natural numbers up to 99.

5
V I N C U L U M VOLUME 48 TERM 2 2011
Martin Gardner is most famous for his contribution to recreational mathematics through his monthly column in Scientific American over 25 years, starting from 1956.
Martin Gardner made significant contributions to magic, philosophy, children’s literature and debunking pseudoscience. He wrote 60 books, including four after his 90th birthday.
Pedagogy, hints, answers, and extensions1. Magic with a matrix
The matrix is just an addition table. The addends are 12, 1, 4, 18 and 0 for the columns and 7, 0 4, 9 and 2 for the rows. When each row and column is chosen once the sum will be the sum of these addends. 12 + 1 + 4 + 18 + 0 + 7 + 0 + 4 + 9 + 2 = 57.
Hints: Tell students to compare one row (or column) with another. They will find common differences. If a further hint is required ask how the lowest number in the table (the 0) could have got there (0 + 0) and suggest that they label its row and column with these zeros.
Pedagogy: This activity can be used for addition and subtraction of any types of number, depending on what type of skill practice is needed. A student who discovers how to develop these matrices can then make up one for other students to solve.
Extension 1: Alternative solutions to the same problem can be obtained by adding a constant to all row addends and subtracting the same constant from all column addends. To check such solutions students would be adding positives to some negatives to obtain the same non-negative sums.
Extension 2: A related magic matrix is obtained by adding (or subtracting) the same constant from every number in the table. For example, if 10 was subtracted from each number in the matrix then a solution (one of many) could be obtained by subtracting 4 from each row heading and 6 from each column heading. The resulting matrix provides excellent skills practice in addition and subtraction involving negatives:
6 -5 -2 12 -6
3 9 -2 1 15 -3
-4 2 -9 -6 8 -10
0 6 -5 -2 12 -6
5 11 0 3 17 -1
-2 4 -7 -4 10 -8
2. Kaprekar’s Constant is 6174.
From most starting points, 6174 is reached with no more than 8 iterations. From some starting points, the first iteration gives 999, after which the process finishes at 0.
The problem involves extensive exercise in subtraction involving whichever of the algorithms that students use. The end point should arise after at most 8 iterations. Solving the problem requires the strategy of restricting the initial conjecture (about all numbers) in order to deal with the counter-examples that arise.
Take the chance to check that all students can do this without using a calculator. If students are unfamiliar with numbers greater than 1000 then start with the equivalent 3-digit problem (See Extension 2 below)
Extension 1: Which starting points lead to a finish at 0?
Answer: 4 digits the same (eg, 3333) or three the same and the other digit differing by 1 (eg, 3334, 5556).
Proof:
1000a+100a+10a+(a –1)
[1000(a -1)+1– 000a+10a +a]
1000 –1 =999
Extension 2: Does a similar pattern apply with 2 digits or with 3 digits?
Answer: Yes. With 2 digits the constant reached is 0. With 3 digits the constant reached is either 495 or 99 followed by 0.
Extension 3: Does a similar pattern apply with 5 digits?
Answer: No. Instead of a final constant there is a final cycle involving the 10 numbers
53955, 59994, 61974, 62964, 63954, 71973, 74943, 75933, 82962, and 83952
3. The Collatz Conjecture
The conjecture is unproven, although computer investigation has verified it for all numbers up to at least 1016. Apart from the skills practice
6
V I N C U L U M VOLUME 48 TERM 2 2011
The Collatz Conjecture is unproven, although computer investigation has verified it for all numbers up to at least 1016.
His puzzles introduce interesting and often little known mathematics, including Kaprekar’s constant, the Collatz Conjecture and Narcissic numbers.
involved, the activity can be used to clarify student understanding of the nature of mathematical proof.
After initial experimentation you could focus attention on checking whether the conjecture holds for all numbers up to at least 30. If students work in groups of three they could well find that their sequences join up well before reaching the 4, 2, 1 endpoint. The unlucky student will be the one allocated the number 27. This could well be the only student who needs support of technology, since 111 iterations are involved, and the sequence includes some 4-digit numbers. The key line for a suitable spreadsheet is
=IF(A1-INT(A1/2)*2 =0,A1/2,3*A1+1)
Finish the activity with a class discussion of some questions about proof.
27 does not reach 1 after 100 iterations. Does that make 27 a counter-example to the conjecture?
• What would be a counter-example to the conjecture?
• All numbers up to 1016 obey the conjecture. Is that a mathematical proof of the conjecture?
• What is the difference between mathematical proof and scientific proof?
• Why is it called the ‘Collatz conjecture’, not the ‘Collatz property’ or the ‘Collatz theorem’?
4. Magic Rectangle
This is a problem-solving task involving addition and subtraction of 1- and 2-digit numbers. Provide students with three or more copies of the 3 × 5 table.
Hints, if required:
• Get started! If you can’t think of anything better then put the 15 numbers in anywhere and see what the row and column sums come to.
• What should be the sum of each row? (One third of the sum of 1 to 15 = 40)
• What should be the sum of each column? (One fifth of the sum of 1 to 15 = 24)
• Which numbers cannot be in the same column? (Any two numbers with a sum greater than the required column sum: 15, 14, 13, and 12).
• Get the column totals right first, then fix the row totals.
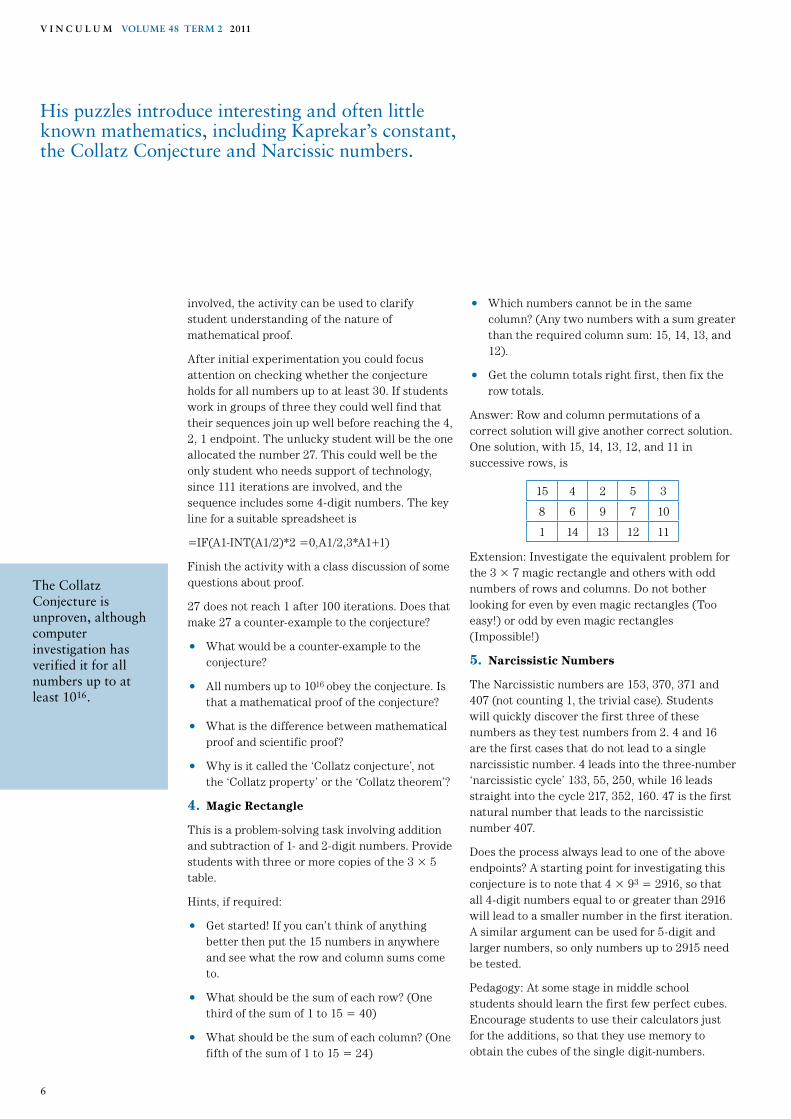
Answer: Row and column permutations of a correct solution will give another correct solution. One solution, with 15, 14, 13, 12, and 11 in successive rows, is
15 4 2 5 3
8 6 9 7 10
1 14 13 12 11
Extension: Investigate the equivalent problem for the 3 × 7 magic rectangle and others with odd numbers of rows and columns. Do not bother looking for even by even magic rectangles (Too easy!) or odd by even magic rectangles (Impossible!)
5. Narcissistic Numbers
The Narcissistic numbers are 153, 370, 371 and 407 (not counting 1, the trivial case). Students will quickly discover the first three of these numbers as they test numbers from 2. 4 and 16 are the first cases that do not lead to a single narcissistic number. 4 leads into the three-number ‘narcissistic cycle’ 133, 55, 250, while 16 leads straight into the cycle 217, 352, 160. 47 is the first natural number that leads to the narcissistic number 407.
Does the process always lead to one of the above endpoints? A starting point for investigating this conjecture is to note that 4 × 93 = 2916, so that all 4-digit numbers equal to or greater than 2916 will lead to a smaller number in the first iteration. A similar argument can be used for 5-digit and larger numbers, so only numbers up to 2915 need be tested.
Pedagogy: At some stage in middle school students should learn the first few perfect cubes. Encourage students to use their calculators just for the additions, so that they use memory to obtain the cubes of the single digit-numbers.

7
V I N C U L U M VOLUME 48 TERM 2 2011
A useful mathematical skill is the ability to be able to extend knowledge into similar areas. These puzzles often have logical extensions. Perhaps they prompt further possibilities you would like to explore.
Solving the puzzles can include class collaboration, use of technology, recognising patterns, discussion of concepts such as mathematical proof, comparing related problems, and much more.
Use class cooperation to complete the task of testing all of the numbers up to 99. Start with a hundreds chart on the board and have students add to it the endpoints obtained from each starting point. Use the calculations for 24 (in the example above) to discuss how this shows that 24, 42, 72 and 27 all lead to the 153 endpoint. The final hundreds chart could look like the table above:
Note that every multiple of 3 has a 153 endpoint.
ReferenceMartin Gardner’s Mathematical Games, a
compact disc published in 2005 by the Mathematical Association of America. The disc contains 15 of Gardner’s publications.
Answer to cover puzzleThe answer will be published in the next issue of Vinculum. if you can’t wait that long, you’d better Google it — or buy the book!
1 2 3 4 5 6 7 8 9 10
11 12 13 14 15 16 17 18 19 20 Trivial case of 1
21 22 23 24 25 26 27 28 29 30 371 endpoint
31 32 33 34 35 36 37 38 39 40 153 endpoint
41 42 43 44 45 46 47 48 49 50 133, 55, 250 cycle
51 52 53 54 55 56 57 58 59 60 370 endpoint
61 62 63 64 65 66 67 68 69 70 217, 352, 160 cycle
71 72 73 74 75 76 77 78 79 80 407 endpoint
81 82 83 84 85 86 87 88 89 90 919, 1459 cycle
91 92 93 94 95 96 97 98 99 100
Do you like us?Do you like us? Lots of people already do, but we’d love some more to! Join the Mathematical Association of Victoria’s Facebook page for a chance to win a Martin Gardner book. We’ll draw three random numbers and the lucky winners will be puzzled over and over by Martin’s brilliance.
Entries close on Friday 6 May. www.facebook.com/mathematicalassociationofvictoria
V I N C U L U M VOLUME 48 TERM 2 2011
8
Dominance matrices are a tool which can produce a more accurate ranking of teams when they haven’t all played each other.
Roger Walter —Roger is the editor of Vinculum. Having spent 30 years teaching secondary mathematics he is now a freelance author/editor of educational publications.
Dominance Matrices: Your Secret Weapon in Footy Tipping
I must acknowledge Stephen Swift from Queensland for his work on matrices, and thank him for his permission to use his work, which is the inspiration for this article.
The general problem of ranking teams in a competition is that not all teams have played each other. One team high on the ladder may have been fortunate in playing mainly lower ranked teams. Dominance matrices are one tool which can take this into account and produce a more accurate ranking. This can be a very useful tool in predicting the results of matches early in the season, when fewer games have been played.
The simplest dominance matrix is a square matrix which lists the teams twice, giving 1 point for a win, ½ a point for a draw and 0 for a loss. For five teams, A, B, C, D and E a dominance matrix may appear as follows:
A B C D E
DD =
AB
C
DE
0 1 0 1 00 0 0 0
0 0 0
0 0 1 0 00 0 1 0
14
12
12
12
This matrix shows that A has beaten B and D, C and E have drawn, and A has not played C. The leading diagonal will be all zeros as a team does not play itself.
The matrix 1 is defined as a column vector with all 1’s, so that D1 will give the total number of points for each team.
This is the usual method for most team ladders. Ranking is usually determined by D1 – DT1, where DT is the transpose of D. This gives wins – losses, which for some teams will be negative. The final vector is called the first order ranking,
rr DD11 DD 11TT
1
2111
1
= =−−−
–
The sum of the elements of first order rankings will always be zero.
If we consider D2, we get
If we examine the process, we will see that if we sum the top row, we get the total of A’s individual scores multiplied by the scores of each team that A defeated (B and E).
Row A = (A d. B) × (B total) + (A d. D) × (D total)= 1 × ½ + 1 × (½ + ½) = 1½
Clearly, a team will gain a higher score if their opponents have done better, so beating ‘quality’ opponents will earn a higher score. It is useful for all teams to have played an equal number of games.
Teams can now be ranked by calculating D21 – (D2)T1.
This will produce a second order ranking vector, in this case
rr DD 11 DD 1122 22TT
2
1 50 52
0 50 5
= ( ) =−−
–
..
.
.
We can now rank the middle three teams.

9
V I N C U L U M VOLUME 48 TERM 2 2011
If anyone is interested, I am preparing an excel spread sheet which will use 20 × 20 matrices to rank AFL teams.
Scores are weighted according to the success of the other teams they played, so beating ‘quality’ opponents will earn a higher score.
So now, how do we combine the two rankings? Stephen suggests the first order ranking should be weighted more heavily and suggests r = r1 + 0.5r2. Others may feel that the second order ranking should stand on its own. What do you think? What do your students think?
This works well in cases like chess tournaments, where there are no scores, as such. In the case of team sports, it is possible to go further.
We can compare two teams playing each other by choosing the ratio of their scores. If A scored 10 points and B scored 3 points, we could say A is 10
3 , or about 3.3 times as good as B. We can rate B as 3
10 as good as A, or 0.3 times A. The ratio rather than the difference should be chosen, to allow for high and low scoring games. This is a little like going by percentage instead of numbers of wins and losses. It would be an interesting class discussion as to which is most reliable when ranking abilities of teams. An example of six teams playing each other is given below. The leading diagonal will still be all zeros, and elements reflected in the leading diagonal will be reciprocals of each other.
A B C D E F
A
B
C
D
E
F
D =
0 0 0103
54
21
3110
53
45
23
43
35
32
65
12
34
109
56
0 0 0 1
0 0 0
0 0 0
0 0 0
0 1 0 9910
0
The first order ranking would be r1 = D1 – DT1
Space does not permit, but the reader may verify by calculating D21 that the score for A, the first element in the vector, will be as follows:
A = 103
310
54
45
21
12
103
53
54
23
43
21
3
1× + × + × + × + + × +
+ ×
( ) ( )
(44
109
+ )
= 3 + (A/B) × (B total) + (A/C) × (C total) + (A/E) × (E total)
This is almost the same, except that for each team the leading diagonal will be the number of games played. The rest of the score consists of their score multiplied by the total of the scores of the teams they have played. Once again, your score improves
if your opponents did well, and decreases if they did badly. This vector could be used to rank the teams, if you subtracted a column vector consisting of the number of games each team had played, then divided each team’s score by the number of games that team had played.
If you calculate r2 = D21 – (D2)T1 the number of teams played will cancel. I believe this gives the best ranking of teams, if they’ve all played the same number of games. Where teams have played different numbers of games, you should divide each score by the number of games played.
As before, the relative weighting of the first and second order rankings is an interesting point for discussion, as well as the meaning and usefulness of third and higher order rankings.
An interesting application of the dominance matrix method has been to rank students in Queensland for tertiary entrance. Students usually do 4–6 subjects where they receive an overall position, or OP, which is a ranking from 1 to 25. Some students do seven OP subjects. Students choose from about 25 different subjects, and as in Victoria some are easier than others. A computer is used, and though the calculations are the same, matrices as such are not used, as the numbers (over 30 000) are too high.
The first year, they did a successful trial run using the previous year’s students. Unfortunately a small increase in numbers in that year meant that the program crashed because the data was too large for the computer. This delayed the rankings by about 3 weeks while they waited to use a larger government computer!
Dominance matrices are an interesting application of matrices. If anyone is interested, I am preparing an excel spreadsheet which will use 20 × 20 matrices to rank AFL teams. I am happy to provide this free of charge by email. You may request copies be emailing me at [email protected]. All I ask is that you include in your email at least one thing you can share from your teaching experience.
ReferenceBrodie, R. & Swift, S. (2009). NewQMaths 11c
(3rd Ed.). (pp. 186–189). Qld. Nelson Cengage Learning.
V I N C U L U M VOLUME 48 TERM 2 2011
10
Breakout text to come
David Dowe — David is an Associate Professor in the IT faculty in Computer Science at Monash University. His research focuses on machine learning, statistics, philosophy and other areas of the information-theoretic Minimum Message Length principle.
Probabilistic and Gaussian Football Tipping
Right/wrong is a very obvious and sensible criterion used in many life situations. However, there is also a time and a place for knowing how sure we are of things, in terms of probabilities.
The Probabilistic Football Tipping CompetitionMost football tipping competitions reward people for correctly tipping the winning team in AFL (or whatever code) football matches. Right/wrong is a very obvious and sensible criterion used by multiple choice tests and applicable to many life situations.
However, there is also a time and a place for knowing how sure we are of things. It may be more relevant to tell a person diagnosed with cancer the probability of his continued survival, and how this probability may change with various treatments. Probabilities are also very relevant to bookmakers, insurers and many other occupations.
So, why not create a football tipping competition where, instead of tipping the winner of each match, you exercised your skill in estimating the probability of each team of winning? The competition would need to be designed so that the highest expected (long term) score can be achieved by tipping the true probability, even though this is never known. It can be shown that this is achieved by giving a reward of log p to a tipper who has assigned a probability p to a team which wins, and log(1 – p) as a reward for picking the losing team. Proving this could be an interesting exercise. We use logarithms to the base 2, so tippers in our competition get a score in bits.
Note that if p > ½, then p > 1 – p, and log2(p) > log2(1 – p), so the tipper is better off selecting the winning team, and gains (and loses) more the higher the probability assigned to the selected team. We have assigned a reward of 1 + log2(p) if the team wins and 1 + log2(1 – p) for a loss.
Now there will be games that you think are really, really close ones. In your typical tipping competition, you’ve got to pick a team and you might not like that because you might feel it’s almost a coin toss and you’re ripped off by having to choose one team. A probabilistic competition enables you to say, “Oh, I’m only 50% sure, or 51% sure,” and you enter that. If the tipper chooses a probability of 50%, then 1 + log2(p) = 1+ log2(1 – p) = 0. This means that they are certain to score zero points, whatever the outcome of the match.
If there is a draw, the average of the winning and losing rewards are given.
Reward = (1 + log2(p) + 1+ log2(1 – p)) ÷ 2 = 1 + log2 p(1 – p)
This is an upside-down “U” shaped function, which is negative for every value of p except for p = 0.5. If you think a draw will occur you should tip 0.5. If correct, your reward is to lose no bits; everyone who tipped otherwise will lose bits.
For matches where one team is a lot stronger than the other, more bits are gained by allocating a high probability. However, be warned. The scoring is not symmetrical and can be very non-intuitive for the beginner. Choosing a value close to 1 is very risky as log2(1 – p) is extremely small when p is close to one. For example, a loss using a probability of 0.95 will score you 1 + log2(1 – p) = 1 + log2(0.05) ≈ 1 – 4.32 = -3.32 bits compared to a win which would earn 1 + log2(0.95) ≈ 0.93 bits. However, if the real probability is 0.95, this is your best option in the long term. For this reason, only probabilities between 0.001 and 0.999 are accepted, so that people won’t get negative scores from which they could not recover.
p Score if win Score if lostScore if
draw
1.00 +1.000 -Infinity -Infinity
0.95 +0.926 -3.322 -1.198
0.90 +0.848 -2.322 -0.737
0.85 +0.766 -1.737 -0.486
0.80 +0.678 -1.322 -0.322
0.75 +0.585 -1.000 -0.208
0.70 +0.485 -0.737 -0.126
0.65 +0.379 -0.515 -0.068
0.60 +0.263 -0.322 -0.029
0.55 +0.138 -0.152 -0.007
0.50 +0.000 +0.000 +0.000
Table 1. Effect of p on scoring.
Since the competition has been running, we have also developed mathematical measures for boldness, calibration and trust. You can find the mathematics behind this by logging on to

11
V I N C U L U M VOLUME 48 TERM 2 2011
It can be shown that the highest expected (long term) score can be achieved by tipping the true probability, even though this is never known.
Why not create a football tipping competition where, instead of tipping the winner of each match, you exercised your skill in estimating the probability of each team of winning?
www.csse.monash.edu.au/~footy/about.shtml and following the appropriate links.
The probabilistic footy tipping competition is a fun way to engage young people at all levels of the curriculum in mathematical thinking. To the best of our knowledge, we have achieved a world first in producing the first real-world tipping competition which is based not on right/wrong but on probabilities and information-theoretic scores. You can join the competition on www.csse.monash.edu.au/~footy/index.shtml. It is no great disadvantage to join the probabilistic competition late, as you begin with a score of zero and many (over confident) tippers already have a negative score after the first few rounds. Unfortunately we can offer no prizes, just the honour and glory of winning the world’s only football tipping competition of this kind.
You may wish to use dominance matrices to predict probabilities, or find the bookmakers’ odds. These of course can be converted to probabilities, but it should be remembered that bookmakers’ odds reflect the relative amounts of money wagered and not necessarily the true probabilities.
The Gaussian Football Tipping CompetitionThis could be called the probability distribution competition. In this case, the tipper must specify a winning margin, and a standard deviation.
The tipper is rewarded for getting close to the actual winning margin. We can begin by using the tipped winning margin and the selected standard deviation to generate a Normal or Gaussian probability distribution.
p e dxm
a
b x
=−
−
∫1
2
2
22
σ π
µ
σ
( )
, the mean, is the tipped winning margin and is the tipped standard deviation. Suppose m is the actual winning margin. The reward will be related to the probability, using this normal distribution, of getting the actual winning margin m. As the normal (Gaussian) distribution is the well known bell shaped curve, the more standard deviations this is away from the mean, the lower
the tipper’s score. Since the distribution is continuous and m must be an integer, we must find the area under the curve from x = m – 0.5 to x = m + 0.5, as below.
p e dxm
m
m x
=−
−
−
+
∫1
2
2
22
0 5
0 5
σ π
µ
σ
( )
.
.
To find the probability for all a tipper’s selections over the entire competition, we must multiply the probabilities of these independent events. However, in tipping competitions, scores are generally added. We have therefore calculated the logarithm of this probability, again using a base of 2. Now adding the logarithms relates to calculating a probability for the complete set of predictions. There is the added advantage of making the scores a reasonable size, as the given probabilities will all be very small. As the logarithms will all be negative, we have added 10 to the scores, so everyone will usually get a positive score, unless they are really way off. The formula for the game score, in bits, is
101
22
2
22
0 5
0 5
+−
−
−
+
∫log( )
.
.
σ π
µ
σe dxx
m
m
where m is the actual winning margin, and are the tipped mean and standard deviation respectively. We use the Z score, the number of standard deviations between the tipped margin and the actual margin.
Figure 1. The probability is the grey strip.
In this competition the accuracy of prediction of winning margin is important. The standard deviation proves to be difficult; the larger you make it, the more spread out and flatter the probability distribution function will be and the smaller the probability of your score, and hence
12
V I N C U L U M VOLUME 48 TERM 2 2011
It is no great disadvantage to join the probabilistic competition late, as you begin with a score of zero and many (over confident) tippers already have a negative score after the first few rounds.
Since the competition has been running, we have also developed mathematical measures for boldness, calibration and trust.
the smaller your actual score. Too small a standard deviation means your prediction is more likely to be three or more standard deviations from the mean, and therefore extremely small; but if you ‘nail it’ with a low standard deviation, you will get a high score. Experience has shown that a value of sigma around 40 is a good place to start. It is also possible to join this competition after the start without being too disadvantaged.
I established the probabilistic and Gaussian competitions in 1995 and 1996 respectively, with the probabilistic competition being a spin-off from joint research which led me to suggest the Gaussian competition the following year in 1996. I have proved uniqueness results about the logarithmic scoring methods for these competitions. The probabilistic competition began in Round 3 of the 1995 AFL season and the Gaussian competition began with the 1996 AFL season. These are world record longest-running compression-based competitions. The scoring
using logarithms of probabilities amounts to the same field, namely information theory, used to compress computer files.
We also run a normal footy tipping competition in the usual way where you select winners and winning margins. You can get bonus points if your winning margin is sufficiently close to the actual winning margin. This applies even if you pick a losing team.
So we hope you and your students will enjoy our unique football tipping competitions, and appreciate the mathematics behind them.
Further readingDowe, D. L. (2011). MML, hybrid Bayesian network graphical models, statistical consistency, invariance and uniqueness. In Bandyopadhyay, P.S. & Forster, M.R. (Eds.), Handbook of the Philosophy of Science (Vol. 7). Elsevier, Philosophy of Statistics. (Section 5.3, pp. 901–982)
15th International Conference on the Teaching of Mathematical Modelling and Applications
will be held 14 – 19 July 2011
Australian Catholic University, Melbourne Campus
Program includes plenaries by international speakers, paper presentations (research and/practice), workshops, symposium for tertiary students (e.g., pre-service teachers), modelling challenge for school students (primary and secondary), teachers’ day.
Further Details: Email [email protected] or [email protected] Or visit: www.ictma15.edu.au
13
V I N C U L U M VOLUME 48 TERM 2 2011
Students loved taking their measurements, filling in their data, and in particular, completing the interactive questions.
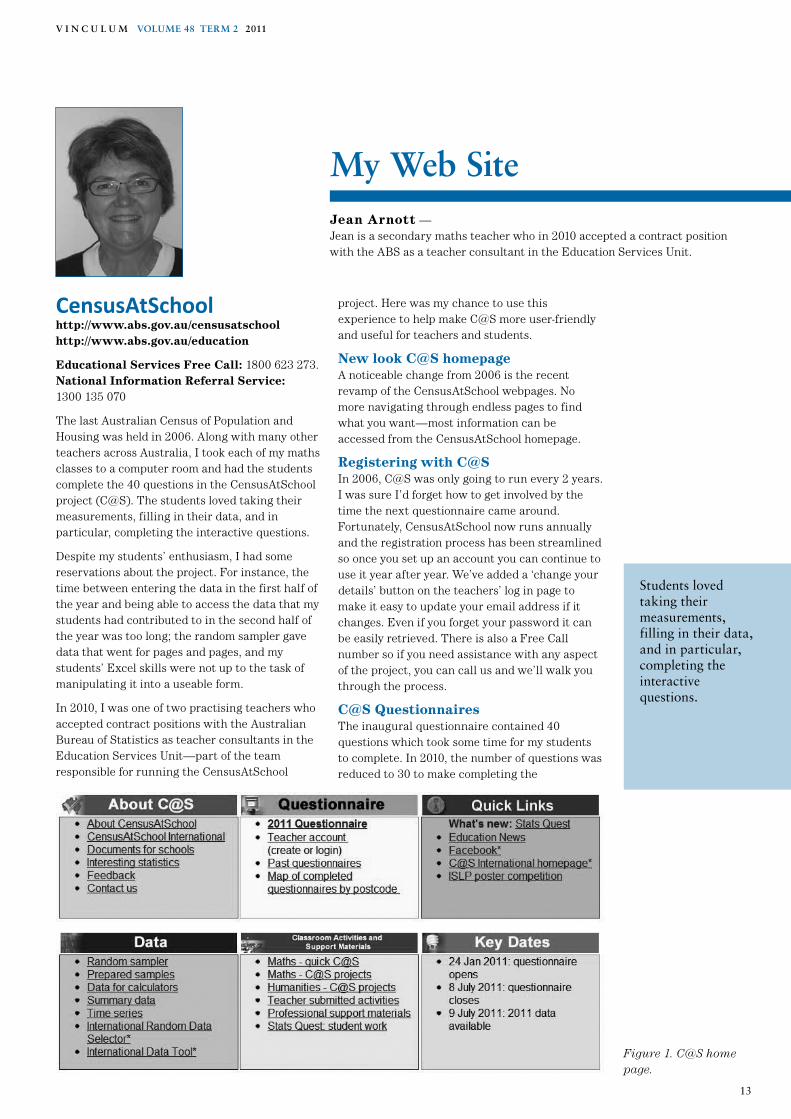
My Web SiteJean Arnott —Jean is a secondary maths teacher who in 2010 accepted a contract position with the ABS as a teacher consultant in the Education Services Unit.
CensusAtSchoolhttp://www.abs.gov.au/censusatschool http://www.abs.gov.au/education
Educational Services Free Call: 1800 623 273.National Information Referral Service: 1300 135 070
The last Australian Census of Population and Housing was held in 2006. Along with many other teachers across Australia, I took each of my maths classes to a computer room and had the students complete the 40 questions in the CensusAtSchool project (C@S). The students loved taking their measurements, filling in their data, and in particular, completing the interactive questions.
Despite my students’ enthusiasm, I had some reservations about the project. For instance, the time between entering the data in the first half of the year and being able to access the data that my students had contributed to in the second half of the year was too long; the random sampler gave data that went for pages and pages, and my students’ Excel skills were not up to the task of manipulating it into a useable form.
In 2010, I was one of two practising teachers who accepted contract positions with the Australian Bureau of Statistics as teacher consultants in the Education Services Unit—part of the team responsible for running the CensusAtSchool
project. Here was my chance to use this experience to help make C@S more user-friendly and useful for teachers and students.
New look C@S homepageA noticeable change from 2006 is the recent revamp of the CensusAtSchool webpages. No more navigating through endless pages to find what you want—most information can be accessed from the CensusAtSchool homepage.
Registering with C@SIn 2006, C@S was only going to run every 2 years. I was sure I’d forget how to get involved by the time the next questionnaire came around. Fortunately, CensusAtSchool now runs annually and the registration process has been streamlined so once you set up an account you can continue to use it year after year. We’ve added a ‘change your details’ button on the teachers’ log in page to make it easy to update your email address if it changes. Even if you forget your password it can be easily retrieved. There is also a Free Call number so if you need assistance with any aspect of the project, you can call us and we’ll walk you through the process.
C@S QuestionnairesThe inaugural questionnaire contained 40 questions which took some time for my students to complete. In 2010, the number of questions was reduced to 30 to make completing the
Figure 1. C@S home page.

14
V I N C U L U M VOLUME 48 TERM 2 2011
Workbooks of prepared samples contain data from 40 students for all, or part of, the 30 questions.
The samples will have real meaning for students if they have filled in a questionnaire and understand the process.
questionnaire more expedient. However, it still covers topics such as students’ favourite fast food, what type of music they preferred to listen to and their opinions on environmental issues.
DataOne of the drawbacks in 2006 was that my students and I had to wait 6 months before we could access any data. This is no longer an issue as you can now take random samples from data collected in 2006, 2008 and 2010 at any time of the year. The samples may not contain your class’s data but they will have real meaning for students if they have filled in a questionnaire and understand the process. Another idea is to record areas of interest that students might want to investigate at the time they are taking the questionnaire and to refer back to them when the data becomes available.
Respect for privacy is a major objective of the ABS. In order to protect privacy of individual schools and students, random samples for particular areas will not be generated when insufficient questionnaires are completed. As well as creating a larger pool of data from which you can draw, the more students that take part in C@S questionnaires, the less chance there is of getting a ‘no sample’ error in the random sampler.
Random samplesThe random sampler generates samples of between 10 and 200 students. In 2006, printing
out a full random sample could amount to 10 pages and this increased in 2008. However, from 2010 the number of pages has reduced to 6. We’ve reduced printing even further by making available a range of downloadable prepared random samples organised by type such as categorical, numerical and by state and territory. Prepared samples are workbooks of 40 samples that can be printed on one page. Teachers can make a class set of random samples enabling students to work with their own set of data. You can select these from Prepared Samples from the Data section of the home page.
C@S activities and projects2010 saw a new range of prepared downloadable activities that are free for you to use in your class room. We’ve included student worksheets that can be tailored to suit your needs. Quick C@S activities take about 30 minutes to complete and cover one statistical concept. C@S projects enable students to conduct in depth investigations using C@S data—these have teacher solutions and marking rubrics aligned to the Proficiency Strands in the Australian Curriculum. This makes them suitable as assessment activities for reporting student outcomes.
Upskilling studentsThe use of digital technology is specifically referred to in the Australian Curriculum documents for mathematics and spread sheet
Figure 2: Workbook of prepared samples. This contains data from 40 students for up to 30 questions.

15
V I N C U L U M VOLUME 48 TERM 2 2011
The use of spreadsheets enables students to undertake increasingly complex investigations as they move from one year to the next.
C@S projects enable students to conduct in depth investigations using C@S data—these have teacher solutions and marking rubrics aligned to the Proficiency Strands in the Australian Curriculum.
skills form a part of this. With this in mind, we’ve produced a range of activities that require students to use Excel. By setting these activities for your students, you will be increasing their ability to undertake increasingly complex investigations as they move from one year to the next. All QuickC@S activities requiring Excel have screen dumps for students to follow.
TASK 2: MAKING A SCATTER PLOT
1. Select the data for dominant and non- dominant hands. Go to Insert and select ‘Scatter with only Markers ‘to draw your graph.
2. Click on the heading to change the title to Dominant vs. Non-Dominant Hands Reaction Times (sec).
3. Select ‘Layout’ tab and ‘Axis Titles’ and label the Horizontal axis ‘Dominant reaction time (sec)’ and the Vertical axis ‘Non-Dominant reaction time (sec)’.
Figure 3. C@S_19 Making a Scatterplot using Excel.
You don’t have to do the same data related activities every year either. Both the Quick and Project activities are summarised in tables that show appropriate year levels according to the Australian Curriculum which means teachers can take a school-wide approach to plan ongoing participation in the project.
More Educational ResourcesThe Education Services Unit has provided a wealth of resources that you can access from their webpages. These include subject based lessons, simplified data sets and Education News.
Subject based lessons use ABS statistics, are project style and in most cases cross-curricular links can be made. Teachers can use the table of lessons to find enrichment lessons, lessons using ABS time series data, and lessons that address the use of misleading graphs in the media.
Simplified data sets come from official ABS collections and have been formatted so that they are immediately useful for teachers looking for real statistics to engage their students. Our time series data are particularly useful.
Education News is published on-line quarterly and contains information about recent changes to the Education Services webpages, ideas for lessons, competitions and other statistical information of interest to teachers. You can subscribe to this newsletter by following the links on the ESU web pages.
ABS homepage http://www.abs.gov.au/educationThe Australian Bureau of Statistics homepage is a springboard to several areas of interest for teachers. Get your students to click on the ‘First Visit?’ tab, then, under the ‘I’m new to Statistics’ heading, choose ‘Interact with our Data’. They’ll find Google Motion Charts of the House Price Index and an Australian Population Projection.
Clicking on the ‘Statistics’ tab will give you and your students access to publications that cover topics such as time series data, consumer price index, and general statistics publications. Finally, from the ‘Census’ tab, your students can enter their postcode in the QuickStats Quick Search box and find information about residents of the suburb such as the percentage of males and females; the languages spoken at home; and the occupations they are employed in.
Stats QuestWe want to reward your students’ efforts. If your students have produced exemplary work that uses

16
V I N C U L U M VOLUME 48 TERM 2 2011
Education News has ideas for lessons, competitions and other statistical information of interest to teachers.
The next Australian Census will be held in 2011. You can not only educate your students about the importance of statistics but also provide an enjoyable activity by getting them to take part in the 2011 C@S Questionnaire.
ABS statistics, send it to our Stats Quest and we’ll send them a certificate of recognition. They may even get to see their work on our webpages as we’ll be uploading some of the projects we receive.
Figure 4. Stats Quest information flier.
International Statistics Poster competition
Your students have an opportunity to win a monetary prize by entering the Australian section of the International Statistical
Literacy Project (ISLP) International Statistics Poster Competition. There are two categories: students born in 1995 and younger and students born in 1992 or younger. National winners will be awarded $500 (senior) and $300 (junior) to be split evenly between the student and their school.
The national winning entry will then be sent for international judging with the overall winner announced at the 58th ISI World Statistics Congress in Dublin, Ireland in August 2011. Make sure your students are part of our growing contingent and those from 29 other countries.
Census 2011The next Australian Housing and Population Survey will be held in 2011. Just as I did with my students in 2006, you can not only educate your students about the importance of statistics but also provide an enjoyable activity by getting them to take part in the 2011 C@S Questionnaire.
Similarly, with statistics gaining a higher profile in the Australian Curriculum, ABS resources and C@S activities are an easy and painless way for teachers to incorporate them into their lessons.
Statistical thinking will one day be as necessary for efficient citizenship as the ability to read and write. — H G Wells.
Errors using inadequate data are much less than those using no data at all. — Charles Babbage.
It is a capital mistake to theorise before one has data. — Sherlock Holmes.
You mean your statistics are facts, but my facts are just statistics. — Rt Hon James Hacker, MP (Yes Minister).

17
V I N C U L U M VOLUME 48 TERM 2 2011
Stop Teaching Calculating, Start Teaching Maths
Real world problems aren’t usually simple; they are “horrible and hairy”. They mostly don’t involve ‘nice’ numbers.
Linda Shardlow —Linda is currently Head of Mathematics at MLC and has been teaching secondary mathematics in Victorian schools for nearly 30 years. She has a blog on mathematics education at http://4maths.wordpress.com.
This is a review of the talk given at the annual TED Global conference in Oxford, England, in July 2010 by Conrad Wolfram, in response to the review of Gapminder and TED (Technology, Education and Design) talks in the previous issue of Vinculum.
When the draft Australian Curriculum up to the end of Year 10 was released for comment in 2010, I was particularly disturbed by the paragraph relating to ICT in the General Capabilities section. The general thrust of this paragraph seemed to be that the main utilisation of the calculator in mathematics classes is to enable more complicated arithmetic to be done. In the subsequent draft curricula for the senior mathematics courses, the statement “Technology can aid in developing skills and allay the tedium of repeated calculations” reinforced this view. The draft documents seemed to only refer to technology as a calculation tool. What about, instead, the development of mathematical understanding and grasp of concepts? What about the ability to work with authentic data so that the ideas assume prominence and the calculations don’t become ends in themselves?
Towards the latter part of 2010, my attention was directed towards this TED talk about the teaching of mathematics with computers. It struck a chord. TED is a small non-profit organisation devoted to ‘Ideas worth Spreading’. It started out, in 1984, as a conference bringing together people from three worlds: Technology, Entertainment, and Design. Since then its scope has become ever broader. Whilst Wolfram is particularly speaking in reference to computer technology, I think that Victorian teachers can equally apply what he says to our use of handheld technology in the form of CAS calculators.
Wolfram starts his presentation with “We have a real problem with mathematics education right now”. Too many students find it disconnected, uninteresting and hard. But “math[s] is more important to the world than at any point in human history”. We live in an increasingly quantitative world. Wolfram believes that correctly using technology is the ‘silver bullet’ for making mathematics education work. He then goes on to compare mathematics in the real world looks with
the mathematics done in schools. The latter he describes as being “full of dumbed-down problems” and “lots of calculating, most of it by hand”; “lots of things that seem simple and not difficult as they are in the real world”. Real world problems aren’t usually simple; they are “horrible and hairy”. They mostly don’t involve ‘nice’ numbers.
W.S. Anglin states: “Mathematics is not a careful march down a well-cleared highway, but a journey into a strange wilderness where explorers often get lost.”
Whilst Wolfram is speaking of mathematics education primarily in Britain, we have all had experience with the so-called application problems at the end of the chapter that involve ‘nice’ numbers in order to simplify the calculations that are needed to be done. Does this ‘clearing’ mean our students don’t get the opportunities they should to explore like mathematicians? Why not start with an application problem encountered in the real world and draw the mathematics from the ensuing exploration? Readers may like to also look at the TEDtalk presentation of Dan Meyer, a mathematics teacher in the US, who talks in more depth about these ideas in relation to classroom practice.
In an attempt to explain how mathematics education in Britain has developed, Wolfram goes on to explore the questions “Why teach maths?” and “What IS maths?” If we are to stop teaching calculating and start teaching maths then we need to know what mathematics actually is.
Wolfram believes mathematics is about:
• Posing the right questions
• Formulating a real world problem into a mathematics problem
• Computation
• Translating a mathematical formulation to a real world formulation
Professor Julius Sumner Miller believed that “Mathematics, when properly viewed, properly taught, properly learned, arouses the spirit, cultivates imagination, stirs curiosity, [and] invites further learning”.

18
V I N C U L U M VOLUME 48 TERM 2 2011
Professor Julius Sumner Miller believed that “Mathematics, when properly viewed, properly taught, properly learned, arouses the spirit, cultivates imagination, stirs curiosity, [and] invites further learning”.
Mathematics is not a careful march down a well-cleared highway, but a journey into a strange wilderness where explorers often get lost.
About 80% of school mathematics, Wolfram states, is based on computational processes and that what we should be doing is using technology to do most of the computation and spend more time in our classes exploring the other aspects of mathematics. Again, this is based on British mathematics education, but I would ask how many of our classes ‘arouse the spirit, cultivate the imagination, stir curiosity and invite further learning’? Wolfram asserts that calculating is the machinery of mathematics and mathematics education should be liberated from this. Calculating is a means to an end, not a means on its own. He doesn’t decry the importance of having fluency with certain calculations. He asks us, however, to carefully consider which calculations and computations are important for students to know in the context of the concepts we wish to engender with students. At this point, I thought of the teachers in Victoria who are still teaching long division of cubic polynomials. Surely this is a computational process that is no longer needed? I would argue that, in the context of the concepts we wish students to understand, it adds no value and serves to actually divert students’ understanding.
It is my view that mathematics curriculum should encourage critical thinking and promote agility in thinking, the taking of initiative and the development of curiosity and imagination. The emphasis on the use of set computational procedures, without students being required to develop these themselves, means students are denied the opportunities to cognitively engage with the ideas underpinning the processes and thus have experience in designing their own creative solutions to new problems. Students will not develop their own neurological pathways by merely using someone else’s creation. To think critically, there needs to be some knowledge of where results come from. There needs to be some experience of justifying a position, providing proof. I believe that handheld technology can provide a means by which this can be accomplished.
Calculators and computers are reshaping the mathematical landscape, and school mathematics should reflect those changes. Students can learn
more mathematics more deeply with the appropriate and responsible use of technology. They can make and test conjectures. They can work at higher levels of generalization or abstraction. They can focus on the ideas that underpin the discipline and work with the ‘horrible and hairy’ numbers without compromising understanding.
In Wolfram’s talk, he mentions some of the more popular arguments against the use of technology in mathematics education. The first is that students need to “get the basics first” before using technology. He asks “what are the basics of mathematics?” He then makes the comment that people sometimes confuse the order of invention of the tools used with the order of how they should be used in educating young people.
Another argument he has heard is that the use of technology ‘dumbs maths down’, that technology can be used mindlessly and that doing something by hand is somehow more intellectual and teaches understanding better. After many years of watching students trying to factorise a quadratic expression by multiplying the co-efficient of the squared term by the constant then splitting up the middle term and using factorising by grouping, I would argue that by hand procedures can be applied just as mindlessly as anything else. Students who use this approach to factorising do not have a greater understanding of what factorisation is, and it certainly doesn’t assist with factorising of higher-order polynomials. We have to always be on guard to ensure that the methodology we use actually serves the learning we want to engender. Form should not hijack function, or, worse, so obscure the function that it becomes a meaningless activity. We, as educators, always need to be mindful of purpose.
Unfortunately, no matter how powerful an educative tool I think our handheld technology is, no technological tool will, on its own, achieve a revolution in mathematics education without a concurrent change in teachers’ thinking about how learning is shaped.
I think we have to be very careful that we think about how handheld technology can be used to really improve learning; that is, in the form of
19
V I N C U L U M VOLUME 48 TERM 2 2011
Calculators and computers are reshaping the mathematical landscape, and school mathematics should reflect those changes.
Authentic changes to student learning will only occur when technological tools are used in ways that don’t just reflect ‘old’ paradigms in teaching and learning.
mathematical understandings — not just students’ scores on assessment tasks that have the same form as tasks in the past. Instead of the biggest potential being “making improvement happen faster”, I think our use of technology could have the potential to make connections between concepts more accessible and visible and allow mathematical educators to have new and different ways of approaching topics. We shouldn’t allow the calculators just to be a more powerful tool to ‘do stuff’ in the same ways that we may have done it in the past. Authentic changes to student learning will only occur when technological tools are used in ways that don’t just reflect ‘old’ paradigms in teaching and learning. Some things we are used to doing a particular way may have to change, or go entirely from the curriculum.
Students can learn from the instant feedback technology provides, they can observe patterns formed more readily, make connections between multiple representations, work with dynamic images, explore simulated or real data, visualise concepts more easily and share information quickly to create mathematical conversations. As Wolfram says towards the end of his talk, we have the unique opportunity to make mathematics more practical (using ‘real’ numbers in real situations) and more conceptual.
During August 2010, I had the opportunity to attend Merrilyn Goos’ presentation at the ACER conference: Mathematics — Make it Count. She talked about the educational affordances of technology in mathematics. Merrilyn made the point that the way technology is used in classes is closely aligned with teacher beliefs about mathematics. If you consider maths to be a fixed body of knowledge then technology’s role is that of an efficiency tool. If we consider the tools we use as providing access to new understandings, then technology can be a part of a conceptual construction toolkit. I liked her idea of using technology in mathematics as a form of agent provocateur, to create cognitive dissonance and push thinking. Examples used included:
• Draw a line 45 units long
• When will a population of 50 000 bacteria become extinct if the decay rate is 4% per day?
I used both of these examples in my Year 10 class last year and they both worked well, provoking thinking, identifying misconceptions, engendering creativity and prompting mathematical discussions. The students were definitely engaged.
I believe that technology can support and help engender mathematical understanding and free up teachers and students to focus on big ideas and deep thinking, instead of spending large amounts of time doing calculations. It all comes back to purpose. What is the purpose of the learning activity? If it is to do arithmetic and develop quick thinking in numeracy, then a calculator isn’t the appropriate tool. If, on the other hand, the purpose is to investigate continuity and differentiability of functions, then a calculator can enable these concepts to be seen and understood a lot better without the distraction of numerous calculations that have the effect of providing intellectual ‘white noise’ and distract the learner from the concepts.
As Wolfram comments at the end of his presentation, “Technology, used mindfully, can assist students to play with mathematics, feel it, engage with it.”
ReferencesGoos, M., Stillman, G. & Vale, C. (2007). Teaching
Secondary School Mathematics. Allen & Unwin
http://en.wikipedia.org/wiki/Conrad_Wolframhttp://www.acer.edu.au/conference/2010/session-lAll TED talks related to mathematics can be found
at http://www.ted.com/talks/tags/id/128http://www.acer.edu.au/conference/2010/session-lhttp://www.youtube.com/watch?v=BlvKWEvKSi8Prochazka, H. (2006). Mathematics Scrapbook.
The Australian Mathematics Teacher. (Vol. 62, No. 4, p. 27)

V I N C U L U M VOLUME 48 TERM 2 2011
20
Mathematical Modelling and ApplicationsGloria Stillman & Jill Brown —Jill Brown and Gloria Stillman are a Lecturer and an Associate Professor in Mathematics Education respectively at the Australian Catholic University. Both have research interests in mathematical modelling and applications.
Jill Brown
While the usefulness of mathematics for modelling and problem solving is well known, mathematics also has a fundamental role in enabling cultural, social and technological advances, and empowering individuals as critical citizens in contemporary society and for the future. (VCAA, 2008, p. 4)
In addition, the VELS states that mathematical modeling is one of the four key elements of mathematical thinking and reasoning.
Mathematical reasoning and thinking underpins all aspects of school mathematics, including problem posing, problem solving, investigation, and modelling. It encompasses the development of algorithms for computation, formulation of problems, making and testing conjectures, and the development of abstractions for further investigation. (VCAA, 2008, p. 5)
What is mathematical modelling?The process of beginning with a real-world situation and gaining understanding about that situation through the use of mathematics is known as mathematical modelling. Basically, this means being able to understand a real-world situation well enough to describe, analyse, and explain it in some mathematical way.
Mathematical Modelling versus ApplicationsBoth modelling and applications are important aspects of school mathematics. It is important to appreciate the difference. In applications, the task setter, usually the teacher, starts with mathematics and looks for links in the real world. Where can I use this particular piece of mathematical knowledge? For example, what can I use to illustrate quadratics?
In modelling, the task setter begins with the real world, looks at the mathematics and then most importantly returns to the real world. For example, I have an illumination problem. How can I model this with maths to solve it? “The modelling process is driven by the desire to obtain a mathematically productive outcome for a problem with genuine real-world motivation” (2006, p. 143).
In the 2004-2006 RITEMaths Project, it was clear that a large majority of the students found applications and modelling helpful in their
developing understanding of mathematics. The following responses are from two year nine students who were interviewed after engaging in the Shot on Goal task.
Sam: I also like doing things like this that gives a separate theory to reality because it helps you visualise.
Interviewer: So the fact that this was set in a real world context?
Sam: It helped me visualise what the real situation could be, how we could deal with it too.
Interviewer: Did it help you at all? When you were trying to figure out the maths of it, did you go back and think about the real setting of it?
Tracey: Yeah, you do.
Interviewer: And that did help?
Tracey: Yeah, because you can imagine doing it in real life.
(RITEMATHS project, 2006, SOG)
Photographs are particularly helpful in problem posing which can lead to mathematical modeling. For example, have you ever wondered
• what is the ‘best’ way to peel a pineapple?
• where a new tropical resort should be located given tropical cyclone activity? (English, Fox, & Watters, 2005).
• how long would it take to evacuate the Q1 building on the Gold Coast?
• whether a subway would ease traffic congestion in the Gold Coast?
These last two questions were posed and investigated during the annual A. B. Paterson College Mathematical Modelling challenges, held on the Gold Coast each year.
ReferencesEnglish, L., Fox, J., & Watters, J. (2005). Problem
posing and solving in mathematical modelling. Teaching Children Mathematics, 12(3), 156–163.
Galbraith, P., & Stillman, G. (2006). A framework for identifying student blockages during transitions in the modelling process. ZDM, 38 (2), 143–162.
What can I use to illustrate quadratics?
I have an illumination problem. How can I model this with maths to solve it?

Looking for lesson plans, activities, tutorials and support?
Visit http://education.ti.com/australiafor the latest updates and resources
Your Passion. Our Technology. Student Success. GO
TOW
OTE
X541
0 03
/11
TEX5410 Web Flyer.indd 1 9/03/11 2:04 PM

MathsBites by Clifford the DogIt’s just another qqq in the wall
Fraction bits and pieces
Fractions have been around since antiquity – whenever and wherever people have needed to refer to parts of some unit, often in a measurement context. The word fraction comes from the Latin frangere – meaning ‘to break’ - as in the word fracture. The English word ‘frangible’ means ‘breakable’. The way a fraction is written with numerator vertically above the denominator, and horizontal line segment separating them, for example ‘two-thirds’ as 2
3, evolved in Hindu-Arabic mathematics from the 7th to 12th centuries CE. The horizontal line segment is called a vinculum (Latin for rod or tie). The alternative ‘diagonal slash’ notation, as in 2
3, called a virgule (Latin for little twig) or solidus, was introduced in the 1700s for convenience in type-setting on a printing press where it was set ‘single-line’ as 2/3. So a fraction can be thought of as a broken or fractured part of some unit.
The following diagram shows a ‘fraction wall’ comprising two copies of a ‘unit strip’ sub-divided into fifteen equal parts. Explain how this could be used to decide which of 2
3 and 35 is largest and
find the difference between them.
Walls for fractions
Consider {1, 2, 3, 4 … 10} the corresponding unit fractions 11
12
13
14
110, , , ...{ } and multiples of these
up to 1, such as 59. What would be a suitable fraction wall, for example, to model, compare, add
and subtract fractions involving halves, quarters and eighths? One based on unit strips divided into eight equal parts would be suitable. For halves, thirds, quarters and sixths, a fractions wall with unit strips divided into twelve equal parts would be suitable. The following fraction wall is suitable for working with halves, thirds, fifths, sixths and tenths, and the unit fraction for each of these is shown. Use the fraction wall to determine which of 1
215+ and 1
316
110+ + is larger, and by how much.
What would be a suitable fraction wall when working with 11
12
13
14
15
16
18
19
110, , , , , , , ,{ } and multiples of
these fractions? What could be used as an alternative model? Why is 17 not convenient for fraction
walls?
V I N C U L U M VOLUME 48 Term 2 2011