tenth annual energy paper full - j.p. morgan
TRANSCRIPT

EYE ON THE MARKET • ENERGY OUTLOOK 2020
Tenth Annual Energy Paper

Tenth Annual Eye on the Market Energy paper: Front Cover
Stargazing. COVID lockdowns reduced global CO2 emissions to levels last seen over a decade ago. While this decline is temporary, there’s still a lesson to be learned: an unsustainable halt in economic activity and mobility was needed to make a material dent in global CO2 emissions. In our tenth annual Eye on the Market energy paper, we take a look at when and how renewable energy transitions might accomplish the same thing. A lot of ideas flicker in the distance, but few are capable of being scaled and substantially commercialized in the foreseeable future.
Topics in this year’s paper include limits from de-carbonizing the grid alone; de-carbonization of steel and other industrial products; political and physical renewable energy bottlenecks; the scope of utility-scale energy storage, reforestation, and carbon sequestration required to make a difference; the impact of ride-hailing on emissions, and the never-ending hope for a hydrogen economy. We also review the financial, political and environmental risks to US energy independence, and whether a supply shock or stranded asset risk is the primary reason for the lowest oil & gas valuations in 90 years. We conclude with an exhibit on Trump and the environment.
INVESTMENT PRODUCTS ARE: • NOT FDIC INSURED • NOT A DEPOSIT OR OTHER OBLIGATION OF, OR GUARANTEED BY, JPMORGAN CHASE BANK, N.A. OR ANY OF ITS AFFILIATES • SUBJECT TO INVESTMENT RISKS, INCLUDING POSSIBLE LOSS OF THE PRINCIPAL AMOUNT INVESTED

1
Preface: the large but temporary impact of COVID on global energy consumption
One of the worst pandemics in 100 years had an understandably large impact on energy consumption given widespread adoption of lockdowns and other mobility restrictions. Estimates of real-time global CO2 emissions showed a decline in May to levels last seen over a decade ago. However, this decline is almost certainly a temporary one. High frequency measures of China coal consumption are already back to pre-pandemic levels, the same is true for China oil demand as tankers line up on its eastern ports waiting to discharge oil for Chinese refineries, and China air traffic is down only 30% vs January. In the US, electricity production never fell more than 15% y/y during the pandemic, a full rebound is expected for US gasoline consumption by the second half of the year, and the EIA expects global liquid fuels consumption to reach pre-COVID levels by June 2021. Even so, there’s an energy lesson to be learned from the pandemic: an unsustainable halt in economic activity and mobility was needed to make a material dent in global CO2 emissions. In our tenth annual energy paper, we take a close look at when and how renewable energy transitions might accomplish the same thing.
30
40
50
60
70
80
90
100
110
1970 1980 1990 2000 2010 Jan 2020 Mar 2020 May 2020
Source: Quéré et al, "Temporary reduction in daily global CO2 emissions during the COVID-19 forced confinement" University of East Anglia. 2020.
Global daily CO2 emissions: history from 1970-2019, with daily estimates for 2020, Million tonnes CO2 / day
-60%
-40%
-20%
0%
20%
40%
60%
2018 2019 2020
Source: cqcoal, Wind. June 24, 2020
China coal consumptionDaily y/y % change
-15%
-10%
-5%
0%
5%
10%
15%
20%
25%
2017 2018 2019 2020
Source: Bloomberg. May 2020.
China oil demandMonthly y/y % change
0
2
4
6
8
10
12
Jan-20 Feb-20 Mar-20 Apr-20 May-20 Jun-20
Source: Flightradar24. June 23, 2020.
Air traffic at China’s 25 busiest airportsTotal departures, thousands
75
80
85
90
95
100
105
110
Jan 18 Jul 18 Jan 19 Jul 19 Jan 20 Jul 20 Jan 21 Jul 21
World liquid fuels consumption Million barrels per day
Source: EIA Short-term Energy Outlook. June 2020.
COVID update
The epicenter of the US pandemic has shifted from the Northeast to several hotspot states spanning the Southern US from coast to coast. Until recently, while hotspot infections were surging, hospitalizations and deaths were not. Over the last week, hospitalizations in hotspot states have been rising as well. These outcomes are not a complete surprise; many hotspot states experienced the smallest declines in social distancing, measured by retail and restaurant tracking. For more information on the virus, vaccine development and market/economic impacts, see
our virus analysis portal which can be found here.

2
Executive Summary
When I began writing this piece ten years ago, I knew that I needed a technical advisor to shepherd me through the real world complexity of energy transitions. Vaclav Smil is one of the world’s foremost experts on such topics, and his guidance and insights have been invaluable. Over the last decade, Vaclav has described renewable energy as the fourth great energy transition (after mastery of fire, a shift from foraging to agriculture and domesticated animals, and a shift from biomass and human/animal labor to combustion of fossil fuels). However, he has also stressed the decades required for past energy transitions to unfold, illustrated in the first chart. In our discussions, he has also cautioned against embrace of faddish energy solutions that sound great on paper but which are difficult to scale (some are illustrated on this year’s cover), and has highlighted how energy efficiency gains are often offset by greater consumption. An example of the latter: a 75% decline since 1960 in jet aircraft fuel consumption per passenger-kilometer led to similar declines in ticket prices and a surge in ridership and related aircraft emissions.
With that introduction, here’s where we stand now. While global CO2 intensity has improved (the amount of CO2 generated per unit of real economic growth has declined), the absolute level of global CO2 emissions keeps going up. Recent emission increases mostly come from emerging economies, but remember the reasons why. Developed countries have been de-industrializing for 25 years, which has shifted carbon-intensive manufacturing of steel, cement, ammonia and plastics to the emerging world. In other words, emerging countries now produce industrial goods they need on top of what they also produce for the developed world. Any discussion of regional emissions and burdens should reflect these realities.
0%
10%
20%
30%
40%
50%
0 10 20 30 40 50 60 70 80
Coal, 1820 to 1900
Oil, 1910 to 1990
Natural gas, 1930 to 2010
Modern renewables, 2010 to 2020
The last three energy transitions took ~40 years to reach 15%-20% shares, % of world primary energy consumption
Years
Source: V. Smil (pre-1965 data), BP (post-1965 data), JPMAM. 2020.
10
15
20
25
30
35
0.20
0.25
0.30
0.35
0.40
0.45
0.50
0.55
0.60
0.65
1965 1970 1975 1980 1985 1990 1995 2000 2005 2010 2015
Source: BP Statistical Review of World Energy, Conference Board. 2019.
Global CO2 intensity declining, CO2 emissions risingTonnes of CO2 / thousand $2018 GDP Billion tonnes
CO2 intensity CO2 emissions
0%
10%
20%
30%
40%
50%
60%
70%
80%
90%
100%
1995 2018 1998 2017 1998 2019 1998 2016 2005 2018
Source: UN Dept. of Social and Economic Affairs, Worldsteel, PlasticsEurope, USGS. 2019.
A shift in energy intensive manufacturing to the emerging world, % of global production
Manufacturing SteelAmmonia Cement
Developed economies
Emerging economies
Plastic-400
-200
0
200
400
600
800
1,000
EU Japan US LatinAmerica
SE Asia MiddleEast
Africa China India
Historical change 2008-2018
Projected change 2018-2040
Source: International Energy Agency World Energy Outlook. 2019.
Primary energy use, past and futureMtoe, with projections based on IEA Stated Policies Scenario
China:2,044 Mtoe

3
To reinforce the point on transfer of production to the developing world, consider coal-fired electricity generation. All the world’s countries except China reduced net coal-fired generation capacity by 8 GW from January 2018 to June 2019. Over the same period, China increased such coal capacity by 43 GW, has another 121 GW under construction and is financing a quarter of all new coal projects across Asia. In other words, global reliance on cheap industrial and consumer goods exports from China comes at a substantial environmental cost.
Here’s a simple exercise in CO2 emissions math. Forget about reducing emissions; let’s just think about keeping emissions flat. Emerging economy emissions increased by 3% p.a. since 2007 while developed world emissions declined by 0.7%. Let’s assume that emerging economy emissions grow at the same pace and that the developed world has to emit less. To keep global emissions flat, the developed world would need to reduce emissions by ~4% per year, which is 5x-6x faster than the current pace. Whether that would be enough to keep oceans from continuing to heat up is unclear, but it would be a move in the right direction.
-4%
-3%
-2%
-1%
0%
1%
2%
3%
Emerging countries,annual emissions
changes, 2007-2018
Developed countries,annual emissions
changes, 2007-2018
Req. annual decline indeveloped countryemissions to keep
global emissions flatSource: BP Statistical Review of World Energy. 2019.
Required emission decline in developed countries to keep global CO2 emissions flat: 5-6x faster than current pace
-150
-100
-50
0
50
100
150
200
250
1958 1964 1969 1974 1979 1984 1989 1994 1999 2004 2009 2014 2019
Source: Cheng, L. et al., Advances in Atmospheric Sciences; Dahlman and Lindsey, National Oceanic and Atmospheric Administration. February 2020.
Warming oceansZettajoules
Ocean heat content change in upper 2000 m vs 1981-2010 baseline (Cheng)
Ocean heat content change in upper 700 m vs 1955-2006 baseline (NOAA)

4
How might developed and developing countries accelerate the pace of de-carbonization? The visual below shows how primary energy is used to generate electricity on the left; and on the right; the composition of all energy consumed including electricity, broken down by end-user1.
Key takeaways: so far, de-carbonization has mostly taken place on the grid. The 17% share of electricity in global energy consumption limits de-carbonization potential from the grid alone; electricity and de-carbonization will have to make substantial inroads in industrial use as well. While technologies are now available to achieve partial electrification of certain industrial processes, evidence of such transitions are very limited, even in jurisdictions with carbon taxes2. The electrification of industry must obey chemical and physical laws as well as economic ones, which we discuss this year in Section 1.
On transportation, there’s a plan in many countries for rapid electric vehicle adoption, but the jury is out regarding how fast it will occur. In 2019, the EV share of global light vehicle purchases was 2.5%, while in the US the EV share was 1.9% (both shares have risen from ~1.2% in 2017); that sounds more like a skirmish than a revolution to me.
And finally, the issue of carbon sequestration. After 20 years in development, carbon capture facilities only store 0.1% of global emissions every year, and there isn’t even a viable blueprint yet for direct air capture or other forms of CO2 mineralization at meaningful scales. Even something straightforward and beneficial like reforestation is often magnified way beyond its actual potential, a topic we discuss this year as well.
1 Regionally, there are only modest differences in the charts above; see Appendix Table on page 34. Importantly, electricity represents less than 25% of energy consumption in every major region.
2 There are roughly 60 carbon pricing initiatives around the world, covering 15% of global GHG emissions (note that carbon taxes and cap/trade systems only apply to a subset of a country’s emissions; power and industry are usually included, while transport, buildings, waste and agriculture are often not). Carbon prices per tonne vary widely: $2 (Japan, Mexico), $18 (California), $30 (EU), $50 (France), $120 (Sweden).
Electricity Electricity
PetroleumPetroleum
Petroleum
Coal
Coal
Nat gas
Nat gas
Renewable
0
50
100
150
200
250
Industrial Transport Resid/Comm
Global electricity generation, and its contribution to total energy consumed by end-users
Source: Energy Information Administration, J.P. Morgan Asset Management. 2019. As per BP/EIA convention, primary energy for nuclear power is derived by assuming 38% thermal conversion. For renewables, primary energy conversion only reflects transmission losses.
Key Stats
Electricity is just 17% of global energyconsumed by end-users
Decarbonization via renewables mostly confined to electricity, with some industrial use
Renewables account for 30% of electricity, and 11% of total energy consumed by end-users
Fossil fuels used in electricity generation represent 30% of all fossil fuel use
Industrial sector is by far the greatest consumer of energy
Energy consumed by end-users, quad. BTU
Petroleum
Nat Gas
Nat Gas 23%
Coal
Coal 34%
NuclearNuclear 11%
Renewables 30%
0
50
100
150
200
250
Electricity generation, quad. BTU
Primary energy
...is converted into electricity
Grey = energy losses from thermal conversion, power plant consumption & transmission
Hydro 18%Wind/Solar 11%

5
1. The Ten Energy Commandments…………………………………………....................................................7
Ten energy and de-carbonization one-pagers to share with clients, friends and family. Topics include the pace of renewable energy adoption, electrification of industry, utility-scale energy storage, transmission bottlenecks, carbon capture, reforestation, ride-hailing, dietary choices and the “hydrogen economy”
2. Peak US energy independence? Pressures on the US shale industry intensify…………………………17
In 2019 the United States achieved its greatest level of energy independence on record, but financial and environmental pressures may bring this independence era to an end
3. Mountains vs Molehills, 2020: de-carbonization of steel, and deep geothermal energy……………25
The latest installment in our series deconstructing de-carbonization ideas reported in the press
4. Oil & gas equity market underperformance: stranded asset risks or supply shock?............................29
Some believe that stranded asset risks explain the oil & gas sector’s dreadful performance over the last 5 years. A closer look suggests that loss of capital discipline and a supply shock are equally responsible
5. Maiming the Swamp: Trump and the Environment………………………………………………………....33
The latest tally of Trump administration rollbacks of environmental rules and regulations
__________________________________________________________________________________________ Links to select topics from prior Eye on the Market energy editions
Germany and Energiewende: A dispassionate assessment (2019)
Wildfires: anthropogenic climate change and risks for utilities in fire-prone areas (2019)
Electric vehicles: a 2% or a 20% solution? (2018)
High voltage direct current lines: China leads, US lags (2018)
The Dream Team rebuttal of the Jacobson “100% renewable electricity by 2050” plan (2018)
Better safe than sorry: sea level rise, coastal exposure and flood mitigation (2018)
Hydraulic fracturing: the latest from the EPA and some conflicting views from its Advisory Board (2017)
Forest biomass: not as green as you might think (2017)
The myth of carbon-free college campuses (2017)
Distributed solar power and utility billing changes which increase the cost (2016)
US hydropower: how much potential for expansion? (2016)
Nuclear power: skyrocketing costs in the developed world (2014 and 2015)
With that background, here are the topics discussed in this year’s Eye on the Market energy paper on its tenth anniversary.
Table of Contents
6
Acknowledgements
Our energy Eye on the Market is overseen by Vaclav Smil, Distinguished Professor Emeritus in the Faculty of Environment at the University of Manitoba and a Fellow of the Royal Society of Canada. His inter-disciplinary research includes studies of energy systems (resources, conversions and impact), environmental change (particularly global biogeochemical cycles), and the history of technical advances and interactions among energy, environment, food, economy, and population. He is the author of more than 40 books (the latest one, Growth, was published by the MIT Press in September 2019 and the next one, Numbers Don’t Lie, is coming out in September 2020) and more than 400 papers on these subjects and has lectured in North America, Europe, and Asia. In 2010, Foreign Policy magazine listed him among the 100 most influential global thinkers. In 2015, he received the OPEC award for research, in 2019 American Energy Society named him Energy Writer of the Year, and he is described by Bill Gates as his favorite author.
We also appreciate feedback we received on various sections from scientists and researchers at the National Renewable Energy Laboratory, the Lawrence Berkeley National Laboratory, the Imperial College of London Centre for Environmental Policy, the Rockefeller University Program for the Human Environment, the Lund University Department of Human Ecology, Nanjing University, the Duke University Nicholas School of the Environment and the University of California Riverside Earth and Planetary Sciences Department.
Acronyms
BTU British thermal unit; CCS carbon capture and storage; CHP Combined heat and power; CIS Confederation of Independent States; CO2 carbon dioxide; CSP concentrated solar power; E&P exploration and production; EIA Energy Information Agency; EPA Environmental Protection Agency; EV electric vehicle; FERC Federal Energy Regulatory Commission; FP flowback and produced water; GHG greenhouse gas emissions; GJ gigajoule; GW gigawatt; GWPC Groundwater Protection Council; HVAC Heating, ventilation and air conditioning; HVDC high voltage direct current; HY high yield; IAEE International Association for Energy Economics; IEA International Energy Agency; IFPEN French Institute of Petroleum; IPCC Intergovernmental Panel on Climate Change; IRENA International Renewable Energy Agency; ISO independent system operator; ITC Investment Tax Credit; kg kilogram; km kilometer; kW kilowatt; kWh kilowatt-hour; LBNL Lawrence Berkeley National Laboratory; LNG liquefied natural gas; m3 cubic meter; MISO Midcontinent Independent System Operator; Mt metric tonnes; Mtoe million tons of oil equivalent; MW megawatt; MWh megawatt-hour; NGL natural gas liquids; NREL National Renewable Energy Lab; OECD Organization for Economic Cooperation and Development; OSHA US Occupational Safety and Health Administration; PEM Polymer electrolyte membrane; PPA Power Purchase Agreement; TWh terawatt-hour; USGS US Geological Survey; VMT vehicle miles traveled
7
[1] The Ten Energy Commandments: on energy and de-carbonization
These have been useful in discussions with friends/family, but the conversations are not always easy.
[i] Thou shalt not conflate the speed of wind and solar cost declines with the speed of de-carbonization
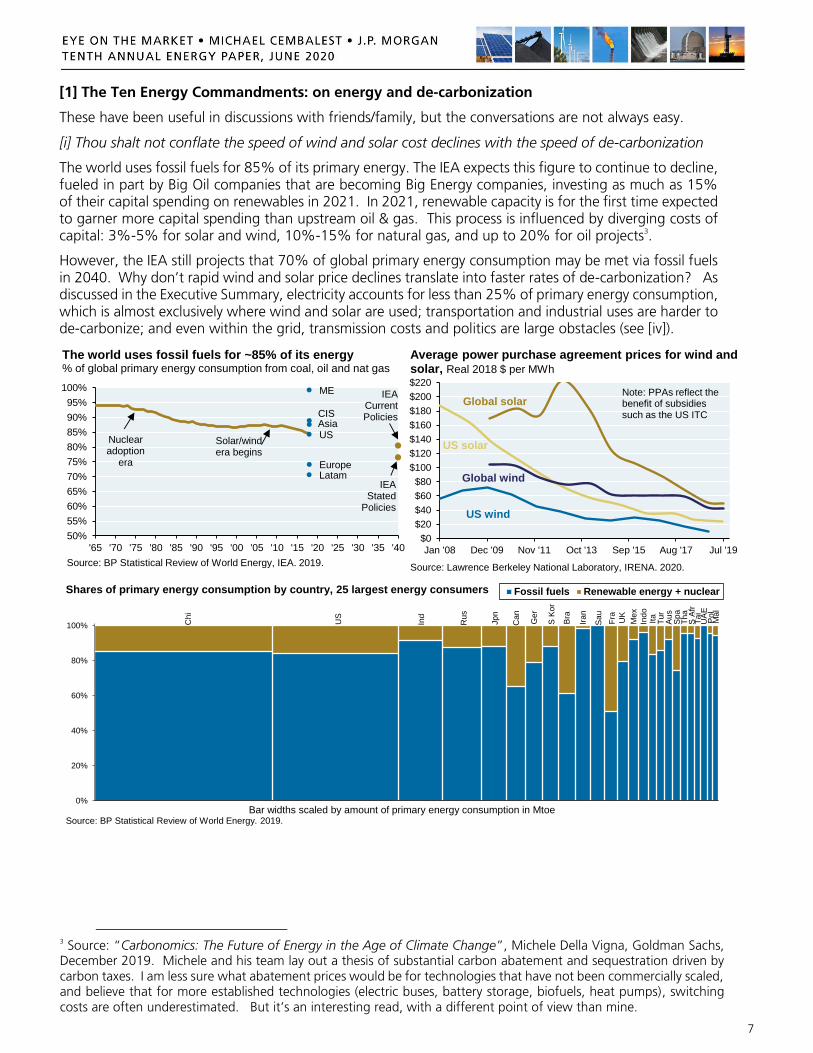
The world uses fossil fuels for 85% of its primary energy. The IEA expects this figure to continue to decline, fueled in part by Big Oil companies that are becoming Big Energy companies, investing as much as 15% of their capital spending on renewables in 2021. In 2021, renewable capacity is for the first time expected to garner more capital spending than upstream oil & gas. This process is influenced by diverging costs of capital: 3%-5% for solar and wind, 10%-15% for natural gas, and up to 20% for oil projects3.
However, the IEA still projects that 70% of global primary energy consumption may be met via fossil fuels in 2040. Why don’t rapid wind and solar price declines translate into faster rates of de-carbonization? As discussed in the Executive Summary, electricity accounts for less than 25% of primary energy consumption, which is almost exclusively where wind and solar are used; transportation and industrial uses are harder to de-carbonize; and even within the grid, transmission costs and politics are large obstacles (see [iv]).
3 Source: “Carbonomics: The Future of Energy in the Age of Climate Change”, Michele Della Vigna, Goldman Sachs, December 2019. Michele and his team lay out a thesis of substantial carbon abatement and sequestration driven by carbon taxes. I am less sure what abatement prices would be for technologies that have not been commercially scaled, and believe that for more established technologies (electric buses, battery storage, biofuels, heat pumps), switching costs are often underestimated. But it’s an interesting read, with a different point of view than mine.
Europe
Asia
Latam
CIS
ME
US
50%
55%
60%
65%
70%
75%
80%
85%
90%
95%
100%
'65 '70 '75 '80 '85 '90 '95 '00 '05 '10 '15 '20 '25 '30 '35 '40
Source: BP Statistical Review of World Energy, IEA. 2019.
The world uses fossil fuels for ~85% of its energy% of global primary energy consumption from coal, oil and nat gas
Nuclearadoption
era
Solar/windera begins
IEA Stated
Policies
IEA Current Policies
$0
$20
$40
$60
$80
$100
$120
$140
$160
$180
$200
$220
Jan '08 Dec '09 Nov '11 Oct '13 Sep '15 Aug '17 Jul '19
Source: Lawrence Berkeley National Laboratory, IRENA. 2020.
Average power purchase agreement prices for wind and solar, Real 2018 $ per MWh
US wind
Global wind
US solar
Global solarNote: PPAs reflect the benefit of subsidies such as the US ITC
Chi
US
Ind
Rus
Jp
n
Can
Ge
r
S K
or
Bra
Ira
n
Sa
u
Fra
UK
Me
x
Ind
oIt
aT
ur
Au
sS
pa
Th
aS
Afr
Ta
iU
AE
Po
lM
al
0%
20%
40%
60%
80%
100%
Fossil fuels Renewable energy + nuclear
Bar widths scaled by amount of primary energy consumption in Mtoe
Shares of primary energy consumption by country, 25 largest energy consumers
Source: BP Statistical Review of World Energy. 2019.

8
[ii] Thou shalt pay a heavy price to electrify industry, when it can be done at all
As illustrated above, the industrial sector is the largest fossil fuel end-user. Could some industrial processes be electrified to eventually use more renewable energy as the grid is de-carbonized? Examples include sectors which use fossil fuels primarily for “process heat” (see table). However, even for sectors with high potential for electrification, it could be an expensive transition. In addition to upfront switching costs, industrial companies would face costs per unit of energy that are 3x-6x higher for electricity compared to the cost of direct natural gas combustion. Electric heating efficiency gains vs natural gas could offset part of the cost, but not all of it. A carbon tax would change these dynamics; it remains to be seen if countries will adopt them at levels required to engineer faster transitions.
Sectors such as chemicals, pulp/paper and food take advantage of combustion waste heat for power (“CHP: combined heat and power”). They are harder to electrify since producers would need to then purchase the part of their energy needs previously obtained at little to no incremental cost, or redesign the entire process. Sectors such as glass, brick and cement require temperatures in excess of 1400°C, and are also harder to electrify since they are non-metallic, non-conductive solids.
The four industrial pillars of modern society are steel, cement, ammonia (for fertilizer) and plastics; each relies on fossil fuels as raw materials and/or for process heat at very high temperatures. Production of these pillars is expected to keep rising, though at a slower pace than during China’s industrialization era.
Industrial sectors with "high" potential for electrification
Sector
Heat
requirement HVAC
Process
Heat CHP
Primary metals excl. steel 1200°C 6% 75% 7%
Fabricated metal 430°C-680°C 20% 61% 7%
Machinery 730°C 46% 39% 4%
Secondary steel 1425°C-1540°C 4% 87% 0%
Wood products 180°C 10% 50% 14%
Vehicle parts (drying) 150°C 31% 33% 12%
Plastics and rubber 260°C 20% 33% 24%
Source: LBNL, "Electrification of buildings and industry ", March 2018
CHP refers to "combined heat and pow er", a process by w hich w aste heat
from combustion provides additional pow er. Sectors above have low CHP
shares; sectors w ith higher CHP shares are harder to electrify.
Fuel consumption shares:
Texas
Cali
forn
ia
Lo
uis
ian
a
Ind
ian
a
Illi
no
is
Oh
io
Pe
nn
sylv
an
ia
UK
Germ
an
y
Italy
Fra
nc
e
Jap
an
Ch
ina
0x
1x
2x
3x
4x
5x
6x
7x
Source: EIA, Eurostat, IAEE, CEIC, IFPEN, JPMAM, World Bank. 2019. States shown are largest industrial users of US primary energy.
Electricity is 3x-6x more expensive than natural gasCost per megajoule of energy, electricity price divided by natural gas price; for industrial users
Industrial use of fossil fuels as raw materials
Metallurgical coke
Pig (cast) iron smelting (carbon
source), which eventually
becomes steel
Methane
Synthesis of ammonia
(hydrogen source), mostly
used for fertilizing crops
Methane, naphtha
and ethane
Synthesis of plastics (sources
of monomers)
Heavy petroleum
products
Production of carbon black
(rubber filler), used in tires &
other industrial products
Industrial use of fossil fuels to generate process heat
Construction materials (cement, bricks, tiles, glass, kiln-dried timber)
Production of petrochemicals, synthesis of plastics, food/beverage
Smelting of iron ores in blast furnaces
Product 2000
2000-2018
CAGR 2018
2018-2050
CAGR E 2050 E
Steel 848 4.3% 1,817 0.6% 2,170
Cement 1,660 5.2% 4,100 0.4% 4,682
Ammonia 132 1.5% 171 1.6% 281
Plastics 190 3.6% 359 2.6% 818
Global production (million tonnes)
Source: Energy Transitions Commission, USGS, World Steel Association,
PlasticsEurope. 2019. CAGR = compound annual growth rate.
9
[iii] Thou shalt toil mightily to store energy that you produce
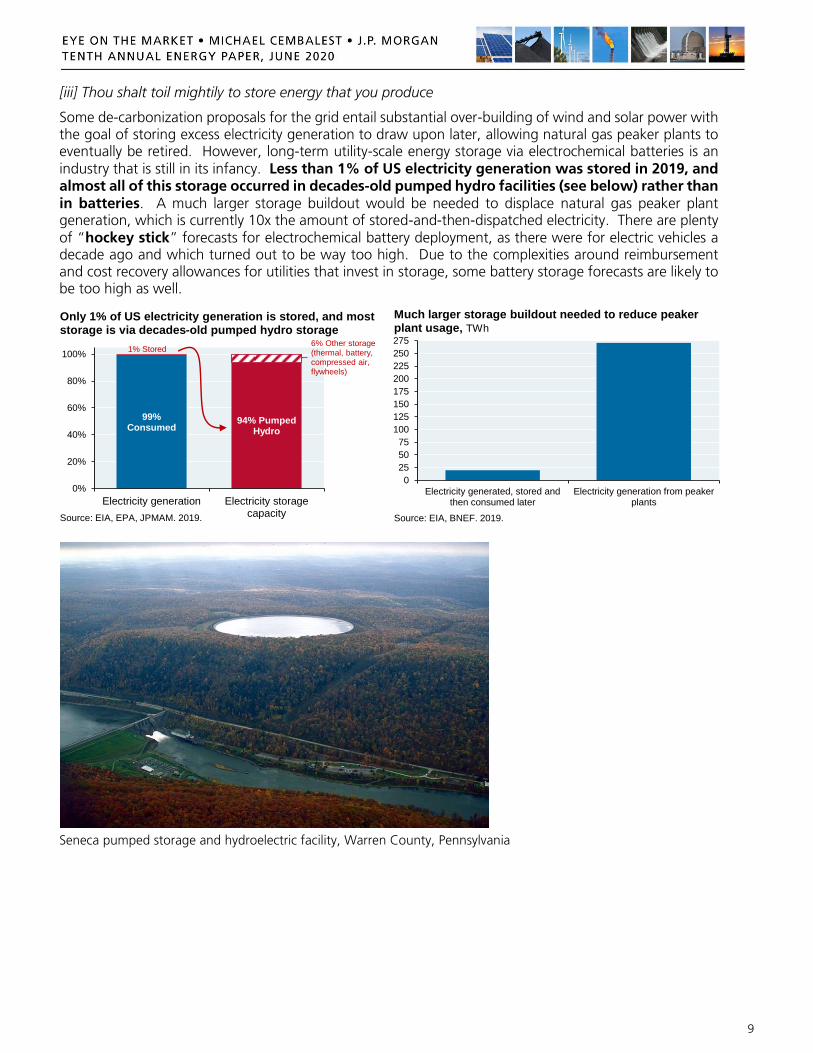
Some de-carbonization proposals for the grid entail substantial over-building of wind and solar power with the goal of storing excess electricity generation to draw upon later, allowing natural gas peaker plants to eventually be retired. However, long-term utility-scale energy storage via electrochemical batteries is an industry that is still in its infancy. Less than 1% of US electricity generation was stored in 2019, and almost all of this storage occurred in decades-old pumped hydro facilities (see below) rather than in batteries. A much larger storage buildout would be needed to displace natural gas peaker plant generation, which is currently 10x the amount of stored-and-then-dispatched electricity. There are plenty of “hockey stick” forecasts for electrochemical battery deployment, as there were for electric vehicles a decade ago and which turned out to be way too high. Due to the complexities around reimbursement and cost recovery allowances for utilities that invest in storage, some battery storage forecasts are likely to be too high as well.
Seneca pumped storage and hydroelectric facility, Warren County, Pennsylvania
99% Consumed
94% Pumped Hydro
1% Stored 6% Other storage (thermal, battery, compressed air, flywheels)
0%
20%
40%
60%
80%
100%
Electricity generation Electricity storagecapacity
Only 1% of US electricity generation is stored, and most storage is via decades-old pumped hydro storage
Source: EIA, EPA, JPMAM. 2019.
0
25
50
75
100
125
150
175
200
225
250
275
Electricity generated, stored andthen consumed later
Electricity generation from peakerplants
Source: EIA, BNEF. 2019.
Much larger storage buildout needed to reduce peaker plant usage, TWh

10
[iv] Thou shalt confront thy neighbor regarding his NIMBY policy on renewable energy deployment
Lawrence Berkeley National Labs recently released a study of renewable transmission costs 1
4 in light of the distance from many wind and solar projects to urban demand centers. The chart below shows levelized electricity generation costs in the blue bars, plus estimates of transmission interconnection costs and “bulk” long-distance transmission costs (the latter only for wind and solar, since the majority of bulk infrastructure for natural gas already exists). A renewable energy future must contend with these incremental costs, but that might not be the hardest part…there’s also the politics, as explained below. Like the US, Germany is also struggling with cost and political obstacles in bringing power from its northern wind sites to southern population centers, and already has the highest electricity costs in Europe.
“No Hampshire”. The proposed 1 GW Northern Pass transmission line connecting Hydro-Quebec to Southern New England was supported by Massachusetts regulators and its Department of Energy Resources to reduce reliance on fossil fuels and use hydropower instead. However, a New Hampshire siting
committee unanimously rejected the proposal since it worried that the 192-mile transmission line would disrupt streets and harm tourism. Concessions by the project group to bury 52 miles of the route and set aside 5,000 acres of preservation/recreation land were insufficient to change the outcome. In July 2019, the New Hampshire Supreme Court rejected the proposal. The grid regulator ISO New England warned that the region's power system may soon be unable to meet electricity demand and maintain reliability without rolling blackouts or controlled outages (see box above). According to the IPCC, lifetime hydropower CO2 emissions are 5% of natural gas emissions, yet some opponents of the Northern Pass Project still cited its emissions as a reason for rejecting it.
4 “Improving estimates of transmission capital costs for utility-scale wind and solar projects to inform renewable
energy policy”, Energy Policy, Gorman, Mills and Wiser (LBNL), December 2019.
PJM
PJM
PJM
MISO
MISO MISO
0
10
20
30
40
50
60
Advanced combinedcycle natural gas
Onshore wind Solar photovoltaic
Levelized cost Plus interconnection/bulk transmission
Levelized cost of electricity, with & without transmission $/MWh
Source: EIA, Gorman et al., Lawrence Berkeley Laboratory. 2019. Transmission costs include LBNL estimates for local interconnection costs in MISO and PJM regions, plus their national estimates for bulk transmission costs derived from projects in California, Texas and the Midwest. Bulk costs represent the majority of total transmission cost.
Operational Fuel Security Analysis ISO New England, January 2018 “Energy shortfalls due to inadequate fuel would occur with almost every fuel-mix scenario in winter 2024/2025, requiring frequent use of emergency actions to keep power flowing and protect the grid. Emergency actions that would be visible to the public range from requests for energy conservation to load shedding (also known as rolling blackouts or controlled outages that disconnect blocks of customers sequentially)…The study results suggest that New England could be headed for significant levels of emergency actions, particularly during major fuel or resource outages.”

11
[v] Thou shalt not perpetuate false narratives on carbon capture and storage (CCS)
Despite almost 20 years of endless hype, by the end of 2019, CCS facilities captured and stored just 0.1% of global CO2 emissions. Put aside issues of cost overruns, failures of bellwether projects, the US Dep’t of Energy withdrawing support for large projects, cancellations in Europe, legal uncertainties about liability and the ~30% energy drag on coal facilities required to perform CCS in the first place. Let’s assume that all of these obstacles are solved via innovation and legislation.
The bigger problem is the scope required to make a difference. Global CO2 emissions from fossil fuels were ~33 bn metric tons in 2019. To store just 15% of this amount (5 bn metric tons), a CCS compression, transportation and storage industry would have to handle 6 bn cubic meters of CO2 every year by volume. How much is that? For context, that’s more than the 5 bn cubic meters of oil that’s produced, transported and refined each year around the globe. In other words, CCS infrastructure would have to be even greater than the one used for the world’s annual oil consumption just to sequester 15% of global emissions. There are applications where CCS makes sense (enhanced oil recovery and small amounts of commercial CO2 demand). But as a big picture solution to CO2 emissions, CCS buildout requirements are daunting.
What about carbon mineralization? Carbon mineralization is an alternative form of carbon capture and storage in which carbon dioxide, rather than being stored as a compressed gas underground, reacts with certain rocks (magnesite, basalt, etc) and is permanently mineralized. In ex-situ versions of this idea, billions of tons of calcite or magnesite would need to be mined each year even if just a small amount of annual CO2 emissions from fossil fuel combustion were removed from the atmosphere (to mineralize 15% of global CO2 emissions, more magnesite would need to be mined every year than annual global mining of coal and iron combined5). The materials handling costs would be enormous, and efforts to accelerate the chemical reaction vs its natural rate have been very challenging. The in-situ version of the idea involves injection of CO2 (mixed in water) into basalt rocks, and in which the carbon mineralization reaction can occur in just a year or two6. However, while you don’t have to mine and move rocks in this version, you do need to move the CO2 to where the rocks are… which brings us back to the chart above on the need for a massive build-out of carbon capture infrastructure (pipelines, compression, storage etc) to make even a small difference.
5 “Carbon Sequestration via Mineral Carbonation: Overview and Assessment”, Howard Herzog, MIT. 6 Read about Iceland’s CarbFix2 project if you want to learn more.
0
1
2
3
4
5
6
7
Mass ofsequestered
Volume ofsequestered
Mass of globaloil extraction
(mt)
Volume of globaloil extraction
To capture 15% of CO2 emissions, CCS infrastructurewould have to be larger than the global oil ecosystemBillions (metric tons for mass, cubic meters for volume)
Source: BP, IEA, JPMAM. 2019. Mt = metric tons, m3 = cubic meters
1.25 m3
per mtsupercritical
CO2
storage
1.15 m3
per mt of oil
CO2 (mt) CO2 (m3) (m3)

12
[vi] Thou shalt replenish the earth with trees, but not overestimate their impact
US forests comprise roughly 750 million acres, which is one third of all US land area (including Alaska and Hawaii). This amount of forest acreage has not changed much over the last 100 years, and offsets ~10% of annual US GHG emissions each year. Reforesting areas cleared due to wildfires/insect outbreaks and planting trees in previously unforested areas (“afforestation”) will help, but be realistic about the achievable
benefits. Assuming 2.5 metric tons of CO2 sequestered per year per acre of forest7, ~130 million acres would have to be planted to offset another 5% of US GHG emissions, bringing forested land area back to the level it was in 1850 (despite a 6-fold increase in US population since then). Reforesting that many acres of private and public land would be a major undertaking; as shown below, the US Forest Service has been
reforesting just over 100 thousand acres per year, which is three orders of magnitude smaller.
Remember as well that some amount of reforestation is needed just to offset acreage lost to (a) aging US forests which absorb less carbon over time, (b) CO2 released from wildfires, which has averaged 60 - 80 million metric tons per year since 2013, and (c) the impact of severe hurricanes, one example being Hurricane Michael which destroyed 3 million acres of trees in Florida in 2018.
7 Obviously depends on the species and location; triangulated from Journal of Forestry, EPA and USDA reports.
-1,000
0
1,000
2,000
3,000
4,000
5,000
6,000
7,000
8,000
1990 1993 1996 1999 2002 2005 2008 2011 2014
Source: US EPA. 2017. Total emissions include agriculture, waste and industrial processes such as chemical, metal and mineral production.
US forests offset 10% of annual GHG emissionsMillion metric tons of CO2 equivalents per year
Carbon sink from forests and land use changes
GHG emissions from energy
Total GHG emissions
0
50
100
150
200
250
300
350
700
750
800
850
900
950
1850 1870 1890 1910 1930 1950 1970 1990 2010
Source: United States Department of Agriculture. 2019.
Forest area and population trends in the USMillion acres Million people
Forest area
Population
0
2
4
6
8
10
12
1989 1992 1995 1998 2001 2004 2007 2010 2013 2016 2019
Acres burned by wildfires per year in the USMillions
Source: National Interagency Fire Center. 2019.
0
50
100
150
200
250
2004
2005
2006
2007
2008
2009
2010
2011
2012
2013
2014
2015
2016
2017
2018
2019
Total USDA reforestation per yearThousand acres
Source: USDA Reforestation and Timber Stand Improvement Reports. 2019.

13
[vii] Thou shalt not make unto thee graven images of a hydrogen economy…yet
The “green hydrogen” economy is based on the notion that hydrogen is a fuel that can be used to generate heat and power; that electrolysis can split water into its component molecules to produce oxygen and hydrogen; and that renewable electricity can be used to power the electrolysis required. However, due to the high costs of electrolysis, 95% of commercially available hydrogen is currently produced via steam methane reformation (SMR) of fossil fuels. Might that change one day, so that renewable-driven electrolysis could create “green” hydrogen?
In February of this year, the US Department of Energy released a study8 on the potential for hydrogen production using electrolysis instead of SMR. They estimated possible future hydrogen costs by (a) varying the price of electricity, which is by far the largest component of electrolysis costs, and (b) assuming 30%-60% declines in upfront electrolyzer capital costs as production increases
DoE future cost estimates range from $4.5 - $5.0 per kg of hydrogen assuming electricity costs of 7-8 cents per kWh, and assuming a large decline in electrolyzer capital costs. This would still be well above current state-of-the-art SMR hydrogen costs of just $1.15 per kg using current nat gas prices
If electricity costs fell to 3 cents per kWh (i.e., in the range of current wind and solar PPAs but without incorporating utility costs for transmission infrastructure), the DoE estimated that hydrogen production costs could fall to $2.0 - $2.5 per kg of hydrogen, which is closer to but still above current SMR costs. This scenario would require co-located renewable energy dedicated to hydrogen production
Bottom line: in the absence of a substantial carbon tax, further electricity and capital cost declines are required for green hydrogen costs to converge with fossil-fuel hydrogen costs9. In addition, to meaningfully impact energy consumption, existing turbines, engines, heating systems and other industrial equipment that now rely on natural gas would need to be replaced or upgraded to rely on hydrogen instead. That’s another real-life obstacle that hockey stick forecasts often fail to incorporate
8 DoE base case: electrolyzer capital costs decline by 30%-60% to $460 per kW ($342 for the electrolyzer stack and
the rest for storage, compression and other auxiliary systems required). Source: “Hydrogen Production Cost From PEM Electrolysis”, US Department of Energy, David Peterson et al, February 2020. 9 A 2019 hydrogen analysis from IRENA came to conclusions that were similar to the US DoE. For green hydrogen to become competitive with SMR hydrogen, IRENA estimates that upfront capital costs would need to fall by 75%, and that electricity costs would need to be around 2 cents per kWh.
Steam Methane Reformation (state of the art)
Steam Methane Reformation, low estimate
Steam Methane Reformation, high estimate
Electrolysis, 7 cents/kWh, 30-60% decline in capital costs
Electrolysis, 3 cents/kWh, 30-60% decline in capital costs
$0
$1
$2
$3
$4
$5
Electrolysis vs Steam Methane Reformation as a means of producing hydrogen, $/kg
Source: US Department of Energy. February 2020.
Hydrogen blasts from the past Hydrogen economy: A practical answer to problems
of energy supply and pollution (Science, 1972)
Hydrogen: Its Future Role in the Nation's Energy
Economy (Science, 1973)
Clean hydrogen beckons aviation engineers (New
York Times, May, 1988)
Hydrogen economy in the future (International Journal of Hydrogen, 1999)
Amory Lovins Sees the Future and It Is Hydrogen (Grist, May 1999)
The Hydrogen Economy (Jeremy Rifkin, 2003)

14
[viii] Thou shalt not equate “emissions foregone” and “emissions sequestered”
Voluntary Carbon Markets refer to companies or individuals purchasing voluntary emission reduction credits, also known as VERs or “carbon offsets”. Corporate or individual purchasers of VERs seek to offset their own emissions, and are typically different from those purchasing offsets as part of a regulated cap and trade system. What is an offset exactly? Well, that’s a good question. Technically, it’s a credit you buy to offset a metric ton of CO2 equivalent that you either emitted (or might emit in the future) by driving, flying etc. The offset would presumably render you “carbon neutral”. However…
There are two kinds of VERs. Some are derived from projects that actually sequester (i.e., remove) carbon from the atmosphere on a long term basis, while others are based on projects that avoid or prevent growth in future GHG emissions.
Currently viable versions of sequestration include forestry projects and related efforts (restoration of peat swamps in Indonesia, for example). Forestry carbon offsets are usually granted by accrediting agencies only when they occur and are verified, which takes time given how long it takes for certain species to grow, and given pest and wildfire risk. Forestry projects are also subject to sovereign risk in emerging countries where they’re often based; some UN reforestation “REDD” projects were reportedly compromised when trees were harvested despite payments made to protect them, with little accountability for the parties involved. Another challenge: local communities in emerging countries tend to prefer tree species that are valued for construction and furniture use, and are less welcoming of native faster-growing species with less perceived utility. Furthermore, exotic non-native species may have faster growth rates, but threaten biodiversity and bring risk of unintended ecological consequences10.
The second type (mitigation) includes capture of methane from landfills, dairy farms and coal mines; managing nitrogen fertilizer on farms; and switching to more energy efficient cookstoves. To reiterate, these projects do not sequester carbon; they slow the rate at which emissions would otherwise have grown in the future.
The size of the VER market is small. In 2018, only $300 million of VERs were purchased globally (a small fraction of regulated carbon trading markets). VER projects funded in 2018 offset 98 million tons of CO2, which was 0.3% of global CO2 emissions. It will be interesting to see if the VER market can accommodate growing interest from airlines11; air travel accounts for 2.5% of all CO2 emissions, which is much larger than 2018 VER project sequestration. There’s no reason why VER projects cannot expand, but oversight will be critical to maintain additionality, ownership, permanence and “no leakage” standards.
VERs traded at ~$3.5 per metric ton in 2017 and 2018, compared to $50 that the Environmental Defense Fund cites as the true social cost of carbon, and compared to the $75 price that the IMF estimates as necessary to accelerate energy transitions. In other words, VERs are inexpensive for purchasers but also reflect a world that has not incorporated the true cost of carbon into pricing mechanisms.
10 “Choosing species for reforestation in diverse forest communities: social preference versus ecological suitability”, Chechina and Hamann, University of Alberta, 2015. 11 In 2019, Shell began offering some customers nature-based carbon credits to offset emissions generated by its share of oil extraction, refining, distribution and use. BA and Air France announced they will offset emissions from domestic flights, while EasyJet announced it will offset all emissions from use of jet fuels immediately.
0
2
4
6
8
10
12
14
16
0 5
10
15
20
25
30
35
40
45
50
55
60
65
70
75
80
85
Coniferous Site 1
Coniferous Site 2
Coniferous Site 3
Evergreen Broadleaf
Deciduous
Examples of tree sequestration by type and ageCO2 sequestration per hectare per year, tonnes of CO2
Source: Research Institute for Sustainable Humanosphere, Kyoto Univ. 2015.
Age of tree (years, upper interval range)

15
[ix] Thou shalt not falsely extol the environmental benefits of ride-hailing services
What’s the impact of ride-hailing services on vehicle miles traveled and GHG emissions? The answer from several recent studies is straightforward: after accounting for people who would have taken public transport, biked or walked instead, and those who would not have traveled at all, there’s a substantial net increase in estimated vehicle miles traveled and emissions from ride-sharing, possibly as large as 60%-80% compared to a world with no ride-sharing at all12. Part of the issue: driver “dead-heading”, which refers to the time/distance ride-share drivers travel while waiting for passengers and commuting.
The charts tell the story: the surge in rides nationally and in NYC after the onset of ride-hailing apps; the increased emissions per trip-mile of ride-hailing trips; and estimates of ride-hailing miles traveled compared with what they replaced by trip category. As per the third chart, ride-hailing is only estimated to reduce emissions in a scenario of electric ride-hailing cars, further de-carbonization of the grid and rider pooling13. California and the City of Chicago have begun to implement penalties and incentives to promote ride-hailing electrification, rider pooling and use of mass transit (which in many cities has suffered declines in ridership). But the convenience of personalized ride-hailing may make it difficult to dislodge.
12 Sources for this section include:
“Ride-Hailing Climate Risks”, Union of Concerned Scientists, 2020
“The impact of ride‑hailing on vehicle miles traveled”, National Renewable Energy Laboratory, September 2018
“The New Automobility: Lyft, Uber and the Future of American Cities”, Schaller Consulting, 2018 13 Even in California, only 1% of ride-hailing vehicles were in EVs in 2018. Around 15% of ride-hailing trips are pooled.
0.0
0.5
1.0
1.5
2.0
2.5
3.0
3.5
4.0
1990 2000 2012 2016 2017 2018
Taxi Ride-Hailing
US ride-hailing and taxi ridershipAnnual ridership, billions
Source: "Ride-Hailing's Climate Risks", Union of Concerned Scientists. 2020.
0
50
100
150
200
250
300
350
2010 2011 2012 2013 2014 2015 2016 2017 2018
Juno
Via
Uber
Others
Lyft
Green Cab
Yellow Cab
Source: Barclays Research. December 2019.
Volume of rides in New York CityMillions of trips
0
100
200
300
400
500
600
700
Displacedtrip
Typical ride-hailingtrip
Electric ride-hailing trip,50% pooling
Source: "Ride-Hailing's Climate Risks" , Union of Concerned Scientists. 2020.
Ride-hailing emissionsEmissions per trip-mile (g CO2 equivalent)
69% more emissions than a displaced trip
52% less emissions than a displaced trip
0 100 200 300 400 500 600 700 800 900 1000
Taxi
Get a ride
Carpool (drive)
Car rental
Carpool (ride)
Bike or walk
Drive alone (SOV)
Wouldn’t have traveled
Public transportation
Ride-hailing VMT
Displaced VMT
Total vehicle miles traveled by ride-hailing services versus displaced choice of transportation
Source: National Renewable Energy Laboratory. September 2018.
A
B

16
[x] Thou shalt read Shakespeare: “The fault lies not in our stars, but in ourselves”
There is some irony to Americans being fascinated by the uncertain premise of geologic carbon storage and carbon mineralization at meaningful scales. Why is that? Americans emit close to the highest levels of CO2 per capita on the planet, and could more readily achieve emissions reductions through behavioral changes rather than through carbon capture schemes. The table shows three totally hypothetical scenarios of behavior switching (cars, housing and food) that in aggregate could substantially reduce US emissions if they all took place as described.
The table is not meant to suggest that such transitions would be easy; they would require large penalties or incentives, and habits are very hard to change. But such changes, as well as other ones dealing with consumption, heating/cooling temperature preferences and transportation patterns, could be a more reliable way for the US to reduce emissions in the near term.
Topic Scenario assumptions
Annual
emissions
decline
(MMT)
US mileage 27.4 mpg
Developed world mileage 41 mpg
US miles driven per capita 16,000
OECD Europe miles driven per capita 8,000
CO2 emissions per gallon of gasoline 8,887 grams
Number of US passenger vehicles 240,000,000
Affects 50 million US housing units above: 2,000 sq ft
Largest average dwelling sizes in Europe: 1,400 sq ft
(Belgium, Denmark, Netherlands, Sw itzerland)
CO2 intensity of nat gas, propane and fuel oil 53 - 73 kg of CO2 / MM btu
CO2 intensity of US electricity generation 0.99 pounds of CO2 / kWh
* Emissions results from this scenario were similar to a no-beef diet partially offset with added amounts of chicken, fish and pork.
Sources: EIA, EPA, Bureau of Transportation, ICCT, IEA, Eurostat, USDA, University of Michigan, Carnegie Mellon (EIO-LCA)
18% of total annual US emissions
Key assumptions
Emissions based on University of Michigan Center for Sustainable Systems,
Scenario #3, Feb 2020, "Implications of future US diet scenarios on GHG
emissions", Martin Heller et al
Cars
210Food
925Total annual CO2 savings
92
US home sizes converge to the
upper end of European averages,
reducing consumption of electricity,
natural gas, propane and fuel oil
Housing
US consumption of animal-based
foods decreases by 50%,
substituted with plant-based foods*
624
US drivers transition to cars with
developed world gas mileage, and
reduce half the US miles driven per
capita gap vs Europe

17
[2] Peak US energy independence? Roadblocks in the Shale Revolution
Whether the US energy deficit is measured in dollar terms or in energy terms, US reliance on foreign energy
supplies ended 2019 at its lowest level in 60 years3F
14. Nixon and his successors could only dream of this
kind of energy independence, which was a constant US policy objective for decades.
However, US energy independence is highly reliant on hydraulic fracturing: between 65%-80%
of all US natural gas, crude oil and natural gas liquid production was derived from fracturing operations in
2019. As a result, hydraulic fracturing accounted for 40% of all US primary energy consumption as well.
Looking ahead, the independence shown above may be at risk due to financial and environmental factors.
14 Here’s an illustrative statistic: US net oil imports as a % of US oil consumption declined from a peak of 60% in 2006 to 14% in 2018, the lowest level since 1958.
-0.5%
0.0%
0.5%
1.0%
1.5%
2.0%
2.5%
3.0%
3.5%
1978 1982 1986 1990 1994 1998 2002 2006 2010 2014 2018
Source: Bureau of Economic Analysis, Haver Analytics, JPMAM. Q1 2020.
US net energy deficit, in dollar termsEnergy imports - energy exports, % of GDP
March 2020-200
-100
0
100
200
300
400
500
600
700
800
1972 1976 1980 1984 1988 1992 1996 2000 2004 2008 2012 2016 2020
Source: EIA, JPMAM. March 2020.
US net energy deficit, in energy termsNet imports of oil, natural gas and coal in million tonnes of oil equiv.
0%
10%
20%
30%
40%
50%
60%
70%
80%
1995 1998 2001 2004 2007 2010 2013 2016 2019
Source: EIA, US Department of Energy, JPMAM. 2019.
Percentage of US oil and gas production derived from hydraulic fracturing through year-end 2019
Crude oil
Natural gas
Natural gas liquids (ethane,
propane, butane)
Oil, gas and NGLs from unconventional
sources requiring hydraulic fracturing
Oil, gas and NGLs from
conventional sources
Coal
Nuclear BiomassHydro
Wind
Solar/Geoth
0%
10%
20%
30%
40%
50%
60%
70%
80%
90%
100%
Source: EIA, BP, Society of Petroleum Engineers, S&P Platts, JPMAM. 2018.
Hydraulic fracturing accounted for 40% of all US primary energy consumption in 2018

18
Financial pressures
Even before the COVID pandemic, investing in the US shale revolution was something of a train wreck.
Let’s focus on a 29-stock universe15 of companies associated with the US shale boom from 2010 to 2019:
As a group, their aggregate free cash flow was negative in every year
Ten of these companies never experienced a single year of positive cash flow
Another thirteen companies only experienced positive free cash flow in 3 or fewer years out of 10
Note that this all happened despite 8%-9% of US natural gas production now being exported via LNG
terminals, which was supposed to be a catalyst for higher US natural gas prices (it wasn’t). This poor
financial performance led to a collapse in shale sector stock prices, an exodus of capital and a spike in
bankruptcies. Debt and equity issuance by E&P companies fell by 60% from 2014 to 2019. By the end of
2019, the industry shake-out started to translate into better relative equity performance for the S&P 500
E&P sector…and then COVID hit, after which the relative gains were lost again (red circle, third chart). Due
to COVID, leverage of US independent producers has now doubled with plenty of debt coming due every
year from 2021 to 202516. The survivors are likely to have to rely on internally generated cash flow instead.
15 The 29 companies in our shale revolution universe: Anadarko, Antero, Apache, Cabot, Callon, Carrizo, Chesapeake, Cimarex, Concho, Continental, Denbury, Diamondback, EOG, EQT, Hess, Laredo, Marathon, Matador, Murphy, Noble, Oasis, PDC, Pioneer, QEP, Range, SM, Southwestern, Whiting and WPX. 16 “Global energy analyzer: Supercycle on the Horizon II”, C.Malek, JP Morgan European Equity Research, June 2020
-$100
-$80
-$60
-$40
-$20
$0
$20
$40
$60
$80
2010 2011 2012 2013 2014 2015 2016 2017 2018 2019
Th
ousands
Source: Bloomberg. 2019.
Shale revolution: a revolution in supply, not profitSelect cash flow measures for 29 shale companies, US$ billions
Operating cash flow
Capital expenditure
Free cash flow
30
100
170
240
310
380
2010 2011 2012 2013 2014 2015 2016 2017 2018 2019 2020
Source: Bloomberg. June 26, 2020. Shale revolution portfolio is market cap weighted and rebalances quarterly.
The shale collapse Cumulative total return index, January 2010=100
S&P 500
Shale revolution portfolio (29 companies)
0
10
20
30
40
50
60
70
80
90
-300%
-250%
-200%
-150%
-100%
-50%
0%
50%
100%
2008 2010 2012 2014 2016 2018 2020
Hundre
ds
Source: Bloomberg. June 26, 2020.
E&P sector relative performance and issuanceS&P 500 E&P energy sector - S&P 500 total return US$, billions
S&P E&P energy sector performance vs market
E&P energy sector equity and HY bond issuance
Energy sector starts to recover, but then rolls over due to COVID
0
5
10
15
20
25
30
35
Q12015
Q12016
Q12017
Q12018
Q12019
Q12020
Source: Haynes and Boone Oil Patch Bankruptcy Monitor. May 31, 2020.
North American oil and gas producer bankruptcy filingsNumber of bankruptcy filings

19
The shale boom has been characterized by rapid growth in production and by rapid decline rates of individual wells (the first chart shows illustrative decline rates of existing wells). As long as the shale
industry is growing, new well production replaces lost production of aging wells. But at a time of scarcer
capital, new wells might not be financed and constructed as fast. Even before COVID (dotted vertical
line in the charts below), the industry shake-out was seen in declining Permian Basin production growth,
in a falling oil and gas rig count, and in declining E&P capital spending expectations.
We expect some of the “base” decline from existing shale wells to be replaced by new wells; the harder question is by how much. Operating and development costs have declined, well productivity has improved and there are large sunk costs in Appalachia (i.e., lease agreement options) that may compel many producers to keep drilling irrespective of lifecycle economics. Furthermore, if the onshore shale boom fades, we might see a revival of US offshore oil & gas production in the Gulf of Mexico. US oil production is also very sensitive to price: $55-$65 oil prices could add 1-3 mm bpd to US production when compared with JP Morgan’s $40 base case WTI price forecast. Even so, the US may now be close to peak oil and natural gas production and peak energy independence given financial pressures on the shale industry, and environmental pressures discussed next.
0.0
0.5
1.0
1.5
2.0
30
40
50
60
70
80
90
'13 '14 '15 '16 '17 '18 '19 '20 '21 '22 '23 '24M
illio
ns
Source: IHS Markit, Antero Resources, JPMAM. 2019.
Oil and gas base decline curves from existing wellsBillion cubic feet per day Million barrels per day
Gas production, total
Oil production, West Texas Midland sub-basin
0%
10%
20%
30%
40%
50%
60%
0.0
0.2
0.4
0.6
0.8
1.0
1.2
2011 2012 2013 2014 2015 2016 2017 2018 2019 2020
Source: EIA. April 2020.
Permian Basin oil production and shareMillion barrels per day, y/y increase % share
Permian tight oil production y/yincrease
Permian share of US tight oil production
Jan 1, 2020
250
500
750
1,000
1,250
1,500
1,750
2,000
2,250
2012 2013 2014 2015 2016 2017 2018 2019 2020
Source: Baker Hughes, Bloomberg. May 29, 2020.
Number of US oil and gas rigs
Jan 1, 2020
-80%
-60%
-40%
-20%
0%
20%
40%
60%
2016 2017 2018 2019 2020
Hundre
ds
Source: Federal Reserve Bank of Dallas. Q1 2020.
E&P year ahead capital spending expectations Share of firms expecting increased capex - expecting decreased capex
Jan 1, 2020
20
Environmental pressures
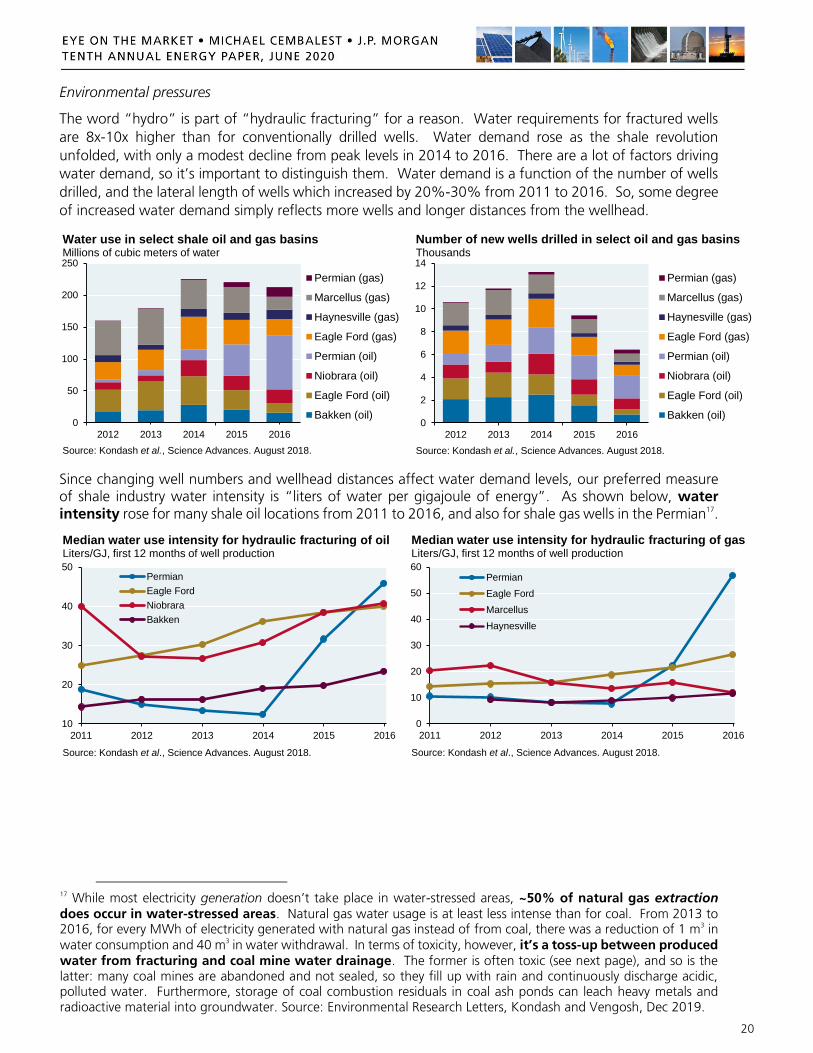
The word “hydro” is part of “hydraulic fracturing” for a reason. Water requirements for fractured wells
are 8x-10x higher than for conventionally drilled wells. Water demand rose as the shale revolution
unfolded, with only a modest decline from peak levels in 2014 to 2016. There are a lot of factors driving
water demand, so it’s important to distinguish them. Water demand is a function of the number of wells
drilled, and the lateral length of wells which increased by 20%-30% from 2011 to 2016. So, some degree
of increased water demand simply reflects more wells and longer distances from the wellhead.
Since changing well numbers and wellhead distances affect water demand levels, our preferred measure of shale industry water intensity is “liters of water per gigajoule of energy”. As shown below, water intensity rose for many shale oil locations from 2011 to 2016, and also for shale gas wells in the Permian17.
17 While most electricity generation doesn’t take place in water-stressed areas, ~50% of natural gas extraction does occur in water-stressed areas. Natural gas water usage is at least less intense than for coal. From 2013 to 2016, for every MWh of electricity generated with natural gas instead of from coal, there was a reduction of 1 m3 in water consumption and 40 m3 in water withdrawal. In terms of toxicity, however, it’s a toss-up between produced water from fracturing and coal mine water drainage. The former is often toxic (see next page), and so is the latter: many coal mines are abandoned and not sealed, so they fill up with rain and continuously discharge acidic, polluted water. Furthermore, storage of coal combustion residuals in coal ash ponds can leach heavy metals and radioactive material into groundwater. Source: Environmental Research Letters, Kondash and Vengosh, Dec 2019.
0
50
100
150
200
250
2012 2013 2014 2015 2016
Permian (gas)
Marcellus (gas)
Haynesville (gas)
Eagle Ford (gas)
Permian (oil)
Niobrara (oil)
Eagle Ford (oil)
Bakken (oil)
Source: Kondash et al., Science Advances. August 2018.
Water use in select shale oil and gas basinsMillions of cubic meters of water
0
2
4
6
8
10
12
14
2012 2013 2014 2015 2016
Permian (gas)
Marcellus (gas)
Haynesville (gas)
Eagle Ford (gas)
Permian (oil)
Niobrara (oil)
Eagle Ford (oil)
Bakken (oil)
Source: Kondash et al., Science Advances. August 2018.
Number of new wells drilled in select oil and gas basinsThousands
10
20
30
40
50
2011 2012 2013 2014 2015 2016
Permian
Eagle Ford
Niobrara
Bakken
Median water use intensity for hydraulic fracturing of oilLiters/GJ, first 12 months of well production
Source: Kondash et al., Science Advances. August 2018.
0
10
20
30
40
50
60
2011 2012 2013 2014 2015 2016
Permian
Eagle Ford
Marcellus
Haynesville
Source: Kondash et al., Science Advances. August 2018.
Median water use intensity for hydraulic fracturing of gasLiters/GJ, first 12 months of well production

21
Water demand is only half the story regarding environmental issues. After the fracturing process is over, operators are left with flowback and produced (FP) wastewater that has to be dealt with. “Flowback” refers to return of water originally injected into the well, while “produced” water refers to water that exists naturally in these formations and which surfaces along with high concentrations of dissolved inorganic and sometimes radioactive substances. The chart on the left shows FP water trends, while the chart on the right shows management practices used to dispose of it. Of the two wastewater types, produced water accounts for ~90% of total volume, which may limit possibilities for beneficial reuse.
The FP water challenge is complex; in some locations, volumes are higher but reinjection is easier/cheaper for geological reasons. In other locations, FP volumes are lower but reinjection is more complex and expensive. While overall FP volumes declined from 2014 to 2016, FP water per well more than doubled from 2012 to 2016. As with overall water demand shown earlier, the Permian is at the epicenter.
It is beyond the scope of this paper to review all the environmental consequences of the shale industry’s water demand and wastewater treatment needs. The Groundwater Protection Council produced a 300-page report in 2018 that goes through some specifics6F
18, and we also covered the EPA’s fracturing study (and objections from the EPA’s own Science Advisory Board) in 2017. The debates are intense; as water scarcity becomes more of an issue and as states deal with environmental impacts of fracturing, its cost and complexity may rise in the handful of states that account for 90% of shale oil and gas production. Wood Mackenzie estimated that water management costs could add $6 to the cost of producing a barrel of oil, possibly curbing future Permian oil supply by 400,000 barrels per day by 2025.19
18 GWPC 2019 “Produced Water Report: Regulations, Current Practices and Research Needs”
19 Wood Mackenzie press release, “Permian produced water: slowly extinguishing a roaring basin?” June 11, 2018.
0
40
80
120
160
2012 2013 2014 2015 2016
Permian (gas)
Marcellus (gas)
Haynesville (gas)
Eagle Ford (gas)
Permian (oil)
Niobrara (oil)
Eagle Ford (oil)
Bakken (oil)
Source: Kondash et al., Science Advances. August 2018.
Flowback/Produced water in shale oil and gas basinsMillions of cubic meters of FP water produced over first 12 months
Injection for enhanced oil recovery
Injection for disposal
Surface discharge5%
Evaporation3%
Offsite commercial disposal 7%
Non oil and gas reuse 1%
Produced water management practices
Source: Groundwater Protection Council, "Produced Water Report: Regulations, Current Practices and Research Needs'", June 2019.
45%
39%

22
Possible consequences for US oil & gas from a Biden presidency and a Democratic sweep20
Federal government could block new oil & gas leases on Federal lands
A halt to new offshore and onshore leases on Federal land in Permian and Bakken basins would be likely, while it’s less likely that existing Federal leases would be rescinded. Oil production on Federal lands is ~25% of total production, and offshore Gulf production is ~10% of total production.
Climate-related financial regulation could further restrict the industry’s access to capital
Publicly-traded energy companies are likely to be required to disclose climate risks, and banks may be required to incorporate climate risks in stress test capital ratios. It is less likely that financial institutions would be subject to energy related portfolio limits, or be forced to divest
Executive Branch could deny fossil fuel infrastructure projects and/or LNG export permits
Biden pledges to evaluate Federal infrastructure projects based on climate pollution potential and GHG impact. Biden originally did not sign the “No Keystone XL” pledge, but now promises to revoke the permit. Other possible outcomes: expand scope of Clean Water Act
Biden may use the threat of fossil fuel export bans to extract concessions from the oil & gas industry, but so far has resisted calls to declare a climate emergency
Congress could subject hydraulic fracturing to stricter review and regulation
A 2005 bill exempted hydraulic fracturing from being subject to Federal standards set by the 1974 Safe Drinking Water Act (the “Halliburton loophole”). If the exemption were repealed, fracturing would require EPA approval, giving the Administration greater discretion to delay or block permits
20 The likelihood of passage of some provisions mentioned on this page are based on research by Rapidan, a Maryland-based energy and political consulting firm.
0
2
4
6
8
10
12
2000 2003 2006 2009 2012 2015 2018
Source: EIA. 2019.
US oil production by typeMillion barrels per day
Tight oil
Gulf of MexicoAlaska
Conventional onshore0
5
10
15
20
25
30
35
2000 2003 2006 2009 2012 2015 2018
Source: EIA. 2019.
US dry natural gas production by typeTrillion cubic feet per year
Shale gas
Conventional onshore
Conventional offshoreOther
Tight gas

23
What might US energy dependence look like if financial and environmental pressures constrain the US shale industry before substantial de-carbonization of transport and industry takes place? From a US geopolitical, military and economic perspective, it’s not a pretty picture. The first chart shows US oil imports by country in 2005, the year of peak US oil imports. The second two charts show proven reserves by country for oil and natural gas. In essence, these are the countries the US would need to rely on for its imported oil & gas needs. If US energy independence is lost, regaining it through renewable energy could take, at the minimum, the rest of my lifetime21.
21 In the IEA’s “Sustainable Development Scenario”, the US gets much closer to energy independence by 2030 through large declines in fossil fuel usage. However, its core assumptions include the following. You can decide whether you consider this scenario in the realm of the possible:
US primary energy use declines to 1992 levels despite a 40% population increase from 1992 to 2030
solar generation grows by a factor of 5.5x, wind generation grows by a factor of 3x
nuclear generation is unchanged (no decommissioning)
coal use for power/heat declines by 90% (industrial sector switches to solar thermal and geothermal energy)
electric vehicles sales reach 47% from today’s 2% levels
oil use declines by 24% due to electric vehicles, and ICE gasoline/diesel mileage per gallon improves by 40%
truck CO2 emissions per tonne of freight declines by 33%
energy intensity of buildings declines by 30%
Canada16%
Mexico12%
Other OECD9%
Saudi Arabia11%
Venezuela11%
Nigeria9%
Persian Gulf, Russia, China17%
Other Non-OECD15%
Peak US oil imports, 2005
Canada, Mexico, Europe, Australia
13%
Central and South America
22%
Russia/CIS8%
Middle East51%
Africa and Asia6%
Proven oil reserves, 2018
Canada, Mexico, Europe, Australia
5%
Central and South America
4%
Russia/CIS34%
Middle East45%
Africa and Asia12%
Proven natural gas reserves, 2018
Source: BP Statistical Review of World Energy, EIA, J.P. Morgan Asset Management, 2019.

24
Section 2 Appendix: no free lunch (the environmental impact of renewable energy) While environmental consequences of oil and gas on climate and groundwater systems have been widely studied, scientists are only just beginning to assess environmental impacts of a world highly reliant on renewable energy instead:
A renewable energy future will require massive amounts of cobalt, copper, lithium, graphite, cadmium and rare earth elements for solar panels, batteries, electric vehicle motors, wind turbines and fuel cells. One study cited increases in materials demand of 87000% for EV batteries, 1000% for wind power, and 3000% for solar cells and photovoltaics by the middle of the century
Even with modest production of these minerals to-date, their extractive and smelting industries have left a legacy in many parts of the world of “environmental degradation, adverse impacts to public health and biodiversity damage” (B. Sovacool)
The renewable waste issues of the future:
IRENA estimates that toxic solar panel waste (which contains lead, cadmium and chromium) could rise from 250 thousand tonnes in 2016 to 78 million tonnes by 2050
By 2030, 11 million tonnes of spent lithium-ion batteries are projected to be discarded, with few systems in place to recycle them
Fiberglass wind turbine blades are built to withstand hurricane force winds and cannot easily be crushed, recycled or repurposed, at least not so far; retired ones mostly end up in landfills, or in Europe, burned. The US might face 720,000 tons of wind turbine blade disposal over the next 20 years
I have not seen anyone suggest that environmental consequences of a renewable energy future would be anywhere near as corrosive on the environment as one based on fossil fuels. Even so, a renewable energy world may be much less “green” than currently perceived. Sources:
“Sustainable minerals and metals for a low-carbon future”, B. Sovacool, Science Magazine, January 2020
IRENA Solar Photovoltaic Panel End-of-Life Management report, 2016
World Economic Forum Global Battery Alliance
“Global metal flows in the renewable energy transition: Exploring the effects of substitutes, technological mix and development”, Manberger and Stenqvist, Energy Policy, August 2018

25
[3] Mountains vs Molehills, 2020: de-carbonizing steel production and deep geothermal energy
Last year, we added a section called “Mountains vs Molehills” to assess the real-world de-carbonization potential of new ideas frequently mentioned in the media and on green energy blogs7F. This year we have another installment: de-carbonization of steel production, and ultra-deep geothermal energy.
Topic #1: De-carbonizing steel production, Bill Gates and concentrated solar power
The idea for this topic started with an article on a Bill Gates-funded solar power startup and how it could “fix” a huge carbon emissions problem8F
22. The article described a concentrated solar power (CSP) plant which reached 1,000°C through the use of reflectors calibrated via artificial intelligence, and how this energy could be used to “create steel, cement and petrochemicals” (instead of using fossil fuels). Ok then. Let’s break this down for steel, the largest industrial source of global CO2 emissions.
Steel is created two ways: producing it from cast iron made from iron ore and coke (“primary” production), or by melting down scrap steel in an electric arc furnace (“secondary” production). The global split is 70% primary and 30% secondary. While US steel production is more skewed to electric arc furnaces (around 70% of US output in 2018), the US only represents 5% of global steel production
For secondary production, steel has a melting point of 1,370°C – 1,540°C, so 1,000°C is still a few hundred degrees away from what’s needed. Even so, let’s assume that the new CSP plants reach higher temperatures (as some reflector operations have); in that case, secondary steel production could be de-carbonized via electricity produced solely via solar/other renewable energy
However, given the long lives of structures made from steel, rising demand for steel in Asia and Africa where there is little scrap to recycle, and the fact that most scrap steel is already recycled (see chart, right), primary steel production is likely to remain the dominant method of creating steel and also remain a carbon-intensive activity for the foreseeable future
22 “A Bill Gates-backed startup wants to fix a huge carbon emissions problem”, CNET, November 19, 2019
Global solid steel production
Source: IEA, "Tracking Industry". May 2019.
Primary steel production
Secondary steel production
72%
28%
Ind
us
tria
l E
qu
ipm
en
t
Ve
hic
les
Str
uc
tura
l S
tee
l
Ap
pli
an
ce
s
Cla
dd
ing
Oth
er
Infr
as
tru
ctu
re
Pa
ck
ag
ing
Rein
forc
ed
Ste
el
40%
60%
80%
100%
Steel recycling rate by product
Source: ArcelorMittal Global R&D, Worldsteel. 2016.
Overall industry

26
Why is primary steel production so carbon-intensive? As per the table below, the two most carbon-intensive primary steel production processes are:
The conversion of coking coal into coke at temperatures of 1,000°C in coke ovens. Most emissions in this stage result from carbonization of coal at high temperatures (specifically, from combustion of coke oven gas that is about 50% methane, carbon monoxide and ethylene). The conversion process eliminates volatile compounds in coal and produces a purer form of more porous carbon
The iron-making process, during which iron ore (oxides), coke and limestone are fed into a blast furnace. Hot air is blown into the furnace, at which point the coke burns, stripping the oxygen from iron oxide to produce carbon monoxide, carbon dioxide and molten “pig” iron. A small amount of limestone is used as a “flux” to absorb impurities
Some CO2 produced in these stages can be recycled into ammonia and methanol production, but the amounts are small relative to overall emissions. Energy intensity of iron and steel production and its reliance on coal hasn’t changed much in recent years. While some countries like Sweden produce steel more efficiently at 16 GJ of energy per tonne, they are offset by less efficient producers like China (~20 GJ/t).
As a result, de-carbonization of primary steel production requires new approaches that produce iron from its ores without using any coke or natural gas. There are ideas afoot: ArcelorMittal announced a demonstration plant to produce steel by using hydrogen instead of coal. The hydrogen would enable “direct reduction” of iron ore (in essence, hydrogen would be used as the reducing agent for iron oxide instead of carbon). The concept is interesting, but…
The plant’s initial output of 100,000 tonnes is 0.01% of 2018 global steel production (1.8 bn tonnes)
ArcelorMittal first plans to use hydrogen obtained via fossil fuel steam methane reformation (see page 13) to allow for “economical operation”. It will only run on “green” hydrogen produced from renewable electricity sources when it is “available in sufficient quantities”
Bloomberg New Energy Finance often makes exponential growth forecasts for de-carbonization technologies of all kinds, and hydrogen-produced steel is no exception: last fall, BNEF estimated that half of global steel output could be produced via green hydrogen by 2050! We ran this forecast by a Swedish steel industry expert who described it as highly implausible. Blast furnace steel plants have useful lives of 50+ years, and it’s rare for them to be replaced beforehand. Construction of hydrogen reduction plants from scratch will take decades, even if the exact design is ready to go…which it isn't. Sweden has shovels in the ground for a demonstration plant to get the iron ore reduction chemistry right (since every iron ore can behave differently), and is targeting 2045 for full operation
CO2 emissions, integrated steel-making
Kg of CO 2 emissions per tonne of steel produced
Coal and coking 990
Iron ore sintering 15
Blast furnaces (iron-making) 610
Basic oxygen furnace (steel-making) 85
Total 1700
Source: "Assessment on the energy flow and carbon emissions of integrated
steelmaking plants", Energy Reports, He et al, January 2017
0
10
20
30
40
0
6
12
18
24
2000 2003 2006 2009 2012 2015
Iron/steel production: energy usage and intensityGigajoules/tonne Energy usage, exajoules
Source: IEA, "Tracking Industry". May 2019. Other categories include oil, imported heat and bioenergy.
Energy intensity
Coal
GasElectricity
Other

27
Mountain vs Molehill Topic #2: Ultra-deep geothermal energy
Geothermal energy has been used in hot baths since antiquity, for space heating in Boise, Idaho since 1892, for virtually all houses in Reykjavik since the 1930s, and for electricity generation since 1904 in Larderello, Italy. Before getting into “ultra-deep” geothermal power, let’s walk through the footprint of existing geothermal energy today.
Geothermal energy has a small presence. Its output in 2018 was only 0.1% of global primary energy consumption, split roughly 50/50 between electricity production and heat (many sources don’t even break geothermal out as a separate category, and combine it with things like wave power)9F
23. Around half a GW of new capacity came online in 2018, bringing the global total to 13.3 GW. Most additions occurred in Turkey and Indonesia, with the rest scattered about the US, Africa and Asia. There are two ways of generating electricity by using geothermal energy: binary cycle and dry-steam. In a binary cycle plant, geothermal fluid vaporizes another fluid with a lower boiling point than water that then spins a turbine, while in conventional dry-steam/flash plants, geothermal steam is used directly to power the turbine.
As shown below, the world’s largest geothermal plants have well depths of ~2 kilometers, and access reservoirs with average temperatures of 250-300°C.
23 REN21 Renewables 2019 Global Status Report
US
Ind
on
esia
Ph
ilip
pin
es
Tu
rkey
New
Zeala
nd
Mexic
o
Italy
Icela
nd
Ken
ya
Jap
an
0
500
1,000
1,500
2,000
2,500
3,000
3,500
4,000
Source: BP Statistical Review of World Energy. 2019.
Installed geothermal capacity by countryMW
Th
e G
eysers
(U
S)
Cerr
o P
rieto
(M
ex)
Lard
ere
llo
(It
a)
Olk
ari
a (
Ken
)
Ma
kb
an
(P
hl)
Sala
k (
Ind
o)
CalE
nerg
y (
US
)
Saru
lla (
Ind
o)
Hellis
heid
i (I
ce)
Dara
jat
(In
do
)
Kam
oja
ng
(In
do
)
Tiw
i (P
hl)
Wayan
g W
ind
u (
Ind
o)
Palin
pin
on
(P
hl)
Te M
ihi (N
Z)
0
200
400
600
800
1,000
1,200
1,400
1,600
Source: Proceedings from World Geothermal Conference, OpenEI, individual company releases. 2020.
Largest geothermal power plants by capacityMW
Th
e G
eysers
(U
S)
Palin
pin
on
(P
hl)
Cerr
o P
rieto
(M
ex)
Olk
ari
a (
Ken
)
Makb
an
(P
hl)
Hellis
heid
i (I
ce)
Lard
ere
llo
(It
a)
Dara
jat
(In
do
)
Saru
lla (
Ind
o)
Tiw
i (P
hl)
Wayan
g W
ind
u (
Ind
o)
CalE
nerg
y (
US
)
Te M
ihi (N
Z)
Sala
k (
Ind
o)
Kam
oja
ng
(In
do
)
0.0
0.5
1.0
1.5
2.0
2.5
3.0
Source: Proceedings from World Geothermal Conference, OpenEI, individual company releases. 2020.
Well depths for largest geothermal power plantsMidpoint/average well depth, km
Makb
an
(P
hl)
Olk
ari
a (
Ken
)
Lard
ere
llo
(It
a)
Tiw
i (P
hl)
Cerr
o P
rieto
(M
ex)
CalE
nerg
y (
US
)
Saru
lla (
Ind
o)
Sala
k (
Ind
o)
Palin
pin
on
(P
hl)
He
llis
he
idi
(Ice)
Wayan
g W
ind
u (
Ind
o)
Te
Mih
i (N
Z)
Dara
jat
(In
do
)
Kam
oja
ng
(In
do
)
Th
e G
eysers
(U
S)
0
50
100
150
200
250
300
350
Source: Proceedings from World Geothermal Conference, OpenEI, individual company releases. 2020.
Average temperatures of geothermal reservoirs C

28
With that backdrop, let’s discuss “ultra deep” geothermal energy. At 5-7 kilometers below the surface of the earth, there are geothermal reservoirs measured at 400°-500° C and at 200+ bars of atmospheric pressure. In these locations, water exists as “supercritical fluid”. Such fluids in theory could deliver 5x-10x more power than traditional geothermal plants and rival the power derived from nuclear power plants. If so, the increased power could offset some of the increased drilling costs required to access such depths, if they were achieved. The concept has led to press articles such as “Supercharged Geothermal Energy Could Power the Planet”, which asserted that “heat contained in the upper three kilometers of the earth’s crust would be enough to meet the world’s energy demand thousands of times over”24. Yes, but….let’s take a closer look.
The most well-known deep geothermal projects in the world are Iceland Deep Drilling Projects 1 and 225. They are still in the exploratory field-test phase since development of valves, coatings, casings and sensors that can withstand the intense temperatures and pressures involved, and the corrosive materials surfaced during the process, are still ongoing.
The first well, IDDP-1, had to be completed in 2009 before reaching supercritical fluid depths since molten magma flowed into the well at 2,100 meters. However, above the magma intrusion, superheated steam at 452°C and at 40-140 bars of pressure was measured during a 2-year flow test, capable of generating 35 MW of power (8x-10x higher than a conventional geothermal well). At the time, IDDP-1 was the hottest producing geothermal well in the world. Eventually, its master valves failed and the superheated steam flow had to be quenched with cold water. The flow was quenched, but the thermal shock caused the well casings to buckle beyond repair, and IDDP-1 was abandoned
In 2017, the IDDP-2 project team drilled to depths of 4,500 m, reaching a different field that is recharged by seawater and which contained supercritical conditions of 600°C and 350 bars of pressure. This project represented the first of its kind in terms of drilling into geothermal reservoir rocks at these extreme temperatures. Flow tests have begun and will be carried out over the next few years, even through IDDP-2 has already sustained casing damage which could restrict certain development options at deeper levels
The ultimate goal of the IDDP project: generate power from supercritical geothermal resources which would be used not just in Iceland but in Scotland as well. The IceLink plan entails a 1,200 km high-voltage underwater DC cable to Scotland to interconnect Iceland’s electric grid to those of the UK and beyond. Laying such a cable in deep Atlantic waters would be another unprecedented achievement: today’s longest underwater HVDC cable is 580 km in shallow waters between Norway and the Netherlands
In other words, deep geothermal power is in the very early stages of development. We’re intrigued about the concept of deep geothermal as baseload power, but are realistic about the physical materials and geological challenges ahead (including risks of seismic activity). We met with a company that’s trying to solve some drilling challenges via an “electric pulse plasma-based drill” designed to reach temperatures of 6,000° C. As the plasma drill descends, it would be followed by a continual casing that would conduct water on the way down, and supercritical steam on the way back up. The intense heat from the drill bit would presumably vaporize everything in its path, and the company developing it believes that drilling costs would remain linear with depth (in contrast to traditional deep drilling techniques whose costs rise geometrically with depth). However, its efforts are in their infancy, and their estimates of plasma drilling costs have to be taken with a giant grain of salt until proven in more than just early field studies.
24 New Scientist.com (a weekly science and technology publication), October 17, 2018 25 “The IDDP Success Story”, Proceedings of the World Geothermal Congress, Gudmundur Friedleifsson et al, 2020

29
[4] Oil & gas equity market underperformance: stranded asset risks or supply shock?
Even before COVID, the US oil & gas sector traded at the largest valuation discount vs the market in
decades, and its performance has been trounced by investments in renewable and other clean energy stock
benchmarks. Both developments are illustrated in the first two charts. The big picture question: did oil & gas stocks underperform primarily due to expectations of widespread carbon taxes and billions of barrels/BTUs of stranded oil and gas reserves that the world will have little use for anymore?
Mark Carney from the Bank of England believes this, and estimated that global markets could decline by
$20 trillion once energy transitions risks are fully recognized by investors26. And in mid-June of this year,
British Petroleum wrote off $18 billion in assets, citing both lower near-term oil demand due to the
coronavirus, and a reduction in BP’s medium-term expectations for oil prices from $70 to $55 per barrel.
In its announcement of one of the largest industry writedowns in many years, BP also cited the tendency
for governments to direct COVID stimulus packages toward more climate-friendly initiatives and away from
anything related to fossil fuels.
26 “Firms ignoring climate crisis will go bankrupt, says Mark Carney”, The Guardian. October 13, 2019.
0.0
0.3
0.6
0.9
1.2
1.5
1.8
2.1
2.4
2.7
1928 1939 1950 1961 1972 1983 1994 2005 2016
Source: Empirical Research Partners. May 2020. Equal-weighted portfolio.
Energy sector valuations at all-time lows vs the market Energy stocks price to book divided by market price to book
1928-2020average
Wil
derh
ill C
lean
En
erg
y
FT
SE
EO
Alt
En
erg
y
MA
C G
lob
al S
ola
r E
nerg
y
Nasd
aq
Cle
an
Ed
ge
S&
P G
lob
al C
lean
En
erg
y
S&
P S
mall
Cap
En
erg
y
S&
P M
id C
ap
En
erg
y
S&
P L
arg
e C
ap
En
erg
y
S&
P S
mall
Cap
S&
P M
id C
ap
S&
P 5
00
-30%
-25%
-20%
-15%
-10%
-5%
0%
5%
10%
15%
20%
Source: Bloomberg. Date range: Jan 1, 2013 to Jun 26, 2020.
Renewable and traditional energy stocks vs the broad market, 2013-2020, Annualized total return
75
80
85
90
95
100
105
110
Jan 18 Jul 18 Jan 19 Jul 19 Jan 20 Jul 20 Jan 21 Jul 21
World liquid fuels consumption Million barrels per day
Source: EIA Short-term Energy Outlook. June 2020.

30
Researchers from UCLA and Simon Fraser University have come to similar conclusions on stranded asset risks, at least as it relates to oil & gas stock prices and the impact of additional reserves. In a
“stranded asset” world, the more reserves a company finds, the worse off its stock price would be for having
invested to obtain them. Using a sample of 679 North American oil firms from 1999 to 2018, they found that
reserve growth had a negative effect on firm value, and that this negative effect was stronger for producers with
higher extraction costs27. When they looked at the details, they found that negative effects were mostly due to growth in undeveloped reserves. Other papers found similar results28: the highest quintile of
undeveloped reserves led to the weakest stock price performance, an effect which was particularly pronounced
over the last 5 years. Finally, companies that spent less on reserve accumulation outperformed, usually since
they used free cash flow to buy back stock.
27 “Stranded Fossil Fuel Reserves and Firm Value”, Simon Fraser University and UCLA. November 2019. 28 Empirical Research Partners, “Energy Bear Market Blues” (December 2019) and “Energy: Buy the 93-year Low” (January 2020).
-12%
-10%
-8%
-6%
-4%
-2%
0%
2%
4%
6%
Highestquintile
Second Third Fourth Lowestquintile
Hu
nd
red
s
Average annual energy producer stock price returns vs the overall industry, by value of undeveloped oil reserves
Source: Empirical Research Partners. 2019.
Highest level of undeveloped reserves corresponded to the worst stock price performance
-30%
-20%
-10%
0%
10%
20%
30%
'00 '01 '02 '03 '04 '05 '06 '07 '08 '09 '10 '11 '12 '13 '14 '15 '16 '17 '18 '19
Hu
nd
red
s
Stock price returns for energy producers with highest value of undeveloped oil reserves vs overall industry
Source: Empirical Research Partners. 2019.

31
Even so, the US supply glut may be just as good an explanation for the dreadful performance of US oil & gas stocks. The US shale revolution began in 2005, after which US oil and gas production almost
doubled in 13 years. When measured in energy terms, it was the second largest positive oil and gas supply shock in modern history, surpassed only by the USSR production boom from 1969 to 1982.
And as shown in the second chart, only a small portion of US supply growth was exported; most of it was
consumed in the US, resulting in a sharp decline in imports.
In the earlier section on US energy independence, we illustrated how shale producers and capital providers didn’t focus on profitability, and how the shale industry generated year after year of negative cash flow. The sector had only just begun to regain profitability when the COVID pandemic hit. It’s hard to find a similar episode of consistently negative free cash flow in the history of US corporate finance: an entire decade of a sector foregoing profitability to focus on revenue growth. It happened with casinos and airlines, but not this pervasively across all companies, and not for this long.
4000
4500
5000
5500
6000
6500
700
800
900
1000
1100
1200
1300
1400
1990 1993 1996 1999 2002 2005 2008 2011 2014 2017
US and global oil and natural gas productionMillion tonnes of oil equivalent
Source: BP Statistical Review of World Energy. 2019.
Global ex-US
US
0
10
20
30
40
50
60
70
2001 2003 2006 2009 2011 2014 2017 2020
Most of the shale boom reduced imports, rather than being exported, Quadrillion BTUs
US crude oil & natural gas production
US crude oil & natural gas exports
Source: EIA. 2019.
Most of the shale boom reduced imports, rather than being exported, Quadrillion BTUs
US crude oil & natural gas production
US crude oil & natural gas exports
-$18
-$12
-$6
$0
$6
2013 2014 2015 2016 2017 2018 2019 2020
Source: Bloomberg. Q1 2020.
Energy sector free cash flowUS$ billions
S&P 1500 Oil and Gas E&P Index
Shale revolution portfolio(29 companies)
Industry GroupYears of consecutive
negative free cash flow
S&P 1500 Oil and Gas E&P 13 (2006 - 2018)
Shale industry (29 stocks) 12 (2008 - 2019)
S&P 1500 Airlines 9 (1999 - 2007)
S&P 1500 Automobile manufacturers 4 (2005 - 2008)
S&P 1500 Casinos & Gaming 3 (1996 - 1998)
Source: Bloomberg, Factset. JPMAM. 2019.

32
Which argument is the right one? It may come down to what happens to oil demand. Projections of peak oil demand incorporate population growth, changes in energy intensity, changes in the energy mix and penetration of electric vehicles. In BP’s “evolving transition” estimates4, global oil consumption persists at current levels until 2040. This scenario assumes that oil consumption rises due to increased prosperity in emerging countries, and is offset by policy changes that improve energy efficiency and boost EV penetration to 15% globally29. If this view turns out to be right, 2020 would be too soon for the “stranded asset” theory to be the primary driver of oil & gas stock prices; poor industry cash flow and the supply glut would be equally sensible explanations for oil & gas underperformance.
What could substantiate the stranded asset theory? The IEA models a “Sustainable Development” Scenario (see footnote 19 on page 23 for details) which entails a large decline in primary energy use, and substantial increases in renewable energy growth, electric vehicle penetration and energy efficiency. This
scenario is designed to limit global warming to 1.8° C relative to the pre-industrial era; energy-related CO2 emissions are assumed to peak immediately and fall to zero by 2070. If the world jumps onto this trajectory, stranded oil & gas asset risks would be substantial. As shown in the bottom table, large portions of current oil, gas and coal proven reserves30 would be stranded in this scenario. In contrast, under the “Stated Policies” Scenario31, cumulative oil and gas extraction by 2070 is estimated to be greater than current proven reserves, so no oil & gas assets would be stranded at all. Only coal reserves still end up being stranded in this case, an outcome which markets are pricing in already.
29 There are well-known investors who apparently agree with this thesis: Berkshire Hathaway is investing $10 billion in Occidental Petroleum to facilitate its acquisition of Anadarko. 30 While proven reserves are generally estimated by incorporating the commercial viability of extracting them, JP Morgan European Equity Research applied higher return thresholds and distinctions on carbon density, and estimated that proven reserves could be roughly half of the BP estimates shown above. 31 The IEA Stated Policies case is not a standstill scenario, and includes current policy intentions and targets that have already been announced.
0
20
40
60
80
100
120
140
1970 1980 1990 2000 2010 2020 2030 2040
Historical
Greater emerging country energy demand
Evolving transition (base case)
Rapid transition
Source: BP Energy Outlook. 2019.
Global oil use, with BP projections to 2040Million barrels/day
Comparing stranded asset risks in IEA scenarios
Proven
reserves, 2018
Cumul. extraction,
2019-2070
Stranded
in 2070
Percent
stranded
Oil 235,931 265,353 0 0%
Nat gas 169,334 228,266 0 0%
Coal 596,540 197,890 398,650 67%
Proven
reserves, 2018
Cumul. extraction,
2019-2070
Stranded
in 2070
Percent
stranded
Oil 235,931 137,478 98,454 42%
Nat gas 169,334 125,259 44,075 26%
Coal 596,540 77,560 518,980 87%
Source: BP, IEA, JPM. Units show n are million tons of oil equivalent. 2019.
Sustainable Development Scenario: large amounts of stranded oil, gas & coal
Stated Policies Scenario: only coal assets stranded

33
[5] Maiming the Swamp: Trump and the Environment
White boxes implemented as of January 2020, shaded boxes pending
Sources: Harvard Law School Environmental Regulation Rollback Tracker, Columbia Law School Climate Deregulation
Tracker, Brookings Institution, Federal Register, Environmental Protection Agency, Interior Department, US Chamber
of Commerce, NY Times, J.P. Morgan Asset Management. January 2020.
Elimination of methane reporting requirements
for oil & gas companies
Rescinded water pollution regulations for
fracking on Federal lands
Rejection of proposed ban on pesticides
linked to developmental problems in children
Partial removal of methane flaring limits on
public lands
Scrapped rule requiring mining companies to
prove ability to finance clean-up costs
Reversed rule requiring braking system
upgrades to trains hauling flammable liquids
Transfer of emissions regulatory control from
Federal Gov't to State Agencies
Reduced importance of GHG emissions in
FERC pipeline environmental reviews
Ended OSHA program designed to reduce
risks of lung disease from silicosis
Revoked right of California to set its own
vehicle emissions limits
Lifted ban on oil and gas drilling in Arctic
National Wildlife Refuge
Relaxation of rules aimed to improve safety at
hazardous chemical plants
Loosening of rules regarding toxic emissions
from industrial polluters
Loosened offshore drilling regulations
including reduced testing requirement for
blowout prevention
Scaled back pollution protections for
tributaries and wetlands
Loosened rules regarding oil refinery
monitoring of benzene and other pollutantsLift freeze on coal leases on public lands
Revoked rule preventing mining companies
from dumping debris into local streams
No more enforcement of rules on
hydroflourocarbon emissions from air
conditioners and refrigerators
Streamlined approval process for oil & gas
drilling in national forests
Withdrew proposed rule to reduce pollution
from sewage treatment plants
Directed agencies to no longer report social
cost of carbon
Open marine protected areas in Atlantic and
Pacific Oceans to commercial fishing
Exempt certain power plants from rules
limiting toxic discharge into local waterways
Revoked prior Executive Order to reduce
Federal Gov't GHG emissions
Revoked flood standards for Federal
infrastructure projects
Extend lifespan of unlined coal ash basins
leaking contaminants into groundwater
Relaxation of rules requiring repair of oil & gas
methane leaks
Revoked directive that Federal agencies
minimize impact on water and wildlife when
approving development projects
Double time allowed for removal of lead pipes
from high lead water systems
Weaker fuel economy standards for cars and
light trucks
Elimination of climate and conservation
policies at Dep't of Interior
Scrapped rules requiring a doubling of energy
efficient light bulbs
Eiminate requirement for new coal plants to
capture GHG emissionsWeakening of Endangered Species Act
Announced plan to stop funding UN program
helping lower income countries to reduce
GHG emissions
Weaker rules regarding coal plant mercury
emissions
Relaxation of fishing season length and catch
rate rules
Limit EPA studies that rely on confidential
patient data that cannot be made public
Limits on community challenges to EPA-
issued pollution permits
Relaxation of salmon protections to free up
water for farmers
Relax standards requiring more energy
efficient residential furnaces and commercial
water heaters

34
Appendix Table: key electricity and primary energy statistics by country/region
Source: JPMAM, US Energy Information Agency “International Energy Outlook”, 2019.
1. Consumed energy is equal to primary energy consumption net of thermal conversion losses in power plants, power plant energy consumption and transmission losses
2. Includes renewable share of electricity generation, plus renewable energy directly used by industrial, transportation and building sectors
Electricity
Region
Primary energy
used for electricity
(quad. BTUs)
Electricity
consumed1
(quad. BTUs)
Electricity share of
primary energy
Electricity share of
consumed energy
Renewable share of
primary energy used
for electricity
World 248.4 80.3 13% 18% 31%
US 37.7 12.9 13% 17% 18%
OECD 99.0 33.5 13% 18% 33%
OECD Europe 34.5 11.5 14% 19% 47%
Japan 8.5 3.2 16% 21% 24%
Canada 6.5 1.8 12% 16% 75%
Non OECD 149.4 46.9 12% 17% 30%
China 72.7 23.2 15% 23% 31%
India 15.4 4.4 12% 18% 22%
Brazil 6.1 1.9 11% 15% 88%
Mid East 9.2 3.3 9% 11% 9%
Russia 11.3 3.1 10% 13% 18%
Primary and delivered energy
Region
Total primary
energy
(quad. BTUs)
Total consumed
energy1
(quad. BTUs)
Consumed energy:
industrial sector
(quad. BTUs)
Consumed energy:
transport sector
(quad. BTUs)
Renewable share of
consumed energy2
World 627.0 453.5 238.7 122.4 11%
US 99.9 75.1 26.4 28.2 7%
OECD 249.8 183.8 75.2 60.1 10%
OECD Europe 83.7 59.4 22.6 18.9 14%
Japan 19.9 15.2 7.7 3.3 9%
Canada 15.9 11.4 6.2 2.8 16%
Non OECD 377.2 269.7 163.4 62.4 11%
China 152.7 101.5 70.6 15.5 10%
India 36.2 25.0 16.3 4.9 14%
Brazil 16.6 12.5 6.7 4.3 36%
Mid East 38.2 31.1 17.7 7.9 1%
Russia 31.6 23.3 13.3 4.8 3%
Fossil fuels
RegionFossil fuel share of
elec. generation
Fossil fuel share
of primary energy
% of fossil fuels
used for electricity
World 57% 80% 29%
US 60% 82% 27%
OECD 47% 76% 24%
OECD Europe 29% 68% 18%
Japan 70% 84% 36%
Canada 11% 61% 7%
Non OECD 65% 82% 31%
China 65% 81% 38%
India 75% 82% 39%
Brazil 9% 50% 7%
Mid East 90% 97% 22%
Russia 62% 86% 26%

35
IMPORTANT INFORMATION The views, opinions and estimates expressed herein constitute Michael Cembalest’s judgment based on current market conditions and are subject to change without notice. Information herein may differ from those expressed by other areas of J.P. Morgan. This information in no way constitutes J.P. Morgan Research and should not be treated as such. The views contained herein are not to be taken as advice or a recommendation to buy or sell any investment in any jurisdiction, nor is it a commitment from J.P. Morgan or any of its subsidiaries to participate in any of the transactions mentioned herein. Any forecasts, figures, opinions or investment techniques and strategies set out are for information purposes only, based on certain assumptions and current market conditions and are subject to change without prior notice. All information presented herein is considered to be accurate at the time of production. This material does not contain sufficient information to support an investment decision and it should not be relied upon by you in evaluating the merits of investing in any securities or products. In addition, users should make an independent assessment of the legal, regulatory, tax, credit and accounting implications and determine, together with their own professional advisers, if any investment mentioned herein is believed to be suitable to their personal goals. Investors should ensure that they obtain all available relevant information before making any investment. It should be noted that investment involves risks, the value of investments and the income from them may fluctuate in accordance with market conditions and taxation agreements and investors may not get back the full amount invested. Both past performance and yields are not reliable indicators of current and future results. Non-affiliated entities mentioned are for informational purposes only and should not be construed as an endorsement or sponsorship of J.P. Morgan Chase & Co. or its affiliates.
For J.P. Morgan Asset Management Clients: J.P. Morgan Asset Management is the brand for the asset management business of JPMorgan Chase & Co. and its affiliates worldwide. To the extent permitted by applicable law, we may record telephone calls and monitor electronic communications to comply with our legal and regulatory obligations and internal policies. Personal data will be collected, stored and processed by J.P. Morgan Asset Management in accordance with our privacy policies at https://am.jpmorgan.com/global/privacy. ACCESSIBILITY For U.S. only: If you are a person with a disability and need additional support in viewing the material, please call us at 1-800-343-1113 for assistance. This communication is issued by the following entities: In the United States, by J.P. Morgan Investment Management Inc. or J.P. Morgan Alternative Asset Management, Inc., both regulated by the Securities and Exchange Commission; in Latin America, for intended recipients’ use only, by local J.P. Morgan entities, as the case may be.; in Canada, for institutional clients’ use only, by JPMorgan Asset Management (Canada) Inc., which is a registered Portfolio Manager and Exempt Market Dealer in all Canadian provinces and territories except the Yukon and is also registered as an Investment Fund Manager in British Columbia, Ontario, Quebec and Newfoundland and Labrador. In the United Kingdom, by JPMorgan Asset Management (UK) Limited, which is authorized and regulated by the Financial Conduct Authority; in other European jurisdictions, by JPMorgan Asset Management (Europe) S.à r.l. In Asia Pacific (“APAC”), by the following issuing entities and in the respective jurisdictions
in which they are primarily regulated: JPMorgan Asset Management (Asia Pacific) Limited, or JPMorgan Funds (Asia) Limited, or JPMorgan Asset Management Real Assets (Asia) Limited, each of which is regulated by the Securities and Futures Commission of Hong Kong; JPMorgan Asset Management (Singapore) Limited (Co. Reg. No. 197601586K), which this advertisement or publication has not been reviewed by the Monetary Authority of Singapore; JPMorgan Asset Management (Taiwan) Limited; JPMorgan Asset Management (Japan) Limited, which is a member of the Investment Trusts Association, Japan, the Japan Investment Advisers Association, Type II Financial Instruments Firms Association and the Japan Securities Dealers Association and is regulated by the Financial Services Agency (registration number “Kanto Local Finance Bureau (Financial Instruments Firm) No. 330”); in Australia, to wholesale clients only as defined in section 761A and 761G of the Corporations Act 2001 (Commonwealth), by JPMorgan Asset Management (Australia) Limited (ABN 55143832080) (AFSL 376919). For all other markets in APAC, to intended recipients only.
For J.P. Morgan Private Bank Clients: ACCESSIBILITY J.P. Morgan is committed to making our products and services accessible to meet the financial services needs of all our clients. Please direct any accessibility issues to the Private Bank Client Service Center at 1-866-265-1727. LEGAL ENTITY, BRAND & REGULATORY INFORMATION In the United States, bank deposit accounts and related services, such as checking, savings and bank lending, are offered by JPMorgan Chase Bank, N.A. Member FDIC. JPMorgan Chase Bank, N.A. and its affiliates (collectively “JPMCB”) offer investment products, which may include bank-managed investment accounts and custody, as part of its trust and fiduciary services. Other investment products and services, such as brokerage and advisory accounts, are offered through J.P. Morgan Securities LLC (“JPMS”), a member of FINRA and SIPC. Annuities are made available through Chase Insurance Agency, Inc. (CIA), a licensed insurance agency, doing business as Chase Insurance Agency Services, Inc. in Florida. JPMCB, JPMS and CIA are affiliated companies under the common control of JPMorgan Chase & Co. Products not available in all states. In Luxembourg, this material is issued by J.P. Morgan Bank Luxembourg S.A. (JPMBL), with registered office at European Bank and Business Centre, 6 route de Treves, L-2633, Senningerberg, Luxembourg. R.C.S Luxembourg B10.958. Authorised and regulated by Commission de Surveillance du Secteur Financier (CSSF) and jointly supervised by the European Central Bank (ECB) and the CSSF. J.P. Morgan Bank Luxembourg S.A. is authorized as a credit institution in accordance with the Law of 5th April 1993. In the United Kingdom, this material is issued by J.P. Morgan Bank Luxembourg S.A– London Branch. Prior to Brexit,(Brexit meaning that the UK leaves the European Union under Article 50 of the Treaty on European Union, or, if later, loses its ability to passport financial services between the UK and the remainder of the EEA), J.P. Morgan Bank Luxembourg S.A– London Branch is subject to limited regulation by the Financial Conduct Authority and the Prudential Regulation Authority. Details about the extent of our regulation by the Financial Conduct Authority and the Prudential Regulation Authority are available from us on request. In the event of Brexit, in the UK, J.P. Morgan Bank Luxembourg S.A.– London Branch is authorised by the Prudential Regulation Authority, subject to regulation by the Financial Conduct Authority and limited regulation by the Prudential Regulation Authority. Details about the extent of our regulation by the Prudential Regulation Authority are available from us on request. In Spain, this material is distributed by J.P. Morgan Bank Luxembourg S.A., Sucursal en España, with registered office at Paseo de la Castellana, 31, 28046 Madrid, Spain. J.P. Morgan Bank Luxembourg S.A., Sucursal en España is registered under number 1516 within the administrative registry of the Bank of Spain and supervised by the Spanish Securities Market Commission (CNMV). In Germany, this material is distributed by J.P. Morgan Bank Luxembourg S.A., Frankfurt Branch, registered office at Taunustor 1 (TaunusTurm), 60310 Frankfurt, Germany, jointly supervised by the Commission de Surveillance du Secteur Financier (CSSF) and the European Central Bank (ECB), and in certain areas also supervised by the Bundesanstalt für Finanzdienstleistungsaufsicht (BaFin). In Italy, this material is distributed by J.P. Morgan Bank Luxembourg S.A– Milan Branch, registered office at Via Catena Adalberto 4, Milan 20121, Italy and regulated by Bank of Italy and the Commissione Nazionale per le Società e la Borsa

36
(CONSOB). In the Netherlands, this material is distributed by J.P. Morgan Bank Luxembourg S.A., Amsterdam Branch, with registered office at World Trade Centre, Tower B, Strawinskylaan 1135, 1077 XX, Amsterdam, The Netherlands. J.P. Morgan Bank Luxembourg S.A., Amsterdam Branch is authorised and regulated by the Commission de Surveillance du Secteur Financier (CSSF) and jointly supervised by the European Central Bank (ECB) and the CSSF in Luxembourg; J.P. Morgan Bank Luxembourg S.A., Amsterdam Branch is also authorised and supervised by De Nederlandsche Bank (DNB) and the Autoriteit Financiële Markten (AFM) in the Netherlands. Registered with the Kamer van Koophandel as a branch of J.P. Morgan Bank Luxembourg S.A. under registration number 71651845. In Denmark, this material is distributed by J.P. Morgan Bank Luxembourg, Copenhagen Br, filial af J.P. Morgan Bank Luxembourg S.A. with registered office at Kalvebod Brygge 39-41, 1560 København V, Denmark. J.P. Morgan Bank Luxembourg, Copenhagen Br, filial af J.P. Morgan Bank Luxembourg S.A.is authorised and regulated by Commission de Surveillance du Secteur Financier (CSSF) and jointly supervised by the European Central Bank (ECB) and the CSSF. J.P. Morgan Bank Luxembourg, Copenhagen Br, filial af J.P. Morgan Bank Luxembourg S.A. is also subject to the supervision of Finanstilsynet (Danish FSA) and registered with Finanstilsynet as a branch of J.P. Morgan Bank Luxembourg S.A. under code 29009. In Sweden, this material is distributed by J.P. Morgan Bank Luxembourg S.A. - Stockholm Bankfilial, with registered office at Hamngatan 15, Stockholm, 11147, Sweden. J.P. Morgan Bank Luxembourg S.A. - Stockholm Bankfilial is authorised and regulated by Commission de Surveillance du Secteur Financier (CSSF) and jointly supervised by the European Central Bank (ECB) and the CSSF. J.P. Morgan Bank Luxembourg S.A., Stockholm Branch is also subject to the supervision of Finansinspektionen (Swedish FSA). Registered with Finansinspektionen as a branch of J.P. Morgan Bank Luxembourg S.A.. In France, this material is distributed by JPMorgan Chase Bank, N.A. (“JPMCB”), Paris branch, which is regulated by the French banking authorities Autorité de Contrôle Prudentiel et de Résolution and Autorité des Marchés Financiers. In Switzerland, this material is distributed by J.P. Morgan (Suisse) SA, which is regulated in Switzerland by the Swiss Financial Market Supervisory Authority (FINMA). In Hong Kong, this material is distributed by JPMCB, Hong Kong branch. JPMCB, Hong Kong branch is regulated by the Hong Kong Monetary Authority and the Securities and Futures Commission of Hong Kong. In Hong Kong, we will cease to use your personal data for our marketing purposes without charge if you so request. In Singapore, this material is distributed by JPMCB, Singapore branch. JPMCB, Singapore branch is regulated by the Monetary Authority of Singapore. Dealing and advisory services and discretionary investment management services are provided to you by JPMCB, Hong Kong/Singapore branch (as notified to you). Banking and custody services are provided to you by JPMCB Singapore Branch. The contents of this document have not been reviewed by any regulatory authority in Hong Kong, Singapore or any other jurisdictions. This advertisement has not been reviewed by the Monetary Authority of Singapore. JPMorgan Chase Bank, N.A., a national banking association chartered under the laws of the United States, and as a body corporate, its shareholder’s liability is limited. JPMorgan Chase Bank, N.A. (JPMCBNA) (ABN 43 074 112 011/AFS Licence No: 238367) is regulated by the Australian Securities and Investment Commission and the Australian Prudential Regulation Authority. Material provided by JPMCBNA in Australia is to “wholesale clients” only. For the purposes of this paragraph the term “wholesale client” has the meaning given in section 761G of the Corporations Act 2001 (Cth). Please inform us if you are not a Wholesale Client now or if you cease to be a Wholesale Client at any time in the future. JPMS is a registered foreign company (overseas) (ARBN 109293610) incorporated in Delaware, U.S.A. Under Australian financial services licensing requirements, carrying on a financial services business in Australia requires a financial service provider, such as J.P. Morgan Securities LLC (JPMS), to hold an Australian Financial Services Licence (AFSL), unless an exemption applies. JPMS is exempt from the requirement to hold an AFSL under the Corporations Act 2001 (Cth) (Act) in respect of financial services it provides to you, and is regulated by the SEC, FINRA and CFTC under US laws, which differ from Australian laws. Material provided by JPMS in Australia is to “wholesale clients” only. The information provided in this material is not intended to be, and must not be, distributed or passed on, directly or indirectly, to any other class of persons in Australia. For the purposes of this paragraph the term “wholesale client” has the meaning given in section 761G of the Act. Please inform us immediately if you are not a Wholesale Client now or if you cease to be a Wholesale Client at any time in the future. This material has not been prepared specifically for Australian investors. It: may contain references to dollar amounts which are not Australian dollars; may contain financial information which is not prepared in accordance with Australian law or practices; may not address risks associated with investment in foreign currency denominated investments; and does not address Australian tax issues. With respect to countries in Latin America, the distribution of this material may be restricted in certain jurisdictions. We may offer and/or sell to you securities or other financial instruments which may not be registered under, and are not the subject of a public offering under, the securities or other financial regulatory laws of your home country. Such securities or instruments are offered and/or sold to you on a private basis only. Any communication by us to you regarding such securities or instruments, including without limitation the delivery of a prospectus, term sheet or other offering document, is not intended by us as an offer to sell or a solicitation of an offer to buy any securities or instruments in any jurisdiction in which such an offer or a solicitation is unlawful. Furthermore, such securities or instruments may be subject to certain regulatory and/or contractual restrictions on subsequent transfer by you, and you are solely responsible for ascertaining and complying with such restrictions. To the extent this content makes reference to a fund, the Fund may not be publicly offered in any Latin American country, without previous registration of such fund´s securities in compliance with the laws of the corresponding jurisdiction. Public offering of any security, including the shares of the Fund, without previous registration at Brazilian Securities and Exchange Commission–CVM is completely prohibited. Some products or services contained in the materials might not be currently provided by the Brazilian and Mexican platforms. References to “J.P. Morgan” are to JPM, its subsidiaries and affiliates worldwide. “J.P. Morgan Private Bank” is the brand name for the private banking business conducted by JPM. This material is intended for your personal use and should not be circulated to or used by any other person, or duplicated for non-personal use, without our permission. If you have any questions or no longer wish to receive these communications, please contact your J.P. Morgan representative. © 2020 JPMorgan Chase & Co. All rights reserved.