tennessee’s outcomes-based funding formula
TRANSCRIPT

1 Tennessee Higher Education Commission
Tennessee’s Outcomes-Based Funding
Formula
APPENDIX C
2 Tennessee Higher Education Commission
Presentation Overview
• Tennessee overview
• What is the significance of the outcomes-based
approach in higher education finance policy?
• Where did the outcomes-based model idea
originate?
• How was this accomplished? What was the
process?

3 Tennessee Higher Education Commission
Presentation Overview
• How does the model work?
• How was it implemented?
• What are its strengths and weaknesses?
• Is it working as intended?

Tennessee Overview

5 Tennessee Higher Education Commission
Shared Governance
6 Public
Universities
13 Community
Colleges
Tennessee Board
of Regents
University of
Tennessee System
3 Public
Universities
Tennessee State
Government
Tennessee Higher
Education Commission
Governing
Boards
Coordinating
Board
Formula
Units
Technology
Centers
Medical/
Agricultural
Medical/
Agricultural
Non-
Formula
Units
6 Tennessee Higher Education Commission
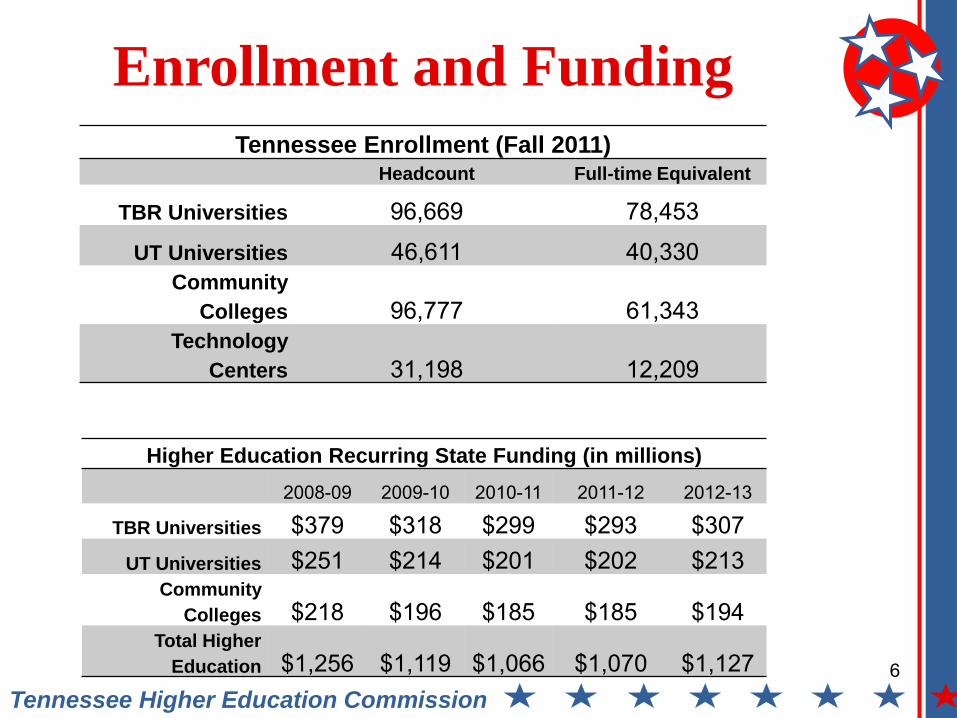
Enrollment and Funding
Higher Education Recurring State Funding (in millions)
2008-09 2009-10 2010-11 2011-12 2012-13
TBR Universities $379 $318 $299 $293 $307 UT Universities $251 $214 $201 $202 $213
Community
Colleges $218 $196 $185 $185 $194 Total Higher
Education $1,256 $1,119 $1,066 $1,070 $1,127
Tennessee Enrollment (Fall 2011) Headcount Full-time Equivalent
TBR Universities 96,669 78,453
UT Universities 46,611 40,330 Community
Colleges 96,777 61,343 Technology
Centers 31,198 12,209
7 Tennessee Higher Education Commission
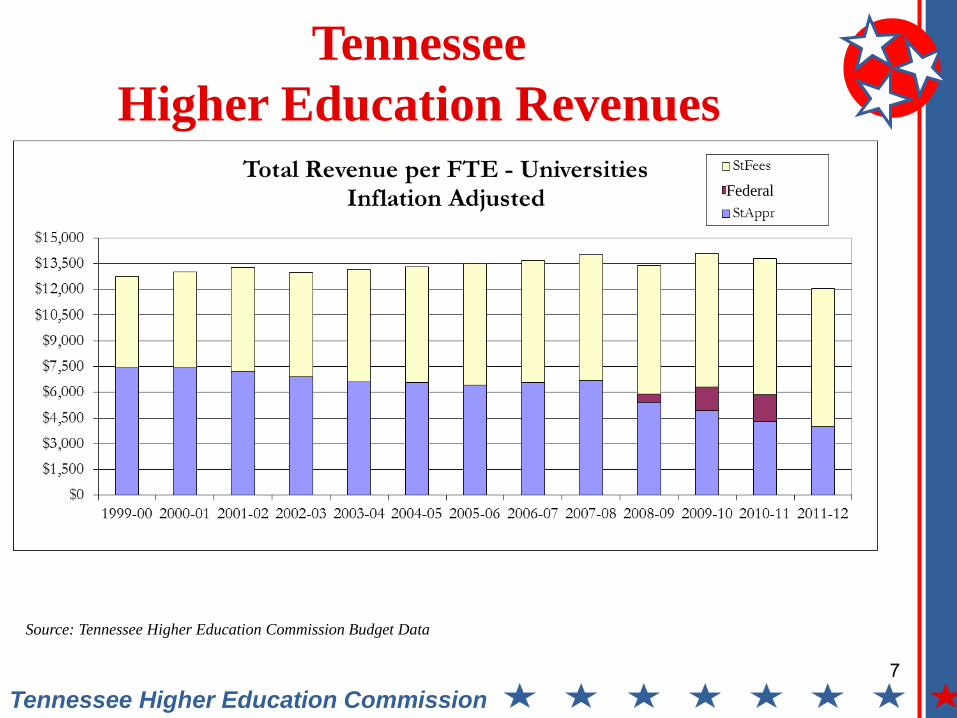
Tennessee
Higher Education Revenues
Source: Tennessee Higher Education Commission Budget Data
Federal
8 Tennessee Higher Education Commission
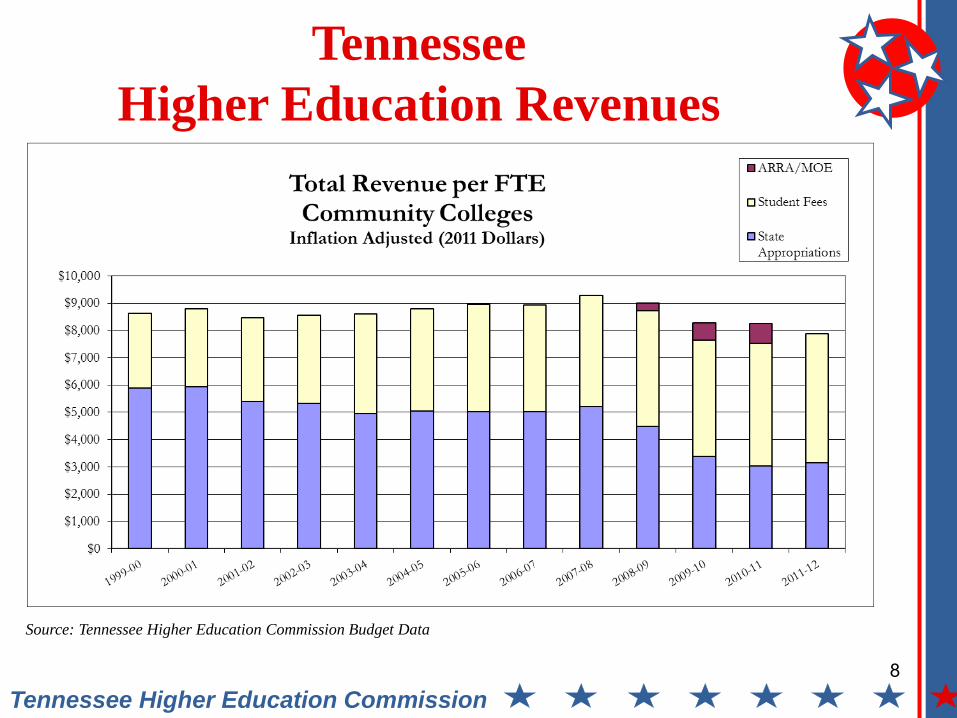
Tennessee
Higher Education Revenues
Source: Tennessee Higher Education Commission Budget Data
9 Tennessee Higher Education Commission
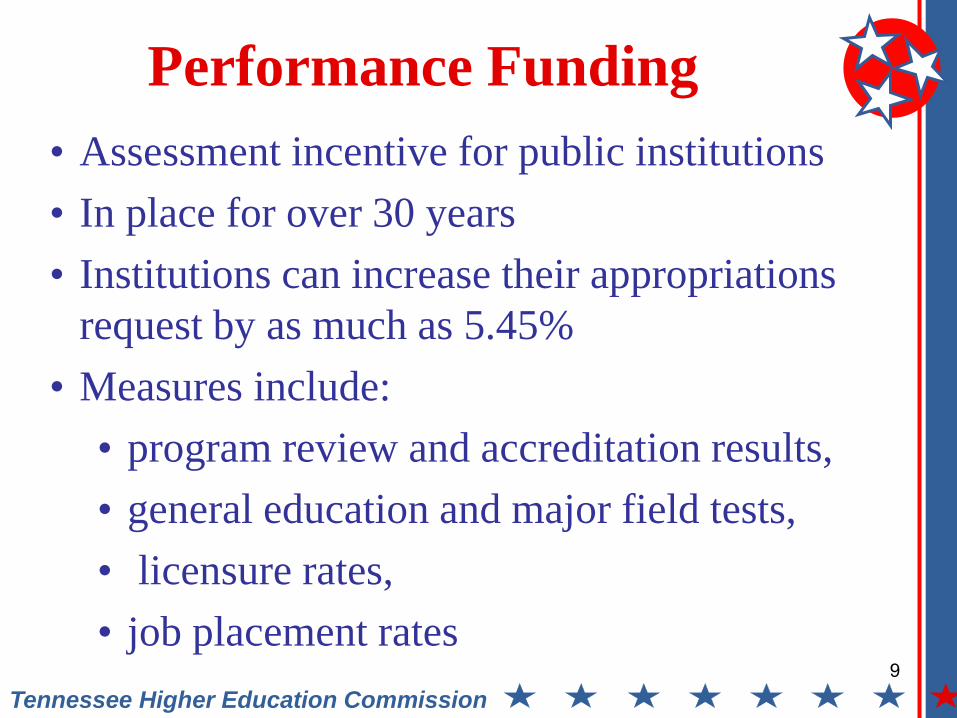
Performance Funding
• Assessment incentive for public institutions
• In place for over 30 years
• Institutions can increase their appropriations
request by as much as 5.45%
• Measures include:
• program review and accreditation results,
• general education and major field tests,
• licensure rates,
• job placement rates

10 Tennessee Higher Education Commission
What is the significance of the
outcomes-based approach in
higher education finance policy?
11 Tennessee Higher Education Commission
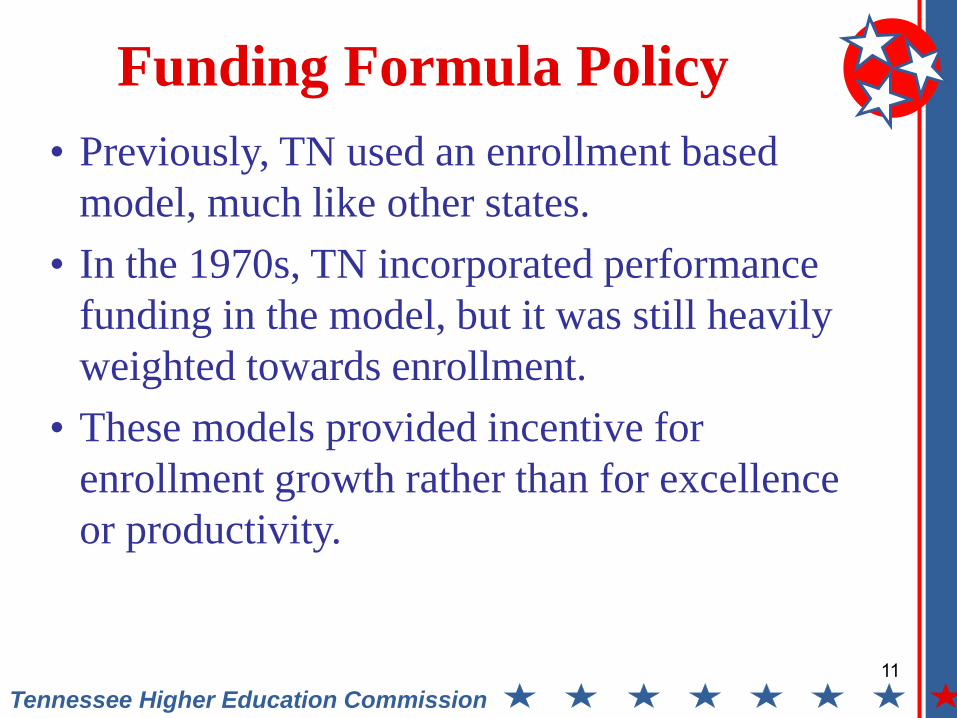
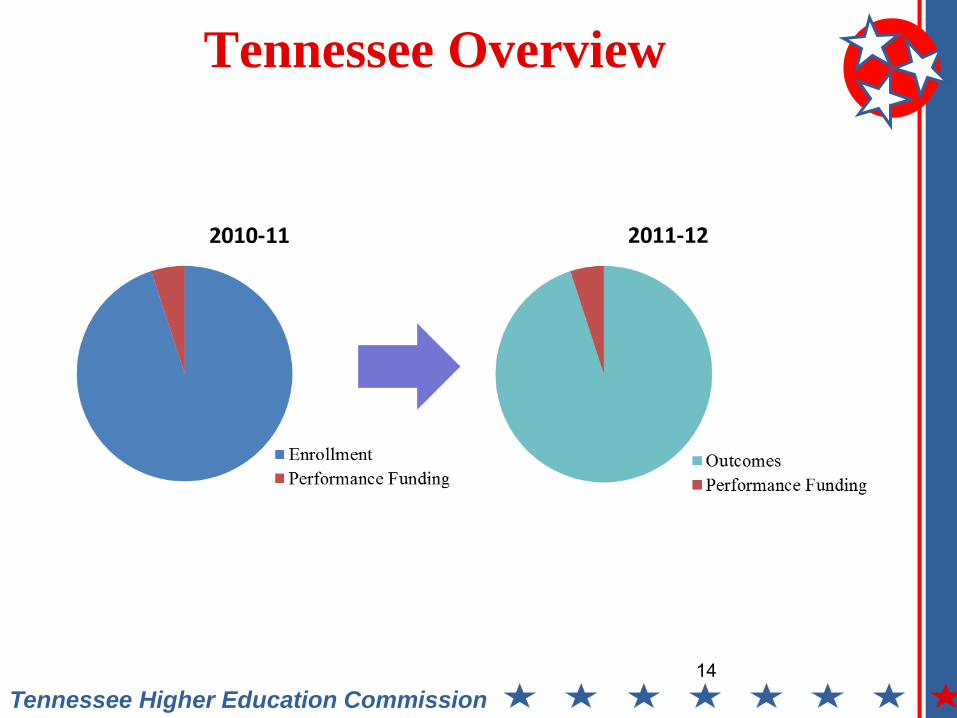
Funding Formula Policy
• Previously, TN used an enrollment based
model, much like other states.
• In the 1970s, TN incorporated performance
funding in the model, but it was still heavily
weighted towards enrollment.
• These models provided incentive for
enrollment growth rather than for excellence
or productivity.
12 Tennessee Higher Education Commission
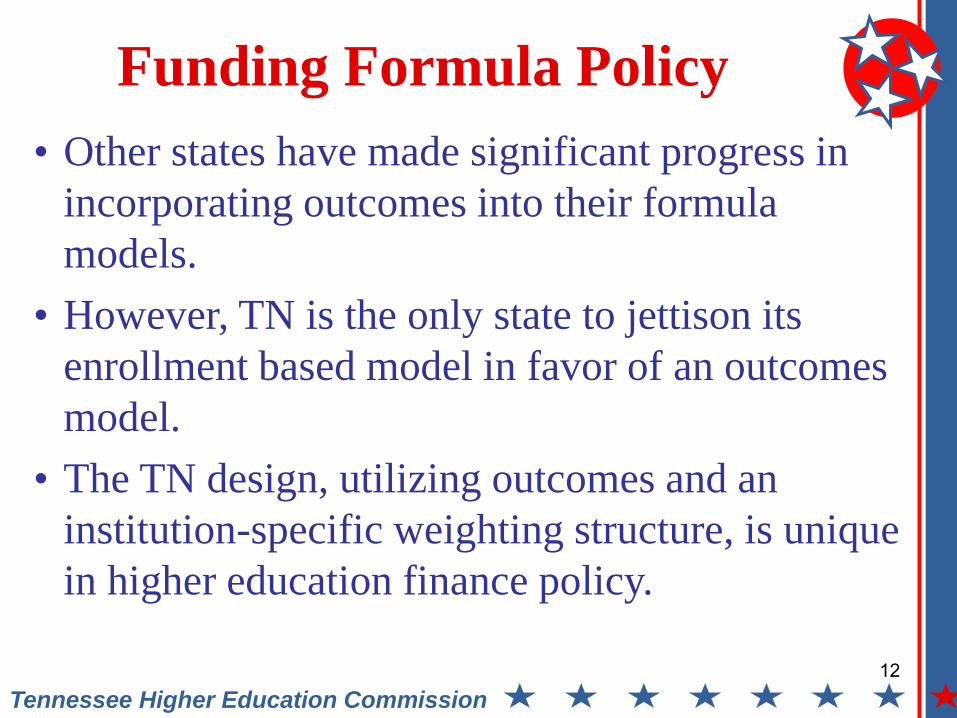
• Other states have made significant progress in
incorporating outcomes into their formula
models.
• However, TN is the only state to jettison its
enrollment based model in favor of an outcomes
model.
• The TN design, utilizing outcomes and an
institution-specific weighting structure, is unique
in higher education finance policy.
Funding Formula Policy
13 Tennessee Higher Education Commission
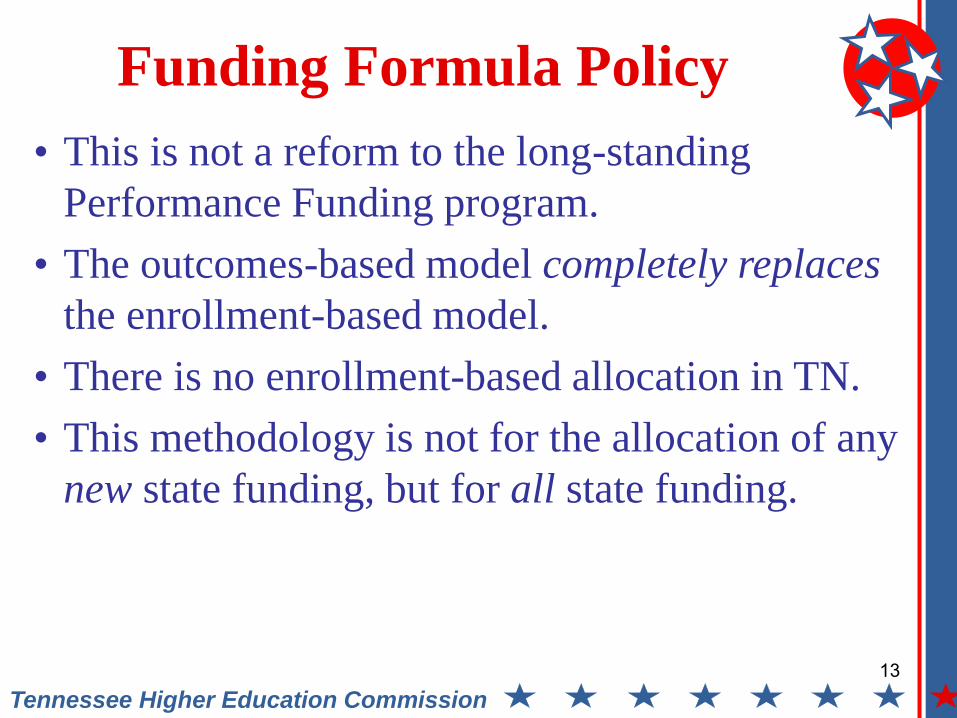
• This is not a reform to the long-standing
Performance Funding program.
• The outcomes-based model completely replaces
the enrollment-based model.
• There is no enrollment-based allocation in TN.
• This methodology is not for the allocation of any
new state funding, but for all state funding.
Funding Formula Policy
14 Tennessee Higher Education Commission
Tennessee Overview
15 Tennessee Higher Education Commission
Where did the outcomes-based
model idea originate?
16 Tennessee Higher Education Commission
Tennessee Finance Policy Reform
• For several years, THEC staff had been
contemplating funding formula redesigns that
would incorporate two key aspects: inclusion of
productivity metrics and recognition of
institutional mission.
• In late 2009 THEC proposed to then Governor
Phil Bredesen a new incentive structure – an
outcomes-based model that would replace the
enrollment based model.

17 Tennessee Higher Education Commission
Tennessee Finance Policy Reform
• Gov. Bredesen included THEC’s idea of an
outcomes-based model in a proposal for higher
education reforms that he made to the
Legislature.
• The Tennessee legislature debated these reforms,
which included other policy issues, in January
2010.
18 Tennessee Higher Education Commission
Tennessee Finance Policy Reform
• In January 2010, Tennessee passed the
“Complete College Tennessee Act.”
• The legislation called for reforms in several
areas:
– student transfer
– research collaboration
– funding formula policy
19 Tennessee Higher Education Commission
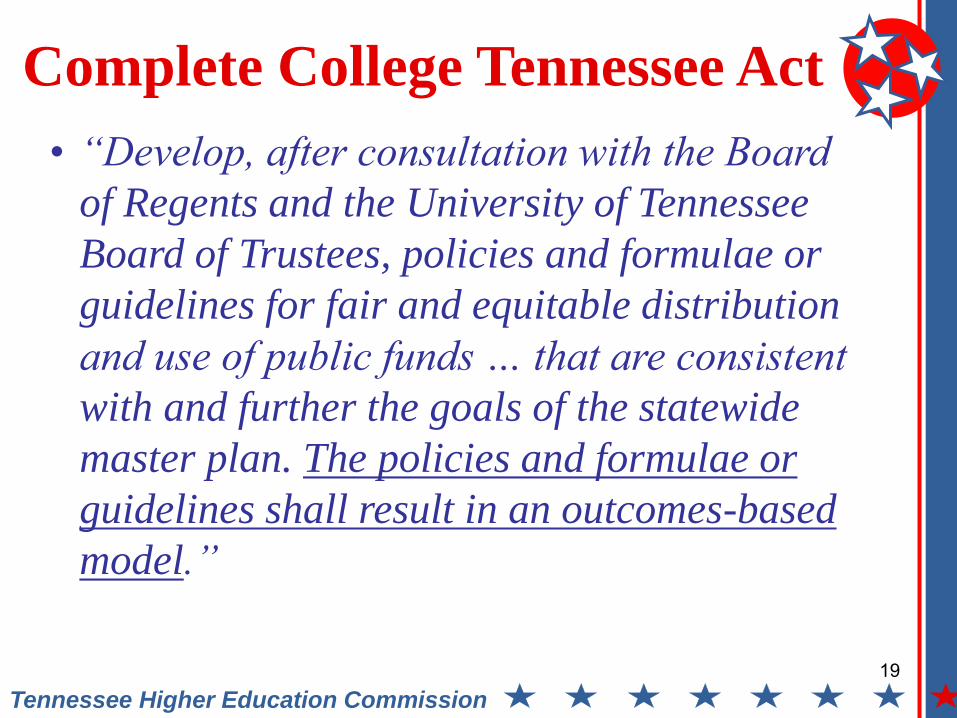
Complete College Tennessee Act
• “Develop, after consultation with the Board
of Regents and the University of Tennessee
Board of Trustees, policies and formulae or
guidelines for fair and equitable distribution
and use of public funds … that are consistent
with and further the goals of the statewide
master plan. The policies and formulae or
guidelines shall result in an outcomes-based
model.”

20 Tennessee Higher Education Commission
How was this accomplished?
What was the process?

21 Tennessee Higher Education Commission
Developing a New Formula Model
• THEC convened a Formula Review Committee
to discuss and debate the new formula design.
• The Committee included representatives from
higher education and state government.
• Meetings each month in spring and summer
2010.
• Throughout the process, THEC consulted
outside experts.
22 Tennessee Higher Education Commission
Formula Review Committee (FRC)
• Broad membership
• Multiple formal FRC meetings
• Explicit institutional feedback and input
• Regional town halls
• Staff background briefings with UT, TBR,
Constitutional officers and legislative members
• External consultant input
23 Tennessee Higher Education Commission
Tennessee Finance Policy Reform
• Institutions played a key role in the process.
• Selected campus presidents, CFOs and provosts
were members of the Formula Review
Committee.
• Presidents/chancellors were queried for their
suggestions on what outcomes to include and the
priority of the outcome.

24 Tennessee Higher Education Commission
Developing a New Formula Model
• Each committee meeting dealt with a different issue
of formula design.
• The committee included people with vastly
different views on higher education.
• Broad consensus on the philosophy and principles
of new outcomes-based formula model.
• Most government and higher education officials
agreed that funding on outcomes was better than
enrollment.
25 Tennessee Higher Education Commission
Developing a New Formula Model
• Institutional mission is a critical component of the
CCTA and the outcomes-based formula.
• Some institutions do not focus on research and
doctoral degrees, while others do.
• Some institutions focus on student access and are
less selective in admissions.
• A major feature of the outcomes model design
solved this issue for the committee.
26 Tennessee Higher Education Commission
Developing a New Formula Model
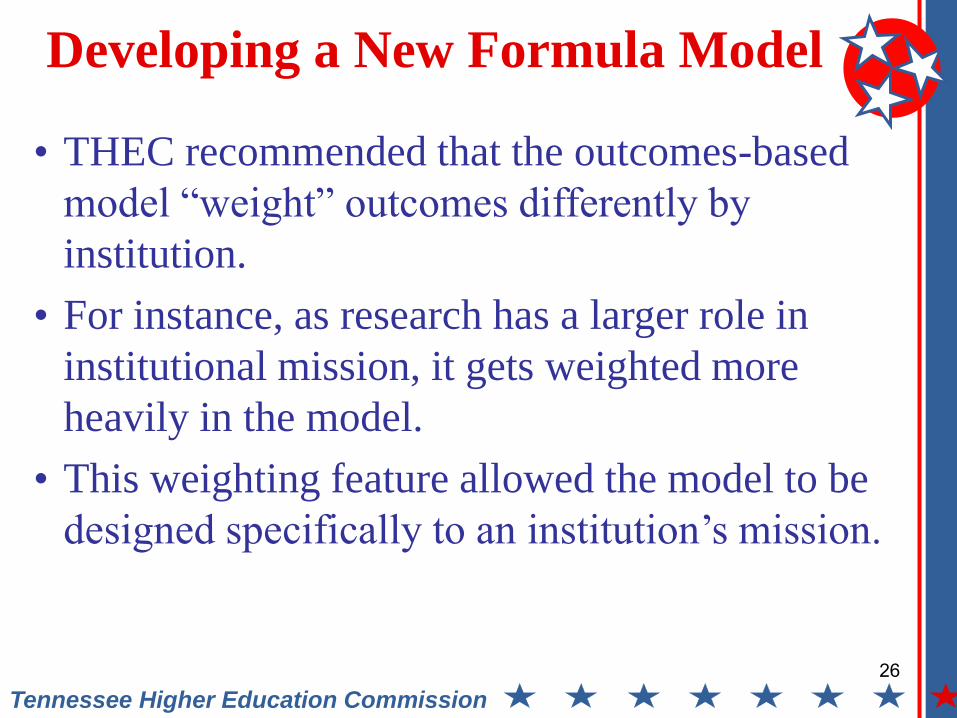
• THEC recommended that the outcomes-based
model “weight” outcomes differently by
institution.
• For instance, as research has a larger role in
institutional mission, it gets weighted more
heavily in the model.
• This weighting feature allowed the model to be
designed specifically to an institution’s mission.
27 Tennessee Higher Education Commission
Developing a New Formula Model
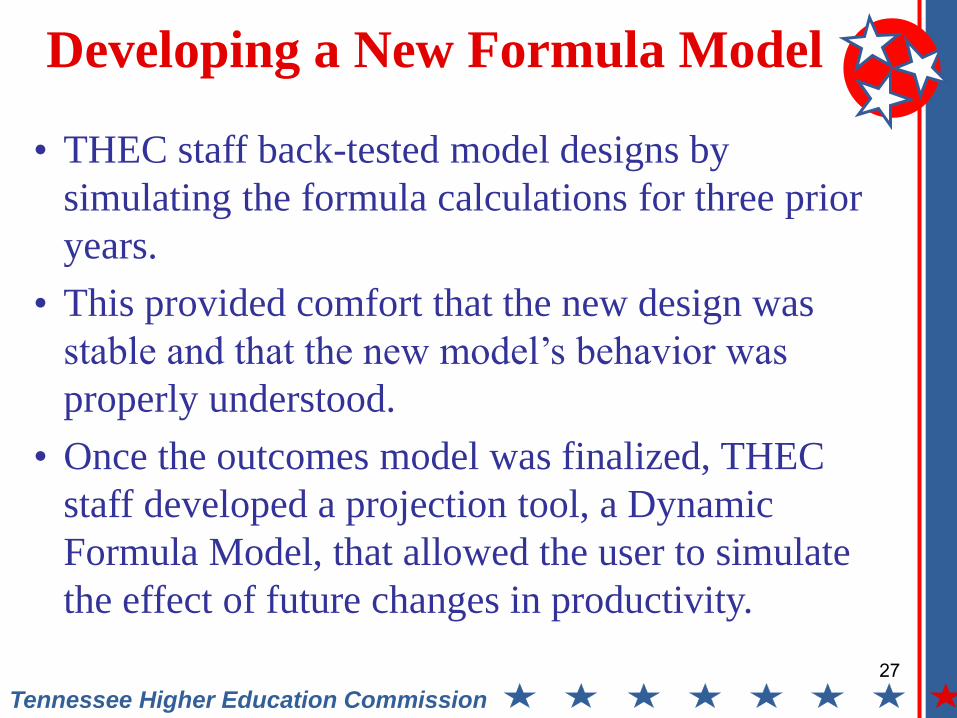
• THEC staff back-tested model designs by
simulating the formula calculations for three prior
years.
• This provided comfort that the new design was
stable and that the new model’s behavior was
properly understood.
• Once the outcomes model was finalized, THEC
staff developed a projection tool, a Dynamic
Formula Model, that allowed the user to simulate
the effect of future changes in productivity.

28 Tennessee Higher Education Commission
How does the model work?
29 Tennessee Higher Education Commission
Developing a New Formula Model
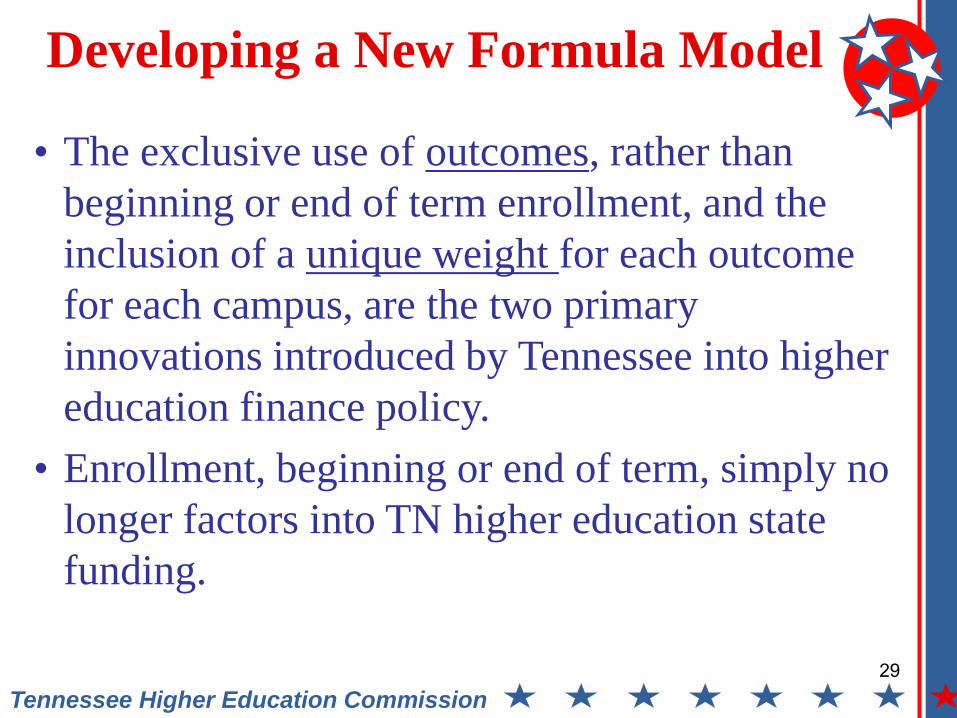
• The exclusive use of outcomes, rather than
beginning or end of term enrollment, and the
inclusion of a unique weight for each outcome
for each campus, are the two primary
innovations introduced by Tennessee into higher
education finance policy.
• Enrollment, beginning or end of term, simply no
longer factors into TN higher education state
funding.
30 Tennessee Higher Education Commission
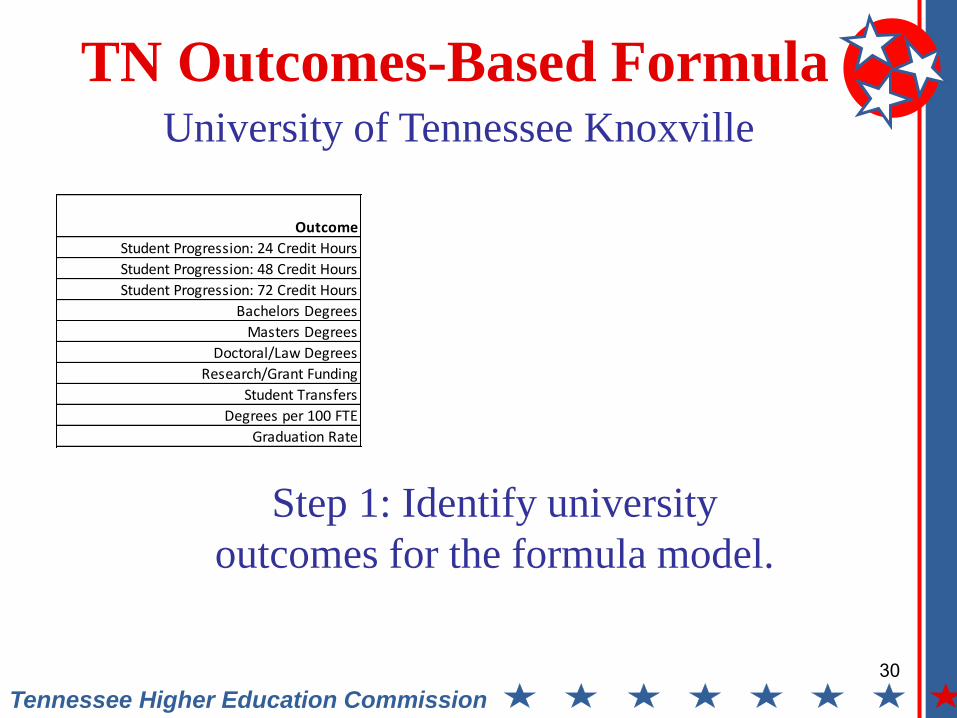
TN Outcomes-Based Formula
Outcome
Student Progression: 24 Credit Hours
Student Progression: 48 Credit Hours
Student Progression: 72 Credit Hours
Bachelors Degrees
Masters Degrees
Doctoral/Law Degrees
Research/Grant Funding
Student Transfers
Degrees per 100 FTE
Graduation Rate
Step 1: Identify university
outcomes for the formula model.
University of Tennessee Knoxville
31 Tennessee Higher Education Commission
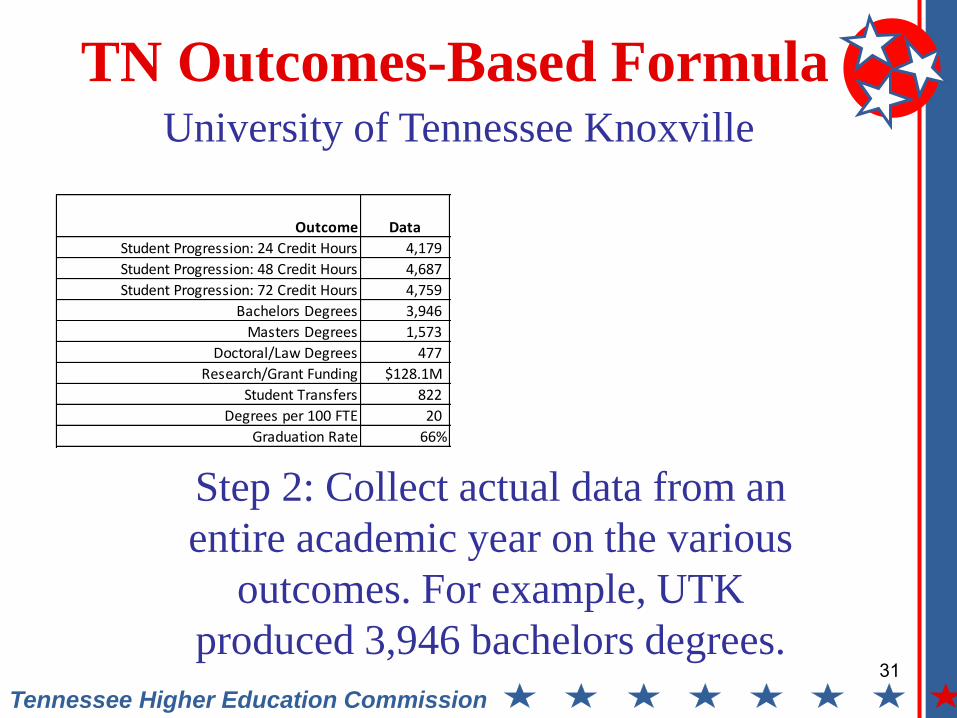
TN Outcomes-Based Formula
Step 2: Collect actual data from an
entire academic year on the various
outcomes. For example, UTK
produced 3,946 bachelors degrees.
Outcome Data
Student Progression: 24 Credit Hours 4,179
Student Progression: 48 Credit Hours 4,687
Student Progression: 72 Credit Hours 4,759
Bachelors Degrees 3,946
Masters Degrees 1,573
Doctoral/Law Degrees 477
Research/Grant Funding $128.1M
Student Transfers 822
Degrees per 100 FTE 20
Graduation Rate 66%
University of Tennessee Knoxville
32 Tennessee Higher Education Commission
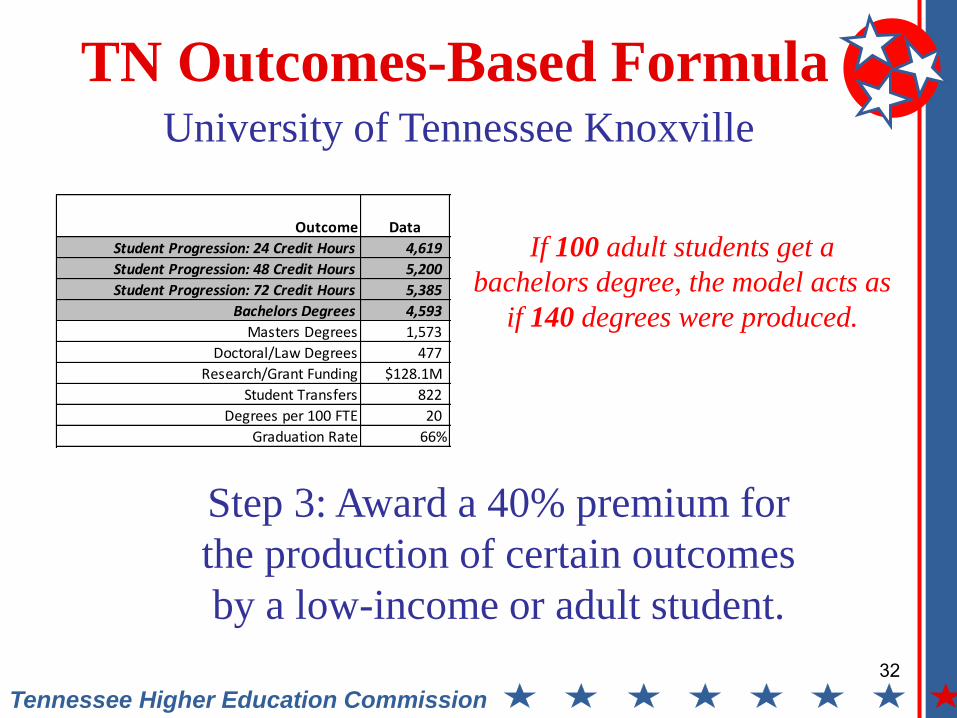
TN Outcomes-Based Formula
Step 3: Award a 40% premium for
the production of certain outcomes
by a low-income or adult student.
Outcome Data
Student Progression: 24 Credit Hours 4,619
Student Progression: 48 Credit Hours 5,200
Student Progression: 72 Credit Hours 5,385
Bachelors Degrees 4,593
Masters Degrees 1,573
Doctoral/Law Degrees 477
Research/Grant Funding $128.1M
Student Transfers 822
Degrees per 100 FTE 20
Graduation Rate 66%
University of Tennessee Knoxville
If 100 adult students get a
bachelors degree, the model acts as
if 140 degrees were produced.
33 Tennessee Higher Education Commission
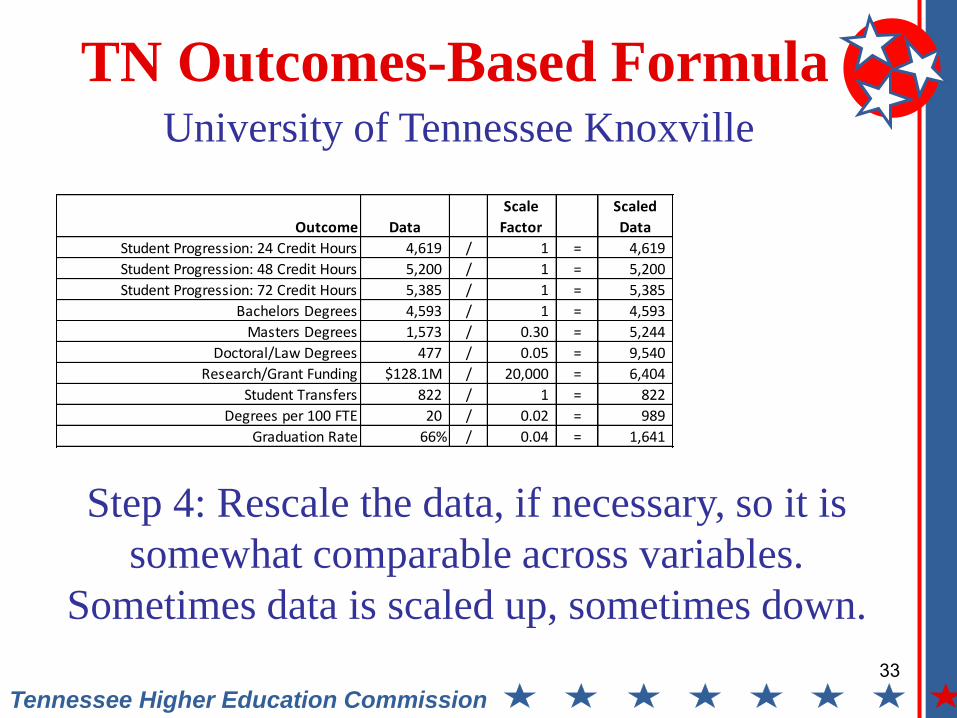
TN Outcomes-Based Formula University of Tennessee Knoxville
Outcome Data
Scale
Factor
Scaled
Data
Student Progression: 24 Credit Hours 4,619 / 1 = 4,619
Student Progression: 48 Credit Hours 5,200 / 1 = 5,200
Student Progression: 72 Credit Hours 5,385 / 1 = 5,385
Bachelors Degrees 4,593 / 1 = 4,593
Masters Degrees 1,573 / 0.30 = 5,244
Doctoral/Law Degrees 477 / 0.05 = 9,540
Research/Grant Funding $128.1M / 20,000 = 6,404
Student Transfers 822 / 1 = 822
Degrees per 100 FTE 20 / 0.02 = 989
Graduation Rate 66% / 0.04 = 1,641
Step 4: Rescale the data, if necessary, so it is
somewhat comparable across variables.
Sometimes data is scaled up, sometimes down.
34 Tennessee Higher Education Commission
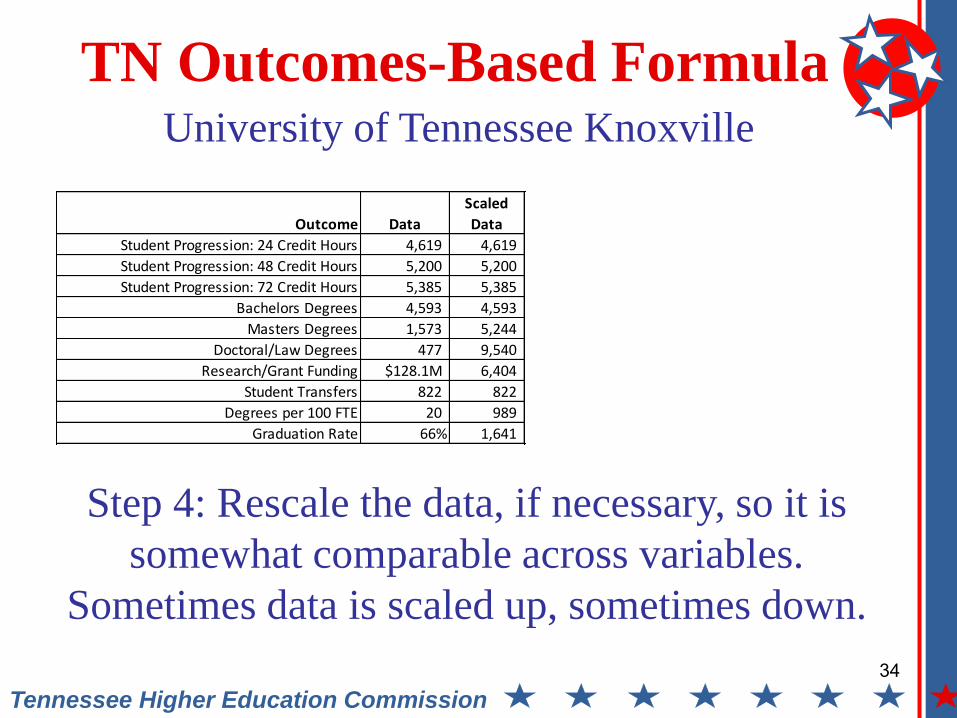
TN Outcomes-Based Formula University of Tennessee Knoxville
Outcome Data
Scaled
Data
Student Progression: 24 Credit Hours 4,619 4,619
Student Progression: 48 Credit Hours 5,200 5,200
Student Progression: 72 Credit Hours 5,385 5,385
Bachelors Degrees 4,593 4,593
Masters Degrees 1,573 5,244
Doctoral/Law Degrees 477 9,540
Research/Grant Funding $128.1M 6,404
Student Transfers 822 822
Degrees per 100 FTE 20 989
Graduation Rate 66% 1,641
Step 4: Rescale the data, if necessary, so it is
somewhat comparable across variables.
Sometimes data is scaled up, sometimes down.
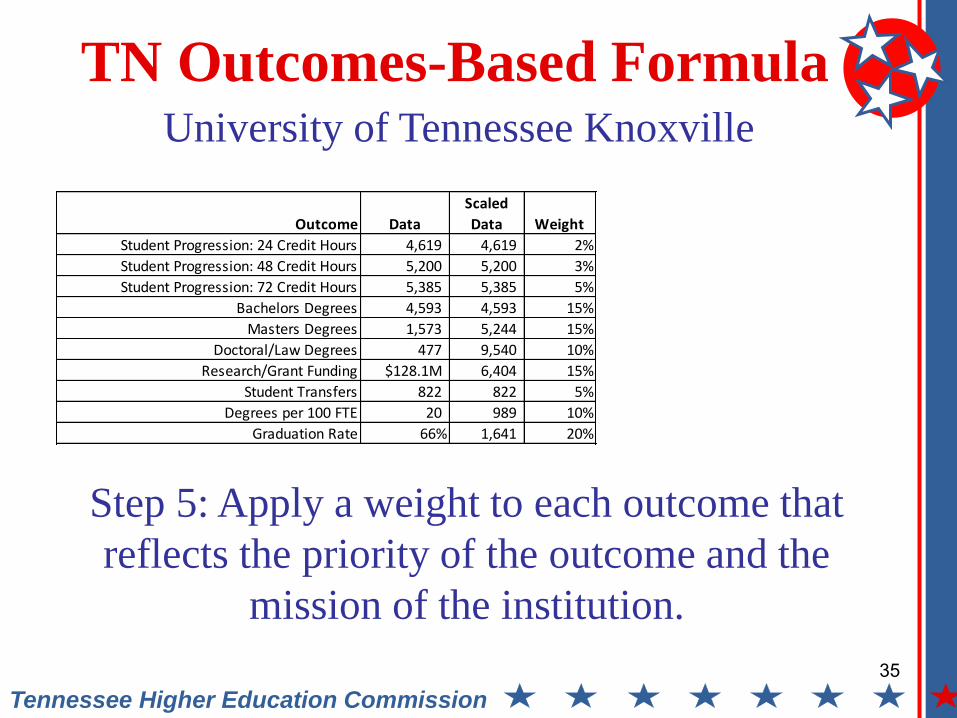
35 Tennessee Higher Education Commission
TN Outcomes-Based Formula University of Tennessee Knoxville
Step 5: Apply a weight to each outcome that
reflects the priority of the outcome and the
mission of the institution.
Outcome Data
Scaled
Data Weight
Student Progression: 24 Credit Hours 4,619 4,619 2%
Student Progression: 48 Credit Hours 5,200 5,200 3%
Student Progression: 72 Credit Hours 5,385 5,385 5%
Bachelors Degrees 4,593 4,593 15%
Masters Degrees 1,573 5,244 15%
Doctoral/Law Degrees 477 9,540 10%
Research/Grant Funding $128.1M 6,404 15%
Student Transfers 822 822 5%
Degrees per 100 FTE 20 989 10%
Graduation Rate 66% 1,641 20%
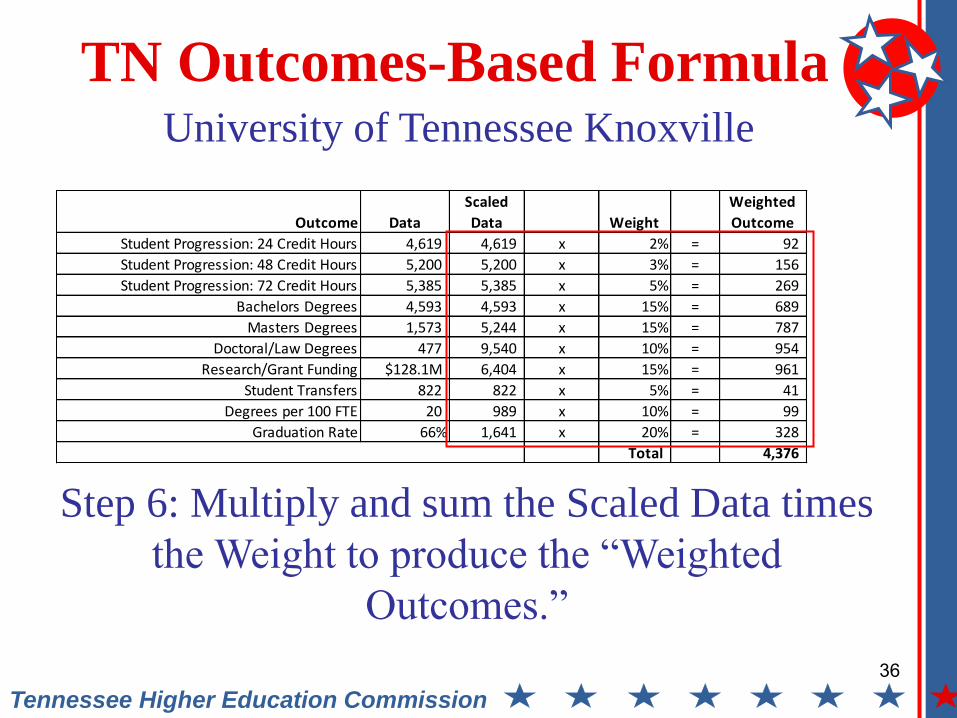
36 Tennessee Higher Education Commission
TN Outcomes-Based Formula University of Tennessee Knoxville
Step 6: Multiply and sum the Scaled Data times
the Weight to produce the “Weighted
Outcomes.”
Outcome Data
Scaled
Data Weight
Weighted
Outcome
Student Progression: 24 Credit Hours 4,619 4,619 x 2% = 92
Student Progression: 48 Credit Hours 5,200 5,200 x 3% = 156
Student Progression: 72 Credit Hours 5,385 5,385 x 5% = 269
Bachelors Degrees 4,593 4,593 x 15% = 689
Masters Degrees 1,573 5,244 x 15% = 787
Doctoral/Law Degrees 477 9,540 x 10% = 954
Research/Grant Funding $128.1M 6,404 x 15% = 961
Student Transfers 822 822 x 5% = 41
Degrees per 100 FTE 20 989 x 10% = 99
Graduation Rate 66% 1,641 x 20% = 328
Total 4,376
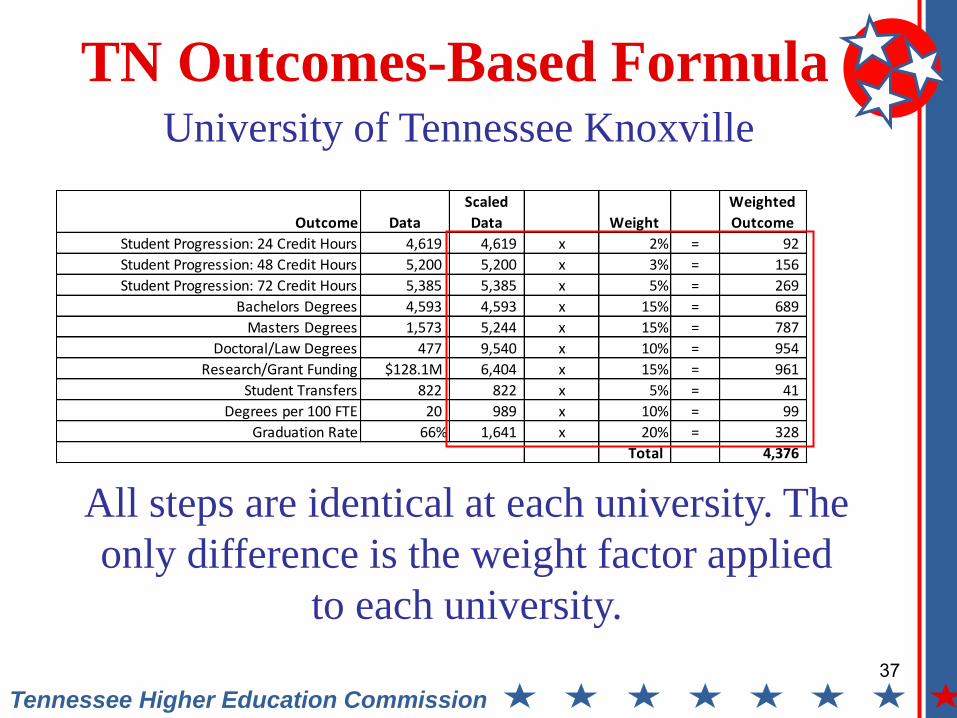
37 Tennessee Higher Education Commission
TN Outcomes-Based Formula University of Tennessee Knoxville
All steps are identical at each university. The
only difference is the weight factor applied
to each university.
Outcome Data
Scaled
Data Weight
Weighted
Outcome
Student Progression: 24 Credit Hours 4,619 4,619 x 2% = 92
Student Progression: 48 Credit Hours 5,200 5,200 x 3% = 156
Student Progression: 72 Credit Hours 5,385 5,385 x 5% = 269
Bachelors Degrees 4,593 4,593 x 15% = 689
Masters Degrees 1,573 5,244 x 15% = 787
Doctoral/Law Degrees 477 9,540 x 10% = 954
Research/Grant Funding $128.1M 6,404 x 15% = 961
Student Transfers 822 822 x 5% = 41
Degrees per 100 FTE 20 989 x 10% = 99
Graduation Rate 66% 1,641 x 20% = 328
Total 4,376
38 Tennessee Higher Education Commission
Developing a New Formula Model
• The weighted outcomes are then monetized with
an average SREB faculty salary multiplier.
• Final adjustments are made for selected fixed
cost elements, such as infrastructure size and
major equipment inventory.
• Finally, the Performance Funding or Quality
Assurance program is added, which includes
elements such as program accreditation, student
satisfaction, licensure exam pass rates, etc.

39 Tennessee Higher Education Commission
TN Outcomes-Based Formula
Outcome Data Scaled Data Weight
Weighted
Outcome
Students Accumulating 24 hrs (Scale=1) 4,619 4,619 2% 92
Students Accumulating 48 hrs (Scale=1) 5,200 5,200 3% 156
Students Accumulating 72 hrs (Scale=1) 5,385 5,385 5% 269
Bachelors and Associates (Scale=1) 4,593 4,593 15% 689
Masters/Ed Specialist Degrees (Scale=0.3) 1,573 5,244 15% 787
Doctoral / Law Degrees (Scale=.05) 477 9,540 10% 954
Research and Service (Scale=20,000) $128.1M 6,404 15% 961
Transfers Out with 12 hrs (Scale=1) 822 822 5% 41
Degrees per 100 FTE (Scale=.02) 20 989 10% 99
Six-Year Graduation Rate (Scale=.04) 66% 1,641 20% 328
Total 4,376
Total Weighted Outcomes
Avg SREB
Salary Subtotal
4,376 x 89,473 = 391,531,000
M&O, Utilities + 74,993,000
Equipment + 19,177,000
Performance Funding + 22,897,000
Grand Total Calculation 508,598,000
Outcomes Model Summary - UTK
For Illustration
Purposes Only
Tennessee Higher Education Commission
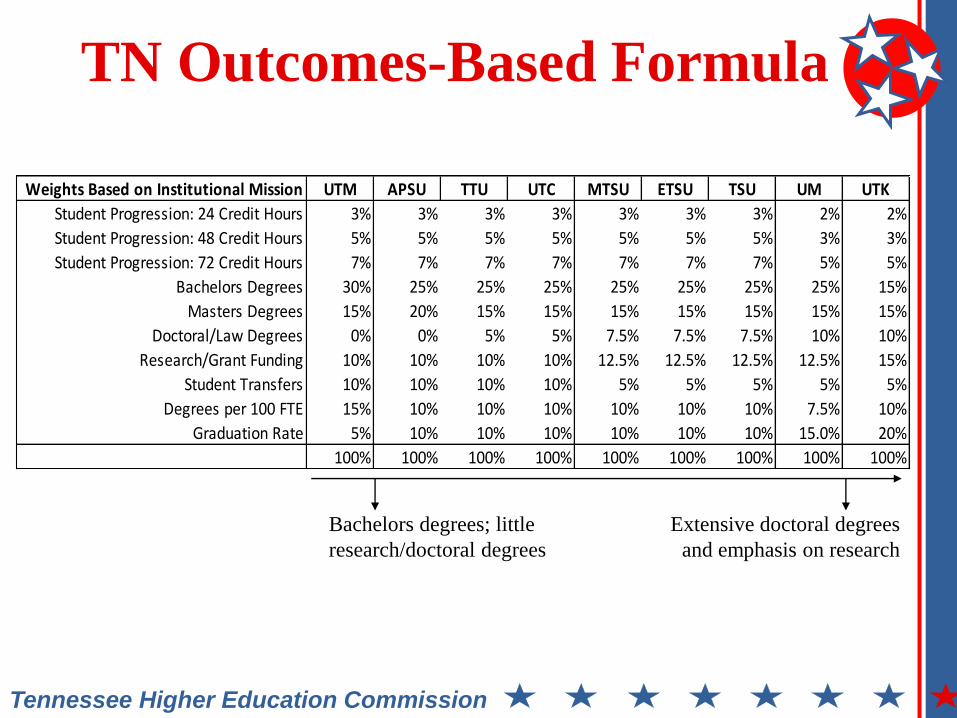
TN Outcomes-Based Formula
Bachelors degrees; little
research/doctoral degrees
Extensive doctoral degrees
and emphasis on research
Weights Based on Institutional Mission UTM APSU TTU UTC MTSU ETSU TSU UM UTK
Student Progression: 24 Credit Hours 3% 3% 3% 3% 3% 3% 3% 2% 2%
Student Progression: 48 Credit Hours 5% 5% 5% 5% 5% 5% 5% 3% 3%
Student Progression: 72 Credit Hours 7% 7% 7% 7% 7% 7% 7% 5% 5%
Bachelors Degrees 30% 25% 25% 25% 25% 25% 25% 25% 15%
Masters Degrees 15% 20% 15% 15% 15% 15% 15% 15% 15%
Doctoral/Law Degrees 0% 0% 5% 5% 7.5% 7.5% 7.5% 10% 10%
Research/Grant Funding 10% 10% 10% 10% 12.5% 12.5% 12.5% 12.5% 15%
Student Transfers 10% 10% 10% 10% 5% 5% 5% 5% 5%
Degrees per 100 FTE 15% 10% 10% 10% 10% 10% 10% 7.5% 10%
Graduation Rate 5% 10% 10% 10% 10% 10% 10% 15.0% 20%
100% 100% 100% 100% 100% 100% 100% 100% 100%
Tennessee Higher Education Commission
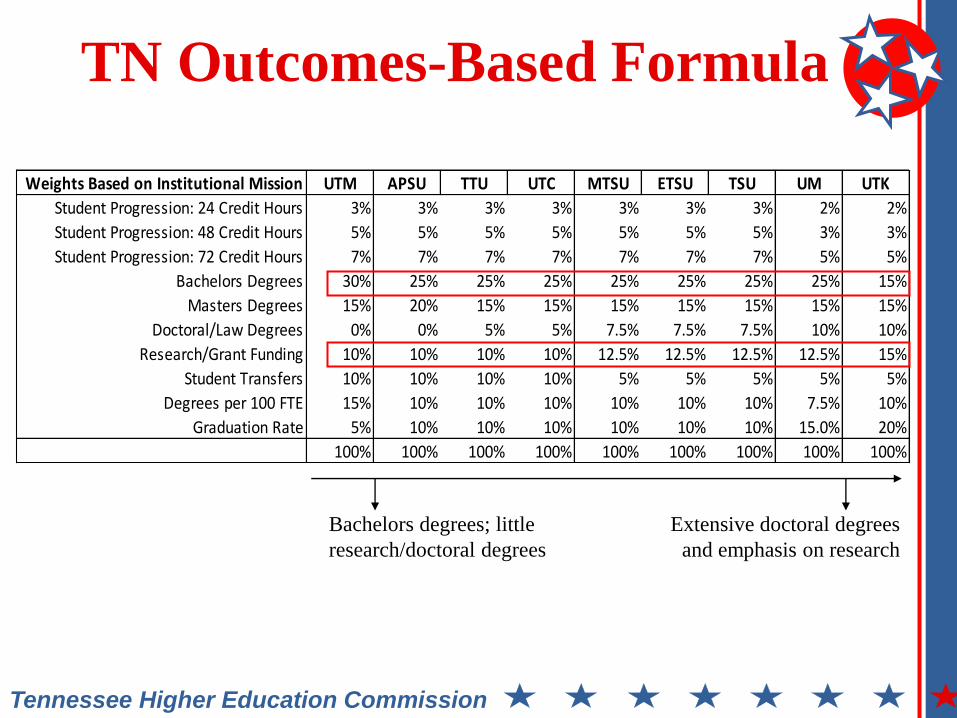
TN Outcomes-Based Formula
Bachelors degrees; little
research/doctoral degrees
Extensive doctoral degrees
and emphasis on research
Weights Based on Institutional Mission UTM APSU TTU UTC MTSU ETSU TSU UM UTK
Student Progression: 24 Credit Hours 3% 3% 3% 3% 3% 3% 3% 2% 2%
Student Progression: 48 Credit Hours 5% 5% 5% 5% 5% 5% 5% 3% 3%
Student Progression: 72 Credit Hours 7% 7% 7% 7% 7% 7% 7% 5% 5%
Bachelors Degrees 30% 25% 25% 25% 25% 25% 25% 25% 15%
Masters Degrees 15% 20% 15% 15% 15% 15% 15% 15% 15%
Doctoral/Law Degrees 0% 0% 5% 5% 7.5% 7.5% 7.5% 10% 10%
Research/Grant Funding 10% 10% 10% 10% 12.5% 12.5% 12.5% 12.5% 15%
Student Transfers 10% 10% 10% 10% 5% 5% 5% 5% 5%
Degrees per 100 FTE 15% 10% 10% 10% 10% 10% 10% 7.5% 10%
Graduation Rate 5% 10% 10% 10% 10% 10% 10% 15.0% 20%
100% 100% 100% 100% 100% 100% 100% 100% 100%
42 Tennessee Higher Education Commission
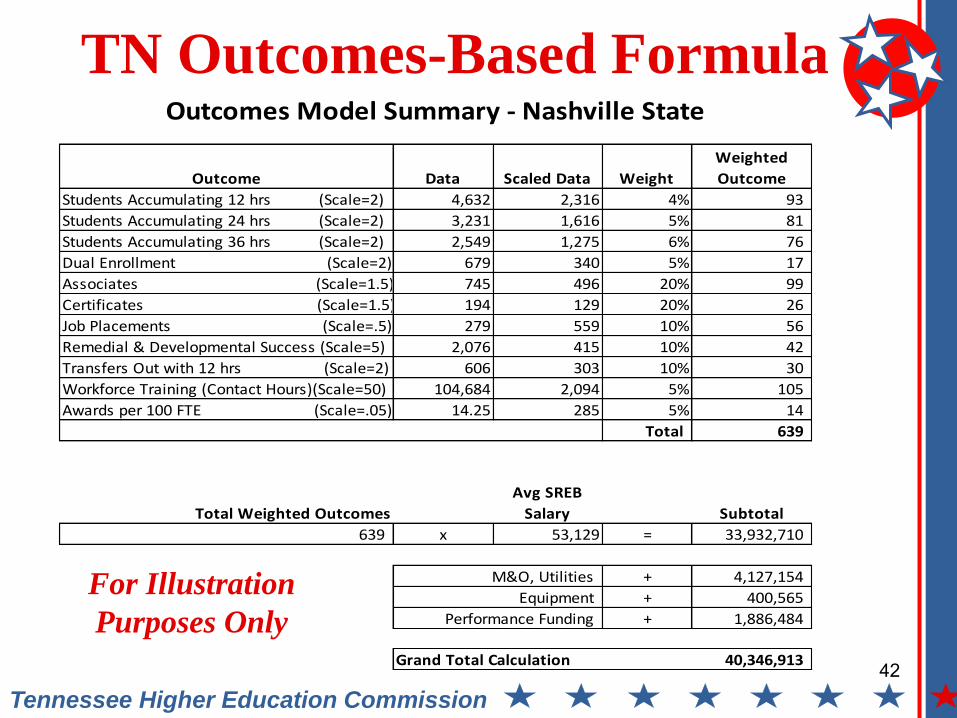
TN Outcomes-Based Formula
Outcome Data Scaled Data Weight
Weighted
Outcome
Students Accumulating 12 hrs (Scale=2) 4,632 2,316 4% 93
Students Accumulating 24 hrs (Scale=2) 3,231 1,616 5% 81
Students Accumulating 36 hrs (Scale=2) 2,549 1,275 6% 76
Dual Enrollment (Scale=2) 679 340 5% 17
Associates (Scale=1.5) 745 496 20% 99
Certificates (Scale=1.5) 194 129 20% 26
Job Placements (Scale=.5) 279 559 10% 56
Remedial & Developmental Success (Scale=5) 2,076 415 10% 42
Transfers Out with 12 hrs (Scale=2) 606 303 10% 30
Workforce Training (Contact Hours)(Scale=50) 104,684 2,094 5% 105
Awards per 100 FTE (Scale=.05) 14.25 285 5% 14
Total 639
Total Weighted Outcomes
Avg SREB
Salary Subtotal
639 x 53,129 = 33,932,710
M&O, Utilities + 4,127,154
Equipment + 400,565
Performance Funding + 1,886,484
Grand Total Calculation 40,346,913
Outcomes Model Summary - Nashville State
For Illustration
Purposes Only
Tennessee Higher Education Commission
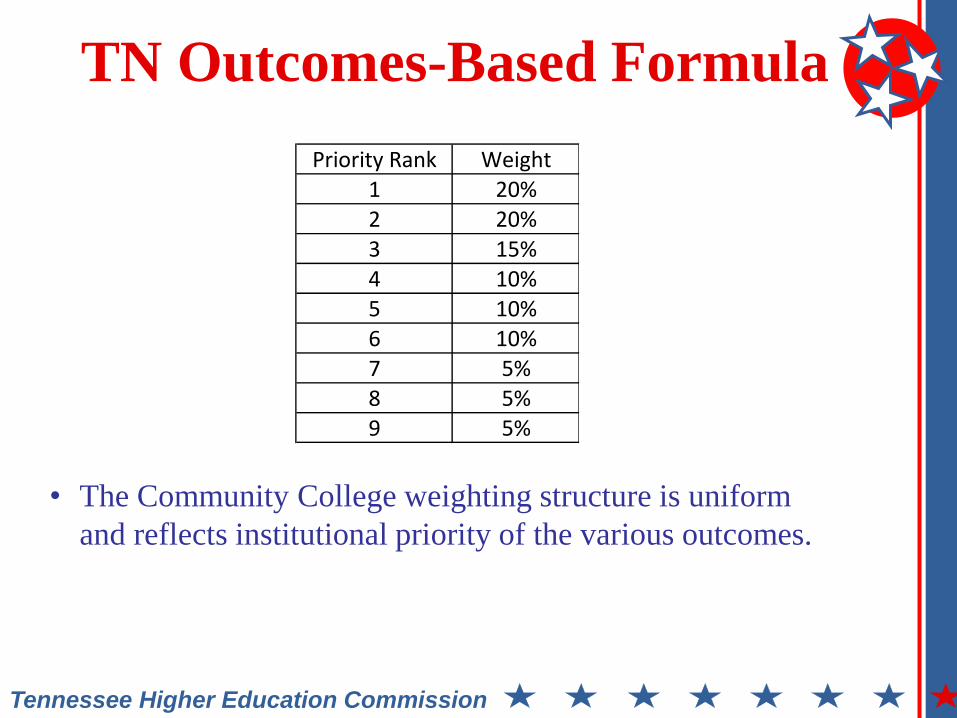
TN Outcomes-Based Formula
• The Community College weighting structure is uniform
and reflects institutional priority of the various outcomes.
Priority Rank Weight1 20%2 20%3 15%4 10%5 10%6 10%7 5%8 5%9 5%
44 Tennessee Higher Education Commission
TN Outcomes-Based Model
• All outcomes, save graduation rate, are
counts rather than rates.
• Therefore, the outcomes model does not
depend on an initial cohort.
• It includes any outcome achieved by any
student at any time (part time, returning
students, transfers, etc.).
• If we can locate the outcome, it is counted.
45 Tennessee Higher Education Commission
TN Outcomes-Based Model
• Most outcome data are derived from a
statewide student information system.
• There are no state-imposed targets or
pre-determined goals.
• Each institution’s formula calculation is
independent of other institutions.
46 Tennessee Higher Education Commission
TN Outcomes-Based Model
• However, the allocation of available (limited)
state appropriations is competitive.
• The distribution of state appropriations follows a
pro-rata share of each institution’s formula
calculation.
• If the state funds 60% of the overall higher
education request, then each institution will
receive 60% of its outcomes formula request.
47 Tennessee Higher Education Commission
TN Outcomes-Based Formula
• All state funding is back up for grabs every year.
• No institution is entitled to some minimal level
of appropriations that is based on prior-year
funding.
• State appropriations have to be earned anew
each year.
• There is no need to wait on new funding to
implement the formula.
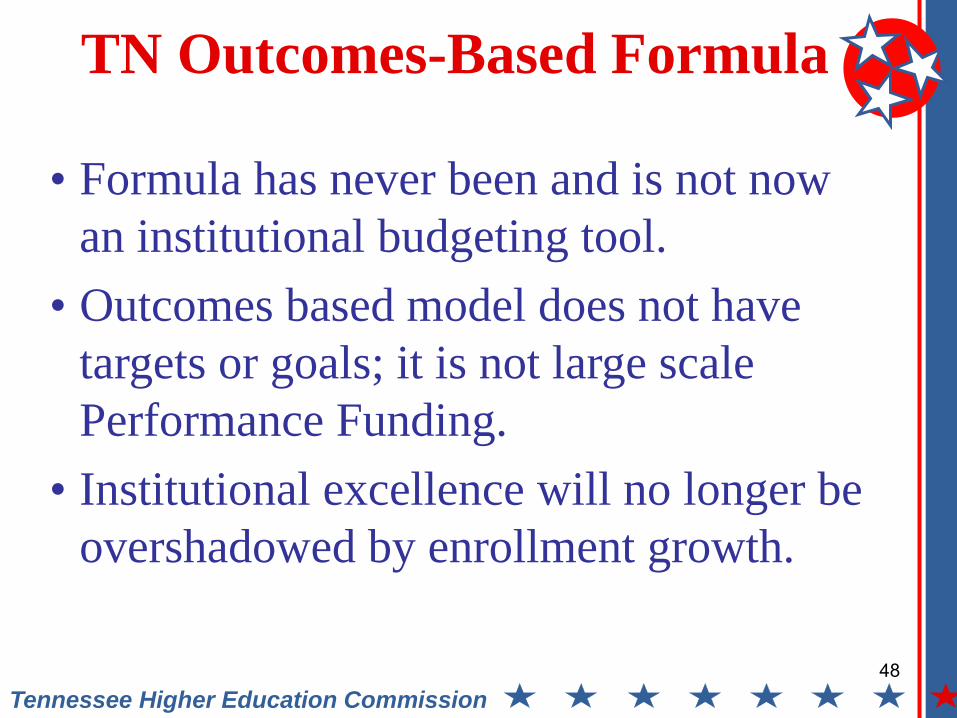
48 Tennessee Higher Education Commission
TN Outcomes-Based Formula
• Formula has never been and is not now
an institutional budgeting tool.
• Outcomes based model does not have
targets or goals; it is not large scale
Performance Funding.
• Institutional excellence will no longer be
overshadowed by enrollment growth.
49 Tennessee Higher Education Commission
How was the outcomes
model implemented?
50 Tennessee Higher Education Commission
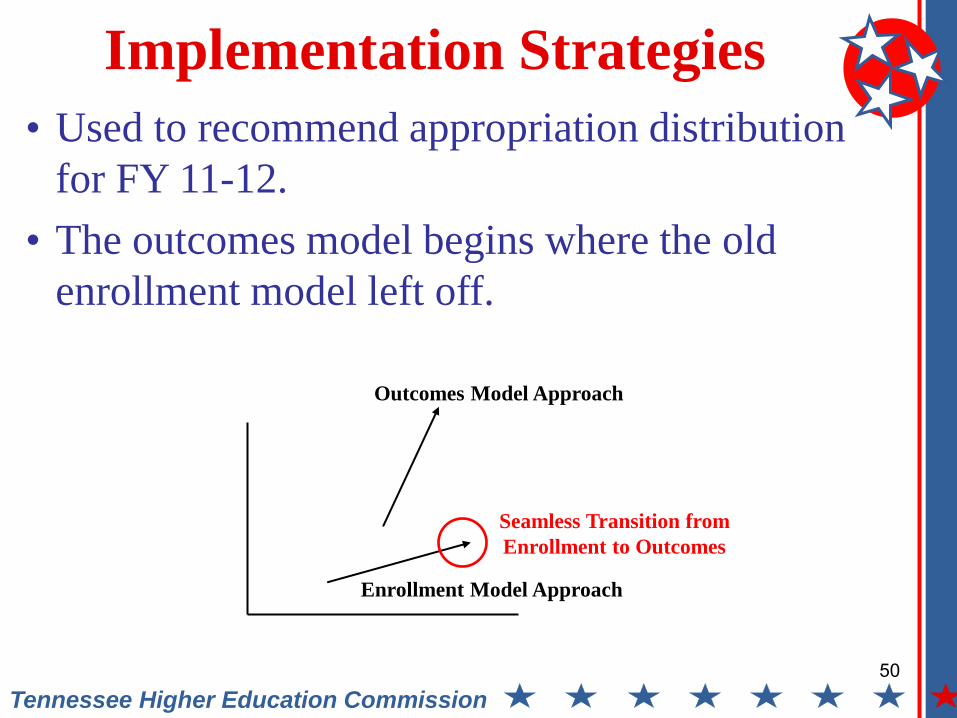
Implementation Strategies
• Used to recommend appropriation distribution
for FY 11-12.
• The outcomes model begins where the old
enrollment model left off.
Enrollment Model Approach
Outcomes Model Approach
Seamless Transition from
Enrollment to Outcomes
51 Tennessee Higher Education Commission
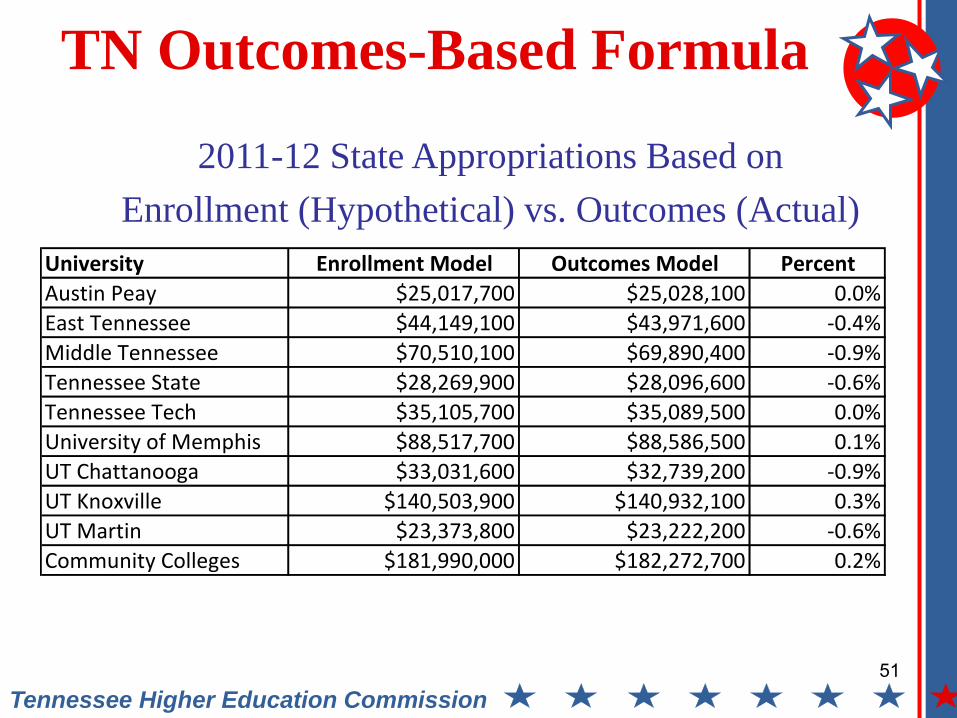
TN Outcomes-Based Formula
2011-12 State Appropriations Based on
Enrollment (Hypothetical) vs. Outcomes (Actual)
University Enrollment Model Outcomes Model Percent
Austin Peay $25,017,700 $25,028,100 0.0%
East Tennessee $44,149,100 $43,971,600 -0.4%
Middle Tennessee $70,510,100 $69,890,400 -0.9%
Tennessee State $28,269,900 $28,096,600 -0.6%
Tennessee Tech $35,105,700 $35,089,500 0.0%
University of Memphis $88,517,700 $88,586,500 0.1%
UT Chattanooga $33,031,600 $32,739,200 -0.9%
UT Knoxville $140,503,900 $140,932,100 0.3%
UT Martin $23,373,800 $23,222,200 -0.6%
Community Colleges $181,990,000 $182,272,700 0.2%
52 Tennessee Higher Education Commission
What are the strengths and
weaknesses of the outcomes-
based formula model?
53 Tennessee Higher Education Commission
• Multiple measures of productivity,
previously unaccounted for, will now be
credited to the institution.
• Formula is not prescriptive in how to
achieve success and excellence.
• Does not penalize failure to achieve pre-
determined goals.
Outcomes Based
Model Advantages
54 Tennessee Higher Education Commission
Outcomes Based
Model Advantages
• Emphasizes unique institutional mission.
• More flexible. Can accommodate future
shifts in mission or desired outcomes.
• More transparent and simpler for state
government.
• Increased stability: funding is now a
function of 10 variables, rather than a
single variable (enrollment).
55 Tennessee Higher Education Commission
Outcomes Based
Model Advantages
• The outcomes model is linked directly to the
educational attainment goals of TN’s Public
Agenda.
• The outcomes model establishes a framework
for government to have an ongoing policy
discussion with higher education.
• The model is adjustable to account for new
outcomes or a different policy focus (changing
the weights).
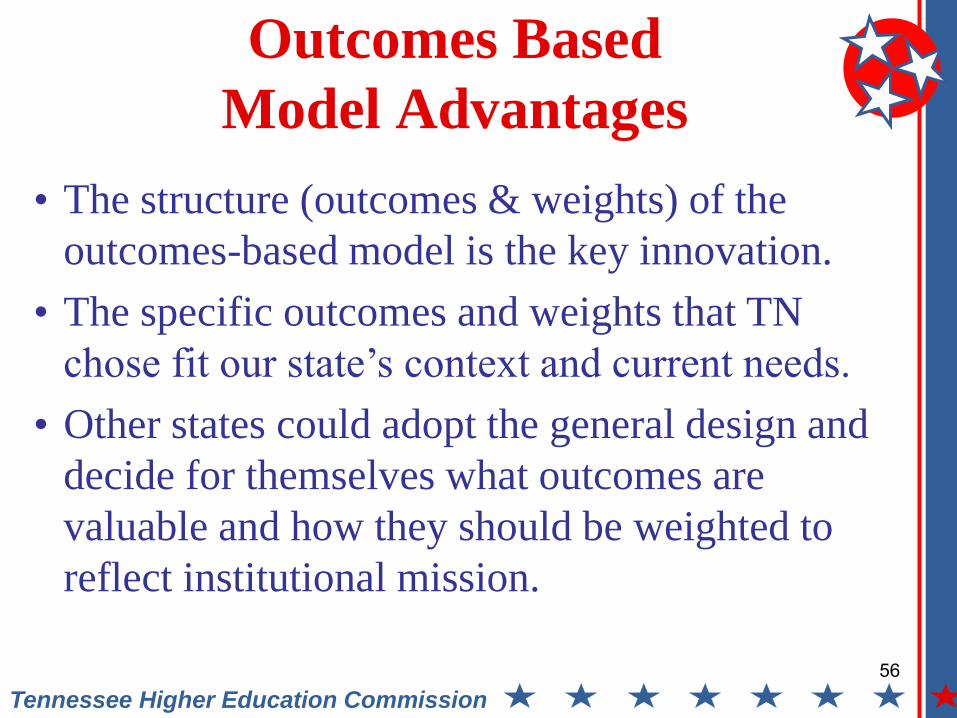
56 Tennessee Higher Education Commission
Outcomes Based
Model Advantages
• The structure (outcomes & weights) of the
outcomes-based model is the key innovation.
• The specific outcomes and weights that TN
chose fit our state’s context and current needs.
• Other states could adopt the general design and
decide for themselves what outcomes are
valuable and how they should be weighted to
reflect institutional mission.

57 Tennessee Higher Education Commission
From the Perspective
of an Institution….
• State government should be clear in its
expectations for higher education.
• Institutions should be given wide latitude in
organizational, budgetary, programmatic and
academic matters.
• State government should provide incentives for
achievement, but should not interfere with
institutional judgments about how to achieve
those goals.

58 Tennessee Higher Education Commission
From the Perspective
of State Government….
• What is the most effective means of allocating
limited state resources among institutions?
• What macro-level information is crucial to
making allocation decisions among institutions?
• What type of incentive structure can be created,
with minimal operational interference but
maximum leverage, to achieve state goals?
59 Tennessee Higher Education Commission
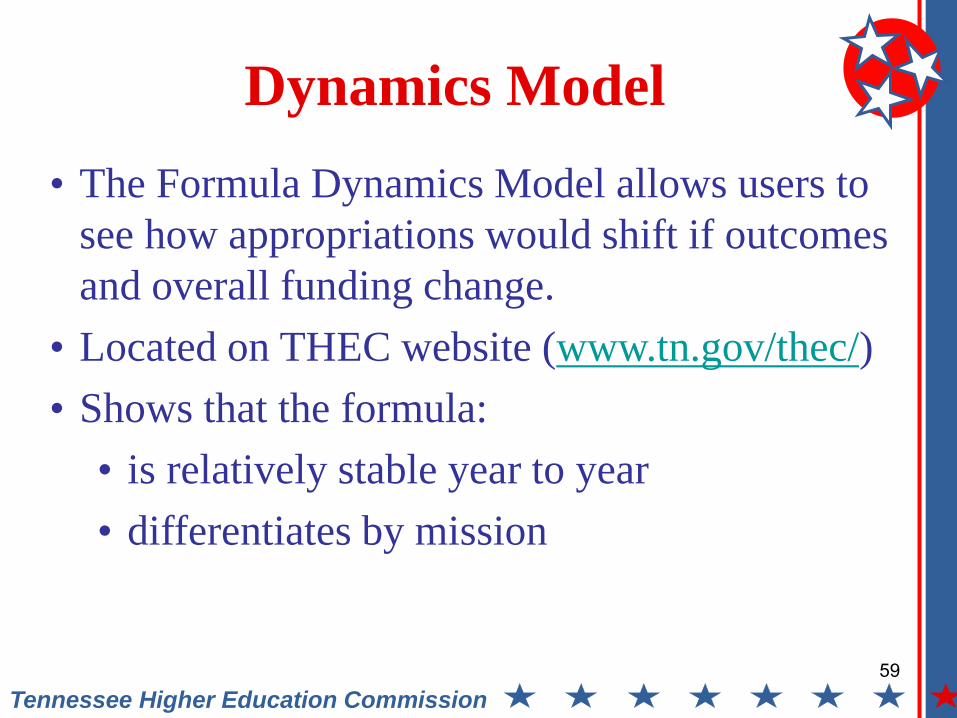
Dynamics Model
• The Formula Dynamics Model allows users to
see how appropriations would shift if outcomes
and overall funding change.
• Located on THEC website (www.tn.gov/thec/)
• Shows that the formula:
• is relatively stable year to year
• differentiates by mission

60 Tennessee Higher Education Commission
Is the formula working?
61 Tennessee Higher Education Commission
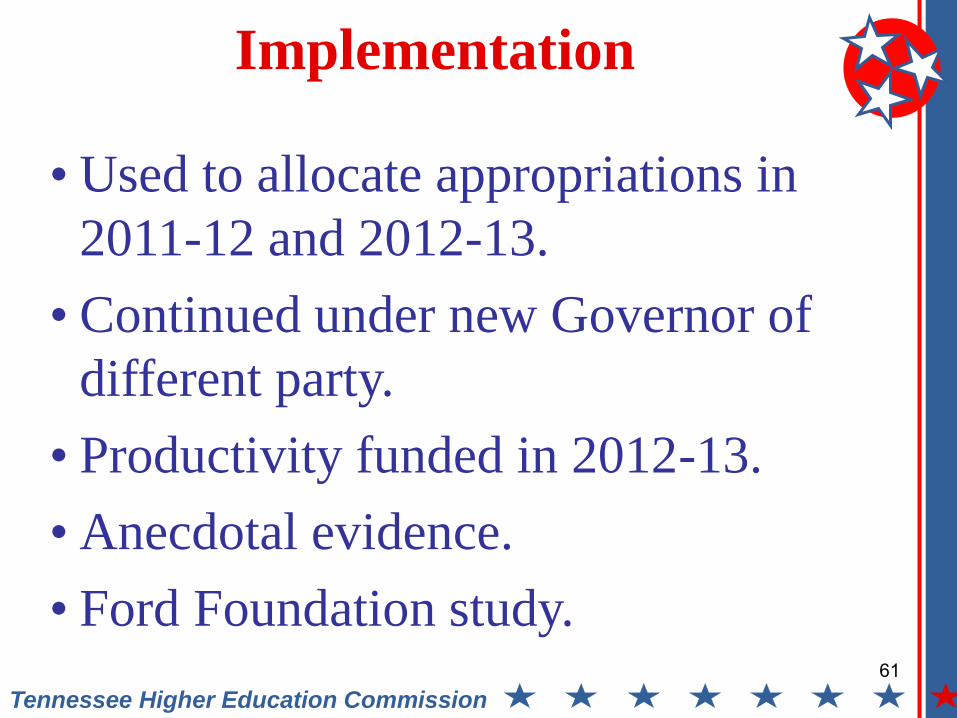
Implementation
• Used to allocate appropriations in
2011-12 and 2012-13.
• Continued under new Governor of
different party.
• Productivity funded in 2012-13.
• Anecdotal evidence.
• Ford Foundation study.
62 Tennessee Higher Education Commission
-4.0%
-3.0%
-2.0%
-1.0%
0.0%
1.0%
2.0%
2010-11 2011-12 2012-13
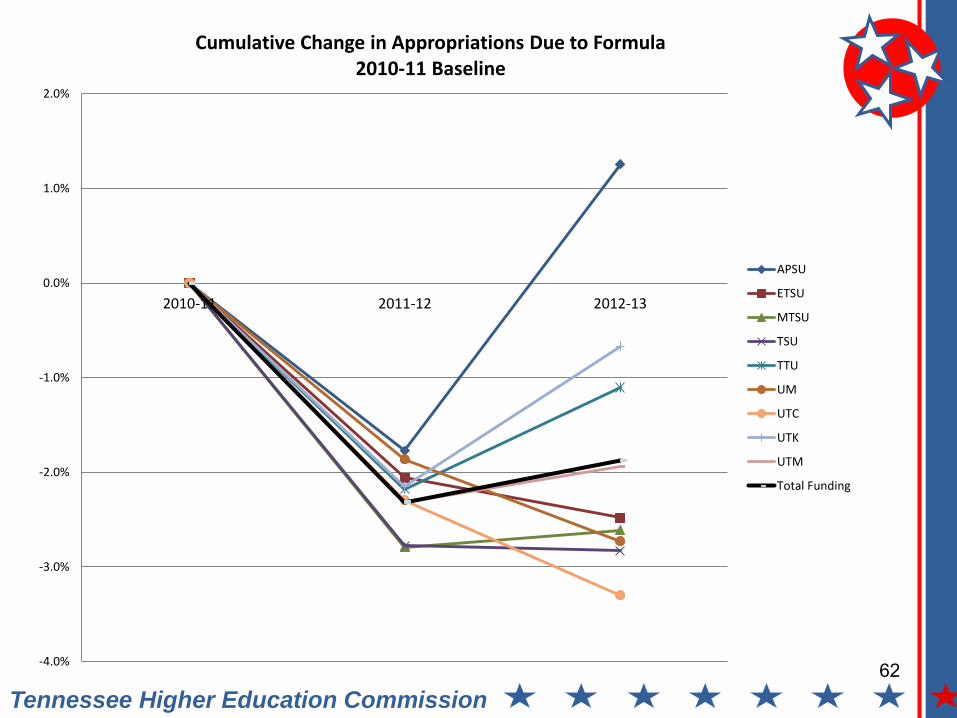
Cumulative Change in Appropriations Due to Formula 2010-11 Baseline
APSU
ETSU
MTSU
TSU
TTU
UM
UTC
UTK
UTM
Total Funding
63 Tennessee Higher Education Commission
TN Outcomes Formula
• Extensive information, including the
formula model, is available on the
THEC homepage.
• tn.gov/thec

64 Tennessee Higher Education Commission
Tennessee’s Outcomes-Based Funding
Formula

65 Tennessee Higher Education Commission
Richard Rhoda
Executive Director
Scott Boelscher
Director for Fiscal Policy and Facilities Analysis
For more information, please contact: