tennant company - s2.q4cdn.coms2.q4cdn.com/547804565/files/doc_presentations/2018/2018_tnc...and...
TRANSCRIPT

TENNANT COMPANY
REINVENTING HOW THE WORLD CLEANS
INVESTOR PRESENTATION

2
TENNANT COMPANY
Safe HarborStatement
2
This presentation contains certain statements that are considered “forward-looking statements” within the meaning of the Private Securities Litigation Reform Act of 1995. Forward-looking statements generally can be identified by the use of forward-looking terminology such as “may,” “will,” “expect,” “intend,” “estimate,” “anticipate,” “believe,” “project,” or “continue” or similar words or the negative thereof. These statements do not relate to strictly historical or current facts and provide current expectations of forecasts of future events. Any such expectations or forecasts of future events are subject to a variety of factors. We caution that forward-looking statements must be considered carefully and that actual results may differ in material ways due to risks and uncertainties both known and unknown. Information about factors that could materially affect our results can be found in Part I, Item 1A, Risk Factors in our Annual Report on Form 10-K for the year ended December 31, 2017, and in Part II, Item 1A Risk Factors in our most recent quarterly report on Form 10-Q. Shareholders and potential investors are urged to consider these factors in evaluating forward-looking statements and are cautioned not to place undue reliance on such forward-looking statements.
We undertake no obligation to update or revise any forward-looking statement, whether as a result of new information, future events or otherwise. Investors are advised to consult any further disclosures by us in our filings with the Securities and Exchange Commission and in other written statements on related subjects. It is not possible to anticipate or foresee all risk factors, and investors should not consider any list of such factors to be an exhaustive or complete list of all risks or uncertainties.

3
TENNANT COMPANY
AboutTennant CompanyTennant Company, a Minnesota corporation founded in 1870 and incorporated in 1909, is a world leader in designing, manufacturing and marketing solutions that empower customers to achieve quality cleaning performance, reduce environmental impact and help create a cleaner, safer, healthier world.
NYSE Symbol:TNC
.2017 REVENUES Balance sheet
& cash flow
.2017 AdjustedEBITDA*
..5 Year ORGANIC GROWTH
*See appendix for Non-GAAP reconciliation.

4
TENNANT COMPANY
OURVISION
We will lead our global industry in sustainable cleaning innovation that empowers our customers to create a cleaner, safer and healthier world.
UNMATCHEDSERVICE
INDUSTRY-LEADINGQUALITY
INNOVATIONLEADER
THE CLEANING INDUSTRY LEADER

5
TENNANT COMPANY
Shareholder Return
$13.2 $14.5 $14.5 $14.3 $15.0
$22.2$14.1
$46.0
$12.8
$0$5
$10$15$20$25$30$35$40$45$50$55$60$65
2013 2014 2015 2016 2017
DividendsShare Repurchase
Tennant Dividends & Share Repurchases
Dividend Yield
2017 & 2018 Focus on Debt Reduction
Remaining Share Repurchase Authorization (1.4M shares)
Consecutive years ofcash dividends
Consecutive years of increase in annual cash dividend payout
1.2% 73 46
$ Milli
ons

6
TENNANT COMPANY
Global Footprint
2017 GLOBAL NET SALES BY REGIONAmericas
64%EMEA
27%APAC
9%
4,300+EMPLOYEES
13MFG PLANTS
40,000+CUSTOMERS
300+SALES REPS
400+DISTRIBUTORS
100+COUNTRIES
TENNANT BY THE NUMBERS
MINNEAPOLISMinnesota, USA
Headquarters
LOUISVILLEKentucky, USA
HOLLANDMichigan, USA
CHICAGOIllinois, USA
LIMEIRABrazil
UDENThe Netherlands
ITALYIPC SHANGHAI
China
GLOBAL MANUFACTURING LOCATIONS
7
TENNANT COMPANY
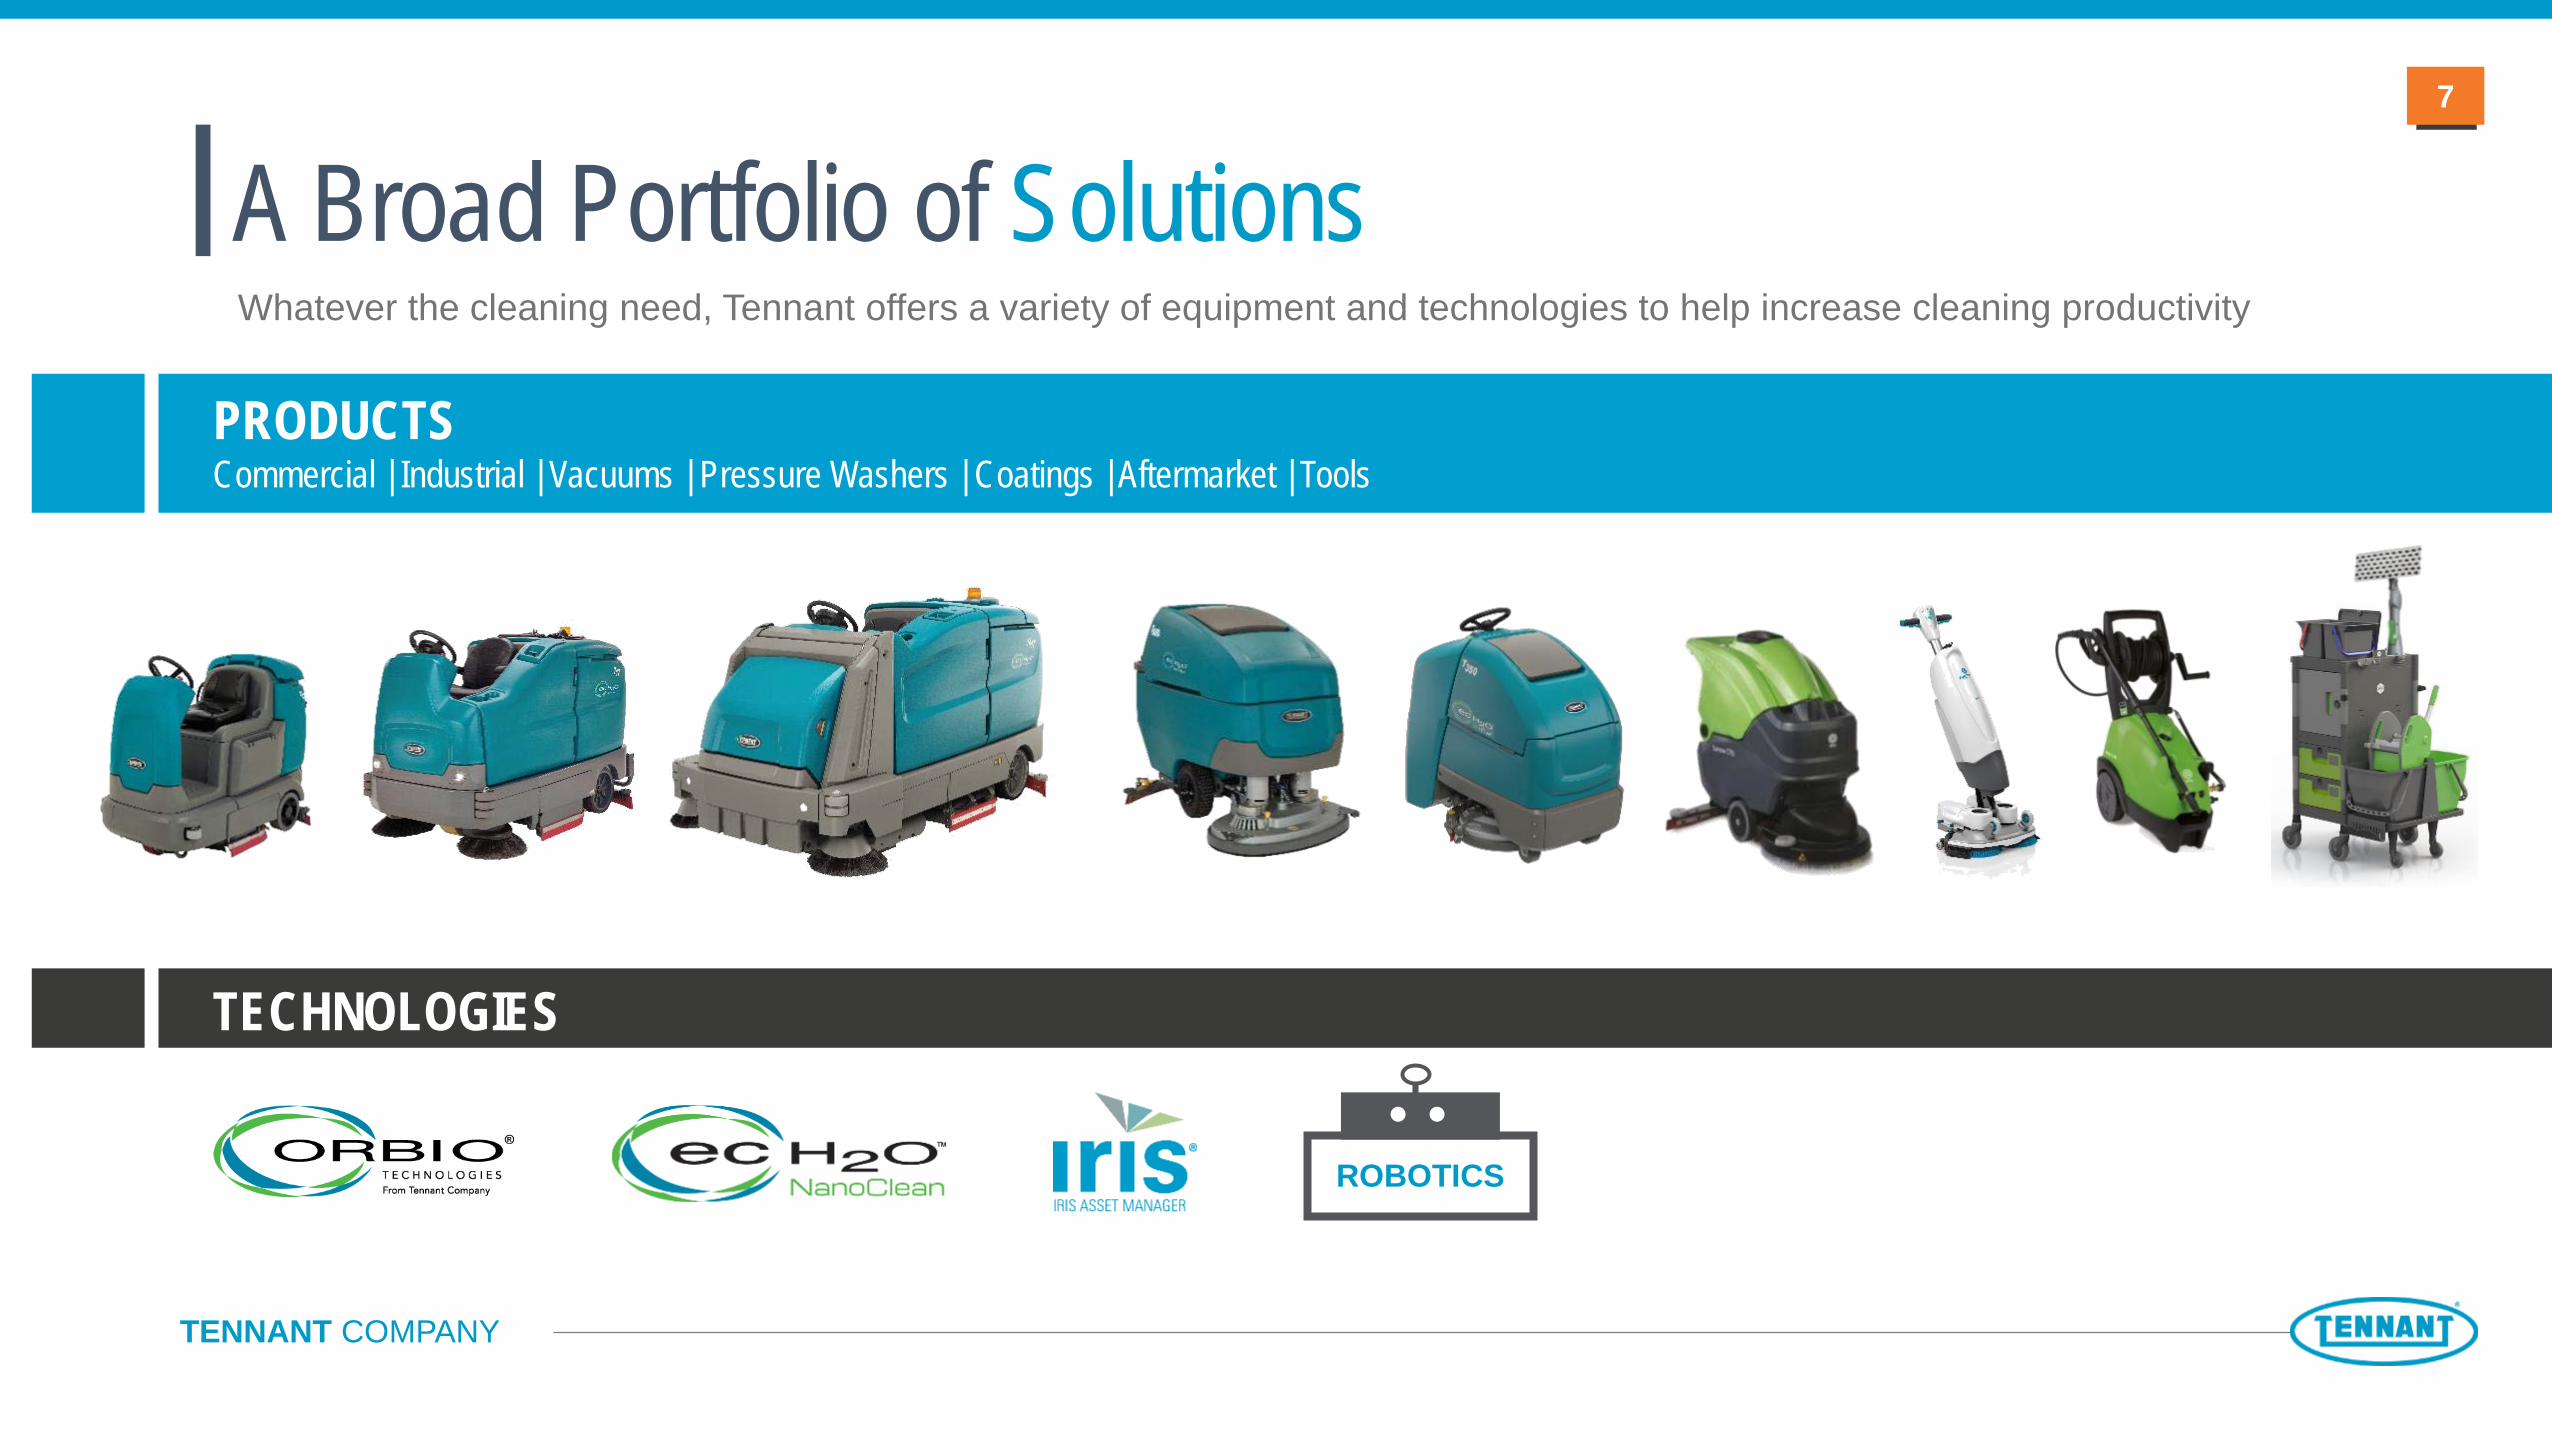
Whatever the cleaning need, Tennant offers a variety of equipment and technologies to help increase cleaning productivity
A Broad Portfolio of Solutions
PRODUCTSCommercial | Industrial | Vacuums | Pressure Washers | Coatings | Aftermarket | Tools
TECHNOLOGIES
ROBOTICS

8
TENNANT COMPANY
CREATING GROWTH
Aftermarket & Recon Support
Extensive Field Service Team Pre-Owned MachinesParts & Consumables
878 Global Direct Service Employees

9
TENNANT COMPANY
Global RevenueNet Sales by PRODUCT GROUP
Global Revenue bySALES CHANNEL
67% 33%
Direct DistributionMore than 500 cross-functional teams & market
specialists
Distribution partners in more than 80 countries around the world
64% 20%
Equipment Parts & Consumables
Equipment MixCommercial – 56%
Industrial – 36%Pre-owned – 3%
All other – 5%
13% 3%
Service Coatings

10
TENNANT COMPANY
Strategic Accounts
Direct Sales
Distribution
Service
e-Commerce
Key Markets Our CustomersOur Channels
How we go to Market
Contract Cleaners Manufacturing
Education Healthcare
Logistics & Warehousing Retail

11
TENNANT COMPANY
20%Tennant | IPC | Nobles | Alfa | Orbio
Nilfisk | Advance | Clarke | Viper
Hako | Minuteman | PowerBoss
Karcher | Windsor | TecServ | ProChem
Taski
of the market consists of others with a market share of 3% or less
18%
12%
9% 3%
38%
Market ShareMARKET SIZE
$5BIncludes only Tennant-like categoriesExcludes power washers & tools

12
TENNANT COMPANY
TENNANT’S FUTURE

13
TENNANT COMPANY
Growth Strategy
DIVERSIFICATION OF REVENUE
STREAMS
TECHNOLOGY LEADERSHIP
COST STRUCTURE OPTIMIZATION
STRENGTHEN FINANCIAL POSITION
IPCINTEGRATION
GROWTH PLAN FOCUS
Diversify our revenue streams by expanding our
sales growth drivers across all geographic
regions and managing our go-to-market strategy to address new customer segments and products
Build on our recognized technology leadership and support our robust new product pipeline
Optimize our cost structure to improve operating efficiency
while continuing to fuel growth investments
Strengthen our financial position and balance solid
cash flow, growth investments, debt
reduction, dividends and share repurchases
Successfully complete the integration of IPC
Focus on our organic growth plans and be open-
minded about the right strategic inorganic growth opportunities with potential
to further enhance shareholder value
$
14
TENNANT COMPANY
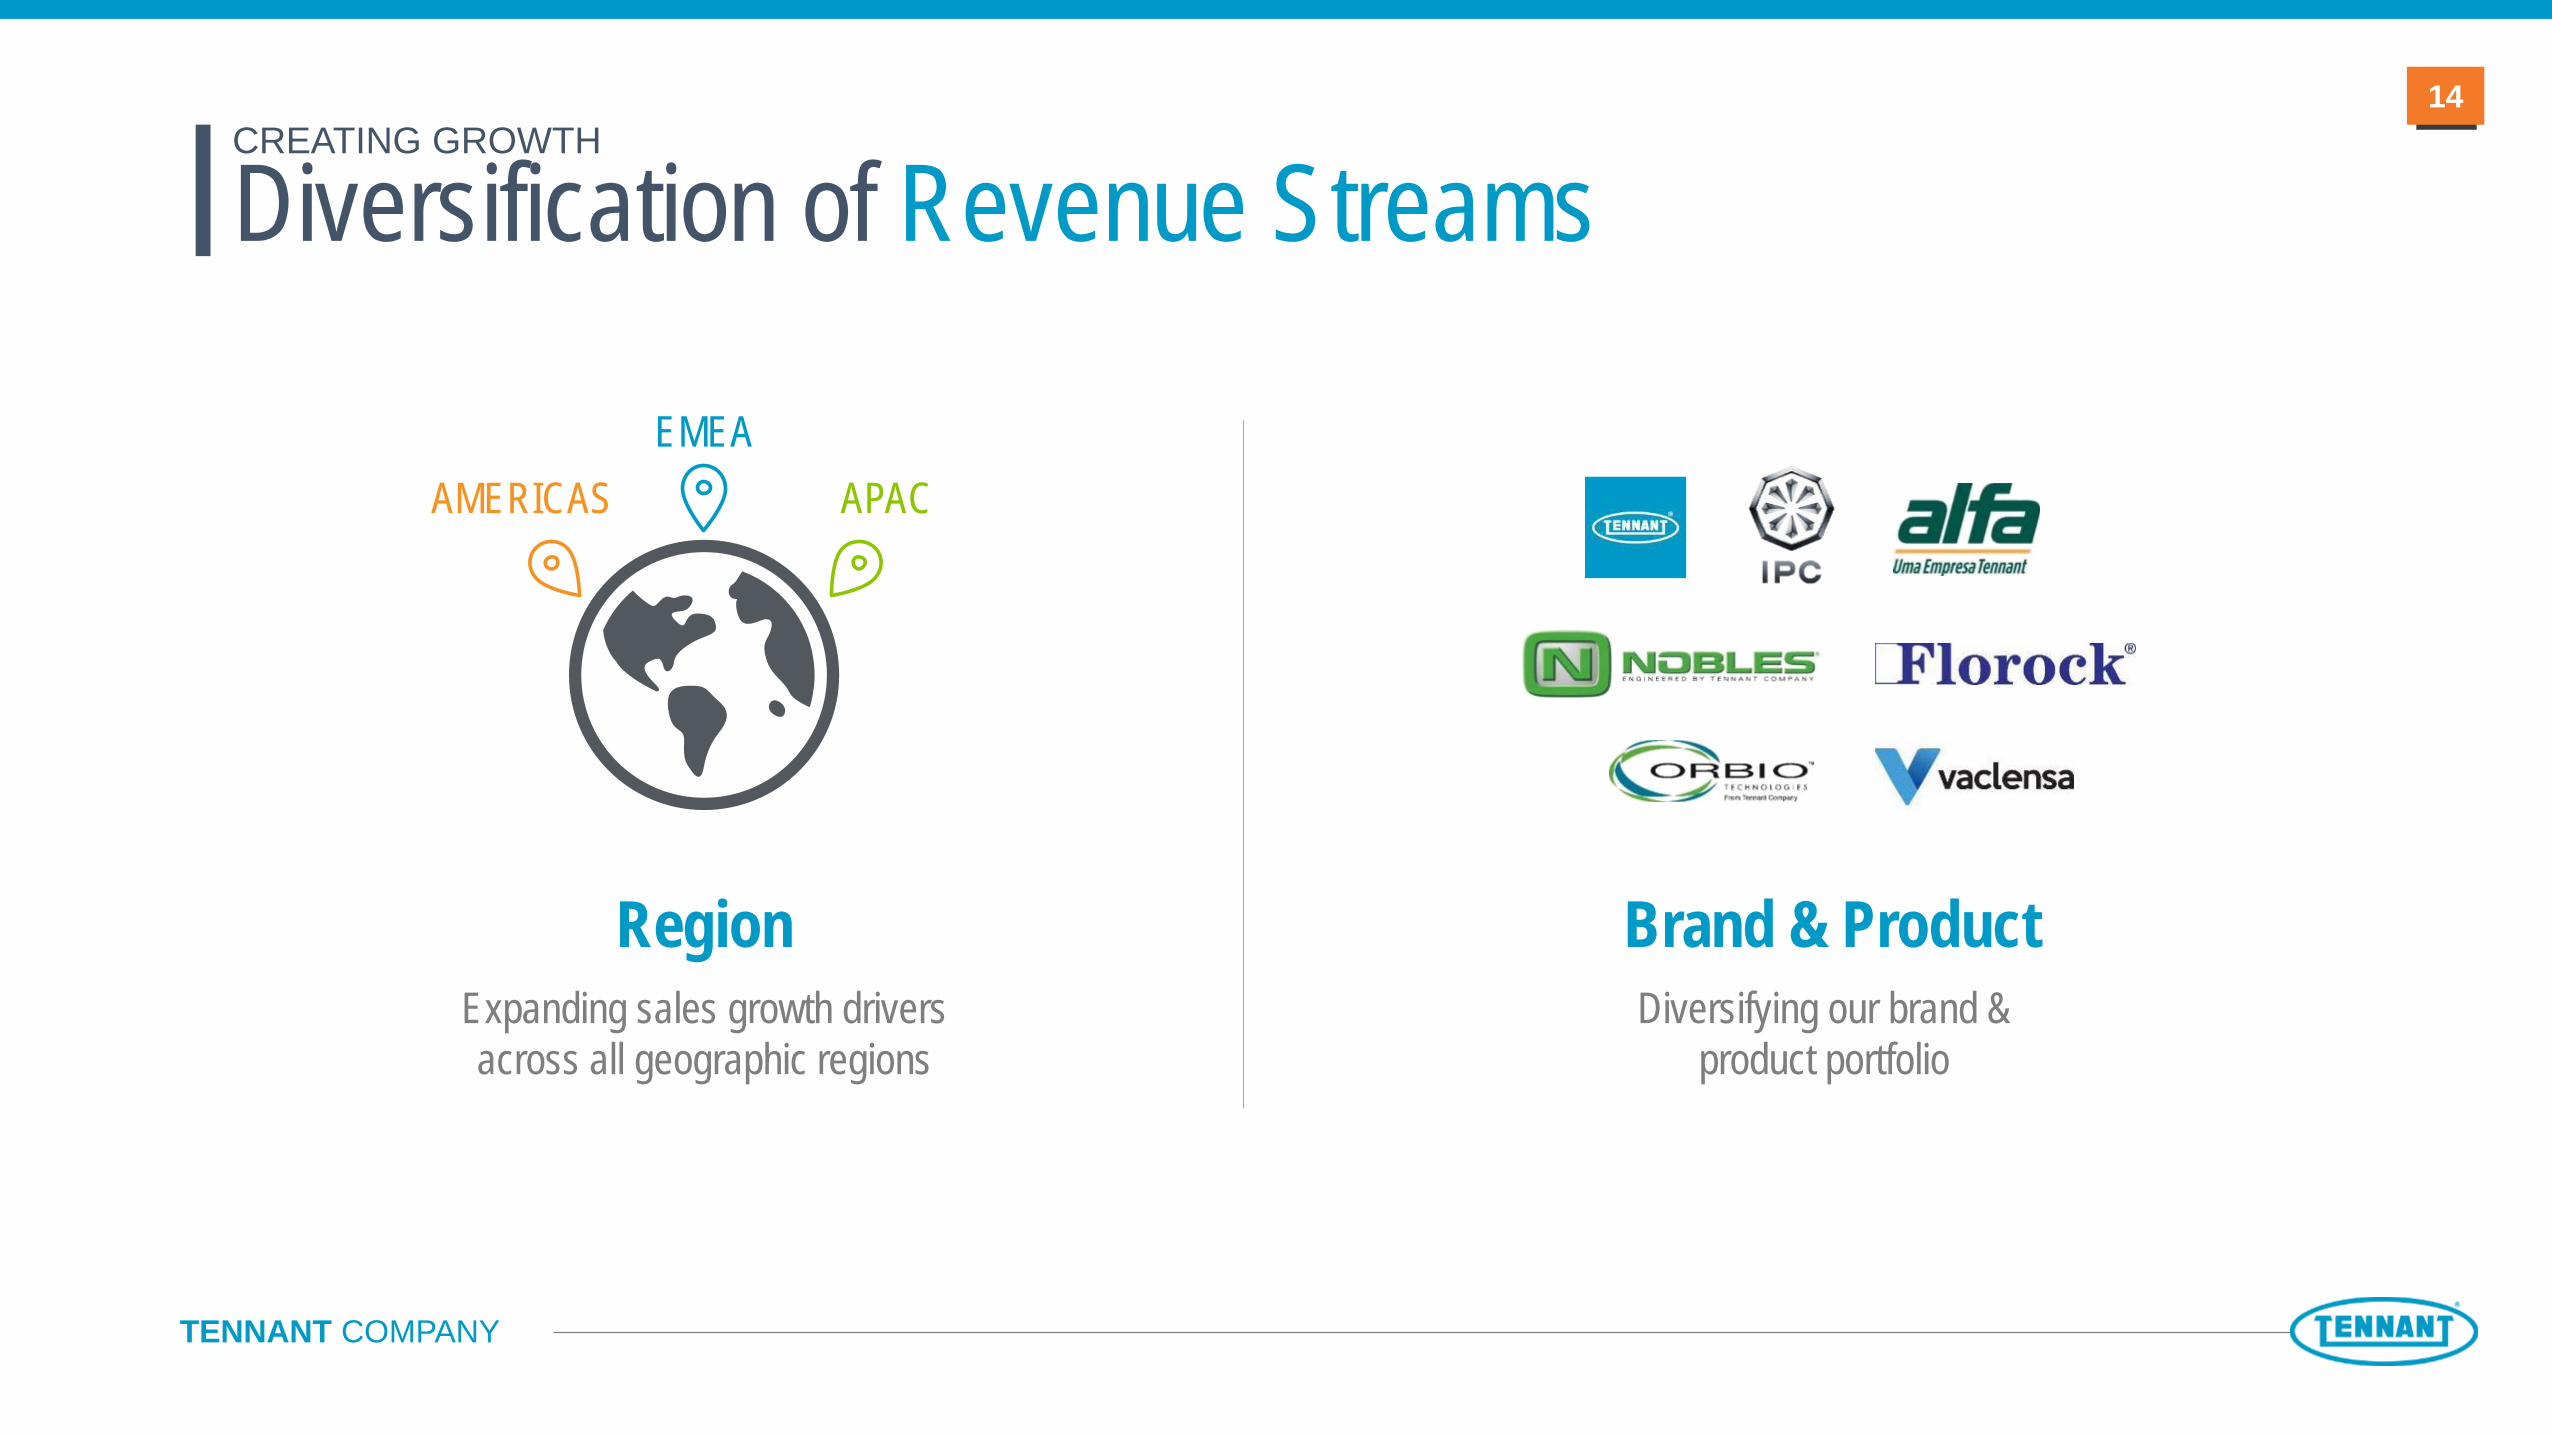
CREATING GROWTH
Diversification of Revenue Streams
RegionExpanding sales growth drivers across all geographic regions
Brand & ProductDiversifying our brand &
product portfolio
AMERICAS APACEMEA

15
TENNANT COMPANY
Growth Strategy Acquisition
CREATING GROWTH
IPC Group
MFG LOCATIONS | 5
COUNTRIES (SALES) | 100+
Revenue by GEOGRAPHY
EMEA 78%
APAC 9%Americas 13%
Revenue by PRODUCT
Sweepers/Scrubbers 27%
Tools/Supplies 18%
Vacuums 17%
High Pressure 15%
Synergy Opportunities►Complementary sales channels►Cross-selling to reach new customers►Cost synergies
Parts & Consum. 14%
Service 9%

16
TENNANT COMPANY
Solving Customer Challenges through Innovation
CREATING GROWTH
Technology Leadership
PROCESS Productivity
TOTAL COST Productivity
MACHINE Productivity
Core Process Innovation
TNC Internal R&D
3rd Party Extension
Supplier Partnership
Joint Development
Technology Research
TennantInnovation
Ecosystem
Drive efficiency in cleaning task
Drive efficiency in cleaning process
Drive efficiency in elimination of task or process
+30% 3-4%New Product Vitality Index
R&D Investment

17
TENNANT COMPANY
FINANCIAL SUMMARY

18
TENNANT COMPANY18
$1,003.1 M$411.7 M$32.0 M
$101.6 M$1.54
$808.6 M$351.6 M$34.7 M$85.7 M$2.59
+24.1%($60.1 M)($2.7 M)+$15.9 M($1.05)
SALESGROSS MARGIN Adjusted*
R&D EXPENSE EBITDA % Adjusted*
EPS Adjusted*
2017 Sales | Gross Margin | R&D | EBITDA | EPS
YTD ‘17 YTD ‘16 CHANGE
*See appendix for Non-GAAP reconciliation.

19
TENNANT COMPANY
Financials Revenue | EBITDA | Adjusted EPS
$822 $812 $809
$1,003$1,080
$0
$200
$400
$600
$800
$1,000
$1,200
2014 2015 2016 2017 2018Guidance
Revenue EBITDA (adjusted)* EPS (adjusted)*
$2.70$2.49
$2.59
$1.54
$1.90
$0.00
$0.50
$1.00
$1.50
$2.00
$2.50
$3.00
2014 2015 2016 2017 2018Guidance
$ Milli
ons
$ Milli
ons
$1.07B to $1.10B (3% Organic)
2018 Guidance$1.80 to $2.002018 Guidance
$111M to $116M (10.5%)2018 Guidance
MidpointMidpoint Midpoint
$91.0$84.5 $85.7
$101.6
$113.5
$0.0
$20.0
$40.0
$60.0
$80.0
$100.0
$120.0
2014 2015 2016 2017 2018Guidance
*See appendix for Non-GAAP reconciliation.

20
TENNANT COMPANY
►Invest in the business
►Manage debt – under 3.0 leverage
►Dividends
►Share repurchase
►Strategic inorganic growth
Free Cash Flow
$45.2
$40.1
$20.8
$32.0
$36.2
$0
$5
$10
$15
$20
$25
$30
$35
$40
$45
$50
2013 2014 2015 2016 2017
$ Milli
ons
Capital Allocation
Operating Cash Flow $59.8 $59.4 $45.2 $57.9 $54.2CapEx ($14.8) ($19.6) ($24.8) ($26.5) ($20.4)
Use of Cash
21
TENNANT COMPANY
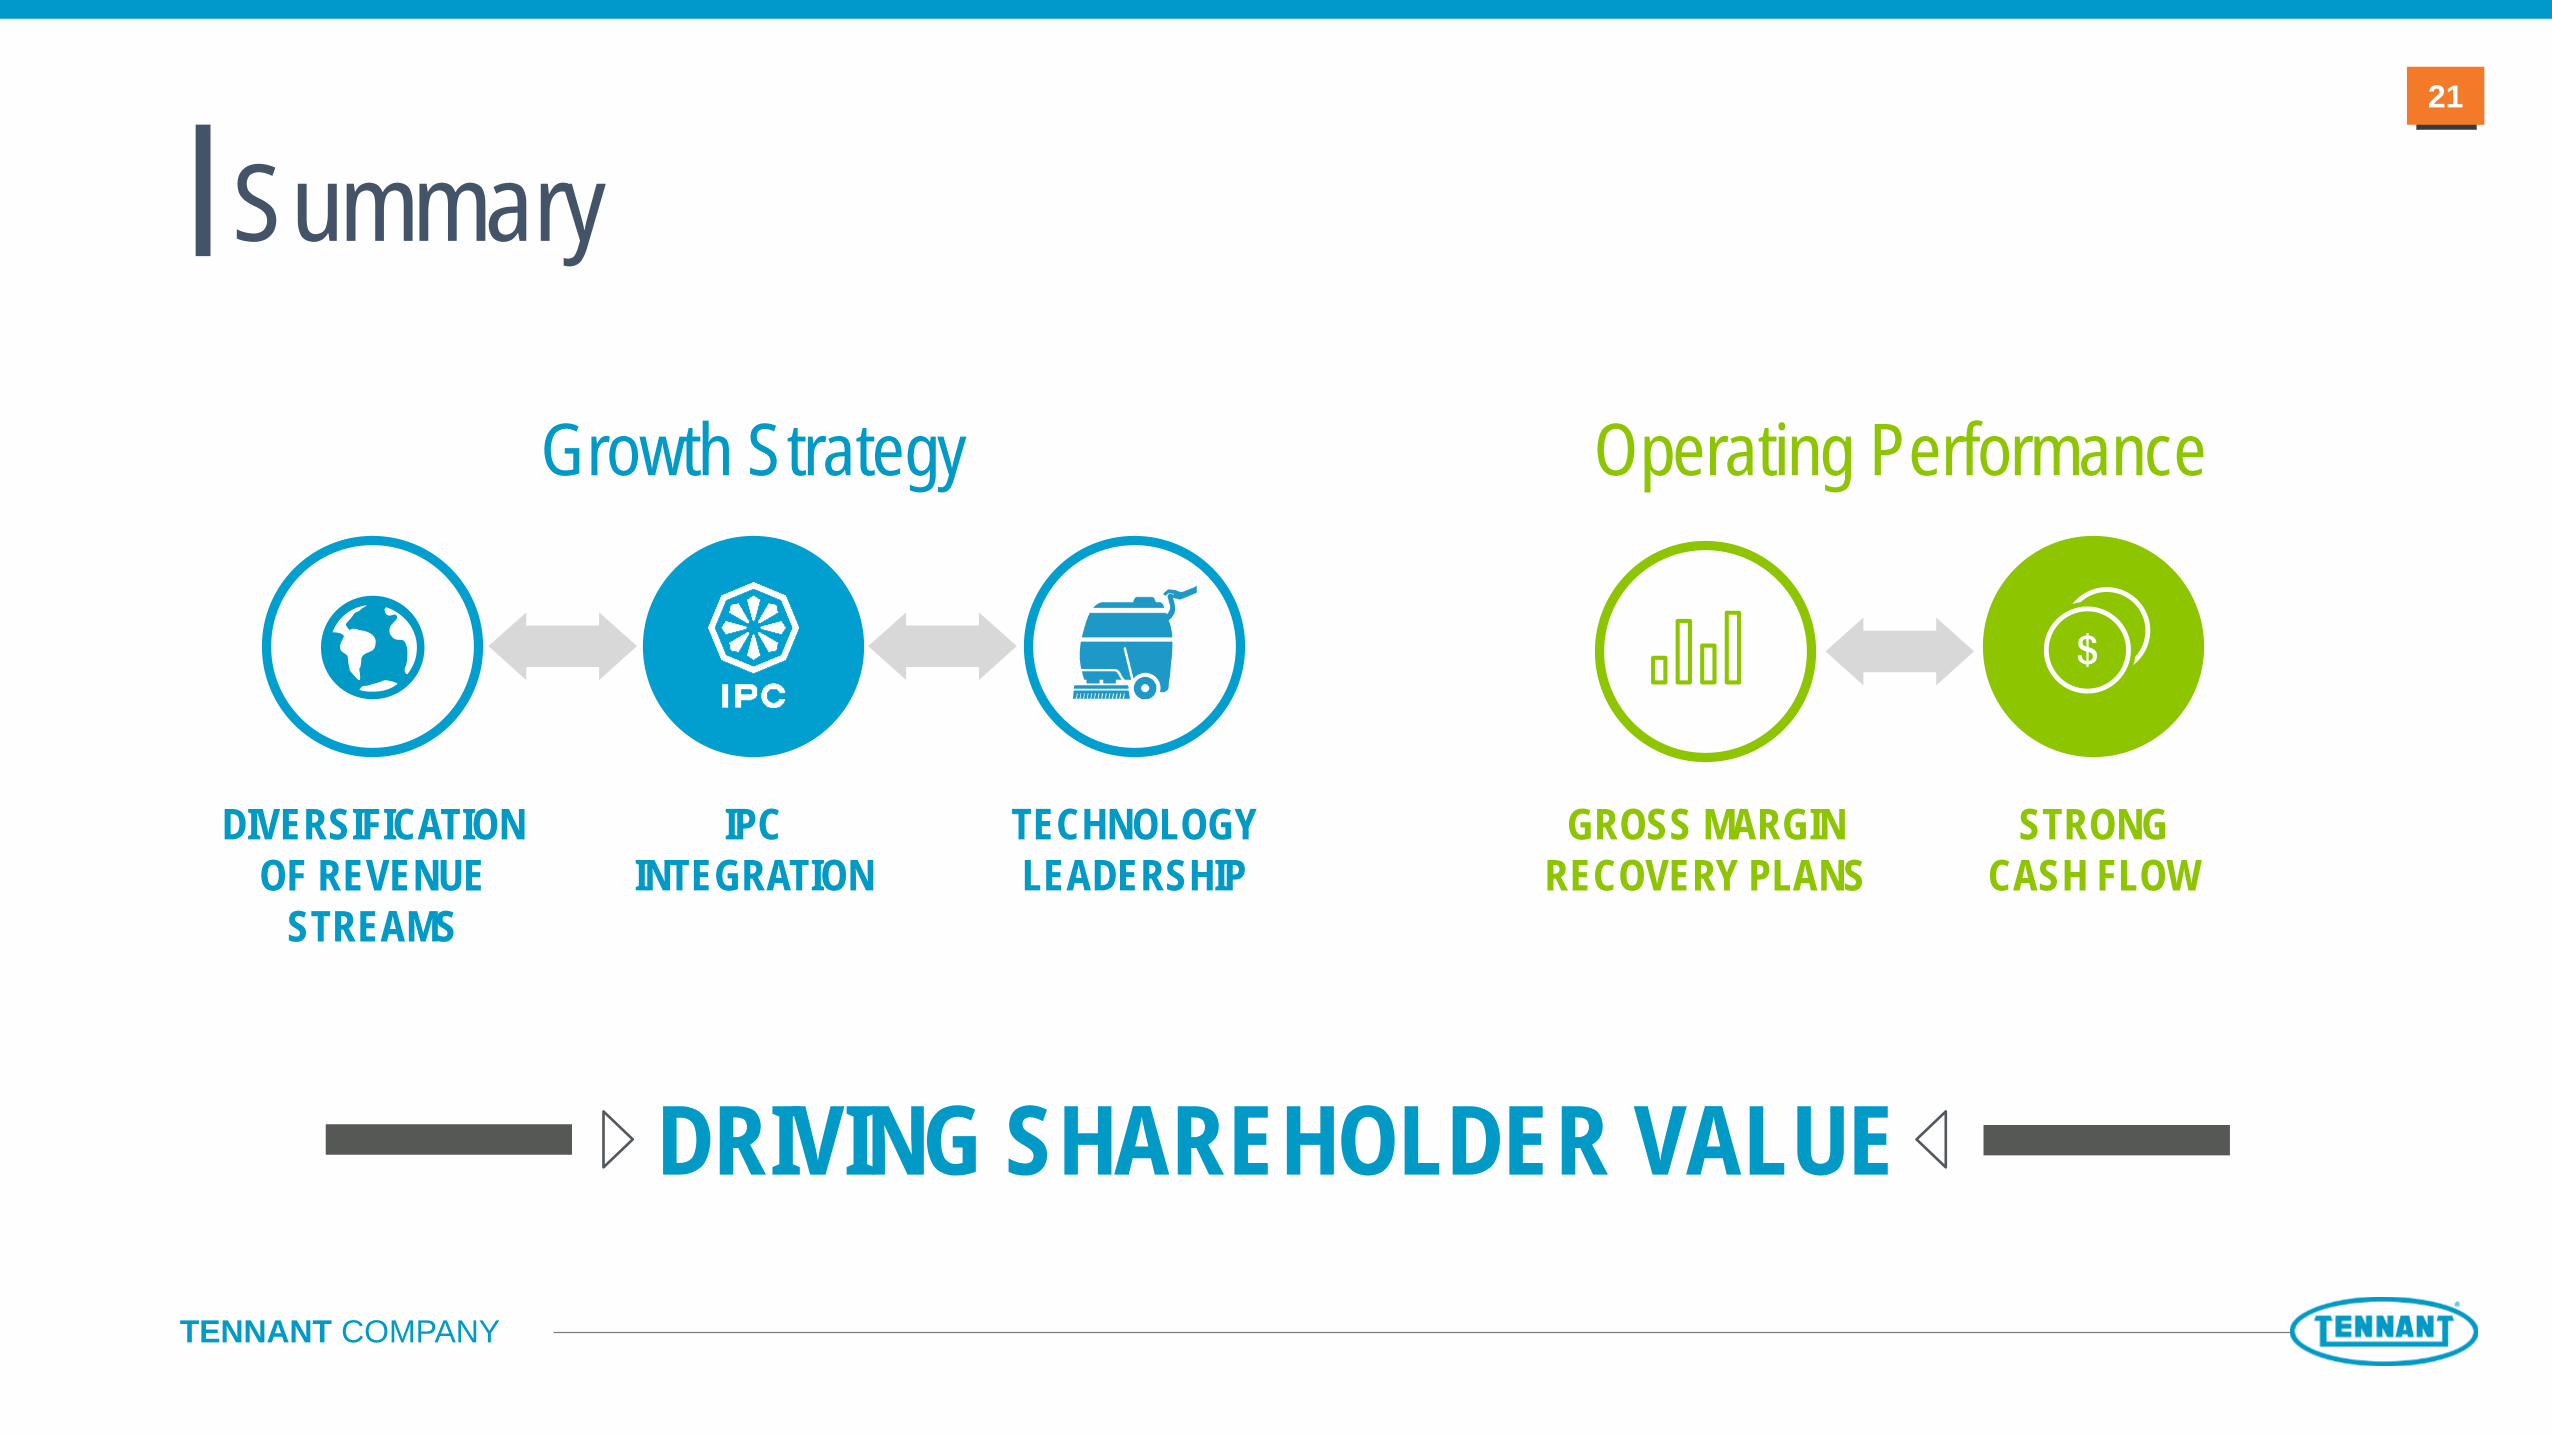
Summary
GROSS MARGIN RECOVERY PLANS
STRONGCASH FLOW
DIVERSIFICATION OF REVENUE
STREAMS
TECHNOLOGY LEADERSHIP
IPCINTEGRATION
Growth Strategy Operating Performance
DRIVING SHAREHOLDER VALUE

22
TENNANT COMPANY
APPENDIX

23
TENNANT COMPANY
Adjusted Earnings Before Interest, Taxes, Depreciation & Amortization up 18.5%
23
$1,003.1 M$101.6 M
10.1%
$808.6 M$85.7 M10.6%
+24.1%+18.5%(50 bps)
SALESEBITDA Adjusted*
EBITDA (% of Sales) Adjusted*
2017 FY EBITDA
FY ‘17 FY ‘16 CHANGE
*See appendix for Non-GAAP reconciliation.

24
TENNANT COMPANY24
$404,421
40.3%
$7,245
$411,666
41.0%
$351,595
43.5%
–
$351,595
43.5%
Gross Profit (as reported)
Gross Margin (as reported)
Adjustments:
Inventory Step-Up
Gross Profit (as adjusted)
Gross Margin (as adjusted)
2017 Non-GAAP ReconciliationDollars – Twelve Months Ended Dec. 31
In thousands20162017

25
TENNANT COMPANY25
($6,195)
$5,237
$7,559
$9,748
$660
$4,020
$4,619
$2,388
$28,036
$46,614
–
–
–
–
–
–
–
$46,614
($0.35)
$.30
$.43
$.55
$.04
$.23
$.26
$.14
($0.06)
$1.54
Net (Loss) Earnings Attributable to Tennant Company per Share (as reported)
Diluted
Adjustments:
Inventory Step-Up
Restructuring Charges
Acquisition Costs (S&A Expense)
Acquisition Costs (Other Expense, Net)
Pension Settlement
Financing Costs
Tax Rate Legislation & Mandatory Repatriation
Adjustment from Impact of Using Diluted Shares
Net Earnings Attributable to Tennant Company per Share (as adjusted)
2017 Non-GAAP Reconciliation
$2.59
–
–
–
–
–
–
–
–
$2.59
Dollars – Twelve Months Ended Dec. 31 Shares – Twelve Months Ended Dec. 31In thousands
2017 2016 2017 2016

26
TENNANT COMPANY26
($6,205)
($2,405)
$25,394
$4,913
$26,199
$17,054
$7,245
$10,519
$11,374
$6,373
$1,178
$101,639
10.1%
$46,614
($330)
$1,279
$19,877
$17,891
$409
–
–
–
–
–
$85,740
10.6%
Net (Loss) Earnings Including Noncontrolling Interest (as reported)
Adjustments:
Interest Income
Interest Expense
Income Tax Expense
Depreciation Expense
Amortization Expense
Inventory Step-Up
Restructuring Charges
Acquisition Costs
Pension Settlement
Acquisition Related Currency Loss
Earnings Before Interest, Taxes, Depreciation & Amortization (as adjusted)
EBITDA Margin (as adjusted)
2017 Non-GAAP ReconciliationDollars – Twelve Months Ended Dec. 31
In thousands2017 2016