temporal evolution of microstructure andrheology …jfeng/publications/pdfs/15_jnnfm.pdftemporal...
TRANSCRIPT
J. Non-Newtonian Fluid Mech. 223, 1-8 (2015) http://dx.doi.org/10.1016/j.jnnfm.2015.05.001
Temporal evolution of microstructure and rheology of sheared
two-dimensional foams
Hadi Mohammadigoushkia and James J. Fengbc∗
We measure the shear rheology of two-dimensional liquid foams in a Couette device, and correlate the vari-
ation of the shear stress with the evolution of the foam microstructure. For a monodisperse foam, inception
of shearing results in a rapid rise of the shear stress, which then saturates into a quasi-steady state of fluctu-
ations about a time-independent mean value. The dominant frequency of the oscillation correlates closely
with the time scale of one row of bubbles sliding past the next row. The mean stress decreases with increas-
ing bubble size. In bidisperse foams, the shear stress exhibits two regimes of transient behavior. If the shear
rate and the large-to-small bubble size ratio are both below certain thresholds, the stress behaves similarly
to that in a monodisperse foam. Above these thresholds, however, the instantaneous shear stress oscillates
around a mean value that declines gradually over several minutes. The foam eventually approaches a quasi-
steady state similar to that of a monodisperse foam. This gradual decrease in shear stress can be attributed to
the size-based segregation of bubbles. Finally, we propose a mixing rule that relates the effective viscosity
of a bidisperse foam in the quasi-steady state to those of monodisperse foams made of the two constituent
bubble sizes.
Keywords: foam, bubble raft, shear thinning, microstructure; lateral migration
1. Introduction
Liquid foams are made of simple ingredients—air, a Newtonian liquid and surfactants—and yet exhibit
complex flow and rheological behavior [1, 2]. Broadly speaking, the key to their mechanical properties
should be sought in the microstructure on the scales of individual bubbles and clusters. Much has been
learned about this structure-property connection in the past few decades [3, 4, 5, 6], but much remains to be
illuminated.
It is well known that a liquid foam is intrinsically unstable. For instance, the structure of a static foam
may coarsen over time as the liquid film drains and ruptures, causing bubble coalescence [7]. Gravity
may aid the liquid drainage [8]. The gas may also diffuse from smaller to larger bubbles through Ostwald
ripening [9]. Finally, bubbles at the foam surface may burst and become lost [10, 11]. When subject to
deformation and flow, foam structure undergoes more dynamic changes [12, 13, 14]. A hallmark event is
the so-called T1 process, when a cluster of four bubbles swap neighbors [15]. Besides, the breakup, coales-
cence, lateral migration and shear-induced diffusion of bubbles may also contribute to the morphological
a Department of Chemical and Biomolecular Engineering, University of California, Berkeley, California 94720, United States.b Department of Chemical and Biological Engineering University of British Columbia, Vancouver, BC V6T 1Z3, Canada; e-mail:
[email protected] Department of Mathematics University of British Columbia, Vancouver, BC V6T 1Z2, Canada.
1

J. Non-Newtonian Fluid Mech. 223, 1-8 (2015) http://dx.doi.org/10.1016/j.jnnfm.2015.05.001
evolution of liquid foam [12, 13, 16, 17, 14].
Previous studies on foam rheology have revealed a similar degree of complexity. For instance, liquid
foams typically exhibit yield stresses, shear thinning, elasticity and normal stress differences [2, 5, 18, 19,
20]. Furthermore, local velocity measurements have indicated that the rheology of foam is non-local; using
the bulk rheology of the foam as a whole may not predict the correct velocity profile [21, 19]. The mismatch
has been ascribed to cooperative motion of bubbles under shear, perhaps in the form of bubble clusters that
move and deform coherently [22, 21]. A potentially related issue is shear banding [23], whose existence in
foam is still controversial [24].
Most of the work cited above investigated either the structure or the rheology of liquid foam. To our
knowledge, only three studies have probed the correspondence between structural and rheological evolu-
tions in sheared liquid foam. Lauridsen et al. [25] demonstrated that for a two-dimensional (2D) foam
undergoing small deformations, T1 events lead to oscillation of the shear stress. Herzhaft [12] sheared a
three-dimensional (3D) polydisperse foam between parallel plates. Upon start of shearing, the shear stress
jumps up almost instantaneously, and then gradually declines in time. The rate of decline seems to be-
come smaller in time, but at the end of the experiment, after 10 minutes of shearing, the stress has not yet
reached steady state. Comparing the foam morphology before and after the shearing, Herzhaft reported
the prevalence of larger bubbles in the middle of the gap and smaller ones at the plates. There is no fur-
ther investigation of the cause of this morphology, e.g., whether the bubbles have segregated according to
size, broken up near the walls or coalesced in the middle. Moreover, it is unclear how the morphological
change has led to the decline in the shear stress. Golemanov et al. [13] performed similar experiments in
a parallel-plate geometry, but reported very different results. If the shear rate is below a certain threshold,
the shear stress quickly attains a constant value after the startup of shear, and shows no further temporal
evolution. Above the threshold, however, the instantaneous stress exhibits a gradual increase over a time of
about 5–10 minutes. At the end, it may or may not have approached a steady state depending on the shear
rate and makeup of the foam. In the meantime, visual observations show that large bubbles tend to break
up into smaller ones because of the shearing. Therefore, they concluded that the breakup of bubbles had
caused the rise in the shear stress.
These experiments offer tantalizing hints at a direct connection between the structural evolution of the
liquid foam and its rheology. Yet, they fail to form a coherent framework for understanding that connection.
In fact, two of the main results on the temporal variation of the shear stress appear to contradict each other
[12, 13]. Hence the motivation for the present study. We will examine the morphology-rheology relation-
ship in well-defined 2D foams under carefully controlled experimental conditions. The two-dimensionality
affords easy visualization of the foam morphology. The main finding of our work is that size-based segrega-
tion in bidisperse foams produces a gradual decline in the shear stress, in apparent agreement with Herzhaft
[12]. This decline happens from all initial foam morphologies tested, somewhat to our surprise.
2. Materials and methods
The preparation of the foams, the setup of the shear cell and the methods of visualization and stress mea-
surement are all similar to those used in recent studies [17, 14, 26]. Therefore we only give a brief overview
in the following. The liquid is a mixture of deionized water, glycerol and dish washing liquid, the com-
position being such as to produce the desired viscosity and foam stability. Bubbles are generated by in-
jecting nitrogen through a micro-needle that is driven by a pico-pump (WPI, model PV-820). The flow
2
J. Non-Newtonian Fluid Mech. 223, 1-8 (2015) http://dx.doi.org/10.1016/j.jnnfm.2015.05.001
rate can be controlled to high precision to yield bubbles of uniform size. Thus the foam is generated one
bubble at a time. Monodisperse foams are made with four different bubble radii: R1 = 0.26± 0.01 mm,
R2 = 0.37±0.02 mm, R3 = 0.44±0.03 mm and R4 = 0.55±0.04 mm. The bidisperse foams are made from
combining two of these bubble species at areal fractions Φi for species Ri, i = 1, . . . ,4. The bubble size ratio
κ is defined as the ratio of the larger bubble to the smaller one. Different initial spatial distributions of the
bubbles can be realized with ease, e.g., with the larger bubbles concentrated at one of the walls or roughly
uniformly distributed throughout the gap. The foam quality, i.e. the total areal fraction of the bubbles, is
kept constant at φ = 0.84 for all the monodisperse and bidisperse foams tested in this study.
The present paper focuses on two aspects of the flow of liquid foam: rheology and microstructural evo-
lution. The custom-made Couette flow cell consists of co-axial cylinders with the inner cylinder mounted
on a commercial rheometer (Malvern Kinexus). The radius of the inner cylinder is Ri = 22 mm and that of
the outer cylinder is Ro = 35 mm. The wide gap allows a large number of bubbles and captures the bulk
rheology and large-scale structure of the foam. Sand papers are glued on both the inner and outer cylin-
ders to prevent slippage of bubbles during measurements. Shear stress is measured at the inner cylinder
with the 2D foam floating on the surface of the Newtonian soap solution. A separate measurement is done
on the liquid alone, without the bubble raft. The latter stress is then subtracted from the former to obtain
the shear stress for the foam. Simultaneously, the microstructure of the foam is monitored using a high-
speed camera (Megaspeed, MS 70K). Moreover, we measure the bubble velocity profile across the gap by
a type of particle image velocimetry. It tracks the bubble position in consecutive exposures and calculates
the bubble velocity via image analysis using PIVlab, an open-source code developed by W. Thielicke and
E. J. Stamhuis [27].
We define a characteristic shear rate as that at the inner cylinder of the Couette device according to the
following formula [28, 26]:
γ = 2ΩΓ
1−Ri2/Ro
2−Ω
1−Γ
ln(Ri/Ro), (1)
where Ω is the rotational rate of the inner cylinder in radians per second, and Γ = d(lnΩ)/d(lnM), M being
the torque on the inner cylinder. In cases where M evolves in time, we have used the time-averaged torque
over the duration of the experiment. The foams yield across the entire gap at shear rates around 0.3 s−1, and
all results to be reported are for higher shear rates in the fully yielded regime. In the following we present
experiments on monodisperse and bidisperse foams in turn.
3. Experimental results: monodisperse foam
3.1. Temporal evolution of shear stress
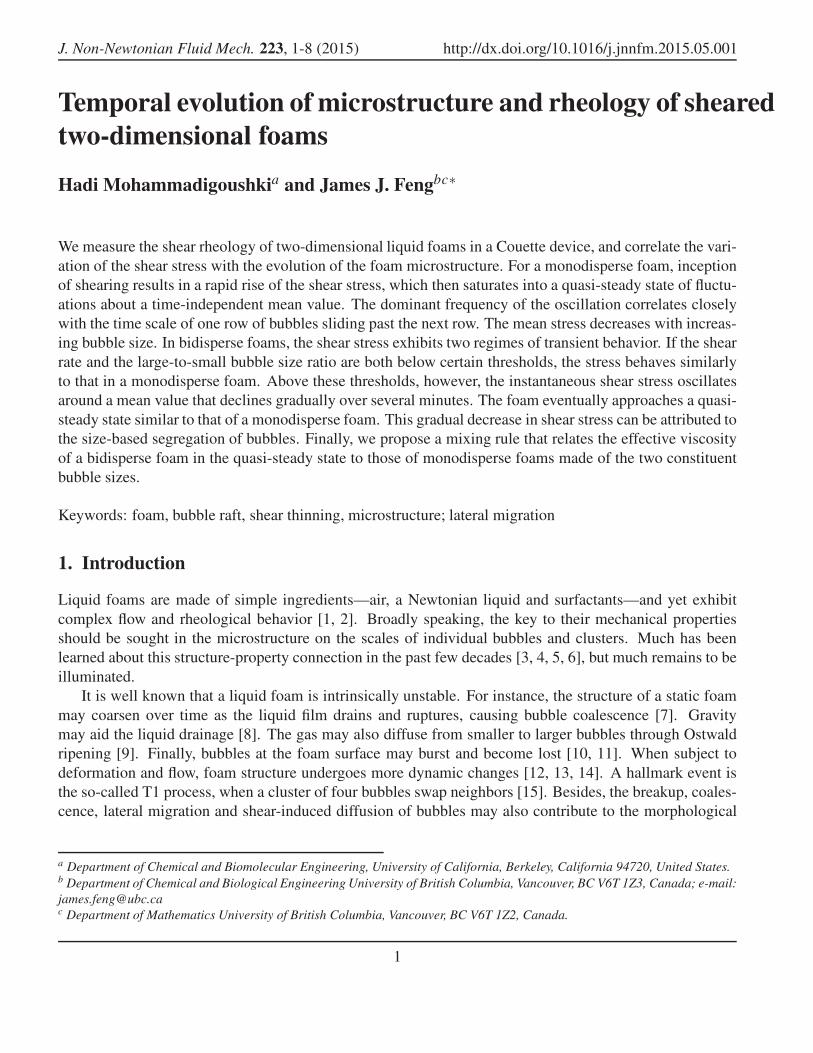
Figure 1 shows the typical behavior of the instantaneous shear stress τi of monodisperse foams after in-
ception of shearing at a constant Ω. The shear stress quickly increases to a “quasi-steady state” in which
it oscillates around a mean value that is more or less constant in time. However, if we perform similar
experiments with the liquid soap solution alone, the shear stress exhibits no oscillation. This implies that
the oscillation originates from the discrete nature of the foam, possibly from bubble rearrangement. The
amplitude of the oscillation is on the order of 10% of the mean stress.
Similar oscillations in the shear stress have been reported by Lauridsen et al. [25] on a polydisperse 2D
foam. They attributed the oscillation to local bubble rearrangement during T1 events. Our experimental
3

J. Non-Newtonian Fluid Mech. 223, 1-8 (2015) http://dx.doi.org/10.1016/j.jnnfm.2015.05.001
0 50 100 150 2000
1
2
3
t (s)
τ i(P
a)
R1 = 0.26 mm, γ = 1.75 (1/s)
R3 = 0.44 mm, γ = 3.5 (1/s)
Liquid, γ = 4 (1/s)
Fig. 1 Temporal evolution of the instantaneous shear stress for two monodisperse foams of different bubble sizes at
different shear rates. The shear stress of the liquid alone is also shown for comparison.
setup differs somewhat. First, in our monodisperse foam, bubbles slide past each other in rows, following a
zig-zag path. This can be viewed as T1 transition happening for rows of bubbles in a synchronized fashion,
and is thus more regular than in polydisperse foams. Second, Lauridsen et al. used much lower shear rates
down to 10−3 s−1, the lower bound approaching the so-called quasi-static limit where viscous dissipation
becomes negligible. Thus, the stress oscillation in their experiment is mostly due to the cyclic buildup and
release of elastic stresses. In our experiments, the shear rates are much higher and viscous dissipation is
important. Nevertheless, the sliding between rows periodically squeezes, shears and stretches the liquid
film between rows of bubbles, thus producing the oscillatory stress.
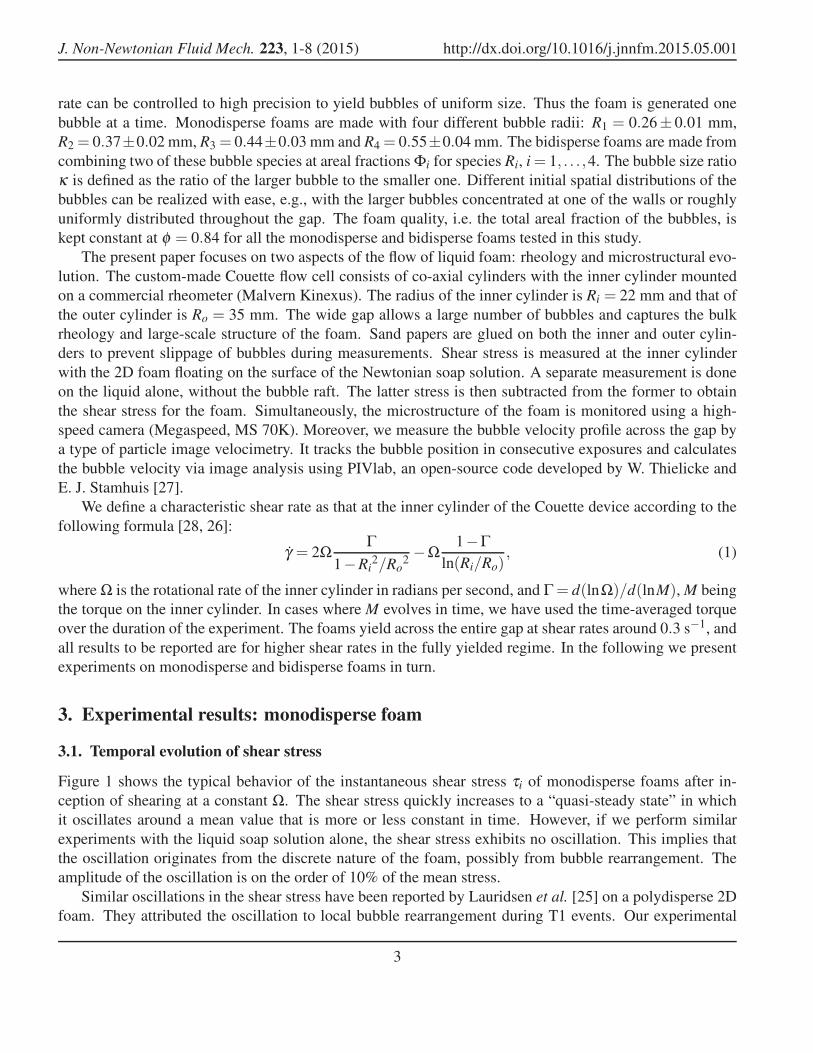
The above discussion suggests that the oscillating stress should exhibit a dominant frequency related
to that of one row of bubbles sliding past the next row. Because of the non-uniformity of the shear rate
across the gap of the Couette device, this frequency differs among different rows, being the highest at the
innermost row. As the stress is measured at the inner cylinder, one expects the sliding between the two
innermost rows to dominate the stress oscillation. To confirm this, we carry out Fast Fourier Transform
on the stress-time signal over a time window of about 100 s with a sampling frequency of 10 Hz. For all
data analyzed, the stress oscillation exhibits a dominant frequency, and an example for R1 = 0.26 mm at
γ = 8.45 s−1 is shown in Fig. 2a. The dominant frequency increases with the shear rate γ roughly linearly.
To be more precise, we scale the dominant frequency by the frequency of T1 events between the two
innermost rows of bubbles. To estimate the period of a T1 transition, we divide the bubble diameter by the
difference in velocity evaluated at the center of the two rows. Figure 2b plots the dimensionless dominant
frequency ωd against the shear rate γ . The dominant frequency agrees with the frequency of the T1 neigh-
bour swap within a factor of 2. The lack of a precise correspondence probably reflects the contribution of
the outer rows in the bubble raft. The scatter in the data may also be partly due to the fact that the bubbles
4
J. Non-Newtonian Fluid Mech. 223, 1-8 (2015) http://dx.doi.org/10.1016/j.jnnfm.2015.05.001
0 1 2 3 4 50
20
40
60
ω (Hz)
Pow
er(d
B/H
z)
(a)
2 4 6 8 100
1
2
3
γ (1/s)
ωd
R1 = 0.26 mm
R2 = 0.37 mm
R3 = 0.44 mm
R4 = 0.55 mm
(b)
Fig. 2 (a) The power spectrum for the stress signal shows a dominant frequency. R1 = 0.26 mm and γ = 8.45 s−1.
(b) Variation of the dimensionless dominant frequency ωd with the shear rate γ for different bubble sizes. The
horizontal line marks the frequency of the T1 transition between the innermost two rows of bubbles.
are slightly deformed and thus the length scales in estimating the frequency of T1 transition are subject to
errors.
3.2. Average shear stress
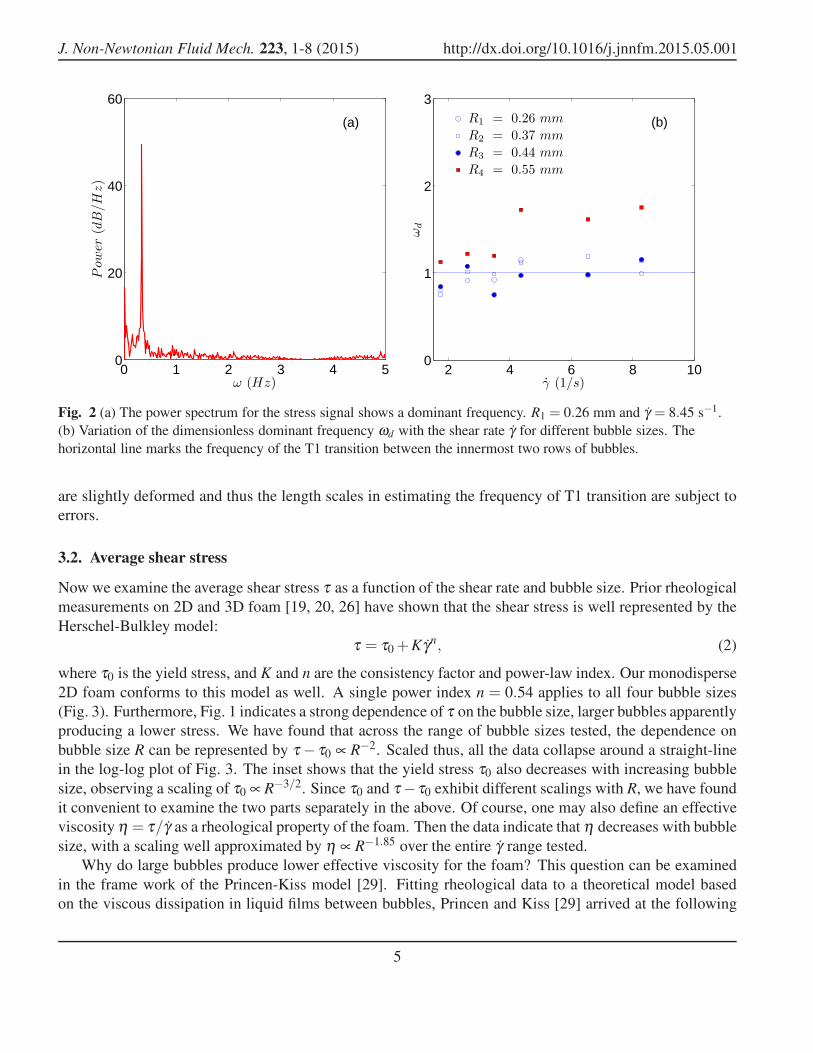
Now we examine the average shear stress τ as a function of the shear rate and bubble size. Prior rheological
measurements on 2D and 3D foam [19, 20, 26] have shown that the shear stress is well represented by the
Herschel-Bulkley model:
τ = τ0 +Kγn, (2)
where τ0 is the yield stress, and K and n are the consistency factor and power-law index. Our monodisperse
2D foam conforms to this model as well. A single power index n = 0.54 applies to all four bubble sizes
(Fig. 3). Furthermore, Fig. 1 indicates a strong dependence of τ on the bubble size, larger bubbles apparently
producing a lower stress. We have found that across the range of bubble sizes tested, the dependence on
bubble size R can be represented by τ − τ0 ∝ R−2. Scaled thus, all the data collapse around a straight-line
in the log-log plot of Fig. 3. The inset shows that the yield stress τ0 also decreases with increasing bubble
size, observing a scaling of τ0 ∝ R−3/2. Since τ0 and τ −τ0 exhibit different scalings with R, we have found
it convenient to examine the two parts separately in the above. Of course, one may also define an effective
viscosity η = τ/γ as a rheological property of the foam. Then the data indicate that η decreases with bubble
size, with a scaling well approximated by η ∝ R−1.85 over the entire γ range tested.
Why do large bubbles produce lower effective viscosity for the foam? This question can be examined
in the frame work of the Princen-Kiss model [29]. Fitting rheological data to a theoretical model based
on the viscous dissipation in liquid films between bubbles, Princen and Kiss [29] arrived at the following
5
J. Non-Newtonian Fluid Mech. 223, 1-8 (2015) http://dx.doi.org/10.1016/j.jnnfm.2015.05.001
100
101
10210
−6
10−5
10−4
γ (1/s)
(τ−
τ 0).R
2(N
)
R1 = 0.26 mm
R2 = 0.37 mm
R3 = 0.44 mm
R4 = 0.55 mm
10−1
100
10−1
100
R (mm)
τ 0(P
a)
Fig. 3 The average shear stress as a function of the shear rate for monodisperse foams of different bubble sizes. The
dash line corresponds to the Herschel-Bulkley model (Eq. 2), with a power law index n = 0.54. The inset shows the
dependence of the yield stress on bubble size, the dash line having a slope of −3/2, and the solid line showing the
prediction of the Prince-Kiss model (Eq. 4).
equations for 3D concentrated emulsions and foams:
τ = τ0 +32σ
RCa1/2(φ −0.73), (3)
τ0 =σ
Rφ 1/3[−0.08−0.114log10(1−φ)], (4)
where φ and σ are the areal fraction and the surface tension of the bubbles, respectively, and Ca= µRγ/σ is
the capillary number defined using the liquid viscosity µ . The main role of the bubble size is in defining the
number of dissipating borders per unit volume. Increasing the bubble size would result in fewer dissipating
borders per unit volume and reduce the total length of these borders. Hence lower viscous dissipation.
Therefore, the larger the bubble size of a foam, the smaller its effective viscosity.
Our measurements in 2D foam bear out the same trend, but there are quantitative differences (c.f. Fig. 3).
For instance, according to Princen and Kiss [29], the stress τ − τ0 should be proportional to γ1/2 and R−1/2
in a 3D foam. In our 2D foam, τ − τ0 shows a similar scaling to the shear rate (τ ∝ γ0.54) but a stronger
scaling to the bubble size (τ ∝ R−2). Furthermore, the yield stress τ0 scales with R−1 in the Princen-Kiss
model, while our data show τ0 ∝ R−3/2. The different scalings with respect to the bubble size probably
reflect the dimensionality of the foam. In our 2D foams, the key parameter is the number of neighboring
bubbles per unit area rather than unit volume.
6
J. Non-Newtonian Fluid Mech. 223, 1-8 (2015) http://dx.doi.org/10.1016/j.jnnfm.2015.05.001
0 0.5 10
5
10
15
20(b) γ = 1.66 s−1
t = 0
s
φ4/Φ
4
0 0.5 10
5
10
15
20γ = 1.66 s−1
t = 10 min
s
φ4/Φ
4
0 0.5 10
5
10
15γ = 5.53 s−1
t = 0
(a)
s
φ4/Φ
4
0 0.5 10
5
10
15γ = 5.53 s−1
t = 10 min
s
φ4/Φ
4
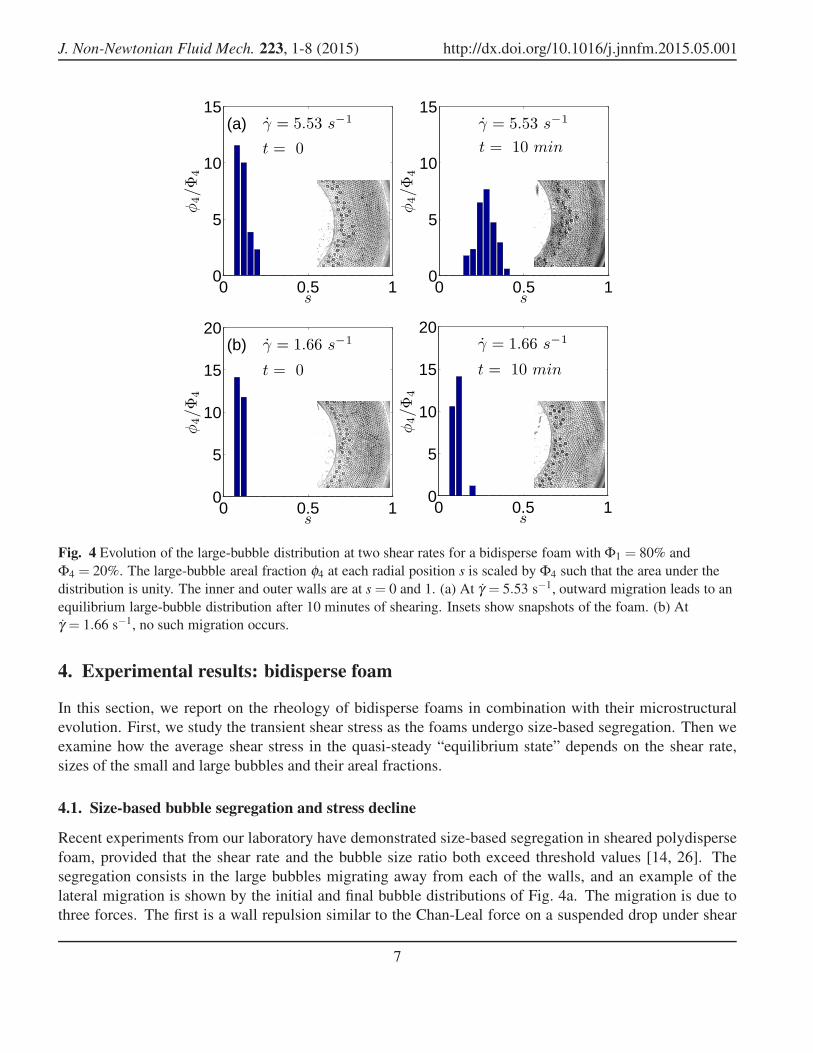
Fig. 4 Evolution of the large-bubble distribution at two shear rates for a bidisperse foam with Φ1 = 80% and
Φ4 = 20%. The large-bubble areal fraction φ4 at each radial position s is scaled by Φ4 such that the area under the
distribution is unity. The inner and outer walls are at s = 0 and 1. (a) At γ = 5.53 s−1, outward migration leads to an
equilibrium large-bubble distribution after 10 minutes of shearing. Insets show snapshots of the foam. (b) At
γ = 1.66 s−1, no such migration occurs.
4. Experimental results: bidisperse foam
In this section, we report on the rheology of bidisperse foams in combination with their microstructural
evolution. First, we study the transient shear stress as the foams undergo size-based segregation. Then we
examine how the average shear stress in the quasi-steady “equilibrium state” depends on the shear rate,
sizes of the small and large bubbles and their areal fractions.
4.1. Size-based bubble segregation and stress decline
Recent experiments from our laboratory have demonstrated size-based segregation in sheared polydisperse
foam, provided that the shear rate and the bubble size ratio both exceed threshold values [14, 26]. The
segregation consists in the large bubbles migrating away from each of the walls, and an example of the
lateral migration is shown by the initial and final bubble distributions of Fig. 4a. The migration is due to
three forces. The first is a wall repulsion similar to the Chan-Leal force on a suspended drop under shear
7
J. Non-Newtonian Fluid Mech. 223, 1-8 (2015) http://dx.doi.org/10.1016/j.jnnfm.2015.05.001
0 200 400 600 8000
2
4
6
8
10
t (s)
τ i(P
a)
γ = 0.55 1/s
γ = 1.66 1/s
γ = 2.76 1/s
γ = 5.53 1/s
γ = 8.31 1/s
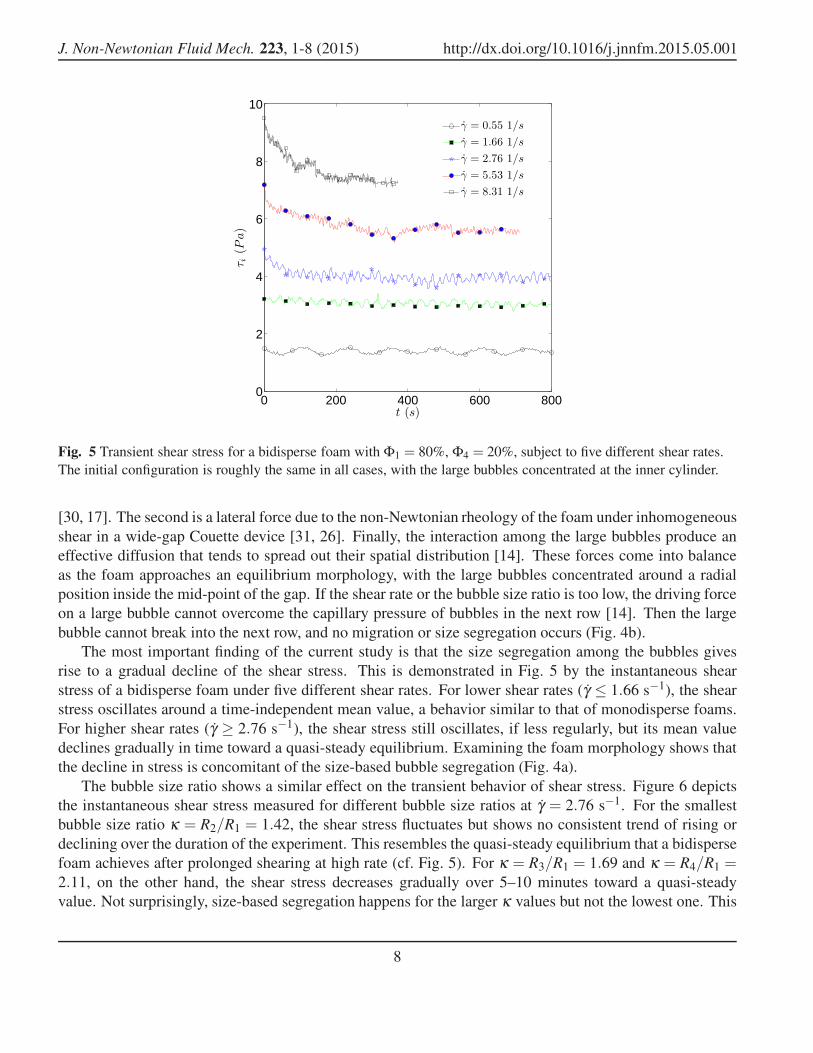
Fig. 5 Transient shear stress for a bidisperse foam with Φ1 = 80%, Φ4 = 20%, subject to five different shear rates.
The initial configuration is roughly the same in all cases, with the large bubbles concentrated at the inner cylinder.
[30, 17]. The second is a lateral force due to the non-Newtonian rheology of the foam under inhomogeneous
shear in a wide-gap Couette device [31, 26]. Finally, the interaction among the large bubbles produce an
effective diffusion that tends to spread out their spatial distribution [14]. These forces come into balance
as the foam approaches an equilibrium morphology, with the large bubbles concentrated around a radial
position inside the mid-point of the gap. If the shear rate or the bubble size ratio is too low, the driving force
on a large bubble cannot overcome the capillary pressure of bubbles in the next row [14]. Then the large
bubble cannot break into the next row, and no migration or size segregation occurs (Fig. 4b).
The most important finding of the current study is that the size segregation among the bubbles gives
rise to a gradual decline of the shear stress. This is demonstrated in Fig. 5 by the instantaneous shear
stress of a bidisperse foam under five different shear rates. For lower shear rates (γ ≤ 1.66 s−1), the shear
stress oscillates around a time-independent mean value, a behavior similar to that of monodisperse foams.
For higher shear rates (γ ≥ 2.76 s−1), the shear stress still oscillates, if less regularly, but its mean value
declines gradually in time toward a quasi-steady equilibrium. Examining the foam morphology shows that
the decline in stress is concomitant of the size-based bubble segregation (Fig. 4a).
The bubble size ratio shows a similar effect on the transient behavior of shear stress. Figure 6 depicts
the instantaneous shear stress measured for different bubble size ratios at γ = 2.76 s−1. For the smallest
bubble size ratio κ = R2/R1 = 1.42, the shear stress fluctuates but shows no consistent trend of rising or
declining over the duration of the experiment. This resembles the quasi-steady equilibrium that a bidisperse
foam achieves after prolonged shearing at high rate (cf. Fig. 5). For κ = R3/R1 = 1.69 and κ = R4/R1 =2.11, on the other hand, the shear stress decreases gradually over 5–10 minutes toward a quasi-steady
value. Not surprisingly, size-based segregation happens for the larger κ values but not the lowest one. This
8

J. Non-Newtonian Fluid Mech. 223, 1-8 (2015) http://dx.doi.org/10.1016/j.jnnfm.2015.05.001
0 200 400 600 800 1000
4
6
8
10
t (s)
τ i(P
a)
κ = R2/R1 = 1.42
κ = R3/R1 = 1.69
κ = R4/R1 = 2.11
Fig. 6 Effect of the bubble size ratio on the evolution of the shear stress for bidisperse foams with 90% of the small
bubble R1, and 10% of large bubbles of three different sizes. The shear rate is the same γ = 2.76 s−1.
provides additional evidence on the correspondence between size-based segregation and temporal evolution
of rheology.
Based on our earlier studies [17, 14], the threshold shear rate for a bubble size ratio R4/R1 = 2.11 is
roughly γ = 1.8 s−1. Figure 5 shows stress decline for γ = 2.76 s−1 but not 1.66 s−1, in agreement with
the previously determined threshold. Similarly, the threshold bubble size ratio for γ = 2.76 s−1 is κ = 1.85.
This is somewhat above κ = R3/R1 = 1.69 for which stress decline occurs in Fig. 6. But considering
the uncertainties in the bubble sizes, R1 = 0.26± 0.01 mm and R3 = 0.44± 0.03 mm, the difference is
insignificant, and the overall behavior of Fig. 6 is consistent with the threshold in bubble size ratio. Also
note that larger κ produces faster approach to the final equilibrium; this is due to faster bubble migration
and segregation [14]. Increasing the shear rate does not seem to have a similar effect in Fig. 5. Although
the large bubbles migrate faster at higher γ , they also have a longer distance to go to reach the more peaked
equilibrium distribution [14]. The two effects tend to cancel each other.
Conceivably, different foam morphologies, i.e., different distributions of the large bubbles in the sea
of small bubbles, entail larger or smaller viscous dissipation in the system when sheared. Thus, when the
morphology evolves, so should the measured shear stress. Then the question arises as to which morpholo-
gies are the most and least costly in terms of energy dissipation. In monodisperse foam, the shear stress
decreases with bubble size (Fig. 1), and larger bubbles seem to be less dissipative. Based on this, one may
expect that placing the large bubbles at the inner cylinder, where the shear rate is the highest, should mini-
mize energy dissipation. To test this hypothesis, we monitor the stress transient for foams of different initial
morphologies, with the large bubbles initially concentrated near the inner cylinder, the outer cylinder, or
more or less uniformly distributed throughout the gap (Fig. 7). As we have anticipated, having the large
9
J. Non-Newtonian Fluid Mech. 223, 1-8 (2015) http://dx.doi.org/10.1016/j.jnnfm.2015.05.001
0 200 400 600 800
6
8
10
t (s)
τ i(P
a)
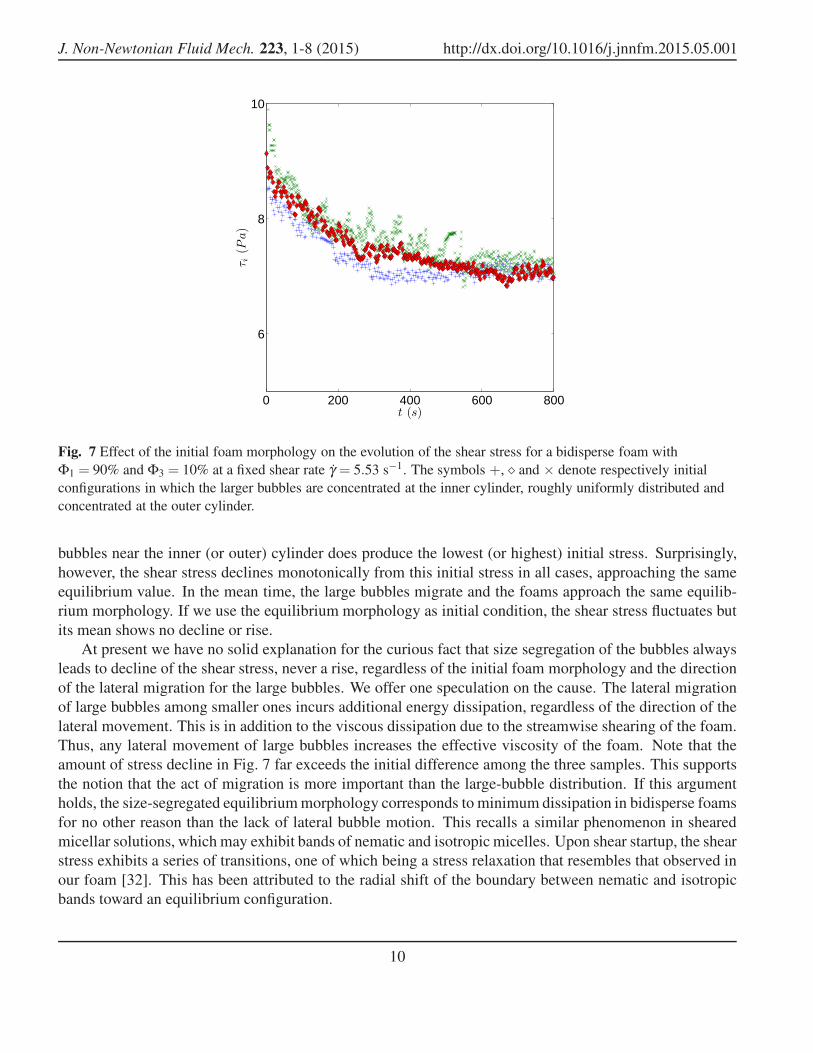
Fig. 7 Effect of the initial foam morphology on the evolution of the shear stress for a bidisperse foam with
Φ1 = 90% and Φ3 = 10% at a fixed shear rate γ = 5.53 s−1. The symbols +, ⋄ and × denote respectively initial
configurations in which the larger bubbles are concentrated at the inner cylinder, roughly uniformly distributed and
concentrated at the outer cylinder.
bubbles near the inner (or outer) cylinder does produce the lowest (or highest) initial stress. Surprisingly,
however, the shear stress declines monotonically from this initial stress in all cases, approaching the same
equilibrium value. In the mean time, the large bubbles migrate and the foams approach the same equilib-
rium morphology. If we use the equilibrium morphology as initial condition, the shear stress fluctuates but
its mean shows no decline or rise.
At present we have no solid explanation for the curious fact that size segregation of the bubbles always
leads to decline of the shear stress, never a rise, regardless of the initial foam morphology and the direction
of the lateral migration for the large bubbles. We offer one speculation on the cause. The lateral migration
of large bubbles among smaller ones incurs additional energy dissipation, regardless of the direction of the
lateral movement. This is in addition to the viscous dissipation due to the streamwise shearing of the foam.
Thus, any lateral movement of large bubbles increases the effective viscosity of the foam. Note that the
amount of stress decline in Fig. 7 far exceeds the initial difference among the three samples. This supports
the notion that the act of migration is more important than the large-bubble distribution. If this argument
holds, the size-segregated equilibrium morphology corresponds to minimum dissipation in bidisperse foams
for no other reason than the lack of lateral bubble motion. This recalls a similar phenomenon in sheared
micellar solutions, which may exhibit bands of nematic and isotropic micelles. Upon shear startup, the shear
stress exhibits a series of transitions, one of which being a stress relaxation that resembles that observed in
our foam [32]. This has been attributed to the radial shift of the boundary between nematic and isotropic
bands toward an equilibrium configuration.
10

J. Non-Newtonian Fluid Mech. 223, 1-8 (2015) http://dx.doi.org/10.1016/j.jnnfm.2015.05.001
0 2 4 6 8 100
1
2
3
γ (1/s)
ωd
Φ1 = 90%, Φ2 = 10%
Φ1 = 90%, Φ3 = 10%
Φ1 = 70%, Φ3 = 30%
Φ1 = 90%, Φ4 = 10%
Φ1 = 80%, Φ4 = 20%
Φ1 = 70%, Φ4 = 30%
Fig. 8 The dimensionless dominant frequency of stress oscillation over the range of the shear rate for six bidisperse
foams of different bubble sizes and area fractions. The horizontal line shows the frequency of the T1 transition
between the two rows of bubbles next to the inner cylinder.
Finally, Herzhaft [12] reported similar stress relaxation in polydisperse 3D foam sheared between par-
allel plates. Initially, the bubbles of different sizes are well mixed and randomly positioned in space. At the
end of roughly 10 minutes of shearing, the morphology of the foam, viewed at the edge of the parallel-plate
device, shows a predominance of larger bubbles in the middle of the gap and smaller ones near the two
plates. Herzhaft [12] did not explore the cause of the morphological change, nor the mechanism for the
stress decline. In the light of our findings in the 2D foams, size-based segregation may have occurred in
the 3D foam as well, and that may have caused the gradual decline in the shear stress reported by Herzhaft
[12].
4.2. Equilibrium state
Once the foam morphology has evolved into an equilibrium state, the shear stress fluctuates around a mean
value that no longer changes in time. This behavior resembles that of monodisperse foams as well as
bidisperse foams that do not experience size segregation. As for monodisperse foams, the stress fluctuation
can be quantified by Fast Fourier Transform. Figure 8 shows the dominant frequency for six bidisperse
foams over the range of shear rates tested. Similar to Fig. 2b, the dominant frequency ωd has been made
dimensionless by the frequency of T1 transition between the two innermost rows of small bubbles. In the
equilibrium morphology, the large bubbles are concentrated in the middle of the gap and stay clear of these
inner rows. We again see an agreement between the two frequencies to within a factor of 2, for foams
of different large-bubble sizes and area fractions. The largest bubbles (R4) appear to produce the highest
frequencies. But the intermediate bubbles (R3) have a slightly lower frequency than the smallest ones (R2).
Thus, there is no clear-cut trend in how ωd varies with the large-bubble size.
11
J. Non-Newtonian Fluid Mech. 223, 1-8 (2015) http://dx.doi.org/10.1016/j.jnnfm.2015.05.001
0 2 4 6 8 100
2
4
6
8
γ (1/s)
τ(P
a)
Φ1 = 100%
Φ1 = 90%, Φ3 = 10%
Φ1 = 60%, Φ3 = 40%
Φ3 = 100%
(a)
0 2 4 6 8 100
2
4
6
8
γ (1/s)
τ(P
a)
Φ1 = 100%
Φ1 = 90%, Φ4 = 10%
Φ1 = 70%, Φ4 = 30%
Φ4 = 100%
(b)
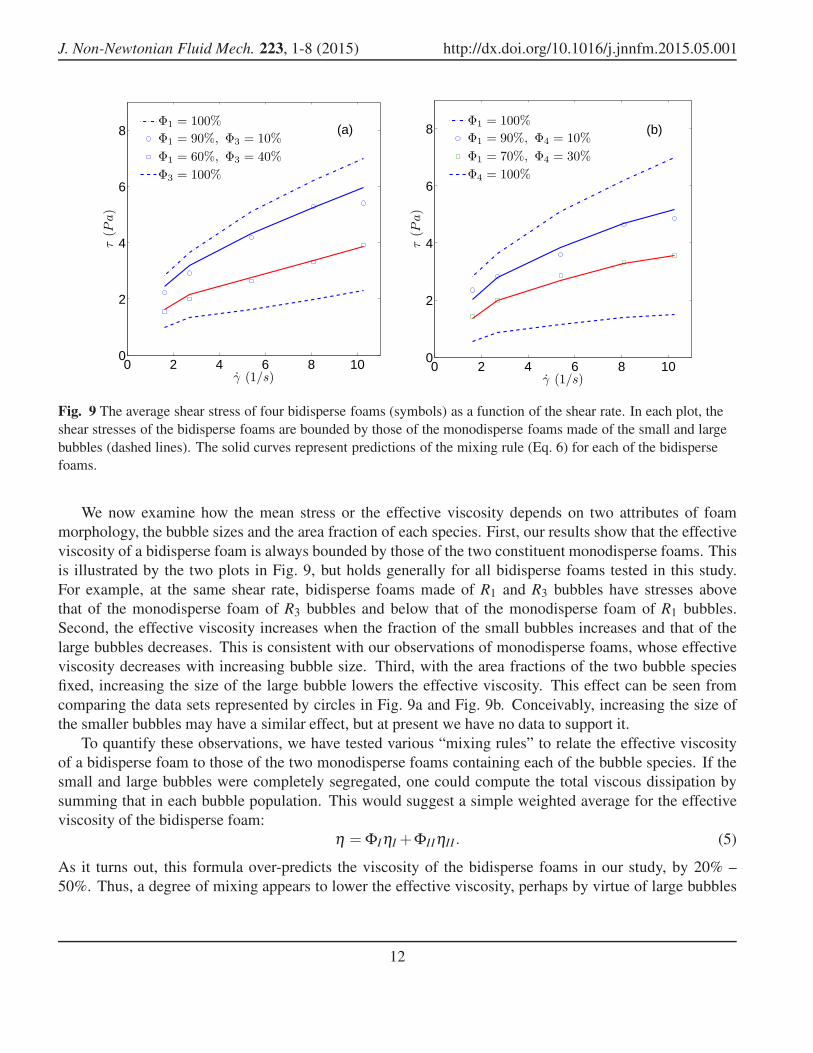
Fig. 9 The average shear stress of four bidisperse foams (symbols) as a function of the shear rate. In each plot, the
shear stresses of the bidisperse foams are bounded by those of the monodisperse foams made of the small and large
bubbles (dashed lines). The solid curves represent predictions of the mixing rule (Eq. 6) for each of the bidisperse
foams.
We now examine how the mean stress or the effective viscosity depends on two attributes of foam
morphology, the bubble sizes and the area fraction of each species. First, our results show that the effective
viscosity of a bidisperse foam is always bounded by those of the two constituent monodisperse foams. This
is illustrated by the two plots in Fig. 9, but holds generally for all bidisperse foams tested in this study.
For example, at the same shear rate, bidisperse foams made of R1 and R3 bubbles have stresses above
that of the monodisperse foam of R3 bubbles and below that of the monodisperse foam of R1 bubbles.
Second, the effective viscosity increases when the fraction of the small bubbles increases and that of the
large bubbles decreases. This is consistent with our observations of monodisperse foams, whose effective
viscosity decreases with increasing bubble size. Third, with the area fractions of the two bubble species
fixed, increasing the size of the large bubble lowers the effective viscosity. This effect can be seen from
comparing the data sets represented by circles in Fig. 9a and Fig. 9b. Conceivably, increasing the size of
the smaller bubbles may have a similar effect, but at present we have no data to support it.
To quantify these observations, we have tested various “mixing rules” to relate the effective viscosity
of a bidisperse foam to those of the two monodisperse foams containing each of the bubble species. If the
small and large bubbles were completely segregated, one could compute the total viscous dissipation by
summing that in each bubble population. This would suggest a simple weighted average for the effective
viscosity of the bidisperse foam:
η = ΦIηI +ΦIIηII. (5)
As it turns out, this formula over-predicts the viscosity of the bidisperse foams in our study, by 20% –
50%. Thus, a degree of mixing appears to lower the effective viscosity, perhaps by virtue of large bubbles
12
J. Non-Newtonian Fluid Mech. 223, 1-8 (2015) http://dx.doi.org/10.1016/j.jnnfm.2015.05.001
shielding smaller ones as observed before [17]. In the end, we find the “harmonic weighted average”
1
η=
ΦI
ηI+
ΦII
ηII(6)
to predict accurately the effective viscosity of a bidisperse foam. Its predictions have been shown for the
four bidisperse foams in Fig. 9, and it applies equally well to the other compositions that we have tested.
5. Summary
We have studied the rheological and structural evolution of monodisperse and bidisperse 2D foams in a
wide-gap Couette shear cell. We are interested in the morphology-rheology relationship in fully yielded
foams. The main experimental findings can be summarized as follows.
(a) In a monodisperse foam, the shear stress oscillates about an average stress that does not change
in time. The oscillation stems from the zigzag motion of a bubble over the next row of bubbles,
as neighboring rows slide past each other. Its frequency correlates closely with that of neighbor-
swapping T1 transitions between the first two rows of bubbles next to the inner cylinder.
(b) In a monodisperse foam, the average shear stress varies with the shear rate according to the Herschel-
Bulkley model. Moreover, with the bubble areal fraction kept constant, the effective viscosity of the
foam decreases with increasing bubble size. This is because increasing the bubble size decreases the
number of dissipating borders between bubbles.
(c) Bidisperse foams exhibit two regimes of dynamics under shear. If the shear rate and large-to-small
bubble size ratio are both below threshold values, the shear stress behaves similarly to that of a
monodisperse foam. Above these thresholds, however, the shear stress oscillates about a mean that
decreases in time toward a constant equilibrium stress.
(d) The decline of the mean stress or effective viscosity corresponds to the spatial segregation of the
two bubble species, and the quasi-steady state reached in the end corresponds to the equilibrium
morphology of the foam, with small bubbles at the two walls and large bubbles concentrated in the
middle. The thresholds in shear rate and bubble size ratio agree with those previously established for
bubble segregation.
(e) The decline in effective viscosity has been observed from all initial bubble distributions tested, except
when the initial morphology is the equilibrium one already. We hypothesize that the lateral migration
of large bubbles incurs viscous dissipation and contributes to the shear viscosity. Thus, the effective
viscosity declines as the intensity of lateral migration falls in time.
(f) In the quasi-steady state of a bidisperse foam, the dominant frequency of stress fluctuation correlates
well with that of the T1 transition of the innermost two rows of small bubbles. The effective viscosity
falls between those of two monodisperse foams made of each of the two constituent bubble species.
We propose a mixing rule that predicts the effective viscosity of the bidisperse foam from those of
the monodisperse foams.
Harking back to the motivation and objective of this study, we have established a clear connection be-
tween one type of morphological evolution—bubble segregation by size—and changes in foam rheology.
13

J. Non-Newtonian Fluid Mech. 223, 1-8 (2015) http://dx.doi.org/10.1016/j.jnnfm.2015.05.001
This is achieved in a purposely simplified geometry where the two-dimensionality of the foam allows un-
ambiguous observation and interpretation of the foam structure. In this light, we surmise that shear-induced
bubble segregation may have caused the stress relaxation in the 3D polydisperse foam of Herzhaft [12] as
well. The same methodology may be extended to 3D foams undergoing other types of structural changes in
more complex flows. Such experiments will lead to a more coherent understanding of how microstructural
and rheological changes are coupled together in this quintessential type of soft matter.
6. Acknowledgement
This study was supported by NSERC, the Canada Research Chair program, and the Canada Foundation for
Innovation. JJF acknowledges additional support by the Peter Wall Institute for Advanced Studies during
his tenure as Wall Scholar.
References
1 A. M. Kraynik, Foam flows, Annu. Rev. Fluid Mech. 20 (1988) 325–57.
2 R. Hohler, S. Cohen-Addad, Rheology of liquid foam., J. Phys. Condens. Matter 17 (2005) R1041–R1069.
3 D. Weaire, N. Rivier, Soap, cells and statistics - random patterns in two dimensions, Contemp. Phys. 25 (1984) 59–99.
4 J. A. Glazier, D. Weaire, The kinetics of cellular patterns, J. Phys. Condens. Matter 4 (1992) 1867–1894.
5 T. Okuzono, K. Kawasaki, T. Nagai, Rheology of random foams., J. Rheol. 37 (1993) 571–586.
6 M. B. Sexton, M. E. Mobius, S. Hutzler, Bubble dynamics and rheology in sheared two-dimensional foams, Soft Matter 7
(2011) 11252.
7 A. Bhakta, E. Ruckenstein, Drainage and coalescence in standing foams, J. Colloid Interface Sci. 191 (1) (1997) 184–201.
8 V. Carrier, A. Colin, Coalescence in draining foams, Langmuir 19 (11) (2003) 4535–4538.
9 N. Louvet, F. Rouyer, O. Pitois, Ripening of a draining foam bubble, J. Colloid Interface Sci. 334 (2009) 82–86.
10 N. Vandewalle, J. F. Lentz, Cascades of popping bubbles along air/foam interfaces, Phys. Rev. E 64 (2001) 021507.
11 H. Ritacco, F. Kiefer, D. Langevin, Lifetime of bubble rafts: Cooperativity and avalanches, Phys. Rev. Lett. 98 (2007)
244501.
12 B. Herzhaft, Correlation between transient shear experiments and structure evolution of aqueous foams, J. Colloid Interface
Sci. 247 (2002) 412–423.
13 K. Golemanov, S. Tcholakova, N. D. Denkov, K. P. Ananthapadmanabhan, A. Lips, Breakup of bubbles and drops in steadily
sheared foams and concentrated emulsions, Phys. Rev. E 78 (2008) 051405.
14 H. Mohammadigoushki, J. J. Feng, Size segregation in sheared two-dimensional polydisperse foam, Langmuir 29 (2013)
1370–1378.
15 M. Dennin, Statistics of bubble rearrangements in a slowly sheared two-dimensional foam, Phys. Rev. E 70 (2004) 041406.
16 H. Mohammadigoushki, G. Gighliotti, J. J. Feng, Anomalous coalescence in sheared two-dimensional foam, Phys. Rev. E 85
(2012) 066301.
17 H. Mohammadigoushki, J. J. Feng, Size differentiated lateral migration in sheared two-dimensional foam, Phys. Rev. Lett
109 (2012) 084502.
18 V. Labiausse, R. Hohler, S. Cohen-Addad, Shear induced normal stress differences in aqueous foams, J. Reol. 51 (2007)
479–492.
19 G. Katgert, B. P. Tiche, M. E. Mobius, M. van Hecke, Couette flow of two-dimensional foams, Europhys. Lett. 90 (2010)
54002.
20 S. Costa, R. Hohler, S. Cohen-Addad, The coupling between foam viscoelasticity and interfacial rheology, Soft Matter 9
(2013) 1100–1112.
21 J. Goyon, A. Colin, G. Ovarlez, A. Ajdari, L. Bocquet, Spatial cooperativity in soft glassy flows, Nature 454 (2008) 07026.
14

J. Non-Newtonian Fluid Mech. 223, 1-8 (2015) http://dx.doi.org/10.1016/j.jnnfm.2015.05.001
22 G. Debregeas, H. Tabuteau, J.-M. di Meglio, Deformation and flow of a two-dimensional foam under continuous shear, Phys.
Rev. Lett. 87 (2001) 178305.
23 S. Rodts, J. C. Baudez, P. Coussot, From “discrete” to “continuum” flow in foams, EPL 69 (4) (2005) 636–642.
24 G. Ovarlez, K. Krishan, S. Cohen-Addad, Investigation of shear banding in three-dimensional foams, Europhys. Lett. 91
(2010) 68005.
25 J. Lauridsen, M. Twardos, M. Dennin, Shear-induced stress relaxation in a two-dimensionalwet foam, Phys. Rev. Lett. 89
(2002) 098303.
26 H. Mohammadigoushki, P. Yue, J. J. Feng, Bubble migration in two-dimensional foam sheared in a wide-gap Couette device:
Effects of non-Newtonian rheology, J. Rheol. 58 (2014) 1809–1827.
27 W. Thielicke, E. J. Stamhuis, PIVlab - Time-resolved digital particle image velocimetry tool for MATLAB (2012 (accessed
January, 2015)).
URL http://pivlab.blogspot.ca/
28 P. Estelle, C. Lanos, A. Perrot, Processing the Couette viscometry data using a Bingham approximation in shear rate calcu-
lation, J. Non-Newtonian Fluid Mech. 154 (2008) 31–38.
29 H. M. Princen, A. D. Kiss, Rheology of foams and highly concentrated emulsions iv. an experimental study of the shear
viscosity and yield stress of concentrated emulsions, J. Colloid Interface Sci. 128 (1989) 176–187.
30 P. C. H. Chan, L. G. Leal, The motion of a deformable drop in a second-order fluid, J. Fluid Mech. 92 (1979) 131–170.
31 P. C. H. Chan, L. G. Leal, An experimental study of drop migration in shear flow between concentric cylinders, Int. J.
Multiphase Flow 7 (1981) 83–99.
32 O. Radulescu, P. D. Olmsted, J. P. Decruppe, S. Lerouge, J. F. Berret, G. Porte, Timescales in shear banding of wormlike
micelles., Europhys. Lett. 62 (2003) 230–236.
15