microstructure evolution during recrystallization of dual
TRANSCRIPT

Microstructure evolution during recrystallizationof dual-phase steels
D. Raabe, F. Roters, D. Ponge, S. Zaefferer, N. Perannio, M. Calcagnotto
Düsseldorf, Germany
WWW.MPIE.DE
RX&GG 4, July 2010, Sheffield

Overview
Raabe: Adv. Mater. 14 (2002), Roters et al. Acta Materi.58 (2010)
Overview
Overview
Calcagnotto et al. Mater. Sc. Engin. A 527 (2010) 2738
4
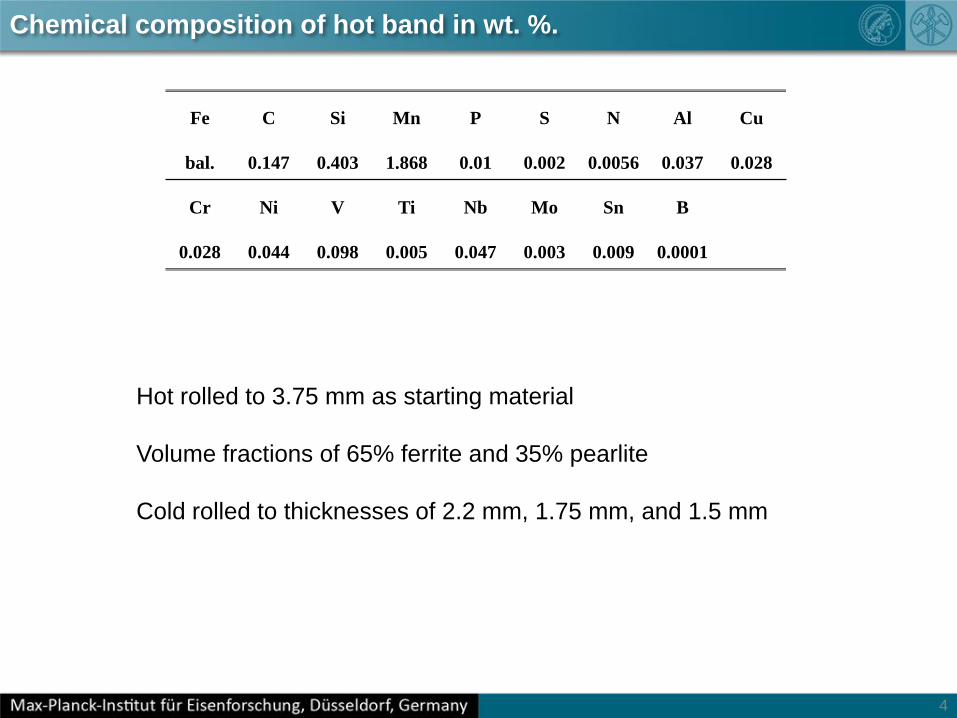
Fe C Si Mn P S N Al Cu
bal. 0.147 0.403 1.868 0.01 0.002 0.0056 0.037 0.028
Cr Ni V Ti Nb Mo Sn B
0.028 0.044 0.098 0.005 0.047 0.003 0.009 0.0001
Chemical composition of hot band in wt. %.
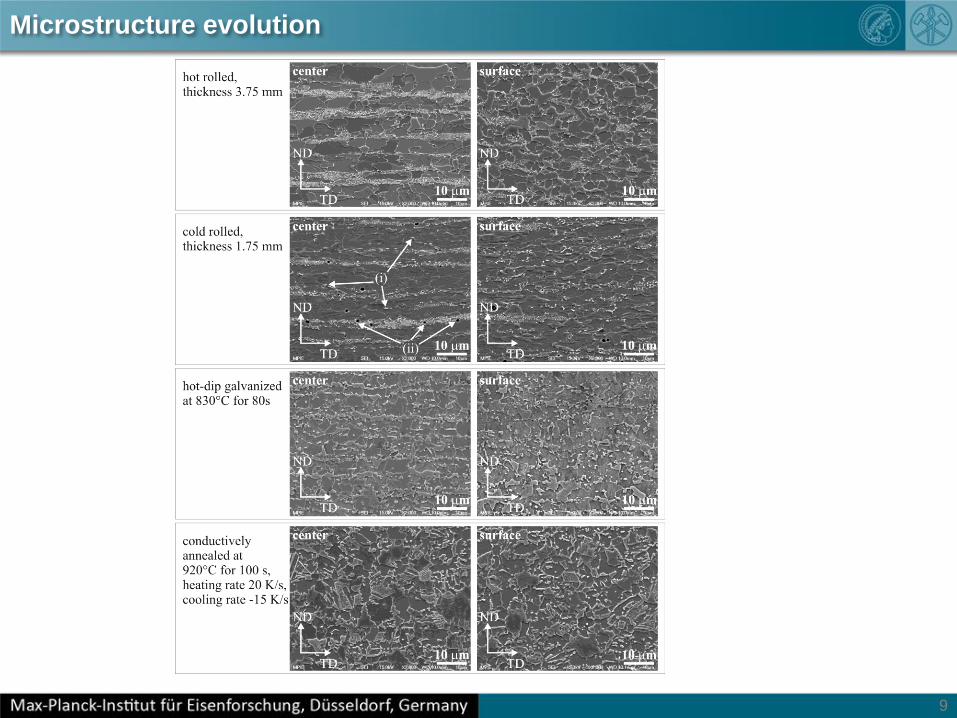
Hot rolled to 3.75 mm as starting material
Volume fractions of 65% ferrite and 35% pearlite
Cold rolled to thicknesses of 2.2 mm, 1.75 mm, and 1.5 mm
5
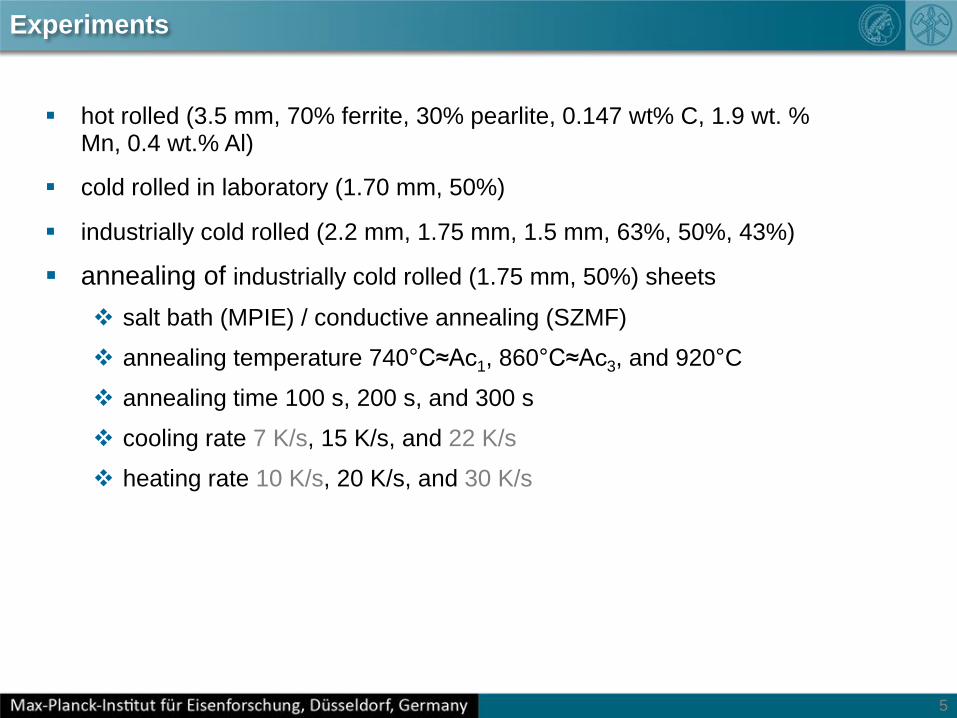
hot rolled (3.5 mm, 70% ferrite, 30% pearlite, 0.147 wt% C, 1.9 wt. % Mn, 0.4 wt.% Al)
cold rolled in laboratory (1.70 mm, 50%)
industrially cold rolled (2.2 mm, 1.75 mm, 1.5 mm, 63%, 50%, 43%)
annealing of industrially cold rolled (1.75 mm, 50%) sheets
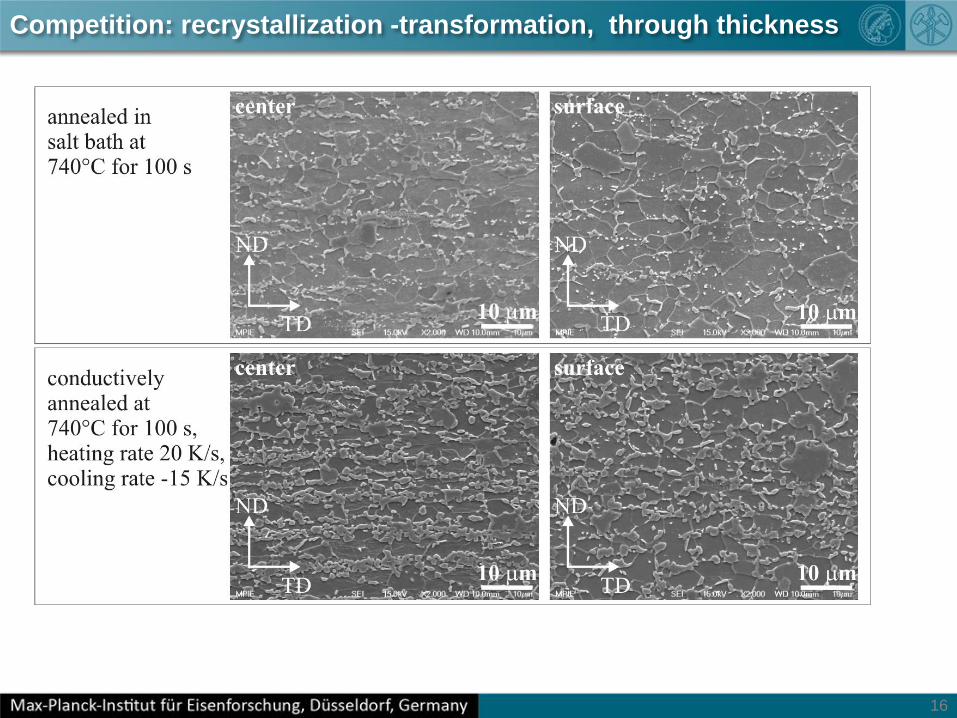
salt bath (MPIE) / conductive annealing (SZMF)
annealing temperature 740°C≈Ac1, 860°C≈Ac3, and 920°C
annealing time 100 s, 200 s, and 300 s
cooling rate 7 K/s, 15 K/s, and 22 K/s
heating rate 10 K/s, 20 K/s, and 30 K/s
Experiments
6
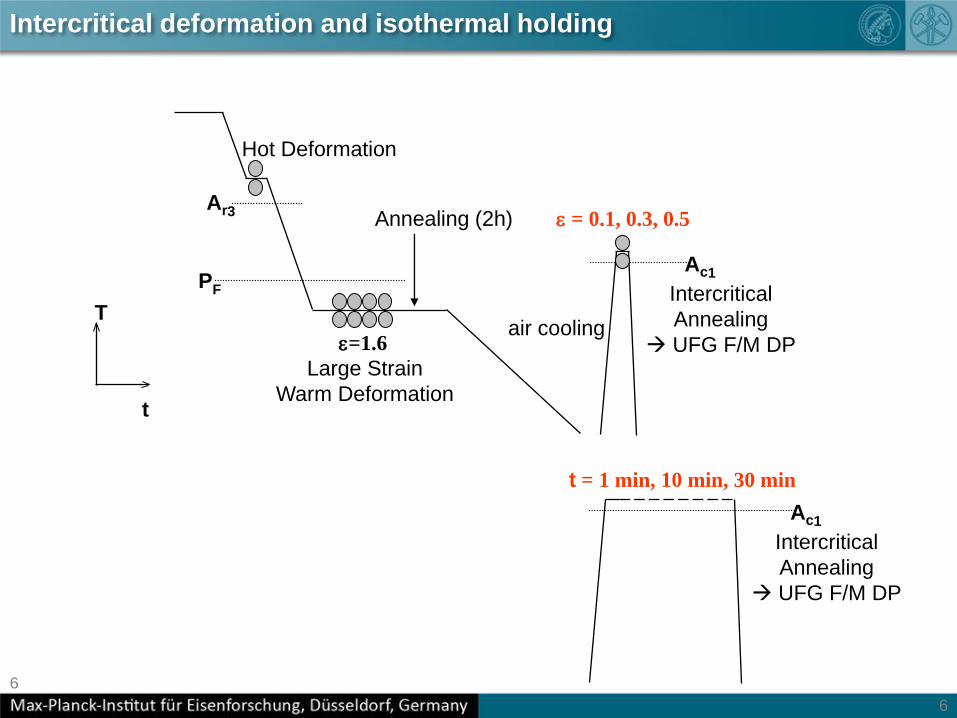
Intercritical deformation and isothermal holding
PF
Ar3
Hot Deformation
T
t
Large Strain
Warm Deformation
e=1.6
Annealing (2h)
air cooling
Intercritical
Annealing
UFG F/M DP
Ac1
e = 0.1, 0.3, 0.5
Intercritical
Annealing
UFG F/M DP
Ac1
t = 1 min, 10 min, 30 min
6

recrystallization dual phase steels
phase changes in dual phase steels
intercritical
annealing
deformed ferrite pearlite
strain free
austenite
recrystallized
ferrite
recovered
ferrite
room
temperature
recrystallized/
strain free
ferrite
recovered/strained
ferritemartensite
cold rolled
7

Overview
Raabe: Adv. Mater. 14 (2002), Roters et al. Acta Materi.58 (2010)
9
Microstructure evolution

10
Microstructure and texture evolution – hot band through thickness
11
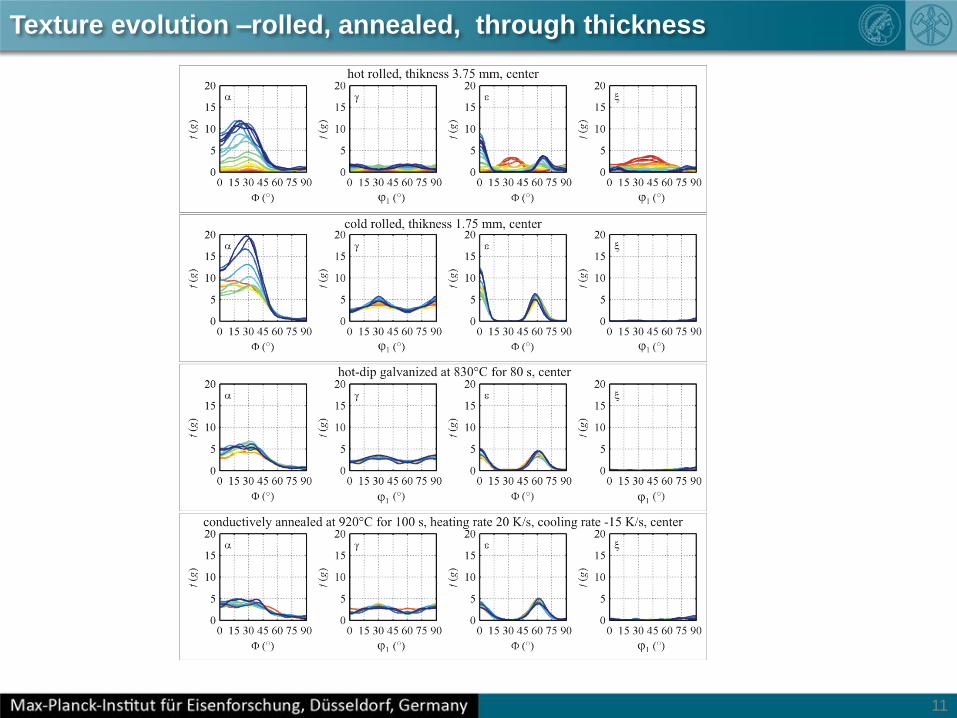
Texture evolution –rolled, annealed, through thickness

12
Texture and microstructure–rolled, annealed, through thickness

1313
Results - EBSD – cold rolled
cold rolled, center of sample
pearlite
ferrite
unfiltered
image quality signal allows separate
analysis of the constituents
ferrite volume fraction 74%
grain size 4.8 mm, aspect ratio 0.26
large grains are deformed
TD
ND
TD
ND
TD
ND

14
inverse pole figures and ODF, cold rolled, center
<110> parallel RD (a-fiber), {111} parallel ND (g-fiber)
typical texture for bcc-materials
TD
ND
TD
ND
ND RD
large grains are closer
to the a-fiber
Results - EBSD – cold rolled

15
Competition: recrystallization -transformation, through thickness
16
Competition: recrystallization -transformation, through thickness

17
Competition: recrystallization -transformation, through thickness
Calcagnotto et al. Mater. Sc. Engin. A 527 (2010) 2738

18
Texture: recrystallization -transformation, through thickness

Overview
Raabe: Adv. Mater. 14 (2002), Roters et al. Acta Materi.58 (2010)
20
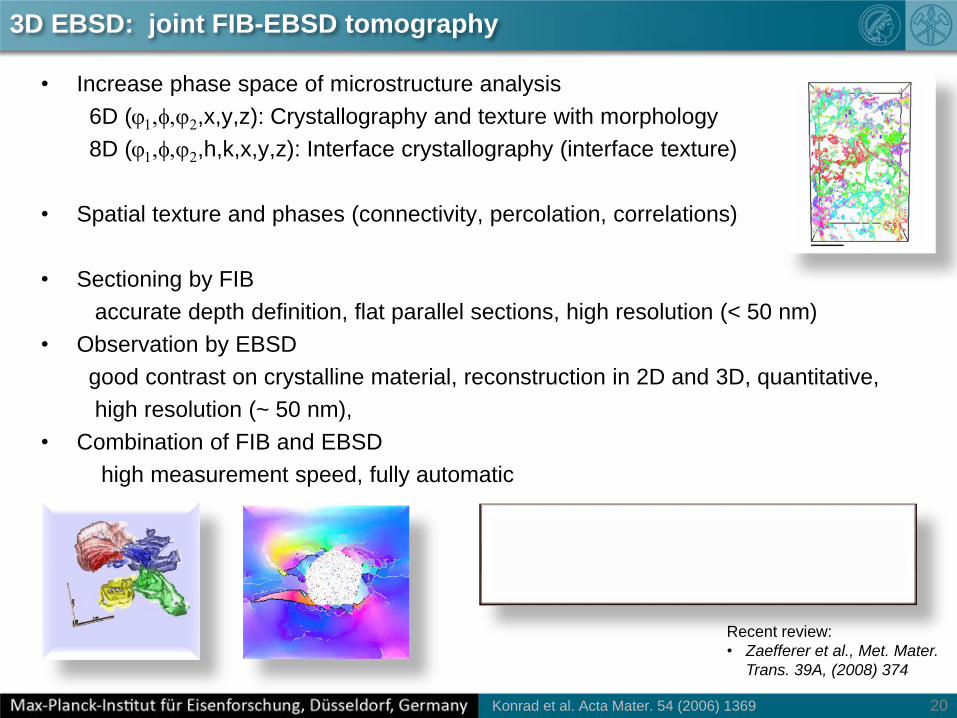
3D EBSD: joint FIB-EBSD tomography
• Increase phase space of microstructure analysis
6D (j1,f,j2,x,y,z): Crystallography and texture with morphology
8D (j1,f,j2,h,k,x,y,z): Interface crystallography (interface texture)
• Spatial texture and phases (connectivity, percolation, correlations)
• Sectioning by FIB
accurate depth definition, flat parallel sections, high resolution (< 50 nm)
• Observation by EBSD
good contrast on crystalline material, reconstruction in 2D and 3D, quantitative,
high resolution (~ 50 nm),
• Combination of FIB and EBSD
high measurement speed, fully automatic
Recent review:
• Zaefferer et al., Met. Mater.
Trans. 39A, (2008) 374
Konrad et al. Acta Mater. 54 (2006) 1369
21
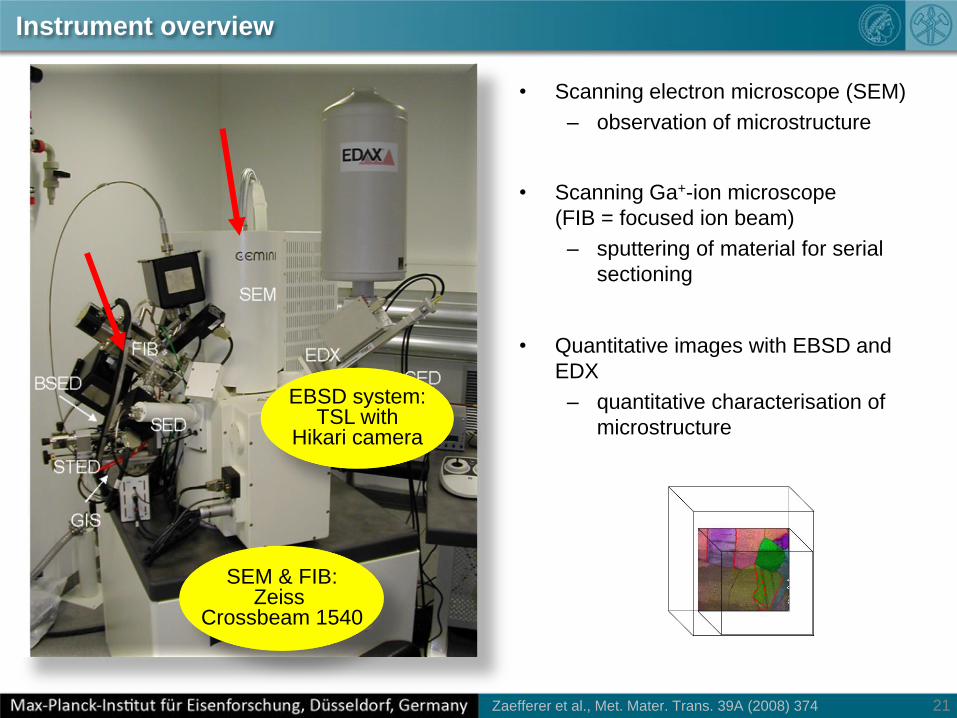
Instrument overview
• Scanning electron microscope (SEM)
– observation of microstructure
SEM & FIB:Zeiss
Crossbeam 1540
EBSD system:TSL with
Hikari camera
• Quantitative images with EBSD and
EDX
– quantitative characterisation of
microstructure
• Scanning Ga+-ion microscope
(FIB = focused ion beam)
– sputtering of material for serial
sectioning
Zaefferer et al., Met. Mater. Trans. 39A (2008) 374

sample in
cutting position
(36° tilt)
e-
e-
sample in
EBSD position
(70° tilt)
ion milling
to EBSD detector
electron
beam
tilt 34 °
alignment
marker
EBSD
camera
SEM objective lens
Ga+
22
Principle of serial sectioning & orientation microscopy
Konrad et al. Acta Mater. 54 (2006) 1369
23
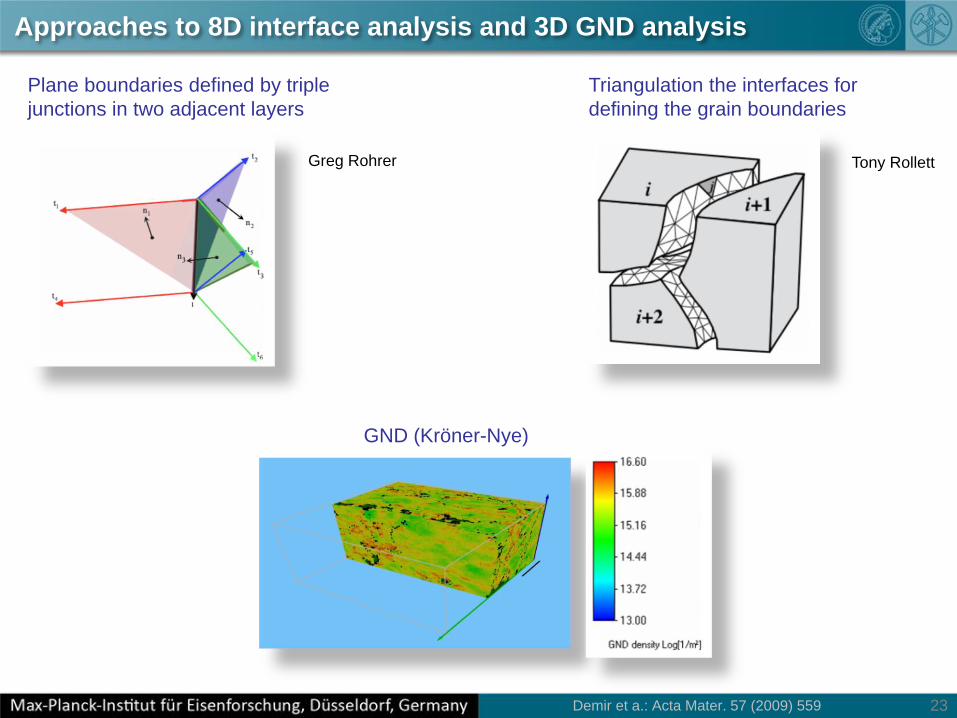
Greg Rohrer Tony Rollett
Triangulation the interfaces for
defining the grain boundaries
Plane boundaries defined by triple
junctions in two adjacent layers
Approaches to 8D interface analysis and 3D GND analysis
GND (Kröner-Nye)
Demir et a.: Acta Mater. 57 (2009) 559
24
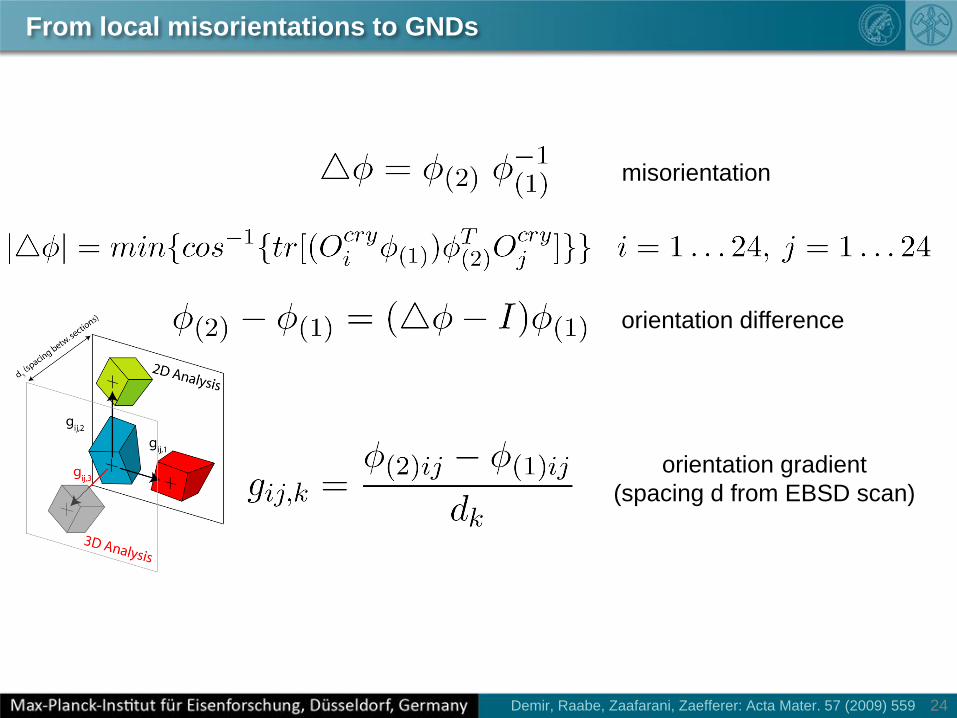
From local misorientations to GNDs
misorientation
orientation gradient
(spacing d from EBSD scan)
Demir, Raabe, Zaafarani, Zaefferer: Acta Mater. 57 (2009) 559
orientation difference

25
From local misorientations to GNDs
distortion
(sym, a-sym)
Demir, Raabe, Zaafarani, Zaefferer: Acta Mater. 57 (2009) 559

26
From local misorientations to GNDs
distortion
(sym, a-sym)
dislocation tensor (GND)
J. F. Nye. Some geometrical relations in dislocated crystals. Acta Metall. 1:153, 1953.
E. Kröner. Kontinuumstheorie der Versetzungen und Eigenspannungen (in German). Springer, Berlin, 1958.
E. Kröner. Physics of defects, chapter Continuum theory of defects, p.217. North-Holland Publishing, Amsterdam, Netherlands, 1981.
Demir, Raabe, Zaafarani, Zaefferer: Acta Mater. 57 (2009) 559

27
From local misorientations to GNDs
Frank loop through area r
18 b,t combinations
9 b,t combinations
Demir, Raabe, Zaafarani, Zaefferer: Acta Mater. 57 (2009) 559

28
martensite
ferrite
111
001 101
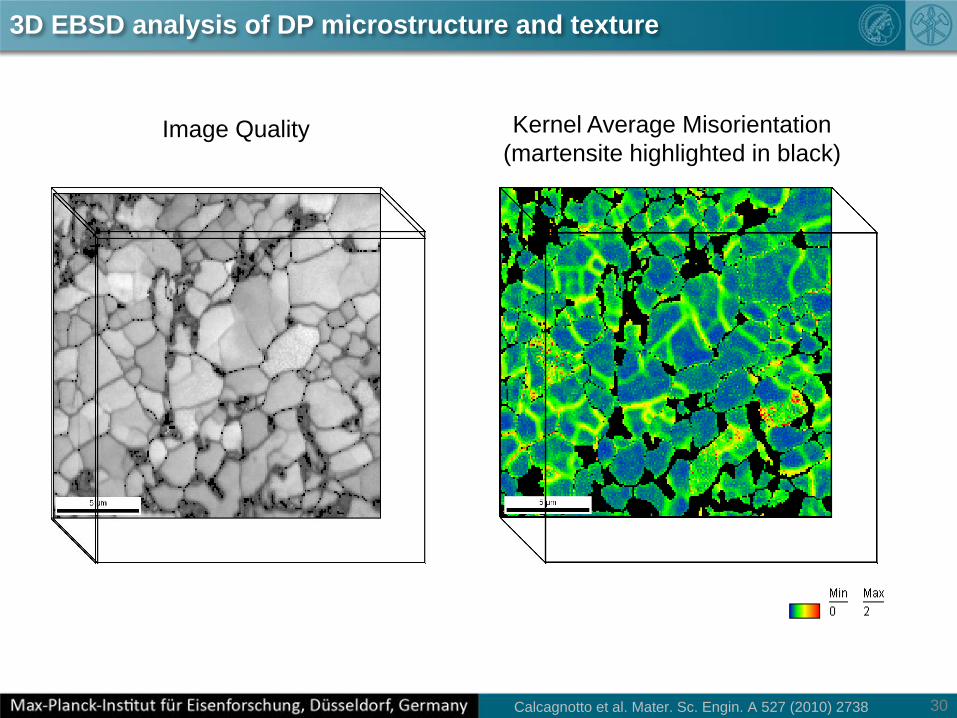
3D EBSD analysis of DP microstructure and texture
Calcagnotto et al. Mater. Sc. Engin. A 527 (2010) 2738

Overview
Calcagnotto et al. Mater. Sc. Engin. A 527 (2010) 2738
30
Image Quality Kernel Average Misorientation
(martensite highlighted in black)
3D EBSD analysis of DP microstructure and texture
Calcagnotto et al. Mater. Sc. Engin. A 527 (2010) 2738
31
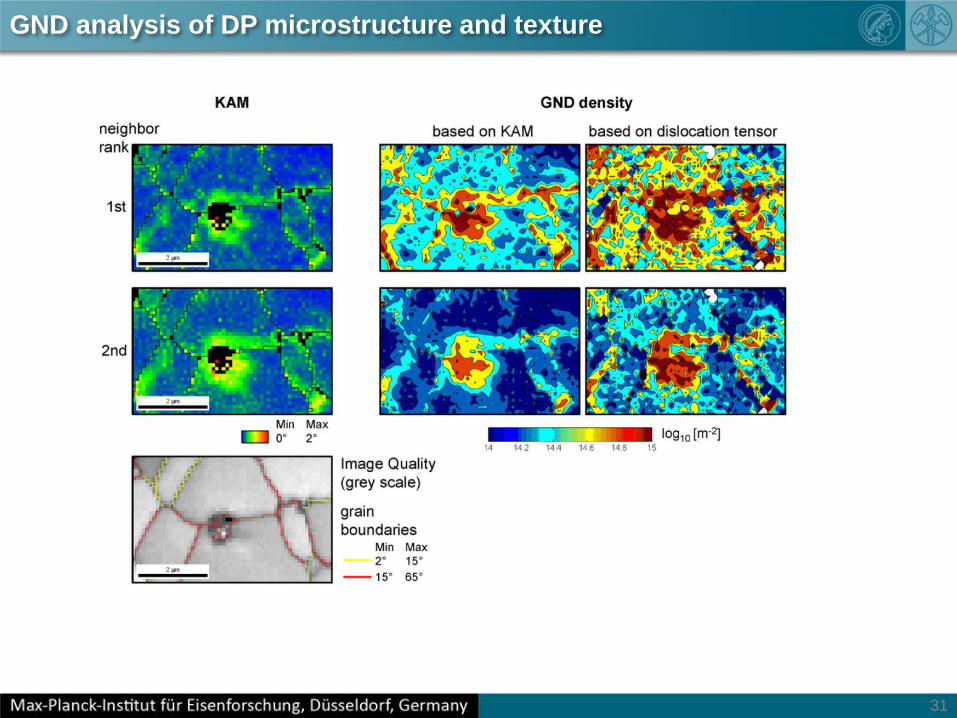
GND analysis of DP microstructure and texture

32
ferrite-ferrite interfaces
ferrite-martensite interfaces
3D GND analysis of DP microstructure
Calcagnotto et al. Mater. Sc. Engin. A 527 (2010) 2738

Overview
Raabe: Adv. Mater. 14 (2002), Roters et al. Acta Materi.58 (2010)

34
Ultrafine grained DP steels
Calcagnotto et al. Mater. Sc. Engin. A 527 (2010) 2738

35
Coarse grained DP (12.4 µm)
Berkovich 50 nm
Constant load 500 µN
3D GND analysis of DP microstructure
Calcagnotto et al. Mater. Sc. Engin. A 527 (2010) 2738
Overview
Calcagnotto et al. Mater. Sc. Engin. A 527 (2010) 2738
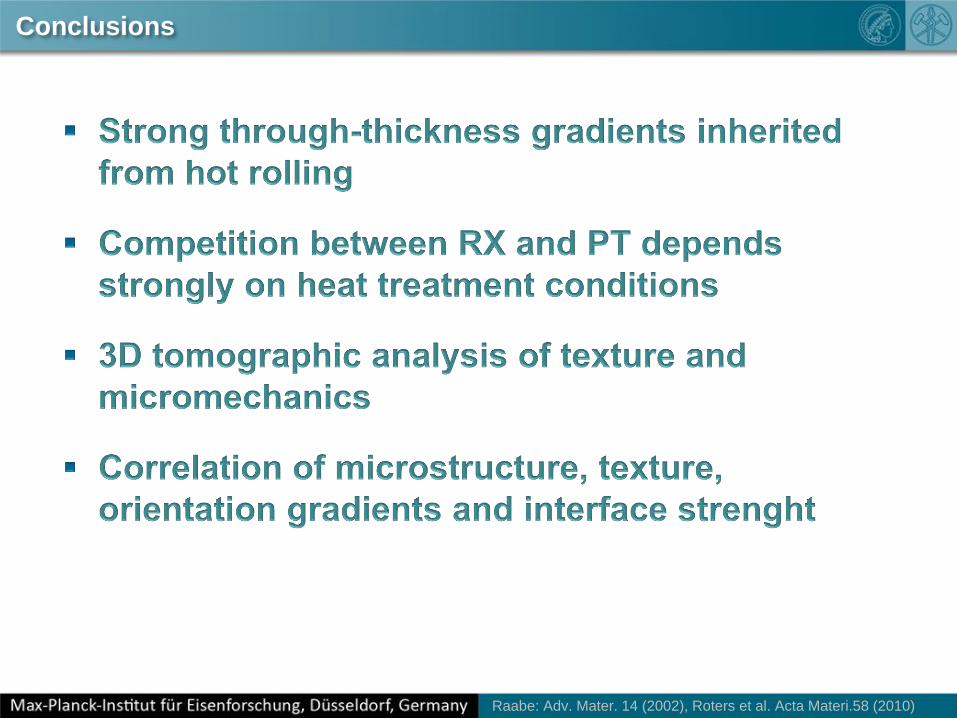
Conclusions
Raabe: Adv. Mater. 14 (2002), Roters et al. Acta Materi.58 (2010)
38
The Düsseldorf Max-Planck Team
!
www.mpie.de
39
40
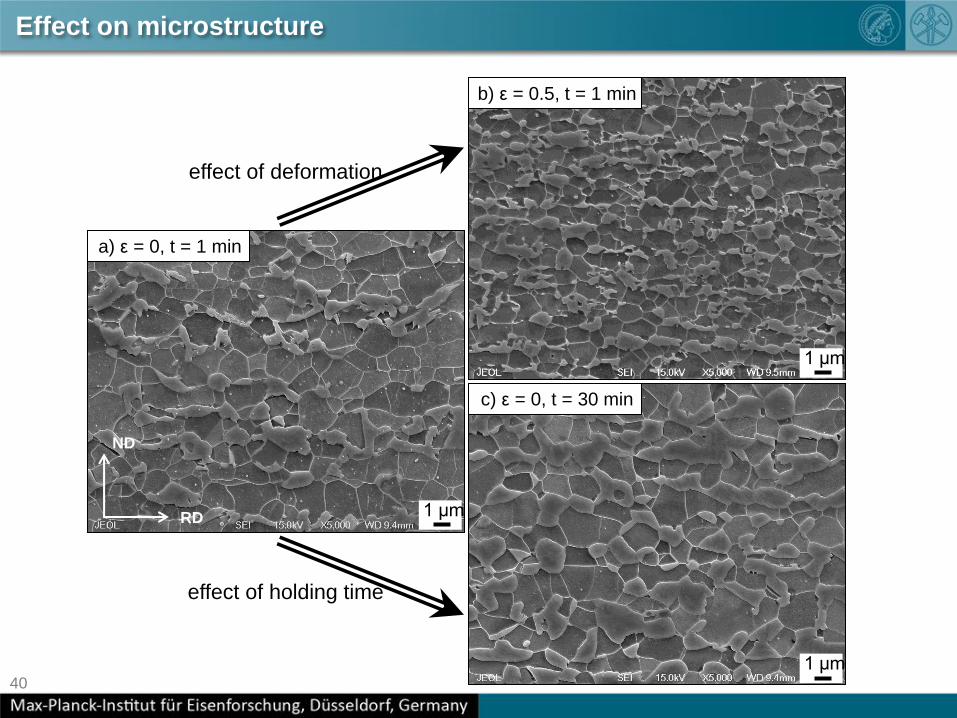
Effect on microstructure
effect of deformation
effect of holding time
a) ε = 0, t = 1 min
b) ε = 0.5, t = 1 min
c) ε = 0, t = 30 min
RD
ND
1 µm
1 µm
1 µm

41
Effect on retained austenite fraction
effect of deformation
effect of holding time
RD
ND
b) ε = 0.3, t = 1 min
γ = 3.4 %
γ = 0.2 %
c) ε = 0, t = 10 min
a) ε = 0, t = 1 min
γ = 2.6 %

42

43

44

45

46