template for bank specific publication of the stress test ... file2 yr cumulative impairment losses...
TRANSCRIPT
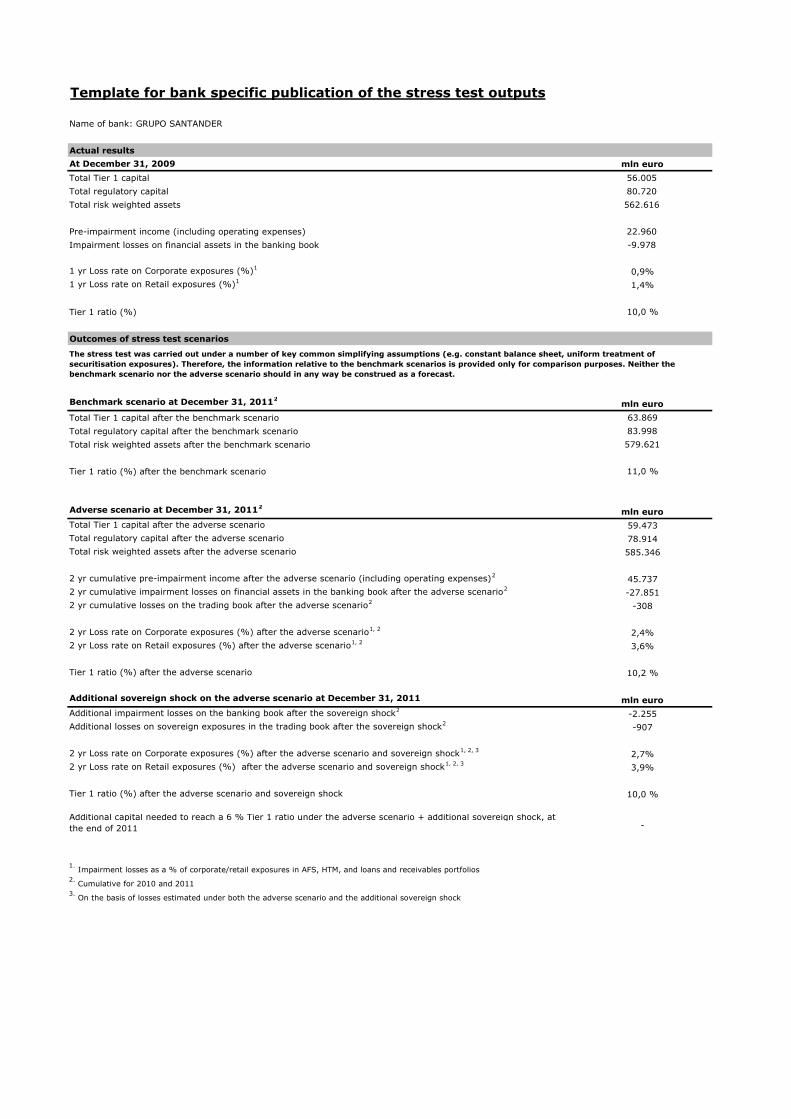
Template for bank specific publication of the stress test outputs
Name of bank: GRUPO SANTANDER
Actual results
At December 31, 2009 mln euro
Total Tier 1 capital 56.005
Total regulatory capital 80.720
Total risk weighted assets 562.616
Pre-impairment income (including operating expenses) 22.960
Impairment losses on financial assets in the banking book -9.978
1 yr Loss rate on Corporate exposures (%)10,9%
1 yr Loss rate on Retail exposures (%)11,4%
Tier 1 ratio (%) 10,0 %
Outcomes of stress test scenarios
Benchmark scenario at December 31, 20112mln euro
Total Tier 1 capital after the benchmark scenario 63.869
Total regulatory capital after the benchmark scenario 83.998
Total risk weighted assets after the benchmark scenario 579.621
Tier 1 ratio (%) after the benchmark scenario 11,0 %
Adverse scenario at December 31, 20112mln euro
Total Tier 1 capital after the adverse scenario 59.473
Total regulatory capital after the adverse scenario 78.914
Total risk weighted assets after the adverse scenario 585.346
2 yr cumulative pre-impairment income after the adverse scenario (including operating expenses)245.737
2 yr cumulative impairment losses on financial assets in the banking book after the adverse scenario2-27.851
2 yr cumulative losses on the trading book after the adverse scenario2-308
2 yr Loss rate on Corporate exposures (%) after the adverse scenario1, 22,4%
2 yr Loss rate on Retail exposures (%) after the adverse scenario1, 23,6%
Tier 1 ratio (%) after the adverse scenario 10,2 %
Additional sovereign shock on the adverse scenario at December 31, 2011 mln euro
Additional impairment losses on the banking book after the sovereign shock2-2.255
Additional losses on sovereign exposures in the trading book after the sovereign shock2-907
2 yr Loss rate on Corporate exposures (%) after the adverse scenario and sovereign shock1, 2, 32,7%
2 yr Loss rate on Retail exposures (%) after the adverse scenario and sovereign shock1, 2, 33,9%
Tier 1 ratio (%) after the adverse scenario and sovereign shock 10,0 %
Additional capital needed to reach a 6 % Tier 1 ratio under the adverse scenario + additional sovereign shock, at
the end of 2011 -
1.Impairment losses as a % of corporate/retail exposures in AFS, HTM, and loans and receivables portfolios
2.Cumulative for 2010 and 2011
3.On the basis of losses estimated under both the adverse scenario and the additional sovereign shock
The stress test was carried out under a number of key common simplifying assumptions (e.g. constant balance sheet, uniform treatment of
securitisation exposures). Therefore, the information relative to the benchmark scenarios is provided only for comparison purposes. Neither the
benchmark scenario nor the adverse scenario should in any way be construed as a forecast.

Exposures to central and local governments
Banking group's exposure on a consolidated basis
Amount in million reporting currency
Name of bank
Reporting date 31-mar-10
of which
Banking book
of which
Trading book
Austria 264 242 242
Belgium 250 84 84
Bulgaria -10 -10
Cyprus
Czech Republic
Denmark -2 -2
Estonia
Finland -2 -2
France 1.826 1.081 478 1.559
Germany 1.524 -461 -461
Greece 513 300 300
Hungary 40 0 0
Iceland
Ireland 16 9 9
Italy 1.184 433 433
Latvia
Liechtenstein
Lithuania
Luxembourg
Malta
Netherlands 691 3 403 406
Norway -2 -2
Poland 31 4 0 4
Portugal 5.118 3.658 1.206 4.864
Romania
Slovakia
Slovenia
Spain 50.642 40.787 7.715 48.502
Sweden -2 -2
United Kingdom 4.561 1.003 3.410 4.413
Gross exposures (net
of impairment)
Net exposures
(net of
impairment)
GRUPO SANTANDER

mill. € % activos mill. € % activos
Activos crediticios1 -39,294 -4.0% -44,180 -4.5%
Instituciones financieras -788 -0.7% -848 -0.9%
Empresas -5,594 -2.6% -6,679 -3.1%
Promotores y adjudicados -5,197 -13.6% -5,819 -15.2%
Pymes -4,698 -5.9% -5,404 -6.7%
Hipotecas -3,632 -1.2% -3,911 -1.3%
Resto minorista -19,385 -12.7% -21,519 -14.1%
Impacto riesgo soberano y otros2 -1,562 -0.2% -6,108 -0.6%
DETERIORO BRUTO -40,856 -4.1% -50,288 -5.1%
1 Incluye inversión crediticia, renta fija distinta a negociación y participaciones permanentes
2 En otros se incluye cartera de negociación y renta variable disponible para la venta
Específicas 14,052 1.4% 14,052 1.4%
Genéricas 6,727 0.7% 6,727 0.7%
MARGEN DE EXPLOTACIÓN Y PLUSVALÍAS 49,196 5.0% 43,599 4.4%
EFECTO IMPOSITIVO -6,701 -0.7% -3,114 -0.3%
22,419 2.3% 10,976 1.1%
mill. € % APR 2009 mill. € % APR 2009
Tier 1 dic 2009 56,005 10.0% 56,005 10.0%
mill. € % APR 2011 mill. € % APR 2011
22,419 3.9% 10,976 1.9%
-14,555 -2.5% -8,730 -1.5%
Tier 1 dic 2011 sin FROB 63,869 11.0% 58,251 10.0%
FROB comprometido 0 0.0% 0 0.0%
Tier 1 dic 2011 63,869 11.0% 58,251 10.0%
Capital adicional para Tier1 6% 0 0.0% 0 0.0%
Ayudas FGD
FROB comprometido
Capital adicional para Tier1 6%
Pruebas de resistencia 2010-2011
GRUPO SANTANDER
Escenario tensionado de
referencia
Escenario tensionado
adverso
BLOQUE A
Deterioro bruto
acumulado 2010-2011
BLOQUE B
Recursos disponibles
acumulado 2010-2011
PROVISIONES
SUPERÁVIT
BLOQUE C
Impacto sobre los
recursos propios Tier 1
Escenario tensionado de
referencia
Escenario tensionado
adverso
SITUACIÓN INICIAL 2009
SITUACIÓN FINAL 2011
Superávit
Dividendos, v. razonable fusiones y otros
PROMEMORIA
Ayudas
Escenario tensionado de
referencia
Escenario tensionado
adverso
0 0
0 0
0 0
TOTAL 0 0

Template for bank specific publication of the stress test outputs
Name of bank: GRUPO BBVA
Actual results
At December 31, 2009 mln euro
Total Tier 1 capital 27.255
Total regulatory capital 39.440
Total risk weighted assets 290.062
Pre-impairment income (including operating expenses) 12.308
Impairment losses on financial assets in the banking book -5.473
1 yr Loss rate on Corporate exposures (%)1
0,7%
1 yr Loss rate on Retail exposures (%)1
2,1%
Tier 1 ratio (%) 9,4%
Outcomes of stress test scenarios
Benchmark scenario at December 31, 20112
mln euro
Total Tier 1 capital after the benchmark scenario 32.028
Total regulatory capital after the benchmark scenario 42.493
Total risk weighted assets after the benchmark scenario 300.842
Tier 1 ratio (%) after the benchmark scenario 10,6%
Adverse scenario at December 31, 20112
mln euro
Total Tier 1 capital after the adverse scenario 29.994
Total regulatory capital after the adverse scenario 39.967
Total risk weighted assets after the adverse scenario 311.126
2 yr cumulative pre-impairment income after the adverse scenario (including operating
expenses)2
21.7682 yr cumulative impairment losses on financial assets in the banking book after the adverse
scenario2
-12.093
2 yr cumulative losses on the trading book after the adverse scenario2
-113
2 yr Loss rate on Corporate exposures (%) after the adverse scenario1, 2
1,7%
2 yr Loss rate on Retail exposures (%) after the adverse scenario1, 2
3,8%
Tier 1 ratio (%) after the adverse scenario 9,6%
Additional sovereign shock on the adverse scenario at December 31, 2011 mln euro
Additional impairment losses on the banking book after the sovereign shock2
-1.505
Additional losses on sovereign exposures in the trading book after the sovereign shock2
-1.223
2 yr Loss rate on Corporate exposures (%) after the adverse scenario and sovereign shock1,
2, 32,1%
2 yr Loss rate on Retail exposures (%) after the adverse scenario and sovereign shock1, 2, 3
4,1%
Tier 1 ratio (%) after the adverse scenario and sovereign shock 9,3%
Additional capital needed to reach a 6 % Tier 1 ratio under the adverse scenario + additional
sovereign shock, at the end of 2011 -
1.Impairment losses as a % of corporate/retail exposures in AFS, HTM, and loans and receivables portfolios
2.Cumulative for 2010 and 2011
3.On the basis of losses estimated under both the adverse scenario and the additional sovereign shock
The stress test was carried out under a number of key common simplifying assumptions (e.g. constant balance sheet, uniform
treatment of securitisation exposures). Therefore, the information relative to the benchmark scenarios is provided only for
comparison purposes. Neither the benchmark scenario nor the adverse scenario should in any way be construed as a forecast.

Exposures to central and local governments
Banking group's exposure on a consolidated basis
Amount in million reporting currency
Name of bank
Reporting date 31-mar-10
of which
Banking book
of which
Trading book
Austria 118 118 8
Belgium 579 578 1 476
Bulgaria
Cyprus
Czech Republic 15 15 15
Denmark
Estonia
Finland 487 487 487
France 2.191 2.175 16 864
Germany 1.693 152 1.541 713
Greece 293 293 293
Hungary 203 203 203
Iceland
Ireland 16 15 1 16
Italy 6.230 4.965 1.265 5.001
Latvia
Liechtenstein
Lithuania
Luxembourg
Malta
Netherlands 2 2 2
Norway
Poland 169 169 169
Portugal 646 643 3 629
Romania
Slovakia
Slovenia
Spain 52.131 43.566 8.565 43.991
Sweden
United Kingdom 2 2 2
Gross exposures (net
of impairment)
Net exposures
(net of
impairment)
GRUPO BBVA

mill. € % activos mill. € % activos
Activos crediticios1 -18.233 -4,5% -20.196 -4,9%
Instituciones financieras -66 -0,3% -69 -0,3%
Empresas -4.007 -2,6% -4.712 -3,1%
Promotores y adjudicados -3.177 -10,5% -3.451 -11,4%
Pymes -1.197 -3,1% -1.406 -3,7%
Hipotecas -3.157 -3,1% -3.440 -3,4%
Resto minorista -6.629 -10,9% -7.118 -11,7%
Impacto riesgo soberano y otros2 -1.245 -0,3% -4.884 -1,1%
DETERIORO BRUTO -19.478 -4,5% -25.080 -5,7%
1 Incluye inversión crediticia, renta fija distinta a negociación y participaciones permanentes
2 En otros se incluye cartera de negociación y renta variable disponible para la venta
Específicas 7.152 1,6% 7.152 1,6%
Genéricas 2.995 0,7% 2.995 0,7%
MARGEN DE EXPLOTACIÓN Y PLUSVALÍAS 21.083 4,8% 20.470 4,7%
EFECTO IMPOSITIVO -2.963 -0,7% -1.313 -0,3%
8.789 2,0% 4.224 1,0%
mill. € % APR 2009 mill. € % APR 2009
Tier 1 dic 2009 27.255 9,4% 27.255 9,4%
mill. € % APR 2011 mill. € % APR 2011
8.789 2,9% 4.224 1,4%
-4.016 -1,3% -2.561 -0,8%
Tier 1 dic 2011 sin FROB 32.028 10,6% 28.918 9,3%
FROB comprometido 0 0,0% 0 0,0%
Tier 1 dic 2011 32.028 10,6% 28.918 9,3%
Capital adicional para Tier1 6% 0 0,0% 0 0,0%
Ayudas FGD
FROB comprometido
Capital adicional para Tier1 6%
PROMEMORIA
Ayudas
Escenario de referencia Escenario adverso
0 0
0 0
0 0
TOTAL 0 0
BLOQUE C
Impacto sobre los
recursos propios Tier 1
Escenario de referencia Escenario adverso
SITUACIÓN INICIAL 2009
SITUACIÓN FINAL 2011
Superávit
Dividendos, v. razonable fusiones y otros
BLOQUE B
Recursos disponibles
acumulado 2010-2011
PROVISIONES
SUPERÁVIT
Pruebas de resistencia 2010-2011
GRUPO BBVA
Escenario tensionado de
referencia
Escenario tensionado
adverso
BLOQUE A
Deterioro bruto
acumulado 2010-2011

Template for bank specific publication of the stress test outputs
Name of bank: BANCO POPULAR ESPAÑOL, S.A.
Actual results
At December 31, 2009 mln euro
Total Tier 1 capital 8.457
Total regulatory capital 8.891
Total risk weighted assets 92.571
Pre-impairment income (including operating expenses) 2.762
Impairment losses on financial assets in the banking book -1.739
1 yr Loss rate on Corporate exposures (%)1
1,9%
1 yr Loss rate on Retail exposures (%)1
0,4%
Tier 1 ratio (%) 9,1 %
Outcomes of stress test scenarios
Benchmark scenario at December 31, 20112
mln euro
Total Tier 1 capital after the benchmark scenario 8.536
Total regulatory capital after the benchmark scenario 8.694
Total risk weighted assets after the benchmark scenario 92.571
Tier 1 ratio (%) after the benchmark scenario 9,2 %
Adverse scenario at December 31, 20112
mln euro
Total Tier 1 capital after the adverse scenario 6.944
Total regulatory capital after the adverse scenario 7.102
Total risk weighted assets after the adverse scenario 92.571
2 yr cumulative pre-impairment income after the adverse scenario (including operating
expenses)2 4.498
2 yr cumulative impairment losses on financial assets in the banking book after the adverse
scenario2 -7.508
2 yr cumulative losses on the trading book after the adverse scenario2
-57
2 yr Loss rate on Corporate exposures (%) after the adverse scenario1, 2
9,0%
2 yr Loss rate on Retail exposures (%) after the adverse scenario1, 2
1,8%
Tier 1 ratio (%) after the adverse scenario 7,5 %
Additional sovereign shock on the adverse scenario at December 31, 2011 mln euro
Additional impairment losses on the banking book after the sovereign shock2
-630
Additional losses on sovereign exposures in the trading book after the sovereign shock2 -4
2 yr Loss rate on Corporate exposures (%) after the adverse scenario and sovereign shock1,
2, 3 9,5%
2 yr Loss rate on Retail exposures (%) after the adverse scenario and sovereign shock1, 2, 3 2,4%
Tier 1 ratio (%) after the adverse scenario and sovereign shock 7,0 %
Additional capital needed to reach a 6 % Tier 1 ratio under the adverse scenario + additional
sovereign shock, at the end of 2011-
1.Impairment losses as a % of corporate/retail exposures in AFS, HTM, and loans and receivables portfolios
2.Cumulative for 2010 and 2011
3.On the basis of losses estimated under both the adverse scenario and the additional sovereign shock
The stress test was carried out under a number of key common simplifying assumptions (e.g. constant balance sheet, uniform
treatment of securitisation exposures). Therefore, the information relative to the benchmark scenarios is provided only for
comparison purposes. Neither the benchmark scenario nor the adverse scenario should in any way be construed as a forecast.

Exposures to central and local governments
Banking group's exposure on a consolidated basis
Amount in million reporting currency
Name of bank
Reporting date 31-mar-10
of which
Banking book
of which
Trading book
Austria
Belgium
Bulgaria
Cyprus
Czech Republic
Denmark
Estonia
Finland
France
Germany
Greece
Hungary
Iceland
Ireland
Italy 209 209 209
Latvia
Liechtenstein
Lithuania
Luxembourg
Malta
Netherlands
Norway
Poland
Portugal 657 657 657
Romania
Slovakia
Slovenia
Spain 7.574 7.558 16 7.574
Sweden
United Kingdom
Gross exposures (net
of impairment)
Net exposures
(net of
impairment)
BANCO POPULAR ESPAÑOL, S.A.
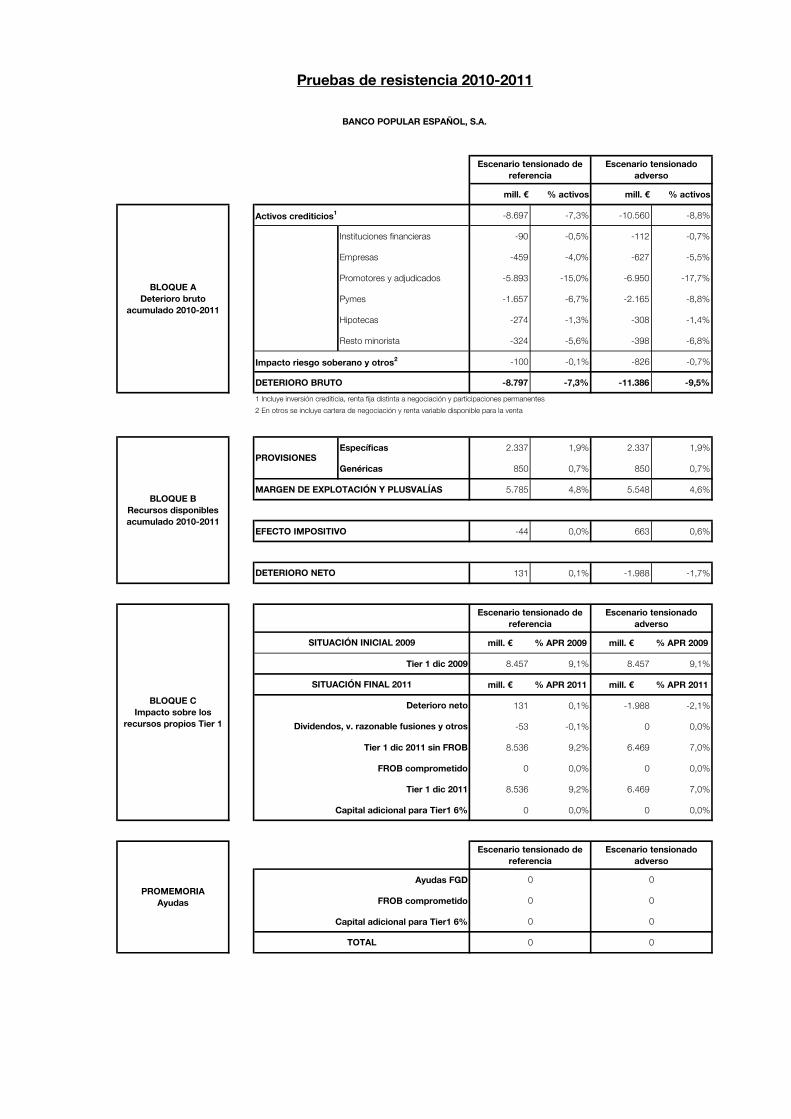
mill. € % activos mill. € % activos
Activos crediticios1 -8.697 -7,3% -10.560 -8,8%
Instituciones financieras -90 -0,5% -112 -0,7%
Empresas -459 -4,0% -627 -5,5%
Promotores y adjudicados -5.893 -15,0% -6.950 -17,7%
Pymes -1.657 -6,7% -2.165 -8,8%
Hipotecas -274 -1,3% -308 -1,4%
Resto minorista -324 -5,6% -398 -6,8%
Impacto riesgo soberano y otros2 -100 -0,1% -826 -0,7%
DETERIORO BRUTO -8.797 -7,3% -11.386 -9,5%
1 Incluye inversión crediticia, renta fija distinta a negociación y participaciones permanentes
2 En otros se incluye cartera de negociación y renta variable disponible para la venta
Específicas 2.337 1,9% 2.337 1,9%
Genéricas 850 0,7% 850 0,7%
MARGEN DE EXPLOTACIÓN Y PLUSVALÍAS 5.785 4,8% 5.548 4,6%
EFECTO IMPOSITIVO -44 0,0% 663 0,6%
131 0,1% -1.988 -1,7%
mill. € % APR 2009 mill. € % APR 2009
Tier 1 dic 2009 8.457 9,1% 8.457 9,1%
mill. € % APR 2011 mill. € % APR 2011
131 0,1% -1.988 -2,1%
-53 -0,1% 0 0,0%
Tier 1 dic 2011 sin FROB 8.536 9,2% 6.469 7,0%
FROB comprometido 0 0,0% 0 0,0%
Tier 1 dic 2011 8.536 9,2% 6.469 7,0%
Capital adicional para Tier1 6% 0 0,0% 0 0,0%
Ayudas FGD
FROB comprometido
Capital adicional para Tier1 6%
PROMEMORIA
Ayudas
Escenario tensionado de
referencia
Escenario tensionado
adverso
0 0
0 0
0 0
TOTAL 0 0
BLOQUE B
Recursos disponibles
acumulado 2010-2011
PROVISIONES
DETERIORO NETO
SITUACIÓN INICIAL 2009
BLOQUE C
Impacto sobre los
recursos propios Tier 1
Escenario tensionado de
referencia
Escenario tensionado
adverso
SITUACIÓN FINAL 2011
Deterioro neto
Dividendos, v. razonable fusiones y otros
Pruebas de resistencia 2010-2011
BANCO POPULAR ESPAÑOL, S.A.
Escenario tensionado de
referencia
Escenario tensionado
adverso
BLOQUE A
Deterioro bruto
acumulado 2010-2011

Template for bank specific publication of the stress test outputs
Name of bank: BANCO DE SABADELL, S.A.
Actual results
At December 31, 2009 mln euro
Total Tier 1 capital 5.211
Total regulatory capital 6.151
Total risk weighted assets 57.958
Pre-impairment income (including operating expenses) 1.326
Impairment losses on financial assets in the banking book -611
1 yr Loss rate on Corporate exposures (%)1
0,3%
1 yr Loss rate on Retail exposures (%)1
0,2%
Tier 1 ratio (%) 9,0 %
Outcomes of stress test scenarios
Benchmark scenario at December 31, 20112
mln euro
Total Tier 1 capital after the benchmark scenario 5.554
Total regulatory capital after the benchmark scenario 6.024
Total risk weighted assets after the benchmark scenario 57.958
Tier 1 ratio (%) after the benchmark scenario 9,6 %
Adverse scenario at December 31, 20112
mln euro
Total Tier 1 capital after the adverse scenario 4.482
Total regulatory capital after the adverse scenario 4.952
Total risk weighted assets after the adverse scenario 57.958
2 yr cumulative pre-impairment income after the adverse scenario (including operating
expenses)2 2.085
2 yr cumulative impairment losses on financial assets in the banking book after the adverse
scenario2 -4.029
2 yr cumulative losses on the trading book after the adverse scenario2
-36
2 yr Loss rate on Corporate exposures (%) after the adverse scenario1, 2
6,4%
2 yr Loss rate on Retail exposures (%) after the adverse scenario1, 2
1,0%
Tier 1 ratio (%) after the adverse scenario 7,7 %
Additional sovereign shock on the adverse scenario at December 31, 2011 mln euro
Additional impairment losses on the banking book after the sovereign shock2
-382
Additional losses on sovereign exposures in the trading book after the sovereign shock2 0
2 yr Loss rate on Corporate exposures (%) after the adverse scenario and sovereign shock1,
2, 3 6,9%
2 yr Loss rate on Retail exposures (%) after the adverse scenario and sovereign shock1, 2, 3 1,5%
Tier 1 ratio (%) after the adverse scenario and sovereign shock 7,2 %
Additional capital needed to reach a 6 % Tier 1 ratio under the adverse scenario + additional
sovereign shock, at the end of 2011-
1.Impairment losses as a % of corporate/retail exposures in AFS, HTM, and loans and receivables portfolios
2.Cumulative for 2010 and 2011
3.On the basis of losses estimated under both the adverse scenario and the additional sovereign shock
The stress test was carried out under a number of key common simplifying assumptions (e.g. constant balance sheet, uniform
treatment of securitisation exposures). Therefore, the information relative to the benchmark scenarios is provided only for
comparison purposes. Neither the benchmark scenario nor the adverse scenario should in any way be construed as a forecast.

Exposures to central and local governments
Banking group's exposure on a consolidated basis
Amount in million reporting currency
Name of bank
Reporting date 31-mar-10
of which
Banking book
of which
Trading book
Austria
Belgium
Bulgaria
Cyprus
Czech Republic
Denmark
Estonia
Finland
France 53 53 53
Germany
Greece
Hungary
Iceland
Ireland
Italy
Latvia
Liechtenstein
Lithuania
Luxembourg
Malta
Netherlands
Norway
Poland 28 28 28
Portugal 105 105 105
Romania
Slovakia
Slovenia
Spain 4.869 4.869 4.869
Sweden
United Kingdom
Gross exposures (net
of impairment)
Net exposures
(net of
impairment)
BANCO DE SABADELL, S.A.

mill. € % activos mill. € % activos
Activos crediticios1 -4.609 -5,9% -5.752 -7,4%
Instituciones financieras -67 -0,8% -80 -0,9%
Empresas -660 -4,1% -894 -5,6%
Promotores y adjudicados -2.001 -14,9% -2.364 -17,6%
Pymes -1.556 -6,6% -2.041 -8,7%
Hipotecas -115 -0,9% -135 -1,0%
Resto minorista -210 -8,3% -238 -9,5%
Impacto riesgo soberano y otros2 -230 -0,3% -820 -1,1%
DETERIORO BRUTO -4.839 -6,2% -6.572 -8,5%
1 Incluye inversión crediticia, renta fija distinta a negociación y participaciones permanentes
2 En otros se incluye cartera de negociación y renta variable disponible para la venta
Específicas 1.719 2,2% 1.719 2,2%
Genéricas 407 0,5% 407 0,5%
MARGEN DE EXPLOTACIÓN Y PLUSVALÍAS 2.795 3,6% 2.685 3,5%
EFECTO IMPOSITIVO -20 0,0% 440 0,6%
61 0,1% -1.321 -1,7%
mill. € % APR 2009 mill. € % APR 2009
Tier 1 dic 2009 5.211 9,0% 5.211 9,0%
mill. € % APR 2011 mill. € % APR 2011
61 0,1% -1.321 -2,3%
282 0,5% 306 0,5%
Tier 1 dic 2011 sin FROB 5.554 9,6% 4.196 7,2%
FROB comprometido 0 0,0% 0 0,0%
Tier 1 dic 2011 5.554 9,6% 4.196 7,2%
Capital adicional para Tier1 6% 0 0,0% 0 0,0%
Ayudas FGD
FROB comprometido
Capital adicional para Tier1 6%
PROMEMORIA
Ayudas
Escenario tensionado de
referencia
Escenario tensionado
adverso
0 0
0 0
0 0
TOTAL 0 0
BLOQUE B
Recursos disponibles
acumulado 2010-2011
PROVISIONES
DETERIORO NETO
SITUACIÓN INICIAL 2009
BLOQUE C
Impacto sobre los
recursos propios Tier 1
Escenario tensionado de
referencia
Escenario tensionado
adverso
SITUACIÓN FINAL 2011
Deterioro neto
Dividendos, v. razonable fusiones y otros
Pruebas de resistencia 2010-2011
BANCO DE SABADELL, S.A.
Escenario tensionado de
referencia
Escenario tensionado
adverso
BLOQUE A
Deterioro bruto
acumulado 2010-2011

Template for bank specific publication of the stress test outputs
Name of bank: BANKINTER, S.A.
Actual results
At December 31, 2009 mln euro
Total Tier 1 capital 2.291
Total regulatory capital 3.171
Total risk weighted assets 30.659
Pre-impairment income (including operating expenses) 599
Impairment losses on financial assets in the banking book -250
1 yr Loss rate on Corporate exposures (%)1
1,1%
1 yr Loss rate on Retail exposures (%)1
0,2%
Tier 1 ratio (%) 7,5 %
Outcomes of stress test scenarios
Benchmark scenario at December 31, 20112
mln euro
Total Tier 1 capital after the benchmark scenario 2.574
Total regulatory capital after the benchmark scenario 3.246
Total risk weighted assets after the benchmark scenario 30.665
Tier 1 ratio (%) after the benchmark scenario 8,4 %
Adverse scenario at December 31, 20112
mln euro
Total Tier 1 capital after the adverse scenario 2.336
Total regulatory capital after the adverse scenario 3.008
Total risk weighted assets after the adverse scenario 30.665
2 yr cumulative pre-impairment income after the adverse scenario (including operating
expenses)2 1.018
2 yr cumulative impairment losses on financial assets in the banking book after the adverse
scenario2 -1.091
2 yr cumulative losses on the trading book after the adverse scenario2
-80
2 yr Loss rate on Corporate exposures (%) after the adverse scenario1, 2
4,6%
2 yr Loss rate on Retail exposures (%) after the adverse scenario1, 2
1,0%
Tier 1 ratio (%) after the adverse scenario 7,6 %
Additional sovereign shock on the adverse scenario at December 31, 2011 mln euro
Additional impairment losses on the banking book after the sovereign shock2
-265
Additional losses on sovereign exposures in the trading book after the sovereign shock2 -163
2 yr Loss rate on Corporate exposures (%) after the adverse scenario and sovereign shock1,
2, 3 5,1%
2 yr Loss rate on Retail exposures (%) after the adverse scenario and sovereign shock1, 2, 3 1,5%
Tier 1 ratio (%) after the adverse scenario and sovereign shock 6,8 %
Additional capital needed to reach a 6 % Tier 1 ratio under the adverse scenario + additional
sovereign shock, at the end of 2011-
1.Impairment losses as a % of corporate/retail exposures in AFS, HTM, and loans and receivables portfolios
2.Cumulative for 2010 and 2011
3.On the basis of losses estimated under both the adverse scenario and the additional sovereign shock
The stress test was carried out under a number of key common simplifying assumptions (e.g. constant balance sheet, uniform
treatment of securitisation exposures). Therefore, the information relative to the benchmark scenarios is provided only for
comparison purposes. Neither the benchmark scenario nor the adverse scenario should in any way be construed as a forecast.

Exposures to central and local governments
Banking group's exposure on a consolidated basis
Amount in million reporting currency
Name of bank
Reporting date 31-mar-10
of which
Banking book
of which
Trading book
Austria
Belgium 13 13 13
Bulgaria
Cyprus
Czech Republic
Denmark 2 2 2
Estonia
Finland
France 390 390 390
Germany 175 175 175
Greece
Hungary
Iceland
Ireland
Italy 69 69 69
Latvia
Liechtenstein
Lithuania
Luxembourg
Malta
Netherlands 15 15 15
Norway
Poland
Portugal
Romania
Slovakia
Slovenia
Spain 1.735 1.735 1.735
Sweden
United Kingdom
Gross exposures (net
of impairment)
Net exposures
(net of
impairment)
BANKINTER, S.A.

mill. € % activos mill. € % activos
Activos crediticios1 -1.561 -3,1% -1.943 -3,8%
Instituciones financieras -58 -0,8% -69 -1,0%
Empresas -332 -4,4% -442 -5,8%
Promotores y adjudicados -272 -16,8% -312 -19,3%
Pymes -491 -6,9% -634 -9,0%
Hipotecas -182 -0,8% -210 -0,9%
Resto minorista -227 -5,8% -276 -7,1%
Impacto riesgo soberano y otros2 -55 -0,1% -533 -1,0%
DETERIORO BRUTO -1.616 -3,2% -2.477 -4,9%
1 Incluye inversión crediticia, renta fija distinta a negociación y participaciones permanentes
2 En otros se incluye cartera de negociación y renta variable disponible para la venta
Específicas 482 0,9% 482 0,9%
Genéricas 397 0,8% 397 0,8%
MARGEN DE EXPLOTACIÓN Y PLUSVALÍAS 1.367 2,7% 1.313 2,6%
EFECTO IMPOSITIVO -157 -0,3% 71 0,1%
472 0,9% -214 -0,4%
mill. € % APR 2009 mill. € % APR 2009
Tier 1 dic 2009 2.291 7,5% 2.291 7,5%
mill. € % APR 2011 mill. € % APR 2011
472 1,5% -214 -0,7%
-189 -0,6% 0 0,0%
Tier 1 dic 2011 sin FROB 2.574 8,4% 2.077 6,8%
FROB comprometido 0 0,0% 0 0,0%
Tier 1 dic 2011 2.574 8,4% 2.077 6,8%
Capital adicional para Tier1 6% 0 0,0% 0 0,0%
Ayudas FGD
FROB comprometido
Capital adicional para Tier1 6%
PROMEMORIA
Ayudas
Escenario tensionado de
referencia
Escenario tensionado
adverso
0 0
0 0
0 0
TOTAL 0 0
BLOQUE B
Recursos disponibles
acumulado 2010-2011
PROVISIONES
DETERIORO NETO
SITUACIÓN INICIAL 2009
BLOQUE C
Impacto sobre los
recursos propios Tier 1
Escenario tensionado de
referencia
Escenario tensionado
adverso
SITUACIÓN FINAL 2011
Deterioro neto
Dividendos, v. razonable fusiones y otros
Pruebas de resistencia 2010-2011
BANKINTER, S.A.
Escenario tensionado de
referencia
Escenario tensionado
adverso
BLOQUE A
Deterioro bruto
acumulado 2010-2011
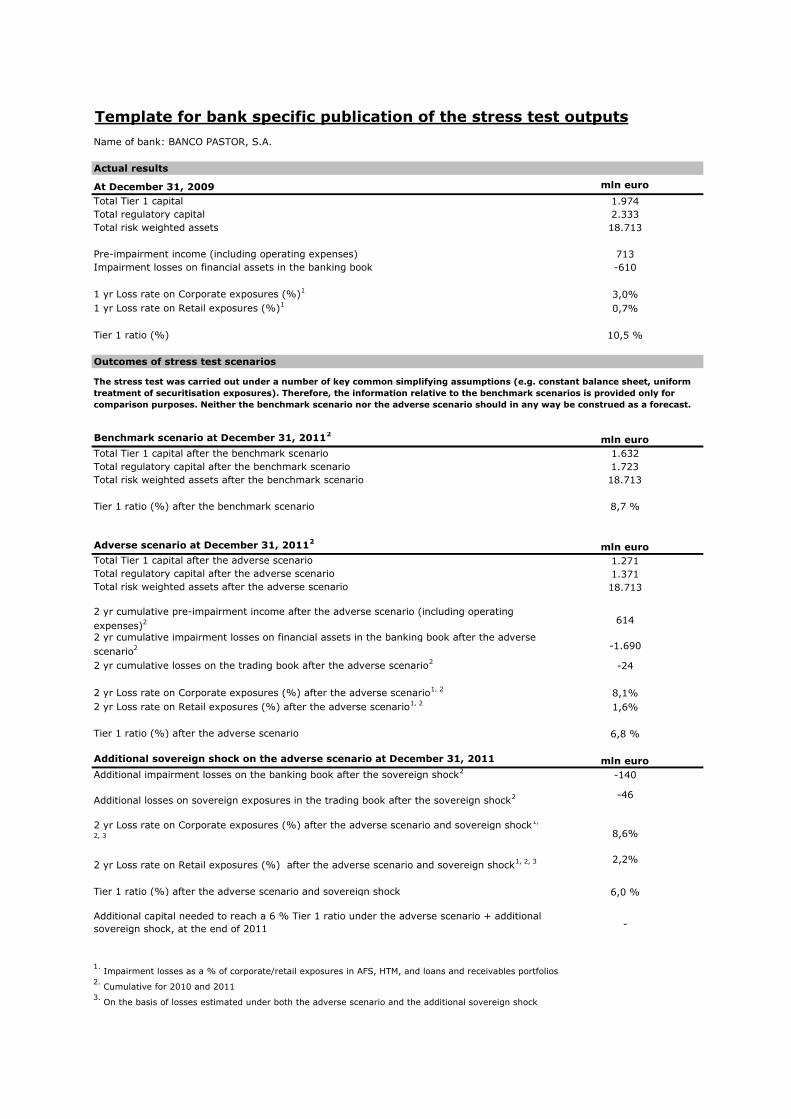
Template for bank specific publication of the stress test outputs
Name of bank: BANCO PASTOR, S.A.
Actual results
At December 31, 2009 mln euro
Total Tier 1 capital 1.974
Total regulatory capital 2.333
Total risk weighted assets 18.713
Pre-impairment income (including operating expenses) 713
Impairment losses on financial assets in the banking book -610
1 yr Loss rate on Corporate exposures (%)1
3,0%
1 yr Loss rate on Retail exposures (%)1
0,7%
Tier 1 ratio (%) 10,5 %
Outcomes of stress test scenarios
Benchmark scenario at December 31, 20112
mln euro
Total Tier 1 capital after the benchmark scenario 1.632
Total regulatory capital after the benchmark scenario 1.723
Total risk weighted assets after the benchmark scenario 18.713
Tier 1 ratio (%) after the benchmark scenario 8,7 %
Adverse scenario at December 31, 20112
mln euro
Total Tier 1 capital after the adverse scenario 1.271
Total regulatory capital after the adverse scenario 1.371
Total risk weighted assets after the adverse scenario 18.713
2 yr cumulative pre-impairment income after the adverse scenario (including operating
expenses)2 614
2 yr cumulative impairment losses on financial assets in the banking book after the adverse
scenario2 -1.690
2 yr cumulative losses on the trading book after the adverse scenario2
-24
2 yr Loss rate on Corporate exposures (%) after the adverse scenario1, 2
8,1%
2 yr Loss rate on Retail exposures (%) after the adverse scenario1, 2
1,6%
Tier 1 ratio (%) after the adverse scenario 6,8 %
Additional sovereign shock on the adverse scenario at December 31, 2011 mln euro
Additional impairment losses on the banking book after the sovereign shock2
-140
Additional losses on sovereign exposures in the trading book after the sovereign shock2 -46
2 yr Loss rate on Corporate exposures (%) after the adverse scenario and sovereign shock1,
2, 3 8,6%
2 yr Loss rate on Retail exposures (%) after the adverse scenario and sovereign shock1, 2, 3 2,2%
Tier 1 ratio (%) after the adverse scenario and sovereign shock 6,0 %
Additional capital needed to reach a 6 % Tier 1 ratio under the adverse scenario + additional
sovereign shock, at the end of 2011-
1.Impairment losses as a % of corporate/retail exposures in AFS, HTM, and loans and receivables portfolios
2.Cumulative for 2010 and 2011
3.On the basis of losses estimated under both the adverse scenario and the additional sovereign shock
The stress test was carried out under a number of key common simplifying assumptions (e.g. constant balance sheet, uniform
treatment of securitisation exposures). Therefore, the information relative to the benchmark scenarios is provided only for
comparison purposes. Neither the benchmark scenario nor the adverse scenario should in any way be construed as a forecast.

Exposures to central and local governments
Banking group's exposure on a consolidated basis
Amount in million reporting currency
Name of bank
Reporting date 31-mar-10
of which
Banking book
of which
Trading book
Austria
Belgium
Bulgaria
Cyprus
Czech Republic
Denmark
Estonia
Finland
France
Germany
Greece 40 40 0 40
Hungary
Iceland
Ireland
Italy 103 103 0 103
Latvia
Liechtenstein
Lithuania
Luxembourg
Malta
Netherlands
Norway
Poland
Portugal 115 115 0 115
Romania
Slovakia
Slovenia
Spain 2.693 2.243 450 2.693
Sweden
United Kingdom
Gross exposures (net
of impairment)
Net exposures
(net of
impairment)
BANCO PASTOR, S.A.

mill. € % activos mill. € % activos
Activos crediticios1 -2.261 -7,6% -2.682 -9,0%
Instituciones financieras -55 -1,0% -66 -1,2%
Empresas -223 -4,7% -290 -6,2%
Promotores y adjudicados -1.507 -16,9% -1.728 -19,3%
Pymes -341 -6,9% -442 -9,0%
Hipotecas -75 -1,5% -84 -1,7%
Resto minorista -61 -5,8% -74 -7,1%
Impacto riesgo soberano y otros2 -31 -0,1% -245 -0,8%
DETERIORO BRUTO -2.292 -7,7% -2.927 -9,8%
1 Incluye inversión crediticia, renta fija distinta a negociación y participaciones permanentes
2 En otros se incluye cartera de negociación y renta variable disponible para la venta
Específicas 724 2,4% 724 2,4%
Genéricas 304 1,0% 304 1,0%
MARGEN DE EXPLOTACIÓN Y PLUSVALÍAS 846 2,8% 814 2,7%
EFECTO IMPOSITIVO 105 0,4% 271 0,9%
-314 -1,1% -814 -2,7%
mill. € % APR 2009 mill. € % APR 2009
Tier 1 dic 2009 1.974 10,5% 1.974 10,5%
mill. € % APR 2011 mill. € % APR 2011
-314 -1,7% -814 -4,4%
-29 -0,2% -29 -0,2%
Tier 1 dic 2011 sin FROB 1.632 8,7% 1.131 6,0%
FROB comprometido 0 0,0% 0 0,0%
Tier 1 dic 2011 1.632 8,7% 1.131 6,0%
Capital adicional para Tier1 6% 0 0,0% 0 0,0%
Ayudas FGD
FROB comprometido
Capital adicional para Tier1 6%
PROMEMORIA
Ayudas
Escenario tensionado de
referencia
Escenario tensionado
adverso
0 0
0 0
0 0
TOTAL 0 0
BLOQUE B
Recursos disponibles
acumulado 2010-2011
PROVISIONES
DETERIORO NETO
SITUACIÓN INICIAL 2009
BLOQUE C
Impacto sobre los
recursos propios Tier 1
Escenario tensionado de
referencia
Escenario tensionado
adverso
SITUACIÓN FINAL 2011
Deterioro neto
Dividendos, v. razonable fusiones y otros
Pruebas de resistencia 2010-2011
BANCO PASTOR, S.A.
Escenario tensionado de
referencia
Escenario tensionado
adverso
BLOQUE A
Deterioro bruto
acumulado 2010-2011

Template for bank specific publication of the stress test outputs
Name of bank: BANCA MARCH, S.A.
Actual results
At December 31, 2009 mln euro
Total Tier 1 capital 1.866
Total regulatory capital 1.866
Total risk weighted assets 9.488
Pre-impairment income (including operating expenses) 512
Impairment losses on financial assets in the banking book -167
1 yr Loss rate on Corporate exposures (%)1
1,7%
1 yr Loss rate on Retail exposures (%)1
0,6%
Tier 1 ratio (%) 19,7 %
Outcomes of stress test scenarios
Benchmark scenario at December 31, 20112
mln euro
Total Tier 1 capital after the benchmark scenario 1.973
Total regulatory capital after the benchmark scenario 1.973
Total risk weighted assets after the benchmark scenario 9.488
Tier 1 ratio (%) after the benchmark scenario 20,8 %
Adverse scenario at December 31, 20112
mln euro
Total Tier 1 capital after the adverse scenario 1.849
Total regulatory capital after the adverse scenario 1.849
Total risk weighted assets after the adverse scenario 9.488
2 yr cumulative pre-impairment income after the adverse scenario (including operating
expenses)2 206
2 yr cumulative impairment losses on financial assets in the banking book after the adverse
scenario2 -661
2 yr cumulative losses on the trading book after the adverse scenario2
-6
2 yr Loss rate on Corporate exposures (%) after the adverse scenario1, 2
5,5%
2 yr Loss rate on Retail exposures (%) after the adverse scenario1, 2
1,0%
Tier 1 ratio (%) after the adverse scenario 19,5 %
Additional sovereign shock on the adverse scenario at December 31, 2011 mln euro
Additional impairment losses on the banking book after the sovereign shock2
-68
Additional losses on sovereign exposures in the trading book after the sovereign shock2 0
2 yr Loss rate on Corporate exposures (%) after the adverse scenario and sovereign shock1,
2, 3 6,1%
2 yr Loss rate on Retail exposures (%) after the adverse scenario and sovereign shock1, 2, 3 1,8%
Tier 1 ratio (%) after the adverse scenario and sovereign shock 19,0 %
Additional capital needed to reach a 6 % Tier 1 ratio under the adverse scenario + additional
sovereign shock, at the end of 2011-
1.Impairment losses as a % of corporate/retail exposures in AFS, HTM, and loans and receivables portfolios
2.Cumulative for 2010 and 2011
3.On the basis of losses estimated under both the adverse scenario and the additional sovereign shock
The stress test was carried out under a number of key common simplifying assumptions (e.g. constant balance sheet, uniform
treatment of securitisation exposures). Therefore, the information relative to the benchmark scenarios is provided only for
comparison purposes. Neither the benchmark scenario nor the adverse scenario should in any way be construed as a forecast.

Exposures to central and local governments
Banking group's exposure on a consolidated basis
Amount in million reporting currency
Name of bank
Reporting date 31-mar-10
of which
Banking book
of which
Trading book
Austria
Belgium
Bulgaria
Cyprus
Czech Republic
Denmark
Estonia
Finland
France
Germany
Greece
Hungary
Iceland
Ireland
Italy
Latvia
Liechtenstein
Lithuania
Luxembourg
Malta
Netherlands
Norway
Poland
Portugal
Romania
Slovakia
Slovenia
Spain 105 105 105
Sweden
United Kingdom
Gross exposures (net
of impairment)
Net exposures
(net of
impairment)
BANCA MARCH, S.A.
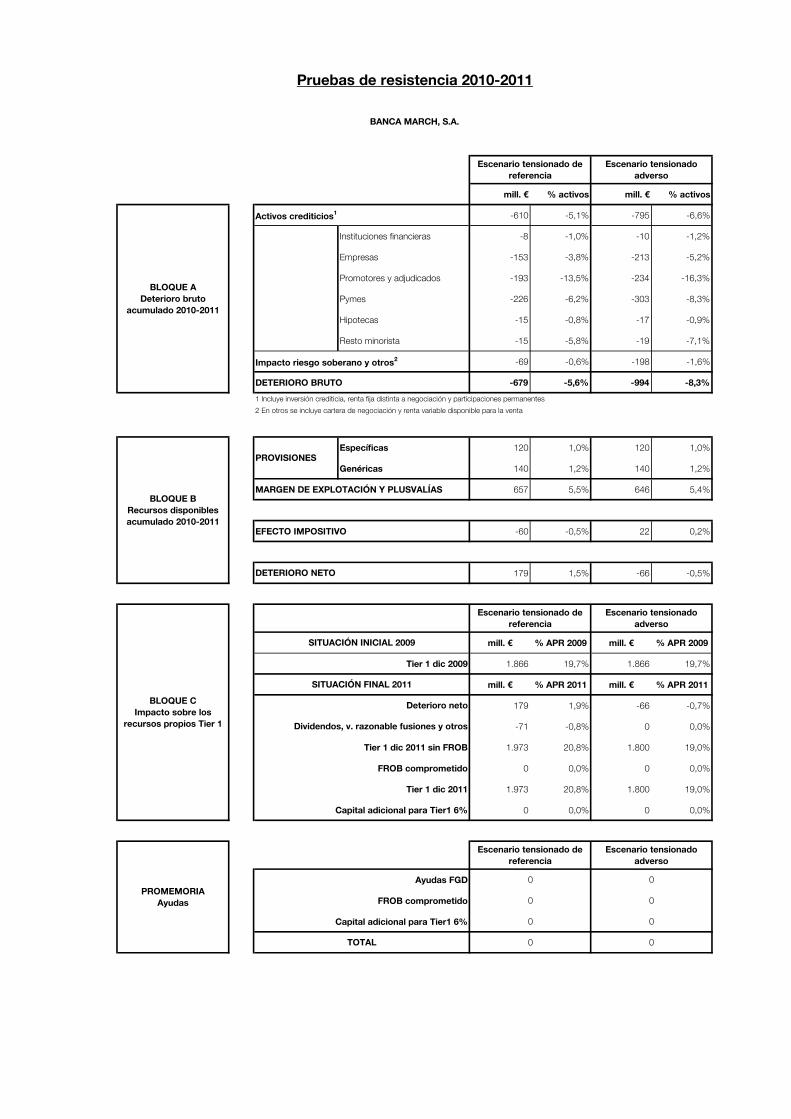
mill. € % activos mill. € % activos
Activos crediticios1 -610 -5,1% -795 -6,6%
Instituciones financieras -8 -1,0% -10 -1,2%
Empresas -153 -3,8% -213 -5,2%
Promotores y adjudicados -193 -13,5% -234 -16,3%
Pymes -226 -6,2% -303 -8,3%
Hipotecas -15 -0,8% -17 -0,9%
Resto minorista -15 -5,8% -19 -7,1%
Impacto riesgo soberano y otros2 -69 -0,6% -198 -1,6%
DETERIORO BRUTO -679 -5,6% -994 -8,3%
1 Incluye inversión crediticia, renta fija distinta a negociación y participaciones permanentes
2 En otros se incluye cartera de negociación y renta variable disponible para la venta
Específicas 120 1,0% 120 1,0%
Genéricas 140 1,2% 140 1,2%
MARGEN DE EXPLOTACIÓN Y PLUSVALÍAS 657 5,5% 646 5,4%
EFECTO IMPOSITIVO -60 -0,5% 22 0,2%
179 1,5% -66 -0,5%
mill. € % APR 2009 mill. € % APR 2009
Tier 1 dic 2009 1.866 19,7% 1.866 19,7%
mill. € % APR 2011 mill. € % APR 2011
179 1,9% -66 -0,7%
-71 -0,8% 0 0,0%
Tier 1 dic 2011 sin FROB 1.973 20,8% 1.800 19,0%
FROB comprometido 0 0,0% 0 0,0%
Tier 1 dic 2011 1.973 20,8% 1.800 19,0%
Capital adicional para Tier1 6% 0 0,0% 0 0,0%
Ayudas FGD
FROB comprometido
Capital adicional para Tier1 6%
PROMEMORIA
Ayudas
Escenario tensionado de
referencia
Escenario tensionado
adverso
0 0
0 0
0 0
TOTAL 0 0
BLOQUE B
Recursos disponibles
acumulado 2010-2011
PROVISIONES
DETERIORO NETO
SITUACIÓN INICIAL 2009
BLOQUE C
Impacto sobre los
recursos propios Tier 1
Escenario tensionado de
referencia
Escenario tensionado
adverso
SITUACIÓN FINAL 2011
Deterioro neto
Dividendos, v. razonable fusiones y otros
Pruebas de resistencia 2010-2011
BANCA MARCH, S.A.
Escenario tensionado de
referencia
Escenario tensionado
adverso
BLOQUE A
Deterioro bruto
acumulado 2010-2011

Template for bank specific publication of the stress test outputs
Name of bank: BANCO GUIPUZCOANO, S.A.
Actual results
At December 31, 2009 mln euro
Total Tier 1 capital 709
Total regulatory capital 981
Total risk weighted assets 7.813
Pre-impairment income (including operating expenses) 112
Impairment losses on financial assets in the banking book -98
1 yr Loss rate on Corporate exposures (%)1
1,4%
1 yr Loss rate on Retail exposures (%)1
0,6%
Tier 1 ratio (%) 9,1 %
Outcomes of stress test scenarios
Benchmark scenario at December 31, 20112
mln euro
Total Tier 1 capital after the benchmark scenario 632
Total regulatory capital after the benchmark scenario 770
Total risk weighted assets after the benchmark scenario 7.814
Tier 1 ratio (%) after the benchmark scenario 8,1 %
Adverse scenario at December 31, 20112
mln euro
Total Tier 1 capital after the adverse scenario 516
Total regulatory capital after the adverse scenario 654
Total risk weighted assets after the adverse scenario 7.814
2 yr cumulative pre-impairment income after the adverse scenario (including operating
expenses)2 156
2 yr cumulative impairment losses on financial assets in the banking book after the adverse
scenario2 -463
2 yr cumulative losses on the trading book after the adverse scenario2
-6
2 yr Loss rate on Corporate exposures (%) after the adverse scenario1, 2
7,0%
2 yr Loss rate on Retail exposures (%) after the adverse scenario1, 2
1,2%
Tier 1 ratio (%) after the adverse scenario 6,6 %
Additional sovereign shock on the adverse scenario at December 31, 2011 mln euro
Additional impairment losses on the banking book after the sovereign shock2
-48
Additional losses on sovereign exposures in the trading book after the sovereign shock2 -8
2 yr Loss rate on Corporate exposures (%) after the adverse scenario and sovereign shock1,
2, 3 7,5%
2 yr Loss rate on Retail exposures (%) after the adverse scenario and sovereign shock1, 2, 3 1,7%
Tier 1 ratio (%) after the adverse scenario and sovereign shock 6,1 %
Additional capital needed to reach a 6 % Tier 1 ratio under the adverse scenario + additional
sovereign shock, at the end of 2011-
1.Impairment losses as a % of corporate/retail exposures in AFS, HTM, and loans and receivables portfolios
2.Cumulative for 2010 and 2011
3.On the basis of losses estimated under both the adverse scenario and the additional sovereign shock
The stress test was carried out under a number of key common simplifying assumptions (e.g. constant balance sheet, uniform
treatment of securitisation exposures). Therefore, the information relative to the benchmark scenarios is provided only for
comparison purposes. Neither the benchmark scenario nor the adverse scenario should in any way be construed as a forecast.
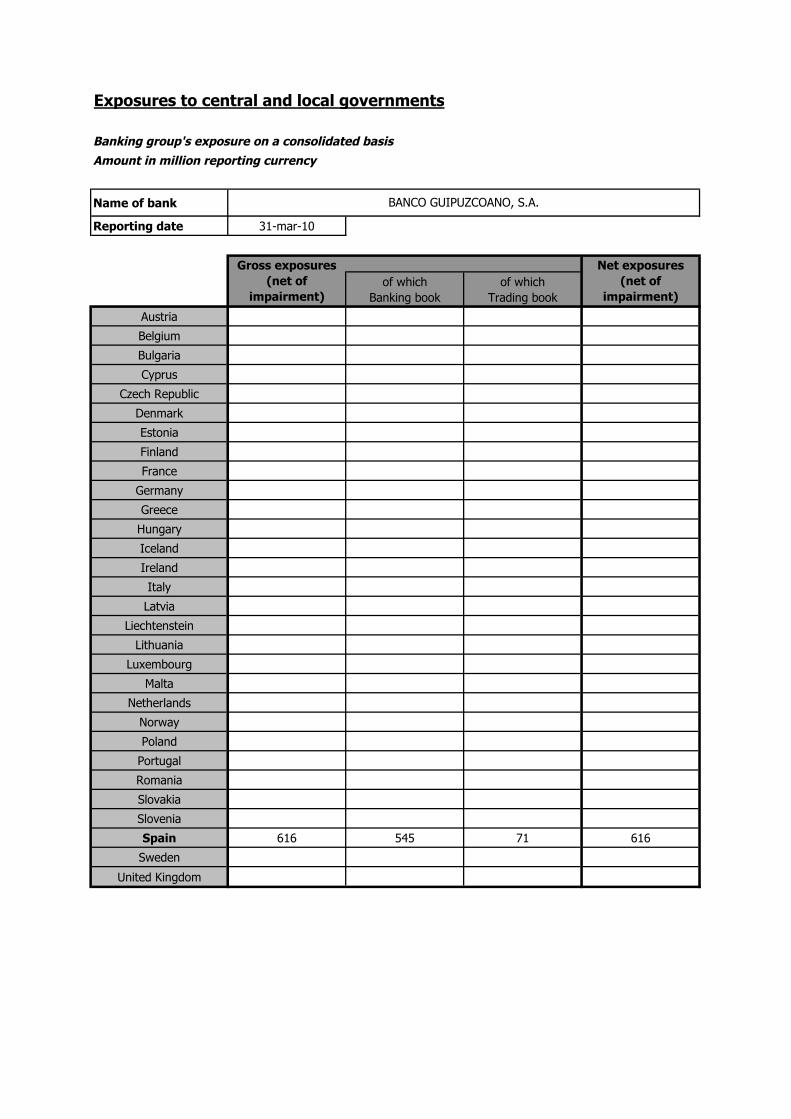
Exposures to central and local governments
Banking group's exposure on a consolidated basis
Amount in million reporting currency
Name of bank
Reporting date 31-mar-10
of which
Banking book
of which
Trading book
Austria
Belgium
Bulgaria
Cyprus
Czech Republic
Denmark
Estonia
Finland
France
Germany
Greece
Hungary
Iceland
Ireland
Italy
Latvia
Liechtenstein
Lithuania
Luxembourg
Malta
Netherlands
Norway
Poland
Portugal
Romania
Slovakia
Slovenia
Spain 616 545 71 616
Sweden
United Kingdom
Gross exposures
(net of
impairment)
Net exposures
(net of
impairment)
BANCO GUIPUZCOANO, S.A.
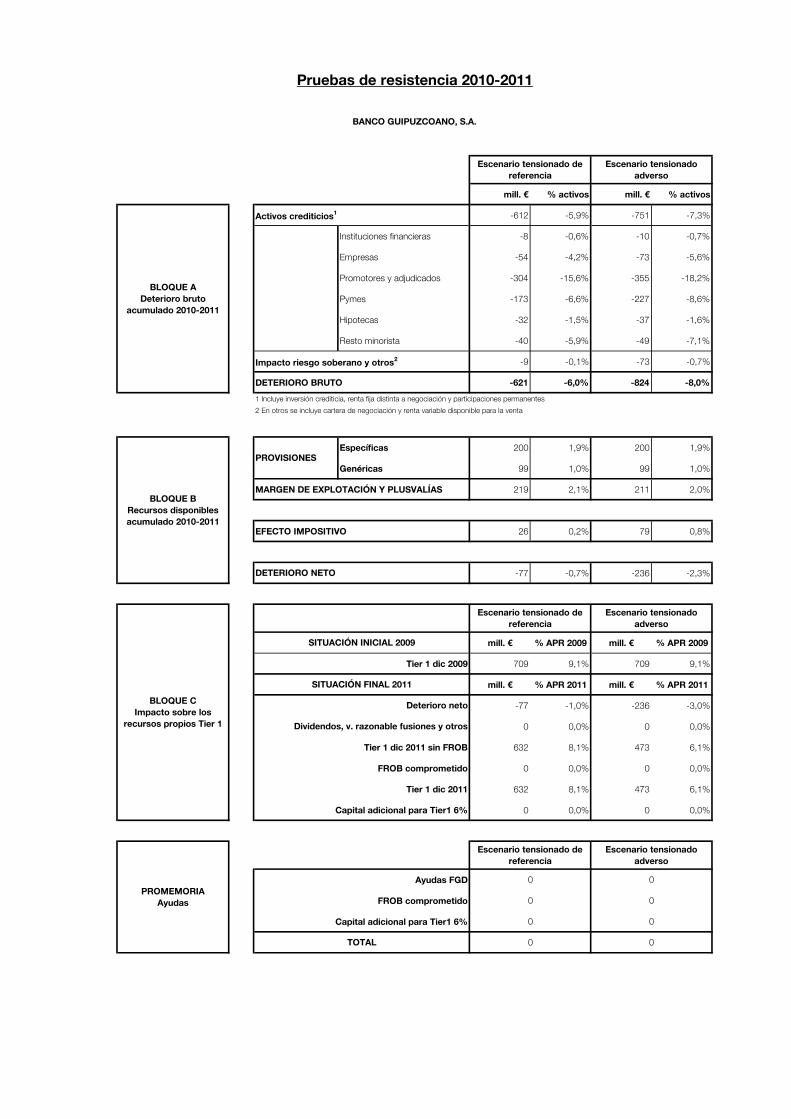
mill. € % activos mill. € % activos
Activos crediticios1 -612 -5,9% -751 -7,3%
Instituciones financieras -8 -0,6% -10 -0,7%
Empresas -54 -4,2% -73 -5,6%
Promotores y adjudicados -304 -15,6% -355 -18,2%
Pymes -173 -6,6% -227 -8,6%
Hipotecas -32 -1,5% -37 -1,6%
Resto minorista -40 -5,9% -49 -7,1%
Impacto riesgo soberano y otros2 -9 -0,1% -73 -0,7%
DETERIORO BRUTO -621 -6,0% -824 -8,0%
1 Incluye inversión crediticia, renta fija distinta a negociación y participaciones permanentes
2 En otros se incluye cartera de negociación y renta variable disponible para la venta
Específicas 200 1,9% 200 1,9%
Genéricas 99 1,0% 99 1,0%
MARGEN DE EXPLOTACIÓN Y PLUSVALÍAS 219 2,1% 211 2,0%
EFECTO IMPOSITIVO 26 0,2% 79 0,8%
-77 -0,7% -236 -2,3%
mill. € % APR 2009 mill. € % APR 2009
Tier 1 dic 2009 709 9,1% 709 9,1%
mill. € % APR 2011 mill. € % APR 2011
-77 -1,0% -236 -3,0%
0 0,0% 0 0,0%
Tier 1 dic 2011 sin FROB 632 8,1% 473 6,1%
FROB comprometido 0 0,0% 0 0,0%
Tier 1 dic 2011 632 8,1% 473 6,1%
Capital adicional para Tier1 6% 0 0,0% 0 0,0%
Ayudas FGD
FROB comprometido
Capital adicional para Tier1 6%
PROMEMORIA
Ayudas
Escenario tensionado de
referencia
Escenario tensionado
adverso
0 0
0 0
0 0
TOTAL 0 0
BLOQUE B
Recursos disponibles
acumulado 2010-2011
PROVISIONES
DETERIORO NETO
SITUACIÓN INICIAL 2009
BLOQUE C
Impacto sobre los
recursos propios Tier 1
Escenario tensionado de
referencia
Escenario tensionado
adverso
SITUACIÓN FINAL 2011
Deterioro neto
Dividendos, v. razonable fusiones y otros
Pruebas de resistencia 2010-2011
BANCO GUIPUZCOANO, S.A.
Escenario tensionado de
referencia
Escenario tensionado
adverso
BLOQUE A
Deterioro bruto
acumulado 2010-2011