template br_rec_2005.dot - itu: committed to … · web viewnote 1 – the reference model above...
TRANSCRIPT

Recommendation ITU-R S.1711-1(01/2010)
Performance enhancements of transmission control protocol over
satellite networks
S SeriesFixed-satellite service
ii Rec. ITU-R S.1711-1
Foreword
The role of the Radiocommunication Sector is to ensure the rational, equitable, efficient and economical use of the radio-frequency spectrum by all radiocommunication services, including satellite services, and carry out studies without limit of frequency range on the basis of which Recommendations are adopted.
The regulatory and policy functions of the Radiocommunication Sector are performed by World and Regional Radiocommunication Conferences and Radiocommunication Assemblies supported by Study Groups.
Policy on Intellectual Property Right (IPR)
ITU-R policy on IPR is described in the Common Patent Policy for ITU-T/ITU-R/ISO/IEC referenced in Annex 1 of Resolution ITU-R 1. Forms to be used for the submission of patent statements and licensing declarations by patent holders are available from http://www.itu.int/ITU-R/go/patents/en where the Guidelines for Implementation of the Common Patent Policy for ITU-T/ITU-R/ISO/IEC and the ITU-R patent information database can also be found.
Series of ITU-R Recommendations (Also available online at http://www.itu.int/publ/R-REC/en)
Series Title
BO Satellite deliveryBR Recording for production, archival and play-out; film for televisionBS Broadcasting service (sound)BT Broadcasting service (television)F Fixed serviceM Mobile, radiodetermination, amateur and related satellite servicesP Radiowave propagationRA Radio astronomyRS Remote sensing systemsS Fixed-satellite serviceSA Space applications and meteorologySF Frequency sharing and coordination between fixed-satellite and fixed service systemsSM Spectrum managementSNG Satellite news gatheringTF Time signals and frequency standards emissionsV Vocabulary and related subjects
Note: This ITU-R Recommendation was approved in English under the procedure detailed in Resolution ITU-R 1.
Electronic PublicationGeneva, 2010
ITU 2010
All rights reserved. No part of this publication may be reproduced, by any means whatsoever, without written permission of ITU.

Rec. ITU-R S.1711-1
RECOMMENDATION ITU-R S.1711-1
Performance enhancements of transmission control protocol over satellite networks
(Question ITU-R 263-1/4)
(2005-2010)
Scope
Most of the current IP transmissions use transmission control protocol (TCP) as transport protocol. However the TCP protocol presents some shortcomings when used in satellite networks. Therefore various techniques, collectively referred to as “TCP performance enhancements”, were developed in order to overcome these limitations. This Recommendation provides test results and measurements of a number of such techniques in order to get a more accurate view of their effectiveness and appropriateness depending on the type of satellite network.
The ITU Radiocommunication Assembly,
considering
a) that satellite systems are being used increasingly for Internet protocol (IP) packet transmissions, in particular providing broadband applications directly to users in addition to their role as backbone links;
b) that transmission of IP packets on satellite links requires performance objectives different from those contained in Recommendation ITU-T G.826 and Recommendations ITU-R S.1062 and ITU-R S.1420;
c) that the performance of transmission control protocol (TCP) may suffer from degradation due to long satellite transmission delay, which affects the quality of service of end-user's applications;
d) that the enhancement of TCP performance is therefore critical in designing satellite links to carry IP packets;
e) that radio frequency resources are not efficiently utilized without implementing any performance enhancement of TCP over satellite in some network environments,
noting
a) that enhancing the performance of TCP may not be required for low throughput links (see § 3.1 of Report ITU-R S.2148),
recommends
1 that the reference models, set out in Annex 1 of this Recommendation, should be considered as a basis when developing methods to enhance TCP performance over satellite links;
2 that system designers implementing TCP connections in networks including satellite links should assess the appropriateness of a specific TCP performance enhancement method for their system based on the results of simulations and measurements as contained in Annex 2;
1

Rec. ITU-R S.1711-1
3 that, in order not to affect TCP throughput, satellite links intended to carry such TCP-based transmissions should be designed to ensure that the bit-error ratio is better than 10−7 during the available time (see § 2 of Annex 2);
4 that, in order to improve the throughput of TCP-based transmissions over networks including satellite links:
4.1 splitting techniques (whether associated or not to caching) should be implemented when the network topology permits it (see § 2, 3 and 5 of Annex 2);
4.2 the TCP window scale option should be used to set the TCP congestion window to the maximum feasible value (see Note 1 and § 4 of Annex 2);
5 that the following Note 1 should be considered as part of this Recommendation.
NOTE 1 – Large TCP windows generate burst traffic, which could result in packet losses in intermediate routers due to buffer saturation. Buffer saturation can be alleviated by implementing larger buffers in the intermediate routers or traffic control at the TCP source (see § 4 of Annex 2). In cases where such implementations are not practical, the maximum value of the TCP congestion window should be set by taking into account the potential buffer saturation at intermediate routers.
NOTE 2 – Report ITU-R S.2148 provides background material on some shortcomings of the TCP when used in satellite networks as well as an overview of TCP performance enhancements, briefly describing them and indicating the areas where they improve the performance of TCP over satellite networks.
NOTE 3 – Section 6 of Annex 2 contains results of measurements performed to assess the effectiveness of enhancements of two typical TCP-based applications (file transfer protocol (FTP) and hypertext transfer protocol (HTTP)).
2

Rec. ITU-R S.1711-1
TABLE OF CONTENTS
Page
Annex 1 – Satellite system reference models........................................................................... 7
1 Scope............................................................................................................................... 7
2 Reference models............................................................................................................ 7
2.1 Point-to-point links............................................................................................. 7
2.2 VSAT networks................................................................................................... 7
2.2.1 Star topology........................................................................................ 7
2.2.2 Mesh topology...................................................................................... 8
2.3 Broadband access................................................................................................ 8
Annex 2 – Tests and measured performance of TCP enhancements....................................... 9
1 Scope............................................................................................................................... 9
2 TCP performance with splitting enhancement................................................................ 9
2.1 Single TCP connection performance tested without any improvement.............. 9
2.1.1 Single TCP connection performance testing........................................ 9
2.1.2 TCP without performance enhancement.............................................. 9
2.1.3 Performance of single TCP connection without performance enhancement......................................................................................... 9
2.2 Two-segment splitting......................................................................................... 10
2.2.1 Configuration of satellite networks...................................................... 10
2.2.2 Tests results.......................................................................................... 12
2.2.3 Summary............................................................................................... 18
2.3 Three-segment splitting....................................................................................... 18
2.3.1 Configuration of satellite networks...................................................... 18
2.3.2 Test procedures..................................................................................... 19
2.3.3 Test results............................................................................................ 19
2.3.4 Summary............................................................................................... 24
3 Tests and measurements of TCP over satellite using caching and spoofing.................. 24
3.1 Introduction......................................................................................................... 24
3.2 Tests and measurements...................................................................................... 25
3
Rec. ITU-R S.1711-1
Page
3.2.1 Equipment specifications...................................................................... 25
3.2.2 Network configurations for tests and measurements............................ 26
3.2.3 Test and measurement results............................................................... 27
3.3 Summary............................................................................................................. 29
4 TCP performance over a satellite ATM network............................................................ 29
4.1 Network configuration........................................................................................ 29
4.2 TCP performance in ATM-based satellite-only network.................................... 31
4.3 TCP behaviours in heterogeneous networks including satellite link.................. 32
4.3.1 Simulation of buffer size...................................................................... 33
4.3.2 TCP performance with traffic control in TCP sender.......................... 35
4.4 Summary............................................................................................................. 37
5 TCP performance in satellite access networks................................................................ 37
5.1 Network architecture and configuration.............................................................. 37
5.1.1 Network architecture............................................................................ 37
5.1.2 Configuration........................................................................................ 38
5.2 Results of performance measurement................................................................. 40
5.2.1 Availability........................................................................................... 40
5.2.2 Throughput........................................................................................... 40
5.2.3 Traffic................................................................................................... 42
5.3 Summary............................................................................................................. 42
6 Application protocol measurements (FTP and HTTP)................................................... 42
6.1 Satellite ATM network configuration................................................................. 43
6.2 FTP throughput over OC-3 satellite link............................................................. 44
6.3 HTTP throughput over OC-3 satellite link.......................................................... 46
6.3.1 HTTP 1.0 with non-persistent connections.......................................... 46
6.3.2 HTTP 1.0 with “keep-alive” option...................................................... 46
6.3.3 HTTP 1.1 without pipelining................................................................ 46
6.3.4 HTTP 1.1 with pipelining..................................................................... 47
6.3.5 Test results............................................................................................ 47
6.4 Summary............................................................................................................. 50
7 Conclusions..................................................................................................................... 50
4

Rec. ITU-R S.1711-1
List of acronyms
AAL ATM adaptation layerACK AcknowledgementATM Asynchronous transfer modeBDP Bandwidth delay productBER Bit-error ratioBW BandwidthCE Congestion experience bitCPU Central processing unitcwnd Congestion window (variable in TCP)DA Dedicated accessDACK Delayed acknowledgementDAMA Demand assignment multiple accessDVB-S Digital video broadcast via satelliteECN Explicit congestion notificatione.i.r.p. Equivalent isotropically radiated powerFEC Forward error correctionFIN Final segment (in a TCP connection)FTP File transfer protocolG/T Gain to equivalent system temperature ratioGSO Geostationary satellite orbitGW GatewayHPA Hub page acceleratorHSP Hub satellite processorHTML Hypertext markup languageHTTP Hypertext transfer protocolICMP Internet control message protocolIETF Internet engineering task forceI/O Input/outputIP Internet protocolIPSEC IP security protocolISP Internet service providerLAN Local area networkLFN Long fat networkMF-TDMA Multifrequency time division multiple accessMPEG Moving picture experts groupMPLS Multiprotocol label switchingMSS Maximum segment sizeMTU Maximum transmission unitNNTP Network news transport protocol
5

Rec. ITU-R S.1711-1
NTP Network time protocolOS Operating systemPAD Padding bytesPAWS Protect against wrapped sequence(s)PC Personal computer(s)PDU Protocol data unitPEP Performance enhancing proxyRA Random accessRAM Random access memoryRBP Rate-based pacingrcvwnd Receive window (variable in TCP)RFC Request for comments (issued by the IETF)RPA Remote page acceleratorRS Reed-Solomon RTT Round trip timeRTTM RTT measurementRx ReceiverSACK Selective acknowledgmentSCPC Single channel per carrierSSPA Solid state power amplifierssthres Slow start threshold (variable in TCP)SYN Synchronous start segment (used to establish a TCP connection)T/TCP TCP for transactionsTBF Token buffer filterTC Trellis codedTCP Transmission control protocolTDMA Time division multiple accessTWTA Travelling wave tube amplifierTx TransmitterUDP User datagram protocolURL Uniform/universal resource locatorVSAT Very small aperture terminalWAN Wide area network
6

Rec. ITU-R S.1711-1
Annex 1
Satellite system reference models
1 Scope
This annex presents reference models of networks including a satellite link, to carry IP packets, followed by a description of the limitations of TCP over satellite links.
2 Reference models
2.1 Point-to-point links
Figure 1 provides a reference model for a network carrying IP packet transmissions. The network consists of a satellite link and associated terrestrial networks between two end-users. The satellite link is bidirectional and consists of link AB (from earth station A to earth station B with an information bit rate, RAB) and of link BA (from earth station B to earth station A with an information bit rate, RBA). The terrestrial networks can employ various data link layer protocols (e.g. ATM, frame relay, MPLS).
FIGURE 1Reference model for a point-to-point link including a satellite link
1 711 -0 1
S a te ll ite s y ste m
L in k B A ( )R BA L in k A B ( )R AB
Te rr e s tria ln e tw o rkU s er 1 E a rth
s ta tion AE a rth
s ta tion BTe rr e st ria l
n e tw o rkU s er 2
S a te lli te l in k
NOTE 1 – The reference model above considers only one satellite hop. Throughout this Recommendation, the techniques that segment the TCP connection to improve TCP performance over satellite links are described for one satellite hop. However an end-to-end connection may include several satellite hops. In this case, such techniques will have to be implemented over each individual satellite link.
2.2 VSAT networks
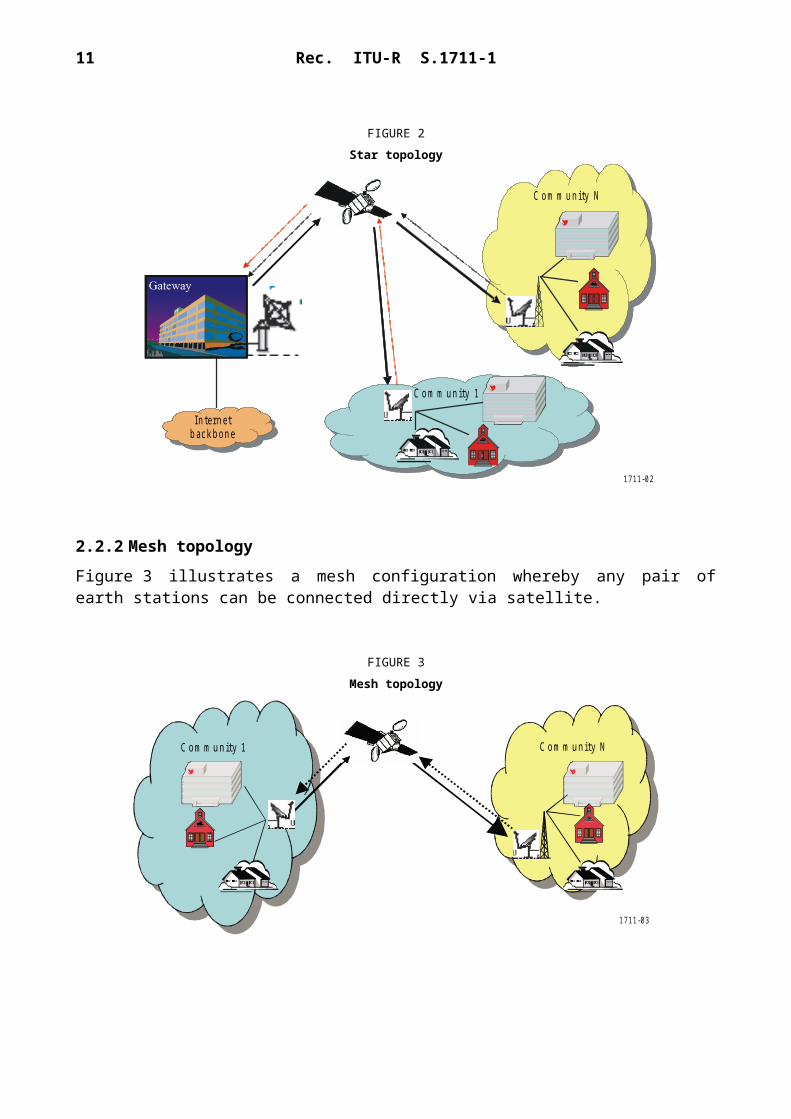
2.2.1 Star topology
Figure 2 depicts the standard star configuration in which signals from various remote users connect to a gateway earth station which in turn connects to terrestrial network.
7

Rec. ITU-R S.1711-1
FIGURE 2Star topology
1 711 -0 2
C NC
CC
C N
C
C om m u nity N
C om m u nity 1
Intern etback b one
2.2.2 Mesh topology
Figure 3 illustrates a mesh configuration whereby any pair of earth stations can be connected directly via satellite.
FIGURE 3 Mesh topology
1 711 -0 3
C o m m u n ity NC o m m u n ity 1
2.3 Broadband access
Even if not completely similar to VSAT networks, broadband access networks generally use the same topologies (i.e. star or mesh).
8
Rec. ITU-R S.1711-1
Annex 2
Tests and measured performance of TCP enhancements
1 Scope
Annex 2 presents the results of independent tests and measurements conducted to experiment some of the TCP performance enhancement methods and provides valuable information for satellite system designers. For further details on the various TCP performance enhancement methods, see Report ITU-R S.2148.
2 TCP performance with splitting enhancement
INTELSAT and KDDI have carried out measurement of TCP performance using segment splitting techniques (two-segment splitting and three-segment splitting) to verify the effectiveness of these techniques. This section provides the results of these measurements.
Section 2.1 presents the performance test results of a single TCP connection without any gateway. Section 2.2 contains the test results of the two-segment splitting technique. Section 2.3 gives the test results of the three-segment splitting technique.
2.1 Single TCP connection performance tested without any improvement
2.1.1 Single TCP connection performance testing
The first set of tests examined the throughput of a single TCP connection. Tests were run with and without protocol gateway enhancement for round trip delays of 200 ms, simulating a terrestrial WAN connection, and 700 ms, simulating a combined satellite link into the terrestrial backbone.
2.1.2 TCP without performance enhancement
The first set of tests was for single TCP connections without performance enhancement. The client window size was set to 8 kbytes to match the default settings on Windows 95, Windows 98, Windows NT, and many other common operating systems. The terrestrial link RTT delay was set to 200 ms and the combined satellite/terrestrial link to 700 ms.
2.1.3 Performance of single TCP connection without performance enhancement
The maximum throughput without performance enhancement is 320 kbit/s for the terrestrial connections and 91 kbit/s for the satellite link (see Fig. 4). These results demonstrate that without performance enhancement, the maximum single-connection TCP throughput rate will be approximately equal to the window size,
8 kbytes⋅8 bitsRTT=200 ms
=320 kbit/s
even if the link rate is increased.
9

Rec. ITU-R S.1711-1
FIGURE 4Single TCP connection over terrestrial and satellite links without enhancement
2.2 Two-segment splitting
2.2.1 Configuration of satellite networks
In order to verify the effectiveness of two-segment splitting techniques under various conditions, the following tests were conducted:TEST-A: Field measurement using a real VSAT system over a satellite linkTEST-B: Measurement using a satellite link simulator.
2.2.1.1 TEST-A: Field measurement using a real VSAT system over a satellite link
The TEST-A measurement was carried out using a DAMA-based satellite IP network with a mesh topology employing variable rate SCPC technology. The test consisted of throughput measurement of single TCP connection and multiple TCP connection for various link rates, UDP and mixture of UDP and TCP connections. The test was conducted using both an asymmetric and a symmetric satellite network whose link rates are 384 kbit/s, 1 536 kbit/s and 2 048 kbit/s.
The test network in TEST-A is shown in Fig. 5. The DAMA satellite network consists of an earth station for channel control and four VSAT. Each VSAT is equipped with gateway equipment enabled for two-segment splitting technique to enhance the throughput of the forward direction. The major specifications of each VSAT are shown in Table 1. Note that there are two types of gateway equipment (Type 1 and Type 2) from two different vendors were used in this test. The satellite link is designed with link availabilities of 99.9% between VSAT and HUB, and 99.85% between VSAT and VSAT.
1 711 -0 4
1 0
6 0
11 0
1 6 0
2 1 0
2 6 0
3 1 0
3 6 0
1 0 1 5 2 0 2 5 3 0 3 5 4 0 4 5
L in k ra te (M b it/s )
Thro
ughp
ut (k
bit/s
)
In teg r ated
Te rre s tria l
10

Rec. ITU-R S.1711-1
FIGURE 5Test network configuration for TEST-A
TABLE 1
Specifications of VSAT earth station
Earth station Antenna size(m)
SSPA power(w)
Maximum Tx rate(kbit/s)
Provider of TCP gateway
Control ES 7.6 N/A N/A N/AVSAT-A 1.2 10 384 Type-1VSAT-B 1.2 40 1 536 Type-2VSAT-C 1.8 40 2 048 Type-2VSAT-D 1.8 120 2 048 Type-2
Earth station OS CPU Memory(Mbit)
Application
VSAT-A FreeBSD 4.3 Pentium III 1 GHz 256 Iperf 1.1.1VSAT-B FreeBSD 4.3 Pentium III 1 GHz 512 Iperf 1.1.1VSAT-C FreeBSD 4.3 Pentium III 1 GHz 256 Iperf 1.1.1VSAT-D FreeBSD 4.3 Pentium III 1 GHz 512 Iperf 1.1.1NTP server Windows 2000 Pentium III 600 MHz 256
1 711 -0 5
G E O sa te llite
M o dem
T C P -G W
M o demC lie nt P C C lie nt P C C lie nt P C C lie nt P CM o dem
N T P se rve r
V S AT-A
V S AT-B
T C P -G W T C P -G W T C P -G W
V S AT-C
V S AT-D
C h ann e lc on tro l E S
M o dem
M a x im u m T x= 38 4 k bit/s
M a xim u m T x= 1 536 k b it/s
M a xim u m T x= 2 048 k b it/s
M ax im u m T x= 2 048 k b it/s
E S : ea rth s ta tionT C P -G W : T C P ga tew a y w ith 2 -segm e n t sp li tt in g te c hn iqu e
11
Rec. ITU-R S.1711-1
The FreeBSD 4.5 operating system is installed on all client PCs, which are then individually connected to a NTP server in order to synchronize the timings between PCs. Each VSAT is equipped with Iperf 1 software to generate IP packets and measure throughput.
2.2.1.2 TEST-B: measurement using a satellite link simulator
The TEST-B: measurement was carried out with a point-to-point configuration using a data link simulator which can insert delay and channel errors. The test consisted of throughput measurements for 1, 2, 4 and 8 simultaneous TCP connections with various link rates (ranging from 384 kbit/s to 1 536 kbit/s) simulating various bit error conditions (error-free, 10−8, 10−7, 10−6, 10−5; random error/burst error) and 250 ms of satellite delay (for one way). For the purpose of comparison, the throughputs were measured with and without the use of gateway equipment.
The test network is shown in Fig. 6. The network contains the data link simulator to simulate the effect of the satellite link conditions in point-to-point networks. The data link simulator uses a serial interface, with two routers installed on both sides of the data link simulator to adapt the interface. The client PC run the Microsoft Windows 2000 (SP2) operating system, and the server PC runs either Microsoft Windows 2000 (SP2) or Linux Version 2.4.7.
FIGURE 6TEST network configuration for TEST-B
2.2.2 Tests results
2.2.2.1 TEST-A
The four tests were conducted under clear-sky conditions. The test results are presented in the following sections:– UDP connection (§ 2.2.2.1.1)– Single TCP/IP connection (§ 2.2.2.1.2)– Multiple TCP/IP connection (§ 2.2.2.1.3) (see Note 1)– One TCP session (60% of link rate) and UDP session (40% of link rate) (§ 2.2.2.1.4)
(see Note 2).
1 Iperf is an application to generate traffic and measure the throughput of IP packet. Iperf version 1.1.1 is a free software that can be downloaded at: http://dast.nlanr.net/Projects/Iperf1.1.1/release.html.
1 711 -0 6
C lie n t-1
C lie n t-2ip e rf 1 .1 .1
W in d o w s 20 0 0T ra ffic
m o n ito r in gs y s te m
S e rv e r-2L in u x 2 .4 .7
o rW in d o w s 2 00 0
R o u te rC is c o 2 5 0 0
D a ta l in k sim u la to rA D T E C H S X 1 2
R o u te rC is c o 2 5 0 0
2 -s eg m e n tT C P g a tew a y
S e rv e r-1
12

Rec. ITU-R S.1711-1
NOTE 1 – The number of session is four on one PC. Some VSAT could not establish four sessions of TCP/IP simultaneously.NOTE 2 – The throughput measured in UDP connection test is assumed to be the maximum throughput of TCP session.
The effect of enhancement by the gateway for two-segment splitting technique was duly observed through all the tests as throughputs of more than 95% of the maximum throughput were obtained.
2.2.2.1.1 Results of UDP connection
TABLE 2
Link rate: 384 kbit/s, average: 360.2 kbit/s (93.8%) (without overhead data)
Tx (set the link rate to 384 kbit/s)
VSAT-A(kbit/s)
VSAT-B(kbit/s)
VSAT-C(kbit/s)
VSAT-D(kbit/s)
Rx (384 kbit/s)
VSAT-A 365 365 365VSAT-B 345 365 365VSAT-C 346 365 365VSAT-D 346 365 365
TABLE 3
Link rate: 1 536 kbit/s, average: 1 463 kbit/s (95.2%) (without overhead data)
Tx (set the link rate to 1 536 kbit/s)
VSAT-A VSAT-B VSAT-C VSAT-D
Rx (384 kbit/s) VSAT-A 1 463 kbit/s
TABLE 4
Link rate: 2 048 kbit/s, average: 1 947.5 kbit/s (95.1%)
Tx (set the link rate to 2 048 kbit/s)
A (384 kbit/s) B (1 536 kbit/s) C (2 048 kbit/s) D (2 048 kbit/s)
Rx (1 536 kbit/s) VSAT-B 1 946 kbit/s 1 949 kbit/s
13

Rec. ITU-R S.1711-1
2.2.2.1.2 Results of single TCP connection
TABLE 5
Link rate: 384 kbit/s, average: 349.2 kbit/s (96.9%) (without overhead data)
Tx (set the link rate to 384 kbit/s)
VSAT-A(kbit/s)
VSAT-B(kbit/s)
VSAT-C(kbit/s)
VSAT-D(kbit/s)
Rx (384 kbit/s)
VSAT-A 359.0 359.0 359.0VSAT-B 327.8 358.5 358.3VSAT-C 328.0 348.3 357.8VSAT-D 328.0 358.5 348.3
Table 5 shows the average over four runs.
TABLE 6
Link rate: 1 536 kbit/s, average: 1 397.5 kbit/s (95.5%) (without overhead data)
TX (set the link rate to 1 536 kbit/s)
VSAT-A (384 kbit/s)
VSAT-B(1 536 kbit/s)
VSAT-C(2 048 kbit/s)
VSAT-D(2 048 kbit/s)
Rx (384 kbit/s) VSAT-A 1 397.5 kbit/s
Table 6 shows the average over four runs.
TABLE 7
Link rate: 2 048 kbit/s, average: 1 890.1 kbit/s (97.1%) (without overhead data)
Tx (set the link rate to 2 048 kbit/s)
VSAT-A (384 kbit/s)
VSAT-B(1 536 kbit/s)
VSAT-C(2 048 kbit/s)
VSAT-D(2 048 kbit/s)
Rx (1 536 kbit/s) VSAT-B 1 888.3 kbit/s 1 891.8 kbit/s
14

Rec. ITU-R S.1711-1
2.2.2.1.3 Results of multiple TCP connection
TABLE 8
Link rate: 1 536 kbit/s, average: 1 370.5 kbit/s (95.5%) (without overhead data)
Tx (set the link rate to 1 536 kbit/s)
VSAT-A (384 kbit/s)
VSAT-B(1 536 kbit/s)
VSAT-C(2 048 kbit/s)
(kbit/s)
VSAT-D(2 048 kbit/s)
(kbit/s)
RxVSAT-A(384 kbit/s)
360358345345
338337329329
Total 1 408 1 333
TABLE 9
Link rate: 2 048 kbit/s, average: 1 910 kbit/s (98.1%) (without overhead data)
Tx (set the link rate to 2 048 kbit/s)
VSAT-A (384 kbit/s)
VSAT-B(1 536 kbit/s)
VSAT-C(2 048 kbit/s)
(kbit/s)
VSAT-D(2 048 kbit/s)
(kbit/s)
RxVSAT-B(1 536 kbit/s)
759597562
680565657
Total 1 918 1 902
2.2.2.1.4 Results of combination of UDP and TCP sessions
TABLE 10
Combination of one TCP (60%) connection and one UDP (40%) connection
Tx (384 kbit/s)
VSAT-A (384 kbit/s)
VSAT-B(1 536 kbit/s)
VSAT-C(2 048 kbit/s)
(kbit/s)
VSAT-D(2 048 kbit/s)
(kbit/s)
Rx VSAT-B 1 241687
1 102841
Upper row: TCP connection; lower row: UDP connection.
2.2.2.2 TEST-B
Test results of TEST-B are shown in Figs. 7 to 11. The throughput values in the graph of 1, 2, 8 TCP sessions are sum of throughputs of all TCP sessions. The effect of enhancement by the gateway for two-segment splitting technique was duly observed through all the tests.
15

Rec. ITU-R S.1711-1
As can be seen in Figs. 7 and 8, the maximum throughput for one TCP/IP session is limited to approximately 200 kbit/s when the gateway is not activated. For instance, in the case of two TCP sessions (see Fig. 8), the total throughput (“without TCP GW”) is limited to approximately 400 kbit/s. On the other hand, in the case of eight TCP sessions (see Fig. 9), the total throughput (“without TCP GW”) reaches approximately 1.5 Mbit/s, and no remarkable difference is observed between the cases of “without TCP GW” and “with TCP GW”.
With higher BERs (i.e. BER = 10−6), the effect of enhancement is reduced as shown in Fig. 10.
FIGURE 7Result of one TCP session (BER = 10−8)
FIGURE 8Result of two TCP sessions (BER = 10−8)
1 711 -0 7
N o d e la y w ith o u t T C P G WD e la y ed ( 2 5 0 m s ) w i th o u t T C P G WD e la y ed ( 2 5 0 m s ) w i th T C P G W
Thro
ughp
ut n
orm
aliz
ed (%
)
L in k rate (k b it/s )L in k rate (k b it/s )
Thro
ughp
ut (k
bit/s
)
1 711 -0 8
N o de lay w itho ut TC P G WD ela y ed (2 50 m s) w ith o u t T C P G WD ela y ed (2 50 m s) w ith T C P G W
Thro
ughp
ut n
orm
aliz
ed (%
)
Thro
ughp
ut (k
bit/s
)
L ink rate (kb it/s ) L ink rate (kb it/s )
16

Rec. ITU-R S.1711-1
FIGURE 9Result of eight TCP sessions (BER = 10−8)
FIGURE 10Results of two TCP sessions (BER = 10−7, 10−6)
1 711 -0 9
N o d e la y w itho ut TC P G WD ela y ed (250 m s) w itho u t T C P G WD e lay ed (250 m s) w ith T C P G W
Thro
ughp
ut n
orm
aliz
ed (%
)
Thro
ughp
ut (k
bit/s
)
L in k ra te (k b it /s ) L in k rate (k b it /s )
1 711 -1 0
N o d e lay w itho ut T C P G WD ela y ed (2 5 0 m s) w ith o u t T C P G WD elay ed (2 50 m s) w ith T C P G W
Thro
ughp
ut (k
bit/s
)
L in k rate (kb it/s ) L ink rate (kb it/s )
Thro
ughp
ut n
orm
aliz
ed (%
)
B E R = 1 0 – 7 B E R = 10 – 6
17

Rec. ITU-R S.1711-1
FIGURE 11Results of one TCP session in case of various burst errors
2.2.3 Summary
The results show that the two-segment splitting method can significantly improve TCP throughput in the satellite link with a BER of 10−7 or better. The total throughput performance corresponding to 95% of capacity with 1, 2 and 8 simultaneous TCP connections was achieved in the presence of long delay such as satellite network. In addition, it was shown that the two-segment splitting technique is suitable for both asymmetric and symmetric satellite networks.
Segment-splitting techniques allow for an optimized load balancing scheme among connections in a satellite segment in order to avoid unwanted degradation of TCP transmission window by the congestion avoidance algorithms. This load balancing scheme is possible because the gateway equipment acts as an intermediary between the TCP end-users.
2.3 Three-segment splitting
2.3.1 Configuration of satellite networks
The test network is shown in Fig. 12. The network contains two link simulators to simulate the effects of both the satellite link conditions and the terrestrial Internet backbone. For testing of only the satellite link conditions, the terrestrial link delay simulator and Cisco 7206 router were not included in the network. The client machine was connected directly to the Ethernet switch attached to the protocol gateway.
Both the client and server machines are Sun Enterprise 450 (2 UltraSPARC–II 296 MHz) with 2 048 Mbytes memory running the Solaris 7 operating system. A client-server application was used for the load generator.
1 711 -1 1
D ela y ed (250 m s) w ith ou t T C P G WD ela y ed (250 m s) w ith T C P G W
Thro
ughp
ut (k
bit/s
)
L ink rate (k b it/s ) L ink rate (k b it/s )
Thro
ughp
ut (k
bit/s
)
T C P th roug hpu t (a vaila b il ity = 1 00% ) T C P th roug hpu t (a vaila b il ity = 9 9 .9 % )
18

Rec. ITU-R S.1711-1
FIGURE 12Test network configuration
2.3.2 Test procedures
The objectives of the tests were to conduct independent testing to investigate the effectiveness of protocol gateways under various loading conditions, TCP connection rates and error rates for typical satellite link conditions. In addition to simulating satellite conditions, testing also examined the effect of Internet congestion on end-to-end throughput with and without the protocol gateway.
Three types of tests were conducted:
Test 1: Single TCP connection throughput for various link bandwidths
These tests were designed to simulate high-speed LAN and Internet-2 applications where high speed transfers of large data files are common, comparing the performance with and without the protocol gateway.
Test 2: Multiple TCP connections with fixed per-connection bandwidth
These tests were designed to examine the performance benefit of the protocol gateway for ISP links supporting large numbers of small TCP connections. Tests were run for round trip delays of 200 ms to simulate a terrestrial WAN link, and 700 ms to simulate the combination of a 500 ms satellite hop from the user to the Internet backbone and 200 ms delay to reach the server. For simplicity, delay and bit errors were added at a single point, with the protocol gateways located on either side of the link simulator.
Test 3: Multiple TCP connections with terrestrial packet loss
The previous testing was extended to more closely examine the effect of delay and error across the Internet backbone, independent of the satellite hop. A second link simulator was added to simulate the satellite and terrestrial conditions separately. For these tests, the satellite hop was set to a round trip delay of 500 ms with no errors, and the backbone link was set to a delay of 200 ms with various loss rates.
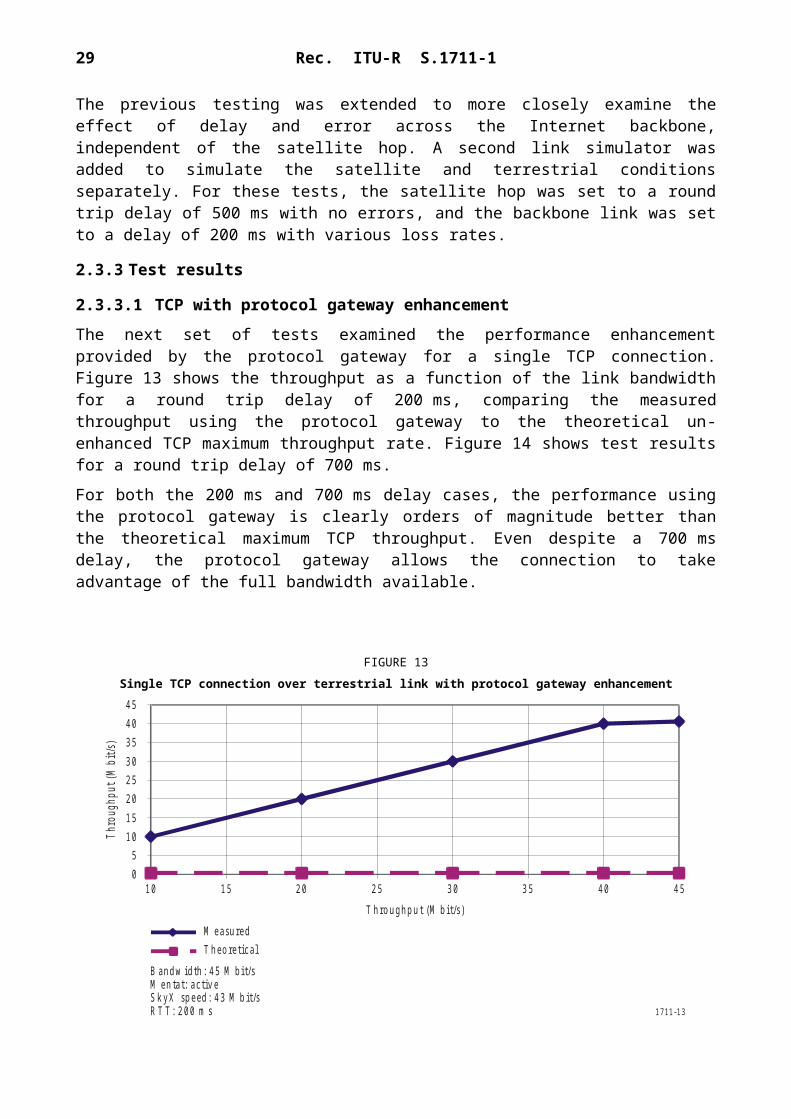
2.3.3 Test results
2.3.3.1 TCP with protocol gateway enhancement
The next set of tests examined the performance enhancement provided by the protocol gateway for a single TCP connection. Figure 13 shows the throughput as a function of the link bandwidth for a round trip delay of 200 ms, comparing the measured throughput using the protocol gateway to the
1 711 -1 2
S w itch
S w itch
S w itch
R o u te r (R 1 )
R o u te r
R o u te r (R 2 )
H S S I 0 H S S I 1
ID S U /C S U ID S U /C S U
F E 1 F E 1 F E 3
S w itch
S w itch
C lie n t P CS e rv e r P C
D e la y s im u la to r(s a te ll ite lin k )
D e la y s im u la to r(te rr es tr ia l lin k )
G a te w a y(3 -se g m e n t)
G a te w a y(3 -se g m e n t)
N o te 1 – “S w itc h ” in d ica te s the 1 0 0 M b it /s E th e r ne t sw i tc h .
19

Rec. ITU-R S.1711-1
theoretical un-enhanced TCP maximum throughput rate. Figure 14 shows test results for a round trip delay of 700 ms.
For both the 200 ms and 700 ms delay cases, the performance using the protocol gateway is clearly orders of magnitude better than the theoretical maximum TCP throughput. Even despite a 700 ms delay, the protocol gateway allows the connection to take advantage of the full bandwidth available.
FIGURE 13Single TCP connection over terrestrial link with protocol gateway enhancement
FIGURE 14Single TCP connection over satellite link with protocol gateway enhancement
1 711 -1 3
Thro
ughp
ut (M
bit/s
)
T h ro ughp u t (M b it/s )
B andw idth : 4 5 M bit/sM e n ta t: a ct iv eS k yX sp e ed : 4 3 M b it/sRT T: 2 00 m s
10 15 20 25 30 35 40 45
4540353025201510
50
M e a su redT h eo re t ic al
1 711 -1 4
Thro
ughp
ut (M
bit/s
)
L ink rate (M b it/s)
B an dw idth: 45 M bit/sM e n ta t: a ct iv eS ky x sp ee d : 43 M bit/sRT T: 7 0 0 m s
10 15 20 25 30 35 40 45
4540353025201510
50
M ea su redT heo retic al T C P
20

Rec. ITU-R S.1711-1
2.3.3.2 Multiple TCP connection performance testing
Rather than a single large TCP connection, ISP servicing home users connecting to the Internet support large numbers of small connections on their networks. TCP connection rates are generally limited to the speed of the user’s connection to the ISP. The next set of tests was therefore designed to examine the performance of TCP with and without protocol gateway enhancement for large numbers of TCP connections, with each connection limited to 128 kbit/s. Tests were run for both 200 ms and 700 ms round trip delays to compare terrestrial and satellite performance. Various bit error rates were tested for each condition.
2.3.3.3 Multiple TCP connections without enhancement
Figures 15 and 16 show the aggregate throughput between client and server without TCP enhancement for multiple 128 kbit/s TCP connections under various bit error rate conditions. With a limit of 128 kbit/s per-connection, 350 connections would be required to fill a 45 Mbit/s link.
Figure 15 shows the aggregate throughput for a terrestrial link. With the 200 ms delay, TCP is able to provide aggregate throughput rates near the theoretical maximum except at high bit error rates.
Figure 16 shows the aggregate throughput for the satellite-based connection. With a 700 ms delay, even without errors, TCP is limited to only 31 Mbit/s for 350 connections. At high error rates, TCP performance drops off rapidly.
FIGURE 15Multiple TCP connections over terrestrial link without enhancement
1 711 -1 5
Thro
ughp
ut (M
bit/s
)
N um ber o f co nn ec tio ns
L ink rate: 12 8 k bit/sB and w idth : 45 M bit/sD e la y: 2 00 m s
70 14 0 21 0 28 0 35 0
4540353025201510
50
10 B E R– 8T h eo re t ical
10 B E R– 61 0 B E R– 7
N o e rro r10 B E R– 5
21

Rec. ITU-R S.1711-1
FIGURE 16Multiple TCP connections over satellite link without enhancement
2.3.3.4 Multiple TCP connections with protocol gateway enhancement
Figures 17 and 18 illustrate the effects of adding the protocol gateway to the network. Figure 17 shows the aggregate throughput for a delay of 200 ms, while Fig. 18 shows the results for a delay of 700 ms.
FIGURE 17Multiple TCP connections over terrestrial link with protocol gateway enhancement
1 711-1 6
Thro
ughp
ut (M
bit/s
)
N u m ber o f con nec tion s
L in k ra te : 128 kb it/sB an dw id th : 45 M bit/sRT T : 700 m s
70 14 0 21 0 28 0 35 0
45 .6 040 .7 435 .8 831 .0 226 .1 621 30
16 .4 411 .58
6 .721 .86
T he o re tica l N o erro r 1 0 B E R– 8
10 B E R– 610 B E R– 7 10 B E R– 5
1 711 -1 7
Thro
ughp
ut (M
bit/s
)
N um be r o f con nec tion s
L ink ra te : 12 8 k b it /sB a n dw id th : 4 5 M b it/sM en tat: ac tiveRT T : 200 m sS ky X sp ee d : 43 M bit/s
70 14 0 2 1 0 2 8 0 35 0
4 5
4 0
3 5
3 0
2 5
2 0
1 5
1 0
5
T he o re tica l N o erro r 10 B E R– 8
1 0 B E R– 610 B E R– 7 10 B E R– 5
22

Rec. ITU-R S.1711-1
FIGURE 18Multiple TCP connections over satellite link with protocol gateway enhancement
For both the terrestrial and satellite conditions, the protocol gateway allows the connection to utilize the full bandwidth available. For both cases, the performance is essentially identical to the theoretical limit for up to 280 connections.
Compared to § 2.3.3.3, the protocol gateway provides almost 100% improvement in aggregate throughput at a packet loss rate of 10% (corresponding to a BER of 1 × 10⁻⁵ for 1 500-byte packets). For the satellite-based network, the protocol gateway provides a substantial increase in aggregate bandwidth at low bit error rates, and at a packet loss rate of 10%, the aggregate throughput for 350 connections with the protocol gateway is 33 Mbit/s compared to only 10 Mbit/s for enhanced TCP.
2.3.3.5 Multiple TCP connections with terrestrial data loss
In considering the performance of Internet users connected via a satellite-based ISP, the connection will traverse both the satellite hop and then cross the Internet backbone to reach the server. The connection may encounter data loss due to congestion over the Internet backbone. To more accurately model conditions that the end user experiences, the next set of tests divided the connection into a lossless satellite link with a 500 ms delay, combined with a backbone path of 200 ms delay and various error rates. In these tests, the protocol gateways are located on either side of the satellite link. Standard TCP is used for the portion of the connection over the backbone between the server and server-side protocol gateway.
As shown in Fig. 19, the protocol gateway allows the connection to maintain full speed with almost no degradation except at high packet loss rates. Comparing Fig. 19 with Figs. 16 and 18 illustrates that the protocol gateway is able to overcome the latency and errors on the satellite link as well as the delay and most of the packet loss on the backbone link.
1 711 -1 8
Thro
ughp
ut (M
bit/s
)
N um b e r o f c o n ne c tion s
L in k ra te : 1 2 8 k b it/ sB a n d w id th : 45 M b it/ sM e n ta t: a c t iv e
S k yX s pe e d : 4 3 M bit/ sR T T : 7 0 0 m s
7 0 1 4 0 2 1 0 2 8 0 3 5 0
4 5
4 0
3 5
3 0
2 5
2 0
1 5
1 0
5
T h e o re tica l N o er ro r 1 0 B E R– 8
1 0 B E R– 610 B E R– 7 1 0 B E R– 5
23

Rec. ITU-R S.1711-1
FIGURE 19Multiple TCP connections over combined satellite-terrestrial link
with protocol gateway enhancement
2.3.4 Summary
The results of this testing show that protocol gateway/connection splitting devices can improve the throughput for carriers with TCP type traffic on satellite links with up to 700 ms in delay. The tests also show that the TCP throughput is not affected as long as the link BER is better than 10−7.
3 Tests and measurements of TCP over satellite using caching and spoofing
3.1 Introduction
This section describes test and measurement results considering five cases of satellite Internet and one case of terrestrial Internet. The purpose of the test and measurement is to assure the effectiveness of the caching and spoofing in a satellite network. As shown in Fig. 20, traditionally Internet services via geostationary satellite communication systems have been provided by unidirectional satellite link (downlink) to overcome the transmission delay caused by the long distance from Earth-to-space and to save the uplink equipment cost, etc.
Korea Telecom (KT) and the Information & Telecommunication Institute of Hansei University (HITRI) have carried out a study of caching and spoofing for bidirectional satellite Internet. The spoofing is used to reduce the required time for the link establishment. Caching is used to improve the transmission bandwidth efficiency.
1 711 -1 9
Thro
ughp
ut (M
bit/s
)
N um be r o f co nn ec tions
L ink ra te : 1 28 kb it/sB a ndw id th : 45 M bit /sM en ta t: a c tive
S k y X spe e d : 43 M bit/sRT T : 700 m s
70 14 0 2 1 0 2 8 0 35 0
45
40
35
30
25
20
15
10
5
T heo re tica l N o erro r 1 0 B E R– 8
10 B E R– 61 0 B E R– 7 10 B E R– 5
24

Rec. ITU-R S.1711-1
FIGURE 20Unidirectional satellite Internet network configuration
3.2 Tests and measurements
3.2.1 Equipment specifications
Tables 11 through 13 show the specifications of the system employed for test and measurement. Table 1 shows specifications for ground systems, Table 12 for satellite systems and Table 13 for VSAT terminals.
TABLE 11
Ground system specifications
Hub earth station 1 station with 9 m antenna
VSAT terminal station 2 stations with 1.2 m antennaIDU/ODU ACQ: 191.0
PING: 1 686 msPTS: VSAT_141b_uts
HUB-Internet connection line 45 Mbit/s
TABLE 12
Satellite system specifications
Orbit GSO 116° ESatellite name Mugunghwa-3
Transponder Bandwidth: 36 MHz. Inbound: 11.040 MHz(480 kHz 23 group) Outbound: 24.8 MHz
Frequency band Ku-band (14 GHz/12 GHz)
Link bit rate Inbound: 128 kbit/s ~ 256 kbit/s Outbound: 23.58 Mbit/s
1 711 -2 0
H ubs ta tion
In tern et
P S T N
V S AT V S AT V S AT
25

Rec. ITU-R S.1711-1
TABLE 13
VSAT terminal specifications
Clarification Items Specification
Internet option
Start page No confirmationSpace 1 MB
LAN connection establishment NOSecurity level Normal
Image dithering DeleteSmooth screen moving Delete
Virtual memoryMinimun 384 MBMaximun 768 MB
Registry size 64
3.2.2 Network configurations for tests and measurements
Four satellite test networks using a star topology and one terrestrial test network have been used. Their configurations are shown in Figs. 21 and 22 respectively. The hub station of each satellite test network is connected to the Internet using a 45 Mbit/s dedicated line. Four Internet websites have been selected for performing measurements: A: www.naver.com, portal siteB: www.google.com, text based siteC: www.hansei.ac.kr, university siteD: www.kbstar.co.kr, bank site.
Figure 21 shows the four satellite test and measurement network configurations: – without caching/spoofing: the satellite network is directly connected to the selected
websites via the hub station;– with caching only: the satellite network is connected to the selected websites via a cache
server located at the hub station;– with spoofing only: the satellite network is connected to the selected websites via an IP
gateway (IPGW) located at the hub station. Spoofing is performed in both the IP gateway of the hub station and the indoor unit (IDU) of VSAT terminals;
– with caching and spoofing: since spoofing is often not effective enough to overcome satellite transmission delays and to adequately improve TCP performance over satellite networks, it is used in conjunction with caching. The satellite network is connected to the selected websites via an IPGW and a cache server.
As a reference point, the performance of a terrestrial access to the Internet was measured. Figure 22 shows the configuration of the terrestrial test and measurement network.
26

Rec. ITU-R S.1711-1
FIGURE 21Satellite network test configuration
FIGURE 22Terrestrial Internet test network configuration
3.2.3 Test and measurement results
Test and measurement were performed three times at 20-min intervals gathering 2 × 15 samples (15 for each of the measured parameters, i.e. connection time and throughput) in each of the five cases described in § 3.2.2. These samples were then averaged and presented in Table 14.
1 711 -2 1
H ubsta tion
In tern etC ach es e rv e r
V S AT V S AT V S AT
IP G W(s p o o fin g )
C ach es e rv e r
IP G W(s p o o fin g )
9 m a n ten n a
2 5 M b it /s 1 2 8 kb it/ s-2 5 6 kb it/ s
M u g o n g h w aG S O 11 6 ° E
fre q u e n c y b a n d w id t h 3 6 M H z1 4 / 1 2 G H z b a n d
1
3
2
4
1C a se w i tho ut cach in g a nd sp oo fingC a se w i tho ut cach in gC a se w i tho ut sp oo fin gC a se w i tho ut cach in g a nd sp oo fing
234
w w w .n a v er.c o m
w w w .g o o g le .c o m
w w w .h a n s e i .a c .k r
w w w .k b s ta r.c o .k r
1 711 -2 2
In tern et
P C
L A N(1 0 0 M b it/s )
w w w .n a ve r.c om
w w w .g o o g le.co m
w w w .h a ns e i.a c .k r
w w w .k b star.c o .k r
P C
P CWA N (4 5 M b it/ s)
27

Rec. ITU-R S.1711-1
TABLE 14
Comparison of average connection time (s) and average throughput (kbyte/sec)
Website
Reference terrestrial access
Satellite access
Case 1: without caching and spoofing Case 2: with caching Case 3: with spoofing Case 4: with spoofing and
caching
Connection time (s)
Throughput (kbytes/s)
Connection time (s)
Throughput (kbytes/s)
Connection time (s)
Throughput (kbytes/s)
Connection time (s)
Throughput (kbytes/s)
Connection time (s)
Throughput (kbytes/s)
A 3.5 110.8 35.7 10.3 44.9 9.7 15.6 24.7 14.1 27.8
B 1.4 11.9 9.5 2.1 9.8 1.6 5.9 2.9 5.2 3.1C 5.9 131.7 56.9 13.1 44.3 13.9 31.1 30.4 14.7 54.3
D 6.1 99.1 28.4 6.1 22.9 7.7 15.4 10.9 13.0 17.9A: www.naver.com, portal siteB: www.google.com, text based siteC: www.hansei.ac.kr, university siteD: www.kbstar.co.kr, bank site.
28

Rec. ITU-R S.1711-1 29
3.3 Summary
For the four websites used in the experiment, spoofing alone improves the performances of TCP/IP over satellite networks both in terms of throughput and connection time. On the contrary, in case of caching only, the throughput is rather lower and the connection time rather longer for websites A (portal, moving-picture-based website) and B (text-based website) than without any performance enhancement method.
When spoofing and caching are applied together to the satellite TCP/IP network, the performance for throughput and connection time is improved for all websites (e.g. the throughput at the VSAT terminal is increased from 1.5 times (website B) to 4.2 times (website C); connection times are reduced from 1.8 times (website B) to 3.9 times (website C)).
4 TCP performance over a satellite ATM network
Section 4.1 describes the environment and configurations of experimental network. Section 4.2 presents the results of TCP throughput when the throughput was measured in pure ATM-based satellite network. Section 4.3 discusses the TCP behaviour when broadband ATM-based satellite network interconnects with high-speed terrestrial networks such as gigabit Ethernet. Section 4.4 summarizes the conclusions reached through this experiment.
4.1 Network configuration
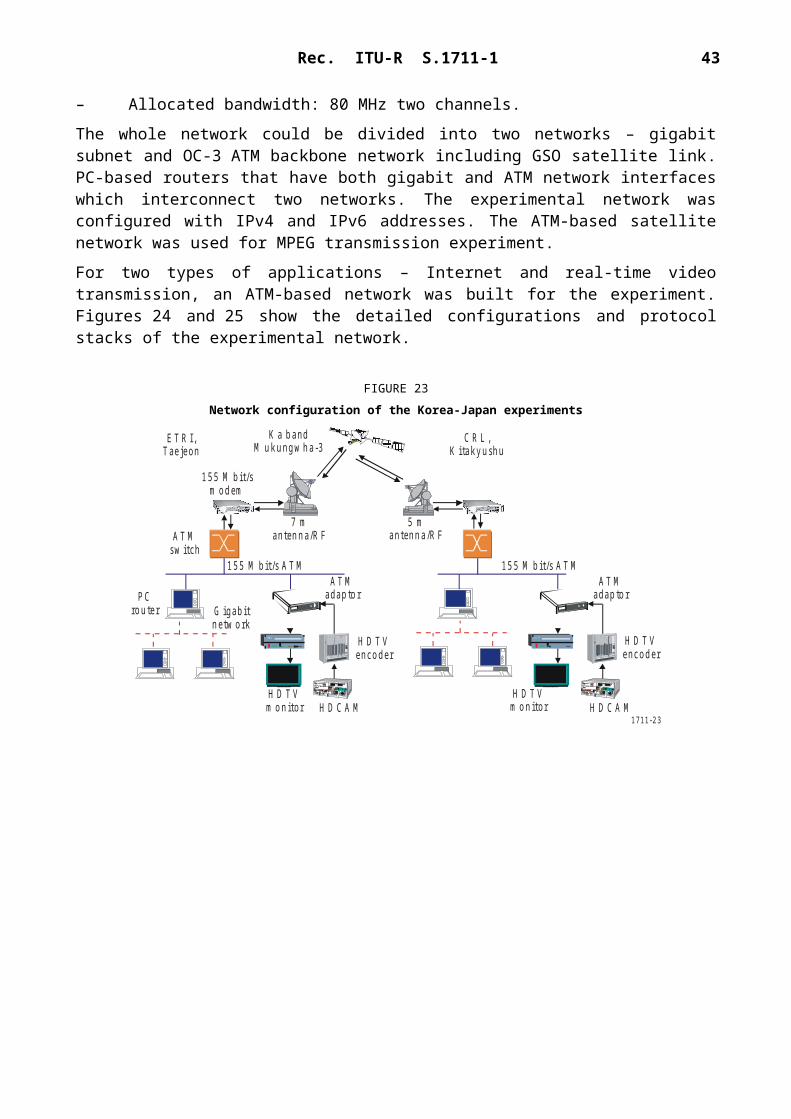
Figure 23 shows the configurations of Korea-Japan high-speed satellite ATM network. In this joint experimentation, the two ground stations with 7 m antenna at ETRI, Korea and 5 m antenna at CRL, Japan were installed respectively. The main specifications of the Korea-Japan 155 Mbit/s satellite ATM link are as follows:– Satellite: Mukungwha-3– Frequency band: uplink: 27.5-31 GHz, downlink 17.7-21.2 GHz– Maximum TWTA power: 125 W– Normal e.i.r.p. (Mukungwha-3): 71 dBW– G/T (45° elevation): 32 dB/K (minimum)– TC 8-PSK modulation/demodulation– Coding: concatenated coding of convolutional code with K = 7, R = 7/8 and RS code– Bit rate: 155.52 Mbit/s– Allocated bandwidth: 80 MHz two channels.
The whole network could be divided into two networks – gigabit subnet and OC-3 ATM backbone network including GSO satellite link. PC-based routers that have both gigabit and ATM network interfaces which interconnect two networks. The experimental network was configured with IPv4 and IPv6 addresses. The ATM-based satellite network was used for MPEG transmission experiment.
For two types of applications – Internet and real-time video transmission, an ATM-based network was built for the experiment. Figures 24 and 25 show the detailed configurations and protocol stacks of the experimental network.
30 Rec. ITU-R S.1711-1
FIGURE 23Network configuration of the Korea-Japan experiments
FIGURE 24Experimental network configuration
1 711 -2 3
K a b andM uk u ngw h a -3
E T R I,Tae je on
15 5 M b it/s AT M 15 5 M b it/s AT M
15 5 M b it/sm o dem
AT Madap to r
AT Msw itch
AT Ma dap to r
G iga b itnetw ork
P Crou te r
H D T Vm o n itor
H D T Vm o n itor
H D T Venco d er
H D T Ve nco d er
H D C A M H D C A M
5 ma nten n a /R F
7 ma nten n a /R F
C R L ,K ita ky ushu
1 711 -2 4
P C router
G igab itH U B
G iga b it E th e rne tO C /3 ATM
AT M in te rfa ce3 ffe :2e 00 :e:fff6 ::221 0.12 3 .25 4 .1 31
AT M in te rface3 ffe :2e 00 :e:fff6 ::121 0.12 3 .25 4 .1 32
3 ffe :2e01 :1:4 ::221 0.12 3 .25 2 .1 01
3 ffe :2e 01 :1:5 ::321 0.12 3 .25 3 .1 02
3ffe :2e 01 :1:5 ::221 0.12 3 .25 3 .1 01
3 ffe :2e 01 :1:5 ::/6 421 0.12 3 .25 3 .
3 ffe :2e 01 :1:4 ::/6 421 0.12 3 .25 2 .
E T R I, D a e jeonAT M
sw itch
M uk u ngw h a-3satelli te lin k
C R L , K itaky ush u

Rec. ITU-R S.1711-1 31
FIGURE 25Protocol stacks of experimental network interconnected via PC router
4.2 TCP performance in ATM-based satellite-only network
The TCP throughput in pure ATM network with 540 ms GSO satellite round trip delay was first measured. IPv6/IPv4 tunnelling was used because IPv6 in IP over ATM was not completely implemented yet. The protocol stack of IPv6/IPv4 tunnelling over ATM-based satellite network is shown in Fig. 26.
FIGURE 26Protocol stack of IPv6/IPv4 tunnelling on ATM
The MTU size in IP over ATM is usually 9 180 bytes. MTU size in IPv6/IPv4 tunnelling interface is 9 160 bytes because IPv4 header size is 20 bytes. Therefore the MSS is a maximum of 9 100 bytes (the sizes of IPv6 header and TCP header are 40 and 20 bytes respectively). However when TCP scale option is used to enlarge TCP window size in ATM-based satellite network, the MSS is reduced by the TCP option bytes. When IP packets are encapsulated into AAL5, the maximum theoretical bandwidth can be calculated. The number of bytes of padding necessary is:
PAD=48−((8+20+40+20+9100+8 ) MOD 48)=20Then the PDU utilization is:
η= 9 100(8+20+40+20+9 100+20+8)
= 9 1009 224
=0 .986
The pure cell rate of STM-1 is about 149 Mbit/s and the bandwidth of 48 bytes payload in ATM cells is about 134.94 Mbit/s. Therefore the theoretical maximum bandwidth of TCP in OC-3 network is given by:
BW TCP = 134 .94⋅η ≃ 133 . 05 Mbit/s
1 711 -2 5
P C ro u ter(L in u x )
P C ro u ter(L in u x )
T P Cre c eiv e r(L in u x )
T C P
T C Ps en d er
(L in u x )
IP v 6 /IP v4tu n n e l in g
IP v 6 /IP v4tu n n e l in g
IP v 6IP v 6IP v 6IP v 6
T C P
IP v 6 IP v 6
E th e rn e t
G iga b itE th e rn e tin ter fa c e
G iga b itE th e rn e tin terfa c e
E th e rn e tE th e rn e t C la s s ica lIP O A
C la s sica lIP O A
C la s s ica lIP O A
AT Min ter fa c e
1 711 -2 6
T C PT C P
IP v 6 /I P v4 tu nn e lingAT Min ter fa ce
IP v 6 /I P v4 tu nn e ling
IP v 6IP v 6
C la ssica l IP O AC la s sica l IP O A

32 Rec. ITU-R S.1711-1
Figure 27 shows the TCP throughput with various TCP socket (or window) sizes. When TCP socket size was 6 Mbytes, throughputs of 113 Mbit/s using IPv4 and of 106 Mbit/s using IPv6 were obtained. The performance was 95% of throughputs without any satellite delay. The TCP throughput in a pure ATM network with 540 ms GSO satellite round trip delay was then measured.
FIGURE 27TCP throughput of ATM-based satellite network with various TCP window sizes
4.3 TCP behaviours in heterogeneous networks including satellite link
Next the TCP throughput was measured when the source was located on a gigabit subnet and the destination located on another gigabit subnet. When the TCP socket size was set to about 6 Mbytes in 540 ms satellite delay network, the maximum throughput was only about 2 to 3 Mbit/s. This is due to the burstiness of the TCP traffic when large TCP window size is set for good throughput in LFNs. When the TCP window size is increased to use full bandwidth of the LFN, the TCP traffic is bursty because the physical interface of the sender (i.e. gigabit Ethernet) is faster than the ATM backbone. The intermediate router should have large buffer to prevent packet losses. Existing routers do not have large enough buffers to allow for large TCP window sizes. Therefore the packet loss of the intermediate router degrades the TCP throughput. Figure 28 shows a TCP sequence graph of the TCP sender. In the first 8 s, there is a TCP slow start. As the TCP window size increases, there are packet losses due to buffer overflow in the intermediate router. There are many retransmissions due to these packet losses. TCP restarts the slow start behaviour after long time (about 27 s later). This transmission pattern (loss and retransmit) repeats and the overall TCP throughput performance becomes poor.
1 711 -2 7
T C P soc k et s ize (M by tes)
0 1 2 3 4 5 6 7
Thro
ughp
ut (M
bit/s
)
M easu re d thro ug h p ut (M bits/s)T h eoretical thro ug hp ut (M b it/s )T h ro ugh p u t w ith o u t sa te llite de layIP v 4 ov er AT M
20
4 0
6 0
8 0
10 0
1 2 0
1 4 0
0

Rec. ITU-R S.1711-1 33
FIGURE 28TCP sequence graph in the TCP traffic source
4.3.1 Simulation of buffer size
The buffer size of intermediate router can be assessed by calculations and simulation. The configuration of simulation model using a network simulator is shown in Fig. 29. For the simulation, the maximum available TCP bandwidth in gigabit and ATM networks is set to 500 Mbit/s and 135 Mbit/s respectively.
FIGURE 29Configuration of simulation model
The delay of a gigabit subnet is negligible compared to the GSO satellite delay in the ATM link and MSS of the Ethernet which is 1 430 s in IPv6. Therefore the required TCP window size is:
W = BW⋅RTT8
= 135 × 106 × 0. 5408 × 1 430
≃ 6 374 packets
R1 and R2 being the packet rates of the gigabit network and the ATM network respectively (R1 > R2), the rate of TCP acknowledgement is set up by R2 (the lowest link in the end-to-end connection). The packet rate in the slow start phase is R1 = 2 R2 because the TCP sender transmits two packets when it receives one ACK. Assuming Wmax is the maximum TCP window size during slow start, the number of packets in the queue of the intermediate router is given by:
P( t ) = [ R 1−R 2 ] ⋅ t = [ 2 ⋅ R 2 − R 2 ] ⋅ t = R 2 ⋅ t
t = TR 2
, 2 ⋅ TR 2
, 3 ⋅ TR 2
⋯ ≤W max
2 ⋅ R 2
where T is the start time of the TCP window during slow start.
1 711 -2 8R e la tive t im e (s )
0 1 0 2 0 3 0 4 0
Sequ
enc e
offs
et (M
bit/s
)
R e tran sm is sio n s o f T C P t ra ffic
T P C A C K
W in d o w a d ve rt is e d by th e rec eiv er
N o rm al T C P t ra ffic
F IN
0
5
1 0
1 5
2 0
S Y N
1 711 -2 9
N o d e 2R o u te r 2R o u te r 1N o d e 1
5 0 0 M b it/s1 m s
1 3 5 M b it /s2 7 5 m s
5 0 0 M b it/s1 m s

34 Rec. ITU-R S.1711-1
Therefore the maximum packet size in the queue is:
P ( W max
2⋅R 2 ) = R 2⋅W max
2 ⋅ R2=
W max
2
That is, during slow start sender sends twice as much as the number of ACK it received during one RTT. The required queue buffer of intermediate node is the half of the maximum TCP window size because in first of the RTT router receives as twice the rate as it sends and so it drains the queue in the next half of RTT. When the maximum available bandwidth of TCP in gigabit network and ATM network are 500 Mbit/s and 135 Mbit/s respectively, theoretically the required buffer size of the experimental network is about 3 187 packets. Figures 30 and 31 are the result of simulation using network simulator-2. Figure 30 shows TCP sequence, ACK and the number of packets in the intermediate queue. Figure 31 shows TCP throughput during first 10 s in sender and receiver. The maximum throughput is obtained when TCP buffer size was about 6 374 packets and at that time the maximum of intermediate router queue was 2 279 packets.
FIGURE 30TCP sequence, ACK and buffer size in the intermediate router queue
1 711 -3 0
Tim e (s)
0 1 2 3 4 5 6 7 8 9 10
Pack
ets
O utp u t packe tsA C KB u ffe r size
5 0 00
10 000
15 000
20 000
25 000
30 000
35 000
40 000
45 000
0

Rec. ITU-R S.1711-1 35
FIGURE 31TCP throughputs with various buffer sizes
4.3.2 TCP performance with traffic control in TCP sender
A traffic shaping mechanism called TBF (supported by Linux advanced networking option) was then used. TBF regulates the rate of TCP burst traffic. Figure 32 shows the basic parameters for TBF queuing discipline. Rate is the rate the bucket refills with tokens – which represents the average transmission rate of a traffic flow. The bucket size or burst size is the number of tokens the token bucket can store. The limit parameter is the sum of the bucket size and the size of the queue. If limit is equal to the bucket size and the queue size is zero, non-conforming packets are dropped. Thus the stream is policed. If the limit is greater than the bucket size some non-conforming packets are queued.
FIGURE 32Basic parameters for TBF queuing discipline
1 711-3 1
To k en bu c k e t s iz e (p a ck e ts )
0 5 0 0 0 1 0 0 00 1 5 0 00 2 0 0 00 2 5 0 00 3 0 0 00
Thro
ughp
ut (M
bit/s
)
T h ro u gh p u t o f s en d e rT h ro u gh p u t o f r ec e iv er
8 0
7 0
6 0
5 0
4 0
3 0
2 0
0
1 711 -3 2
C on fo rm
D ropE x ce ed
C on formP a ck e ts
R a te
B ucke ts iz e
Q ue ue s iz e = lim it - buc k e t s iz e
P a ck e ts

36 Rec. ITU-R S.1711-1
Figure 33 shows the TCP throughput with various TCP socket size when TBF was used in TCP sender with 6 Mbytes fixed TCP window size (for comparison, the case where there is no satellite delay is also shown). Figure 34 shows the TCP throughput with various token bucket sizes. A token bucket of 120-130 kbits results in the best throughput. Above 130 Mbytes of bucket size, there are packet losses in the intermediate router due to the burstiness of the TCP traffic.
FIGURE 33TCP throughputs with various TCP socket size when TBF was used in TCP sender
FIGURE 34TCP throughputs with various token bucket sizes
1 711 -3 3
T C P so c ket s iz e (M by tes)
0 2 4 6 8
Thro
ughp
ut (M
bit/s
)
M ea su red th rou gh p u t (M b it/s )T h eo retical thro ug hp ut (M bit /s )T h ro u gh p u t w ith o u t sa te ll ite de lay
18 0
0
16 0
14 0
12 0
10 0
8 0
6 0
4 0
2 0
1 711 -3 4
Tok en buc k et s iz e (kb y te s)
0 20 40 60 80 10 0 12 0 14 0
Thro
ughp
ut (M
bit/s
)
M e asu red th ro ugh pu t (M bit /s )
T h ro ugh p u t w itho u t sa te llite de lay
12 0
10 0
80
60
40
20
0

Rec. ITU-R S.1711-1 37
4.4 Summary
TCP throughput was measured and the TCP internal behaviours in the heterogeneous high-speed network including GSO satellite link were analysed. The experiment results are summarized below:
1 For a maximum TCP throughput of 155 Mbit/s over a satellite network, about 6 Mbytes TCP socket size is needed.
2 When TCP source is on another network media that is faster than ATM-based satellite backbone, mechanisms to lessen burst traffic due to large TCP window are needed. Two solutions can be considered: large buffer in the intermediate routers or traffic control at the TCP source. For large buffer in intermediate routers, the queue buffer size to prevent packet losses due to the burst TCP traffic was estimated and verified through simulation. Alternatively, traffic control mechanism at the TCP source was considered: a throughput of about 95 Mbit/s (i.e. 95% of the maximum throughput without satellite delay) was achieved.
3 TCP window scale option for large TCP windows is one of the solutions to improve TCP performance in the long delay networks that include GSO satellite link. The use of large TCP windows in long delay network improves the throughput up to about 90% of theoretical maximum. But the large TCP window generates the burst traffic in short time. Especially in the case of the heterogeneous network that is composed of different physical media and different link-layer control protocols, there are serious packet losses in the intermediate router due to burst traffic. To avoid this situation, the network designer should consider possible solutions and verify them through experiments.
5 TCP performance in satellite access networks
This section presents the results of tests conducted by Star One, a satellite company from Brazil. Section 5.1 describes the network architecture used in the tests. Section 5.2 provides the system performance measurements using three-segment splitting and includes performance results. Section 5.3 draws some conclusions from the measurement results contained in § 5.2.
5.1 Network architecture and configuration
5.1.1 Network architecture
The system architecture encompasses a Hub with a DVB-S stream (outbound) and a proprietary reverse link (inbound). The central Hub is connected to an Internet backbone. Figure 35 shows the architecture of the system used to obtain the performance data.
The hub and VSAT local acknowledgements improve TCP performance by eliminating windowing limitation. The local acknowledgements eliminate slow start mechanism and improve TCP throughput efficiency. The IP headers compression used in this test reduces the system overhead and increases efficiency.

38 Rec. ITU-R S.1711-1
IGURE 35Network architecture
5.1.2 Configuration
5.1.2.1 VSAT and satellite characteristics
The two geostationary satellites are operating in the range of 14 068 MHz to 14 214 MHz (uplink) and 11 774 MHz to 11 919 MHz (downlink).
Each platform in use has a forward link (outbound) of 48 Mbit/s and 140 return channels (inbound) of 76.8 kbit/s.
This forms three clusters (Cluster 1, Cluster 2 and Cluster 3) using two different satellites (satellite A and satellite B) in the 14/11 GHz frequency band with a total of 8 000 VSATs installed on the Brazil territory. The RTT considered is 800 ms.
The cluster characteristics are shown below:Cluster 1 (Satellite A): divided in 3 HSPs with around 1 200 VSATsCluster 2 (Satellite A): divided in 3 HSPs with around 3 200 VSATsCluster 3 (Satellite B): divided in 4 HSPs with around 3 600 VSATs
The VSAT characteristics are shown in Table 15. The various necessary Eb/N0 ratios on the outbound link are shown in Table 16.
TABLE 15
VSAT characteristics
Clusters in use
Antenna size(m)
SSPA power(W)
Maximuminbound rate
(kbit/s)
Maximum outbound rate
(kbit/s)
1, 2 and 3 0.96 1 50 320
1 711 -3 5
R F m o d e m
V S AT
H u b
In tern et
E N D u s e r
H U B sy s te m
S a te lli te s (A an d B )
P C ID U O D U

Rec. ITU-R S.1711-1 39
TABLE 16
Characteristics of the outbound link
FEC ratios
DVB-S mode
Minimal Eb/N0
(dB)
1/2 4.52/3 5.03/4 5.55/6 6.07/8 6.4
5.1.2.2 Protocols
The protocol utilized in the uplink from the Hub to the VSAT (outbound) is a MPEG-2 transport stream over DVB-S. The IP packets are encapsulated, multiplexed and modulated in the Hub as described in Figs. 36 and 37.
FIGURE 36MPEG over DVB-S
FIGURE 37MPEG-transport stream
1 711 -3 6
D V B -Sm o d u la to r
M P E G -2m u ltip le x e r
IPe nc a ps u la tio n
In tern etfa r m
C o n dition a la cc e ss s y stem
M P E G -2tra ns p or t st re a mIP p a ck e ts
A n te n na
1 711-3 7
Q P S Km o d u la to r
P ID2 4 5D a ta
P ID2 3 2
V id e o
P ID1 3 3
A u d io
P ID2 3 2
V id e o
B a se b an ds ha p in gIn n e r co d eIn ter le a v eO u te r co d e
1 8 8 /2 0 4 b y te s
1 8 8 by tes H e ad e r (4 b y te s ) P a y lo a d ( 1 84 b y te s )
E n erg yd is p ersa l
D V B -S R e ed -S o lo m on
M P E G -2 tran s p or t s tre am
F E C

40 Rec. ITU-R S.1711-1
The reverse channels (inbound link) are MF-TDMA channels, divided in RA channels and DA channels as described in Fig. 38.
FIGURE 38Reverse channels
5.2 Results of performance measurement
The measurement of availability was performed in Clusters 1, 2 and 3. The measurement of throughput and traffic was only conducted in Clusters 2 and 3.
5.2.1 Availability
Table 17 shows the availability of each different cluster and the unavailability of the system caused by rain and others atmospheric conditions in each month of 2003.
5.2.2 Throughput
Tables 18 and 19 show the average throughput of Clusters 2 and 3 (respectively) and of their associated HSP. About 200 measurements per day were performed during each day of February 2004.
1 711 -3 8
11 34
3421
21
21
14
14
14
34
34
34
34
3425
31
R A D Af
t

Rec. ITU-R S.1711-1 41
TABLE 17
Availability of the outbound system
MonthPer clusters Total outbound system
unavailability due to rain, scintillation, etc.Cluster 1 Cluster 2 Cluster 3
January 100.0 99.0 N/A 1.4%February 100.0 100.0 N/A 1.1%March 99.9 100.0 N/A 0.2%April 100.0 100.0 N/A 0.0%May 100.0 100.0 99.9 0.0%June 100.0 100.0 99.9 0.0%July 100.0 100.0 100.0 0.0%August 100.0 100.0 100.0 0.0%September 100.0 100.0 100.0 0.0%October 99.9 99.9 99.9 0.0%November 100.0 99.9 100.0 0.1%December 100.0 100.0 100.0 0.1%Year average 100.0 99.9 100.0 0.2%
TABLE 18
Average throughput of Cluster 2
Average throughput per day(kbit/s)
Cluster 2 HSP 1 HSP 2 HSP 3
Average 308.97 310.33 309.02 307.58Median 307.66 311.76 309.50 306.63Maximum 319.11 317.44 321.36 324.09Minimum 302.13 304.03 299.06 298.70
TABLE 19
Average throughput of Cluster 3
Average throughput per day(kbit/s)
Cluster 3 HSP 1 HSP 2 HSP 3 HSP 4
Average 253.05 247.09 251.04 266.74 266.74Median 253.24 246.87 252.15 266.99 266.99Maximum 262.35 256.94 259.45 282.42 282.42Minimum 243.98 237.55 241.94 249.46 249.46

42 Rec. ITU-R S.1711-1
5.2.3 Traffic
Tables 20 and 21 show the total inbound traffic of Clusters 2 and 3 (respectively) measured during each day in February 2004.
TABLE 20
Traffic of Cluster 2
Total traffic per day(Gbyte)
Cluster 2 HSP 1 HSP 2 HSP 3
Average 6.08 5.72 6.21 6.30Median 7.02 6.60 7.00 7.00Maximum 7.65 7.57 8.10 7.99Minimum 3.56 3.15 3.80 3.51
TABLE 21
Traffic of Cluster 3
Total traffic per day(Gbyte)
Cluster 3 HSP 1 HSP 2 HSP 3 HSP 4
Average 4.84 5.44 4.58 5.74 3.58Median 5.33 6.26 4.65 6.35 3.88Maximum 6.33 7.44 6.34 7.54 5.14Minimum 2.64 2.79 2.39 2.63 1.89
5.3 Summary
Tests conducted over VSAT networks designed to provide IP connectivity in Brazil show that three-segment splitting as well as IP header compression allows to offer average throughput close to the theoretical maximum. This method also guarantees a good stability of the average throughput over a month period.
6 Application protocol measurements (FTP and HTTP)
ETRI in Korea and CRL in Japan started the Korea-Japan joint high data rate Satellite Communication Experiment in 2000. Two typical TCP applications – FTP and HTTP – were tested over ATM-based satellite network. The transmission of FTP and HTTP was done via Ka-band MUKUNGWHA-3 satellite.
Section 6.1 describes the network configuration for the experiment. Section 6.2 presents the experimental results of the tests conducted with FTP. Section 6.3 briefly introduces HTTP and

Rec. ITU-R S.1711-1 43
presents the experimental results of the tests conducted with HTTP. Section 6.4 summarizes the conclusions.
6.1 Satellite ATM network configuration
Figure 39 shows the configurations of Korea-Japan high-speed satellite ATM network. For this joint experiment, two earth stations with 7 m antenna at ETRI, Korea and 5 m antenna at CRL, Japan were installed respectively. For main specifications of the Korea-Japan satellite ATM network, see § 4.1.
FIGURE 39Satellite ATM network configuration
The FTP and HTTP server was installed at CRL using a Linux-based PC. The server was directly connected to the ATM network. At ETRI, two client PCs were installed using Windows 2000 and Linux respectively. They were connected to a PC router that had two network interfaces: ATM and gigabit Ethernet. A gigabit subnet and a server were interconnected through the ATM-based satellite network.
For the FTP experiment, NCFTP 3.0 was used as FTP client and WUFTPD 2.6.1 as server. WUFTPD enables to set the maximum TCP window size to the value of the operating system. NCFTP implements the TCP window scaling option.
For the HTTP experiment, Apache 1.3.12 was used as a web server running on Linux. The TCP window size was set to 10 Mbytes. In order to monitor the internal operation and the performance of HTTP 1.0 and HTTP 1.1, two web browsers were used: Netscape 4.77 Linux version for HTTP 1.0, W3C’s Webbot 5.2.8 for HTTP 1.1. When web pages were retrieved by the client’s request, all transferred packets were captured at the client side using tcpdump and post-processed using a tcptrace HTTP module. Five typical web pages were used in the HTTP experiment and described in Table 22.
1 711 -3 9
K a-b andM uk u ngw h a-3
E T R I,Tae je on
15 5 M b it/sm o dem
15 5 M b it/s AT M15 5 M b it/s AT M
AT Msw itch
P Crou ter
G iga b itnetw ork
7 ma nten n a/R F
5 ma nten n a /R F
C R L ,K ita kyu sh u
44 Rec. ITU-R S.1711-1
TABLE 22
Details of web pages
Web page Number of elements Page size(bytes)
China2008 30 212 207CRL 21 80 333FIFA 33 176 105LionKing 16 393 672RBLAB 8 72 103
6.2 FTP throughput over OC-3 satellite link
The goal was to measure the throughput of an FTP connection over an ATM-based satellite link. For the ease of comparison, the FTP throughput over a 155 Mbit/s link without satellite delay was also measured: a throughput of 118.32 Mbit/s was obtained with a TCP socket size of 64 kbytes (i.e. 87.5% of the theoretical throughput). Assuming a file size of about 92.1 Mbytes, the FTP throughput changing TCP socket buffer size was measured. Figure 40 shows FTP throughput using both a simulated and a real satellite link.
FIGURE 40FTP throughput over a 155 Mbit/s satellite network
In the case of FTP, many factors affect the throughput performance such as CPU utilization, disk I/O and internal memory allocation for the network drivers and disk drivers. Figures 41 and 42 show TCP time sequence and TCP congestion window graphs respectively for a TCP socket buffer size of 1 Mbyte. For the first 38 s, the file transfer runs normally, afterwards there were some data losses requiring retransmissions (since TCP recognizes data losses as due to network congestion). In
1 711 -4 0
4 .0
3 .0
2 .0
1 .0
0 .0
T C P soc k et s iz e (M by te s)
Thro
ughp
ut (M
bit/s
)
M e asu red in lab ora to ry
S a te llite n e tw o rk
0 .5 1 .5 2 .5 3 .5

Rec. ITU-R S.1711-1 45
Fig. 42, TCP congestion mechanism reduces the window size to half. Figure 41 shows another slow start after 38 s. As a result the overall throughput is severely degraded. Therefore for the normal operation of FTP with large TCP socket buffer, other system parameters and resources such as memory allocation for disk I/O and network driver interruption should be configured.
FIGURE 41TCP time sequence graph
(TCP buffer size = 1 Mbyte)
FIGURE 42TCP congestion window graph
(TCP buffer size = 1 Mbyte)
1 711 -4 1
10
R e la tive t im e (s )
3020 40
10
30
40
Sequ
ence
offs
et (M
bit/s
)
0
20
0
1 711 -4 2
10
R e la tive t im e (s)
3020 40
20 0 00 0
40 0 00 0
60 0 00 0
O uts tan d in g data
Out
stan
ding
dat
a (b
ytes
)

46 Rec. ITU-R S.1711-1
6.3 HTTP throughput over OC-3 satellite link
6.3.1 HTTP 1.0 with non-persistent connections
In HTTP 1.0, to download a complete web page, a separate TCP connection is required to retrieve each HTTP objects contained in a web page. Figure 43 shows the interactions between HTTP 1.0 client and server when a web page includes three objects. The base HTML page is first transferred via a TCP connection. Afterwards the TCP connection is closed and three new TCP connections are simultaneously established for the parallel download of the linked three objects. This may be inefficient as multiple simultaneous TCP connections burden the network.
FIGURE 43HTTP 1.0 – Non-persistent connections
6.3.2 HTTP 1.0 with “keep-alive” option
Some browsers and servers using HTTP 1.0 support the “keep-alive” option to overcome the inefficiency described above. This method uses one TCP connection to carry multiple HTTP requests. However browsers implementing this option can still establish multiple TCP connections. Figure 44 shows the operation of HTTP connection with the “keep-alive” option. The base document and one of the three objects are transferred through the first TCP connection. The other two objects are then transferred via two new TCP connections.
FIGURE 44HTTP 1.0 – “keep-alive” option
6.3.3 HTTP 1.1 without pipelining
The “keep-alive” extension, a form of persistent connection, was formally defined in HTTP 1.1. Persistent connections allow multiple requests. Responses can be contained in a single TCP connection and do not require multiple TCP connections. The performance of HTTP with persistent connections is improved because it bypasses the multiple slow start phases that would otherwise occur. Figure 45 shows the mechanism of HTTP 1.1 with persistent connection. The different objects are transferred in series. In the case of a base HTML document and three objects, it only takes four RTTs without pipelining.
1 711 -4 3
S e rverC lie ntG E T
G E T G E T G E T
D ATAD ATA
D ATA
D ATA
1 711 -4 4
S e rv e rC lie n tG E T
G E T G E T G E T
D ATAD ATA
D ATA
D ATA

Rec. ITU-R S.1711-1 47
FIGURE 45HTTP 1.1 without pipelining
6.3.4 HTTP 1.1 with pipelining
HTTP 1.1 with pipelining allows multiple requests to be sent without waiting for a response. The pipelining can be used to avoid many round trip delays and improve performance because it eliminates the idle time between consecutive object retrievals.
Figure 46 shows the interactions between server and client using HTTP 1.1 with pipelining. A base document and three objects are transferred through a single TCP connection.
FIGURE 46HTTP 1.1 with pipelining
6.3.5 Test results
The main goal was to measure the performance of Web page retrieval over satellite network using several HTTP versions. Table 23 summarizes the results of HTTP transfer over the satellite network for the five reference web pages. When webbot is used, only one TCP connection was established (HTTP 1.1 only needs one TCP connection). When Netscape was used, the number of TCP connections that were established corresponds to the number of elements linked to the web page. In the case of HTTP 1.0, each TCP connection is independent of the other ones. That is, each TCP connection performs slow start and congestion avoidance mechanism. When HTTP 1.0 was used, more packets were generated to transfer web page and linked elements. The total response time was less than with HTTP 1.1 without pipelining option. This means that, in long delay network, if there
1 711 -4 5
S erv erC lien t
G E T
G E T
G E T
D ATA
D ATA
D ATA
S e rv e rC lie n t
G E T
G E T
D ATA
D ATA
1 711 -4 6

48 Rec. ITU-R S.1711-1
is no network congestion, multiple simultaneous TCP connections may be more effective than a single one (especially when the size of the elements is small). However there are many negative aspects (e.g. burdens to server, network congestion due to more packets) of using multiple concurrent connections.
TABLE 23
HTTP transfer performance
Web page Web browserNumber of TCP
connections
Number of packets
Total response
time(s)
Average throughput
(bit/s)
China2008(30 objects,212 207 bytes)
Netscape 4.77 41 655 14.764 14 373Webbot without pipeline 1 306 21.158 10 030Webbot with pipeline 1 318 4.363 48 638
CRL(21 objects,80 333 bytes)
Netscape 4.77 22 307 8.642 9 296Webbot without pipeline 1 133 13.547 5 930Webbot with pipeline 1 137 3.247 24 741
FIFA(33 objects,176 105 bytes)
Netscape 4.77 34 551 13.054 13 491Webbot without pipeline 1 282 21.682 8 122Webbot with pipeline 1 285 4.328 40 690
LionKing(16 objects,393 672 bytes)
Netscape 4.77 14 660 8.277 47 562Webbot without pipeline 1 514 12.529 31 421Webbot with pipeline 1 564 4.882 80 637
RBLAB(8 objects,72 103 bytes)
Netscape 4.77 8 166 4.365 16 518Webbot without pipeline 1 104 6.540 11 025Webbot with pipeline 1 119 3.822 18 865
When the request for a web page is made, the browser issues an HTTP GET command for the base HTML document. One RTT later, the base document will be received. Then the browser issues further GET commands for each element linked in the base document. With pipelining option of HTTP 1.1, these GET commands can be generated as soon as the reference is received by the browser without waiting for the current data transfer from the server to be completed. In the case of HTTP 1.0, separate TCP connections are established for the transfer of each element.
Figure 47 shows the sequence of element retrieval request and transfer for RBLAB page (seven elements). Item 1 in Figs. 47b) and 47c) represent the time for the entire transfer of the base page and linked objects. The other items depict the time for the transfer of each object. Item 2 is the first document from the web server at the request of the browser. Its transfer duration is the same regardless of HTTP version or options. However the following items have different transfer start times and durations depending on HTTP version and options. In the case of HTTP 1.0 (see Fig. 47a)), when the base documents are received, the browser requests multiple GET for the objects linked to the base page. Therefore a number of TCP connections are established through three-way handshaking with a different connection request for each element. When the RBLAB page is loaded through HTTP 1.1 with pipelining option, the transfer of the following objects starts as soon as the base element is received. Without the pipelining option, the transfer of other objects can not start until the transfer of previous objects is completed. HTTP 1.1 establishes only one TCP connection hence triggering only one slow start.

Rec. ITU-R S.1711-1 49
FIGURE 47RBLAB web page and its elements transfer sequence graph
1 711 -4 7
E lem en t n um b er
Tim
e (s
)
a ) H T T P 1 .0 no “k eep -a liv e” (n etscap e )
Tim
e (s
) Ti
me
(s)
Tim
e (s
)
E le m en t n u m b er
E le m en t n u m b er
b ) H T T P 1 .1 w ith p ip elin ing (w eb b o t)
c ) H T TP 1 .1 w ith ou t pipe lin in g (w eb b ot)

50 Rec. ITU-R S.1711-1
When the pipelining option is active, several elements are transferred in the same connection appearing as a single bulk transfer. Many experiments show that bulk data transfers have good performance in LFN such as with GSO satellite networks. Therefore it seems that HTTP 1.1 with the pipelining option provides the best performance.
6.4 Summary
The maximum FTP throughput was about 3 Mbit/s with a TCP socket size of 1 Mbytes. With a TCP socket size of more than 1 Mbytes, the throughput is degraded. In the case of memory-to-memory transfer over satellite channel, the throughput mainly depends on the TCP window size. Increasing the TCP buffer size to improve TCP throughput may degrade the FTP performance by affecting disk I/O or system memory allocations.
As a result of several HTTP throughput measurements, it was found that HTTP 1.1 with pipelining option provided the best performance.
7 Conclusions
The various tests and measurement results presented in this annex provide guidance on the design of TCP performance enhancements depending on the satellite network configuration.
The following results are of particular significance when designing a satellite network: – TCP throughput is not affected as long as the satellite link BER is better than 10−7 (see § 2).– Splitting techniques can improve the throughput of TCP-based traffic on satellite links
(see § 2, 3 and 5).– Caching only does not provide effective performance enhancement in the case of moving
picture-based or text-based websites and has in any case to be combined with spoofing (see § 3).
– The use of large TCP windows in satellite links improves the throughput up to about 90% of the theoretical maximum. But large TCP windows generate burst traffic, which in turn could result in packet losses in intermediate routers due to buffer saturation (see § 4).
– Implementing traffic control mechanism at the TCP source can result in a throughput of about 95% of the throughput that would be achieved without satellite delay (see § 4).
– Increasing the TCP buffer size improves TCP throughput, but may in turn degrade application-layer performance by affecting disk I/O or system memory allocations (see § 6).
– In networks using satellite links, HTTP 1.1 with pipelining option provides the best performance in terms of throughput (see § 6).