temperature influence on the white muscle growth … cientificas/lopez albor… · dicentrarchus...
TRANSCRIPT
Available online at www.sciencedirect.com
(2008) 39–51www.elsevier.com/locate/aqua-online
Aquaculture 277
Temperature influence on the white muscle growth dynamics of the sea bassDicentrarchus labrax, L. Flesh quality implications at commercial size
Octavio López-Albors a,⁎, Isaac Abdel b, Ma. Jesús Periago c, Ma. Dolores Ayala a,Alicia García Alcázar b, Carmen Martínez Graciá c, Cosmas Nathanailides d, José Ma. Vázquez a
a Department Anatomía y Anatomía Patológica Comparadas, University of Murcia, Veterinary Faculty, 30100 Murcia, Spainb Centro Oceanográfico de Murcia, Instituto Español de Oceanografía, Ctra. de La Azohía s/n, Puerto de Mazarrón, 30860, Spain
c Department Tecnología de los Alimentos, Nutrición y Bromatología, University of Murcia, Veterinary Faculty, 30100 Murcia, Spaind Department of Aquaculture and Fisheries, Faculty of Agricultural Sciences, Epirus Institute of Technological Educational, Igoumenitsa 46100, Greece
Received 12 July 2007; received in revised form 11 February 2008; accepted 13 February 2008
Abstract
Rearing temperature was used to monitor muscle growth patterns of sea bass Dicentrarchus labrax, L. from hatching to the commercial size(350 g, 30 cm). At this moment, the white muscle cellularity, proximate composition and organoleptic parameters of the fillet were analysed toevaluate the influence of temperature on the structure and quality of the commercial product. One ambient (A/A) and three warm regimes oftemperature were compared. In warmed tanks temperature was raised to 19 °C: during the larval period (W/A), only during the cool seasons(winter and early spring) (A/W), or both during the larval period and cool seasons (W/W). High temperature during the larval period was positivefor an advanced yield of fingerlings and early juveniles. Winter heating of juveniles also advanced the time to reach 200 g by 25 days. However,independently of the thermal regime all fish attained the commercial size at approximately 600 days. Temperature modulated the rates ofhypertrophy and hyperplasia of white muscle fibres throughout the larval, fingerling and juvenile periods, such that at commercial size the numberand size distributions of muscle fibres varied depending on the previous thermal story. Thus, the density of muscle fibres (number/mm2) wasmaximum in tank W/A (212.19±8.77) and minimum in W/W (151.95±8.7) (pb0.001). The proximate composition varied for moisture andprotein content, but independently of temperature, all the sensorial attributes of cooked flesh (firmness, juiciness, fattiness, chewiness, flavour andodour) were similar. Thus, no correlation between muscle fibre size and flesh texture was found. Compensatory growth of fish reared at ambienttemperature and the uniformity of the proximate composition and sensorial properties evaluated by panellists minimized the impact of temperatureon both the time at harvest and the quality of the commercial product.© 2008 Elsevier B.V. All rights reserved.
Keywords: Fish; Muscle growth; Temperature; Sea bass; Flesh quality
1. Introduction
The axial musculature is the edible part of most commercialfish accounting for approximately 60–70% of fish weight. It isarranged in a series of folded myotomes each one including a thinsuperficial layer of redmuscle, enlarged to some extent at the levelof the lateral line, and a deep stratum of white muscle which
⁎ Corresponding author. Tel.: +34 968 364694; fax: +34 968 364147.E-mail address: [email protected] (O. López-Albors).
0044-8486/$ - see front matter © 2008 Elsevier B.V. All rights reserved.doi:10.1016/j.aquaculture.2008.02.015
comprises up to 80% of the trunk musculature thickness. Due togreat variability in the size of muscle fibres, at microscopicallevel, a cross-section of the white muscle usually displays atypical image of mosaic. White muscle fibre size variability is theconsequence of a double mechanism of muscle growth:hypertrophy and hyperplasia of muscle fibres. Hypertrophy isan increase in the size of the muscle fibres, whereas muscle fibrehyperplasia depends on the recruitment of newmuscle fibres. Thecellular basis of both processes is the existence of a population ofmyogenic progenitor cells, which after activation and severalmitoses (proliferation), either add to the existing muscle fibres to
40 O. López-Albors et al. / Aquaculture 277 (2008) 39–51
keep their volumetric ratio of cytoplasm to nuclei within thephysiologic limits (hypertrophy), or fuse to other myogenic cellsto differentiate progressively into newmuscle fibres (hyperplasia)(Johnston, 1999). In most teleost of a large final size, muscle fibrehyperplasia persists throughout the juvenile and even adult stages(Rowlerson and Veggetti, 2001).
Depending on endogenous as well as environmental factors,temperature may significantly influence the muscle growthpatterns of fish by a modulation of the rates of hypertrophy andhyperplasia of muscle fibres (Johnston et al., 2003a). Conse-quently, themuscle cellularity, defined by the size distribution andtotal number of muscle fibres in the myotomes, may significantlyvary throughout the lifecycle of fish. The relationship betweentemperature and muscle growth patterns has been investigated inembryos, larvae and postlarvae of several marine and fresh waterspecies of farming interest such as Atlantic salmon, Salmo salar,L. (Stickland et al., 1988; Nathanailides et al., 1995, Johnstonet al., 2003a), common trout Salmo trutta (Killeen et al., 1999),Atlantic cod Gadus morhua (Galloway et al., 1998), turbotScophthalmus maximus (Gibson and Johnston, 1995), pacuPiaractusmesopotamicus (deAsis et al., 2004), etc. The influenceof temperature on the muscle growth dynamics of sea bass hasbeen studied during larval stages (Ayala et al., 2000, 2001, 2003;Wilkes et al., 2001; Alami-Durante et al., 2006), early postlarval(Nathanailides et al., 1996; López-Albors et al., 2003), and
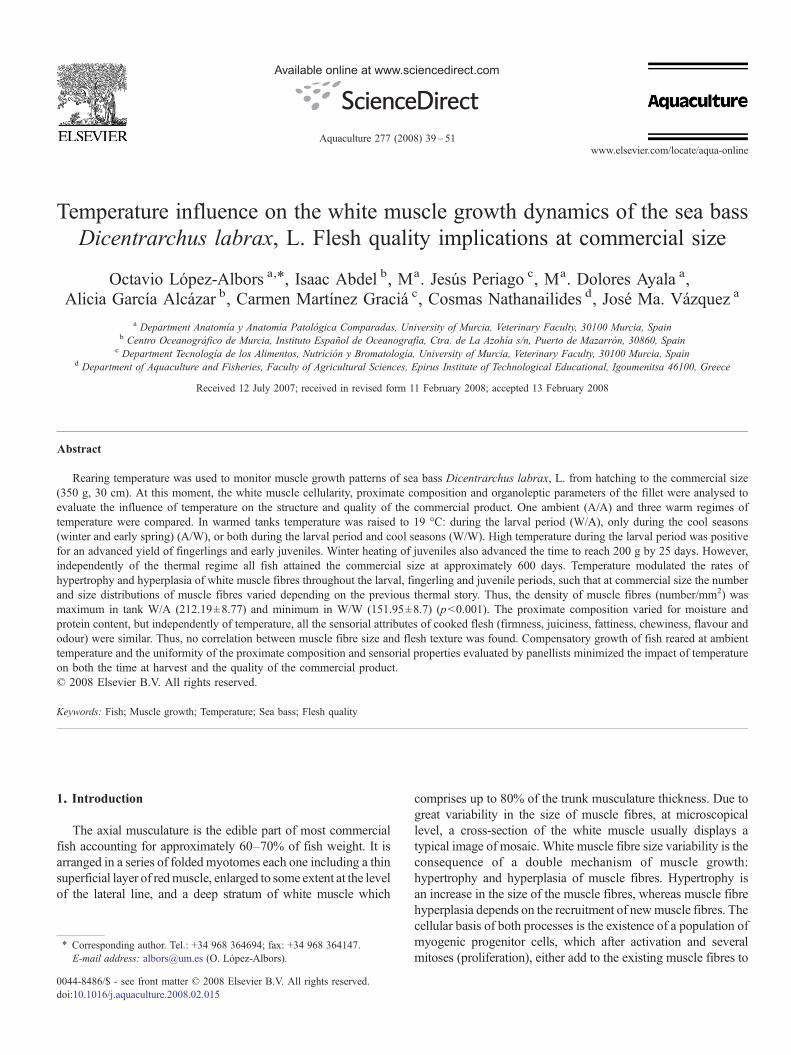
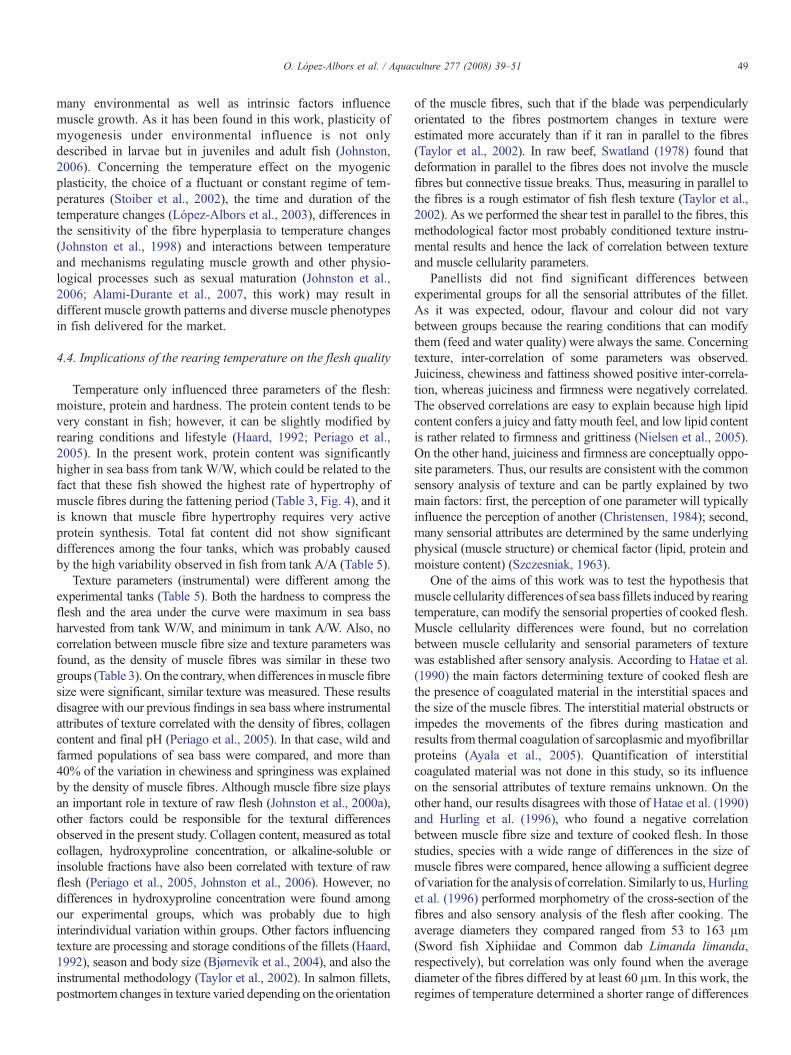
Fig. 1. Regimes of temperature and sampling. a) A/A and W/W tanks; b) A/W and WW/Wand W/A tanks, respectively. Sampling points correspond to: end of the larval pe
advanced juvenile periods (≈210 mm, Alami-Durante et al.,2007). In this work, the whole productive lifecycle of sea bass isstudied for the first time: from hatching to the usual market size(approximately 30 cm, 350–400 g). Investigations focused on thefinal growth period of fattening or ongrowing are relevant for thefish farm industry.We were interested in monitoring the influenceof the rearing temperature on the muscle growth dynamics andfinal cellularity of the fillet. The hypothesis was that sea basswhite muscle cellularity at harvest can vary depending on thethermal regime of rearing.
Four regimes of temperature were used: ambient/ambient(A/A), warm/warm (W/W), warm/ambient (W/A) and ambient/warm (A/W) (Fig. 1). Warm water (W=19–20 °C) was usedduring the larval period and/or in the following winter and earlyspring seasons. Justification of thermal regimes is based on thefollowing facts.Water heating during the larval period (20 °C), hasgreatly improved sea bass husbandry in the last two decades(Moretti et al., 1999). Also, early temperature may affect musclephenotype by immediate and even persistent effects on musclecellularity of postlarvae (Johnston and Hall, 2004). On the otherhand, probably due to seasonal influences and particularphysiological conditions, somatic growth of juvenile sea bass isgenerally reduced inwinter (Akbulut and Sahin, 1999;Abdel et al.,2004). Water heating during cold months could therefore be usedto overcome somatic growth constraints by seasonal influence.
/A tanks. Solid and dotted arrows indicate samples for A/A and A/W tanks, andriod (I), 4 g (II), 10 g (III), 50 g (IV), 200 g (V) and 350 g (VI, commercial size).
41O. López-Albors et al. / Aquaculture 277 (2008) 39–51
Sea bass, together with Gilthead sea bream Sparus aurata, L.,is one of the main reared species in Mediterranean countries. InSpain, sea bass production reached a peak of 9438.78 tons in 2006(www.mapa.es), and figures may increase during the followingyears due to reasonable price in markets and highly appreciatedquality. Despite its economic relevance there is still limitedscientific information about the influence of rearing conditions onthe quality of the final product. Fish quality has been traditionallyassociated with freshness. However, nowadays fish quality is awider concept involving attributes associated to chemical andnutritional composition, as well as to various organoleptic param-eters such as flavour, odour, and textural properties. Flesh qualityof cultivated fish can be influenced by physiological (biologicalage, growth rate, sexual maturation), environmental (water tem-perature, salinity, pressure, water flow) and dietary (feeding cycle,starvation, overfeeding, diet composition) factors (Haard, 1992).Changes in any of these factors can potentially modify thechemical composition or the nutritional and sensorial qualities ofthe flesh. Among the sensorial characteristics, texture is one of themost important parameters for fish producers, processors andconsumers (Hyldig and Nielsen, 2001). Texture is influenced byseveral factors such as species, age, size, growth rate, nutritionalstage and postmortem biochemical changes (Love, 1983; Barrosoet al., 1998). In different teleost species, sea bass included, acorrelation between texture and muscle fibre size has been dem-onstrated (Hatae et al., 1990; Hurling et al., 1996; Johnston et al.,2000a; Periago et al., 2005). Large muscle fibre size, or cor-respondingly lowmuscle fibre density, correlatedwith soft textureof the flesh. Recently, we found that sea bass texture of raw fleshwas correlated with muscle fibre size, pH and collagen content(Periago et al., 2005). However, the relationship between musclecellularity and quality parameters of cooked flesh remains to beinvestigated in sea bass. Considering these precedents and theformer hypothesis written above, a supplementary hypothesis forthe present study was that muscle cellularity differences induced
Table 1Fish sampling and corresponding average values for age, degree days, weight and l
Sampling stage Temperature regime Age (days post f
Hatching A/A and A/W 3.75W/A and W/W 3.75
End of metamorphosis (scaling) A/A and A/W 93W/A and W/W 82
4 g A/A and A/W 132W/A and W/W 112
10 g A/A and A/W 180W/A and W/W 168
50 g A/A and A/W 267W/A and W/W 237
200 g A/A 545A/W 520W/A 513W/W 507
350 g A/A 605 and 612A/W 605 and 612W/A 605 and 612W/W 605 and 612
Column values with different superscripts within each sampling stage are significan
by rearing temperature may modify the sensorial properties of thecooked flesh.
2. Materials and methods
2.1. Fish rearing
Fish were cultivated in the Centro Oceanográfico de Murcia (Instituto Españolde Oceanografía). On the 6th of February 2002, a selected spawn of 600,000 eggswas equally distributed in four cylindrical tanks (1 m3), each one aimed toexperience a different thermal regime (Fig. 1): in tank A/A, water was kept atambient temperature throughout the whole experiment (range of temperature 14 to28 °C); in tankW/W, after the absorption of the yolk sac of larvae (mouth opening)temperature was raised to 19–20 °C, and kept constant until the beginning of May,when the ambient temperature reached 19 °C. In this tank temperature wasincreased again during the following winter and early spring seasons (fromDecember the 18th of 2002 to April the 30th of 2003). In tankW/A, water was onlyheated during the larval phase; and finally, in tankA/W,water heating correspondedto winter and early spring seasons. Hence, from the beginning of the experiment toDecember the 18th (310 days), tanks A/A and A/W, as well as tanksW/WandW/Aexperienced the same regime of temperatures (duplicate tanks). The analysisof variance (Anova) and post-hoc Tukey test for the length and weight offish throughout this period demonstrated the inexistence of differences betweenduplicates (no tank effect): pA/A versus A/W=0.415 and pW/W versus W/A=0.081 forlength, and pA/A versus A/W=0.053 and pW/W versus W/A=0.364 for weight.
Initial larval rearing was done in darkness and without feeding until 160 °C-day. At that moment, a photoperiod of 16:8 h (light:dark) with 500 lux intensitywas set up and larvae fed with nauplii of Artemia salina. Oxygen level wasmonitored with an oximeter (Oxiguard Mk III) and maintained over 6 ppm.Salinity was approximately 36‰. Weaning began at 35–40 days and larvalfeeding consisted of extruded commercial feed (Trouw, S.A). Postlarvae weretransferred to rectangular tanks (2.5 m3) up to a weight of 15 g and subsequentlyto tanks of 7.5 m3 until commercial size (≅350 g). To monitor fish growth, theweight and length of 50 fish from each tank were recorded monthly. Fingerlingsand juveniles were fed ad libitum with a commercial diet (Trouw, S.A) whichcontained: 45% protein, 11% ash and 22% fat.
The sampling strategy was defined for equivalent stages of development in thelarval period— hatching and end of the larval metamorphosis (scaling)— and fordefinedweights in fingerlings (4 and 10 g) and juveniles (50 and 200 g), until a finalstage of commercial size (350 g) (Table 1, Fig. 1). Fish of commercial sizewere sampled in two consecutive weeks to allow a simultaneous and optimum
ength
ertilization) Degree days (°C) Weight (g) Length (cm)
59 – 0.31959 – 0.319
1676 – 1.33±0.35a
1390 – 5.19±1.17b
2567 4.24±0.15a 7.31±0.12a
1953 3.35±0.14b 7.76±0.1b
3790 10.86±0.13a 13.23±0.61a
3262 11.05±0.13a 13.88±0.35a
5883 50.15±0.65a 17.36±0.17a
5058 52.32±1.03a 17.04±0.2a
10,888 202.63±2.39a 25.92±0.24a
10,630 201.54±2.18a 26.35±0.14a
10,652 206.83±1.97a 26.08±0.21a
10,532 192.35±1.25b 26.06±0.11a
12,631 353.12±4.62a 31.12±0.31a
13,060 348.98±4.5a 31.26±0.38a
12,549 343.84±6.08a 31.03±0.3a
13,262 345.49±4.9a 30.96±0.29a
tly different (pb0.05).
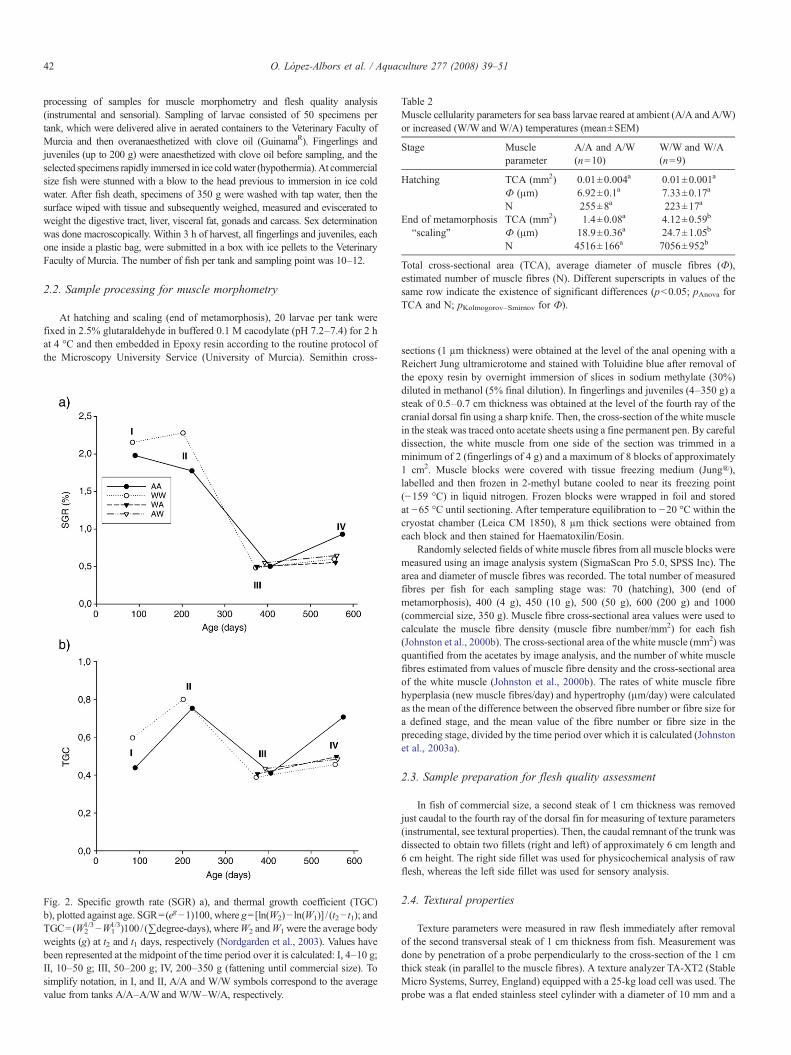
Table 2Muscle cellularity parameters for sea bass larvae reared at ambient (A/A and A/W)or increased (W/W and W/A) temperatures (mean±SEM)
Stage Muscleparameter
A/A and A/W(n=10)
W/W and W/A(n=9)
Hatching TCA (mm2) 0.01±0.004a 0.01±0.001a
Ф (μm) 6.92±0.1a 7.33±0.17a
N 255±8a 223±17a
End of metamorphosis“scaling”
TCA (mm2) 1.4±0.08a 4.12±0.59b
Ф (μm) 18.9±0.36a 24.7±1.05b
N 4516±166a 7056±952b
Total cross-sectional area (TCA), average diameter of muscle fibres (Ф),estimated number of muscle fibres (N). Different superscripts in values of thesame row indicate the existence of significant differences (pb0.05; pAnova forTCA and N; pKolmogorov–Smirnov for Ф).
42 O. López-Albors et al. / Aquaculture 277 (2008) 39–51
processing of samples for muscle morphometry and flesh quality analysis(instrumental and sensorial). Sampling of larvae consisted of 50 specimens pertank, which were delivered alive in aerated containers to the Veterinary Faculty ofMurcia and then overanaesthetized with clove oil (GuinamaR). Fingerlings andjuveniles (up to 200 g) were anaesthetized with clove oil before sampling, and theselected specimens rapidly immersed in ice coldwater (hypothermia).At commercialsize fish were stunned with a blow to the head previous to immersion in ice coldwater. After fish death, specimens of 350 g were washed with tap water, then thesurface wiped with tissue and subsequently weighed, measured and eviscerated toweight the digestive tract, liver, visceral fat, gonads and carcass. Sex determinationwas done macroscopically. Within 3 h of harvest, all fingerlings and juveniles, eachone inside a plastic bag, were submitted in a box with ice pellets to the VeterinaryFaculty of Murcia. The number of fish per tank and sampling point was 10–12.
2.2. Sample processing for muscle morphometry
At hatching and scaling (end of metamorphosis), 20 larvae per tank werefixed in 2.5% glutaraldehyde in buffered 0.1 M cacodylate (pH 7.2–7.4) for 2 hat 4 °C and then embedded in Epoxy resin according to the routine protocol ofthe Microscopy University Service (University of Murcia). Semithin cross-
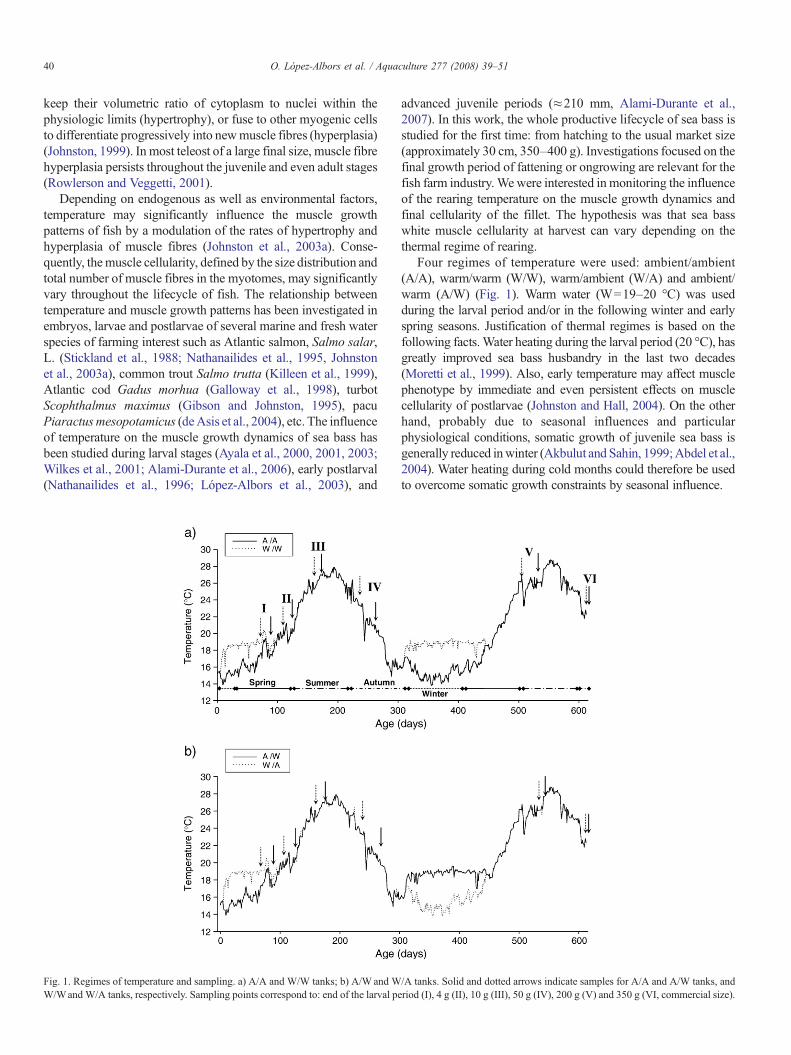
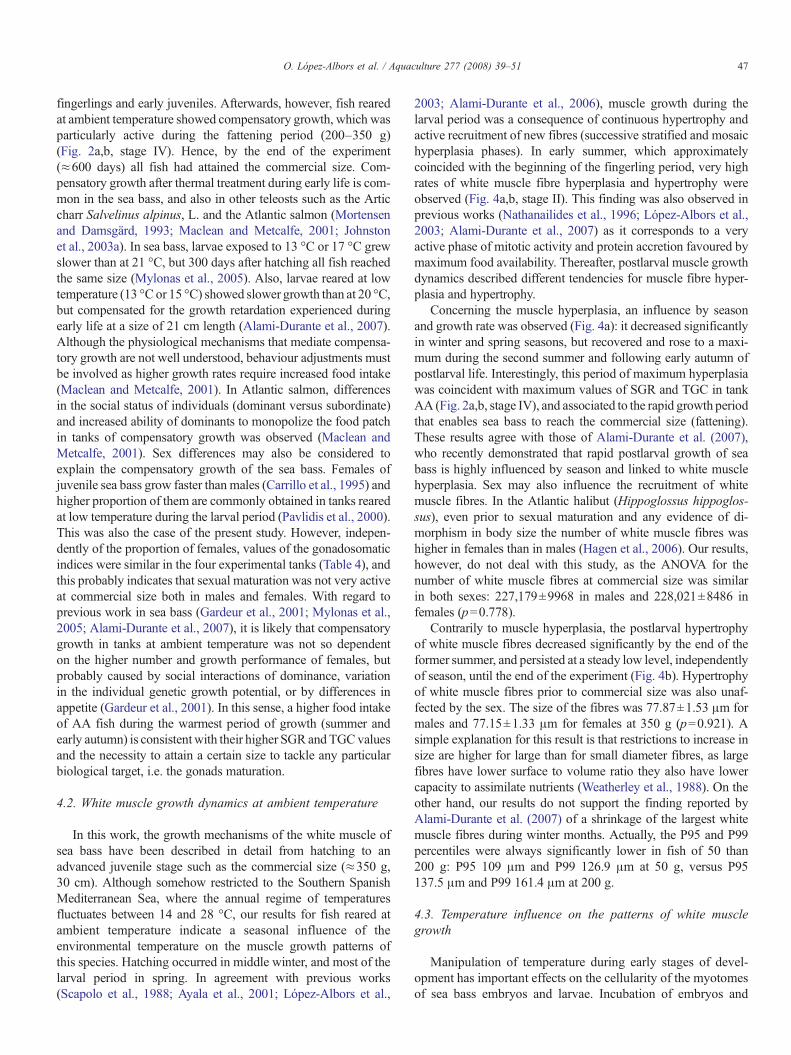
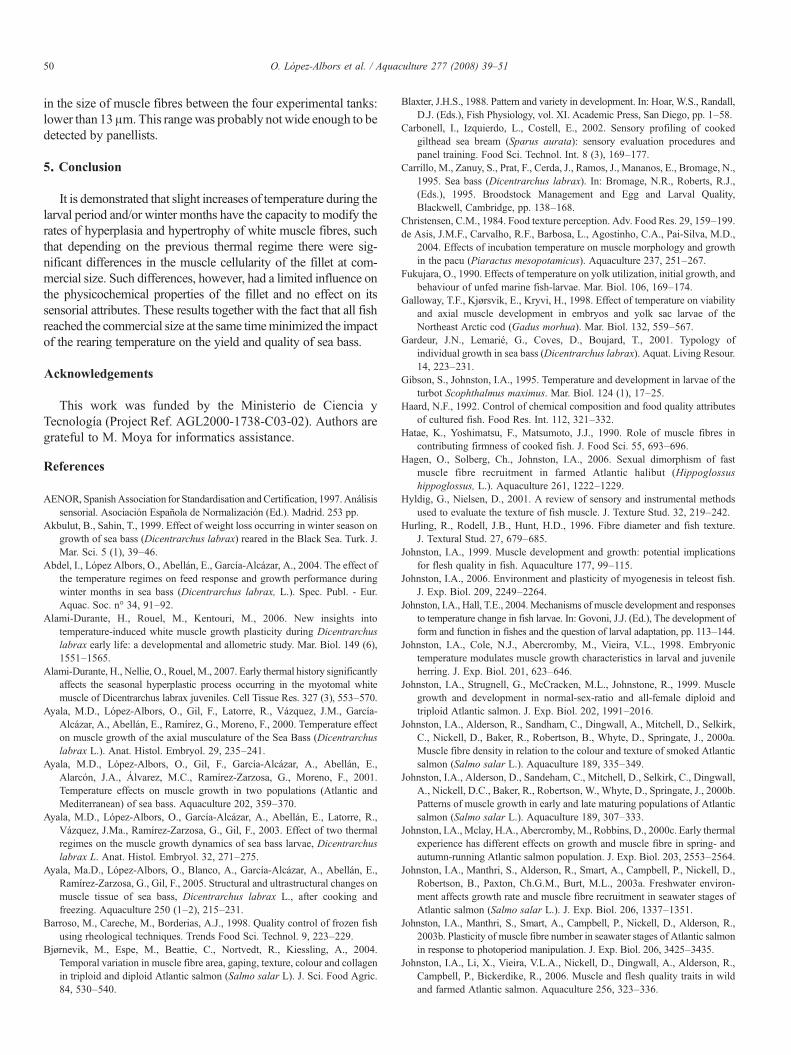
Fig. 2. Specific growth rate (SGR) a), and thermal growth coefficient (TGC)b), plotted against age. SGR=(eg−1)100, where g=[ln(W2)− ln(W1)] / (t2− t1); andTGC=(W2
1/3−W11/3)100/ (∑degree-days), whereW2 andW1 were the average body
weights (g) at t2 and t1 days, respectively (Nordgarden et al., 2003). Values havebeen represented at the midpoint of the time period over it is calculated: I, 4–10 g;II, 10–50 g; III, 50–200 g; IV, 200–350 g (fattening until commercial size). Tosimplify notation, in I, and II, A/A and W/W symbols correspond to the averagevalue from tanks A/A–A/W and W/W–W/A, respectively.
sections (1 µm thickness) were obtained at the level of the anal opening with aReichert Jung ultramicrotome and stained with Toluidine blue after removal ofthe epoxy resin by overnight immersion of slices in sodium methylate (30%)diluted in methanol (5% final dilution). In fingerlings and juveniles (4–350 g) asteak of 0.5–0.7 cm thickness was obtained at the level of the fourth ray of thecranial dorsal fin using a sharp knife. Then, the cross-section of the white musclein the steak was traced onto acetate sheets using a fine permanent pen. By carefuldissection, the white muscle from one side of the section was trimmed in aminimum of 2 (fingerlings of 4 g) and a maximum of 8 blocks of approximately1 cm2. Muscle blocks were covered with tissue freezing medium (Jung®),labelled and then frozen in 2-methyl butane cooled to near its freezing point(−159 °C) in liquid nitrogen. Frozen blocks were wrapped in foil and storedat −65 °C until sectioning. After temperature equilibration to −20 °C within thecryostat chamber (Leica CM 1850), 8 µm thick sections were obtained fromeach block and then stained for Haematoxilin/Eosin.
Randomly selected fields of white muscle fibres from all muscle blocks weremeasured using an image analysis system (SigmaScan Pro 5.0, SPSS Inc). Thearea and diameter of muscle fibres was recorded. The total number of measuredfibres per fish for each sampling stage was: 70 (hatching), 300 (end ofmetamorphosis), 400 (4 g), 450 (10 g), 500 (50 g), 600 (200 g) and 1000(commercial size, 350 g). Muscle fibre cross-sectional area values were used tocalculate the muscle fibre density (muscle fibre number/mm2) for each fish(Johnston et al., 2000b). The cross-sectional area of the white muscle (mm2) wasquantified from the acetates by image analysis, and the number of white musclefibres estimated from values of muscle fibre density and the cross-sectional areaof the white muscle (Johnston et al., 2000b). The rates of white muscle fibrehyperplasia (new muscle fibres/day) and hypertrophy (μm/day) were calculatedas the mean of the difference between the observed fibre number or fibre size fora defined stage, and the mean value of the fibre number or fibre size in thepreceding stage, divided by the time period over which it is calculated (Johnstonet al., 2003a).
2.3. Sample preparation for flesh quality assessment
In fish of commercial size, a second steak of 1 cm thickness was removedjust caudal to the fourth ray of the dorsal fin for measuring of texture parameters(instrumental, see textural properties). Then, the caudal remnant of the trunk wasdissected to obtain two fillets (right and left) of approximately 6 cm length and6 cm height. The right side fillet was used for physicochemical analysis of rawflesh, whereas the left side fillet was used for sensory analysis.
2.4. Textural properties
Texture parameters were measured in raw flesh immediately after removalof the second transversal steak of 1 cm thickness from fish. Measurement wasdone by penetration of a probe perpendicularly to the cross-section of the 1 cmthick steak (in parallel to the muscle fibres). A texture analyzer TA-XT2 (StableMicro Systems, Surrey, England) equipped with a 25-kg load cell was used. Theprobe was a flat ended stainless steel cylinder with a diameter of 10 mm and a
43O. López-Albors et al. / Aquaculture 277 (2008) 39–51
pace of 1.1 mm/s. Fillet temperature during compression was kept at 5–8 °C bystoring the fillets in plastic bags inside a fridge until measurement. Compressioncurves were recorded and texture properties expressed as hardness (maximumcompression force) and area under the curve (maximum compression work).
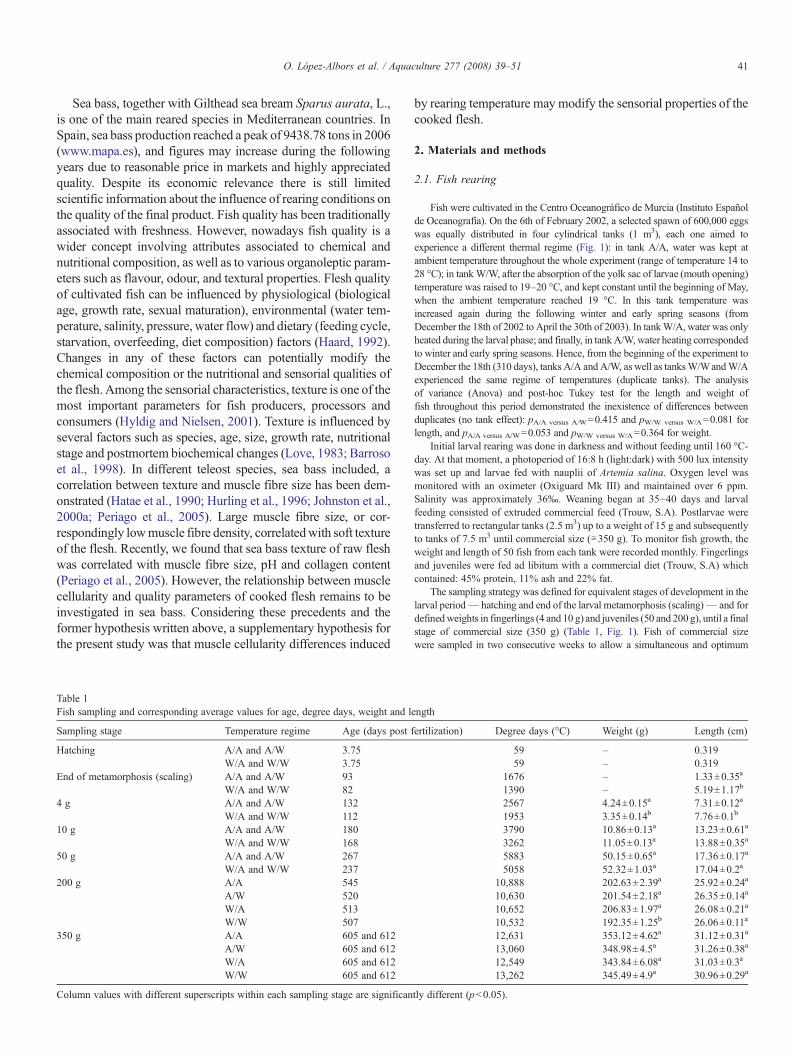
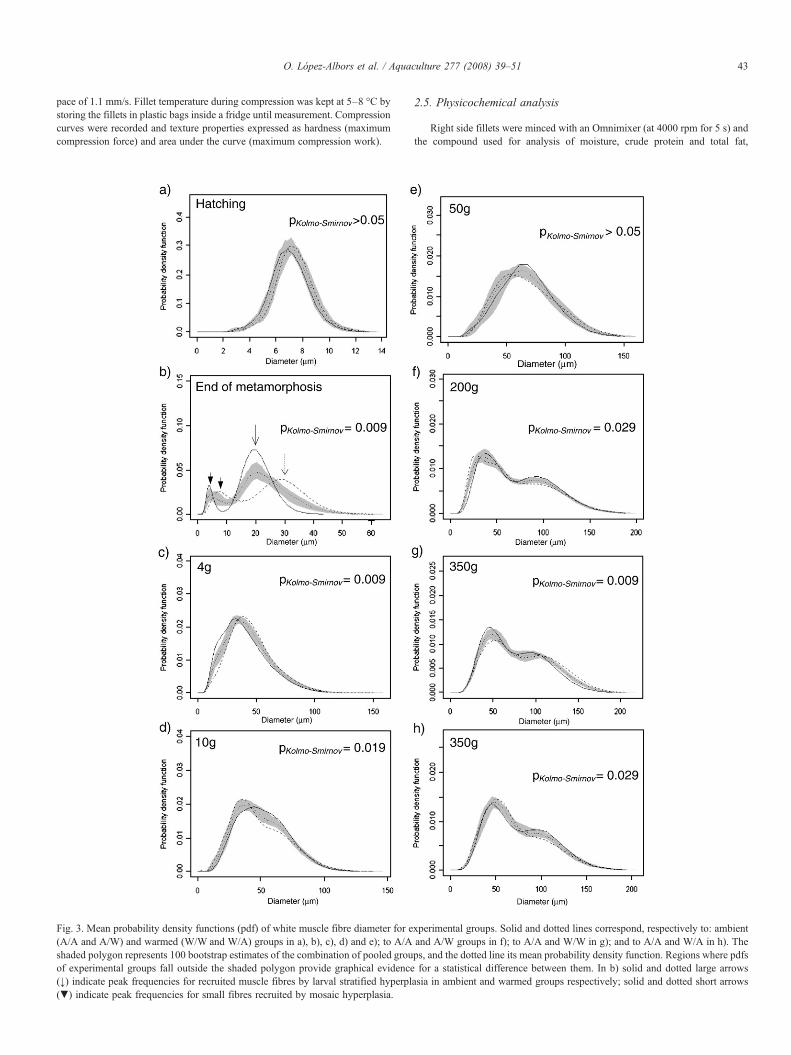
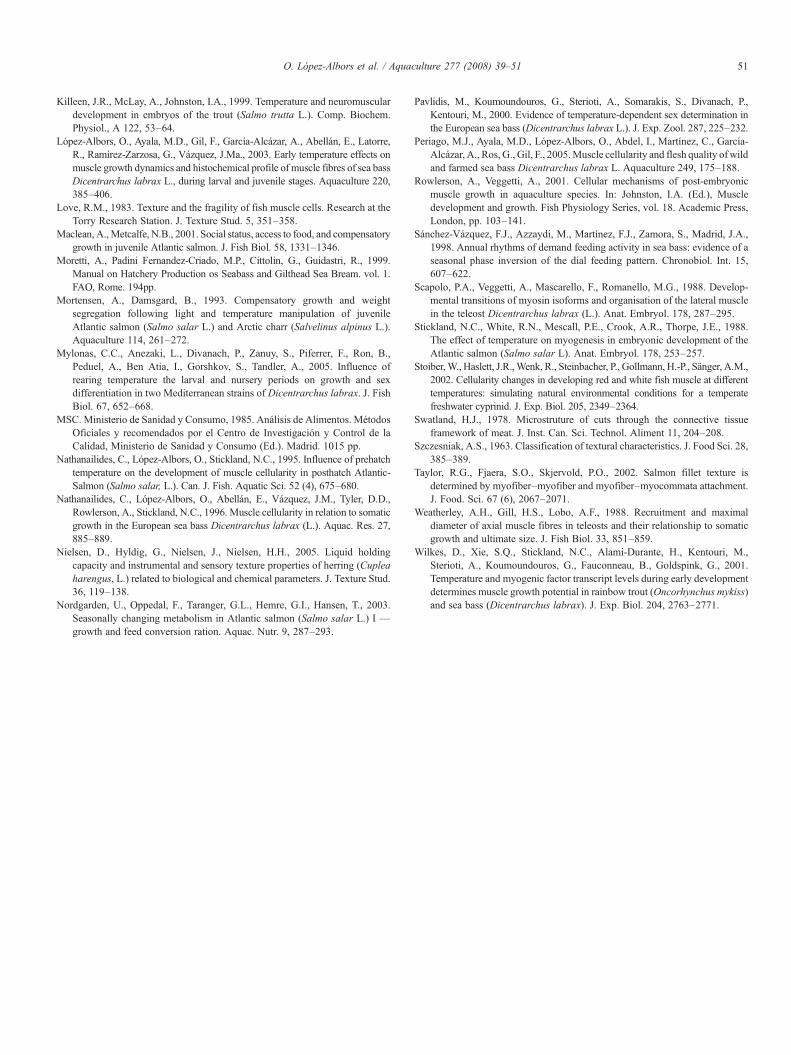
Fig. 3. Mean probability density functions (pdf) of white muscle fibre diameter for e(A/A and A/W) and warmed (W/W and W/A) groups in a), b), c), d) and e); to A/Ashaded polygon represents 100 bootstrap estimates of the combination of pooled grouof experimental groups fall outside the shaded polygon provide graphical evidence(↓) indicate peak frequencies for recruited muscle fibres by larval stratified hyperpl(▼) indicate peak frequencies for small fibres recruited by mosaic hyperplasia.
2.5. Physicochemical analysis
Right side fillets were minced with an Omnimixer (at 4000 rpm for 5 s) andthe compound used for analysis of moisture, crude protein and total fat,
xperimental groups. Solid and dotted lines correspond, respectively to: ambientand A/W groups in f); to A/A and W/W in g); and to A/A and W/A in h). Theps, and the dotted line its mean probability density function. Regions where pdfsfor a statistical difference between them. In b) solid and dotted large arrows
asia in ambient and warmed groups respectively; solid and dotted short arrows
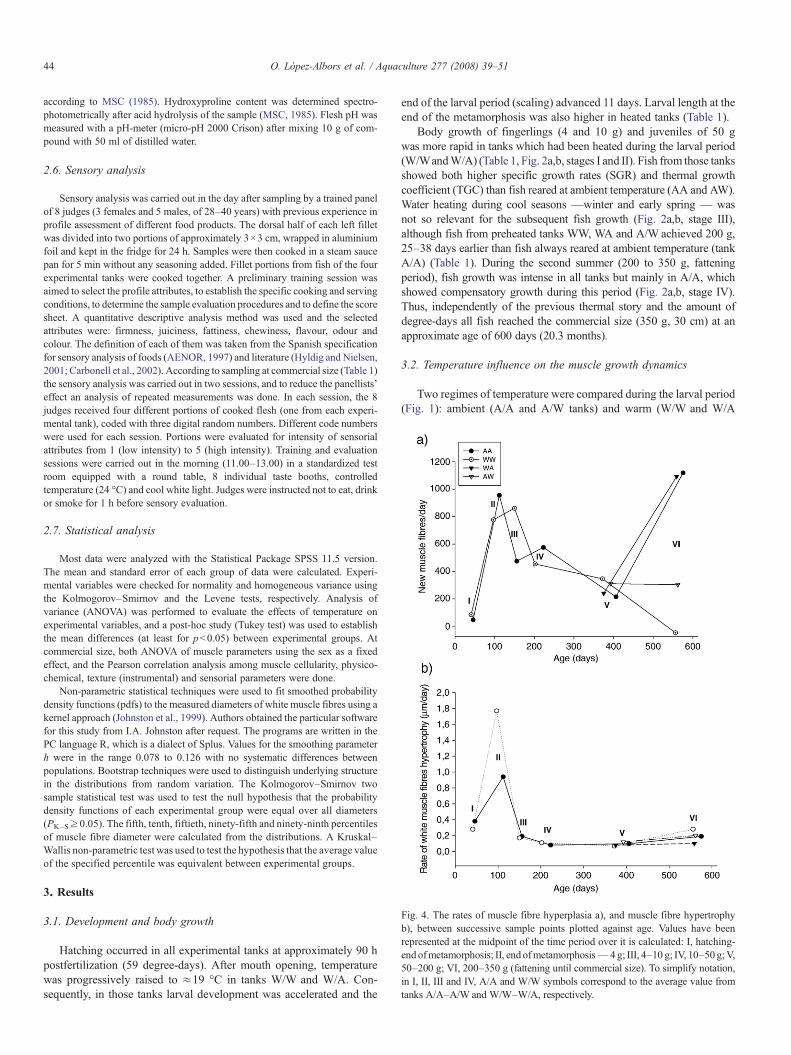
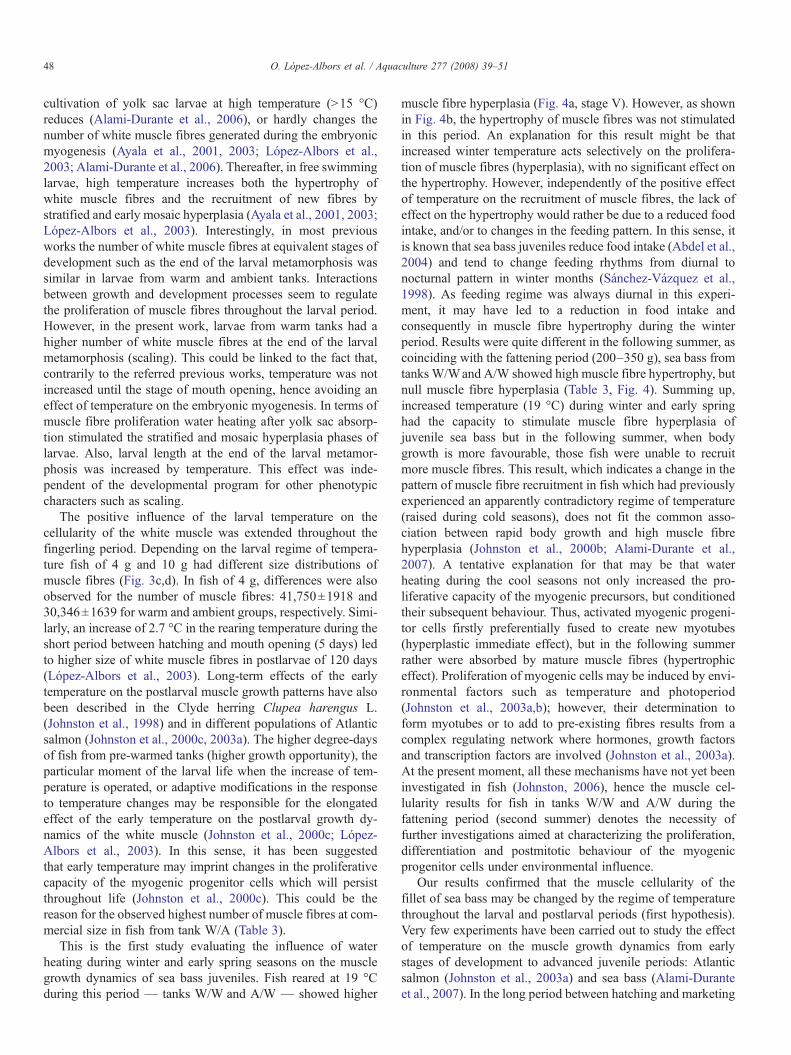
Fig. 4. The rates of muscle fibre hyperplasia a), and muscle fibre hypertrophyb), between successive sample points plotted against age. Values have beenrepresented at the midpoint of the time period over it is calculated: I, hatching-endofmetamorphosis; II, end ofmetamorphosis— 4 g; III, 4–10 g; IV, 10–50g;V,50–200 g; VI, 200–350 g (fattening until commercial size). To simplify notation,in I, II, III and IV, A/A and W/W symbols correspond to the average value fromtanks A/A–A/W and W/W–W/A, respectively.
44 O. López-Albors et al. / Aquaculture 277 (2008) 39–51
according to MSC (1985). Hydroxyproline content was determined spectro-photometrically after acid hydrolysis of the sample (MSC, 1985). Flesh pH wasmeasured with a pH-meter (micro-pH 2000 Crison) after mixing 10 g of com-pound with 50 ml of distilled water.
2.6. Sensory analysis
Sensory analysis was carried out in the day after sampling by a trained panelof 8 judges (3 females and 5 males, of 28–40 years) with previous experience inprofile assessment of different food products. The dorsal half of each left filletwas divided into two portions of approximately 3×3 cm, wrapped in aluminiumfoil and kept in the fridge for 24 h. Samples were then cooked in a steam saucepan for 5 min without any seasoning added. Fillet portions from fish of the fourexperimental tanks were cooked together. A preliminary training session wasaimed to select the profile attributes, to establish the specific cooking and servingconditions, to determine the sample evaluation procedures and to define the scoresheet. A quantitative descriptive analysis method was used and the selectedattributes were: firmness, juiciness, fattiness, chewiness, flavour, odour andcolour. The definition of each of them was taken from the Spanish specificationfor sensory analysis of foods (AENOR, 1997) and literature (Hyldig and Nielsen,2001; Carbonell et al., 2002). According to sampling at commercial size (Table 1)the sensory analysis was carried out in two sessions, and to reduce the panellists'effect an analysis of repeated measurements was done. In each session, the 8judges received four different portions of cooked flesh (one from each experi-mental tank), coded with three digital random numbers. Different code numberswere used for each session. Portions were evaluated for intensity of sensorialattributes from 1 (low intensity) to 5 (high intensity). Training and evaluationsessions were carried out in the morning (11.00–13.00) in a standardized testroom equipped with a round table, 8 individual taste booths, controlledtemperature (24 °C) and cool white light. Judges were instructed not to eat, drinkor smoke for 1 h before sensory evaluation.
2.7. Statistical analysis
Most data were analyzed with the Statistical Package SPSS 11.5 version.The mean and standard error of each group of data were calculated. Experi-mental variables were checked for normality and homogeneous variance usingthe Kolmogorov–Smirnov and the Levene tests, respectively. Analysis ofvariance (ANOVA) was performed to evaluate the effects of temperature onexperimental variables, and a post-hoc study (Tukey test) was used to establishthe mean differences (at least for pb0.05) between experimental groups. Atcommercial size, both ANOVA of muscle parameters using the sex as a fixedeffect, and the Pearson correlation analysis among muscle cellularity, physico-chemical, texture (instrumental) and sensorial parameters were done.
Non-parametric statistical techniques were used to fit smoothed probabilitydensity functions (pdfs) to the measured diameters of white muscle fibres using akernel approach (Johnston et al., 1999). Authors obtained the particular softwarefor this study from I.A. Johnston after request. The programs are written in thePC language R, which is a dialect of Splus. Values for the smoothing parameterh were in the range 0.078 to 0.126 with no systematic differences betweenpopulations. Bootstrap techniques were used to distinguish underlying structurein the distributions from random variation. The Kolmogorov–Smirnov twosample statistical test was used to test the null hypothesis that the probabilitydensity functions of each experimental group were equal over all diameters(PK–S≥0.05). The fifth, tenth, fiftieth, ninety-fifth and ninety-ninth percentilesof muscle fibre diameter were calculated from the distributions. A Kruskal–Wallis non-parametric test was used to test the hypothesis that the average valueof the specified percentile was equivalent between experimental groups.
3. Results
3.1. Development and body growth
Hatching occurred in all experimental tanks at approximately 90 hpostfertilization (59 degree-days). After mouth opening, temperaturewas progressively raised to ≈19 °C in tanks W/W and W/A. Con-sequently, in those tanks larval development was accelerated and the
end of the larval period (scaling) advanced 11 days. Larval length at theend of the metamorphosis was also higher in heated tanks (Table 1).
Body growth of fingerlings (4 and 10 g) and juveniles of 50 gwas more rapid in tanks which had been heated during the larval period(W/WandW/A) (Table 1, Fig. 2a,b, stages I and II). Fish from those tanksshowed both higher specific growth rates (SGR) and thermal growthcoefficient (TGC) than fish reared at ambient temperature (AA and AW).Water heating during cool seasons —winter and early spring — wasnot so relevant for the subsequent fish growth (Fig. 2a,b, stage III),although fish from preheated tanks WW, WA and A/W achieved 200 g,25–38 days earlier than fish always reared at ambient temperature (tankA/A) (Table 1). During the second summer (200 to 350 g, fatteningperiod), fish growth was intense in all tanks but mainly in A/A, whichshowed compensatory growth during this period (Fig. 2a,b, stage IV).Thus, independently of the previous thermal story and the amount ofdegree-days all fish reached the commercial size (350 g, 30 cm) at anapproximate age of 600 days (20.3 months).
3.2. Temperature influence on the muscle growth dynamics
Two regimes of temperature were compared during the larval period(Fig. 1): ambient (A/A and A/W tanks) and warm (W/W and W/A

45O. López-Albors et al. / Aquaculture 277 (2008) 39–51
tanks). Larval heating started after mouth opening, so no differencesbetween experimental tanks were observed for all muscular parametersat hatching (Table 2, Fig. 3a). During the larval period, white musclethickness increased rapidly as a consequence of active hypertrophy ofmuscle fibres and recruitment of new fibres. Muscle fibre recruitmentduring the larval period consisted of successive phases of “stratified”and “mosaic” hyperplasia (Rowlerson and Veggetti, 2001) (Fig. 3b,arrows). In the stratified hyperplasia new white muscle fibres appearedat the dorso-ventral extremities of the myotome and between the redand white muscles. In contrast, in the mosaic hyperplasia phase newmuscle fibres were scattered throughout the entire white muscle. Whitemuscle hyperplasia was highly sensitive to temperature during thelarval period. Thus, the onset of the mosaic hyperplasia phase wasadvanced (Fig. 3b) and the rate of muscle fibre recruitment 44% higherin fish from warm tanks (Fig. 4a, stage I tanks W/W and W/A).Contrarily, the rate of hypertrophy of white muscle fibres was slightlyhigher in larvae from ambient tanks (26%) (Fig. 4b). As a consequenceof larval heating, muscle cellularity at the end of the larval meta-morphosis (scaling) was significantly different in specimens fromwarm and ambient tanks (Table 2, Fig. 3b).
Following the larval period, all postlarvae experienced the sameregime of temperature until the end of the autumn (Fig. 1). In finger-lings of 4 and 10 g, and juveniles of 50 g, muscle growth was alwaysvery intense, but depending on the previous regime of temperature(larval phase) a different muscle growth strategy was observed. Musclegrowth was particularly high in early fingerlings. Thus, to reach 4 g fishfrom pre-warmed tanks (W/W and W/A) showed a very high rate ofmuscle fibre hypertrophy, whereas fish from ambient tanks (A/A andA/W) showed a higher rate of muscle fibre hyperplasia. Consequently,at 4 g the muscle fibre size distributions for ambient and pre-warmedgroups were significantly different (Fig. 3c): the left hand curve in theambient group at this stage denoted a recent period of intense mosaichyperplasia. In fingerlings of 10 g, muscle cellularity differencesbetween ambient and pre-warmed groups were less evident but stillsignificant (Fig. 3d, p=0.019). As demonstrated by percentile valuesof the muscle fibre size distributions, differences occurred for small andmedium size muscle fibres: P5 (23 μm ambient, 19.15 μm pre-warmed, p=0.059),P10 (27.74 μm ambient, 24.06 μm pre-warmed, p= 0.04), and P50 (49.91 μm ambient,
45.27 μm pre-warmed, p= 0.019). Such differences corresponded to a higherrate of muscle fibre hyperplasia in the pre-warmed group (Fig. 4a, stageIII). In contrast, the hypertrophic rate decreased significantly duringthis period in all fish (Fig. 4b). In juveniles of 50 g, no muscle cel-lularity differences were observed (Fig. 3e). Detailed values for the
Table 3Muscle cellularity parameters for fish of 50, 200 and 350 g (mean±SEM)
Stage Muscle parameter A/A
50 g (n=8) TCA 444±14a
Ф 68.24±3.24a
N 108812±5924 a
Đ 246±21 a
200 g (n=10) TCA 841±16a
Ф 71.42±1.43b,c
N 174042±8416a,b
Đ 206.52±8a,b
350 g (n=10) TCA 1259±45a
Ф 75.37±1,45a,b
N 241159±13159a,b
Đ 191.64±8.3a,b
Total cross-sectional area (TCA, mm2), average diameter of muscle fibres (Ф, μm), eDifferent superscripts in values of the same row indicate the existence of significan
muscle parameters of these fish are shown in Table 3. Therefore, theinfluence of the larval regime of temperature on the postlarval musclegrowth dynamics was progressively lost, so that all fish reached 50 gwith a similar muscle cellularity.
From 50–200 g (winter and spring months), tanks A/A and W/Aexperienced the ambient (cool) regime of temperatures, whereastemperature was kept at≈19 °C in tanks W/Wand A/W (Fig. 1). In thisperiod, water heating determined an active recruitment of new musclefibres but no increase in the rate of hypertrophy (Figs. 4a,b, stage V).Consequently, fish from tanks W/W and A/W showed the highestvalues for the total number of muscle fibres, and the lowest averagediameter of muscle fibres at 200 g (Table 3). A comparison of themuscle fibre size distributions for A/A and A/W fish at stage 200 g isshown in Fig. 3f. Both groups exhibited a typical probability densityfunction with two peaks where the muscle fibres included in the lefthand curve are the most recently recruited. Due to water heating, fishfrom tank A/W showed lower values for percentiles P5 (24.78 μm A/A,
20.01 μm A/W, p=0.0001), P10 (29.5 μm A/A, 24.26 μm A/W, p= 0.0001), andP50 (67.12 μm A/A, 60.42 μm A/W, p= 0.035).
In the short period between 200 and 350 g, all fish experienced asimilar and favourable regime of temperatures (second summer).Throughout this period of rapid somatic growth (fattening), fish fromunheated tanks during the previous winter (A/A and W/A) showed avery high rate of white muscle fibre hyperplasia (Fig. 4a, stage VI),which determined the highest muscle fibre numbers at commercial size(350 g) (Table 3).In contrast, in the same period, the rate of whitemuscle fibre recruitment did not increase or was apparently negative infish from winter heated tanks (A/W and W/W, respectively) (Fig. 4a).At commercial size, those fish displayed the lowest number anddensities of white muscle fibres (Table 3), but the highest average fibresize. Comparative muscle fibre size distributions between fish fromtanks A/A and W/W evidenced such differences (Fig. 3g). Frequenciesfor small size fibres were higher in fish from tank A/A, whilefrequencies for medium size and big fibres were higher in fish fromtank W/W: P5 (30.16 μm A/A, 31.24 μm W/W, p= 0.326), P10 (35.64 μm A/A,
37.81 μm W/W, p= 0.105), P50 (71.27 μm A/A, 80.82 μm W/W, p= 0.005),P95 (137.64 μm A/A, 154.38 μmW/W, p=0.001), and P99 (160.44 μm A/A, 178.49 μmW/W,
p=0.002). Therefore, the regime of temperature during the cold seasons(winter and early spring) influenced the following muscle growth strategyin summer, such that water heating during winter months determined animmediate slight positive effect but a long-term negative effect on therecruitment of white muscle fibres. On the other hand, fish from tanks A/Aand W/A also showed different muscle cellularities at commercial size
W/W W/A A/W
410±5 a 378±13 a 425±16 a
73.51±3.02 a 61.58±1.55 a 65.74±2.1 a
89749±8170 a 112881±10350 a 117577±11061 a
217.75±17.2 a 296.3±17.6 a 274±18 a
850±8a 852±15a 871±10a
65.94±0.97a 72.71±0.77c 67.22±1.14a,b
194782±5397b 167654±3726a 192754±7282b
229.39±7.32b 197.03±4.62a 221.03±7.49a,b
1264±20a 1270±43a 1235±23a
83.92±2.57c 71.23±1.64a 77.97±1,84b,c
191523±15619c 268109±11154a 218589±9648b,c
151.95±8.7c 212.19±8.77a 177.9±9.67b,c
stimated number of muscle fibres (N) and density of muscle fibres (Đ, n/mm2).t differences (pb0.05; pAnova for TCA, N and Đ; pKolmogorov–Smirnov for Ф).

Table 4Biometric parameters, body indices, sex percentage of sea bass at commercialsize (350 g) (mean±SEM), number of fish per tank=10
A/A W/W W/A A/W
Fork length (cm) 31.12±0.31 30.96±0.29 31.03±0.3 31.26±0.38Dorsal height (cm) 6.62±0.07 6.66±0.07 6.51±0.04 6.62±0.06K condition 1.4±0.04 1.39±0.035 1.36±0.032 1.39±0.045Anal height (cm) 6.18±0.05 6.22±0.08 6.25±0.06 6.21±0.04Hepatosomatic index 2.01±0.08 1.88±0.09 1.97±0.06 1.89±0.12Visceral fat index 8.1±0.78 8.34±0.49 7.94±0.49 7.78±0.60Digestive tract index 1.35±0.084 1.42±0.050 1.43±0.059 1.31±0.035Gonadosomatic index 0.29±0.032 0.20±0.05 0.21±0.031 0.27±0.042Sex (% males) 10 50 40 30
No statistically significant differences among experimental tanks were obtainedfor all measured parameters (pAnovaN0.05). K condition=100 weight/length3.
Fig. 5. Spider web diagram for scores (1–5) of the sensorial parameters of thefillet. Definition of sensorial parameters was done according to AENOR 1997:firmness (the force required to compress the sample between the molar teeth),juiciness (the total impression of succulence in the mouth just prior toswallowing), fattiness (fatty sensation in the mouth), chewiness (the totalperceived effort required to prepares the sample for swallowing), flavour (theflavour associated with cooked fresh fish), odour (the aromatics associated withcooked fresh fish). No significant differences for all measured parameters werefound (pN0.05).
46 O. López-Albors et al. / Aquaculture 277 (2008) 39–51
(Table 3, Fig. 3h), which suggests the existence of a subtle long-term effectof the larval regime of temperature on the muscle growth dynamics of seabass which reach the commercial size during the early autumn of thesecond year of life.
3.3. Carcass and flesh quality parameters at commercial size
Results for biometric parameters and body indexes are shown inTable 4. No significant differences for any parameter were observedamong experimental tanks. However, sex ratio was influenced by tem-perature as higher percentages of males were found in tanks of heatedwater. Warming during the larval period was most critical for sexdetermination, as the highest percentages of males were found in tanksW/W and W/A.
In Table 5 the chemical composition and textural parameters(instrumental) of the fillet are summarized. Fish from heated tanksduring winter and early spring seasons (W/W and A/W) showed maxi-mum values of moisture and protein content, whereas fish from tankW/Ahad the lowest protein content. The total fat, hydroxyproline and pHwere not influenced by temperature. The total fat range was 5.4–7.33%and hydroxyproline 25.8–35.29 mg/100 g. Concerning the instrumentaltextural parameters, significant differences were found between tanksW/W (maximum value) and A/W (minimum). However, no correlationbetween texture and muscle cellularity parameters was found.
Results for the sensorial attributes of the flesh have beensummarized in a spider web diagram (Fig. 5). No differences amongexperimental tanks were observed. Mean values for all evaluated
Table 5Physicochemical and textural parameters (instrumental) of raw sea bass flesh atcommercial size (mean±SEM), number of fish per tank=10
Chemicalcomposition
A/A W/W W/A A/W
Moisture (%) 67.43±1.42b 72.32±0.49a 70.38±0.41ab 72.40±0.59a
Protein (%) 19.03±0.61ab 20.75±0.37a 18.77±0.33b 19.18±0.57ab
Total fat (%) 7.33±1.35a 5.40±0.87a 6.51±0.97a 6.00±0.88a
Hydroxyproline(mg/100 g)
28.56±4.30a 31.43±3.44a 25.80±3.57a 35.29±3.10a
pH 6.45±0.10a 6.41±0.08a 6.37±0.13a 6.39±0.07a
Textural parametersHardness (kg) 2.31±0.14ab 2.82±0.25a 2.24±0.14ab 2.04±0.11b
Area under thecurve (kg/s)
21.27±2.25ab 32.29±4.19a 23.44±2.41ab 19.66±1.21b
Different superscripts in the same row indicate significant differences (pb0.05).
parameters ranged from 2.8 to 3.7, so none of the tested samplesreceived too low or high punctuations. Positive correlations were ob-served between juiciness and chewiness (r=0.59, pb0.0001), fattinessand juiciness (r=0.36, pb0.01) and fattiness and chewiness (r=0.43,pb0.0001). On the contrary, firmness was negatively correlated withjuiciness (r=−0.331, pb0.01). No correlations were found betweenmuscle cellularity, texture parameters (instrumental) and texture attri-butes (sensorial).
4. Discussion
4.1. Temperature effect on sea bass growth
It has been extensively demonstrated that temperature has anintense effect on fish development and growth (Blaxter, 1988;Fukujara, 1990). In sea bass, high temperature reduces theembryonic period and anticipates the total absorption of theyolk sac, flexion of the notochord, completion of the fin raycounts and scaling (Ayala et al., 2000, 2001; López-Alborset al., 2003; Alami-Durante et al., 2006). Accordingly, in thiswork, larvae from warmed tanks scaled 11 days earlier thanthose reared at ambient temperature. The total length at differentdevelopmental stages of the larval life is also affected bytemperature, but variable results have been found depending onthe stock or the particular regime of temperature: Ayala et al.(2001) no difference, Alami-Durante et al. (2006) shorter larvaein warmed batches, and López-Albors et al. (2003) and thiswork longer larvae in heated tanks.
Postlarval growth of sea bass is also influenced by tem-perature. In this study, sampling of fingerlings and early juveniles(up to 50 g) was advanced in tanks where the larval temperaturehad been increased (Fig. 1, Table 1). This result may be of interestfor hatcheries and nurseries, as it demonstrates that water heatingduring the larval period may be used to advance the obtaining of
47O. López-Albors et al. / Aquaculture 277 (2008) 39–51
fingerlings and early juveniles. Afterwards, however, fish rearedat ambient temperature showed compensatory growth, which wasparticularly active during the fattening period (200–350 g)(Fig. 2a,b, stage IV). Hence, by the end of the experiment(≈600 days) all fish had attained the commercial size. Com-pensatory growth after thermal treatment during early life is com-mon in the sea bass, and also in other teleosts such as the Articcharr Salvelinus alpinus, L. and the Atlantic salmon (Mortensenand Damsgärd, 1993; Maclean and Metcalfe, 2001; Johnstonet al., 2003a). In sea bass, larvae exposed to 13 °C or 17 °C grewslower than at 21 °C, but 300 days after hatching all fish reachedthe same size (Mylonas et al., 2005). Also, larvae reared at lowtemperature (13 °C or 15 °C) showed slower growth than at 20 °C,but compensated for the growth retardation experienced duringearly life at a size of 21 cm length (Alami-Durante et al., 2007).Although the physiological mechanisms that mediate compensa-tory growth are not well understood, behaviour adjustments mustbe involved as higher growth rates require increased food intake(Maclean and Metcalfe, 2001). In Atlantic salmon, differencesin the social status of individuals (dominant versus subordinate)and increased ability of dominants to monopolize the food patchin tanks of compensatory growth was observed (Maclean andMetcalfe, 2001). Sex differences may also be considered toexplain the compensatory growth of the sea bass. Females ofjuvenile sea bass grow faster than males (Carrillo et al., 1995) andhigher proportion of them are commonly obtained in tanks rearedat low temperature during the larval period (Pavlidis et al., 2000).This was also the case of the present study. However, indepen-dently of the proportion of females, values of the gonadosomaticindices were similar in the four experimental tanks (Table 4), andthis probably indicates that sexual maturation was not very activeat commercial size both in males and females. With regard toprevious work in sea bass (Gardeur et al., 2001; Mylonas et al.,2005; Alami-Durante et al., 2007), it is likely that compensatorygrowth in tanks at ambient temperature was not so dependenton the higher number and growth performance of females, butprobably caused by social interactions of dominance, variationin the individual genetic growth potential, or by differences inappetite (Gardeur et al., 2001). In this sense, a higher food intakeof AA fish during the warmest period of growth (summer andearly autumn) is consistentwith their higher SGR andTGCvaluesand the necessity to attain a certain size to tackle any particularbiological target, i.e. the gonads maturation.
4.2. White muscle growth dynamics at ambient temperature
In this work, the growth mechanisms of the white muscle ofsea bass have been described in detail from hatching to anadvanced juvenile stage such as the commercial size (≈350 g,30 cm). Although somehow restricted to the Southern SpanishMediterranean Sea, where the annual regime of temperaturesfluctuates between 14 and 28 °C, our results for fish reared atambient temperature indicate a seasonal influence of theenvironmental temperature on the muscle growth patterns ofthis species. Hatching occurred in middle winter, and most of thelarval period in spring. In agreement with previous works(Scapolo et al., 1988; Ayala et al., 2001; López-Albors et al.,
2003; Alami-Durante et al., 2006), muscle growth during thelarval period was a consequence of continuous hypertrophy andactive recruitment of new fibres (successive stratified and mosaichyperplasia phases). In early summer, which approximatelycoincided with the beginning of the fingerling period, very highrates of white muscle fibre hyperplasia and hypertrophy wereobserved (Fig. 4a,b, stage II). This finding was also observed inprevious works (Nathanailides et al., 1996; López-Albors et al.,2003; Alami-Durante et al., 2007) as it corresponds to a veryactive phase of mitotic activity and protein accretion favoured bymaximum food availability. Thereafter, postlarval muscle growthdynamics described different tendencies for muscle fibre hyper-plasia and hypertrophy.
Concerning the muscle hyperplasia, an influence by seasonand growth rate was observed (Fig. 4a): it decreased significantlyin winter and spring seasons, but recovered and rose to a maxi-mum during the second summer and following early autumn ofpostlarval life. Interestingly, this period of maximum hyperplasiawas coincident with maximum values of SGR and TGC in tankAA (Fig. 2a,b, stage IV), and associated to the rapid growth periodthat enables sea bass to reach the commercial size (fattening).These results agree with those of Alami-Durante et al. (2007),who recently demonstrated that rapid postlarval growth of seabass is highly influenced by season and linked to white musclehyperplasia. Sex may also influence the recruitment of whitemuscle fibres. In the Atlantic halibut (Hippoglossus hippoglos-sus), even prior to sexual maturation and any evidence of di-morphism in body size the number of white muscle fibres washigher in females than in males (Hagen et al., 2006). Our results,however, do not deal with this study, as the ANOVA for thenumber of white muscle fibres at commercial size was similarin both sexes: 227,179±9968 in males and 228,021±8486 infemales (p=0.778).
Contrarily to muscle hyperplasia, the postlarval hypertrophyof white muscle fibres decreased significantly by the end of theformer summer, and persisted at a steady low level, independentlyof season, until the end of the experiment (Fig. 4b). Hypertrophyof white muscle fibres prior to commercial size was also unaf-fected by the sex. The size of the fibres was 77.87±1.53 μm formales and 77.15±1.33 μm for females at 350 g (p=0.921). Asimple explanation for this result is that restrictions to increase insize are higher for large than for small diameter fibres, as largefibres have lower surface to volume ratio they also have lowercapacity to assimilate nutrients (Weatherley et al., 1988). On theother hand, our results do not support the finding reported byAlami-Durante et al. (2007) of a shrinkage of the largest whitemuscle fibres during winter months. Actually, the P95 and P99percentiles were always significantly lower in fish of 50 than200 g: P95 109 μm and P99 126.9 μm at 50 g, versus P95137.5 μm and P99 161.4 μm at 200 g.
4.3. Temperature influence on the patterns of white musclegrowth
Manipulation of temperature during early stages of devel-opment has important effects on the cellularity of the myotomesof sea bass embryos and larvae. Incubation of embryos and
48 O. López-Albors et al. / Aquaculture 277 (2008) 39–51
cultivation of yolk sac larvae at high temperature (N15 °C)reduces (Alami-Durante et al., 2006), or hardly changes thenumber of white muscle fibres generated during the embryonicmyogenesis (Ayala et al., 2001, 2003; López-Albors et al.,2003; Alami-Durante et al., 2006). Thereafter, in free swimminglarvae, high temperature increases both the hypertrophy ofwhite muscle fibres and the recruitment of new fibres bystratified and early mosaic hyperplasia (Ayala et al., 2001, 2003;López-Albors et al., 2003). Interestingly, in most previousworks the number of white muscle fibres at equivalent stages ofdevelopment such as the end of the larval metamorphosis wassimilar in larvae from warm and ambient tanks. Interactionsbetween growth and development processes seem to regulatethe proliferation of muscle fibres throughout the larval period.However, in the present work, larvae from warm tanks had ahigher number of white muscle fibres at the end of the larvalmetamorphosis (scaling). This could be linked to the fact that,contrarily to the referred previous works, temperature was notincreased until the stage of mouth opening, hence avoiding aneffect of temperature on the embryonic myogenesis. In terms ofmuscle fibre proliferation water heating after yolk sac absorp-tion stimulated the stratified and mosaic hyperplasia phases oflarvae. Also, larval length at the end of the larval metamor-phosis was increased by temperature. This effect was inde-pendent of the developmental program for other phenotypiccharacters such as scaling.
The positive influence of the larval temperature on thecellularity of the white muscle was extended throughout thefingerling period. Depending on the larval regime of tempera-ture fish of 4 g and 10 g had different size distributions ofmuscle fibres (Fig. 3c,d). In fish of 4 g, differences were alsoobserved for the number of muscle fibres: 41,750±1918 and30,346±1639 for warm and ambient groups, respectively. Simi-larly, an increase of 2.7 °C in the rearing temperature during theshort period between hatching and mouth opening (5 days) ledto higher size of white muscle fibres in postlarvae of 120 days(López-Albors et al., 2003). Long-term effects of the earlytemperature on the postlarval muscle growth patterns have alsobeen described in the Clyde herring Clupea harengus L.(Johnston et al., 1998) and in different populations of Atlanticsalmon (Johnston et al., 2000c, 2003a). The higher degree-daysof fish from pre-warmed tanks (higher growth opportunity), theparticular moment of the larval life when the increase of tem-perature is operated, or adaptive modifications in the responseto temperature changes may be responsible for the elongatedeffect of the early temperature on the postlarval growth dy-namics of the white muscle (Johnston et al., 2000c; López-Albors et al., 2003). In this sense, it has been suggestedthat early temperature may imprint changes in the proliferativecapacity of the myogenic progenitor cells which will persistthroughout life (Johnston et al., 2000c). This could be thereason for the observed highest number of muscle fibres at com-mercial size in fish from tank W/A (Table 3).
This is the first study evaluating the influence of waterheating during winter and early spring seasons on the musclegrowth dynamics of sea bass juveniles. Fish reared at 19 °Cduring this period — tanks W/W and A/W — showed higher
muscle fibre hyperplasia (Fig. 4a, stage V). However, as shownin Fig. 4b, the hypertrophy of muscle fibres was not stimulatedin this period. An explanation for this result might be thatincreased winter temperature acts selectively on the prolifera-tion of muscle fibres (hyperplasia), with no significant effect onthe hypertrophy. However, independently of the positive effectof temperature on the recruitment of muscle fibres, the lack ofeffect on the hypertrophy would rather be due to a reduced foodintake, and/or to changes in the feeding pattern. In this sense, itis known that sea bass juveniles reduce food intake (Abdel et al.,2004) and tend to change feeding rhythms from diurnal tonocturnal pattern in winter months (Sánchez-Vázquez et al.,1998). As feeding regime was always diurnal in this experi-ment, it may have led to a reduction in food intake andconsequently in muscle fibre hypertrophy during the winterperiod. Results were quite different in the following summer, ascoinciding with the fattening period (200–350 g), sea bass fromtanks W/Wand A/W showed high muscle fibre hypertrophy, butnull muscle fibre hyperplasia (Table 3, Fig. 4). Summing up,increased temperature (19 °C) during winter and early springhad the capacity to stimulate muscle fibre hyperplasia ofjuvenile sea bass but in the following summer, when bodygrowth is more favourable, those fish were unable to recruitmore muscle fibres. This result, which indicates a change in thepattern of muscle fibre recruitment in fish which had previouslyexperienced an apparently contradictory regime of temperature(raised during cold seasons), does not fit the common asso-ciation between rapid body growth and high muscle fibrehyperplasia (Johnston et al., 2000b; Alami-Durante et al.,2007). A tentative explanation for that may be that waterheating during the cool seasons not only increased the pro-liferative capacity of the myogenic precursors, but conditionedtheir subsequent behaviour. Thus, activated myogenic progeni-tor cells firstly preferentially fused to create new myotubes(hyperplastic immediate effect), but in the following summerrather were absorbed by mature muscle fibres (hypertrophiceffect). Proliferation of myogenic cells may be induced by envi-ronmental factors such as temperature and photoperiod(Johnston et al., 2003a,b); however, their determination toform myotubes or to add to pre-existing fibres results from acomplex regulating network where hormones, growth factorsand transcription factors are involved (Johnston et al., 2003a).At the present moment, all these mechanisms have not yet beeninvestigated in fish (Johnston, 2006), hence the muscle cel-lularity results for fish in tanks W/W and A/W during thefattening period (second summer) denotes the necessity offurther investigations aimed at characterizing the proliferation,differentiation and postmitotic behaviour of the myogenicprogenitor cells under environmental influence.
Our results confirmed that the muscle cellularity of thefillet of sea bass may be changed by the regime of temperaturethroughout the larval and postlarval periods (first hypothesis).Very few experiments have been carried out to study the effectof temperature on the muscle growth dynamics from earlystages of development to advanced juvenile periods: Atlanticsalmon (Johnston et al., 2003a) and sea bass (Alami-Duranteet al., 2007). In the long period between hatching and marketing
49O. López-Albors et al. / Aquaculture 277 (2008) 39–51
many environmental as well as intrinsic factors influencemuscle growth. As it has been found in this work, plasticity ofmyogenesis under environmental influence is not onlydescribed in larvae but in juveniles and adult fish (Johnston,2006). Concerning the temperature effect on the myogenicplasticity, the choice of a fluctuant or constant regime of tem-peratures (Stoiber et al., 2002), the time and duration of thetemperature changes (López-Albors et al., 2003), differences inthe sensitivity of the fibre hyperplasia to temperature changes(Johnston et al., 1998) and interactions between temperatureand mechanisms regulating muscle growth and other physio-logical processes such as sexual maturation (Johnston et al.,2006; Alami-Durante et al., 2007, this work) may result indifferent muscle growth patterns and diverse muscle phenotypesin fish delivered for the market.
4.4. Implications of the rearing temperature on the flesh quality
Temperature only influenced three parameters of the flesh:moisture, protein and hardness. The protein content tends to bevery constant in fish; however, it can be slightly modified byrearing conditions and lifestyle (Haard, 1992; Periago et al.,2005). In the present work, protein content was significantlyhigher in sea bass from tank W/W, which could be related to thefact that these fish showed the highest rate of hypertrophy ofmuscle fibres during the fattening period (Table 3, Fig. 4), and itis known that muscle fibre hypertrophy requires very activeprotein synthesis. Total fat content did not show significantdifferences among the four tanks, which was probably causedby the high variability observed in fish from tank A/A (Table 5).
Texture parameters (instrumental) were different among theexperimental tanks (Table 5). Both the hardness to compress theflesh and the area under the curve were maximum in sea bassharvested from tank W/W, and minimum in tank A/W. Also, nocorrelation between muscle fibre size and texture parameters wasfound, as the density of muscle fibres was similar in these twogroups (Table 3). On the contrary, when differences inmuscle fibresize were significant, similar texture was measured. These resultsdisagree with our previous findings in sea bass where instrumentalattributes of texture correlated with the density of fibres, collagencontent and final pH (Periago et al., 2005). In that case, wild andfarmed populations of sea bass were compared, and more than40% of the variation in chewiness and springiness was explainedby the density of muscle fibres. Although muscle fibre size playsan important role in texture of raw flesh (Johnston et al., 2000a),other factors could be responsible for the textural differencesobserved in the present study. Collagen content, measured as totalcollagen, hydroxyproline concentration, or alkaline-soluble orinsoluble fractions have also been correlated with texture of rawflesh (Periago et al., 2005, Johnston et al., 2006). However, nodifferences in hydroxyproline concentration were found amongour experimental groups, which was probably due to highinterindividual variation within groups. Other factors influencingtexture are processing and storage conditions of the fillets (Haard,1992), season and body size (Bjørnevik et al., 2004), and also theinstrumental methodology (Taylor et al., 2002). In salmon fillets,postmortem changes in texture varied depending on the orientation
of the muscle fibres, such that if the blade was perpendicularlyorientated to the fibres postmortem changes in texture wereestimated more accurately than if it ran in parallel to the fibres(Taylor et al., 2002). In raw beef, Swatland (1978) found thatdeformation in parallel to the fibres does not involve the musclefibres but connective tissue breaks. Thus, measuring in parallel tothe fibres is a rough estimator of fish flesh texture (Taylor et al.,2002). As we performed the shear test in parallel to the fibres, thismethodological factor most probably conditioned texture instru-mental results and hence the lack of correlation between textureand muscle cellularity parameters.
Panellists did not find significant differences betweenexperimental groups for all the sensorial attributes of the fillet.As it was expected, odour, flavour and colour did not varybetween groups because the rearing conditions that can modifythem (feed and water quality) were always the same. Concerningtexture, inter-correlation of some parameters was observed.Juiciness, chewiness and fattiness showed positive inter-correla-tion, whereas juiciness and firmness were negatively correlated.The observed correlations are easy to explain because high lipidcontent confers a juicy and fatty mouth feel, and low lipid contentis rather related to firmness and grittiness (Nielsen et al., 2005).On the other hand, juiciness and firmness are conceptually oppo-site parameters. Thus, our results are consistent with the commonsensory analysis of texture and can be partly explained by twomain factors: first, the perception of one parameter will typicallyinfluence the perception of another (Christensen, 1984); second,many sensorial attributes are determined by the same underlyingphysical (muscle structure) or chemical factor (lipid, protein andmoisture content) (Szczesniak, 1963).
One of the aims of this work was to test the hypothesis thatmuscle cellularity differences of sea bass fillets induced by rearingtemperature, can modify the sensorial properties of cooked flesh.Muscle cellularity differences were found, but no correlationbetween muscle cellularity and sensorial parameters of texturewas established after sensory analysis. According to Hatae et al.(1990) the main factors determining texture of cooked flesh arethe presence of coagulated material in the interstitial spaces andthe size of the muscle fibres. The interstitial material obstructs orimpedes the movements of the fibres during mastication andresults from thermal coagulation of sarcoplasmic andmyofibrillarproteins (Ayala et al., 2005). Quantification of interstitialcoagulated material was not done in this study, so its influenceon the sensorial attributes of texture remains unknown. On theother hand, our results disagrees with those of Hatae et al. (1990)and Hurling et al. (1996), who found a negative correlationbetween muscle fibre size and texture of cooked flesh. In thosestudies, species with a wide range of differences in the size ofmuscle fibres were compared, hence allowing a sufficient degreeof variation for the analysis of correlation. Similarly to us, Hurlinget al. (1996) performed morphometry of the cross-section of thefibres and also sensory analysis of the flesh after cooking. Theaverage diameters they compared ranged from 53 to 163 μm(Sword fish Xiphiidae and Common dab Limanda limanda,respectively), but correlation was only found when the averagediameter of the fibres differed by at least 60 μm. In this work, theregimes of temperature determined a shorter range of differences
50 O. López-Albors et al. / Aquaculture 277 (2008) 39–51
in the size of muscle fibres between the four experimental tanks:lower than 13μm. This rangewas probably not wide enough to bedetected by panellists.
5. Conclusion
It is demonstrated that slight increases of temperature during thelarval period and/or winter months have the capacity to modify therates of hyperplasia and hypertrophy of white muscle fibres, suchthat depending on the previous thermal regime there were sig-nificant differences in the muscle cellularity of the fillet at com-mercial size. Such differences, however, had a limited influence onthe physicochemical properties of the fillet and no effect on itssensorial attributes. These results together with the fact that all fishreached the commercial size at the same timeminimized the impactof the rearing temperature on the yield and quality of sea bass.
Acknowledgements
This work was funded by the Ministerio de Ciencia yTecnología (Project Ref. AGL2000-1738-C03-02). Authors aregrateful to M. Moya for informatics assistance.
References
AENOR, SpanishAssociation for Standardisation andCertification, 1997.Análisissensorial. Asociación Española de Normalización (Ed.). Madrid. 253 pp.
Akbulut, B., Sahin, T., 1999. Effect of weight loss occurring in winter season ongrowth of sea bass (Dicentrarchus labrax) reared in the Black Sea. Turk. J.Mar. Sci. 5 (1), 39–46.
Abdel, I., López Albors, O., Abellán, E., García-Alcázar, A., 2004. The effect ofthe temperature regimes on feed response and growth performance duringwinter months in sea bass (Dicentrarchus labrax, L.). Spec. Publ. - Eur.Aquac. Soc. n° 34, 91–92.
Alami-Durante, H., Rouel, M., Kentouri, M., 2006. New insights intotemperature-induced white muscle growth plasticity during Dicentrarchuslabrax early life: a developmental and allometric study. Mar. Biol. 149 (6),1551–1565.
Alami-Durante, H., Nellie, O., Rouel,M., 2007. Early thermal history significantlyaffects the seasonal hyperplastic process occurring in the myotomal whitemuscle of Dicentrarchus labrax juveniles. Cell Tissue Res. 327 (3), 553–570.
Ayala, M.D., López-Albors, O., Gil, F., Latorre, R., Vázquez, J.M., García-Alcázar, A., Abellán, E., Ramírez, G., Moreno, F., 2000. Temperature effecton muscle growth of the axial musculature of the Sea Bass (Dicentrarchuslabrax L.). Anat. Histol. Embryol. 29, 235–241.
Ayala, M.D., López-Albors, O., Gil, F., García-Alcázar, A., Abellán, E.,Alarcón, J.A., Álvarez, M.C., Ramírez-Zarzosa, G., Moreno, F., 2001.Temperature effects on muscle growth in two populations (Atlantic andMediterranean) of sea bass. Aquaculture 202, 359–370.
Ayala, M.D., López-Albors, O., García-Alcázar, A., Abellán, E., Latorre, R.,Vázquez, J.Ma., Ramírez-Zarzosa, G., Gil, F., 2003. Effect of two thermalregimes on the muscle growth dynamics of sea bass larvae, Dicentrarchuslabrax L. Anat. Histol. Embryol. 32, 271–275.
Ayala, Ma.D., López-Albors, O., Blanco, A., García-Alcázar, A., Abellán, E.,Ramírez-Zarzosa, G., Gil, F., 2005. Structural and ultrastructural changes onmuscle tissue of sea bass, Dicentrarchus labrax L., after cooking andfreezing. Aquaculture 250 (1–2), 215–231.
Barroso, M., Careche, M., Borderias, A.J., 1998. Quality control of frozen fishusing rheological techniques. Trends Food Sci. Technol. 9, 223–229.
Bjørnevik, M., Espe, M., Beattie, C., Nortvedt, R., Kiessling, A., 2004.Temporal variation in muscle fibre area, gaping, texture, colour and collagenin triploid and diploid Atlantic salmon (Salmo salar L). J. Sci. Food Agric.84, 530–540.
Blaxter, J.H.S., 1988. Pattern and variety in development. In: Hoar, W.S., Randall,D.J. (Eds.), Fish Physiology, vol. XI. Academic Press, San Diego, pp. 1–58.
Carbonell, I., Izquierdo, L., Costell, E., 2002. Sensory profiling of cookedgilthead sea bream (Sparus aurata): sensory evaluation procedures andpanel training. Food Sci. Technol. Int. 8 (3), 169–177.
Carrillo, M., Zanuy, S., Prat, F., Cerda, J., Ramos, J., Mananos, E., Bromage, N.,1995. Sea bass (Dicentrarchus labrax). In: Bromage, N.R., Roberts, R.J.,(Eds.), 1995. Broodstock Management and Egg and Larval Quality,Blackwell, Cambridge, pp. 138–168.
Christensen, C.M., 1984. Food texture perception. Adv. Food Res. 29, 159–199.de Asis, J.M.F., Carvalho, R.F., Barbosa, L., Agostinho, C.A., Pai-Silva, M.D.,
2004. Effects of incubation temperature on muscle morphology and growthin the pacu (Piaractus mesopotamicus). Aquaculture 237, 251–267.
Fukujara, O., 1990. Effects of temperature on yolk utilization, initial growth, andbehaviour of unfed marine fish-larvae. Mar. Biol. 106, 169–174.
Galloway, T.F., Kjørsvik, E., Kryvi, H., 1998. Effect of temperature on viabilityand axial muscle development in embryos and yolk sac larvae of theNortheast Arctic cod (Gadus morhua). Mar. Biol. 132, 559–567.
Gardeur, J.N., Lemarié, G., Coves, D., Boujard, T., 2001. Typology ofindividual growth in sea bass (Dicentrarchus labrax). Aquat. Living Resour.14, 223–231.
Gibson, S., Johnston, I.A., 1995. Temperature and development in larvae of theturbot Scophthalmus maximus. Mar. Biol. 124 (1), 17–25.
Haard, N.F., 1992. Control of chemical composition and food quality attributesof cultured fish. Food Res. Int. 112, 321–332.
Hatae, K., Yoshimatsu, F., Matsumoto, J.J., 1990. Role of muscle fibres incontributing firmness of cooked fish. J. Food Sci. 55, 693–696.
Hagen, O., Solberg, Ch., Johnston, I.A., 2006. Sexual dimorphism of fastmuscle fibre recruitment in farmed Atlantic halibut (Hippoglossushippoglossus, L.). Aquaculture 261, 1222–1229.
Hyldig, G., Nielsen, D., 2001. A review of sensory and instrumental methodsused to evaluate the texture of fish muscle. J. Texture Stud. 32, 219–242.
Hurling, R., Rodell, J.B., Hunt, H.D., 1996. Fibre diameter and fish texture.J. Textural Stud. 27, 679–685.
Johnston, I.A., 1999. Muscle development and growth: potential implicationsfor flesh quality in fish. Aquaculture 177, 99–115.
Johnston, I.A., 2006. Environment and plasticity of myogenesis in teleost fish.J. Exp. Biol. 209, 2249–2264.
Johnston, I.A., Hall, T.E., 2004. Mechanisms of muscle development and responsesto temperature change in fish larvae. In: Govoni, J.J. (Ed.), The development ofform and function in fishes and the question of larval adaptation, pp. 113–144.
Johnston, I.A., Cole, N.J., Abercromby, M., Vieira, V.L., 1998. Embryonictemperature modulates muscle growth characteristics in larval and juvenileherring. J. Exp. Biol. 201, 623–646.
Johnston, I.A., Strugnell, G., McCracken, M.L., Johnstone, R., 1999. Musclegrowth and development in normal-sex-ratio and all-female diploid andtriploid Atlantic salmon. J. Exp. Biol. 202, 1991–2016.
Johnston, I.A., Alderson, R., Sandham, C., Dingwall, A., Mitchell, D., Selkirk,C., Nickell, D., Baker, R., Robertson, B., Whyte, D., Springate, J., 2000a.Muscle fibre density in relation to the colour and texture of smoked Atlanticsalmon (Salmo salar L.). Aquaculture 189, 335–349.
Johnston, I.A., Alderson, D., Sandeham, C., Mitchell, D., Selkirk, C., Dingwall,A., Nickell, D.C., Baker, R., Robertson, W., Whyte, D., Springate, J., 2000b.Patterns of muscle growth in early and late maturing populations of Atlanticsalmon (Salmo salar L.). Aquaculture 189, 307–333.
Johnston, I.A., Mclay, H.A., Abercromby,M., Robbins, D., 2000c. Early thermalexperience has different effects on growth and muscle fibre in spring- andautumn-running Atlantic salmon population. J. Exp. Biol. 203, 2553–2564.
Johnston, I.A., Manthri, S., Alderson, R., Smart, A., Campbell, P., Nickell, D.,Robertson, B., Paxton, Ch.G.M., Burt, M.L., 2003a. Freshwater environ-ment affects growth rate and muscle fibre recruitment in seawater stages ofAtlantic salmon (Salmo salar L.). J. Exp. Biol. 206, 1337–1351.
Johnston, I.A., Manthri, S., Smart, A., Campbell, P., Nickell, D., Alderson, R.,2003b. Plasticity of muscle fibre number in seawater stages of Atlantic salmonin response to photoperiod manipulation. J. Exp. Biol. 206, 3425–3435.
Johnston, I.A., Li, X., Vieira, V.L.A., Nickell, D., Dingwall, A., Alderson, R.,Campbell, P., Bickerdike, R., 2006. Muscle and flesh quality traits in wildand farmed Atlantic salmon. Aquaculture 256, 323–336.
51O. López-Albors et al. / Aquaculture 277 (2008) 39–51
Killeen, J.R., McLay, A., Johnston, I.A., 1999. Temperature and neuromusculardevelopment in embryos of the trout (Salmo trutta L.). Comp. Biochem.Physiol., A 122, 53–64.
López-Albors, O., Ayala, M.D., Gil, F., García-Alcázar, A., Abellán, E., Latorre,R., Ramírez-Zarzosa, G., Vázquez, J.Ma., 2003. Early temperature effects onmuscle growth dynamics and histochemical profile of muscle fibres of sea bassDicentrarchus labrax L., during larval and juvenile stages. Aquaculture 220,385–406.
Love, R.M., 1983. Texture and the fragility of fish muscle cells. Research at theTorry Research Station. J. Texture Stud. 5, 351–358.
Maclean, A.,Metcalfe, N.B., 2001. Social status, access to food, and compensatorygrowth in juvenile Atlantic salmon. J. Fish Biol. 58, 1331–1346.
Moretti, A., Padini Fernandez-Criado, M.P., Cittolin, G., Guidastri, R., 1999.Manual on Hatchery Production os Seabass and Gilthead Sea Bream. vol. 1.FAO, Rome. 194pp.
Mortensen, A., Damsgard, B., 1993. Compensatory growth and weightsegregation following light and temperature manipulation of juvenileAtlantic salmon (Salmo salar L.) and Arctic charr (Salvelinus alpinus L.).Aquaculture 114, 261–272.
Mylonas, C.C., Anezaki, L., Divanach, P., Zanuy, S., Piferrer, F., Ron, B.,Peduel, A., Ben Atia, I., Gorshkov, S., Tandler, A., 2005. Influence ofrearing temperature the larval and nursery periods on growth and sexdifferentiation in two Mediterranean strains of Dicentrarchus labrax. J. FishBiol. 67, 652–668.
MSC. Ministerio de Sanidad y Consumo, 1985. Análisis de Alimentos. MétodosOficiales y recomendados por el Centro de Investigación y Control de laCalidad, Ministerio de Sanidad y Consumo (Ed.). Madrid. 1015 pp.
Nathanailides, C., López-Albors, O., Stickland, N.C., 1995. Influence of prehatchtemperature on the development of muscle cellularity in posthatch Atlantic-Salmon (Salmo salar, L.). Can. J. Fish. Aquatic Sci. 52 (4), 675–680.
Nathanailides, C., López-Albors, O., Abellán, E., Vázquez, J.M., Tyler, D.D.,Rowlerson, A., Stickland, N.C., 1996. Muscle cellularity in relation to somaticgrowth in the European sea bass Dicentrarchus labrax (L.). Aquac. Res. 27,885–889.
Nielsen, D., Hyldig, G., Nielsen, J., Nielsen, H.H., 2005. Liquid holdingcapacity and instrumental and sensory texture properties of herring (Cupleaharengus, L.) related to biological and chemical parameters. J. Texture Stud.36, 119–138.
Nordgarden, U., Oppedal, F., Taranger, G.L., Hemre, G.I., Hansen, T., 2003.Seasonally changing metabolism in Atlantic salmon (Salmo salar L.) I —growth and feed conversion ration. Aquac. Nutr. 9, 287–293.
Pavlidis, M., Koumoundouros, G., Sterioti, A., Somarakis, S., Divanach, P.,Kentouri, M., 2000. Evidence of temperature-dependent sex determination inthe European sea bass (Dicentrarchus labrax L.). J. Exp. Zool. 287, 225–232.
Periago, M.J., Ayala, M.D., López-Albors, O., Abdel, I., Martínez, C., García-Alcázar, A., Ros, G., Gil, F., 2005.Muscle cellularity and flesh quality of wildand farmed sea bass Dicentrarchus labrax L. Aquaculture 249, 175–188.
Rowlerson, A., Veggetti, A., 2001. Cellular mechanisms of post-embryonicmuscle growth in aquaculture species. In: Johnston, I.A. (Ed.), Muscledevelopment and growth. Fish Physiology Series, vol. 18. Academic Press,London, pp. 103–141.
Sánchez-Vázquez, F.J., Azzaydi, M., Martínez, F.J., Zamora, S., Madrid, J.A.,1998. Annual rhythms of demand feeding activity in sea bass: evidence of aseasonal phase inversion of the dial feeding pattern. Chronobiol. Int. 15,607–622.
Scapolo, P.A., Veggetti, A., Mascarello, F., Romanello, M.G., 1988. Develop-mental transitions of myosin isoforms and organisation of the lateral musclein the teleost Dicentrarchus labrax (L.). Anat. Embryol. 178, 287–295.
Stickland, N.C., White, R.N., Mescall, P.E., Crook, A.R., Thorpe, J.E., 1988.The effect of temperature on myogenesis in embryonic development of theAtlantic salmon (Salmo salar L). Anat. Embryol. 178, 253–257.
Stoiber,W., Haslett, J.R.,Wenk, R., Steinbacher, P., Gollmann, H.-P., Sänger, A.M.,2002. Cellularity changes in developing red and white fish muscle at differenttemperatures: simulating natural environmental conditions for a temperatefreshwater cyprinid. J. Exp. Biol. 205, 2349–2364.
Swatland, H.J., 1978. Microstruture of cuts through the connective tissueframework of meat. J. Inst. Can. Sci. Technol. Aliment 11, 204–208.
Szczesniak, A.S., 1963. Classification of textural characteristics. J. Food Sci. 28,385–389.
Taylor, R.G., Fjaera, S.O., Skjervold, P.O., 2002. Salmon fillet texture isdetermined by myofiber–myofiber and myofiber–myocommata attachment.J. Food. Sci. 67 (6), 2067–2071.
Weatherley, A.H., Gill, H.S., Lobo, A.F., 1988. Recruitment and maximaldiameter of axial muscle fibres in teleosts and their relationship to somaticgrowth and ultimate size. J. Fish Biol. 33, 851–859.
Wilkes, D., Xie, S.Q., Stickland, N.C., Alami-Durante, H., Kentouri, M.,Sterioti, A., Koumoundouros, G., Fauconneau, B., Goldspink, G., 2001.Temperature and myogenic factor transcript levels during early developmentdetermines muscle growth potential in rainbow trout (Oncorhynchus mykiss)and sea bass (Dicentrarchus labrax). J. Exp. Biol. 204, 2763–2771.