telenor – second quarter 2009 · telenor – second quarter 2009 ... and ed cing the n mbe of...
TRANSCRIPT

Telenor – Second Quarter 2009
DisclaimerThe following presentation is being made only to, and is only directed at, persons to whom such presentation may lawfully be communicated (’relevant persons’). Any person who is not a relevant person should not act or rely on this presentation or any of its contents. Information in the following presentation relating to the price at which relevant investments have been bought or sold in the past or the yield on such investments cannot be relied upon as a guide to the future performance of such investments. This presentation does not constitute an offering of securities or otherwise constitute an invitation or inducement to any person to underwrite, subscribe for or otherwise acquire securities in any company within the Telenor Group. The release, publication or distribution of this presentation in certain jurisdictions may be restricted by law, and therefore persons in such jurisdictions into which this presentation is released, published or distributed should inform themselves about, and observe, such restrictions. This presentation contains statements regarding the future in connection with Telenor’s growth initiatives, profit figures, outlook, strategies and objectives. In particular, the section ‘Outlook for 2009’ contains forward looking statements regarding the Telenor Group’s expectations All statements regarding the section Outlook for 2009 contains forward-looking statements regarding the Telenor Group s expectations. All statements regarding the future are subject to inherent risks and uncertainties, and many factors can lead to actual profits and developments deviating substantially from what has been expressed or implied in such statements.
As a consequence of Alfa Group’s previous collusive litigation in Ukraine and boycott of Kyivstar’s board and shareholder meetings in defiance of an international arbitration award and two court orders, Telenor has been unable to consolidate Kyivstar’s financial results since 29 December 2006.
Kyivstar was deconsolidated, due to injunctions in Ukraine prohibiting Kyivstar’s management from providing financial information to Kyivstar’s external auditors and its shareholders, including Telenor. In response to the termination of the last of the three injunctions by a Ukrainian court on 23 November 2007 Kyivstar was included in the line associated companies. After the termination of the injunctions, Kyivstar provided Telenor with unaudited financial information until audited financial information was received as described below.
To restore corporate governance in Kyivstar, Telenor filed on 23 January 2008 a contempt motion with the federal court in New York against Storm LLC, its two direct shareholders Alpren Ltd. and Hardlake Ltd., and Altimo Holdings & Investments Ltd. The court ruled on 19 November 2008, finding for Telenor on all accounts and ordering Storm to take all steps necessary to restore corporate governance in Kyivstar.
On 16 December 2008 the shareholders met at two Extraordinary General Meetings of Shareholders (EGMS) to bring the charter incompliance with Ukrainian law. Furthermore the EGMSs elected a new company Board, appointed the Auditing Commission and declareddividends for the years 2004 and 2005. The company board met and elected Ernst & Young as the company’s external auditor. On 1 June 2009 the EGMS approved the audited Financial Statements for 2006 and 2007 and declared dividends. The audit of the 2008 accounts will be finalised in the third quarter 2009. There is a possibility that when external auditors have completed the audit of Kyivstar's financial statements, discrepancies may emerge between the unaudited financial information for 2008 that has been provided by Kyivstar and the final audited financial statements.
On 13 March 2009 Telenor initiated arbitration against Storm and Alfa entities under the Kyivstar shareholder agreement with a claim for compensation for losses occurred as a consequence of the Storm/Alfa boycott of corporate governance in Kyivstar since 2005.

Jon Fredrik BaksaasPresident and CEO
Revenues (NOKm) and EBITDA %
27 058 26 923
Q2 2009
Commitment to priorities remains firm
Market development in line with
34,6 % 34,7 %
Q2 08 Q2 09
9 362 9 332
EBITDA CAPEX
EBITDA and capex (NOKm)
• Market development in line with trends from previous quarters
• Challenging top line balanced by cost and capex control
• Stable margin and solid cash flow
• Preparing for service launch in India
6 386
3 249
Q2 08 Q2 09
All figures including Kyivstar
EBITDA and EBITDA margin before other items

Revenues (NOKm)/EBITDA%
3 3563 656 3 639
Q2 2009 – Nordic
Steady improvement in operating cash flow
Continued strong performance in 3 208 3 356
36 % 40 %
Q2 08 Q2 09
36 % 36 %
Q2 08 Q2 09
2 392 2 2781 862 1 981
Mobile Norway Fixed Norway
- 3%+ 4%
- 1% - 5%
• Continued strong performance in Norway
• Passed 500k Nordic mobile broadband subscribers
• Successful rebranding in Denmark
• Strict capex prioritisation in all operations
• Operating cash flow showing steady improvement on a 4Q rolling basis
19 % 18 %
Q2 08 Q2 09
22 % 23 %
Q2 08 Q2 09Sweden Denmark
Organic revenue growth YoY
Q2 2009
Implementing efficiency measures in Sweden
• Downsizing the organisation by up to 400 employees and ed cing the n mbe of cons ltantsand reducing the number of consultants
• Improving efficiency and precision in market spend towards high-quality customers
• Aligning capex and market spend with market development
• Optimising infrastructure across technologies and spectrum
3 349
Revenues (NOKm)/EBITDA%
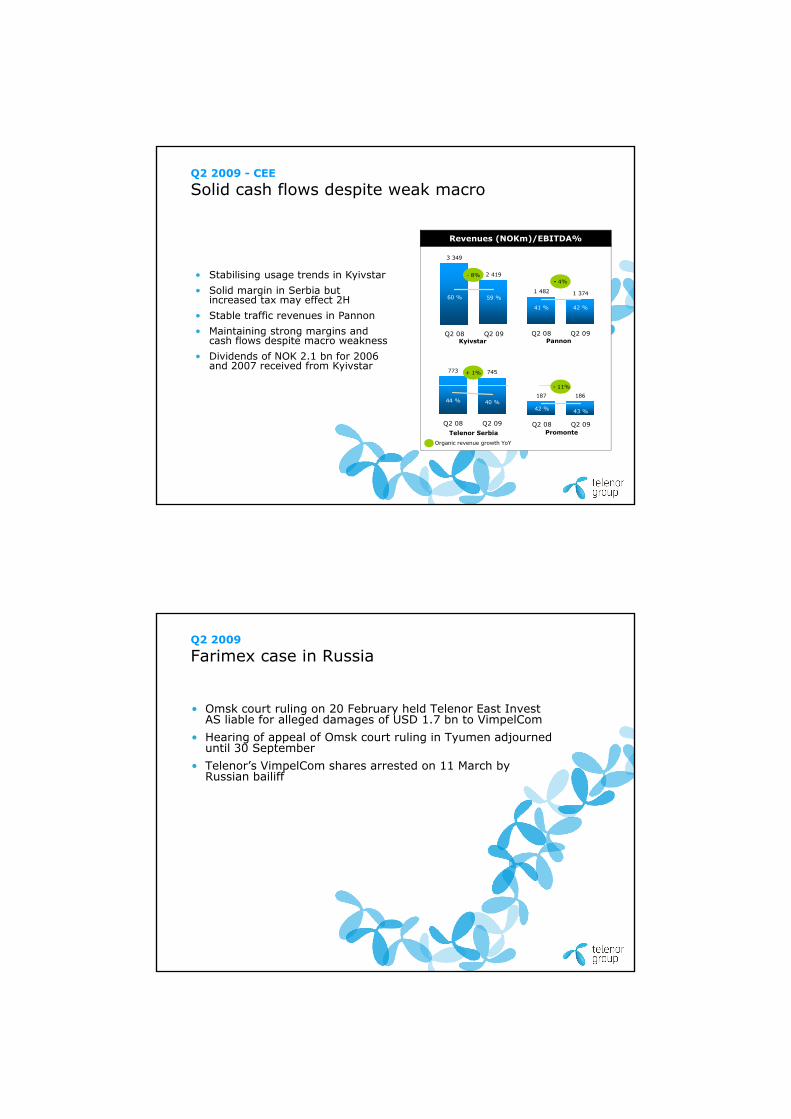
Q2 2009 - CEE
Solid cash flows despite weak macro
773 745
2 419
60 % 59 %
Q2 08 Q2 09
1 482 1 374
41 % 42 %
Q2 08 Q2 09Kyivstar Pannon
- 8%- 4%
+ 1%
11%
• Stabilising usage trends in Kyivstar• Solid margin in Serbia but
increased tax may effect 2H• Stable traffic revenues in Pannon • Maintaining strong margins and
cash flows despite macro weakness• Dividends of NOK 2.1 bn for 2006
and 2007 received from Kyivstar
44 % 40 %
Q2 08 Q2 09
187 186
43 %42 %
Q2 08 Q2 09Telenor Serbia Promonte
- 11%
Organic revenue growth YoY
Q2 2009
Farimex case in Russia
• Omsk court ruling on 20 February held Telenor East Invest AS liable for alleged damages of USD 1.7 bn to VimpelCom
• Hearing of appeal of Omsk court ruling in Tyumen adjourned until 30 September
• Telenor’s VimpelCom shares arrested on 11 March by Russian bailiff

3 068 3 009
Q2 2009 - Asia
Positive trends in Bangladesh and Pakistan
• Higher prices and lower subsidies in
Revenues (NOKm)/EBITDA%
3 068 3 009
41 %30 %
Q2 08 Q2 09
1 8892 208
47 % 44 %
Q2 08 Q2 09
g pBangladesh
• Continued cautious spending in low income segments in Malaysia
• 6% organic revenue decline in Thailand excl. DPC one-off last year
• Good revenue growth and improved EBITDA margin in Pakistan
• Substantial cash flow improvements in Bangladesh and Pakistan
1 0941 537 991
1 132
DTAC DiGi
+ 7%+ 10%
- 17%+ 1%
1 094
28 %
59 %
Q2 08 Q2 09
21 % 23 %
Q2 08 Q2 09
Grameenphone Telenor Pakistan
Organic revenue growth YoY
Q2 2009
Preparing for launch in India
• Planning to launch services in 5 circles in Q4 2009, with further step-up on a circle by circle basis
• GSM equipment contracts with Huawei, Alcatel Lucent and Ericsson, and IT outsourcing agreement with Wipro
• Inter circle roaming agreement secured
• Network planning and preparing go-to-market strategy
• Pending FIPB* approval to increase ownership above 49%
*Foreign Investment Promotion Board

Q2 2009
Maintaining priorities for 2009
• Scaling activities to top line developmentg p p• Strict prioritisation of capex allocation• Implementing measures to improve long-term efficiency • Successful launch of operations in India
Trond WestlieExecutive Vice President and CFO

Q2 2009
Organic revenue decline and stable EBITDA margin
Revenues (NOKm) and organic revenue growth (%)
EBITDA (NOKm) and EBITDA%g g ( )
26 24427 265
29 403
26 92327 058 26 956
7 % 7 %
3 % 3 %
0 %
9 249
10 0509 830
9 3329 2709 362
35 % 35 % 37 %33 % 34 % 35 %
All figures including Kyivstar. Organic revenue growth in fixed currency, adjusted for acquisitions and disposals. EBITDA and EBITDA margin before other items
0 %
-3 %
Q1 08 Q2 08 Q3 08 Q4 08 Q1 09 Q2 09 Q1 08 Q2 08 Q3 08 Q4 08 Q1 09 Q2 09
Q2 2009
Changes in revenues and EBITDA
Reported Organic
Mobile Norway 4.6% 4.4%
Reported Organic
14.9% 15.0%
Revenues EBITDA
Fixed Norway -0.5% -3.1%
Sweden -4.8% -1.4%
Denmark 6.4% -4.6%
Kyivstar -27.7% -7.8%
Pannon -7.3% -3.7%
Serbia -3.5% 0.7%
Promonte -0.4% -10.6%
DTAC -1.9% -17.4%
-1.4% -2.2%
-7.6% -4.2%
8.9% -2.4%
-28.6% -9.0%
-6.6% -3.0%
-11.6% -7.8%
2.3% -8.3%
-28.8% -39.6%DiGi 16.9% 0.9%
Pakistan 14.3% 6.7%
Grameenphone 40.4% 10.2%
Broadcast 0.9% -0.5%
Telenor Group -0.5% -3.1%
Organic growth YoY in fixed currency and adjusted for acquisitions and disposals. EBITDA before other items. Telenor Group organic figures including Kyivstar
8.8% -6.1%
26.0% 21.6%
202.3% 133.5%
51.1% 51.3%
-0.3% -0.7%

Q2 2009
Strict capex allocation
Change in capex (NOKm)Capex (NOKm) and capex/sales (%)
3 249
4 836
- 770- 239
- 258- 320
5 089
4 001
6 754
3 249
1550
485
3 291
4 836
19 % 18 %15 %
22 %
Licence fees
Other capex
CapexQ208
Asia CEE Nordic Broadcast/ Other
CapexQ109
15 %12 % 12 %
Q1 08 Q2 08 Q3 08 Q4 08 Q1 09 Q2 09
All figures including Kyivstar. Capex/sales ratio excluding licence fees.
Q2 2009
Positive trend in operating cash flow continued
Quarterly operating cash flow (NOKm) 4 quarters rolling op. cash flow (NOKm)
14 636
16 90817 811
21 19119 630
15 081
4 160
6 049
3 076
6 0835 979
4 526
Quarterly operating cash flow (NOKm) 4 quarters rolling op. cash flow (NOKm)
Q1 08 Q2 08 Q3 08 Q4 08 Q1 09 Q2 09Q1 08 Q2 08 Q3 08 Q4 08 Q1 09 Q2 09
Operating cash flow including Kyivstar and excluding licences and spectrum
Operating cash flow defined as EBITDA before other items - capex

Q2 2009
Cash flow improvement in Asia offsetting CEE decline
Nordic
4Q rolling operating cash flow (NOKm):
AsiaCEE
8 407 8 040 8 2908 8508 434
7 981
Q1 08 Q2 08 Q3 08 Q4 08 Q1 09 Q2 09
72
2 087 2 366
4 410
867
3 341
Q1 08 Q2 08 Q3 08 Q4 08 Q1 09 Q2 09
7 614
8 5929 051
8 2818 696
7 905
Q1 08 Q2 08 Q3 08 Q4 08 Q1 09 Q2 09
+ 3.6 NOKbn+ 0.4 NOKbn+ 0.9 NOKbn
Operating cash flow including Kyivstar and excluding licences and spectrum
Operating cash flow defined as EBITDA before other items - capex
Change YoY
Q2 2009
Solid cash flow improvement in Bangladesh and Pakistan
Nordic CEE Asia
4Q rolling operating cash flow margin:
30 %23 %
9 % 8 %
Mob
ile N
orway
Fixed N
orway
Sweden
Denmar
k
32 % 31 %37 %42 %
Kyivsta
r
Panno
n
Telenor
Serb
ia
Prom
onte
-28 %
15 %26 %
33 %
DTACDiG
i
Gram
eenp
hone
Telenor
Pakis
tan
Operating cash flow including Kyivstar and excluding licences and spectrum
Operating cash flow defined as EBITDA before other items - capex
4Q rolling Q308-Q209
4Q rolling Q307-Q208
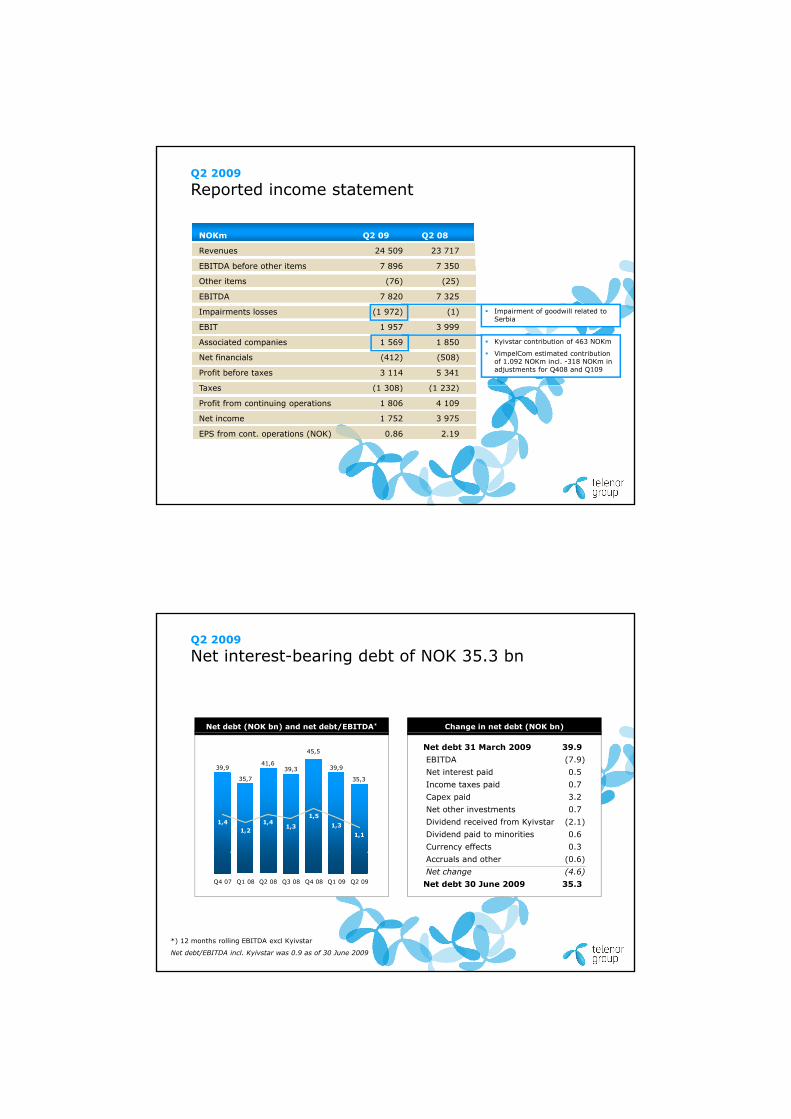
Q2 2009
Reported income statement
NOKm Q2 09 Q2 08
Revenues 24 509 23 717
EBITDA before other items 7 896 7 350EBITDA before other items 7 896 7 350
Other items (76) (25)
EBITDA 7 820 7 325
Impairments losses (1 972) (1)
EBIT 1 957 3 999
Associated companies 1 569 1 850
Net financials (412) (508)
Profit before taxes 3 114 5 341
T (1 308) (1 232)
Kyivstar contribution of 463 NOKm
VimpelCom estimated contribution of 1.092 NOKm incl. -318 NOKm in adjustments for Q408 and Q109
Impairment of goodwill related to Serbia
Taxes (1 308) (1 232)
Profit from continuing operations 1 806 4 109
Net income 1 752 3 975
EPS from cont. operations (NOK) 0.86 2.19
Q2 2009
Net interest-bearing debt of NOK 35.3 bn
Net debt (NOK bn) and net debt/EBITDA* Change in net debt (NOK bn)
39,941,6
39,3 39,9
35,335,7
45,5
1,41,2
1,41,3
1,51,3
1,1
Net debt 31 March 2009 39.9EBITDA (7.9) Net interest paid 0.5 Income taxes paid 0.7 Capex paid 3.2Net other investments 0.7Dividend received from Kyivstar (2.1)Dividend paid to minorities 0.6Currency effects 0.3
Q4 07 Q1 08 Q2 08 Q3 08 Q4 08 Q1 09 Q2 09
*) 12 months rolling EBITDA excl Kyivstar
Net debt/EBITDA incl. Kyivstar was 0.9 as of 30 June 2009
Accruals and other (0.6)Net change (4.6)
Net debt 30 June 2009 35.3

Q2 2009
Outlook for 2009
Group* incl India excl Indiap
Organic revenues: Marginal
India
Organic revenues: In line with 2008 In line with 2008
EBITDA: 32-33% Around 34%
Capex/sales: 16-19% 13-15%
*) Outlook on Group figures incl. Kyivstar, assuming Group structure and exchange rates as of 30 June 2009. EBITDA before other items. Capex excl. new licences and spectrum.
EBITDA loss: NOK 1.5 - 2.0 bn
Capex: NOK 3.5 - 4.5 bn
Telenor – Second Quarter 2009

3 120 3 208 3 249 3 2193 300 3 356
Q2 2009
Mobile NorwayRevenues (NOKm) and EBITDA%
+ 4%• 28k net subscriber growth, driven by bil b db d
36 % 36 % 36 % 34 % 39 % 40 %
Q1 08 Q2 08 Q3 08 Q4 08 Q1 09 Q2 09
1 127 1 166 1 182 1 1351 249
1 339
EBITDA CAPEX
EBITDA and capex (NOKm)
mobile broadband
• Continued revenue growth from consumer and business segments
• Growth in wholesale revenues driven by Network Norway
• 35% operating cash flow margin
237 227 185345
252 174
Q1 08 Q2 08 Q3 08 Q4 08 Q1 09 Q2 09
Organic growth assuming fixed currency, adjusted for acquisitions and disposals. EBITDA and EBITDA margin before other items
Organic revenue / EBITDA growth YoY
+ 15%
Revenues (NOKm) and EBITDA%
Q2 2009
Fixed Norway
3 631 3 656 3 6203 800
3 681 3 639
• Fixed voice and DSL subscriber trends ti d f i t
EBITDA and capex (NOKm)
35 % 36 % 38 % 34 % 36 % 36 %
Q1 08 Q2 08 Q3 08 Q4 08 Q1 09 Q209
1 281 1 324 1 373 1 301 1 333 1 306
EBITDA CAPEX
- 3%continued from previous quarters
• Organic revenue decline due to price and volume reductions
• Reduced operation & maintenance costs
• Continuous reductions in headcount
• Reduced capex driven by lower IS/IT investments
518 561454 538 478 458
Q1 08 Q2 08 Q3 08 Q4 08 Q1 09 Q209
Organic growth assuming fixed currency, adjusted for acquisitions and disposals. EBITDA and EBITDA margin before other items
- 2%
Organic revenue / EBITDA growth YoY

Revenues (NOKm) and EBITDA%
2 360 2 392 2 370 2 4102 160 2 278
Q2 2009
Telenor Sweden
- 1%• 34k net mobile subscriber growth
EBITDA and capex (NOKm)
22 % 18 %24 % 21 % 18 % 18 %
Q1 08 Q2 08 Q3 08 Q4 08 Q1 09 Q2 09
709573
EBITDA CAPEX
• Continued weakness in international traffic impacting revenues and EBITDA
• Workforce reductions announced in May
• MTRs reduced by 26% from 1 July
511385 408
250 213356
243 218
514442
573
Q1 08 Q2 08 Q3 08 Q4 08 Q1 09 Q2 09
450
Organic growth assuming fixed currency, adjusted for acquisitions and disposals. EBITDA and EBITDA margin before other items
- 4%
Organic revenue / EBITDA growth YoY
Licence fees
Revenues (NOKm) and EBITDA%
1 818 1 862 1 872 1 9812 075 2 016
Q2 2009
Telenor Denmark
• 132k net mobile subscriber growth - 5%
EBITDA and capex (NOKm)
21 % 22 % 25 % 25 % 23 % 23 %
Q1 08 Q2 08 Q3 08 Q4 08 Q1 09 Q2 09
386 416475
516466 453429
EBITDA CAPEX
g
• Acquisition of service provider BiBob with 70k subscribers
• Revenue decline due to continued PSTN subscriber loss and price pressure on DSL
• Successful rebranding of Sonofon and Cybercity to Telenor Denmark
386
258337
266 272 275
Q1 08 Q2 08 Q3 08 Q4 08 Q1 09 Q2 09
Organic growth assuming fixed currency, adjusted for acquisitions and disposals. EBITDA and EBITDA margin before other items
- 2%
Organic revenue / EBITDA growth YoY

Revenues (NOKm) and EBITDA%
Q2 2009
Kyivstar – Ukraine
3 0933 349
3 8393 553
2 348 2 419
• 504k net subscriber loss
• Revenue decrease has stabilised as
EBITDA and capex (NOKm)
61 % 60 % 62 %
51 %59 %58 %
Q1 08 Q2 08 Q3 08 Q4 08 Q1 09 Q2 09
1 872 2 0122 366
1 808
EBITDA CAPEX
- 8%• Revenue decrease has stabilised as
macro conditions have not worsened
• Small decline in ARPU with an effective 9% price drop in local currency offset by growth in usage
• 49% operating cash flow margin due to cost and investment savings
1 808
1 370 1 436
340 404241
486296
866
Q1 08 Q2 08 Q3 08 Q4 08 Q1 09 Q2 09Organic growth assuming fixed currency, adjusted for acquisitions and disposals. EBITDA and EBITDA margin before other items
Q408 figures have been restated to include estimate deviations 2006-2008, in accordance with the Annual Report 2008
- 9%
Organic revenue / EBITDA growth YoY
Revenues (NOKm) and EBITDA%
Q2 2009
Pannon – Hungary
1 3801 482
1 656 1 641
1 322 1 374
• 17k net subscriber loss - in line with - 4%
EBITDA and capex (NOKm)
42 % 41 % 43 %37 %
42 % 42 %
Q1 08 Q2 08 Q3 08 Q4 08 Q1 09 Q209
584 612719
601 558 572
EBITDA CAPEX
market
• Lower revenues due to MTR cut from 1 January 2009 and lower usage
• Stable EBITDA margin as sales costs are reduced
• Capex mainly related to new headquarter
558 572
107 160 130203
91 116
Q1 08 Q2 08 Q3 08 Q4 08 Q1 09 Q209
Organic growth assuming fixed currency, adjusted for acquisitions and disposals. EBITDA and EBITDA margin before other items
- 3%
Organic revenue / EBITDA growth YoY

Revenues (NOKm) and EBITDA%
Q2 2009
Telenor Serbia
698773
861 834720 745
+ 1%
• 32k net subscriber reduction
• Postpaid ratio above 30%
EBITDA and capex (NOKm)
41 % 44 % 47 % 49 % 43 % 40 %
Q1 08 Q2 08 Q3 08 Q4 08 Q1 09 Q2 09
284337
401 411
310 297
EBITDA CAPEX
• Postpaid ratio above 30%
• Significant usage increase and lower prices due to campaign offers
• Stable opex and strong capex control
• 10% sales tax on mobile usage implemented from 1 June 2009
284 297
13992 75
211
66 74
Q1 08 Q2 08 Q3 08 Q4 08 Q1 09 Q2 09
Organic growth assuming fixed currency, adjusted for acquisitions and disposals. EBITDA and EBITDA margin before other items
- 8%
Organic revenue / EBITDA growth YoY
Revenues (NOKm) and EBITDA%
164187
236
188166
186
Q2 2009
Promonte - Montenegro
EBITDA and capex (NOKm)
35 % 42 %50 %
38 % 41 % 43 %
Q1 08 Q2 08 Q3 08 Q4 08 Q1 09 Q2 09
119
EBITDA CAPEX
- 11%
• 23k net subscriber gain as summer season started
• Revenue decline due to less subscribers and tourists
• EBITDA margin increased following cost control measures
5778
119
72 68 79
1024 20 13 6 10
Q1 08 Q2 08 Q3 08 Q4 08 Q1 09 Q2 09
Organic growth assuming fixed currency, adjusted for acquisitions and disposals. EBITDA and EBITDA margin before other items
- 8%
Organic revenue / EBITDA growth YoY

Revenues (NOKm) and EBITDA%
3 036 3 0682 655
3 241 3 219 3 009
Q2 2009
DTAC – Thailand
400- 17%
• 255k net subscriber growth
EBITDA and capex (NOKm)
1251
EBITDA CAPEX
33 %
41 %30 % 28 % 29 % 30 %
Q1 08 Q2 08 Q3 08 Q4 08 Q1 09 Q2 0932%
• 255k net subscriber growth
• Drop in ARPU from Q1 due to seasonal lower usage
• 6% organic revenue decline excluding DPC one-off in Q208
• Stable EBITDA margin
• Cash flow improvement driven by low capex
32%
1014802
913 937 890
378 414617
512262 283
Q1 08 Q2 08 Q3 08 Q4 08 Q1 09 Q209
400
Organic growth assuming fixed currency, adjusted for acquisitions and disposals. EBITDA and EBITDA margin before other items
- 40%
Organic revenue / EBITDA growth YoY
DPC settlement
• Cash flow outlook for 2009 maintained
Revenues (NOKm) and EBITDA%
Q2 2009
DiGi – Malaysia
1 921 1 889 1 963
2 339 2 307 2 208
+ 1%
• 76k net subscriber growth
EBITDA and capex (NOKm)
48 % 47 % 43 % 44 % 45 % 44 %
Q1 08 Q2 08 Q3 08 Q4 08 Q1 09 Q2 09
1394
EBITDA CAPEX
1100
• 76k net subscriber growth
• Continued cautious spending in low income segments
• 8% decline in ARPU from Q208 due to lower APPM
• EBITDA and capex affected by 3G roll-out
• Cash flow outlook for 2009 maintained
918 886 8391023 1032 965
208 311
762
277 250
Q1 08 Q2 08 Q3 08 Q4 08 Q1 09 Q2 09
1100
294
Organic growth assuming fixed currency, adjusted for acquisitions and disposals. EBITDA and EBITDA margin before other items
- 6%
Organic revenue / EBITDA growth YoY
Licence fees

Revenues (NOKm) and EBITDA%
Q2 2009
Grameenphone – Bangladesh
1 153 1 094 1 175
1 627 1 574 1 537
+ 10%
106K net subscriber growth
EBITDA and capex (NOKm)
43%47 %
28 %
49 %57 % 59 % 59 %
Q1 08 Q2 08 Q3 08 Q4 08 Q1 09 Q2 09
924
1 144
934 909
EBITDA CAPEX
43%
485
• 106K net subscriber growth
• Good organic revenue growth as a result of higher prices
• Lower SIM tax subsidies and low gross adds secure high EBITDA margin
• Capex further adjusted to lower traffic growth
• 47% operating cash flow margin
545
301433 418
263 281184
572
Q1 08 Q2 08 Q3 08 Q4 08 Q1 09 Q2 09
Organic growth assuming fixed currency, adjusted for acquisitions and disposals. EBITDA and EBITDA margin before other items
Organic revenue / EBITDA growth YoY
Spectrum fees
+ 133%• SEC approval of IPO on 2 July
Revenues (NOKm) and EBITDA%
1042 991869
1109 1121 1132
Q2 2009
Telenor Pakistan
+ 7%
• 908k net subscriber growth
EBITDA and capex (NOKm)
17 %
11 %
23 %21 %20 % 21 %
Q1 08 Q2 08 Q3 08 Q4 08 Q1 09 Q209
1 249
966
EBITDA CAPEX
• 908k net subscriber growth
• Pick-up in market growth and usage from Q1
• Improved EBITDA margin
• Network investments adjusted to lower market growth
• First quarter with positive operating cash flow
179 20699
225 232 182260341
638
966
208
Q1 08 Q2 08 Q3 08 Q4 08 Q1 09 Q209
Organic growth assuming fixed currency, adjusted for acquisitions and disposals. EBITDA and EBITDA margin before other items
+ 22%
Organic revenue / EBITDA growth YoY

Revenues (NOKm) and EBITDA%
Q2 2009
Broadcast
19222066 2022
2160 2102 2 084
- 1%• 12k cable Internet net adds
EBITDA and capex (NOKm)
22 %16 %
24 %18 %
24 %21 %
Q1 08 Q2 08 Q3 08 Q4 08 Q1 09 Q2 09
1398
EBITDACAPEX
1144
• 17k DTH net subscriber loss, despite lower churn
• Conax revenues hit by global recession
• Norkring Belgie awarded DTT licence in Flanders in June
• 7 year satellite transmission contract signed with UPC in July
423 329489
389 435 497323 322 322 245 228
Q1 08 Q2 08 Q3 08 Q4 08 Q1 09 Q2 09
1144
254
Organic growth assuming fixed currency, adjusted for acquisitions and disposals. EBITDA and EBITDA margin before other items
+ 51%
Organic revenue / EBITDA growth YoYSatellite
Telenor – Second Quarter 2009Appendix

36,3 37,4 35,8 35,6 34,236,2
Mobile operations
ARPU development (USD)
Mobile SwedenMobile Norway
38,338,939,940,44140,2
Mobile Denmark
50,948,650,251,952,8
50,2
5,25,7
6,1 6,1
5 05,4
Q108 Q208 Q308 Q408 Q109 Q2 09
Kyivstar
Q108 Q208 Q308 Q408 Q109 Q2 09
20,519,621,9
23,422,421,6
Pannon
21,519,519,6
20,720,220,6
Promonte
Q108 Q208 Q308 Q408 Q109 Q209
, 5,0
Q108 Q208 Q308 Q408 Q109 Q2 09 Q108 Q208 Q308 Q408 Q109 Q2 09 Q108 Q208 Q308 Q408 Q109 Q2 09
FX as of 30.06.2009
Mobile operations
ARPU development (USD)
13,112,2
13,014,1
13,412,3
Telenor Serbia
3,1 3
2,62,8
2,62,8
Telenor Pakistan
15,415,816,416,816,816,6
DiGi
Q108 Q208 Q308 Q408 Q109 Q209 Q108 Q208 Q308 Q408 Q109 Q209 Q108 Q208 Q308 Q408 Q109 Q209
8 38,99,3
10,1
DTAC
3 73 63,9
3 74,2
Grameenphone
7,98,28,3
Q108 Q208 Q308 Q408 Q109 Q209
3,73,63,53,7
Q108 Q208 Q308 Q408 Q109 Q209
FX as of 30.06.2009

204191193 190 195 192
251 249
235 236 241 243 221 227199 208 218 211
Mobile Norway Mobile SwedenMobile Denmark
MoU APPM (USD)
Mobile operations
MoU/APPM development
147159
168 169154
166
173 165159173 166
156125
147130
120128 131
0,21 0,20 0,21 0,20 0,20 0,20
Q108 Q208 Q308 Q408 Q109 Q209
0,21 0,21 0,22 0,21 0,20 0,20
Q108 Q208 Q308 Q408 Q109 Q209
0,18 0,17 0,17 0,16 0,16 0,16
Q108 Q208 Q308 Q408 Q109 Q209
PromontePannonKyivstar
0,030,030,040,040,040,04
Q108 Q208 Q308 Q408 Q109 Q209
159 156
0,14 0,13 0,14 0,13 0,13 0,12
Q108 Q208 Q308 Q408 Q109 Q209
0,16 0,16 0,17 0,15 0,15 0,15
Q108 Q208 Q308 Q408 Q109 Q209
FX as of 30.06.2009
211 210203221 220 212165 163163
146155 155
123
103
Telenor Serbia Telenor Pakistan DiGi
Mobile operations
MoU/APPM development MoU APPM (USD)
0,08 0,08 0,08 0,07 0,07 0,07
Q108 Q208 Q308 Q408 Q109 Q209
146
0,02 0,02 0,02 0,02 0,02 0,02
Q108 Q208 Q308 Q408 Q109 Q209
938894
10395
0,14 0,14 0,15 0,13 0,130,11
Q108 Q208 Q308 Q408 Q109 Q209
363
DTAC
319 319 332 327
Grameenphone
333291
363317 308 303
0,03 0,03 0,03 0,03 0,03 0,03
Q108 Q208 Q308 Q408 Q109 Q209
319301
259
319 332 327
0,02
0,01 0,01 0,01 0,01 0,01
Q108 Q208 Q308 Q408 Q109 Q209
FX as of 30.06.2009
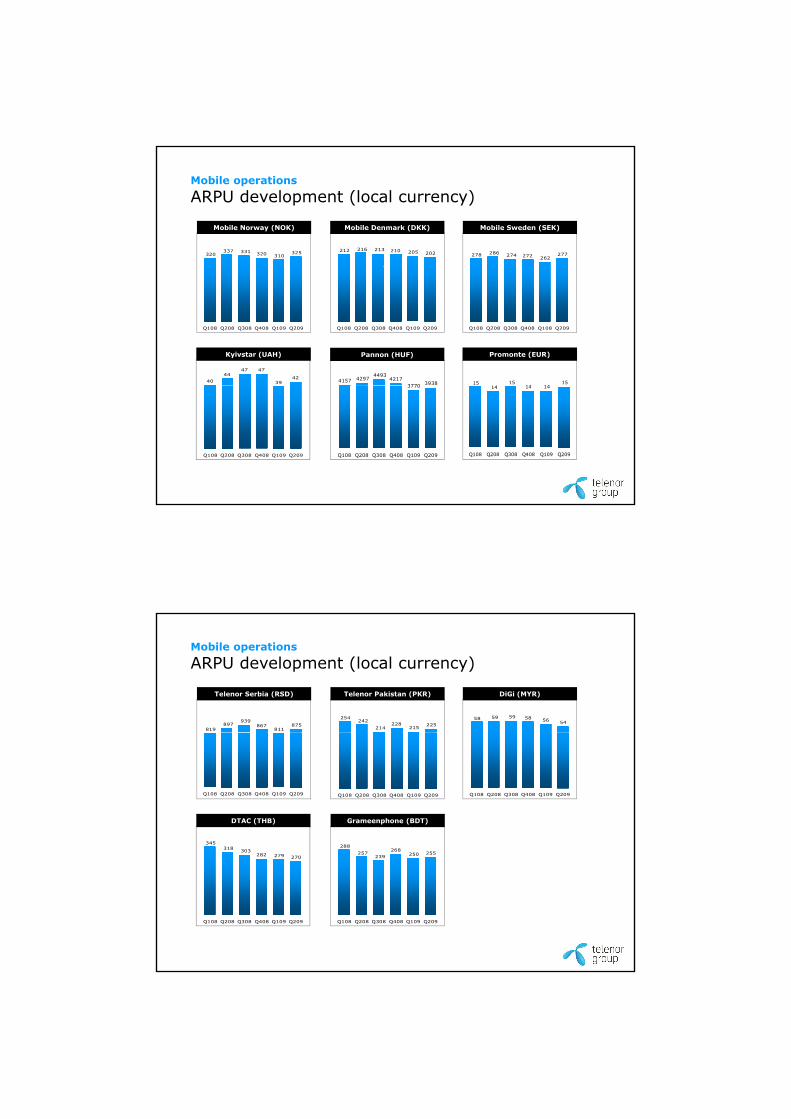
277262272274286278
Mobile Sweden (SEK)
Mobile operations
ARPU development (local currency)
202205210213216212
Mobile Denmark (DKK)
320337 331 320 310
325
Mobile Norway (NOK)
Q108 Q208 Q308 Q408 Q108 Q209Q108 Q208 Q308 Q408 Q109 Q209Q108 Q208 Q308 Q408 Q109 Q209
4044
47 47
3942
Kyivstar (UAH)
393837704217
449342974157 15
141415
1415
Promonte (EUR)Pannon (HUF)
Q108 Q208 Q308 Q408 Q109 Q209
3770
Q108 Q208 Q308 Q408 Q109 Q209
141414
Q108 Q208 Q308 Q408 Q109 Q209
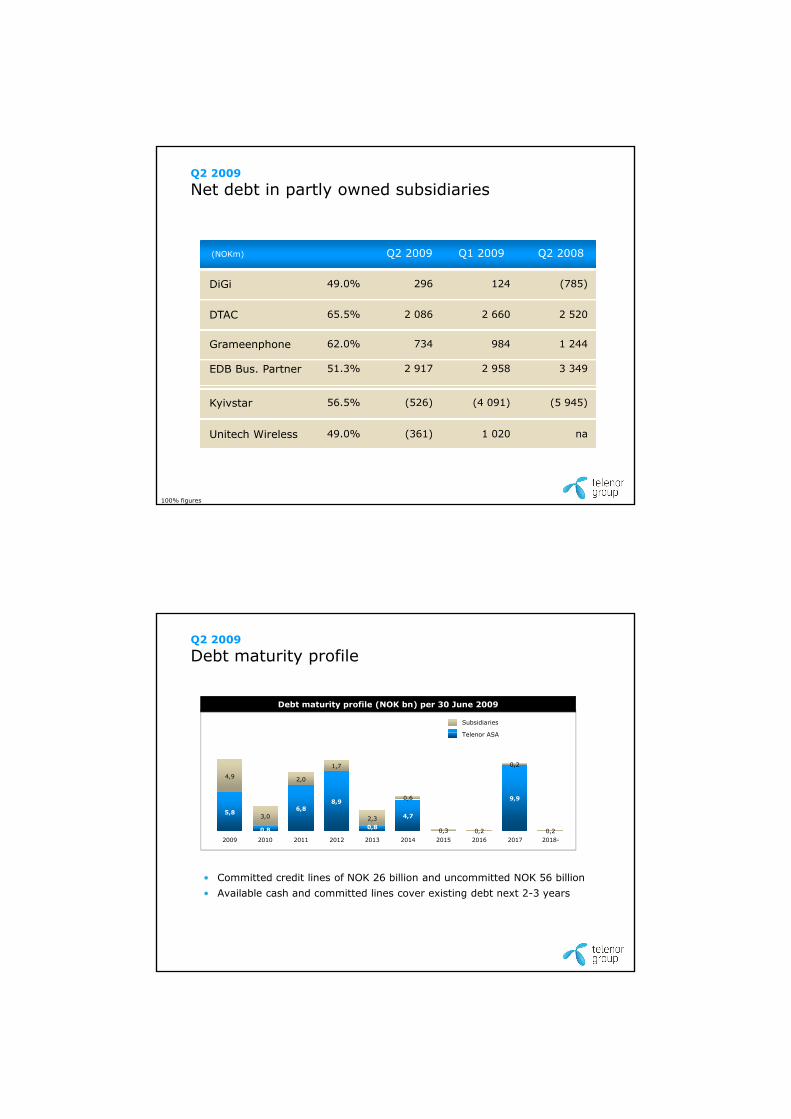
Mobile operations
ARPU development (local currency)
875811
867939
897819
Telenor Serbia (RSD)
225215
228214
242254
Telenor Pakistan (PKR)
545658595958
DiGi (MYR)
Q108 Q208 Q308 Q408 Q109 Q209 Q108 Q208 Q308 Q408 Q109 Q209 Q108 Q208 Q308 Q408 Q109 Q209
303318345
DTAC (THB)
255268
257
288
Grameenphone (BDT)
270279282303
Q108 Q208 Q308 Q408 Q109 Q209
255250239257
Q108 Q208 Q308 Q408 Q109 Q209

Mobile operations
MoU/APPM development
204191193 190 195 192
251 249
235 236241 243 221 227
199 208 218 211
Mobile Norway Mobile SwedenMobile Denmark
MoU APPM (local currency)
1,10 1,06 1,12 1,08 1,07 1,06
Q108 Q208 Q308 Q408 Q109 Q209
1,36 1,34 1,40 1,33 1,28 1,31
Q108 Q208 Q308 Q408 Q109 Q209
1,40 1,29 1,32 1,25 1,24 1,22
Q108 Q208 Q308 Q408 Q109 Q209
147159 168 169
154166 173 165156
166173159
125
147130
120128 131
PromontePannonKyivstar
0,250,250,280,280,280,27
Q108 Q208 Q308 Q408 Q109 Q209
23,924,225,426,024,826,1
Q108 Q208 Q308 Q408 Q109 Q209
0,11 0,110,12 0,11 0,11
0,10
Q108 Q208 Q308 Q408 Q109 Q209
93
123
95103
9488
211 210203221 220 212165 163163
146155 155
Telenor Serbia Telenor Pakistan DiGi
Mobile operations
MoU/APPM development MoU APPM (local currency)
88
7,138,508,42
9,999,659,31
Q108 Q208 Q308 Q408 Q109 Q209
0,29 0,28 0,27 0,26 0,26 0,26
Q108 Q208 Q308 Q408 Q109 Q209
1,56 1,46 1,47 1,47 1,39 1,38
Q108 Q208 Q308 Q408 Q109 Q209
333363
317 308 303
DTAC
319 301319 332 327
Grameenphone
291317 308 303
0,95 0,96 0,95 0,92 0,92 0,93
Q108 Q208 Q308 Q408 Q109 Q209
259
1,110,81 0,75 0,81 0,76 0,85
Q108 Q208 Q308 Q408 Q109 Q209
Q2 2009
Net debt in partly owned subsidiaries
(NOKm) Q2 2009 Q1 2009 Q2 2008
DiGi 49.0% 296 124 (785)
DTAC 65.5% 2 086 2 660 2 520
Grameenphone 62.0% 734 984 1 244
EDB Bus. Partner 51.3% 2 917 2 958 3 349
Kyivstar 56.5% (526) (4 091) (5 945)
Unitech Wireless 49.0% (361) 1 020 na
100% figures
Q2 2009
Debt maturity profile
Debt maturity profile (NOK bn) per 30 June 2009
Subsidiaries
T l ASA
5,8 6,88,9
4,7
9,9
4,9
3,0
2,0
1,7
2,3
0,6
0,3 0,2
0,2
0,20,8 0,8
2009 2010 2011 2012 2013 2014 2015 2016 2017 2018-
Telenor ASA
• Committed credit lines of NOK 26 billion and uncommitted NOK 56 billion• Available cash and committed lines cover existing debt next 2-3 years