teekay lng partners q4-2017 earnings presentation · pdf filethis presentation contains...
TRANSCRIPT
TEEKAY LNG PARTNERS Q4-2017 EARNINGS PRESENTATIONFebruary 22, 2018

Forward Looking Statement
This presentation contains forward-looking statements (as defined in Section 21E of the Securities Exchange Act of 1934, as
amended) which reflect management’s current views with respect to certain future events and performance, including statements
regarding: the Partnership’s forward fixed-rate revenues and weighted average remaining contract duration; the amount, timing and
certainty of completing financings for newbuilding vessels and refinancings; LNG and LPG fundamentals; and the timing of
newbuilding vessel deliveries, the commencement of related contracts and cash flow contributions from these vessels. The following
factors are among those that could cause actual results to differ materially from the forward-looking statements, which involve risks
and uncertainties, and that should be considered in evaluating any such statement: potential shipyard and project construction delays,
newbuilding specification changes or cost overruns; changes in production of LNG or LPG, either generally or in particular regions;
changes in trading patterns or timing of start-up of new LNG liquefaction and regasification projects significantly affecting overall
vessel tonnage requirements; changes in applicable industry laws and regulations and the timing of implementation of new laws and
regulations; the potential for early termination of long-term contracts of existing vessels in the Teekay LNG fleet; the inability of
charterers to make future charter payments; the inability of the Partnership to renew or replace long-term contracts on existing
vessels; the Partnership’s and the Partnership’s joint ventures’ ability to secure financing for its existing newbuildings and projects and
to refinance existing debt; and other factors discussed in Teekay LNG Partners’ filings from time to time with the SEC, including its
Report on Form 20-F for the fiscal year ended December 31, 2016. The Partnership expressly disclaims any obligation to release
publicly any updates or revisions to any forward-looking statements contained herein to reflect any change in the Partnership’s
expectations with respect thereto or any change in events, conditions or circumstances on which any such statement is based.
2

Recent Highlights
• Generated distributable cash flow (DCF)(1) of $52.1
million and total cash flow from vessel operations(1)
of $126.8 million in Q4-17
o DCF per LP unit of $0.65 per unit
o Distribution coverage ratio of 4.6x
• Since September 2017, have taken delivery of six
LNG carrier newbuildings, all of which commenced
long-term charter contracts
• In December 2017, completed long-term debt
financing for all six 50%-owned ARC7 LNG carrier
newbuildings chartered to Yamal LNG
• In January 2018, divested 50% interest in S/S
Excelsior for net proceeds after debt repayment of
~$44 million
• In February 2018, refinanced a 2018 loan maturity
with a new, 5-year $197 million long-term debt
facility
3
1) These are non-GAAP financial measures. Please refer to “Definitions and Non-GAAP
Financial Measures” and the Appendices in the Partnership’s Q4-2017 earnings release
for definitions of these terms and reconciliations of these non-GAAP financial measures
as used in this presentation to the most directly comparable financial measures under
United States generally accepted accounting principles (GAAP).

4
Six LNG Carriers Delivered in Past Four Months
• All six vessels immediately commenced
their respective charter contracts with
Yamal LNG (1x) and Shell (5x) ranging
between six and 28 years in duration
• Two 30%-owned LNG newbuilds
○ Pan Asia: Delivered on October 13th
○ Pan Americas: Delivered on January 31st
• Three wholly-owned MEGI LNG newbuilds
○ Macoma: Delivered on October 19th
○ Murex: Delivered on November 1st
○ Magdala: Delivered on February 9th
• First 50%-owned ARC7 LNG newbuild
○ Eduard Toll: Delivered on January 12th
4
Vessels expected to contribute a combined
~$85(1) million of annual CFVO
1) Includes Teekay LNG’s proportionate share of CFVO from equity-accounted joint ventures.

Financing
completed
Macoma
Remaining 12 vessels and Regas Terminal expected to contribute an
additional ~$225(1) million of annual CFVO
Multi-Year Built-in Growth
5
2018 2019 2020 2021 2022 2023 2024 2025 2026 2027 2028 2029 2030 2031 2032 2033 2034 2035
Murex
Magdala
Myrina
Megara
Charterer
Bahrain Spirit
Sean Spirit
Yamal Spirit
Pan Asia
Pan Americas
Pan Europe
Pan Africa
Ownership
100%
100%
100%
100%
100%
Regas Terminal
100%
30%
100%
30%
30%
20%
20%
Eduard Toll
Rudolf Samoylovich
Nikolay Yevgenov
Vladimir Voronin
50%
50%
50%
50%
50%
50%
Georgiy Ushakov
Yakov Gakkel
100%
2018 2019 2020 2021 2022 2023 2024 2025 2026 2027 2028 2029 2030 2031 2032 2033 2034 2035
Firm Period Option Periods
Firm period end date in 2045
Firm period end date in 2045
Firm period end date in 2045
Firm period end date in 2045
Firm period end date in 2045
Firm period end date in 2045
Firm period end date in 2039
Firm period end date in 2038
Firm period end date in 2038
Firm period end date in 2037
Firm period end date in 2039
Firm period end date in 2038
Available
Est. Q2-18
Delivered
1) Includes Teekay LNG’s proportionate share of CFVO from equity-accounted joint ventures.
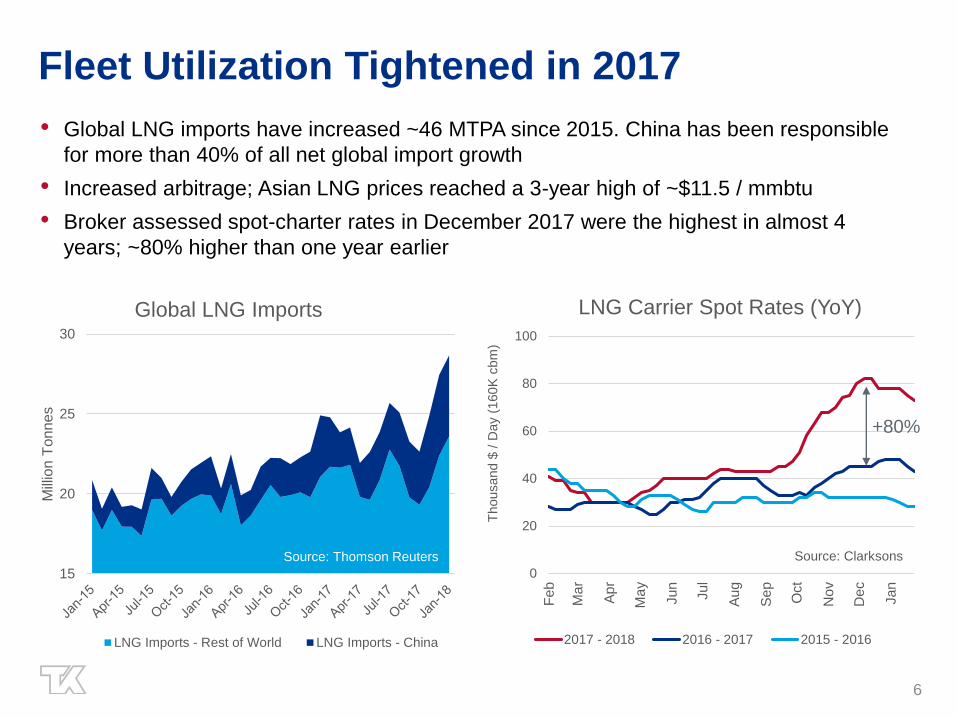
Fleet Utilization Tightened in 2017
• Global LNG imports have increased ~46 MTPA since 2015. China has been responsible
for more than 40% of all net global import growth
• Increased arbitrage; Asian LNG prices reached a 3-year high of ~$11.5 / mmbtu
• Broker assessed spot-charter rates in December 2017 were the highest in almost 4
years; ~80% higher than one year earlier
6
0
20
40
60
80
100
Fe
b
Ma
r
Ap
r
Ma
y
Jun
Jul
Au
g
Se
p
Oct
No
v
De
c
Jan
Thousand $
/ D
ay
(160K
cbm
)
Source: Clarksons
LNG Carrier Spot Rates (YoY)
2017 - 2018 2016 - 2017 2015 - 2016
15
20
25
30
Mill
ion T
onn
es
Source: Thomson Reuters
Global LNG Imports
LNG Imports - Rest of World LNG Imports - China
+80%
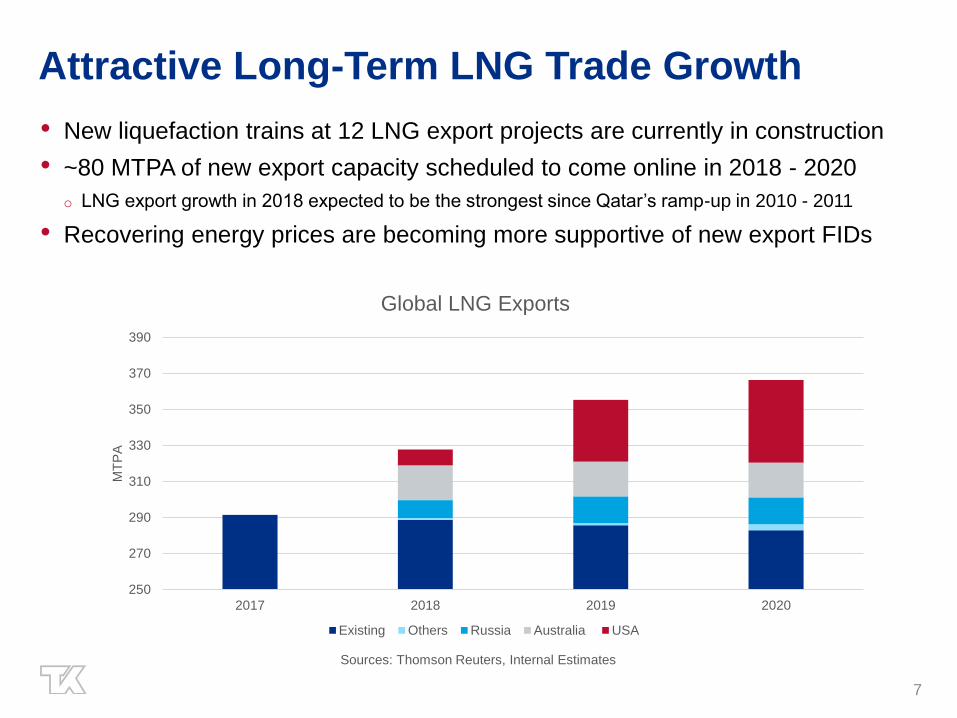
Attractive Long-Term LNG Trade Growth
• New liquefaction trains at 12 LNG export projects are currently in construction
• ~80 MTPA of new export capacity scheduled to come online in 2018 - 2020
o LNG export growth in 2018 expected to be the strongest since Qatar’s ramp-up in 2010 - 2011
• Recovering energy prices are becoming more supportive of new export FIDs
7
250
270
290
310
330
350
370
390
2017 2018 2019 2020
MT
PA
Sources: Thomson Reuters, Internal Estimates
Global LNG Exports
Existing Others Russia Australia USA

Well-Positioned for LPG Shipping Recovery
• In 2018, 50/50 joint venture with Exmar scheduled to take delivery of last three mid-sized
LPG carrier newbuildings, increasing fleet size to 22 vessels
• Created the Teekay Multigas Pool, which includes seven vessels that were previously
managed by IM Skaugen
• Early signs of LPG charter rate recovery
• LPG trade growth expected to exceed fleet growth for the first time since 2014
8
5
15
25
35
45
55
65
Jan-16 Jul-16 Jan-17 Jul-17 Jan-18
Thousand $
/ d
ay
Source: Clarksons
LPG Charter Rates
VLGC TCE 35k MGC 1-yr TC
0%
5%
10%
15%
20%
2014 2015 2016 2017 2018
Source: Clarksons
LPG Fleet and Trade Growth
Fleet Growth (total cbm) Tonne-Mile Growth

9
Teekay LNG at a Positive Inflection Point• Executing on financing plan and
strengthening balance sheet
○ Substantially financed newbuild program and 2018
refinancings progressing well
○ Newbuilds beginning to deliver onto LT contracts, which
naturally delevers balance sheet
○ Strong liquidity position of $478(1) million at Dec 31, 2017
• Significant CFVO growth expected through
2020
○ 6 LNG carrier newbuilds delivered in past four months
○ Annual run-rate CFVO contribution from 18 LNG carrier
newbuilds plus Regas Terminal expected to be ~$310(2)
million.
• Underlying LNG vessel market improving and
LT fundamentals remain strong
○ LNG fleet fixed coverage of 88% in 2018 and 84% in 2019
91) Liquidity pro-forma for sale of S/S Excelsior which occurred in January 2018
2) Includes Teekay LNG’s proportionate share of CFVO from equity-accounted joint ventures.

Appendix
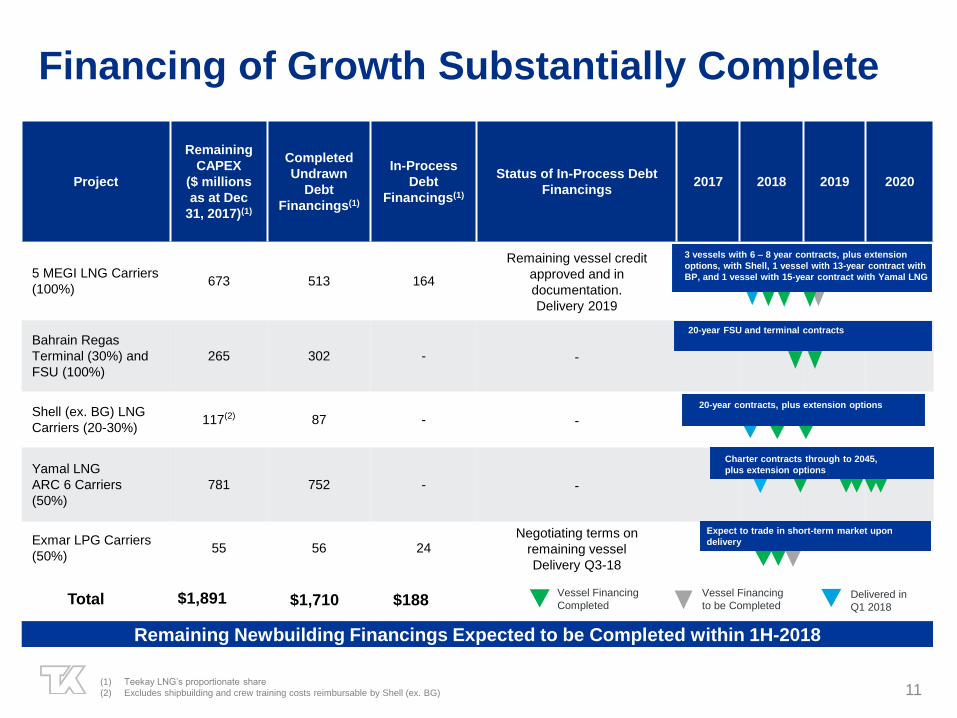
Project
Remaining
CAPEX
($ millions
as at Dec
31, 2017)(1)
Completed
Undrawn
Debt
Financings(1)
In-Process
Debt
Financings(1)
Status of In-Process Debt
Financings2017 2018 2019 2020
5 MEGI LNG Carriers
(100%)673 513 164
Remaining vessel credit
approved and in
documentation.
Delivery 2019
Bahrain Regas
Terminal (30%) and
FSU (100%)
265 302 - -
Shell (ex. BG) LNG
Carriers (20-30%)117(2) 87 - -
Yamal LNG
ARC 6 Carriers
(50%)
781 752 - -
Exmar LPG Carriers
(50%)55 56 24
Negotiating terms on
remaining vessel
Delivery Q3-18
Financing of Growth Substantially Complete
11
Vessel Financing
to be Completed
Vessel Financing
Completed$1,891 $1,710Total
3 vessels with 6 – 8 year contracts, plus extension
options, with Shell, 1 vessel with 13-year contract with
BP, and 1 vessel with 15-year contract with Yamal LNG
20-year FSU and terminal contracts
20-year contracts, plus extension options
$188
Remaining Newbuilding Financings Expected to be Completed within 1H-2018
(1) Teekay LNG’s proportionate share
(2) Excludes shipbuilding and crew training costs reimbursable by Shell (ex. BG)
Delivered in
Q1 2018
Charter contracts through to 2045,
plus extension options
Expect to trade in short-term market upon
delivery

2018 Refinancing Update
• In November 2017, completed refinancing of unsecured corporate revolving credit facility
• In February 2018, completed $197 million refinancing of 2018 maturity
• Expect to complete remaining vessel refinancings by Q3-2018
12
0
200
400
600
Total liquidity as of December 31,2017, pro-forma for Excelsior sale in
January 2018
2018
2H-2018
1H-2018
$ M
illio
ns
(1) US Dollar equivalent of Euro denominated loan as at December 31, 2017
(2) NOK Bond Maturity is net of cash collateral placed to secure associated cross-currency swaps
(3) Unsecured Corporate Revolver was $90 million drawn and $100 million undrawn as at December 31, 2017
NOK Bond Maturity(1)Maturities Secured by VesselsUnsecured Corporate Revolver (3)
• $57m Arctic/Polar Spirit –
Negotiating terms
• $124m(1) 1x Spanish LNG
carrier under LT charter –
Negotiating terms
• $51m LPG carriers – Agreed
term sheet
• $136m(2) senior unsecured
NOK bond maturity, matures in
September 2018
• 364-day unsecured corporate
revolving credit facility(3),
matures in November 2018

Distributable Cash FlowQ4-17 vs. Q3-17
2) For a reconciliation of Distributable Cash Flow, a non-GAAP measure, to the most directly comparable GAAP figures, see Appendix B in the Q4-17 and Q3-17 Earnings Releases.
1) Refer to next slide for a reconciliation of Net Voyage Revenues, Adjusted Interest Expense and Adjusted Income Tax Expense.
(Thousands of U.S. Dollars except units outstanding or
unless otherwise indicated)
Q4-2017
(unaudited)
Q3-2017
(unaudited) Comments
Net voyage revenues(1) 122,156 103,465
Increase primarily due to recognition of the remaining Skaugen prepaid lease payments of
$10.7M, and the deliveries of the Macoma and Murex
Vessel operating expenses (26,930) (26,724)
Estimated maintenance capital expenditures (14,265) (13,232)
General and administrative expenses (4,949) (2,793)Increase due to one-time lower corporate allocation in Q3-17
Partnership's share of equity-accounted joint ventures'
DCF net of estimated maintenance capital expenditures 13,719 11,008
Higher equity income from the MALT Joint Venture due to higher earnings on short-term trading
vessels and from the Pan Union Joint Venture due to the delivery of the Pan Asia. These
increases are partially offset by lower equity income from the Exmar LNG Joint Venture due to a
scheduled dry docking of the Excalibur
Adjusted interest expense(1) (30,738) (26,167)Increase due to LNG vessel deliveries in Q4-2017
Interest income 880 602
Adjusted Income tax expense(1) (703) (750)
Distributions relating to preferred units (5,541) (2,813)Issuance of preferred units in October 2017
Distributions relating to equity financing of newbuildings 3,844 1,589 Issuance of preferred units in October 2017
Direct finance lease payments received in excess of revenue
recognized and other adjustments 2,142 1,901
Other adjustments - net (2,711) (546)
Increase due to an income tax provision in Q4-17 relating to adjustments to uncertain tax positions
of prior years
Distributable Cash Flow before Non-Controlling Interests 56,904 45,540
Non-controlling interests' share of DCF (4,850) (5,316)
Distributable Cash Flow(2) 52,054 40,224
Cash distributions to the General Partner (226) (227)
Limited partners' Distributable Cash Flow 51,828 39,997
Weighted-average number of common units outstanding 79,626,819 79,626,819
Distributable Cash Flow per limited partner unit 0.65 0.50
13

Reconciliations of Non-GAAP Financial Measures
Reconciliation of the Partnership’s Adjusted Interest Expense:
Reconciliation of the Partnership’s Net Voyage Revenues:
(Thousands of U.S. Dollars)
Three Months Ended
December 31, 2017
(unaudited)
Three Months Ended
September 30, 2017
(unaudited)
Voyage revenues as reported 126,307 104,285
Voyage expenses as reported (4,303) (1,466)
Realized gains on charter contract derivative instrument 152 646
Net Voyage Revenues 122,156 103,465
(Thousands of U.S. Dollars)
Three Months Ended
December 31, 2017
(unaudited)
Three Months Ended
September 30, 2017
(unaudited)
Interest expense as reported (23,333) (20,091)
Realized losses on derivative instruments and other (7,405) (6,076)
Adjusted Interest Expense (30,738) (26,167)
Reconciliation of the Partnership’s Adjusted Income Tax Expense:
(Thousands of U.S. Dollars)
Three Months Ended
December 31, 2017
(unaudited)
Three Months Ended
September 30, 2017
(unaudited)
Income tax recovery (expense) as reported 319 (750)
Deferred income tax recovery (2,652) -
Tax provision relating to uncertain tax positions in prior years 1,630 -
Adjusted Income Tax Expense (703) (750)
14

Q1 2018 Outlook
Distributable Cash Flow Item
Q1 2018 Outlook
(compared to Q4 2017)
Net voyage revenues• $7M decrease primarily due to recognition in Q4-17 of the remaining IM Skaugen prepaid lease payments of $10.7M,
partially offset by an increase in revenues from charter contract commencement for the Macoma, Murex and Magdala
Vessel operating expenses• $4M increase primarily due to our LPG vessels, which were on bareboat contracts, repossessed from IM Skaugen in Q4-17
and the timing of vessel maintenance expenses
Estimated maintenance capital expenditures • Expected to be consistent with Q4-17
General and administrative expenses • Expected to be consistent with Q4-17
Partnership's share of equity-accounted joint
ventures' DCF net of estimated maintenance
capital expenditures
• $3M increase in equity income from the Yamal LNG Joint Venture primarily due to the delivery and charter contract
commencement of the Edward Toll in January 2018
• $2M increase in equity income from the Teekay LNG–Marubeni Joint Venture primarily due higher rates earned on our
short-term trading vessels
• $1M increase in equity income from the Pan Union Joint Venture primarily due to the delivery and charter contract
commencement of the Pan Americas in February 2018
Adjusted interest expense • $3M increase primarily due to vessel deliveries
Distributions relating to preferred units • $1M increase due to the full-quarter impact of preferred units issued in October 2017
Distributions relating to equity financing of
newbuildings• Expected to be consistent with Q4-17
Direct finance lease payments received in
excess of revenue recognized• Expected to be consistent with Q4-17
Non-controlling interests' share of DCF • Expected to be consistent with Q4-17
Cash distributions to the General Partner • Expected to be consistent with Q4-17
Other adjustments - net • $1M reduction to DCF for restructuring expenses related to the sale of the Teide Spirit
15

2017(A) / 2018(E) Drydock Schedule
16
SegmentVessels
Total Off-hire
DaysVessels
Total Off-
hire Days Vessels
Total Off-hire
Days Vessels
Total Off-
hire Days Vessels Total Off-hire Days
Liquefied Gas - Consolidated 1 31 - - 1 32 - - 2 63
LPG Equity Accounted 2 10 2 94 2 48 - 8 6 160
LNG Equity Accounted - - - 8 1 25 1 39 2 72
3 41 2 102 4 105 1 47 10 295
March 31, 2017 (A) June 30, 2017 (A) September 30, 2017 (A) December 31, 2017 (A) Total 2017 (A)
SegmentVessels
Total Off-hire
DaysVessels
Total Off-hire
DaysVessels
Total Off-hire
DaysVessels
Total Off-hire
DaysVessels
Total Off-hire
Days
Liquefied Gas - Consolidated 1 48 1 34 - - 1 24 3 106
LPG Equity Accounted - - - - - - 1 24 1 24
LNG Equity Accounted - - 1 24 1 24 - - 2 48
1 48 2 58 1 24 2 48 6 178
March 31, 2018 (E) June 30, 2018 (E) September 30, 2018 (E) December 31, 2018 (E) Total 2018 (E)
