teddington, middlesex, twii olwpublications.npl.co.uk/npl_web/pdf/cmam74.pdf · mass comparators s...
TRANSCRIPT

NPL Report CMAM 74
Final Report -Project 1.2.8Investigate Thermal Influence on Weights and on
Mass Comparators
S Davidson and G Peattie
Centre for Mechanical and Acoustical MetrologyNational Physical Laboratory
Teddington, Middlesex, TWII OLW
M Buckley and D Palmer
South Yorkshire Trading Standards UnitChapeltown, Sheffield, S35 3XX
ABSTRACT
The following report summarises the work carried out on Project 1.2.8 -Investigate ThermalInfluence on Weights and on Mass Comparators. 62 organisations were surveyed to ascertainthe types of problems they had experienced on thermal instability and its effects onweighing. Following the conclusions from the survey the proposed content for a GoodPractice Guidance Note was drawn up, and laboratory measurements on manual andautomatic comparators were investigated.

NPL Report CMAM 74
INTRODUCTION1 1
2 BACKGROUND 1
SURVEY3 2
4 LABORATORY MEASUREMENTS 3
4.1 Data from the Automated Mass Metrology System (AMMS) on the effects oftemperature/stabilisation times for manual calibrations of weights 3
4.2 Measurement to determine best place for measuring temperature in manual balances 44.3 Thermal stability of typical manual balances, and measurement of temperature
distribution in the weighing chamber of such equipment 54.4 Effects of calibration staff, including stabilisation time, use of gloves, long tweezers etc
to minimise thermal instability 74.5 Recommendations on use of pseudo-thermal generators to give good thermal
performance 84.6 Use of auto zero, internal calibration cycles etc in manual balances and comparators 84.7 Measurements to examine best practice in design of balance cases for manual
measurements 94.8 Thermal stability of larger weights >50 kg 104.9 Examination of the thermal stability of automatic balances 114.10 Laboratory design suggestions to give good thermal performance 14
5 16
16161617171717171819192122
CORRECTIONS FOR AUTOMATIC MASS COMPARATORS
5.1 Introduction5.2 Techniques for measurement of thermal gradients
5.2..1 Anemometry5.2.2 Thermal imaging5.2.3 Micro PRTs5.2.4 Thermistors5.2.5 Thermocouple arrays
5.3 Selection of measurement technique5.4 Differential thermocouple arrays5.5 Measurement technique5.6 Measurements5.7 Established model5.8 Relationship of apparent mass difference with change in absolute temperature
CONCLUSION6 24
ACKNOWLEDGEMENTS7 25
8 REFERENCES 25
9 26
263437
APPENDICES
9.1 Appendix 1: Survey questionnaire9.2 Appendix 2: Organisations providing a response to the survey questionnaire9.3 Appendix 3: Good Practice Guidance Note

NPL Report CMAM 74
1
INTRODUCTION
This report summarises the work carried out as part of the NMS Mass Programme,1999-2002 Project 1.2.8. The project was carried out by the National Physical Laboratory(NPL) in collaboration with the South Yorkshire Trading Standards Unit (SYTSU) inresponse to an invitation from DTI National Measurement System Policy Unit (NMSPU) toinvestigate thermal influence on weights and mass comparators (Dll ITT no. MPU 8/60.3).
The aims of the project were to:.Establish a technique for measurement of thermal gradients within a balance weighing
chamber that does not modify the ambient conditions in which it is used. Thetechnique will be used to measure thermal gradients within a range of automatic andmanual comparators;
.Correlate thermal measurements with weighing data and produce mathematicalalgorithms for the modification of weighing data according to the thermal instabilityof the balance and the configuration of the artefacts being compared;
.Disseminate information to balance manufacturers and end users regarding GoodPractice Guidance Note in the design and usage of automatic and manual masscomparators to minimise the cause and effect of thermal instability.
The report:.Discusses the results of a survey of manufacturers and end users of mass comparators
and high accuracy balances regarding the causes of thermal instability and theireffects on weighing accuracy;
.Describes laboratory experiments designed to investigate the thermal instabilitiesbrought about by different methods of operating and using mass comparators;
.Outlines the content of a proposed Good Practice Guidance Note;
.Discusses the thermal gradient measurement techniques that have been investigated;
.Summarises the experimental work carried out in the project and the conclusionsdrawn.
2 BACKGROUND
Thermal gradients, which can arise from a number of sources, are a cause of instability andpossible error in the results obtained from both manual and automatic mass comparators.Thermal gradients cause eddy currents to be set up in the air within the balance case. Thesecurrents affect the apparent mass of the weight applied to the balance pan. At best theseeffects will result in poor balance performance shown by a worse repeatability or standarddeviation. At worst they can introduce a systematic error in the results, which is not obviousfrom the balance performance and is therefore not accounted for in the uncertainty budget.
The effect of thermal gradient on weights and mass comparators is of increasing significanceto mass metrology with the growing use of electronic mass comparators and their increasingresolution and performance. Results from automatic comparators are particularly sensitive tothermal effects as they generally have very high resolution (the most accurate giving 1 part in109). This, combined with the mechanism required for weight exchange, can lead to problemsof thermal instability. The large amounts of data these comparators are capable of generating
1
NPL Report CMAM 74
draws attention to their sensitivity to thermal effects both in the short and long term. Theproblems seen with automatic mass comparators are further exacerbated when comparingweights of different material (e.g. platinum iridium and stainless steel) or different shapes(standard OIML shaped weights with pure cylindrical weights, spheres, air density artefactsand pressure balance components).
3 SURVEY
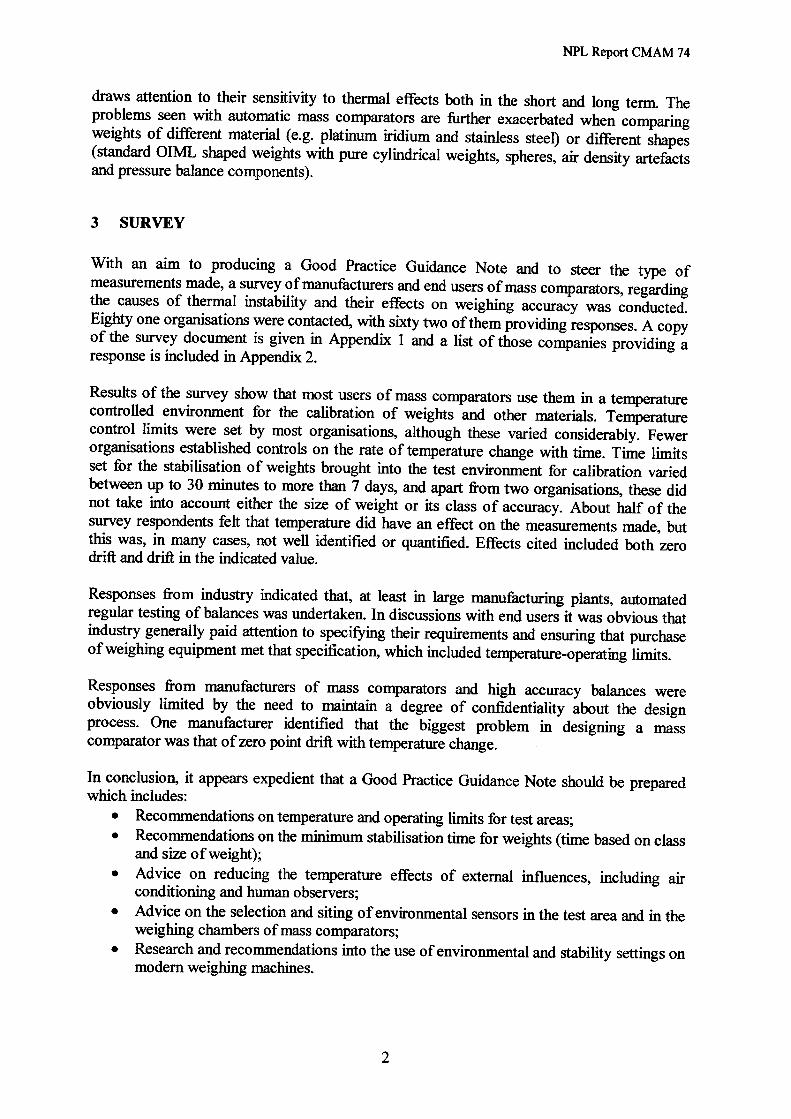
With an aim to producing a Good Practice Guidance Note and to steer the type ofmeasurements made, a survey of manufacturers and end users of mass comparators, regardingthe causes of thermal instability and their effects on weighing accuracy was conducted.Eighty one organisations were contacted, with sixty two of them providing responses. A copyof the survey document is given in Appendix I and a list of those companies providing aresponse is included in Appendix 2.
Results of the survey show that most users of mass comparators use them in a temperaturecontrolled environment for the calibration of weights and other materials. Temperaturecontrol limits were set by most organisations, although these varied considerably. Fewerorganisations established controls on the rate of temperature change with time. Time limitsset for the stabilisation of weights brought into the test environment for calibration variedbetween up to 30 minutes to more than 7 days, and apart from two organisations, these didnot take into account either the size of weight or its class of accuracy. About half of thesurvey respondents felt that temperature did have an effect on the measurements made, butthis was, in many cases, not well identified or quantified. Effects cited included both zerodrift and drift in the indicated value.
Responses from industry indicated that, at least in large manufacturing plants, automatedregular testing of balances was undertaken. In discussions with end users it was obvious thatindustry generally paid attention to specifying their requirements and ensuring that purchaseof weighing equipment met that specification, which included temperature-operating limits.
Responses from manufacturers of mass comparators and high accuracy balances wereobviously limited by the need to maintain a degree of confidentiality about the designprocess. One manufacturer identified that the biggest problem in designing a masscomparator was that of zero point drift with temperature change.
In conclusion, it appears expedient that a Good Practice Guidance Note should be preparedwhich includes:
.Recommendations on temperature and operating limits for test areas;
.Recommendations on the minimum stabilisation time for weights (time based on classand size of weight);
.Advice on reducing the temperature effects of external influences, including airconditioning and human observers;
.Advice on the selection and siting of environmental sensors in the test area and in theweighing chambers of mass comparators;
.Research and recommendations into the use of environmental and stability settings onmodem weighing machines.
2

NPL Report CMAM 74
4 LABORATORY MEASUREMENTS
Following the conclusions of the survey and the proposed content of a Good PracticeGuidance Note, laboratory measurements on manual and automatic comparators wereinvestigated. The work included:
.Analysis of data from the SYTSU Automated Mass Metrology System (AMMS) onthe effects oftemperature/stabilisation times for manual calibrations of weights;
.Introductory measurements to determine best place for measuring temperature inmanual balances;.Investigating thermal stability of typical manual balances, and measurement oftemperature distribution in the weighing chamber of such equipment;.Study of the effects of calibration staff, including stabilisation times, use of gloves,long tweezers etc. to minimise thermal instability;.Making recommendations on the use of psuedo-thermal generators (e.g. light bulbs inplace of calibration staff);.Investigating the use of auto zero, internal calibration cycles etc in manual balancesand comparators;.Making measurements to examine best practise in design of balance cases for manualmeasurements;.Investigating the thermal stability of larger weights (i.e. greater than 50 kg);.Examining the stability of automatic balances;.Making suggestions on laboratory design to give good thermal performance.
4.1 Data from the Automated Mass Metrology System (AMMS) on the etTects oftemperature/stabilisation times for manual calibrations of weights
In 1997 the South Yorkshire Trading Standards Unit installed a data information system in itsmass calibration laboratories. The Automated Mass Metrology System (AMMS) provides afull environmental monitoring facility, with temperature measurements being madethroughout the calibration area and at every balance or mass comparator in routine use; dataon air pressure and humidity levels are also collected by the system at regular intervals. Thesystem is designed to monitor each environmental sensor at approximately one minuteintervals, day and night, seven days a week.
Data from AMMS on effects of temperature/stabilisation times for manual calibrations ofweights has been analysed for the past three years. This data covers many thousands ofmeasurements both in the calibration laboratories and in other areas where lower grademeasurements are made. Recommendations taken from this data are summarised in the GoodPractice Guidance Note in Appendix 3.
The data gathered and analysed from the AMMS is also used to provide much of the otherrecommendations outlined in the following sections.
3

NPL Report CMAM 74
4.2 Measurement to determine best place for measuring temperature in manualbalances
Although there are many temperature measuring devices available for measuring thetemperature within a balance or mass comparator, some are considered more practical thanothers. Traditional temperature measuring devices such as mercury-in-glass thermometershave the advantage of being cheap to purchase and calibrate and usually display long-termstability, with little drift between successive calibrations. There are however two distinctdisadvantages to this type of thermal sensor: a) they are difficult to interface with datahandling equipment, and b) they are usually calibrated in a vertical orientation, which canmake them difficult to incorporate in a balance case where it may be easier to lay thethermometer down.
Consequently two types of temperature sensors are now generally used in massmeasurements:.Platinum resistance thermometers (PRTs);.Thermistors.
PRTs, nominally 100 0, are used as reference thermometers in calibration equipment.Typically the sensor is enclosed in a metal or glass sheath of 10 mrn to 20 mrn in length.Sensitivity is excellent, but the sensor must be mounted in a metal block if the effects of self-heating are not to be significant. A resistance bridge is used to convert the measured value inohms to temperature units (OC). For high accuracy, a reference resistor is required so that theresistance bridge can then be used as a comparator.
Thermistors are generally less accurate than PRTs, but by careful choice of the sensor andannual calibration a high degree of precision and repeatability with time can be achieved.Thermistors with exposed beads are the best choice, as they have lower thermal inertia andquicker response, but care must be given to mounting if they are not to be damaged throughstrain. In some applications a thin metal sheath can be used to protect the last few millimetresof connecting cable.
In undertaking measurements to determine the best place for measuring temperatures inmanual balances, the SYTSU used a series of thermistors mounted inside metal cylinders10 mm in diameter and 20 mm long to ensure that the temperature being measured was asnear as possible to that of the weights being calibrated (in previous experiments it was foundthat a bare thermistor was highly susceptible to localised heating and to stray temperaturegradients caused, for example, by passing of an operator's hand close to the temperaturesensor). The choice of thermistors over PRTs was partly made by their ready availabilitywithin the laboratory, but cost is also a significant consideration, with PRTs costingconsiderably more to buy than thermistors. All of the thermistors had previously beencalibrated in-house with a typical uncertainty of:l:6 InK (k=2).
Measurements were made on a selected range of balances and mass comparators (from microbalances to high capacity balances). Sensors were installed outside of the balance case and inseveral places within the weight chamber. Sensors were also directly mounted on metalblocks of similar materials and size as the weights to be calibrated on that balance.
In general, measurements made on balances and mass comparators of weighing capacitiesexceeding 200 g indicated that when used in a test area dedicated to weighing, with good
4

NPL Report CMAM 74
temperature stability and little variation from 20 °C, measurements were probably best madewith a single sensor (thermistor) installed in the centre back of the balance case. Providingthat there was no local heat source adjacent to the wall of the balance, temperatures measuredat this point were generally within 0.01 °C of the temperature of the weights being used in thecalibration.
Balances and mass comparators of a capacity 200 g or less were much more susceptible tolocal heating caused by motorised doors, the presence of transformers or the movement of anoperator's hand near to the temperature sensor which caused variations in the recordedtemperatures in parts of the balance case which did not represent the temperature of theweights being calibrated. Placing a sensor outside the weighing chamber to the rear of thebalance seems to give a temperature value, which is in closer agreement with the temperatureof the weights. However, there are exceptions to this general rule and it is evident that for thehighest accuracy a temperature profile of the balance or mass comparator is necessary usingmultiple sensors at the location it is used.
4.3 Thermal stability of typical manual balances, and measurement of temperaturedistribution in the weighing chamber of such equipment
Measurements have been made and data analysed to establish the thermal stability of typicalbalances used for calibrating weights. Obviously, the thermal stability of a balance or masscomparator will be influenced by the temperature stability of the calibration area in which itis located. For high precision measurements, the test area should ideally have a temperatureof 20 °C :!: 0.5 °C, with a stability being maintained within 0.1 °C or 0.2 °C during an eighthour period. It is important that temperature stability is maintained during the working dayand night time, as well as weekends or public holidays. For measurements made to lowerprecision (above Fl) the temperature of the test area might be in the range 15 °C to 27 °C,although the thermal stability over an eight hour period should, if possible, be maintainedwithin 2 °C (ideally 0.5 °C).
Within the limits suggested above, most balances and mass comparators will exhibit areasonable degree of thermal stability, providing simple precautions are maintained:
1. They are left on or in electrical standby mode at all times.2. They are not in the path of any direct air currents from air conditioners.3. The balance operator weight handling recommendations outlined in Section 4.4
are followed.
It is also important that both the reference weights and test weights are located in the testarea, either in the weighing chamber or, when this is not practical, adjacent to the balance fora sufficient time beforehand to facilitate good thermal stability of the weights. Stabilisationtime recommendations are given in the Good Practice Guidance Note in Appendix 3.
A graphical example of the temperature distribution investigated on a Sartorius C5Smicrobalance is given in Figure 2. The position of the probes is indicated in Figure 1.
~
NPL Report CMAM 74
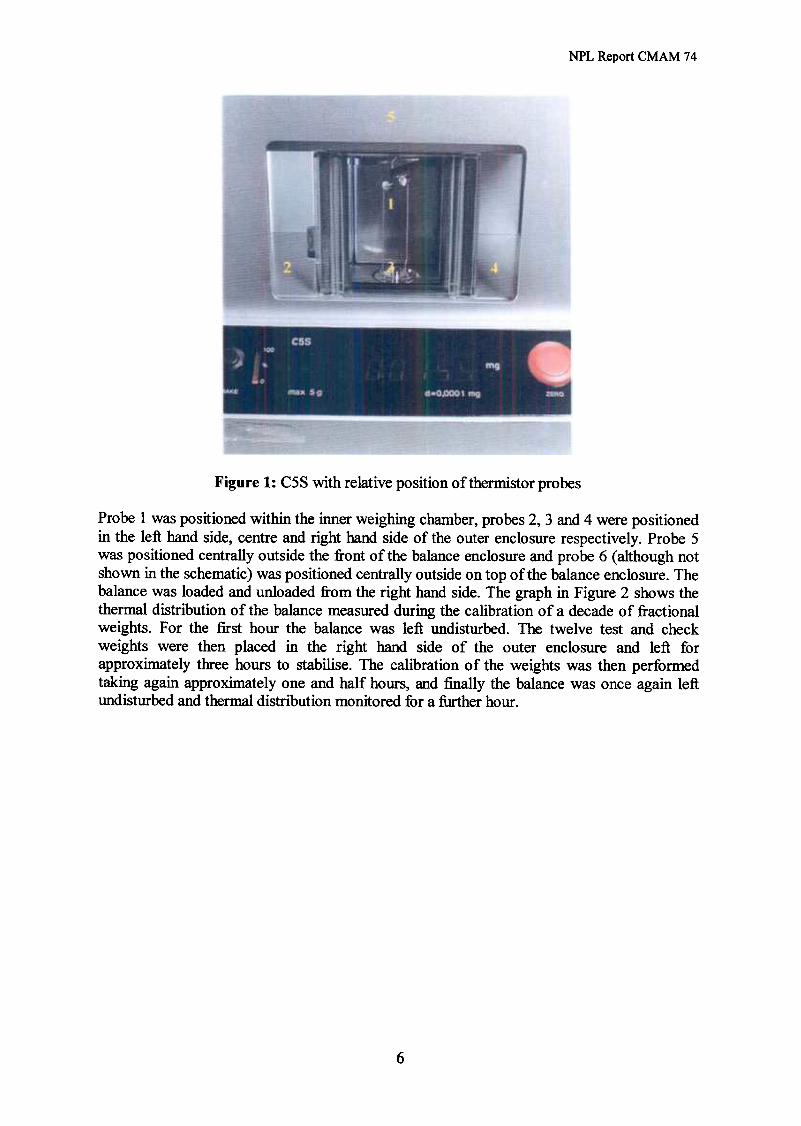
Figure 1: C5S with relative position of thermistor probes
Probe I was positioned within the inner weighing chamber, probes 2,3 and 4 were positionedin the left hand side, centre and right hand side of the outer enclosure respectively. Probe 5was positioned centrally outside the front of the balance enclosure and probe 6 (although notshown in the schematic) was positioned centrally outside on top of the balance enclosure. Thebalance was loaded and unloaded from the right hand side. The graph in Figure 2 shows thethermal distribution of the balance measured during the calibration of a decade of fractionalweights. For the first hour the balance was left undisturbed. The twelve test and checkweights were then placed in the right hand side of the outer enclosure and left forapproximately three hours to stabilise. The calibration of the weights was then performedtaking again approximately one and half hours, and finally the balance was once again leftundisturbed and thermal distribution monitored for a further hour.
6
NPL Report CMAM 74
24.00
23.80
23.60
23.40(J! 23.20
23.00
22.80
22.60
22.40
22.20
22.000
§N
8a)0~
time (seconds)
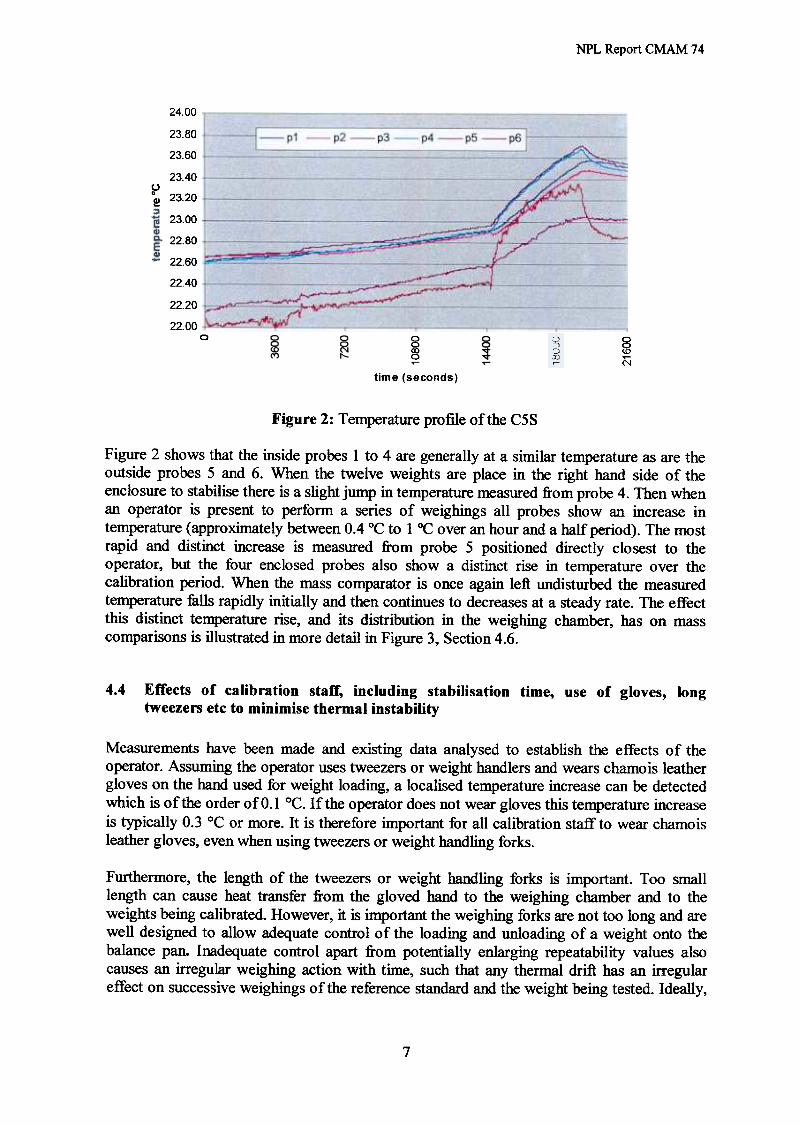
Figure 2: Temperature profile of the C5S
Figure 2 shows that the inside probes 1 to 4 are generally at a similar temperature as are theoutside probes 5 and 6. When the twelve weights are place in the right hand side of theenclosure to stabilise there is a slight jump in temperature measured from probe 4. Then whenan operator is present to perform a series of weighings all probes show an increase intemperature (approximately between 0.4 °C to 1 °C over an hour and a half period). The mostrapid and distinct increase is measured from probe 5 positioned directly closest to theoperator, but the four enclosed probes also show a distinct rise in temperature over thecalibration period. When the mass comparator is once again left undisturbed the measuredtemperature falls rapidly initially and then continues to decreases at a steady rate. The effectthis distinct temperature rise, and its distribution in the weighing chamber, has on masscomparisons is illustrated in more detail in Figure 3, Section 4.6.
4.4 Effects of calibration staff, including stabilisation time, use of gloves, longtweezers etc to minimise thermal instability
Measurements have been made and existing data analysed to establish the effects of theoperator. Assuming the operator uses tweezers or weight handlers and wears chamois leathergloves on the hand used for weight loading, a localised temperature increase can be detectedwhich is of the order of 0.1 °C. If the operator does not wear gloves this temperature increaseis typically 0.3 °c or more. It is therefore important for all calibration Staff to wear chamoisleather gloves, even when using tweezers or weight handling forks.
Furthermore, the length of the tweezers or weight handling forks is important. Too smalllength can cause heat transfer from the gloved hand to the weighing chamber and to theweights being calibrated. However, it is important the weighing forks are not too long and arewell designed to allow adequate control of the loading and unloading of a weight onto thebalance pan. Inadequate control apart from potentially enlarging repeatability values alsocauses an irregular weighing action with time, such that any thermal drift has an irregulareffect on successive weighings of the reference standard and the weight being tested. Ideally,
7

NPL Report CMAM 74
the tweezers should be of suitable length to allow the operator to load and unload the balancepan without their hand entering the weighing chamber.
Experiments are reported in Section 4.5 on the use of pseudo-thermal generators to stabilisethe temperature in the weighing area when the operator is not present. However, it is notedthat the effects of a calibration operator can sometimes be seen as an increase in temperatureof the weights being tested if temperature sensors are not well located, see Section 4.2:thermal effects can be measured when an operator's hand passes near the temperature sensorwhen weights are loaded on and off the balance pan. Likewise, a temperature sensor locatedin line with the operator may detect localised thermal effects caused by the operator'sbreathing or body heat.
4.5 Recommendations on use of pseudo-thermal generators to give good thermalperformance
The use of pseudo-thermal generators such as light bulbs has been used in the calibration areato maintain temperature stability, switching on and off to compensate for the presence of theoperator. In some laboratories using a 60 watt or 100 watt light bulb as pseudo-thermalgenerators, this technique can achieve improvements in thermal stability. The presence of ahuman operator can increase the temperature where the balance or mass comparator issituated by 1 °C or more (see Figure 2) the use of a light bulb can reduce this initialtemperature rise to perhaps half. However it is recommended that the user experiments forthemselves as each situation will need individual assessment. However, based onmeasurements made over a limited period it was not felt that, under the laboratory conditionsexperienced, any practical benefit was to be gained by using pseudo-thermal generators,when compared with the use of suitable weighing techniques and good mass measurementpractice.
4.6 Use of auto zero, internal calibration cycles etc in manual balances andcomparators
Balances can be fitted with auto-zero devices that automatically re-zero the balance when ithas drifted from zero by a specified number of digits. Sometimes the operator may set thislevel of drift. But on some balances it is factory set. However, the auto-zero facility canusually be turned on or off by the operator.
In assessing the effectiveness of the auto-zero facility, measurements were made using thebalance or mass comparator both for direct reading (such as might occur when undertakinglower grade measurements or calibrating volume measures or pipettes gravimetrically) andfor comparison measurements.
It is recommended that the use of auto zero should be:.Switched off-for comparison weighings;.Switched off -for direct reading weighings when a correction is made for the zero
reading before and after the weighing;.Switched on -for direct reading weighings when only the loaded balance reading is
taken.
8

NPL Report CMAM 74
For comparison weighings the selection of a symmebic weighing scheme such as ABA orABBA will eliminate any drift due to temperature. The use of the auto zero function maycause a discontinuity in these readings and therefore an error in the measured weightdifference.
For direct weighings, recording zero readings and monitoring the change in the zero cancorrect any drift due to temperature effects.
If the balance is used intermittently the auto-zero facility should be enabled, as this willprovide a more accurate measurement for a single weighing when only the loaded value ofthe balance reading is recorded. However if zero readings are also being recorded the autozero facility should be disabled.
When a balance or mass comparator is first used after a period of inactivity (e.g. overnight orafter a break), several preliminary weighings are essential to ensure that the initial rise intemperature brought about by use and the presence of an operator has a minimum effect onthe results of the calibration process. Exercising the balance will also have a beneficial effecton the repeatability of reading. It is estimated that a minimum of three up to maximum of fiveABA or ABBA cycles (equating to a period of approximately 10 minutes) are needed tominimise drift when the balance is fJrst used after a period of inactivity exceeding 30minutes. This procedure will negate the period of rapid temperature gain illustrated inFigure 3, when the balance will not give repeatable readings (t = 20 to t = 30 minutes).
23.40
23.20-Ut-II...~-IV...IICo
EII
I-
23.00
22.80
2260
22.40
22.20
0 20 40 60 80 100 120 140
Time (minutes)
Figure 3. Drift in balance temperature due to presence of user.
4.7 Measurements to examine best practice in design of balance cases for manualmeasurements
Following on from work conducted in Section 4.3, tests were carried out on a variety ofbalances and mass comparators to exan1ine whether improvements were possible in thedesign of balance cases and mass comparator housings. As a result of many measurementsmade it was possible to identify potential improvements.
9

NPL Report CMAM 74
Where possible, all transformers, display units and door motors should be removed from thebalance housing and located outside the immediate weighing area. In the case of motoriseddoors, consideration should be given to ensuring that the motors generate as little heat aspossible, the doors are capable of manual operation if required, and can easily be adjusted.On more than one third of balances surveyed it was found that doors were not a good fit,leaving gaps at the edges, or did not close smoothly, causing vibrations to be transmitted tothe weighing cell. Many weighing machine manufacturers offer the option of remoteelectronics -balance users should have this option fitted wherever possible. Likewiseadditional or secondary housing are sometimes available from the weighing machinemanufacturer.
Mass comparators fitted with weight handlers or alternators for automatic calibration ofweights should be designed so that motors do not give off excessive heat into the weighingchamber. In some cases rises of more than 1 °C were measured when the weighingprogramme was started and the weight handlers commenced motion. In some cases,particularly for weights of20 kg and above, this temperature rise led to potential instability ofthe mass value for several hours, even when weights were initially located close by in theweighing chamber. It is recommended that pre-runs be used to stabilise the temperature.
It was noted that thermal glass was fitted to some balances and mass comparators,particularly of capacities of 200 g and less. This was designed to reduce the effect of heatgenerated by the balance user. However, it should be checked that the thermal shields areinstalled the correct way round.
Where it is not possible to install a balance or mass comparator in an ideal location,consideration should be given to installing insulation to avoid effects of temperature changescaused by adjacent wall or windows which are at different temperatures, or from thermaleffects caused by lighting or air conditioning.
Thermal stability of larger weights >50 kg4.8
Measurements have been made to ascertain the time taken for larger weights of mass greaterthan 50 kg to achieve thermal stability.
Weights of solid stainless steel, cased weights made of stainless steel with an inner core oflead, and painted cast iron weights were all measured. Stabilisation times have beenestablished and are listed in the Good Practice Guidance Note in Appendix 3. As a generalrule weights of the highest accuracy may need to be located in the calibration laboratory forseveral days to achieve thermal equilibrium, particularly if transported to the calibrationlaboratory at a temperature significantly different from that at which they will be tested. Thefigures given in Table 2 of the Appendix 3 represent the acclimatisation times for weights ofdefined class. The times are defmed as the time taken for a weight to change from atemperature differing from the reference temperature by :i:5 °C to a temperature within halfthe values specified in Table 1 for a particular class and size of weight. For example a 1 kg E2weight should be left to acclimatise for a period of 6 hours to reach a thermal stability withinO.25°C of the balance temperature.
Measurements were made on some stainless steel weights which are of cased construction -they have an outside case of stainless steel, with a central core of lead, covered by a stainless
10

NPL Report CMAM 74
steel plate welded to the inside of the case. It has been known that these weights areparticularly susceptible to changes in air pressure (as well as surface corrosion due to thequality of stainless steel often used in the manufacture of these weights). Compared with astainless steel weight, which is of an integral construction, these weights generally took about60 % longer to achieve initial thermal stability. They also displayed a greater susceptibility tothermal or pressure drifts (generally remaining stable in laboratory conditions only to 1 ppmor greater).
In the case of cast iron weights, problems arise from corrosion of the surface of the weight,from dirt accumulated in defects on the surface and from the ingress of moisture into theweight adjustment chamber. However, measurable changes can occur when a weight isbrought into the calibration area off a vehicle particularly when the ambient temperature ismore than 5 °C different from the calibration temperature. It is suggested that at least fortyeight hours should elapse after the weights are brought into the calibration environmentbefore testing commences. Furthermore, it is recommended that the value is not reported toan uncertainty of better than 50 ppm (ideally 100 ppm) due to changes which may occurwhen the test weight has been or is exposed to significant changes of temperature and
humidity.
4.9 Examination of the thermal stability of automatic balances
The thermal stability of four automatic mass comparators Sartorius CIOOOS and CIOOOOS,Mettler HKIOOOMC and ATIOOO5 and the Metrotech 'A' series robot balances have beeninvestigated. All have delayed start and pre-run as options in their control software andrecommendations on the use of these options in order to minimise thermal problems are
suggested.
The problem of initial temperature rise in the enclosure of the C10000S mass comparator and, A' series robot balances fitted with weight handlers or alternators for automatic calibration
of weights has been discussed already in Section 4.7. In both automatic comparators androbot balances it was found that the location of the motors used for interchanging thereference standards and the weights under test caused an initial increase in the temperature ofthe weighing chamber by up to 1.3 °C. Ahhough it is not difficult to make measurementswhen temperatures are above the initial stabilisation temperature, the first weighings must notbe used in the fmal mass calculations (despite the use of trend eliminating symmetricweighing schemes). The fIrst weighings may be subjected to excessive thermal drift, whichmay not be the same for the reference standard and the test weight. This is particularly true ifthe test weight has not been located in the calibration area for an adequate length of time, oris perhaps of different materials or of a different construction to the standard.
Figure 4 shows the ATlOOO5 weighing chamber with two spheres (solid density artefacts)being calibrated against two stainless steel OIML shaped standards and the relative positionsof the eight thermistor probes. Figure 5 shows the temperature profile of the weighing before,during and after the calibration of these artefacts.
For the ATIOOO5 and HKIOOO automatic comparators the weight handler motor and controlelectronics are separated from the weighing chamber and connected across an air gap. Thisgap limits the effect of initial heating, however it is still of the order of 0.04 °C/hour as can beseen in Figure 5.
I

NPL Report CMAM 74
Figure 4: ATIOOO5 with relative position of thermistor probes.
24
23.9
23.8
23.7(J0 23.6
23.5
23.4
23.3
23.2
23.1
230
Figure 6 shows a rise in temperature of approxinlately 0.6 °C during the calibration, or theactivation of the automatic weight handler, and a distinct fall in temperature once thecalibration (or use of the weight handler) has ceased. This temperature rise equates to a driftin the measured mass difference of approxinlately 300 ~g. Using the measured temperature in
12

NPL Report CMAM 74
the balance enclosme the drift in the balance reading can be corrected. Algorithms for thesecorrections are given in Section 5.8.
OIML vs Sphere
296.524
296.423.8
P 23.6~:J
~ 23.4Q)D-E~ 23.2
23295.8
295.722.8~ ~ I'-. 0 (t) <0 m N 1{) a) ~ ~ I'-. 0 (t) <0 m
~~~ ~NNN(t)(t)(t) ~~~~
Weighing Series
Figure 6: Correlation between weighing data and temperature form A TI 0005
The C 1 0008 also has a temperature stability problem. The comparators weight handler motorand control electronics are housed above the weighing chamber, but the weighing cell andassociated electronics are housed directly below the weighing chamber. It has been observedthat there is a localised heating effect or hot spot in the weighing chamber of the order of+0.2°C to +O.3°C above the ambient temperature in the balance enclosure. This hot spot hasthe effect of influencing the temperature of the artefacts during their stabilisation period; suchthat one is hotter than the other or others. Once the weight handler is activated this hot spot iscancelled out as it then affects each of the artefacts equally. However, until the period ofthermal equilibrium is reached between the artefacts being compared, the first few series ofweighings will need to be discarded. In this case the thermal equilibrium between the ambienttemperature and all the weights being compared will be better than 0.1 °C. The inequality intemperature between the weights can be overcome by the use of pre runs or by modifying thecontrol software to rotate continually the weight handler carousel during the delayed startperiod. In general 2 to 4 pre-runs will be necessary. Preliminary weighings should be ignoredif their results are more than three times the standard deviation of the normal balance
performance.
In making measurements using the CIOOOOS repeatability was found to be 42 J.Lg. Aluminiumcylindrical cans were manufactured to sit over the top of the reference and test weights. Thecans were open at the bottom. Using these covers produced significant improvement inperformance with repeatability reduced to less than 10 J.Lg. Investigations suggest thatperformance is improved because the effect of localised drafts caused by rotation of theweights by the handler is eliminated by covering the weight with aluminium cans, illustratedin Figure 7. Reducing the speed of rotation can improve performance, but the use of thesecans is recommended as the preferred method when calibrating weights. As a result of thesetests, similar measurements were made on other balances, such as the ATIOOO5. Althougheach balance showed some improvement in repeatability when used with aluminium cans
13

NPL Report CMAM 74
placed over the weights, the performance improvement seen in the case ofClOOOOS was notnecessarily achieved to the same degree on other mass comparators.
Figure 7: Aluminium cylindrical cans used on the C 1 00008 as individual draft shields
In both automatic comparators and robot balances it is possible to calibrate a sequence ofseveral weights, one after the other (e.g. 1 v 2, 1 v 3, etc.). This is especiallysignificant in the case of the' A' series robots where a large number of test weights may belocated on the weight storage racks. When calibrating weights in such a sequence, weight 1will be used in both of the fIrst two comparisons (against 2 and then agafust 3), but in thesecond comparison weight 3 may initially be at a slightly different temperature because it wasnot used in the first comparison. The calibration officer must consider this when using thesoftware, and it is recommended that a few weighings at the start of every comparison shouldbe treated as preliminary weighings. In most cases one or two ABA or ABBA weighings maybe discarded, but as the size of the weight increases then the number of weighings, which arediscarded, must also be increased, as larger weights take longer to achieve thermal stability.Preliminary weighings for each series should be ignored if their resuhs are more than threetimes the standard deviation of the normal balance performance.
It is recommended that two temperature measuring probes (taking an average) are used. Eachplaced on opposite sides of the weighing chamber, positioned such that they are in the samevertical plane as the artefacts being weighed.
4.10 Laboratory design suggestions to give good thermal performance
Temperature instability in laboratories may arise from:
The presences of heat or cold arising from windows, heating pipes and through thetransmission of heat through the walls caused by processes taking place in other adjoiningrooms;
.14
NPL Report CMAM 74
..
The location of heat sources in equipment located in the calibration area, includingcomputers and monitors weight handlers and other ancillary equipment;The effect of lighting. The choice of luminaries can have a significant effect on thelaboratory environment. Fluorescent lighting is probably best, and for good stabilityshould be left on at all times;The presence of human operators, who generate heat and create air turbulence andtemperature instability through movement.
.
In a perfect world, a calibration laboratory should probably be located away from traffic andindustry in a specially constructed facility set deep into the ground for good thermal stability.A number ofNMIs and some industrial calibration laboratories have been constructed in thismanner. However, for most organisations this simply is not possible and good laboratoryconstruction can give good thermal stability.
Where the mass laboratory has an outside wall it is suggested that this be provided withadditional insulation and perhaps with a secondary internal wall up to 300 mm inside theroom. Windows, ifprovided at all, should be double or triple glazed (with double glazing anda single secondary window located at least 100 mm inside). The aim of this additionalinsulation and the provision of a large air gap is to minimise the effects of externaltemperatures on the calibration process.
Internal walls should also be fitted, if this is possible, with an additional wall of at least 100mm thickness on the inside, with the gap between the walls filled with insulation. Asecondary door system should be installed to give an air lock between the outside area andthe mass laboratory.
In spite of all the additional insulation installed around the adjoining walls, it is possible thatthe temperature of the walls may be different from that of the remaining calibrationlaboratory. It is therefore recommended that balances and mass comparators be installed onbalance tables situated away from any vertical surface.
It is not absolutely necessary for the laboratory to be air conditioned but it is very importantto maintain the laboratory temperature within the stability limits recommended in The GoodPractice Guidance Note Appendix 3, if the effects of temperature instability are to be lessthan 10% of the overall uncertainty on the weighing. Where air conditioning is inStalled, theeffects of temperature and pressure variations must be carefully considered. It isrecommended that the air conditioner does not blow directly into the calibration room. Ifpossible arrange for the conditioned air to be blown into an upper ceiling. Air in the upperceiling is then allowed to enter the main measurement area through perforated ceiling panelsfitted with filier material. This reduces the pressure effect of forced air from the airconditioner directly affecting the balances or mass comparators. Air is drawn directly fromthe calibration laboratory back into the air conditioner. Measurements within the calibrationlaboratory area will enable adjustments to be made to the fan speed and thermoStat settings ofthe air conditioner to give a uniform but not excessive supply of conditioned air within thecalibration room. Measurements should be made throughout the full area of the calibrationroom to ensure an even distribution of stable air -any instability may be rectified by thepositioning of deflectors within the upper ceiling or by the addition of extra filter materialabove the perforated ceiling panels. Temperature measurements should specifically be madeat the positions where the balances will be located to ensure maximum thermal Stability.
15

NPL Report CMAM 74
Heat ftom motors for mass comparator weight handlers and ftom computers can be reducedby careful choice of the equipment and its location. Where this is not possible heat ftomcomputers and similar equipment can be ducted to outside.
There will be some thermal gain from the presence of human operators. Psuedo-thermalgenerators may be used to compensate for this (see Section 4.5). If this recommendation isfollowed it is still necessary to carry out some prelirnillary weighings when the calibrationprocess commences (see section 4.6). In a well regulated environment it is suggested thatgood thermal stability can be attained without the use of thermal generators. There must, ofcourse, be a limit to the number of humans in the calibration area at anyone time. This limitis probably around one operator for each 3 -4 m3. Sensible positioning of the inlet andextraction points for the air conditioning will mean that air flow can be channelled to guidethe thermal effect of balance users away from the balance.
Taking precautions against heat sources and following the above recommendations shouldensure a thermal stability within the calibration area spread over several hours of better thanO.l°C.
CORRECTIONS FOR AUTOMATIC MASS COMPARATORS5
5.1 Introduction
It is difficult to measure thermal gradients within a balance enclosure without modifying thethermal conditions with the measuring devices. Even the simple measurement of airtemperature is difficult due to its low thermal inertia and the potential for local heating due tomeasurement devices such as platinum resistance thermometers. PRT's produce aself-heating effect due to their measurement current. In order to measure effectively thethermal gradients within a balance, the temperature distribution over a relatively small areaneeds to be determined. This not only requires a number of sensors in close proximity to eachother (and having no interactive effect) but also a resolution to the milli-kelvin level, astemperature variations will be very small. The response time of the temperature sensors usedis an important consideration, due to the transient nature of the thermal gradients. Thetechniques that have been considered for these measurements include: anemometry, thermalimaging, use of small PRT's, thermistors and thermocouple arrays. Their advantages anddisadvantages are discussed.
5.2 Techniques for measurement of thermal gradients
5.2.1 Anemometry
Laser Doppler Anemometry is a widely accepted tool for fluid dynamic investigations ingases and liquids. It is a well-established technique that gives information about flowvelocity, which could be related to air convection or thermal gradients. Its principle anddirectional sensitivity make it more suitable for applications where physical sensors aredifficult or impossible to use. Unfortunately it would not be able to resolve small flow
16

NPL Report CMAM 74
velocities associated with air convection in a weighing chamber. It also requires tracerparticles in the flow.
Them1al imaging
Thermal imaging detectors are quick, easy to use devices for measuring temperaturevariances. They detect infrared energy radiated from an object whose temperature is above0 K. However, they cannot be used to measure air temperature. Light-weight metallic targetscould be spatially arranged within the weighing chamber and used to characterise thetemperature variances. Such targets would, however, modify the airflow. Also the detectorwill not work through glass therefore for practical use the weighing chamber door wouldneed to be left open thus modifying the weighing conditions. In addition, all but the mostexpensive detectors still only have a resolution of hundreds of mK.
5.2.3 Micro PRTs
Micro PRTs are inexpensive easy to buy off the shelf items. They provide the resolutionrequired to measure thermal gradients (milli-kelvin level). They are, however, difficult tospatially arrange in order to cover the areas of interest within the weighing chamber and theyalso generate a self-heating effect due to their measurement current, although to a muchlesser extent than standard PRT's. Even micro PRT's have a relatively high thermal inertiaand therefore a relatively slow response time.
Thermistors
Thermistors are generally less accurate than PRTs, but by careful choice of the sensor andannual calibration a high degree of precision and repeatability with time can be achieved.Thermistors with exposed beads are the best choice, as they have lower thermal inertia andquicker response, but care must be given to mounting if they are not to be damaged throughstrain. The resolution is generally limited to 10 InK.
Thermocouple arrays
Thermocouples are the most widely used temperature sensor in test and measurement work.Accurate temperature measurements can be made at low cost with ordinary digital voltmetersand in-house built probes. Although of limited accuracy when used as absolute temperaturemeasuring devices, thermocouples can be used to measure temperature differences to theresolution required across the areas of interest within the weighing chamber. Using thin wireand the low resistive nature of the metals used to make thermocouples means they have avery quick response time. Again, however, they are quite difficult to spatially arrange.
Selection of measurement technique
Existing research data shows that temperature differences between an artefact and the balancechamber modifies the apparent mass of the artefact. According to previous work [1] these
17

NPL Report CMAM 74
changes are not buoyancy or sorption effects and have been directly related to free convectionair currents and corresponding viscous forces or thermal gradients. This data is based ontheoretical considerations and mass measurements. We intend to use the thermocoupletechnique to test this theory and provide a model for air convection based on thermalgradients within the weighing chamber and the influence it has on mass measurements.
5.4 Differential thermocouple arrays
Type T (copper-constantan) differential thermocouple arrays were used in the measurementof thermal gradients in the balance enclosures. Each Type T junction has an output of about40 Il V /K at ambient temperature. Therefore using a digital voltmeter with a resolution ofIIlVa 10junction array (five-differential thermocouple) was required to resolve the thermalgradients to approximately 5 InK. Figure 8 shows two schematics, one of the 10 junctionarray construction and the other of its spatial arrangement, with the five differentialthermocouples arranged with a planar spacing of an approximately 20 mm gap.
DVM
CopperConstantan
DVM
Figure 8: Arrangement of a 10 junction array (five-differential thermocouple)
18

NPL Report CMAM 74
5.5 Measurement technique
Three 10 junction arrays were placed in the weighing chamber adjacent to the weighingcradle. Figure 9 shows a schematic of the weight carousel with a pair of air density artefacts(bobbin and hollow) and the relative positioning of the thermocouple arrays.
Figure 9: Positioning of the thermocouple arrays in the weighing chamber
5.6 Measurements
The thermal gradient problems seen in automatic comparators are known to increase whencomparing weights of different material (e.g. platinum iridium and stainless steel) or differentshapes (standard OIML shaped weights with pure cylindrical weights, spheres and air densityartefacts). The arrangement of three 10 junction thermocouple arrays shown in Figure 9 wasused to measure the thermal gradients when weighing these artefact combinations of differentshapes and different materials.
The measured thermal gradients for a pair of air density artefacts (bobbin v hollow) is shownin Figure 10 The measurements show that the differential temperature (or thermal gradient)always rises along the vertical surface of the artefact being weighed. With the rate of change,or gradient of the slope, fluctuating with time. The measured output from the three arraysgive temperature differentials in the range of approximately 8 mK to 11 mK. With the arrayat the top, Array 1 showing the most variation in differential temperature. This fluctuation indifferential temperature follows a similar pattern to the variation in the absolute temperaturemeasured in the weighing enclosure using a PRT. This was seen to be the case whencomparisons involving weights of different material or different shape were investigated.
19

NPL Report CMAM 74
Bobbin v Hollow
3:01 7:50 12:39 17:28 22:18
Time of day
3:09 8:01 12:53
Figure 10: Measured output from differential thermocouple arrays for comparison of abobbin and hollow air density artefacts
Figure 10 shows the differential temperature measurements made in the weighing chamberwhen comparing a pair of air density artefacts.
20
NPL Report CMAM 74
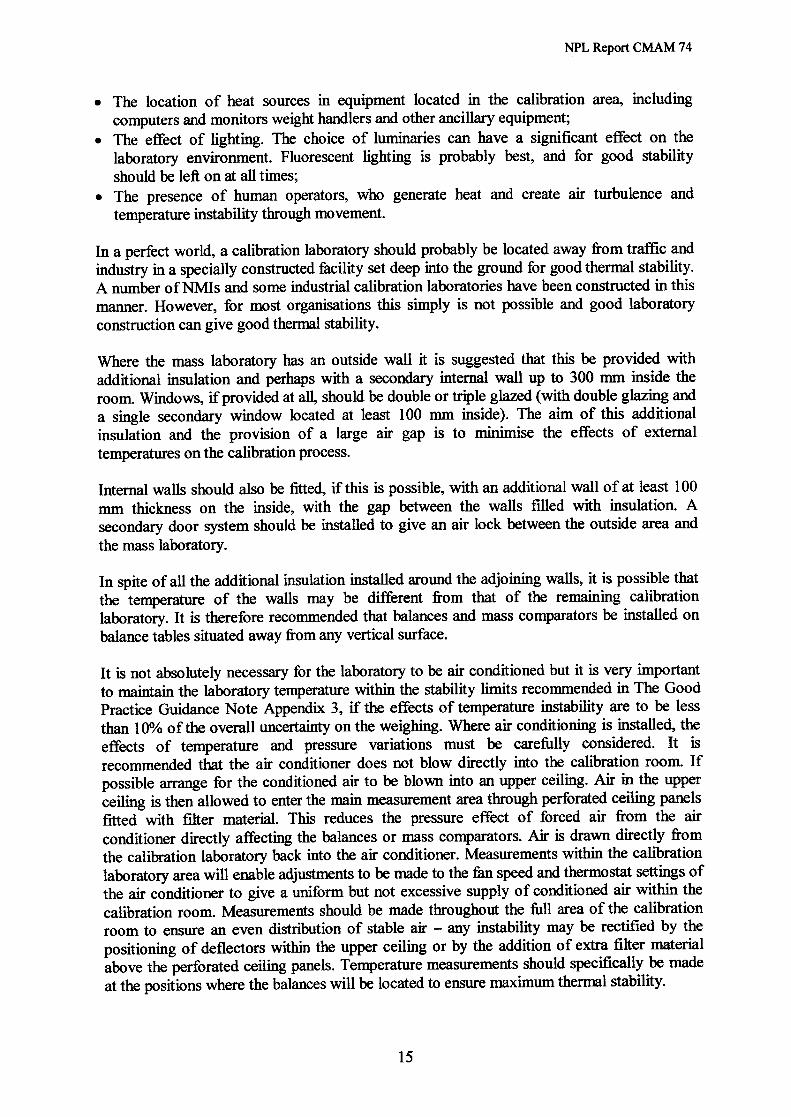
Established model5.7
The established theoretical model proposed by Glaser t [2], states that the thermal gradients
which are set up in the balance enclosure, when comparing weights which are at a differentabsolute temperature to the weighing enclosure, follow a path shown in Figure 11. It has alsobeen calculated that the apparent mass change observed when comparing weights in thisenvironment can be directly related to the viscous air flow along the vertical surface of theweight. The measurements carried out in this project have corroborated these proposals.
Figure 11: Model of convection currents set up in the weighing chamber
t EUROMET Project No. 395. "Convection effects in mass calibration due to temperature differences or gradients".Working documents. Presentations of participants on 18 February 1998 in Oslo (or before).
21
NPL Report CMAM 74
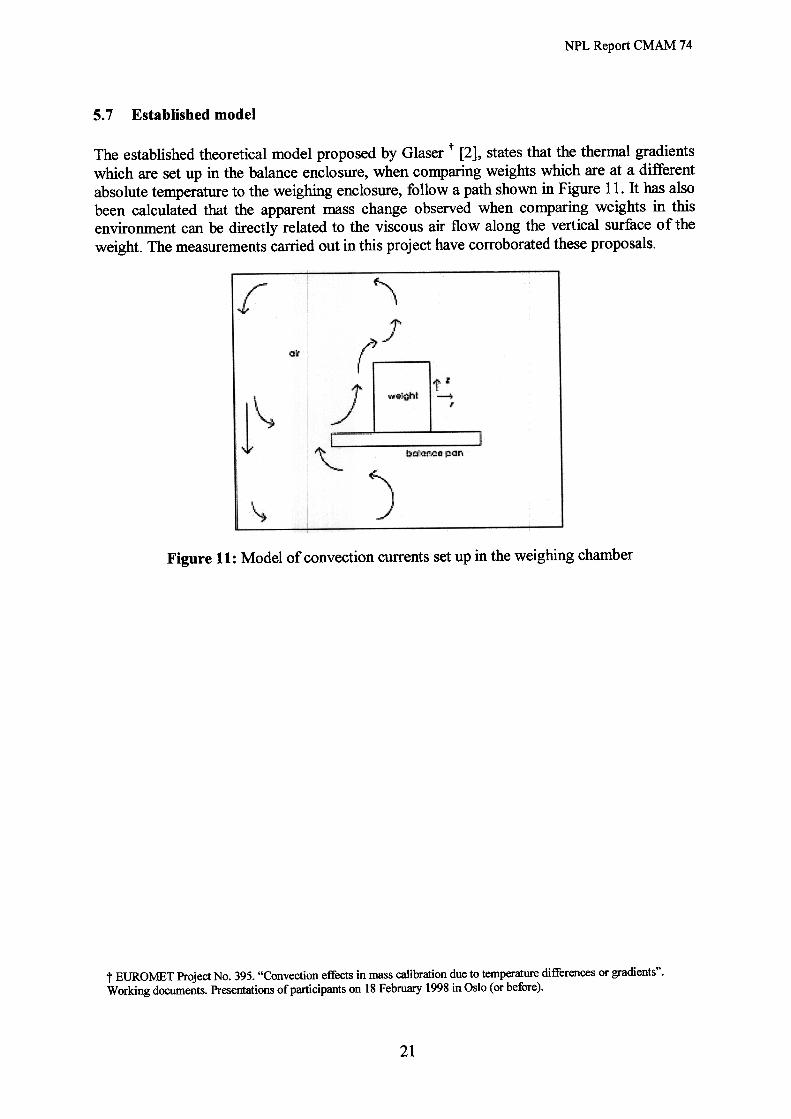
5.8 Relationship of apparent mass difference with change in absolute temperature
Changes in measured mass difference have been related to the viscous air flow along thevertical surface of the artefact being weighed. This air flow has been measured using thedifferential thermocouple technique. These measurements have shown that the variation indifferential temperature along this surface follows a similar trend to the absolute temperaturechange within the balance enclosure. Figure 12 shows the change in absolute temperaturewithin the balance enclosure and the apparent mass change for the same comparison of a pairof air density artefacts (bobbin v hollow) that were used for the thermocouple measurementsin Figure 10.
Bobbin v Hollow
23
22.8
U 22.6~!.; 22.4..GICo
~ 22.2I-
22
21.80 5 10 15 20 25 30 35
Time (hours)
Figure 12: Variation with time of both the absolute measured temperature and the measuredmass difference
Figure 12 shows that the variation in the apparent mass difference follows a very similarvariation to the absolute temperature with a slight temporal offset. Correcting for this leadtime brings the two graphs into alignment, shown in Figure 13.
22

NPL Report CMAM 74
Lead Time Corrected
-118.2623
-118.28
22.8-118.3
"OJ
-118.32 .§.
22
-118.4221.835 4020 25
Time (hours)
300 5 10 15
Figure 13: As Figure 8 after correcting the difference for the lead time offset
This time corrected graph can then be used to nomtalise the apparent mass difference knownto result from the viscous air flow using the absolute temperature change measured using aPRT. The corrected mass difference and measured temperature are related by the following
general equation:
(1)M=mI
Where:.....
Mi is the corrected mass difference in mg for comparison i;mi is the measured mass difference in mg for comparison i;T A is the average measured temperature in °C over the period of calibration;Ti is the measured temperature in °C for comparison i;c is the correction factor in °C fig-I.
Figure 14 shows the above comparison (bobbin v hollow) corrected for temperaturevariations using four values for the correction factor c. The correction factor required to bestnormalise the weighing data to the fluctuating temperature was c = 750 °C mg-l. Thiscorrection factor had little effect on the average mass differemce for the comparison,however, it reduced the standard deviation of the comparison by a factor of approximately3 from 28.5 ~g to 9.1 ~g.
23

NPL Report CMAM 74
Correction Factors
Figure 14: Measured mass difference corrected for temperature variation using differentvalues for the correction factor c
Unfortunately, there is no common correction factor for each combination of different shapesand different materials compared. Each set of weighing data is unique and must be treated assuch. However, data collected has shown that the correction factor c has a positive sign forthe weighing configurations shown in Table 1. The arrangement of the weighing equationshows that the artefact with the greater continuous vertical surface is always on the right handside for c to have a positive value.
Weighing Eguations
HollowOIMLOIMLOIML
!!:1m
!!:1m
!!:1m
!!:1m
++++
Bobbin =PtIr =
Cylinder =Sphere =
Where Am is the absolute mass difference betweenthe two artefacts compared
Table 1: Weighing equation for each combination of different shapes and different materials
6 CONCLUSION
The examples and recommendations given in this report are a product of the practical workcarried out on this project and the extensive experience and knowledge both NPL andSYTSU have of mass metrology and its associated problems. The information given here isnot considered comprehensive, but includes examples of good mass measurement practice.Other working practices may exist which fall outside the criteria for this study, or which maysimply not have been considered during this project. Finally, the findings of this report aresummarised in Appendix 3 in the Good Practice Guidance Note.
24

NPL Report CMAM 74
7 ACKNOWLEDGEMENTS
The authors would like to thank the many organisations that contributed to the survey.Without their help and comments, the project would have lacked a considerable amount ofvaluable information.
Thanks also to the National Physical Laboratory's Thermophysical Properties Group for theiradvice and extensive assistance on the measurement of thermal gradients.
8 REFERENCES
[1] Glaser M. Do J. Y. "Effect of Free Convection on the Apparent Mass of 1 kg MassStandards". Metrologia, 1993,30,67-73.[2] Glaser M. "Change of the Apparent Mass of Weights Arising from TemperatureDifferences". Metrologia, 1999, 36, 183-197.
25

NPL Report CMAM 74
APPENDICES9
Appendix 1: Survey questionnaire9.1
26

THE NATIONAL F'HYSICAL LABORATORYSOUTH YORKSHIRE TRADING STANDARDS UNIT
JOINT PROJECT TO STUDY THE PROBLEMS OF THERMAL
INSTABILITY Al'rD ITS EFFE<=T ON WEIGHING
This survey is part of a project funded by the Department of Tradeand Industry and being carried out jointly by the National PhysicalLaboratory and the South Yorkshire Trading Standards Unit to carryout an investigation into thermal influences on balances andproduction of technical report quantifying the effect. A user guidewill be produced recommending test practice.
We will not identify individual answers to particular companies inthe report that will be published. However, your full and frankanswers, comments and advice will be much appreciated as it will helpus to prepare a user guide to help those who need to make weighingsas part of their business.
telephone survey, you can also submit writtenAll information will be of value.
Alth,ough this is acomments if you wish
If you would prefer us to call back at a different time or on adifferent day we can do so.
Once the project is completed the results of our researches and ourrecommendations will be published. If you would like to receivedetails please let us know.
For further enquiries please contact:National physical Laboratory, Teddington, Middleses TWll OLW
Tel: 020 8943 6224 Fax: 020 8943 6458South Yorkshire Trading Standards Unit, Thorncliffe Lane, Chapeltown,
Sheffield S35 3XXTel: 0114 246 3491 Fax: 0114 240 2536

FAX BACK ON 0114 240 2:536
SURVEY ON THERMAL PROBLEMS IN WEIGHING
Name of Company:
Address:
Postcode
Contact Person:
Telephone:
Fax:
Date of Survey:
EQUIPMENT AND ITS trSE
Do you manufacture mass comparators or high accuracy balances?1
0 Yes 0 No
Do you use mass comparators or high accuracy balances?2
0 Yes 0 No
If the answer to both questions 1 and 2 is no then go toquestion 25.
What sort of weighing equipment do you use:
3.
NUMBER OFTHIS TYPE
CAPACITY READABILITYMAKE MODEL NUMBER
Please continue on a separate sheet if needed
What do you use this equipment for?4
[]
Calibrating weights[] Other calibrations (give details)[] Weighing precious metals[] Weighing pharmaceuticals[] Other purposes (give details) ...
How do you use your weighing equipment. As a direct readingdevice or do you make comparison weighings?
5.
[]
Comparison weighings0 Direct reading
Where do you use this equipment?6.
[]
In a calibration laboratory

000
In a general laboratoryOn the shop floorOther (give details)
TEMPERATURE
7 Is the place where the equipment is used temperaturecontrolled?
0 Yes 0 No
If the answer to question 7 is yes go to question 8, otherwisego to question 9.
8 Can you tell me something about the temperature controls?
8 (a) What are the temperature limits? maximumminimum
8(b) Do you limit the rate of temperature change with time?
0 Yes 0 No
If the answer to question 8(b) is yes go to question 8(c),otherwise go to question 9.
8 (c) What limits do you put on the temperature change with time?(For example: at not more than 0.5 °C h-1)
details
9 Do you measure the temperature:
D NoD No
In the roomInside the balance
DYesDYes
If the answer to question 9 is yes go to questio~ 10, otherwisego to question 11.
10.
What equipment do you use to measure the temperature?
Platinum resistance thermometerThermistorThermocouplesMercury-in-glass thermometerOther (give details)
11 Do you see any temperature effects in the weighings that youmake?
DYes 0 No
If the answer to question 11 is yes go to questi~n 12,otherwise go to question 13.

In what way does the temperature affect the weigfuing results?12
000
Causes measurement errorsCauses a lack of repeatabilityOther (give details)
Please give as much detail as possible if the answer to theabove questions is yes.
WHAT ARE YOU WEIGHJCNG
What do you generally weigh?
13.
0 Test weights0 Solids0 Liquids0 Powders
Please give details of the materials or objects that you weigh.
14.
Are the materials that you weigh all of the same composition?
15.
0 No0 Yes

Do you weigh items of different shapes?16
0 Yes 0 No
Please give additional information where available
YOUR BALANCE OR MASS COMPARATOR
If you have several weighing machines please answer the followingquestions in relation to the majority of your balances or masscomparators.
Do you normally leave the balance connected to the electricitysupply at all times?
17.
0 Yes 0 No
When your balances are connected to the mains electricity, doyou leave it in the standby mode (if fitted) when you are notusing them for weighing?
18.
0 Yes 0 No
Does some or all of your balances have a calibration cycle'19
0 Yes D No
If the answer to question 19 is yes to go question 20otherwise go to question 22.
[] Internal [] External [] Both internal and external
20 Does the calibration cycle use an internal or an externalcalibration weight?

21 How often do you use the calibration cycle?
Before every weighingL Each day before I start weighing!::; Each week0 Each month0 I do not use the calibration cycle
Give additional information where available
22. When weighing, do you use any handling equipment?
D No
DYes I use TweezersWeight forksOther (give details)
23 When weighing, do you wear gloves on your hands?
0 No
0 Yes 000
I use Chamois leather glovesCotton glovesOther (give details)
24. Do you allow a stabilisation time before starting weighing?
D No
DYes I allow Up to 30 minutesUp to 2 hoursUp to 12 hoursUp to 24 hoursUp to 7 daysMore than 7 days
(Give additional details where available)

25 Thank you for taking part in this survey. Is there any otherinformation you can give which might help us?
26 Would you like to receive a copy of the Good Practice Guide?
DYes D No
27 If you would also like to send written comments please do soWe would appreciate it if you would send any comments by theend of September 2000.

NPL Report CMAM 74
Appendix 2: Organisations providing a response to the survey questionnaire9.2
34

Aberdeen City, Aberdeenshire and the Moray Councils Mass Calibration LaboratoryAbsolute Calibration LimitedALSTOM Gas Turbines Ltd, ALSTOM Energy Technology CentreAntech Engineering LtdBestobell Service, A division of Meggit Mobrey LtdBG Technology Calibration LaboratoryCardiff Metrology ServicesCleveland Metrology and Calibration CentreDaco Scientific LtdDartec Ltd Calibration FacilitiesDenison Mayes GroupDERADevon Metrology LaboratoryDH"Budenberg Gauge Co Ltd, Budenberg Pressure Standards LaboratoryDurham County Council Metrology LaboratoryEssex County Council Metrology ServicesEuropean InstrumentsFife Council Trading Standards ServiceFurness Controls LimitedGlasgow City Council Calibration and Test CentreGlaxo Operations UK Ltd (Barnard Castle)Glaxo Operations UK Ltd (Ware)H & D Fitzgerald LtdHampshire Scientific Services Calibration CentreHertfordshire Metrology LaboratoryHumitec LtdInstrument Services LtdJames ScottJohnson Controls Calibration LaboratoriesKent Scientific ServicesLaboratory of the Government ChemistLeicestershire County Council Trading Standards ServiceLittlebrook Power Services LtdLondon Borough of Brent Trading Standard ServicesLondon Borough of Have ring Trading Standards ServicesLondon Borough of Sutton Trading Standards ServicesMarconi Marine (VSEL), Barrow Calibration CentreMetrotec Engineering AGMettler-Toledo LtdMidlothian Council Metrology LaboratoryNational Physical Laboratory Mass and Density StandardsNational Weights and Measures LaboratoryNorfolk County Council Trading Standards DepartmentNorthern Ireland Trading Standards ServicePressurements LimitedRAPRA Technology LimitedSartorius LimitedScotia Instrumentation IJimitedSheffield Assay OfficeS I Pressure Instruments Ltd

SIRA Test and Certification LtdSoil MechanicsSolartron -Transducer Standards LaboratorySouthend on Sea Borough Council Trading Standards ServiceSouth Yorkshire Trading Standards Unit8t Helens Metrological LaboratorySuffolk County Council Trading Standards LaboratoryHenry Troemner IncTyne & Wear Trading Standards Joint Committee Metrology LaboratoryUniversal Calibration LaboratoriesWarwickshire County Council Trading Standards DepartmentWest Yorkshire Calibration Laboratory

NPL Report CMAM 74
9.3 Appendix 3: Good Practice Guidance Note
37

THERMAL EFFECTS ON BALANCES AND WEIGHTS
Introduction
The information given ill this Guidance Note includes recommendations of good massmeasurement practice and should not be considered a comprehensive mass metrology guide.Other working practices may exist which fall outside the criteria for this text, or which simplyhave not been considered for inclusion in this Guidance Note.
Laboratory Environment
Temperature instability in mass laboratories arises from sources of heat or cold such as
Windows, heating pipes and the transmission of heat from adjacent rooms;
Equipment located in the calibration area -computers, monitors, weight handlers etc.;
Effect of lighting;
Air-conditioning;Human operators, who generate heat and create air turbulence.
In a laboratory envkonment, good thermal stability can be achieved by considering the
following:
Insulation of outside walls with the possible addition of a secondary internal wall;
Windows, if provided at all, should be double or triple glazed;A secondary door to give an air lock between the mass laboratory and the outside;
Mass comparators should, where possible, be installed away from vertical surfaces;
If installed, consider the delivery and extraction of air from air-conditioning units.
Recommended temperature limits and stability ranges for mass laboratories are given inTable 1.
Temperaturelimit(°C)
18 to 22 18 to 22 17 to 23 16 to 25 5 to 27
Temperaturestability
(8 hours) (°c)
50.2 0.5 1.0 2.0
Table 1: Recommended laboratory temperature limits and stability ranges

Selection and Siting of Environmental Sensors
Many temperature measuring devices are available for measuring the temperature within abalance or mass comparator. Three of the most common types of device used are:
.Platinum resistance thermometers (PRTs);
.Liquid-in-glass thermometers;
.Thermistor probes.
PRTs are used as reference thermometers in calibration equipment. Sensitivity and accuracyat the InK level is achieved, but the sensor should be mounted in a metal block if the effectsof self-heating are not to be significant. A resistance bridge is required to convert themeasured value in ohms to temperature units (OC), thereby making the entire apparatus
expensive.
Liquid-in-glass thermometers have the advantage of being cheap to purchase and calibrateand usually display long-term stability, with little drift between successive calibrations. Theyare however, difficult to interface with data handling equipment, and they are usuallycalibrated in a vertical orientation, which can make them difficult to incorporate in a balancecase where it may be easier to lay the thernlOmeter down.
Thermistor probes are a good compromise, providing versatility of use and goodmeasurement uncertainty. Thermistors with exposed beads are the best choice, as they havelower thermal inertia and therefore quicker response.
Sensors should be mounted within the balance enclosure in the same horizontal plane as theartefacts being calibrated. Figure 1 shows a close up picture of an exposed bead thermistorprobe protected by a thin metal sheath (typically 10 mm diameter and 20 mm long) and thenan example of this probe positioned inside a balance enclosure.
Figure 1: Thermistor probe and its siting in a balance enclosure
Manual Mass Comparators
Manual mass comparators have thermal stability problems associated with their transformersand display units. Where possible these should be removed from the balance housing andlocated outside the immediate weighing area. In the case of motorised doors, considerationshould be given to ensuring that the motors generate as little heat as possible. The doorsshould be capable of manual operation if required, and easily adjusted. Doors should bechecked for a good fit avoiding gaps at the edges. Secondary housing, either from themanufacturer or custom made, can help to improve thermal stability.
Automatic Mass Comparators
Automatic mass comparators have thermal stability problems associated with the weighthandler control motors. These motors have a heating effect, which can raise the temperatureof the weighing environment by up to I °C on commencing the automatic weighing sequence.Awareness of this heating effect and suitable use of the delayed start and pre-run options inthe control software can help to minimise the effects on the weighing data.
Balance Settings
Most modem electronic balances have settings for local environmental conditions such asvibration or the type of weighing application being carried out. However, in practice neitherof these settings has any effect on elimination of errors due to thermal drift or thermalinfluences.
The auto-zero setting automatically re-zeros the balance when it has drifted from zero by aspecified number of digits. It is recommended that the use of auto zero should be:
.Switched off-for comparison weighings;
.Switched off -for direct reading weighings when a correction is made for the zeroreading before and after the weighing;
.Switched on -for direct reading weighings when only the loaded balance reading istaken.
The balance should always be connected to the power supply in standby mode so that thermalequilibrium is established in the balance. However, if this is not possible the balance shouldbe switched on for a minimum of 1 hour before use.
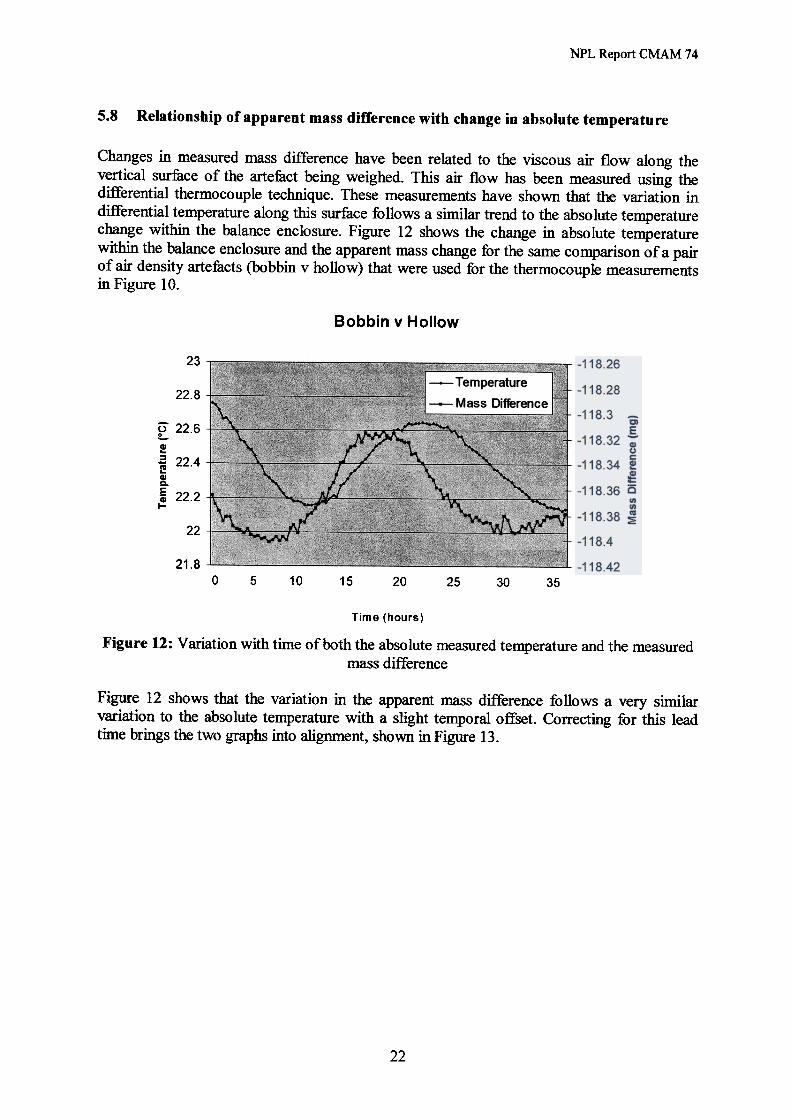
Weight Handling
The presence of human operators inevitably influences the temperature stability of theweighing environment and the weights. The use of chamois leather gloved hands and suitablehandling equipment can help to minimise this effect. Figure 2 shows three examples ofloading a mass standard onto a weighing pan. The third example is recommended; using a
gloved hand, which does not enter the weighing enclosure. Handling and loading of a massstandard in this way will help to minimise the thermal influence the operator.
Ungloved hand, potentialheat transfer to weight and
balance enclosure.
Operators hand enters thebalance enclosure affecting
the thermal stability.Recommended practice.
Figure 2: Examples of incorrect and correct weight handling
Note: Where possible the weight handling equipment should be of a suitable length to allowthe operator to load the mass comparator without their hand entering the weighing chamber,whilst still maintaining a good degree of handling stability.
Stabilisation Times
Before commencing any weighing, all the weights to be used must have had the opportunity toreach thermal equilibrium with the balance environment. The required acclimatisation time willdepend on the size of the weight and the difference between the temperature in the balance case andthe temperature in which the weights have previously been stored. Table 2 gives suggestedminimum acclimatisation times.
1 000 kg
100 kg
10kg1 kg
100g
10919
<1
7
3
21
4824
126
32
2
1
3618
9
4
22
1
1
2412
6
321
10.5
21
Table 2: Recommended minimum temperature stabilisation times (in hours)
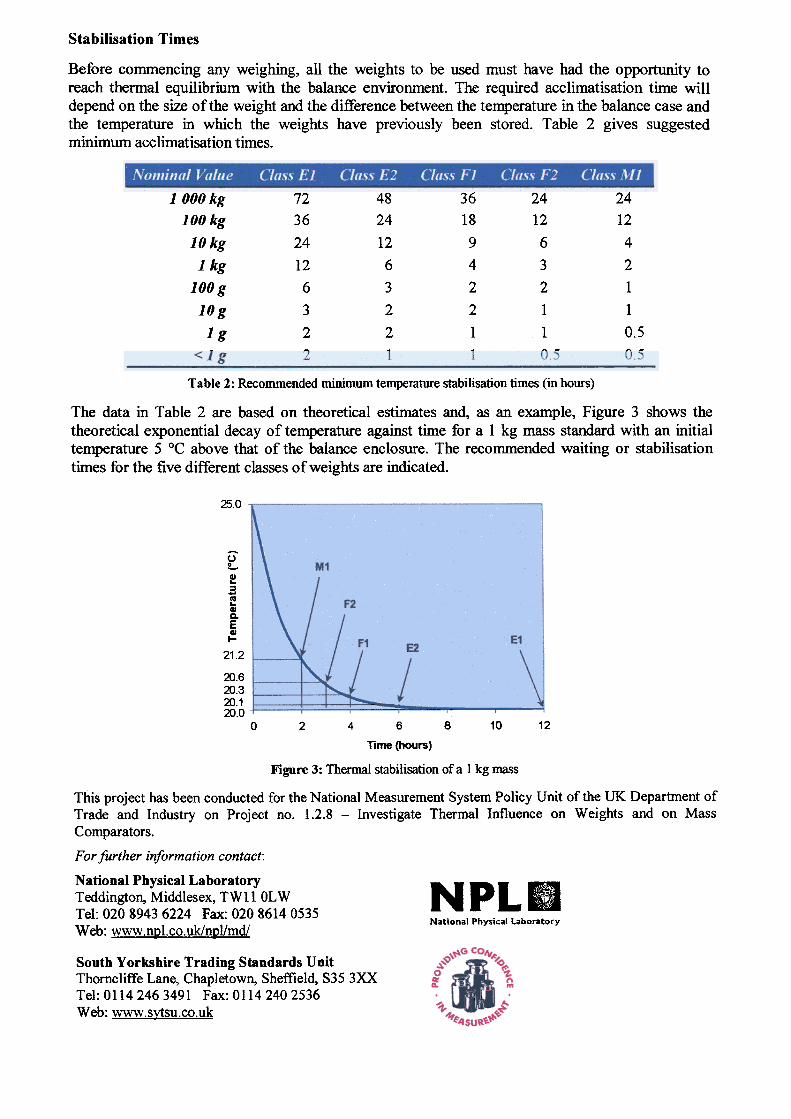
The data in Table 2 are based on theoretical estimates and, as an example, Figure 3 shows thetheoretical exponential decay of temperature against time for a 1 kg mass standard with an initialtemperature 5 °C above that of the balance enclosure. The recommended waiting or stabilisationtimes for the five different classes of weights are indicated.
25.0
u~GI...~...IV...GID-
EGI
I-
21.2
20.620.320.120.0
0 122 4 6 8 10
Time (hours)
Figure 3: Thermal stabilisation of a 1 kg mass
This project has been conducted for the National Measurement System Policy Unit of the UK Department ofTrade and Industry on Projec:t no. 1.2.8 -Investigate Thermal Influence on Weights and on Mass
Comparators.
For further information contact:
National Physical Laboratory N PL " Teddington, Middlesex, TWll OL W ..
Tel: 020 8943 6224 Fax: 020 8614 0535 N . I Ph . I L b tatlona yslca a ora ory
Web: www.ngI.co.uk/ngI/md/
South Yorkshire Trading Standards UnitThorncliffe Lane, Chapletown, Sheffield, S35 3XXTel: 0114 246 3491 Fax: 0114 240 2536Web: www.s,ytsu.co.uk
2
6
4
2
6
32
2
42
4
2
11O.O.
55