protocol for establishing and maintaining the calibration...
TRANSCRIPT
No. 93
Protocol for Establishingand Maintaining theCalibration of MedicalRadionuclide Calibratorsand their Quality Control
A NATIONAL MEASUREMENT
GOOD PRACTICE GUIDE
6302 GPG 93 25/5/06 4:56 pm Page 1

The DTI drives our ambition of‘prosperity for all’ by working tocreate the best environment forbusiness success in the UK.We help people and companiesbecome more productive bypromoting enterprise, innovationand creativity.
We champion UK business at homeand abroad. We invest heavily inworld-class science and technology.We protect the rights of workingpeople and consumers. And westand up for fair and open marketsin the UK, Europe and the world.
This Guide was developed by the NationalPhysical Laboratory on behalf of the NMS.
6302 GPG 93 25/5/06 4:56 pm Page 2
Measurement Good Practice Guide No. 93 Protocol for Establishing and Maintaining the Calibration of Medical Radionuclide Calibrators and their Quality Control
Prepared by a joint working party composed of representatives from the following:
Institute of Physics and Engineering in Medicine
Ionising Radiation Metrology Consultants Ltd
National Physical Laboratory
R GADD (1) (Chairman), M BAKER (2) (Secretary), K S NIJRAN (3), S OWENS (4), W THOMSON (5), M J WOODS (6) and F ZANANIRI (7)
(1) University Hospital of North Staffordshire, Stoke-on-Trent, Staffordshire, ST4 7LN (2) National Physical Laboratory, Teddington, Middlesex, TW11 0LW (3) Hammersmith Hospitals NHS Trust, London, W12 0HS (4) North Western Medical Physics, Christie Hospital, Manchester, M20 4BX (5) Sandwell and West Midlands Hospital Trust, Birmingham, West Midlands, B18 7QH (6) Ionising Radiation Metrology Consultants Ltd, Teddington, Middlesex, TW11 0LW (7) Bristol General Hospital, Bristol, Avon, BS1 6SY ABSTRACT Guidance is given on the quality controls that should be undertaken on a routine basis for medical radionuclide calibrators to ensure the accuracy and traceability of measurements of the activities of radiopharmaceuticals. Sources of error and magnitudes of associated uncertainties are discussed.
© Crown Copyright 2006 Reproduced by permission of the Controller of HMSO
ISSN: 1368-6550
May 2006
National Physical Laboratory
Teddington, Middlesex, United Kingdom TW11 0LW
Website: www.npl.co.uk

FOREWORD This Good Practice Guide describes the use of radionuclide calibrators for the measurement of radionuclides used in medical practice and how all measurements made using these systems can be traced to primary measurement standards held at the National Physical Laboratory (NPL). Accurate measurements and their traceability to primary standards together with a documented quality assurance programme are requirements of both the Ionising Radiation Regulations, 1999[1] and the Ionising Radiations (Medical Exposures) Regulations, 2000 [2]. In 1992, the Institute of Physical Sciences in Medicine (IPSM) addressed the issue of Quality Standards in Nuclear Medicine and published their recommendations in IPSM Report No. 65, Chapter 5 [3]. This section of the report was produced by a joint Working Group, comprising members of IPSM and NPL, which dealt specifically with the establishment and maintenance of the calibration of medical radionuclide calibrators and their quality control. Since then, new measurement needs have arisen and commercially available calibrators have been improved and upgraded. It was agreed that the original recommendations should be revised and updated accordingly. The Institute of Physics and Engineering in Medicine (IPEM) and the NPL established a further Working Group in 2001 to revise the existing guidelines and to produce a good practice guide for users of radionuclide calibrators in hospitals. The recommended procedures are intended for use in busy hospital departments and should not add appreciably to the existing workload. The emphasis has continued to be simple, robust and reliable procedures. The revision comprises two chapters. Chapter 1 includes most of the existing procedures whilst Chapter 2 provides more detailed descriptions of, and justifications for, the procedures together with relevant examples of possible sources of error and the typical uncertainties associated with them.


i
Contents Quality Assurance & Quality Control Procedures ........................ 1
1.1 Introduction ..................................................................................................................2 1.2 Principles of Traceability .............................................................................................3 1.3 Procedures for Quality Control ....................................................................................5
1.3.1 High Voltage ..........................................................................................................6 1.3.2 Display ...................................................................................................................6 1.3.3 Zero Adjust.............................................................................................................6 1.3.4 Background............................................................................................................6 1.3.5 Check Source (Relative Response).........................................................................6 1.3.6 Accuracy ................................................................................................................7 1.3.7 Repeatability ..........................................................................................................7 1.3.8 Subsidiary Calibrations .........................................................................................7 1.3.9 Linearity.................................................................................................................8
1.4 Additional Considerations ..........................................................................................10 1.4.1 Environmental Requirements...............................................................................10 1.4.2 Power Requirements ............................................................................................10 1.4.3 Shielding ..............................................................................................................10
1.5 Quality Assurance and Documentation......................................................................10 1.5.1 Authorisations ......................................................................................................12 1.5.2 Non-conformances ...............................................................................................12 1.5.3 Documentation.....................................................................................................12
Uncertainties & Sources of Error ..........................................13
2.1 Introduction ................................................................................................................14 2.2 Calibration ..................................................................................................................16
2.2.1 Calibration factor ................................................................................................16 2.2.2 Chamber wall thickness .......................................................................................16
2.3 Electronics ..................................................................................................................17 2.3.1 Inherent accuracy ................................................................................................17 2.3.2 Linearity...............................................................................................................17 2.3.3 Range changing ...................................................................................................17
2.4 Statistical ....................................................................................................................18 2.5 Activity.......................................................................................................................19
2.5.1 High Activity ........................................................................................................19 2.5.2 Low activity and background...............................................................................20
2.6 Shielding.....................................................................................................................21 2.7 Container and Source Effects .....................................................................................21
2.7.1 Container wall thickness......................................................................................21 2.7.2 Container Types ...................................................................................................22 2.7.3 Volume ................................................................................................................24 2.7.4 Position ................................................................................................................25 2.7.5 Density .................................................................................................................26 2.7.6 Homogeneity ........................................................................................................26 2.7.7 Adsorption............................................................................................................26
ii
2.8 Radionuclide Purity....................................................................................................27 2.9 Nuclear Data...............................................................................................................29 2.10 Simulated Sources ......................................................................................................29 2.11 Specific Problem of Assaying Pure Beta Emitters .....................................................30
References .....................................................................31 List of Tables Table 1.1 Acceptable calibration tolerances for reference and field instruments..............5 Table 1.2 Recommended frequencies for measuring radionuclide calibrator performance
parameters. .........................................................................................................5 Table 1.3 Results of UK hospital comparisons................................................................11 Table 2.1 Principal Sources of Uncertainty .....................................................................15 Table 2.2 Typical state-of-the-art uncertainties for primary standards ............................16 Table 2.3 Change in response of an aluminium-wall ionization chamber with an
additional aluminium layer between the source and chamber .........................17 Table 2.4 Variation of radionuclide calibrator response with shielding/backscatter.......21 Table 2.5 Typical glass vials (All dimensions in mm) ....................................................22 Table 2.6 Change in response of an NPL ionization chamber with variation in wall
thickness of glass vials.....................................................................................22 Table 2.7 Differences between calibration factors for NPL Secondary Standard
Radionuclide Calibrator for different containers, relative to 10R Schott vials23 Table 2.8 Indicative differences between responses for Capintec CRC120 for syringes
relative to P6 vials............................................................................................23 List of Figures Figure 1.1 Radionuclide calibration ....................................................................................2 Figure 1.2 Traceability and equivalence .............................................................................4 Figure 2.1 Effects of inherent accuracy, linearity and range changing in electrometers ..18 Figure 2.2 Effects of recombination..................................................................................20 Figure 2.3 Volume correction factors for the NPL SSRC for 10R Schott,
Type +1 vials ...................................................................................................24 Figure 2.4 The spatial sensitivity of a typical ionisation chamber to a point source. .......25 Figure 2.5 Variation in response for radial and axial displacements of 3 ml solution in
5 ml ampoule for NPL secondary standard radionuclide calibrator ...............26

Quality Assurance & Quality Control Procedures IN THIS CHAPTER
111
Introduction
Principles of traceability
Procedures for quality control
» High voltage
» Display
» Zero adjust
» Background
» Check source (Relative Response)
» Accuracy
» Repeatability
» Subsidiary calibrations
» Linearity
Additional considerations
» Environmental requirements
» Power requirements
» Shielding
Quality assurance and documentation
» Authorisations
» Non-conformances
» Documentation

2 Good Practice Guide 93 Chapter 1
Ionisation chamber
High voltagesupply
Electrometer, processor, display
DDD.D MBq
Sample
1.1 Introduction Radioactive materials are widely used in hospitals for diagnostic and therapeutic purposes. It is important that the activity of the radioactive material should be accurately determined prior to administration to a patient. The principal instrument used to assay the radioactivity is the radionuclide calibrator (see Figure 1.1). This instrument normally consists of: (a) Well-type ionisation chamber (b) Stabilised high voltage supply (c) Electrometer for measuring the small ionisation currents (d) Processing electronics (e) Display device
Figure 1.1 Radionuclide calibration
An ionisation chamber consists essentially of two electrodes at a potential difference of several hundred volts and insulated from each other by an envelope of gas. Most chambers are sealed and the gas is usually at a pressure of several atmospheres. The radioactive sample is placed into a cavity surrounded by the chamber. The passage of ionising radiation through the sensitive volume of the calibrator ionises the gas, producing an electrical current, the magnitude of which is proportional to the activity of radionuclide being assayed. The ratio of the current to the activity is normally referred to as the calibration factor for that radionuclide. The calibration factor is not only dependent on the emissions of the radionuclide but also on a number of other factors, including, for example, the nature of the container and volume of solution. The current that is generated between the electrodes typically ranges from 10’s of femtoamperes (fA) up to perhaps microamperes (μA) – a dynamic range of 108. The electrometer in the radionuclide calibrator has to be capable of making accurate measurements over this large dynamic range.
Chapter 1 Good Practice Guide 93 3
Radionuclide calibrators were originally designed for the measurement of the activity of gamma-emitting radionuclides in solution. Since those early days, their use has been extended to the activity assay of high-energy pure beta emitters (e.g. 32P, 89Sr and 90Y) as well as to the dose assay of Low Dose Rate therapeutic sources (e.g. 125I prostate seeds, 137Cs needles and 192Ir wires). Although general principles in this document apply equally to the assay of these new sources, sources of this type are not specifically covered by this document. It is important that the calibrator user answers several questions before using a calibrator: (a) Are the calibration factors traceable to national standards and is there documented evidence to
support this?
(b) What is the overall uncertainty that is needed for the activity of any particular radionuclide?
(c) Do the calibration factors apply to the volumes and containers being used in practice? If not, are accurate correction factors available and what additional uncertainties do they introduce?
(d) What are the ranges of activity that can be assayed within the declared uncertainty limits?
(e) Is there a long-lived check source available, the response to which has been documented
when the system was first calibrated?
(f) Can the system response be adjusted easily to ensure that the response is the same as when the system was first calibrated?
(g) Is the effect of secondary shielding around the chamber known? (h) If the electrometer or ionisation chamber has been replaced, has the system been recalibrated
for all calibration factors? Such considerations should be considered in the selection process when a calibrator is being purchased and tests may need to be undertaken to confirm that the declared specifications are met. However, it is equally important that these specifications continue to be met throughout the useful life of the calibrator. The procedures detailed in this chapter are those that are recommended as the minimum requirements of a quality assurance system that will confirm the initial and ongoing validity of these specifications. 1.2 Principles of Traceability Traceability is defined as “The property of a result or a measurement whereby it can be related to appropriate standards, generally international or national standards, through an unbroken chain of comparisons” [4]. In the context of nuclear medicine and its associated statutory obligations, calibration factors should be traceable (for each radionuclide that is to be used) to the national primary standards of radioactivity. National primary standards are normally maintained by the

4 Good Practice Guide 93 Chapter 1
relevant National Metrology Institute (NMI). In the UK, the NMI is the National Physical Laboratory in Teddington. The NMI confirms the accuracy of its standards by comparisons with the NMIs of other countries: these are organised by the Bureau International des Poids et Mesures (BIPM), the world measurement standards authority. This process is generally described as the establishment of Equivalence (see Figure 1.2):
Figure 1.2 Traceability and equivalence
← E Q U I V A L E N C E → NIST (USA)
⇔ NPL (UK)
⇔ PTB (DE)
⇔ LNHB (FR)
⇔ ⇔ ↑
T R
Secondary A Standards C Laboratory E A
B Reference I Instrument L I T
Y Field Instrument ↓
There are a number of ways in which traceability can be established and the uncertainty associated with the calibration factor will depend to a large degree on the calibration method used. Two possible calibration methods used by manufacturers are: (a) The master system is calibrated for each radionuclide using primary standards. (b) The manufacturer determines of the calibration factors for a typical production calibrator for a
restricted range of radionuclides using traceable standards. The response-energy curve is then calculated and calibration factors for all radionuclides are calculated from knowledge of their radiative emissions and the response curve. Additional uncertainties then need to be included to allow for manufacturing differences between the “typical” calibrator and all other production models.
These two examples might be regarded as the extremes in terms of the resultant uncertainties on individual calibration factors. There are other options and these can also be supplemented by subsequent calibrations and comparisons that will provide opportunities to reduce these uncertainties. A practical method to ensure traceability to the national standard is to calibrate, at least annually, the routine instrument (field instrument) against a reference instrument. This can be a “secondary standard” instrument for which nationally traceable measurements are available for a

Chapter 1 Good Practice Guide 93 5
comprehensive range of radionuclides, geometries and activities. Alternatively a reliable routine instrument that has been individually calibrated for the full range of radionuclides for which it is to be a reference could be used. Typical acceptable tolerances for reference and field instruments are shown in Table 1.1.
Table 1.1 Acceptable calibration tolerances for reference and field instruments
Parameter Reference Instrument Field Instrument
Repeatability ± 0.5% (1 s.d.) ± 1% (1 s.d.) Linearity (over range used) ± 1% (1 s.d.) ± 5% (1 s.d.)
Accuracy High energy & gamma (> 100 keV)
± 2% (range) to secondary standard
± 5% (range) to reference
Low energy & gamma (< 100 keV)
± 5% (range) to secondary standard
± 10% (range) to reference
1.3 Procedures for Quality Control Several parameters must be assessed to confirm that the radionuclide calibrator meets its performance requirements. The most thorough assessment will be made during acceptance testing. Thereafter, less extensive measurements may be sufficient to confirm that there has been no significant change in performance. However, if the performance changes or there have been major repairs, the detailed measurements required for acceptance testing must be repeated. The recommended frequency for checking each aspect of calibrator performance is indicated in Table 1.2.
Table 1.2 Recommended frequencies for measuring radionuclide calibrator performance parameters.
Acceptance Daily Monthly Annually High voltage Display Zero adjust Background Check source (Relative Response) Accuracy Repeatability Subsidiary calibrations Linearity Details of how the various measurements may be made are described below.

6 Good Practice Guide 93 Chapter 1
1.3.1 High Voltage If it is possible to display the high voltage, its value should be recorded to note any drift (particularly downwards) or to compare with the manufacturers tolerances. If the display is not available, measurement of the check source may indicate if a problem exists. With low activities, a small change in voltage will have little effect on the measurement. However, the same change in voltage can have a large effect on the measurement of high activities. This is because recombination effects in the ion chamber change with voltage and are important at high currents. 1.3.2 Display If there is a segmented display, there should be a facility to check that all segments are operating correctly. 1.3.3 Zero Adjust This facility should be checked in accordance with the instructions in the user manual. It is useful to record the “zero” reading before any adjustment is made in order to identify any ongoing trend which suggests that the instrument needs repair. 1.3.4 Background A sufficiently large measurement period, together with an appropriate number of significant figures on the display, should be used for the background measurement. The magnitude of the background should be noted daily and compared against previous values (ideally a control chart should be maintained) or against a control value. Acceptable variations need to be determined by a series of repeated benchmark measurements at the installation stage. Background measurements should be made with the source holder in the chamber. If the measured background is higher than expected this may be due to contamination of the chamber/ source holder/ liner or because of the presence of large sources nearby. 1.3.5 Check Source (Relative Response) It is important that a long-lived radioactive check source is available and measured on a regular basis. These sources should be chosen for their long half-lives and the absence of any significant radioactive impurity. Typical sources used are 137Cs (half-life = 30 years), 57Co (half-life = 270 days) or 226Ra (half-life = 1600 years). However, sources such as 57Co, which do contain impurities, have altered effective half-lives and so must be treated with caution. The check source initially checks the response of the overall system (chamber + electrometer) against a benchmark value, which is established when the system is first installed. A record should be kept of the daily checks and any adjustments documented. Daily measurements of the responses to a check source need only be performed for instrument nuclide settings corresponding to the radionuclides, which will be measured on that day. This check gives a measure of the reproducibility [4] for day to day measurements of the ionisation chamber and electrometer combination. If checks indicate that the response suffers large random variations, this may suggest an inherent instability in the electrometer. If there is an ongoing trend, which indicates that the response is continually rising (or falling), this could indicate either a leak in the pressurised ionisation chamber or a progressive drift of the electrometer. In either of these cases an initial compensation could be achieved by adjusting the electrometer, but if the cumulative change is greater than 5% it should be repaired: the problem may be more than just that arising from the inherent instability of the electrometer. The check source should be a solid source, which is less prone to loss of activity than a solution. It is important to recognise that the check source is NOT a calibration source for that radionuclide. It would generally have different characteristics to those of sources, which are routinely assayed and,

Chapter 1 Good Practice Guide 93 7
hence, have a different calibration factor. A check should be made using all the instrument nuclide settings that are to be used that day. 1.3.6 Accuracy For acceptance testing, reference sources for as many relevant radionuclides as practicable should be obtained. These should normally be in liquid form and should be in the volume and container for which calibration factors have been supplied by the manufacturer. If there is a difference between the container/volume specified by the manufacturer and those routinely used, the appropriate procedure described below (Subsidiary Calibrations) should be applied. In the UK at the time of writing, a volume of 4 ml in a 10R Schott vial is recommended as a reference source. The activities of reference sources must be traceable to national standards. This can be achieved by purchasing such sources either from the national laboratory (NPL in the case of the UK), or from a secondary standard supplier that can guarantee traceability to the national laboratory for each of the reference sources supplied. Alternatively the national laboratory can assay samples sent to them from the hospital or, if the ionisation chamber is a field instrument, it can be calibrated against a secondary standard instrument already traceable to the national standard. In order to maintain and demonstrate traceability, it is essential that all steps are fully documented in accordance with a quality assurance procedure (Section 1.5) It is recommended that the instrument calibration is checked annually with at least two reference sources and that the radionuclides used should vary from year to year. The intention of this rotation policy should be two-fold. First, it should seek to cover the energy range of those radionuclides which are commonly used and, second, it should seek to include, over a reasonable period of time, all of those radionuclides which are commonly used. For example, a schedule could be as follows: Year 1: 99mTc and 131I Year 2: 201Tl and 67Ga Year 3: 123I and 89Sr Year 4: 99mTc and 111In Year 5: 131I and 90Y Where operator preset calibration switches are used, each of these must be checked to ensure it is operating correctly. 1.3.7 Repeatability Repeatability [4, 17] is normally expressed as a percentage value (the standard deviation of at least 10 measurements divided by the mean and multiplied by 100), and measured using a source, which exhibits negligible decay during the period of measurement. The sealed check source referred to in section 1.3.5 is suitable for this purpose. The source should not be removed from the ionisation chamber between each measurement. Where more than one time constant is available precision should be checked for each setting. If possible, repeatability should be determined for each current range for which the calibrator will be used. This can be accomplished using a series of sources with activities within each measurement range tested. 1.3.8 Subsidiary Calibrations Subsidiary calibrations are those that relate to containers and volumes for which calibration factors are not supplied by the manufacturer. A procedure to determine these subsidiary calibrations is as follows.

8 Good Practice Guide 93 Chapter 1
First, measure the activity of a solution in the standard container and then transfer a known proportion of the liquid to the container for which the calibration is to be determined. The volume transferred may be determined by accurate weighing before and after transfer. To confirm the activity removed, the original container can be re-assayed, having first adjusted the container to the original volume using non-radioactive liquid of the same density. Having determined the activity transferred from the original container, the instrument setting required to display this activity for the new container/volume can be determined by trial and error. During this procedure care must be taken to avoid loss of radioactive liquid during the transfer. This can be checked by monitoring all containers, syringes etc., involved in the process, and confirming that any residual activity is trivial. 1.3.9 Linearity This should be measured over the entire range of activity for which a particular radionuclide calibrator will be used. The usual technique is the decaying source method. A vial containing the maximum activity of a radionuclide used in the department is measured at intervals as the source decays. To cover the entire activity range this may require measurements to be made several times each day for several days. The activity at which non-linearities appear will be different for different radionuclides. Activity measurements can be recorded on a spreadsheet and a log-linear graph made of these measurements plotted against time. With a linear system, this should be a straight line, and the slope of the trend line produced for the whole of the data should equate to the decay constant of the radionuclide used. Any difference will indicate that non-linearities exist. In order to quantify this non-linearity a region of the plot should be identified where the slope equates to the decay constant of the radionuclide used. Typically, this section of data is where the measured activity is 100 times background and covers about 10 half-lives. This can then be extrapolated back to obtain predicted activities at all measurement times. The activities at which the predicted activity and the measured activity differ by 1% (reference instrument limit) and 5% (field instrument limit) can then be identified. For each radionuclide, the range of activities over which the instrument may be used as either a field or reference instrument can then be determined. A full outline of the method using 99mTc, which is the most widely used radionuclide, is shown below.
Chapter 1 Good Practice Guide 93 9
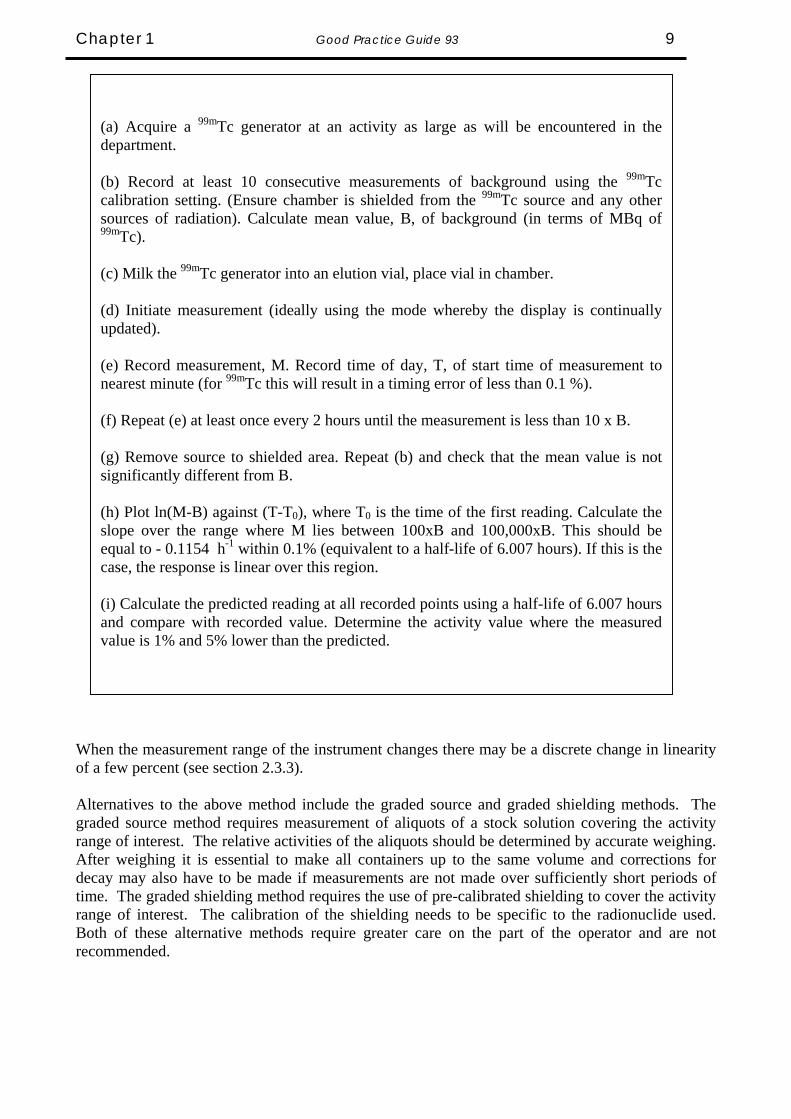
When the measurement range of the instrument changes there may be a discrete change in linearity of a few percent (see section 2.3.3). Alternatives to the above method include the graded source and graded shielding methods. The graded source method requires measurement of aliquots of a stock solution covering the activity range of interest. The relative activities of the aliquots should be determined by accurate weighing. After weighing it is essential to make all containers up to the same volume and corrections for decay may also have to be made if measurements are not made over sufficiently short periods of time. The graded shielding method requires the use of pre-calibrated shielding to cover the activity range of interest. The calibration of the shielding needs to be specific to the radionuclide used. Both of these alternative methods require greater care on the part of the operator and are not recommended.
(a) Acquire a 99mTc generator at an activity as large as will be encountered in thedepartment. (b) Record at least 10 consecutive measurements of background using the 99mTccalibration setting. (Ensure chamber is shielded from the 99mTc source and any othersources of radiation). Calculate mean value, B, of background (in terms of MBq of99mTc). (c) Milk the 99mTc generator into an elution vial, place vial in chamber. (d) Initiate measurement (ideally using the mode whereby the display is continuallyupdated). (e) Record measurement, M. Record time of day, T, of start time of measurement tonearest minute (for 99mTc this will result in a timing error of less than 0.1 %). (f) Repeat (e) at least once every 2 hours until the measurement is less than 10 x B. (g) Remove source to shielded area. Repeat (b) and check that the mean value is notsignificantly different from B. (h) Plot ln(M-B) against (T-T0), where T0 is the time of the first reading. Calculate theslope over the range where M lies between 100xB and 100,000xB. This should beequal to - 0.1154 h-1 within 0.1% (equivalent to a half-life of 6.007 hours). If this is thecase, the response is linear over this region. (i) Calculate the predicted reading at all recorded points using a half-life of 6.007 hoursand compare with recorded value. Determine the activity value where the measuredvalue is 1% and 5% lower than the predicted.
10 Good Practice Guide 93 Chapter 1
1.4 Additional Considerations 1.4.1 Environmental Requirements Ideally the instrument should be used in a stable environment. The chamber should be mounted on a very firm, vibration-free base. The area must not be affected by high activity sources nearby and this will often require extra shielding (see section 1.3.4). For reliability and stability, the calibrator should be operated at a reasonably constant temperature. Direct sunlight or proximity to a room heater or air conditioner should be avoided. Excessive humidity should also be avoided. 1.4.2 Power Requirements No special power requirements are normally necessary. The line voltage required will be stated in the user manual. For optimum performance, the unit should be left powered at all times. The use of a mains interference filter and an uninterruptible power supply (UPS) is recommended. 1.4.3 Shielding An effective way of reducing the effects of local environment radiation is to shield the ionisation chamber, usually with lead. Shielding also helps to minimise the dose to the operator whilst a radioactive source is in the ionisation chamber. The shield may be provided by the manufacturer either as an integral part of the chamber module or as a removable outer sleeve; alternatively it may be constructed "in-house" by the user as the only form of shielding or in addition to that already provided with the chamber. It is important to note that shielding will alter the calibration factors to an extent that is dependent on the type and proximity of the shielding. This arises from back-scattering of photons from the source after they emerge from the outer surface of the chamber together with the emission of Pb K X-rays arising from interactions within the lead shielding. Typically, the combination of these two events results in an enhancement of the chamber response, which maximises in the region of 80 keV. As such, those radionuclides, which are ideal for imaging purposes also suffer most from this effect. It is important therefore to determine the shielding arrangements which apply for the calibration settings provided by the manufacturer. If additional shielding is introduced, comparative measurements should be made with and without the additional shielding to determine the correction factors that will need to be applied. 1.5 Quality Assurance and Documentation Results of UK hospital exercises conducted over the years by NPL for a wide range of medical radionuclides illustrate a wide variation of response, even for those using chambers of the same model. They also demonstrate that it is related to the average energy of the photon radiation being measured: the lower the photon energy, the wider the variation. This is demonstrated in Table 1.3, which examines the spread of responses for a particular radionuclide in terms of the fraction of results which lie within a given range of the true value. The results have been presented in ascending order of average photon energy (results from a recent comparison of a pure beta emitter, 89Sr, have also been included).

Chapter 1 Good Practice Guide 93 11
Table 1.3 Results of UK hospital comparisons
Percentage of results within given range of NPL value
Nuclide Ref. Principal Photon Energy (keV)
Emission Probability 0.95 – 1.05 0.90 – 1.10
125I [5] ~30 1.39 13 26
123I * [6, 7] 30 159
0.87 0.83 29 66
57Co [5] 122 0.855 52 76
201Tl [8] 71 167
0.47 0.10 73 94
99mTc [9] 141 0.890 73 94
111In [10] 26 171 245
0.83 0.90 0.94
84 92
67Ga [11]
93 185 300 393
0.42 0.21 0.17 0.05
91 95
131I [9, 12] 365 0.82 90 100
89Sr ** [13] beta emitter 58 86 * 123I errors in response mainly due to low energy photon emissions ** 89Sr errors in response mainly due to inadequate corrections for the presence of 85Sr impurity. These results demonstrate the need for a rigorous approach to quality assurance. The quality control procedures detailed above (section 1.3) are specific actions that need to be taken on a routine basis. They should form part of such an overall quality assurance system. For operations which include a significant technical content including calibration, the most relevant QA system is that of the international standard, ISO17025 [14] This standard addresses both the management and technical requirements necessary to maintain an operation which will produce technically valid data and results. It is not the remit of this guidance to reproduce ISO17025 but there are some points, which are worth emphasising.
12 Good Practice Guide 93 Chapter 1
1.5.1 Authorisations The system should document the qualifications and training requirements necessary for those personnel who are to operate radionuclide calibrators. It should also detail those who are subsequently authorised to operate the calibrators as well as those who have ultimate responsibility for their correct functioning. 1.5.2 Non-conformances There should be agreed and documented criteria which define the points at which the results of quality control measurements (section 1.3) fall outside acceptable limits (non-conformance). When this occurs, there should be defined responsibilities and follow-up actions, which ensure that the non-conformances are remedied. It is often useful to mainain charts (either hand-drawn or computer based) which display tolerance levels and not only record quality control measurements but also provide an instant indication of when non-conformances arise or identify trends which might give early warning of future problems. 1.5.3 Documentation Sufficient records need to be kept to demonstrate that quality control procedures have been adhered to and that the calibrator can be shown to have been operating correctly at all times. Actual readings should be recorded. Details of any maintenance or repair should also be recorded. Users should develop forms, which meet the requirements of their own systems.

Uncertainties & Sources of Error IN THIS CHAPTER
222
Introduction
Calibration
» Calibration factor
» Chamber wall thickness
Electronics
» Inherent accuracy
» Linearity
» Range changing
Statistical
Activity
» High activity
» Low activity & background
Shielding
Container & source effect
» Container wall thickness
» Container types
» Volume
» Position
» Density
» Homogeneity
» Adsorption
Radionuclide purity
Nuclear data
Simulated sources
Specific problem of assaying pure beta emitters

Good Practice Guide 93 Chapter 2 14
2.1 Introduction Over the past few years, the determination of the uncertainty of a measurement value has become as important as the measurement value itself. The accepted concept is that “An expression of the result of a measurement is incomplete unless it includes a statement of the associated uncertainty.” There is now international agreement on the way in which uncertainties should be estimated and this is documented in the ISO publication,“Guidance on the Estimation of Uncertainties in Measurement (GUM) [15]. The United Kingdom Accreditation Service (UKAS) has produced its own version (M3003) [16] of this for the UK. These guidelines have been adopted in all National Measurement Institutes worldwide and their use is being extended down through the relevant measurement chains to all those organisations and individuals who make measurements in whatever field or discipline. An extended discussion of the underlying principles of this new guidance is beyond the scope of this protocol and users should refer to GUM and M3003. For an explanation of the terminology the user is referred to NPL Measurement Good Practice Guide Number 11 – A Beginner’s Guide to Uncertainty of Measurement [17]. However, it is useful to summarise the main steps described in these two documents in order to show how the overall uncertainty in a final measurement can be derived. These steps are:
a) Identify each independent input component, which will affect the uncertainty in the measurement and estimate the magnitude of the component’s uncertainty at the 68% confidence level (approximately plus or minus one standard deviation).
b) Estimate the standard uncertainty which each component contributes to the measurement
result by identifying the weighting of the component, expressed as a sensitivity coefficient per unit change in the measurement, and multiplying by the estimated component uncertainty derived in (a).
c) Combine in quadrature all of the identified standard uncertainties to produce a combined
standard uncertainty. This will again be at a 68% confidence level.
d) Calculate the expanded uncertainty quoted on the final measurement. This is the combined standard uncertainty multiplied by a coverage factor, k. A particular value of k gives a particular confidence level for the expanded uncertainty. Usually a value of k = 2 is used, which corresponds approximately to a 95% confidence level.
The methods of estimation of uncertainties are classified as either Type A, those determined by statistical means, or Type B, those determined by other means. The distinction between these two types of uncertainty is important in that the Type A estimate will normally have a finite number of degrees of freedom associated with it and have a normal distribution whilst Type B uncertainties normally have an infinite number of degrees of freedom and may also have a non-normal distribution (e.g. rectangular, bi-modal, etc). Each of these factors may cause the coverage factor, k, to be different from 2. This, however, tends to be the exception rather than the rule and GUM provides relevant guidance in these cases. It is important to note that it should not be necessary to make estimates of each individual uncertainty for every measurement. If a generic approach is taken, it should be possible to determine a set of operating limits for a particular calibrator whereby the individual components of uncertainty are either maintained below a known (insignificant) level or remain at a constant

Chapter 2 Good Practice Guide 93 15
(known) level for a reasonable period of time. This will allow the same overall uncertainty to be attributed to all measurements of a particular radionuclide. Table 2.1 below identifies and describes the major sources of uncertainty in calibrator measurements and states whether they are dependent on the level of activity being measured, the particular radionuclide being measured or the properties of the calibrator. The following sections examine in turn each of these sources of uncertainty.
Table 2.1 Principal Sources of Uncertainty Source of Uncertainty
Description Dependency Chapter 2 Reference
Activity Nuclide Calibrator Calibration Traceability, accuracy,
variation between chambers N Y Y 2.2
Electronics Accuracy, linearity, range changing
Y N Y 2.3
Statistical Repeatability Y Y Y 2.4 High activity Recombination effects Y Y Y 2.5.1 Low activity Short counting period,
background uncertainty Y Y Y 2.5.2
Shielding Shielding backscatter effects
N Y Y 2.6
Container - I Wall thickness variations N Y N 2.7.1 Container - II Differences between
container types N Y N 2.7.2
Volume Volume correction factors N Y Y 2.7.3 Position Reproducibility of sample
position N N Y 2.7.4
Density Different carrier/chemical compositions
N Y N 2.7.5
Homogeneity Variations throughout source
N Y N 2.7.6
Adsorption Adherence of activity to surfaces
N Y N 2.7.7
Purity Response differences from main nuclide
N Y Y 2.8
Nuclear data Half-lives, interpolation of calibration factors
N Y Y 2.9
Simulators Use of simulated sources for calibration
N Y Y 2.10
Good Practice Guide 93 Chapter 2 16
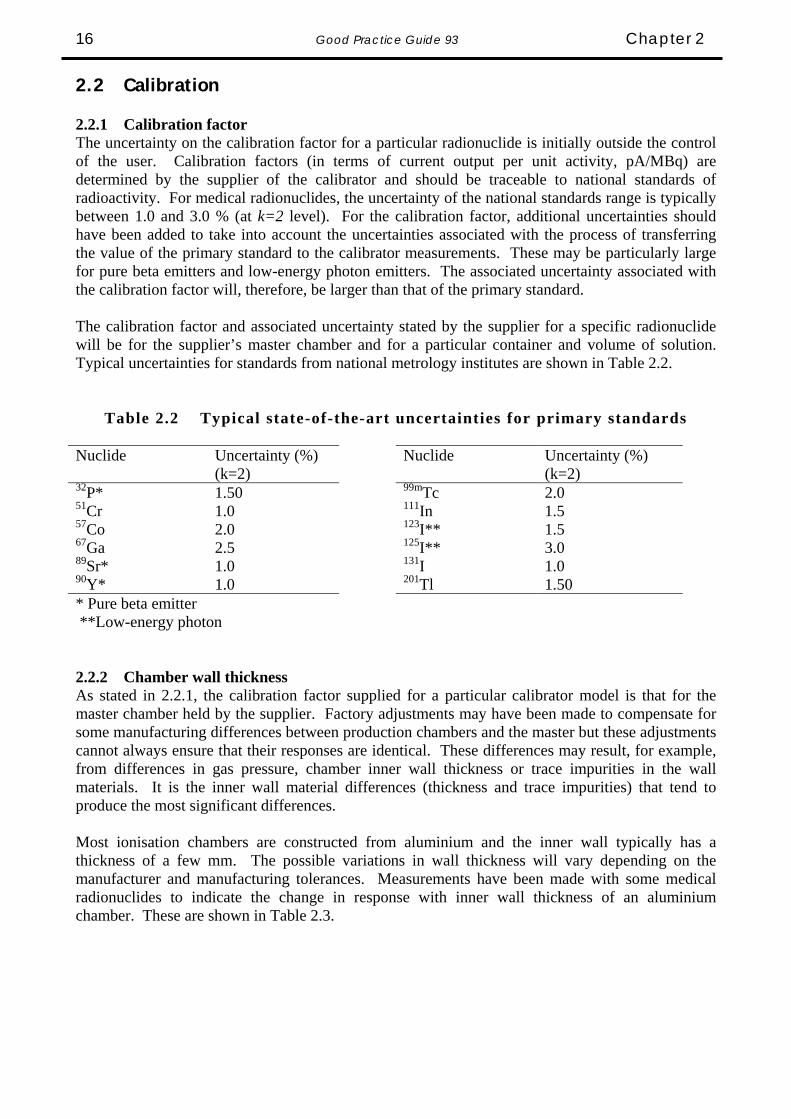
2.2 Calibration 2.2.1 Calibration factor The uncertainty on the calibration factor for a particular radionuclide is initially outside the control of the user. Calibration factors (in terms of current output per unit activity, pA/MBq) are determined by the supplier of the calibrator and should be traceable to national standards of radioactivity. For medical radionuclides, the uncertainty of the national standards range is typically between 1.0 and 3.0 % (at k=2 level). For the calibration factor, additional uncertainties should have been added to take into account the uncertainties associated with the process of transferring the value of the primary standard to the calibrator measurements. These may be particularly large for pure beta emitters and low-energy photon emitters. The associated uncertainty associated with the calibration factor will, therefore, be larger than that of the primary standard. The calibration factor and associated uncertainty stated by the supplier for a specific radionuclide will be for the supplier’s master chamber and for a particular container and volume of solution. Typical uncertainties for standards from national metrology institutes are shown in Table 2.2.
Table 2.2 Typical state-of-the-art uncertainties for primary standards Nuclide Uncertainty (%)
(k=2) Nuclide Uncertainty (%)
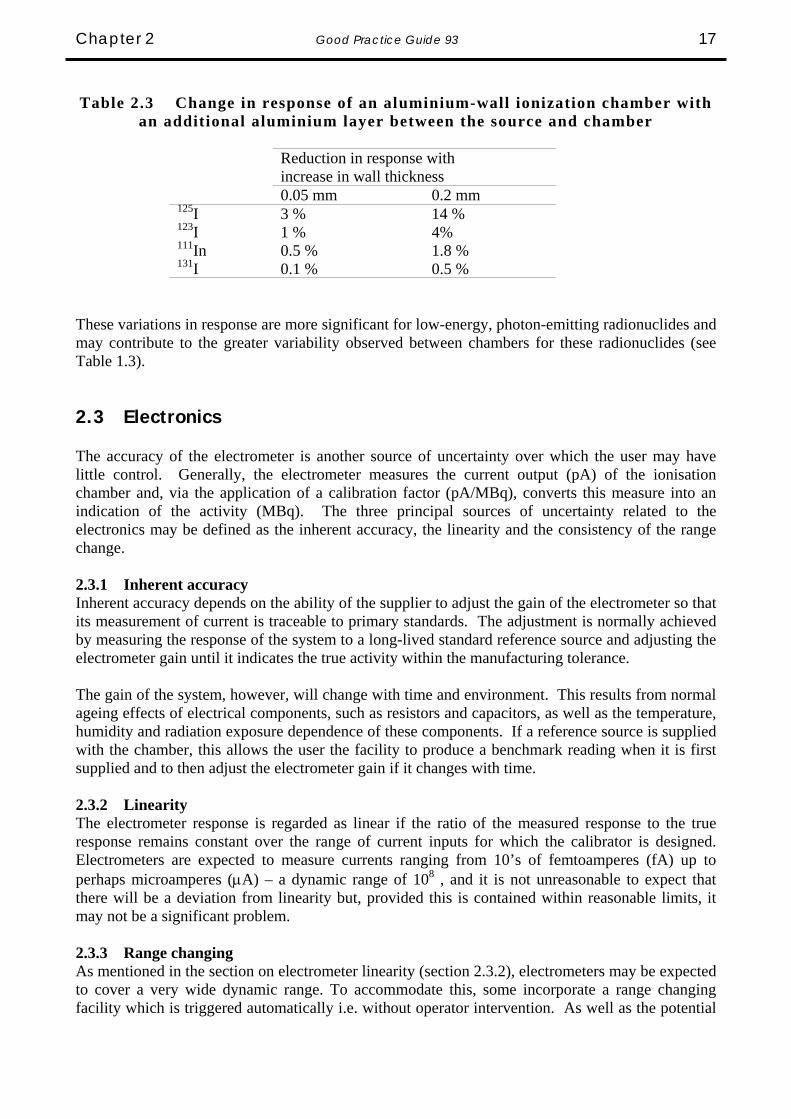
(k=2) 32P* 1.50 99mTc 2.0 51Cr 1.0 111In 1.5 57Co 2.0 123I** 1.5 67Ga 2.5 125I** 3.0 89Sr* 1.0 131I 1.0 90Y* 1.0 201Tl 1.50 * Pure beta emitter **Low-energy photon 2.2.2 Chamber wall thickness As stated in 2.2.1, the calibration factor supplied for a particular calibrator model is that for the master chamber held by the supplier. Factory adjustments may have been made to compensate for some manufacturing differences between production chambers and the master but these adjustments cannot always ensure that their responses are identical. These differences may result, for example, from differences in gas pressure, chamber inner wall thickness or trace impurities in the wall materials. It is the inner wall material differences (thickness and trace impurities) that tend to produce the most significant differences. Most ionisation chambers are constructed from aluminium and the inner wall typically has a thickness of a few mm. The possible variations in wall thickness will vary depending on the manufacturer and manufacturing tolerances. Measurements have been made with some medical radionuclides to indicate the change in response with inner wall thickness of an aluminium chamber. These are shown in Table 2.3.
Chapter 2 Good Practice Guide 93 17
Table 2.3 Change in response of an aluminium-wall ionization chamber with
an additional aluminium layer between the source and chamber
Reduction in response with increase in wall thickness
0.05 mm 0.2 mm 125I 3 % 14 % 123I 1 % 4% 111In 0.5 % 1.8 % 131I 0.1 % 0.5 %
These variations in response are more significant for low-energy, photon-emitting radionuclides and may contribute to the greater variability observed between chambers for these radionuclides (see Table 1.3). 2.3 Electronics The accuracy of the electrometer is another source of uncertainty over which the user may have little control. Generally, the electrometer measures the current output (pA) of the ionisation chamber and, via the application of a calibration factor (pA/MBq), converts this measure into an indication of the activity (MBq). The three principal sources of uncertainty related to the electronics may be defined as the inherent accuracy, the linearity and the consistency of the range change. 2.3.1 Inherent accuracy Inherent accuracy depends on the ability of the supplier to adjust the gain of the electrometer so that its measurement of current is traceable to primary standards. The adjustment is normally achieved by measuring the response of the system to a long-lived standard reference source and adjusting the electrometer gain until it indicates the true activity within the manufacturing tolerance. The gain of the system, however, will change with time and environment. This results from normal ageing effects of electrical components, such as resistors and capacitors, as well as the temperature, humidity and radiation exposure dependence of these components. If a reference source is supplied with the chamber, this allows the user the facility to produce a benchmark reading when it is first supplied and to then adjust the electrometer gain if it changes with time. 2.3.2 Linearity The electrometer response is regarded as linear if the ratio of the measured response to the true response remains constant over the range of current inputs for which the calibrator is designed. Electrometers are expected to measure currents ranging from 10’s of femtoamperes (fA) up to perhaps microamperes (μA) – a dynamic range of 108 , and it is not unreasonable to expect that there will be a deviation from linearity but, provided this is contained within reasonable limits, it may not be a significant problem. 2.3.3 Range changing As mentioned in the section on electrometer linearity (section 2.3.2), electrometers may be expected to cover a very wide dynamic range. To accommodate this, some incorporate a range changing facility which is triggered automatically i.e. without operator intervention. As well as the potential

Good Practice Guide 93 Chapter 2 18
for different linearity characteristics in each range, the individual ranges may also have separate gain adjustments. If these are not properly matched, this will result in a step in the response as the electrometer switches between adjacent ranges. The preceding three electronics effects are illustrated graphically in Figure 2.1.
Figure 2.1 Effects of inherent accuracy, linearity and range changing in electrometers
Expected response
Indi
cate
d re
spon
se
106
105
104
103
102
101
100
100 101 102 103 104 105 106
non-linearity
range changeeffect
measured response "ideal" response
inaccuracy
{
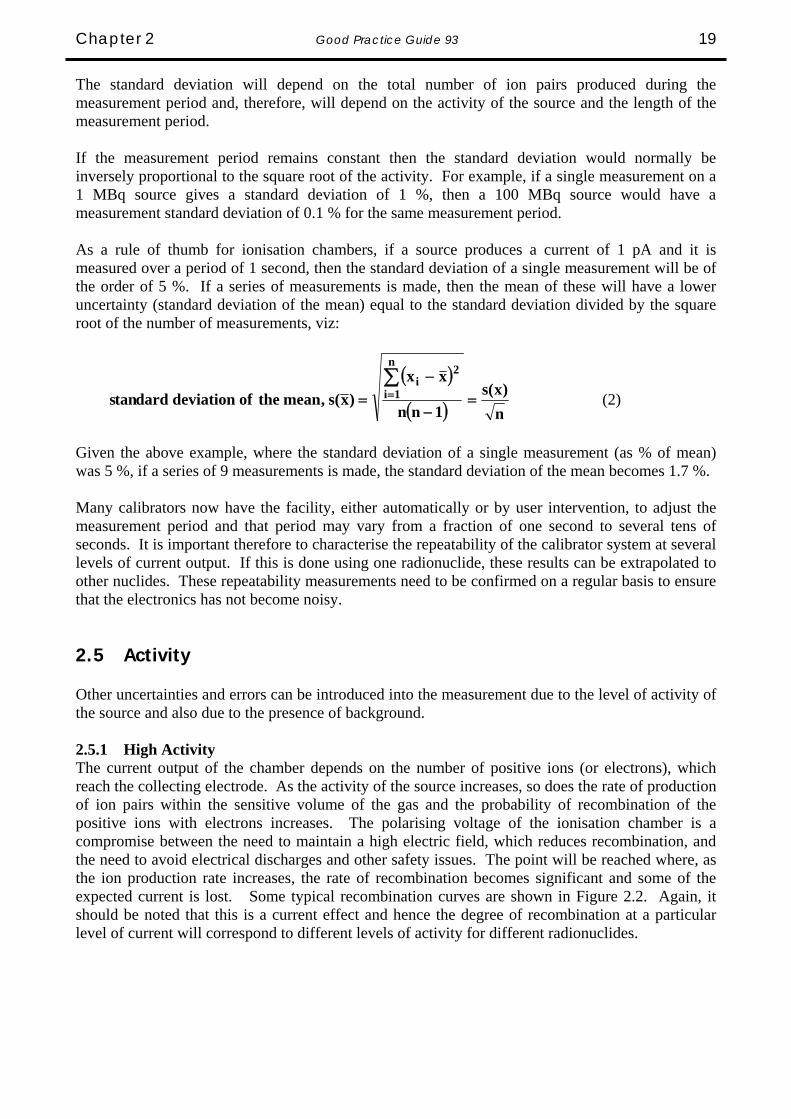
Generally, the supplier will quote a level of uncertainty, which encompasses each of these three components and 1 to 2% uncertainty is common. However, the level of confidence is often not quoted and it is normally prudent to assume that the quoted uncertainty is at a 68% level of confidence, k = 1. 2.4 Statistical Repeatability defines the precision with which a single measurement is made. Because of the random nature of radioactive decay, within two separate but equal measurement periods, there will be a difference between the number of events that occur as well as the number of interactions per event in the gas and the number of ion pairs produced. This will result in two different measurement results for, effectively, the same measurement (this of course assumes that there is no significant decay between the two measurement periods). If a series of n sequential identical measurements (xi) are made, it is possible to determine the uncertainty on a single measurement by calculating the mean and standard deviation of that series. The normal equations are used:
( )
( )1n
xx)x(s,deviationdardtans
n
xx,mean
n
1i
2i
n
1ii
−
−==
∑∑== (1)
Chapter 2 Good Practice Guide 93 19
The standard deviation will depend on the total number of ion pairs produced during the measurement period and, therefore, will depend on the activity of the source and the length of the measurement period. If the measurement period remains constant then the standard deviation would normally be inversely proportional to the square root of the activity. For example, if a single measurement on a 1 MBq source gives a standard deviation of 1 %, then a 100 MBq source would have a measurement standard deviation of 0.1 % for the same measurement period. As a rule of thumb for ionisation chambers, if a source produces a current of 1 pA and it is measured over a period of 1 second, then the standard deviation of a single measurement will be of the order of 5 %. If a series of measurements is made, then the mean of these will have a lower uncertainty (standard deviation of the mean) equal to the standard deviation divided by the square root of the number of measurements, viz:
( )
( ) n)x(s
1nn
xx)x(s,meantheofdeviationdardtans
n
1i
2i
=−
−=
∑= (2)
Given the above example, where the standard deviation of a single measurement (as % of mean) was 5 %, if a series of 9 measurements is made, the standard deviation of the mean becomes 1.7 %. Many calibrators now have the facility, either automatically or by user intervention, to adjust the measurement period and that period may vary from a fraction of one second to several tens of seconds. It is important therefore to characterise the repeatability of the calibrator system at several levels of current output. If this is done using one radionuclide, these results can be extrapolated to other nuclides. These repeatability measurements need to be confirmed on a regular basis to ensure that the electronics has not become noisy. 2.5 Activity Other uncertainties and errors can be introduced into the measurement due to the level of activity of the source and also due to the presence of background. 2.5.1 High Activity The current output of the chamber depends on the number of positive ions (or electrons), which reach the collecting electrode. As the activity of the source increases, so does the rate of production of ion pairs within the sensitive volume of the gas and the probability of recombination of the positive ions with electrons increases. The polarising voltage of the ionisation chamber is a compromise between the need to maintain a high electric field, which reduces recombination, and the need to avoid electrical discharges and other safety issues. The point will be reached where, as the ion production rate increases, the rate of recombination becomes significant and some of the expected current is lost. Some typical recombination curves are shown in Figure 2.2. Again, it should be noted that this is a current effect and hence the degree of recombination at a particular level of current will correspond to different levels of activity for different radionuclides.
Good Practice Guide 93 Chapter 2 20
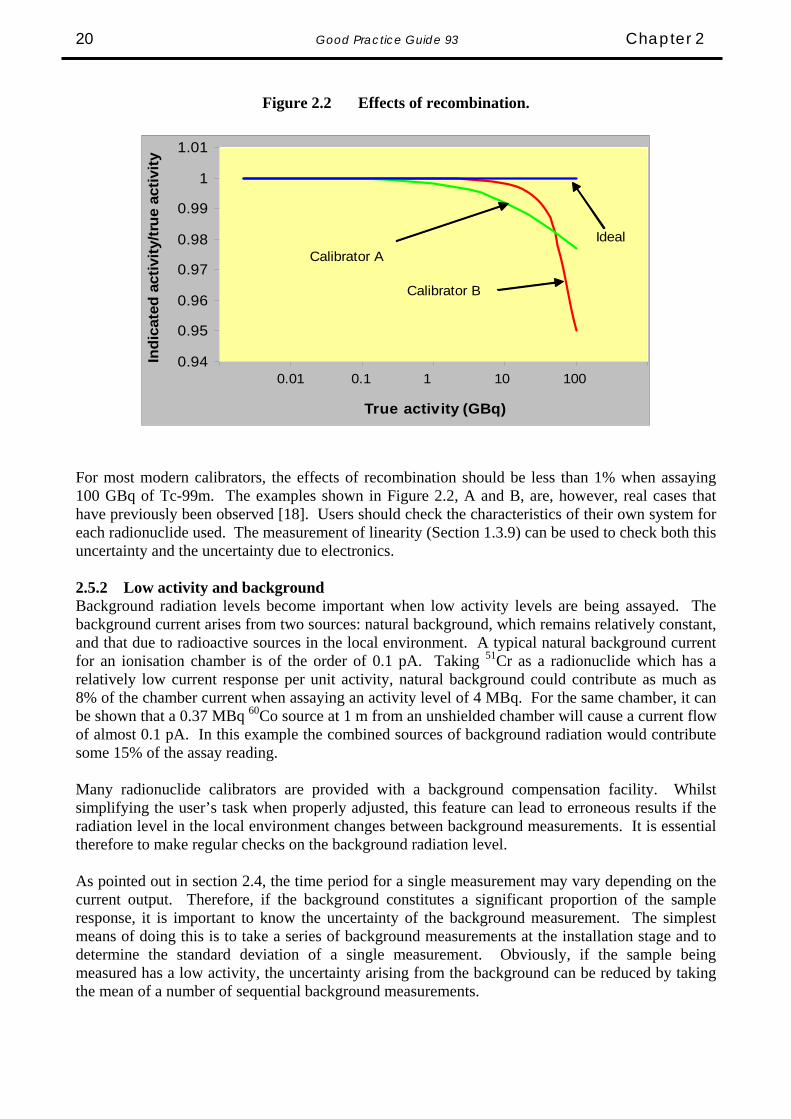
Figure 2.2 Effects of recombination.
0.94
0.95
0.96
0.97
0.98
0.99
1
1.01
True activity (GBq)
Indi
cate
d ac
tivity
/true
act
ivity
0.01 0.1 1 10 100
Calibrator A
Calibrator B
Ideal
For most modern calibrators, the effects of recombination should be less than 1% when assaying 100 GBq of Tc-99m. The examples shown in Figure 2.2, A and B, are, however, real cases that have previously been observed [18]. Users should check the characteristics of their own system for each radionuclide used. The measurement of linearity (Section 1.3.9) can be used to check both this uncertainty and the uncertainty due to electronics. 2.5.2 Low activity and background Background radiation levels become important when low activity levels are being assayed. The background current arises from two sources: natural background, which remains relatively constant, and that due to radioactive sources in the local environment. A typical natural background current for an ionisation chamber is of the order of 0.1 pA. Taking 51Cr as a radionuclide which has a relatively low current response per unit activity, natural background could contribute as much as 8% of the chamber current when assaying an activity level of 4 MBq. For the same chamber, it can be shown that a 0.37 MBq 60Co source at 1 m from an unshielded chamber will cause a current flow of almost 0.1 pA. In this example the combined sources of background radiation would contribute some 15% of the assay reading. Many radionuclide calibrators are provided with a background compensation facility. Whilst simplifying the user’s task when properly adjusted, this feature can lead to erroneous results if the radiation level in the local environment changes between background measurements. It is essential therefore to make regular checks on the background radiation level. As pointed out in section 2.4, the time period for a single measurement may vary depending on the current output. Therefore, if the background constitutes a significant proportion of the sample response, it is important to know the uncertainty of the background measurement. The simplest means of doing this is to take a series of background measurements at the installation stage and to determine the standard deviation of a single measurement. Obviously, if the sample being measured has a low activity, the uncertainty arising from the background can be reduced by taking the mean of a number of sequential background measurements.

Chapter 2 Good Practice Guide 93 21
2.6 Shielding The effects of background radiation were discussed in section 2.5.2. An effective way of reducing the effects of local environment radiation is to shield the ionisation chamber, usually with lead. Shielding will produce differences in calibration factors between the shielded and un-shielded states due to the backscattering of photons. The magnitude of this effect will depend on the type and proximity of the shielding. This effect will also occur if the chamber is placed in close proximity to a backscattering medium, for example, a solid wall. Many chambers are now provided with an integral shield but this may not be of sufficient thickness to absorb all of the backscattered radiation before it re-enters the chamber. So, if additional shielding is provided or the chamber is positioned close to a wall, users should determine whether new calibration factors need to be derived. For lead shielding, the difference between shielded and un-shielded calibration factors is most pronounced for nuclides that emit photons just above the K X-ray energy of lead (∼ 80 keV). Nuclides such as 99mTc will, therefore, be affected. Some typical data are given in Table 2.4 and show the magnitude of this effect [19]. Users should determine the magnitude of this effect for their own calibrator at their normal operating position.
Table 2.4 Variation of radionuclide calibrator response with shielding/backscatter
Shielding/backscatter conditions Increase in indicated 99m Tc activity
No shielding -
Chamber 9” (23 cm) from dry wall 2 %
Chamber 6” (15 cm) from 70 kg person 2.5 %
1” (2.5 cm) Pb in contact with exterior of chamber 19 %
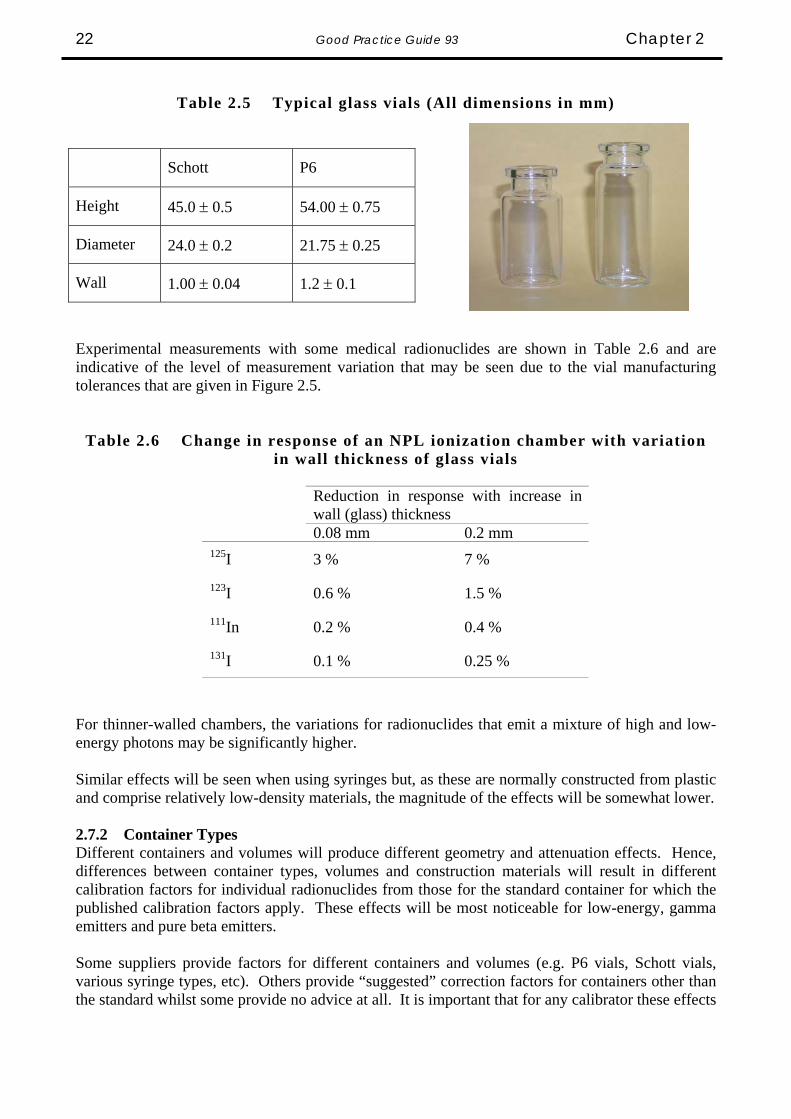
2.7 Container and Source Effects 2.7.1 Container wall thickness In the same way that responses will depend on variations in the wall thickness of the inner wall of the chamber, variations in the wall thickness of the sample container will also have an impact. The sample would normally be delivered from the supplier in a glass container. The dimensions and wall thickness variations of typical containers used in the U.K. are shown in Table 2.5.
Good Practice Guide 93 Chapter 2 22
Table 2.5 Typical glass vials (All dimensions in mm)
Schott P6
Height 45.0 ± 0.5 54.00 ± 0.75
Diameter 24.0 ± 0.2 21.75 ± 0.25
Wall 1.00 ± 0.04 1.2 ± 0.1
Experimental measurements with some medical radionuclides are shown in Table 2.6 and are indicative of the level of measurement variation that may be seen due to the vial manufacturing tolerances that are given in Figure 2.5.
Table 2.6 Change in response of an NPL ionization chamber with variation in wall thickness of glass vials
Reduction in response with increase in wall (glass) thickness
0.08 mm 0.2 mm 125I 3 % 7 %
123I 0.6 % 1.5 %
111In 0.2 % 0.4 %
131I 0.1 % 0.25 %
For thinner-walled chambers, the variations for radionuclides that emit a mixture of high and low-energy photons may be significantly higher. Similar effects will be seen when using syringes but, as these are normally constructed from plastic and comprise relatively low-density materials, the magnitude of the effects will be somewhat lower. 2.7.2 Container Types Different containers and volumes will produce different geometry and attenuation effects. Hence, differences between container types, volumes and construction materials will result in different calibration factors for individual radionuclides from those for the standard container for which the published calibration factors apply. These effects will be most noticeable for low-energy, gamma emitters and pure beta emitters. Some suppliers provide factors for different containers and volumes (e.g. P6 vials, Schott vials, various syringe types, etc). Others provide “suggested” correction factors for containers other than the standard whilst some provide no advice at all. It is important that for any calibrator these effects
Chapter 2 Good Practice Guide 93 23
are quantified across the range of containers and volumes that will be used in practice. Tables 2.7 and 2.8 illustrate the wide variations possible due to different container types.
Table 2.7 Differences between calibration factors for NPL Secondary Standard Radionuclide Calibrator for different containers, relative to 10R
Schott vials
Ratio of calibration factor for given container to that for a 10R Schott vial containing 4 ml of solution [20, 21]
Nuclide 2 ml ampoule (1 ml solution)
P6 vial (4 ml solution)
1 ml syr. (0.5 ml solution)
3 ml syr. (1.5 ml solution)
5 ml syr. (2.5 ml solution)
10 ml syr. (5 ml solution)
125I 1.27 0.91 1.56 1.47 1.35 1.34 123I 1.04 0.98 1.06 1.05 1.01 1.01 99mTc 1.01 1.00 - 0.99 0.98 0.94 131I 1.01 0.98 0.98 0.98 0.97 0.93 32P 1.05 0.97 - - - - 90Y 1.97 0.94 - - - -
Note: Syringe factors depend on the manufacture type, volume of solution as well as the needle type and length. The examples shown above are based on Becton Dickinson Luer slip syringes fitted with the green needle and containing the nominal volume of solution as shown. The variation, again, is larger for thinner-walled chambers, in particular for 123I and 111In. This is due to the low energy emissions from these radionuclides. For some calibrators over 60% of the response for 123I is due to the low-energy x-ray emissions at 27-28 keV. Some indicative measurements carried out by NPL on a Capintec CRC120 chamber are shown in Table 2.8. Table 2.8 Indicative differences between responses for Capintec CRC120 for
syringes relative to P6 vials
Typical ratio of response to that for a 10ml P6 vial containing 4 ml of solution [7, 10, 21]
Nuclide 1 ml syr. (1 ml solution)
2 ml syr. (2 ml solution)
5 ml syr. (5 ml solution)
10 ml syr. (10 ml solution)
111In 1.2 1.25 1.25 1.15 123I 1.4 - 1.6 1.25
These results show that the response for 123I activity in a syringe can be up to 60% higher than that for a P6 vial. This has clear implications for being able to accurately measure the injection dose for a patient. It is possible to derive tables of calibration factors for the vials and syringes used routinely. However, a simpler process employs a copper filter to eliminate the variations due to the
Good Practice Guide 93 Chapter 2 24
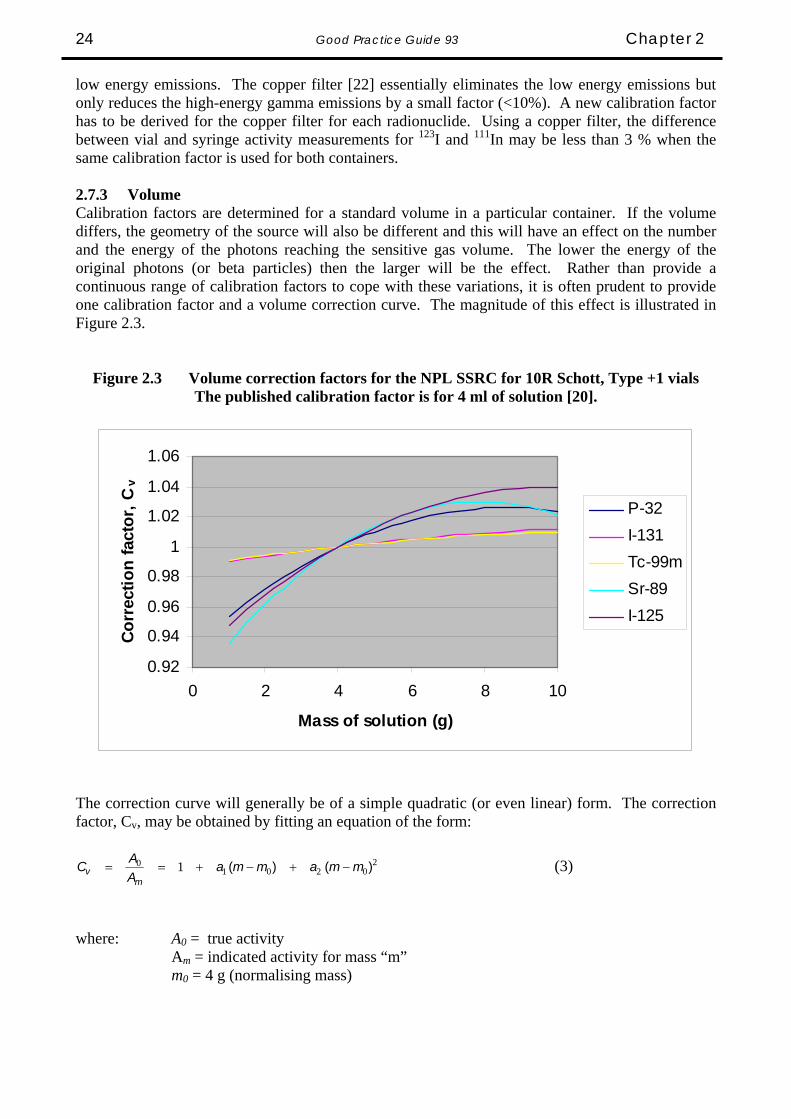
low energy emissions. The copper filter [22] essentially eliminates the low energy emissions but only reduces the high-energy gamma emissions by a small factor (<10%). A new calibration factor has to be derived for the copper filter for each radionuclide. Using a copper filter, the difference between vial and syringe activity measurements for 123I and 111In may be less than 3 % when the same calibration factor is used for both containers. 2.7.3 Volume Calibration factors are determined for a standard volume in a particular container. If the volume differs, the geometry of the source will also be different and this will have an effect on the number and the energy of the photons reaching the sensitive gas volume. The lower the energy of the original photons (or beta particles) then the larger will be the effect. Rather than provide a continuous range of calibration factors to cope with these variations, it is often prudent to provide one calibration factor and a volume correction curve. The magnitude of this effect is illustrated in Figure 2.3.
Figure 2.3 Volume correction factors for the NPL SSRC for 10R Schott, Type +1 vials The published calibration factor is for 4 ml of solution [20].
0.92
0.94
0.96
0.98
1
1.02
1.04
1.06
0 2 4 6 8 10
Mass of solution (g)
Corr
ectio
n fa
ctor
, Cv
P-32I-131Tc-99mSr-89I-125
The correction curve will generally be of a simple quadratic (or even linear) form. The correction factor, Cv, may be obtained by fitting an equation of the form:
20201
0 1 )()( mmammaAAC
mv −+−+== (3)
where: A0 = true activity Am = indicated activity for mass “m” m0 = 4 g (normalising mass)

Chapter 2 Good Practice Guide 93 25
The coefficients a1 and a2 may be calculated and also applied in practice using an Excel spreadsheet. In many cases, it may be possible to set limits on the volume that can be measured without the need to apply a correction factor, provided the magnitude of the correction is much less than the overall uncertainty of the measurement. For example, in the case of 99mTc, the correction is no greater than 1.0 % for all volumes between 1 and 10 ml in this vial. If the combined uncertainty from all other sources is say 3 %, it might be reasonable to ignore the volume correction for all volumes between 1 and 10 ml. 2.7.4 Position When a source is measured, removed from the chamber, replaced and measured again, there will be a possible difference in the two measurements arising from the inability to replace the source in an identical position. The response of the calibrator depends on both the horizontal and vertical position of the source relative to the ionisation chamber. With most systems, the source is placed at the point of maximum response on the vertical axis of the chamber using a dedicated sample holder and the change in response for a change in vertical height of a few millimetres is usually negligible. For horizontal displacement from the vertical axis of symmetry, the effect is usually also small. The spatial sensitivity of a typical ionisation chamber, mapped using a 99mTc point source, is illustrated in Figure 2.4 [22].
Figure 2.4 The spatial sensitivity of a typical ionisation chamber to a point source.
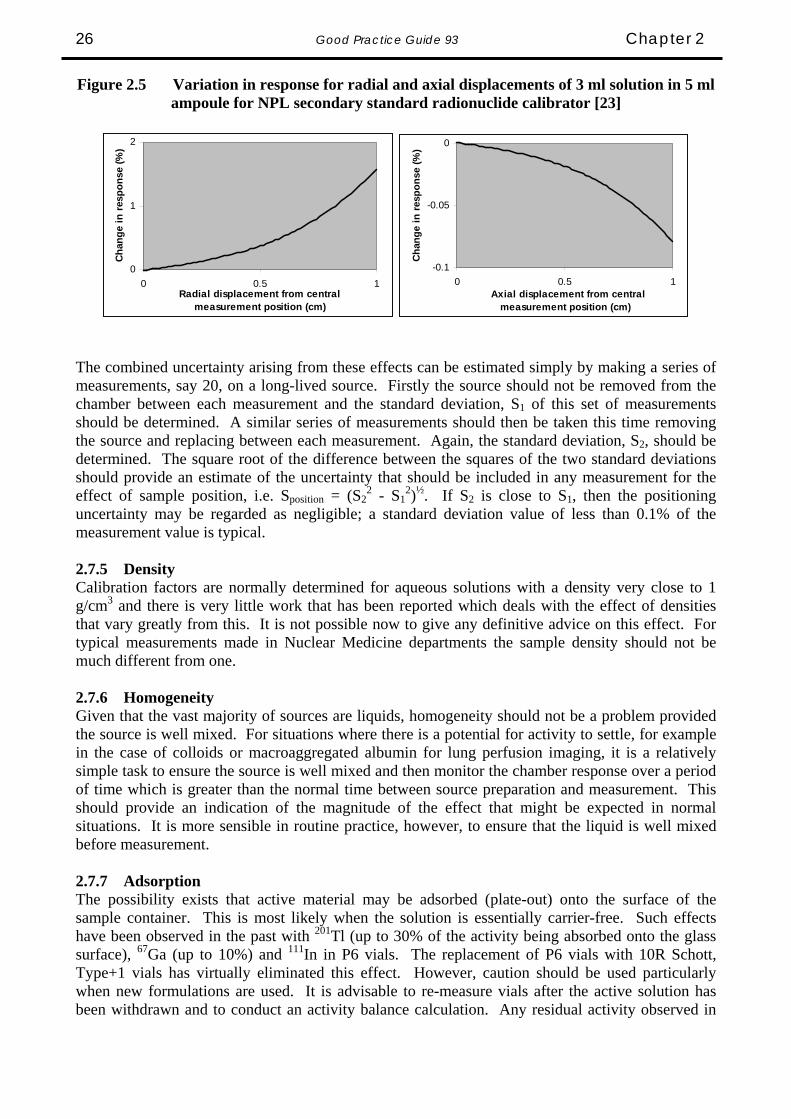
In practice, calibrators are generally used to assay a finite volume of solution in a container but the effects are very similar to those for a point source. Figure 2.5 shows the variations in response for the ionisation chamber of the NPL secondary standard radionuclide calibrator when the radial and axial positions are changed for a 5 ml ampoule containing 3 ml of solution.
Good Practice Guide 93 Chapter 2 26
Figure 2.5 Variation in response for radial and axial displacements of 3 ml solution in 5 ml ampoule for NPL secondary standard radionuclide calibrator [23]
0
1
2
0 0.5 1Radial displacement from central
measurement position (cm)
Chan
ge in
resp
onse
(%)
-0.1
-0.05
0
0 0.5 1 Axial displacement from central
measurement position (cm)
Cha
nge
in re
spon
se (%
)
The combined uncertainty arising from these effects can be estimated simply by making a series of measurements, say 20, on a long-lived source. Firstly the source should not be removed from the chamber between each measurement and the standard deviation, S1 of this set of measurements should be determined. A similar series of measurements should then be taken this time removing the source and replacing between each measurement. Again, the standard deviation, S2, should be determined. The square root of the difference between the squares of the two standard deviations should provide an estimate of the uncertainty that should be included in any measurement for the effect of sample position, i.e. Sposition = (S2
2 - S12)½. If S2 is close to S1, then the positioning
uncertainty may be regarded as negligible; a standard deviation value of less than 0.1% of the measurement value is typical. 2.7.5 Density Calibration factors are normally determined for aqueous solutions with a density very close to 1 g/cm3 and there is very little work that has been reported which deals with the effect of densities that vary greatly from this. It is not possible now to give any definitive advice on this effect. For typical measurements made in Nuclear Medicine departments the sample density should not be much different from one. 2.7.6 Homogeneity Given that the vast majority of sources are liquids, homogeneity should not be a problem provided the source is well mixed. For situations where there is a potential for activity to settle, for example in the case of colloids or macroaggregated albumin for lung perfusion imaging, it is a relatively simple task to ensure the source is well mixed and then monitor the chamber response over a period of time which is greater than the normal time between source preparation and measurement. This should provide an indication of the magnitude of the effect that might be expected in normal situations. It is more sensible in routine practice, however, to ensure that the liquid is well mixed before measurement. 2.7.7 Adsorption The possibility exists that active material may be adsorbed (plate-out) onto the surface of the sample container. This is most likely when the solution is essentially carrier-free. Such effects have been observed in the past with 201Tl (up to 30% of the activity being absorbed onto the glass surface), 67Ga (up to 10%) and 111In in P6 vials. The replacement of P6 vials with 10R Schott, Type+1 vials has virtually eliminated this effect. However, caution should be used particularly when new formulations are used. It is advisable to re-measure vials after the active solution has been withdrawn and to conduct an activity balance calculation. Any residual activity observed in
Chapter 2 Good Practice Guide 93 27
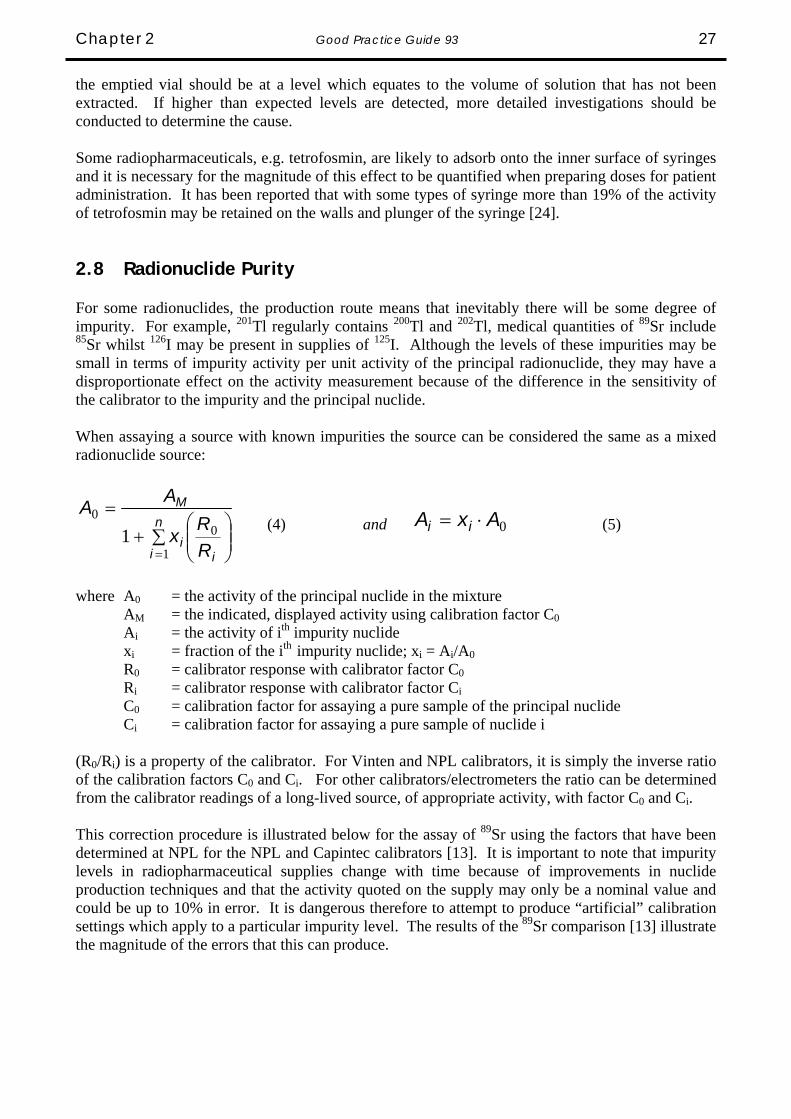
the emptied vial should be at a level which equates to the volume of solution that has not been extracted. If higher than expected levels are detected, more detailed investigations should be conducted to determine the cause. Some radiopharmaceuticals, e.g. tetrofosmin, are likely to adsorb onto the inner surface of syringes and it is necessary for the magnitude of this effect to be quantified when preparing doses for patient administration. It has been reported that with some types of syringe more than 19% of the activity of tetrofosmin may be retained on the walls and plunger of the syringe [24]. 2.8 Radionuclide Purity For some radionuclides, the production route means that inevitably there will be some degree of impurity. For example, 201Tl regularly contains 200Tl and 202Tl, medical quantities of 89Sr include 85Sr whilst 126I may be present in supplies of 125I. Although the levels of these impurities may be small in terms of impurity activity per unit activity of the principal radionuclide, they may have a disproportionate effect on the activity measurement because of the difference in the sensitivity of the calibrator to the impurity and the principal nuclide. When assaying a source with known impurities the source can be considered the same as a mixed radionuclide source:
∑ ⎟⎟⎠
⎞⎜⎜⎝
⎛+
=
=
n
i ii
M
RRx
AA
1
00
1 (4) and 0AxA ii ⋅= (5)
where A0 = the activity of the principal nuclide in the mixture AM = the indicated, displayed activity using calibration factor C0
Ai = the activity of ith impurity nuclide xi = fraction of the ith
impurity nuclide; xi = Ai/A0
R0 = calibrator response with calibrator factor C0 Ri = calibrator response with calibrator factor Ci
C0 = calibration factor for assaying a pure sample of the principal nuclide Ci = calibration factor for assaying a pure sample of nuclide i (R0/Ri) is a property of the calibrator. For Vinten and NPL calibrators, it is simply the inverse ratio of the calibration factors C0 and Ci. For other calibrators/electrometers the ratio can be determined from the calibrator readings of a long-lived source, of appropriate activity, with factor C0 and Ci. This correction procedure is illustrated below for the assay of 89Sr using the factors that have been determined at NPL for the NPL and Capintec calibrators [13]. It is important to note that impurity levels in radiopharmaceutical supplies change with time because of improvements in nuclide production techniques and that the activity quoted on the supply may only be a nominal value and could be up to 10% in error. It is dangerous therefore to attempt to produce “artificial” calibration settings which apply to a particular impurity level. The results of the 89Sr comparison [13] illustrate the magnitude of the errors that this can produce.
Good Practice Guide 93 Chapter 2 28
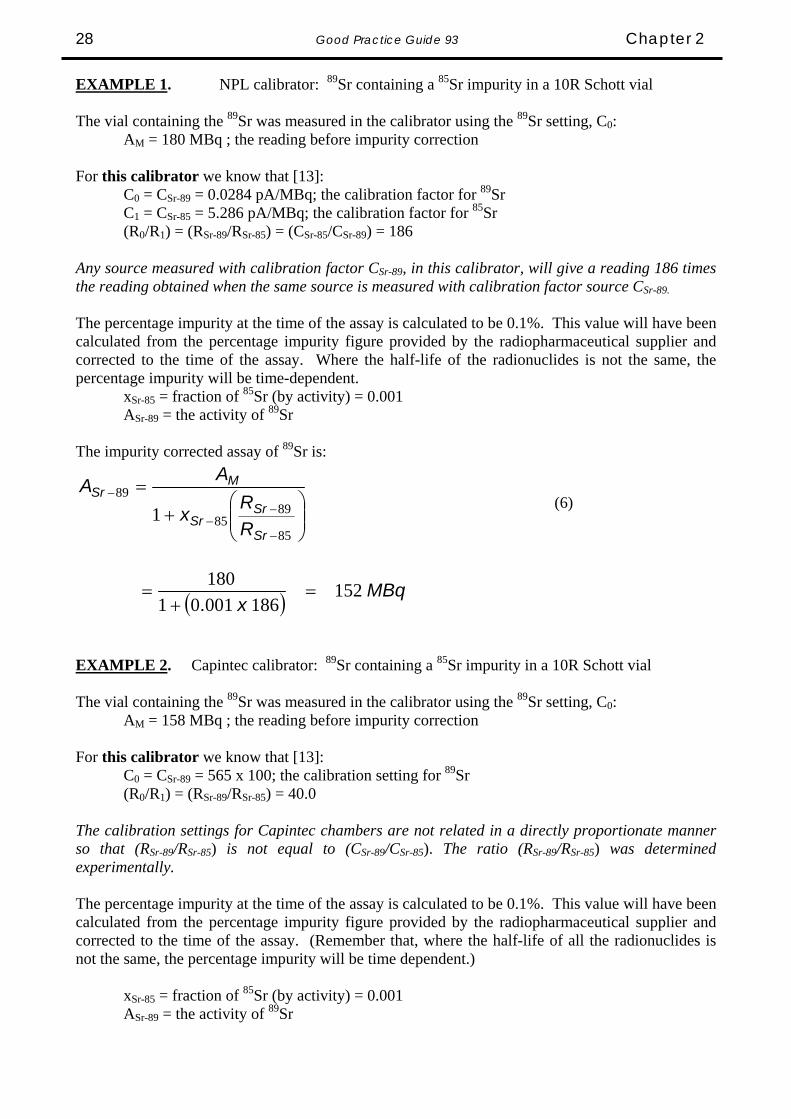
EXAMPLE 1. NPL calibrator: 89Sr containing a 85Sr impurity in a 10R Schott vial The vial containing the 89Sr was measured in the calibrator using the 89Sr setting, C0: AM = 180 MBq ; the reading before impurity correction For this calibrator we know that [13]: C0 = CSr-89 = 0.0284 pA/MBq; the calibration factor for 89Sr C1 = CSr-85 = 5.286 pA/MBq; the calibration factor for 85Sr (R0/R1) = (RSr-89/RSr-85) = (CSr-85/CSr-89) = 186 Any source measured with calibration factor CSr-89, in this calibrator, will give a reading 186 times the reading obtained when the same source is measured with calibration factor source CSr-89. The percentage impurity at the time of the assay is calculated to be 0.1%. This value will have been calculated from the percentage impurity figure provided by the radiopharmaceutical supplier and corrected to the time of the assay. Where the half-life of the radionuclides is not the same, the percentage impurity will be time-dependent. xSr-85 = fraction of 85Sr (by activity) = 0.001 ASr-89 = the activity of 89Sr The impurity corrected assay of 89Sr is:
⎟⎟⎠
⎞⎜⎜⎝
⎛+
=
−
−−
−
85
8985
89
1Sr
SrSr
MSr
RRx
AA (6)
( ) MBqx
15218600101
180=
+=
.
EXAMPLE 2. Capintec calibrator: 89Sr containing a 85Sr impurity in a 10R Schott vial The vial containing the 89Sr was measured in the calibrator using the 89Sr setting, C0: AM = 158 MBq ; the reading before impurity correction For this calibrator we know that [13]: C0 = CSr-89 = 565 x 100; the calibration setting for 89Sr (R0/R1) = (RSr-89/RSr-85) = 40.0 The calibration settings for Capintec chambers are not related in a directly proportionate manner so that (RSr-89/RSr-85) is not equal to (CSr-89/CSr-85). The ratio (RSr-89/RSr-85) was determined experimentally. The percentage impurity at the time of the assay is calculated to be 0.1%. This value will have been calculated from the percentage impurity figure provided by the radiopharmaceutical supplier and corrected to the time of the assay. (Remember that, where the half-life of all the radionuclides is not the same, the percentage impurity will be time dependent.) xSr-85 = fraction of 85Sr (by activity) = 0.001 ASr-89 = the activity of 89Sr

Chapter 2 Good Practice Guide 93 29
The impurity corrected assay of 89Sr is:
⎟⎟⎠
⎞⎜⎜⎝
⎛+
=
−
−−
−
85
8985
89
1Sr
SrSr
MSr
RRx
AA
( ) MBqx
15204000101
158=
+=
..
2.9 Nuclear Data For medical nuclides in common use, the relevant calibration factors should be well-established with traceability to national or international standards. This is the responsibility of the supplier. Where new calibration factors are required, for example, because of a change in container, this can be achieved without any detailed knowledge of the decay scheme characteristics of the nuclide. The only exception to this is that the half-life needs to be known to allow for decay between related measurements. For those medical nuclides in common use, half-lives are known to a sufficient accuracy that they should not introduce any significant contribution to the overall uncertainty of a measurement. Advice on the latest reliable half-life evaluations should be available from NPL. Where a new nuclide is to be assayed and a calibration factor is not available, it is possible to interpolate a calibration factor provided there is an accurate knowledge of both the ionisation chamber energy response characteristic and the decay scheme of the radionuclide in question. However, the response characteristic may not be available (or even measured) and the decay scheme details may not be known sufficiently well. It is strongly recommended that advice is sought from expert centres (generally a national metrology institute with experience in this area) before this is undertaken. 2.10 Simulated Sources The use of simulated sources has been shown to be a major cause of problems. A simulated source can never exactly mirror the characteristics of the radionuclide it is simulating. The ratio of its response to that of the simulated radionuclide will vary according to chamber type. Consider the example of 57Co used to simulate 99mTc. Three different ionisation chambers were found to have ratios of 99mTc: 57Co calibration figures of 0.937, 0.863 and 1.098 respectively. It can be seen that, in the worst case, a simulated source that is “calibrated” using the second chamber and is then used to calibrate the third chamber will produce an error of almost 28% in any subsequent assays of 99mTc using the third chamber. Although simulated sources may be used for long-term reproducibility measurements, it cannot be emphasised too strongly that they must not be used for calibration. Any calibrations must be achieved with the nuclide under investigation, using sources having activities which are directly traceable to national or international standards.
Good Practice Guide 93 Chapter 2 30
2.11 Specific Problem of Assaying Pure Beta Emitters Any list of radionuclides used clinically includes pure beta emitters, such as 90Y, 32P and 90Sr. The conventional radionuclide calibrator, incorporating an ionisation chamber, is designed principally for the measurement of radioactivity when the spectrum of the radionuclide includes photon emissions. However, the sensitivity of such a device is low for beta radiations as most or all of the beta particles are absorbed in or attenuated by the material of the source (e.g. the solution itself and the container walls) and the walls of the ionisation chamber. The response from beta particles arises from bremsstrahlung radiation. As beta particles decelerate in an attenuating medium, a continuous spectrum of X-rays is produced. This bremsstrahlung (braking) radiation has intensity proportional to the square of the atomic number of the absorbing material and contributes to the current produced within the ionisation chamber. Therefore, during assay of a radionuclide where the spectrum includes both beta and gamma radiations, most of the current produced in the ionisation chamber is due to the interactions of the gamma photons with a much lower contribution from the beta particles. As an example, the current produced per MBq of 131I might be 30 times greater than that produced per MBq of 32P. Pure beta emitting radionuclides are used generally for therapeutic purposes and ‘it has been customary to dispense therapeutic activities to within 5 per cent of that prescribed’ [25]. The source geometry and other factors affecting a measurement have been discussed in detail in this chapter. These factors are particularly important in the assay of pure beta emitters and particular attention must be paid to any corrections necessary due, for instance, to volume or container changes, in order to meet this more stringent accuracy requirement. At least one device is available, which uses a sodium iodide detector optimised for bremsstrahlung (Capintec Inc., Beta-C). The greater sensitivity of the sodium iodide detector results in a greater signal for the electrometer to measure. Improving the signal reduces the errors in the measurement. The accuracy of the Capintec instrument is stated to be ±5%, ‘relative to the standard sample used to calibrate the system’. The greater accuracy in a reading does not exclude the necessity for scrupulous attention to the geometry and other corrections and the system must be calibrated for the containers and volumes to be used clinically.

References
33

Good Practice Guide 93 Chapter 3 32
References 1 The Ionising Radiations Regulations 1999, HMSO, 1999. 2 The Ionising Radiations (Medical Exposures) Regulations 2000, HMSO, 2000. 3 A Parkin, J P Sephton, E G A Aird, J Hannan, A E Simpson, M J Woods. Protocol for Establishing and Maintaining the Calibration of Medical Radionuclide
Calibrators and their Quality Control. Proceedings of the joint IPSM/BIR Meeting on Quality Standards in Nuclear Medicine, BIR, London, February 1992. Institute for Physical Sciences in Medicine Report No.65, 1992.
4 VIM
International vocabulary of basic and general terms in metrology, 1993 ISO, Geneva, Switzerland. Second edition 1993.
5 M J Woods.
Intercomparison of 57Co and 125I in U.K. Hospitals 1980/81. NPL Report RS56, National Physical Laboratory, Teddington, 1981.
6 M J Woods, M Ciocanel, J D Keightley.
Intercomparison of 123I Solution Sources in UK Hospitals, 1996. NPL Report CIRA(EXT)017, National Physical Laboratory, Teddington, 1997.
7 M Baker, M J Woods.
Intercomparison of 123I Solution Sources in UK Hospitals, 2000. NPL Report CIRM 38, National Physical Laboratory, Teddington, 2000.
8 M Baker, M J Woods.
Intercomparison of 201Tl Solution Sources in UK Hospitals, 2001. NPL Report CIRM 47, National Physical Laboratory, Teddington, 2001.
9 M J Woods,
Intercomparison of 99mTc and 131I by Radionuclide Calibrators in UK Hospitals, 1986. NPL Report RS(EXT)88, National Physical Laboratory, Teddington, 1987.
10 M J Woods, M Ciocanel, J D Keightley.
Intercomparison of 111In Solution Sources in UK Hospitals, 1997. NPL Report CIRM 001, National Physical Laboratory, Teddington, 1997.
11 M J Woods, J D Keightley, M Ciocanel.
Intercomparison of 67Ga Solution Sources in UK Hospitals, 1996. NPL Report CIRA(EXT)012, National Physical Laboratory, Teddington, 1996.
12 M Ciocanel, J D Keightley, C J Scott, M J Woods.
Intercomparisons of 131I Solution and Capsule Sources in UK Hospitals, 1999. NPL Report CIRM 31, National Physical Laboratory, Teddington, 1999.
Chapter 3 Good Practice Guide 93 33
13 D K Tyler, M I Baker, M J Woods Comparison of Strontium-89 Solution Sources in UK Hospitals, 2003. NPL Report DQL-RN 012, National Physical Laboratory, Teddington, 2005.
14 ISO/IEC 17205:2005 General requirements for the competence of testing and calibration laboratories. 15 BIPM, IEC, IFCC, ISO, IUPAC, IUPAP, OIML.
Guide to the Expression of Uncertainty in Measurement. ISO, Geneva, Switzerland. ISBN 92-67-10188-9, First Edition 1993, corrected and reprinted 1995.
16 UKAS Publication M 3003.
The Expression of Uncertainty and Confidence in Measurement. Edition 1, December 1997.
17 A Beginner’s Guide to Uncertainty of Measurement
NPL Measurement Good Practice Guide No. 11, 1999 18 R J Kowalsky, R E Johnston, F H Chan.
Journal of Nuclear Medicine Technology 5, 35-40, 1977. 19 Proceedings ICRM Life Sciences Working Group Seminar (Paris, 1982).
International Journal of Nuclear Medicine and Biology 10, 65-68, 1983 20 M Baker.
Calibration of the NPL secondary standard radionuclide calibrator for the new 10R Schott, Type 1+ vials. Journal of Applied Radiation and Isotopes, (in press), 2005.
21 D K Tyler, M J Woods.
Syringe calibration factors and volume correction factors for the NPL secondary standard radionuclide calibrator. NPL Report CIRM 56, National Physical Laboratory, Teddington, 2002.
22 W Thomson
Private communication 23 M J Woods, W J Callow, P Christmas
The NPL Radionuclide Calibrator – Type 271 Int. J. Nucl. Med. Biol. 10, 127-132, 1983
24 R D Gunasekera, A B Mostafa, A Notghi, L K Harding
Tetrofosmin absorption onto syringes: is it significant? European Journal of Nuclear Medicine: 23; PMo873. p1250,1996
25 IPEM
Medical and Dental Guidance Notes (paragraph 12.7, p113) ISBN 1 903613 09 4 , York, 2002.

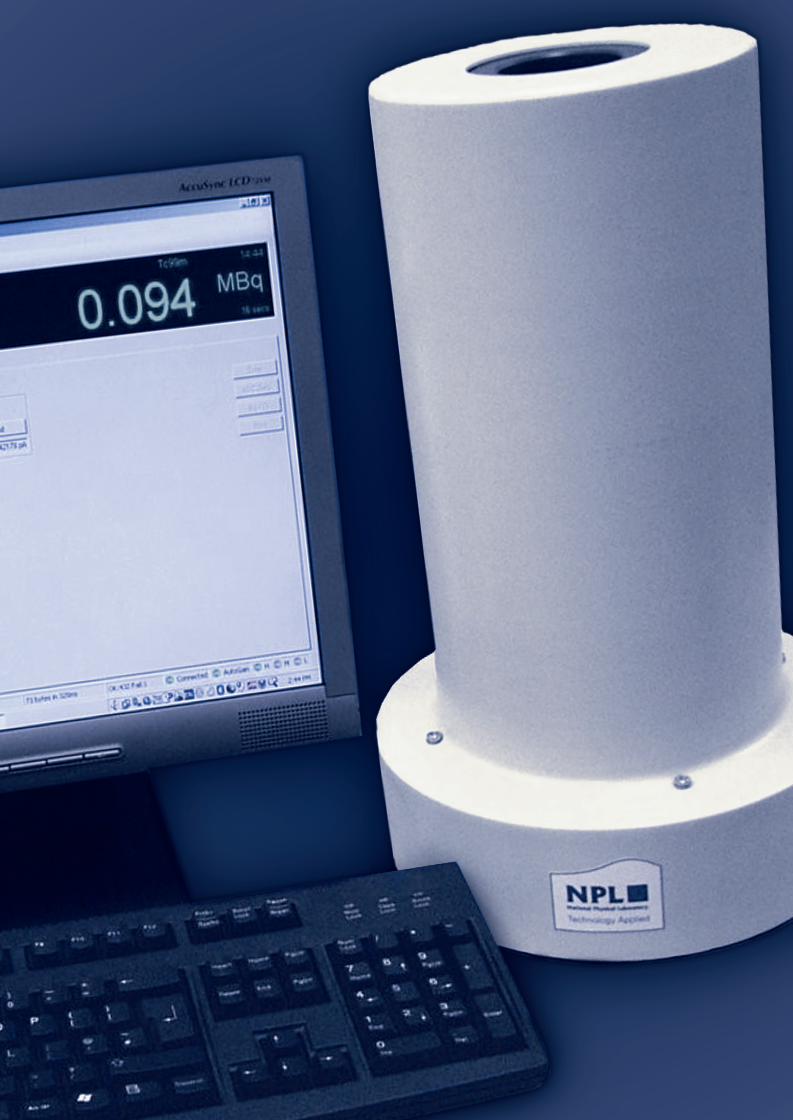
6302 GPG 93 25/5/06 4:57 pm Page 3