ted angradi, us epa - united states environmental ...€¢ emap-gre assessment will be based on...
TRANSCRIPT


Ted Angradi, US EPATed Angradi, US EPABiological Indicators WorkshopBiological Indicators Workshop
October 24October 24--26, 2006 Duluth, MN26, 2006 Duluth, MN
EMAPEMAP--GRE reference condition: concepts GRE reference condition: concepts and results of data explorationand results of data exploration

Topics
• Least disturbed condition and the EMAP-GRE assessment
• Stratification of reference condition • Stressor metrics useful for screening• Models for screening

The assumption“Regardless of the extent of human disturbance in a region, some stream sites will have less human disturbancethan others and these yield the bestexisting [or least disturbed]conditions”
Stoddard et al. 2006

“[On] large rivers, reference sites may be upstream of major sources of disturbance or as far as possible from upstream sources, cities, and dams”
Hughes 1995
Internal reference condition
In 2006 we tried to find and sample those sites

We have sampled all the sites and now we need to screen them to identify
reference sites
• Iterative process to determine which sites are in “least disturbed condition” (LDC).
• Select reference sites that are representative of the full range of healthy conditions in each river/reach and are consistent with the objectives and reporting units for EMAP-GRE

Least Disturbed Condition• Sites with “the best available physical,
chemical and biological habitat conditions given today’s state of the landscape”(Stoddard et al. 2006)
• EMAP-GRE assessment will be based on least disturbed conditions (LDC) by default. Other thresholds based on best attainable condition or whatever will be incorporated as available.

Metrics for screening
• Important theme of this meeting• Large number of potential metrics
– Stressor metrics – Human disturbance metrics– Biological metrics

Metric class Metric Relationship to condition
Water chem Total P Negative
Water chem Total N Negative
Water chem Sulfate Negative
Water chem Chloride Negative
Water chem DO Positive
Water chem Turbidity Negative
Water chem Total dissolved metals Negative
Exposure Sedtox (amphipod survival) Negative
Phab LWD density (fish habitat) Positive
Phab Development score Positive
Phab Human influence index Negative
Some of the many available EMAP-GRE stressor/human disturbance metrics

Metric Class
Metric Relationship to condition
Phab Riparian disturbance index Positive
Phab Vegetative cover index PositiveBiology Percent DELT anomalies Negative
Landscape Route distance upriver to dam Positive
Landscape Route distance upriver to NPDES PositiveLandscape Route distance upriver to large trib PositiveLandscape Route distance upriver to small trib Positive
Landscape Local percent cultivated (5 k radius) Negative
Landscape Local percent forest + wetland (5 k radius) Positive
Landscape Local impervious surface (5 k radius) Negative
Landscape Local watershed LU/LC metrics TBD na
Screening metrics, cont.
* Metrics in yellow included in screening examples

Most screening metrics have issues
• Some have reach-specific significance (LWD)• Some have river-specific patterns (turbidity)• Some have lots of missing values • Metrics likely vary in strength of relationship to
biotic assemblages• Some may be discharge - sensitive (nutrients,
ions)• All are flawed, so using multiple metrics is more
reliable

Stratification of reference condition and the assessment
• Stratification = different reference sites for different reaches or aquatic habitats
• Geographic stratification will influence the condition assessments because there will be longitudinal patterns in condition. So there are policy implications of stratification.
• E.g., the “lower” lower Missouri will likely be in worse condition than the “upper” lower Missouri if they are judged by the same (unstratified) reference condition.

“upper lower” vs “lower lower”

No 2004 Upper
MO fish data
Longitudinal variation in fish species richness

Longitudinal variation in % tolerant individuals

Stratification, continued• These differences would be partially masked by
geographic stratification of reference (within the lower Missouri) because LDC on a more impacted reach will be more disturbed than LDC on a less impacted reach.
• More strata will reduce confidence in condition thresholds because of lower N so we should use stratification judiciously.
• Strata ≠ reporting units. Strata-specific condition class thresholds can be “behind the scenery”.

Geographic stratification of Missouri River
• Large differences in stressor metric values between Upper and Lower Missouri River
• Upper Missouri= ? – above Ponca (above the last dam tailwater)– Above Lake Oahe (above the last large dam)
• Upper River strongly influenced by large deep-release reservoirs; little industry, urban, or riprap
• Aridity gradient: 16 degrees longitude end to end (OH = 9)
• A qualitative vs. a quantitative difference

Extent of EMAP-GRE Phase I
Upper vs Lower

Ft. Peck Dam
Garrison Dam
Ft. Randall Dam
Reservoir influences

Little urbanization

Fewer permitted outfalls

MO temp range = 15MS temp range = 5OH temp range = 6
The Upper Missouri River is different
Much cooler

Consequences of not stratifying LDC on Missouri River
• Upper river sites probably over-represented in reference set if not stratified.
• But these sites are not really in LDC relative to the lower river because of the dams and related effects
• Assessing the lower river using (mostly) upper river reference criteria problematic politically
• Similar issues on Mississippi (?) but geographic stratification potential might be limited by sample size.

Habitat stratificationImportant because variation among widespread
and “permanent” aquatic habitats may be greater than variation due to stressors
riprap “natural”

There is plenty of evidence for a strong riprap effect on the structure of Great River invertebrate assemblages
From Angradi et al., submitted
Upper Missouri River, ND

Strong effect of riprap on the percent pollution tolerant invertebrates…But riprap isn’t pollution

Mississippi
Missouri
Percent revetmentRiver mile
Fish
spe
cies
rich
ness
Effect of riprap on fish assemblages less clear

Less riprap because no navigation
and less to protect
Revetment patterns vary among rivers
Less riprap becausebanks naturally stable

Reality check
Habitat stratification may be essential because if we assume riprap is a stressor rather than a habitat strata, then riprap would drive invertebrate indicator development because I don’t think we can build IBIs that will “ignore” the riprap to indicate condition independent of dominant shoreline substrate.
* Problem most severe on Missouri River; nav pools seem to reduce riprap effects

• Mississippi– longitudinal strata not essential – Possibly 2 habitat strata (>50% revetment and <50% revetment) – pools vs open river (=185 miles) needs discussion
• Missouri– 2 reach strata (e.g., above and below Ponca) – 2 habitat strata (e.g., >50% revetment and <50% revetment)
• Ohio– no longitudinal or revetment strata– ORSANCO-type substrate strata

For assessment purposes…• This means potential for different condition class
thresholds for each strata for invertebrates.• Condition class thresholds for biota not effected by riprap
could be determined for the pooled set of riprap and non-riprap reference sites.
• Results still reported out by river and state, not by strata. • Habitat stratification improves spatial representativeness• Can and will still report out %revetment for all reporting
units.• Multivariate exploration of assemblages of reference
sites will clarify stratification picture (NMDS)

Approaches to screening

Example of pass/fail screening for wadeable streams
For EMAP wadeable stream datasets, the reference sites are generally screened on chemistry and physical habitat variables with region-specific criteria.
Pass all = reference; fail any = non reference
Simple and proven for smaller streams and lakes

Using WSA “plains” criteria, lower 600 miles of Missouri River not
in LDC. This may be true but unwise to base it on one metric.


MAIA threshold
Pass/fail criteria, continued
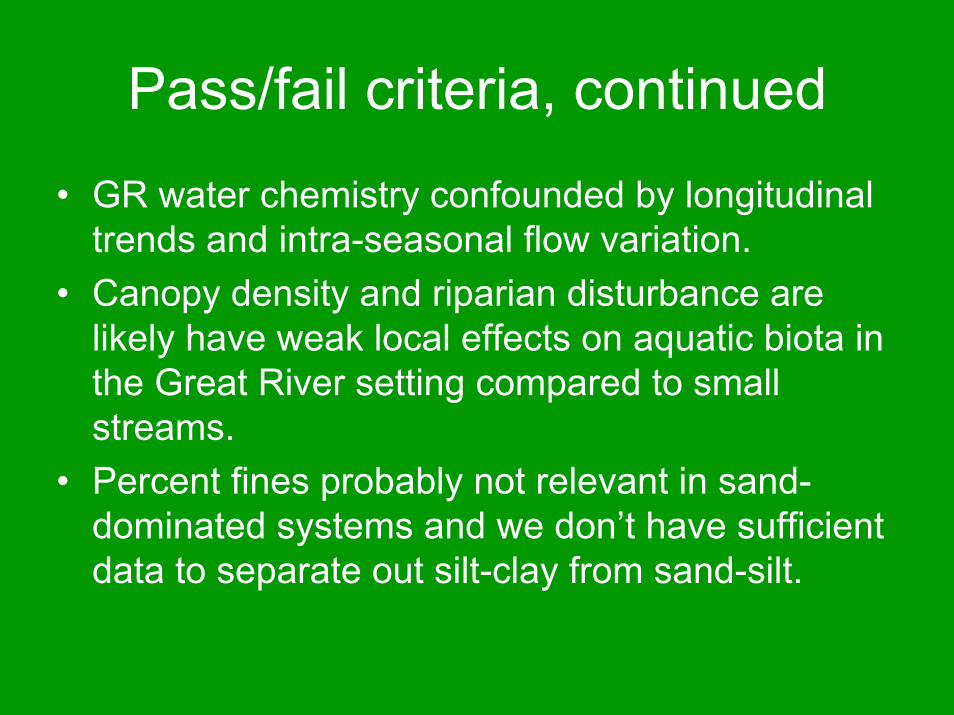
• GR water chemistry confounded by longitudinal trends and intra-seasonal flow variation.
• Canopy density and riparian disturbance are likely have weak local effects on aquatic biota in the Great River setting compared to small streams.
• Percent fines probably not relevant in sand-dominated systems and we don’t have sufficient data to separate out silt-clay from sand-silt.

Pass/fail, continued
• Requires expert knowledge to set P/F criteria for each metric
• We will try to adapt the P/F approach to GRE data, but we want to explore other approaches if doesn’t work out
• Alternative: additive multimetric approach

Example: additive multimetric with continuous scoring (one possible mm approach)
• Normalize all stressor metrics to 0-1• Sum metric scores for each site to calculate an
additive score for the site • >75th pctl of scores = LDC • <25th pctl of scores = MDC• 13 metrics in this example: DO, turbidity,
development score, total P, total N, CL, SO4, dissolved metals, sedtox, % cultivated, % forest+wetland, %impervious surface, LWD density

Metrics for Mississippi River

Best site
Worst siteRaw data
Normalize scores to 0 – 1
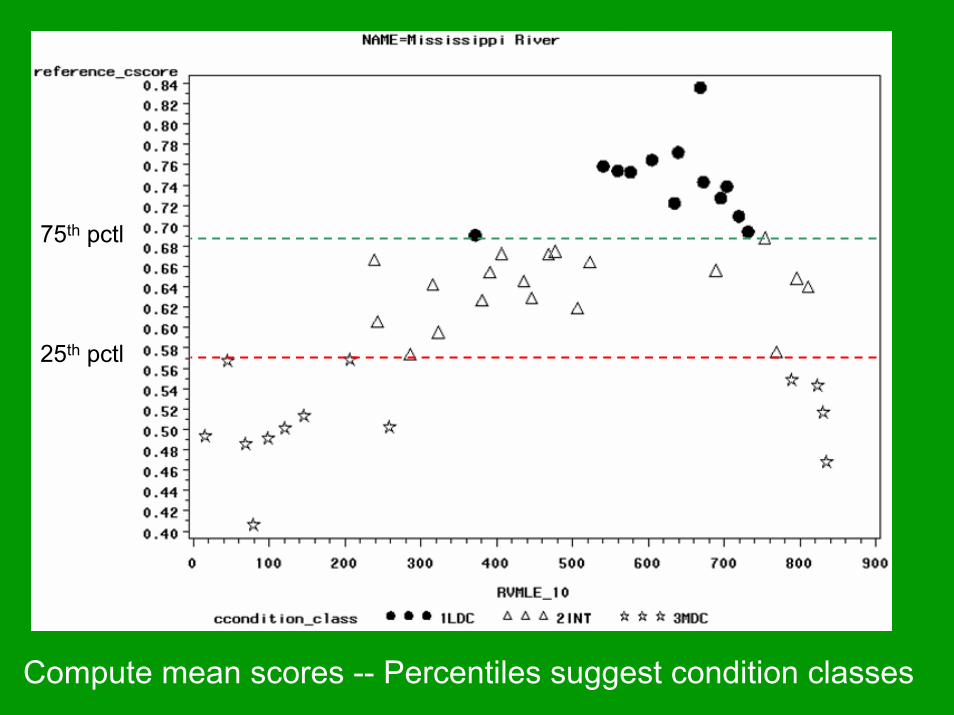
Compute mean scores -- Percentiles suggest condition classes
75th pctl
25th pctl


Percentiles suggest condition classes
If unstratified all LDC sites in Upper River

Lower river scored independently

Percentiles suggest condition classes

Test this particular model using biology – fish S
LDC > MDC = (

LDC > MDC = (
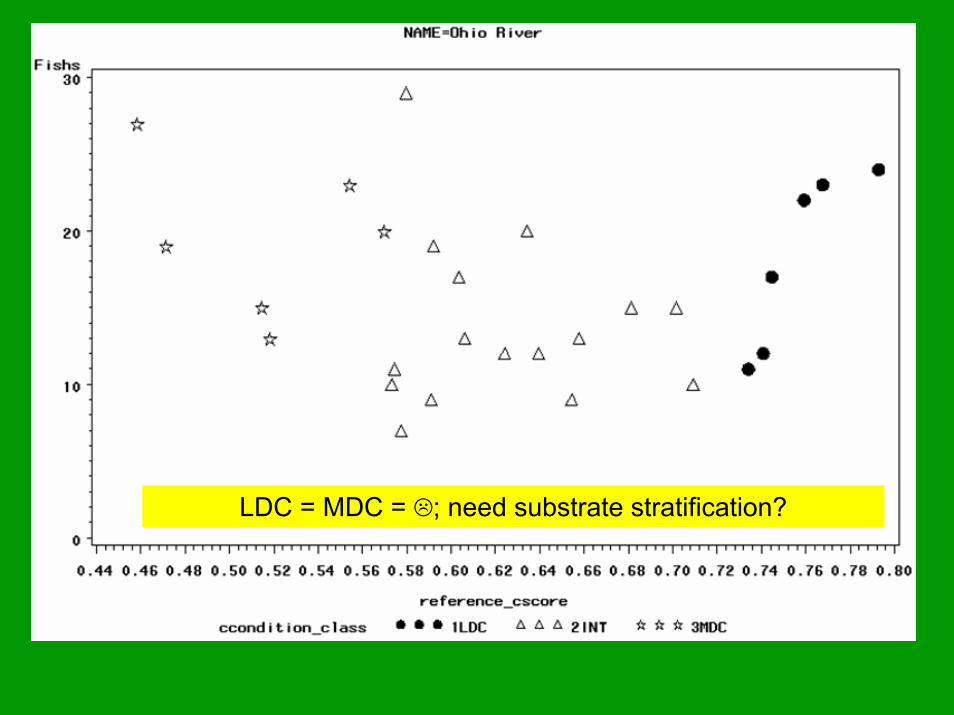
LDC = MDC = ;; need substrate stratification?

*This is not the model (metrics, criteria, screen) this is just one possible model from among
many models.
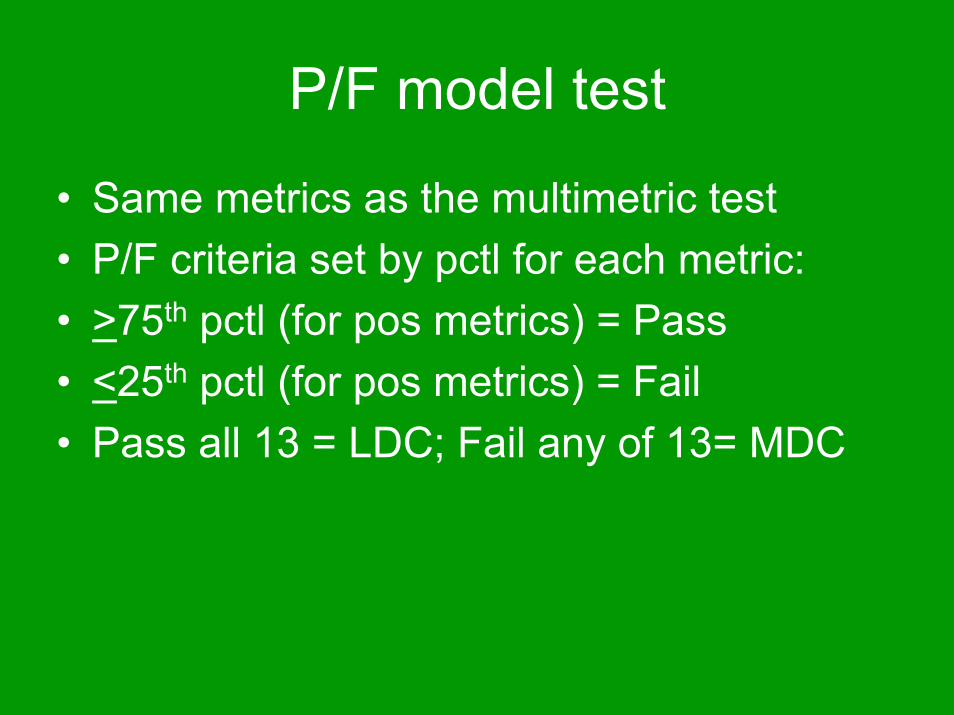
P/F model test
• Same metrics as the multimetric test• P/F criteria set by pctl for each metric:• >75th pctl (for pos metrics) = Pass• <25th pctl (for pos metrics) = Fail• Pass all 13 = LDC; Fail any of 13= MDC

Nearly all sites in mostdisturbed condition

Pass/Fail for GRE
• Almost every site fails for at least one metric on all 3 rivers.
• Almost no sites pass every metric• GRE sites bi-polar?• Can we use biology to provide expert
knowledge for setting criteria instead of using arbitrary percentiles?

LDC
MDC
Hard criteria based on pctls

Criteria based on bioticresponse
Potential LDC Non-LDC

LDC
MDC
Hard criteria based on pctls“Reference potential” criteria based on biotic response:
lots more sites pass through
LDC

Using biology data
• Not used to pick sites directly • Biotic-response plots may be useful for
setting metric criteria for P/F or multimetric models (a substitute for 10+ years expert experience with screening small stream data)
• Concordant biology approach


Reference potential criteria (floor or ceiling) for each metric used in P/F or multimetric screen

One last concept: LDC really bugs some people because it “sets the bar too low” for GREs
Can we do something more than an assessment based strictly on LDC?
Can we derive something like best attainable conditions (BAC) from empirical models?
Assumption: LDC and BAC overlap to some degree (or come really close).
BAC of tomorrow
All sites today
PristineLDC
The condition gradient

Use empirical models to approximate BAC for selected metrics based on best possible additive metric score (=1).
BAC > 39 species(Upper 95% CL for y-intercept)
• Doesn’t require reference sites• Report out departure from BAC or species loss• Augment assessment based on LDC?

• There are no shortcuts. Screening will be an iterative process.
• We will try multiple screening approaches.• The multimetric model seems promising
for GRE data.• Geo-stratification probably necessary for
Missouri River and habitat stratification for all rivers
ConclusionsConclusions

Conclusions, continued
• Strong longitudinal patterns in condition are likely for MS and MO.
• Adding additional landscape and riparian metrics should improve screens
• Using biotic data as “expert knowledge” to help set criteria may be useful.
• The 3 rivers are very different – likely to need different metrics and stratification schemes to optimize screening.

There is variability in stress/disturbance among sites that is reflected in the biota.
We have lots of stressor and disturbance metrics from which to pick combinations to use for screening
Prognosis: good!

EMAPCO IBI EMAPCO IBI -- O O –– MaticMatic