technology transfer and domestic innovation: evidence...
TRANSCRIPT

Technology Transfer and Domestic Innovation:
Evidence from the High-Speed Rail Sector in China
Yatang Lin †
Yu Qin‡
Zhuan Xie§¶
This version: April 29, 2017
†CEP, Department of Economics, London School of Economics, London WC2A2AE, United Kingdom(email:[email protected]).
‡Department of Real Estate, 4 Architecture Drive, National University of Singapore, 117566, Singapore.(email: [email protected]).
§State Administration of Foreign Exchange, 100032, Beijing, China. (email:[email protected]).¶We are grateful to Xiaobo Zhang for sharing with us the Chinese patent data, and to Luciano Kay and
Ismael Rafols for sharing with us their technological similarity calculations. We thank Duyi Chen for herexcellent research assistance. All errors are ours.
1

Abstract
This paper investigates China’s high-speed railway (HSR) technology introduction to
show how it spurs innovation in local regions and in relevant industries. The large-scale
technology introduction, covering specific technology categories and directly benefiting
railway-related firms from various cities, enables us to specifically depict how foreign
technology is digested and spurs follow-up innovation in and out of directly receiving
firms. We find that technology transfer leads to a 42% significant increase in HSR-
related patents granted in cities with direct technology receivers. In addition, we
also find evidence on sizable spillovers to firms that are not directly related to the
railway industry, whereas technology similarity and the existence of relevant research
institutions play important roles.
Keywords: Innovation; Foreign Technology Transfer; Knowledge Spillover;
China
JEL classification: O25; O33; O38
2

1 Introduction
Over the past decades, emerging economies, notably China, have experienced impressive
growth in technological innovations. It is widely believed that direct technology transfers
from OECD multinationals to their subsidiaries in developing countries help these countries
gradually approach the technology frontier, but how large are these effects? How is advanced
transferred technology digested, renovated and diffused in a developing country? Although
many empirical studies support the presence of productivity spillovers of FDI (Javorcik,
2004 [24]; Liu et al., 2000 [30]), it is difficult to disentangle the contributions of direct
technology transfer from the overall benefits of FDI, which include forming trade networks,
innovation in advertising and management, introducing new products and generating new
demands. A clean identification of the direct impacts of technology transfer is necessary for
further examining the mechanisms of technology spillovers from multinational corporations
(MNCs) to their host countries.
This paper attempts to identify the direct and spillover effects of foreign technology trans-
fer by exploiting the introduction of the state-of-art high-speed railway (HSR, thereafter) in
China during its unprecedented large-scale expansion of the HSR system. This is a classic
example of the Chinese government’s promotion of ‘quid pro quo’, also known as market for
technology, policies that aimed at helping Chinese companies acquire advanced technology
from foreign multinationals by asking the latter to sign technology transfer contracts to enter
Chinese markets (Holmes et al., 2015) [20]. There is an abundance of anecdotes about the
existence and importance of these type of policies. However, rigorous empirical evidence on
their effectiveness, as well as the impacts on innovation out of their direct focus through
knowledge spillovers, is scarce if not nonexistent. A major empirical difficulty in examining
the effects of direct international technology transfer is that the technology transfer contracts
between firms are usually business secrets, and a large proportion of them happened without
written contracts. Even if information on technology cooperation between firms is publicly
available, the exact types of technology transferred are not usually observed by researchers.
In this project, we have data access to the recent massive wave of HSR technology intro-
duction to China. This setting is ideal for studying the impacts of international technology
3

transfer on developing countries’ domestic innovation for a number of reasons. One the one
hand, the scale and coverage of this wave of technology transfer was unprecedented. The
two major train manufacturers in China, China Southern Railway Corp. (CSR) and China
Northern Railway Corp. (CNR) signed technology transfer contracts with all of the four
major technology providers at the time and introduced a complete line of HSR technology
ranging from engines, dynamos, and electricity transmissions to railway signal control sys-
tems.1 Many of these technologies have applications separate from the HSR system and have
great potential for technology spillovers.2 On the other hand, we have clear information on
the types of technology introduced and the identities of the firms that received them. These
firms, owned by CSR or CNR, are located in 25 cities. Individual CSR- and CNR-affiliated
firms usually only import particular subsets of technology, which provides us with helpful
variation in the magnitude of technology transfer at the subsidiary-technology level. We
also have a list of certificated suppliers for the HSR by the Ministry of Railway (MoR). This
helps us separate the effects of demand-driven innovation from knowledge spillovers because
we can focus on firms that are neither receivers of these technologies nor direct suppliers to
the Chinese HSR projects.
We assemble a unique dataset that matches information on patents that were applied
for at the State Intellectual Property Office of China (SIPO) to firm-level variables from the
Annual Survey of Industrial Firms (ASI) of China from 1996 to 2009. Firms are geocoded
according to their addresses to study the spillover effects within city. We begin by estimating
a triple-difference model that relates technology transfer within a given technology class (de-
fined by 4-digit International Patent Class (IPC)), city and year to total patents applied in
the same technology class, city and subsequent years, conditioning on a full set of city, tech-
nology class, year fixed effects and flexible growth trends. Our preliminary analyses reveal a
significant 42% increase in HSR-related patents granted in cities with direct technology re-
ceivers. The magnitude drops to 20% after we exclude patents that were applied for directly
by CSR or CNR affiliates and HSR suppliers, but it remains significant. These findings
1The four major providers include Alstom, Siemens, Bombardier, and Kawasaki Heavy Industries. Apartfrom the four major technology providers, CSR and CNR also work with other foreign firms, such as Toshiba,General Electric and ABB, on technology solutions for specific parts.
2China Railway Yearbooks (2002-2005).
4

show that technology transfers from developed countries do significantly spur innovation in
receiving developing countries, within and outside of the direct technology recipients.
We then further examine the mechanisms behind the knowledge spillovers from both
cross-city and within-city perspectives. Our results from both dimensions suggest that tech-
nological similarity plays an important role: for cross-city analysis, we observe a significant
increase in patent applications in technology classes that are closer to the transferred technol-
ogy; for within-city firm level analysis, we find that firms within a few miles distance to the
technology receiving firms apply (and are subsequently granted) for more patents. Moreover,
the firms closer to direct technology receivers not only innovate more, but also experience real
economic gains in terms of higher revenue and productivity after the technology transfer.
Such effects are stronger for firms with similar technology to the technology-receiving firms
but not for firms with stronger input-output linkages to the railway sector. Another piece
of evidence on the heterogeneity of spillover effects is that cities with stronger university re-
search background in related fields have much greater increases in patents from non-railway
related firms in HSR technology classes, even if these cities do not have any CSR or CNR
subsidiaries and do not receive technology transfer directly.
Our findings have a number of policy implications. First, our estimation shows the
effectiveness and limitations of ‘quid-pro-quo’ policies and the role of government-promoted
technological pushes in domestic innovation activities. This could be a very important lesson
to learn for other emerging markets that aspire to develop technological bases from scratch.
Of course, some special institutional features in our example, such as the large Chinese
market for railway and the monopoly power of CSR and CNR in this market might facilitate
or hinder the implementation of this policy. Hence, we find it necessary to examine the
actual mechanisms at work during and after the whole process of technology transfer, such
as changes in patenting behavior of receiving firms in different areas, channels of knowledge
spillovers, and changes in product market performance of relevant firms.
Second, our findings provide evidence on the importance of absorptive capacity, such as
technology similarity and relevant university research capacity, on the magnitude of technol-
ogy transfer spillovers. Our results indicate that firms located in technology-receiving cities
specializing in similar technology experience the largest positive spillovers from the technol-
5

ogy transfer. This finding highlights the importance of within-city clustering of high-tech
firms. Policy makers who want to maximize the impacts of introduced foreign technology
may want to place them in cities with existing clusters of technologically related firms or im-
plement other industrial policies to enhance the local spillovers of technology. Our findings
also reveal the complementarity between basic research strength and specific technology, un-
derlining the importance of universities and other basic research institutes as intermediaries
of knowledge spillovers into firms and cities that do not have direct access to the transferred
technology. From a policy perspective, encouraging industry-university cooperation in di-
gesting transferred technology may prove to be highly important in making better and wider
use of this technology.
The paper is structured as follows: section 2 discusses related literature; section 3 prepares
the readers with the institutional knowledge of technology transfer in the HSR sector in
China; section 4 introduces the data and identification strategies; section 5 presents the
main findings; section 6 discusses the mechanisms; and section 7 concludes.
2 Related Literature
Our paper has its antecedents in the rich literature of FDI and other MNC activities in the
developed and developing countries. Keller (2010) [26] systematically examines technology
spillovers through international trade and MNC activities and finds imports to be a more
significant channel of technology diffusion than exports. Blalock and Gertler (2005) [6]
distinguish two types of externalities through FDI: horizontal flows to local competitors (or
spillovers) and vertical flows to backward-linked suppliers. Hale and Long (2007) [17] finds
mixed evidence on the effects of FDI spillovers on the productivity of Chinese domestic
firms. Using a production function approach, Barrell and Pain (1997) [5] find that FDI has
a significant effect on technical progress in the private sector in the United Kingdom. The
closest paper on FDI-driven innovation is Lin and Cheung (2004) [12], which finds positive
effects of FDI in domestic patent application at the provincial level. The spillover effect is
the strongest for minor innovations such as external design patents. Our main contribution
to this literature is to single out the pure impacts of technology transfer from the aggregate
6

effects of FDI and MNC activities in general, which allows us to clearly examines the channels
of technology spillovers on domestic innovation. In additional, being able to merge firm
characteristics with patents application data allows us to separate knowledge spillovers from
product market impacts and delve deeper into mechanisms.
The recent paper by Giorcelli (2016) [18] is one of a few papers that directly look at
technology transfer on firm performance, exploiting the transfer of the US expertise into
Italy during the Marshall Plan. They find that management and technology transfer has
persistent effect on firms’ survivorship, sales, employment and productivity, with the transfer
of management practices playing a more long-lasting role. Our paper deals with an episode
of technology transfer that is of larger scale and covers more frontier technologies. As a
result, we focus on the role of technology transfer in spurring innovation not only in direct
receivers, but also in other related firms, and looks closer into the spillover mechanisms.
A number of papers emphasize the importance of absorptive capacity as a key mechanism
of FDI’s effect. For example, Borensztein et al. (1998) [10] find that FDI contributes
to economic growth only when a sufficient absorptive capability (such as minimum stock of
human capital) is available in the host country. Using the cases of Czech Republic and Russia,
Sabirianova et al. (2005) [34] argue that firms need to be more technologically advanced and
open to competition in order to be able to gain from foreign presence. In the context of
China, the recent paper by Lu et al. (2017) [31] find that FDI has a negative and significant
effect on the productivity of domestic firms in the same industry, which is not attenuated
by absorptive capacity, measured by firms’ R&D investment and ownership structure. Our
paper adds to the discussion by quantifying absorptive capacity using technology similarity
and the presence of university research strength, and showing the importance of absorptive
capacity on positive FDI spillovers at both firm level and aggregate (city-year-technology
class) level.
We also contribute to the rich literature on knowledge spillovers. The seminal paper by
Jaffe, Trajtenberg, and Henderson (1993) [23] shows the importance of geographic proximity
in explaining the transmission of knowledge using US patent citation data. Bloom, Schanker-
man and Van Reenen (2013) [9] investigate the externalities of R&D spending through knowl-
edge spillovers and product market rivalry channels and find both channels important, al-
7

though significant heterogeneity exists across sectors. Our paper is particularly interested in
how far a top-down massive technology import plan initiated by the government can go in
private sector innovation. We are able to separate knowledge spillovers from product market
effects quite cleanly and look more closely at the actual mechanisms at work with detailed
information on HSR-driven demands.
On a related note, this paper looks at university-industry collaboration and spillovers
from a novel perspective. Two aspects of our research stand out as interesting. First, differ-
ent from the majority of literature on university-industry relationships in innovation — which
study how university research is disseminated into related industries and how it leads to joint
university-firm R&D activities (Abramovsky et. al. (2007) [2], Abramovsky and Simpson
(2011) [1], Anselin et. al. (1997)[3], Audrestsch et al. (2004) [4], Kantor and Walley (2014)
[25], Sharon and Schankerman (2013) [7]) — we focus on the other way around by studying
how a sudden shock to the knowledge stock of a few firms exerts wider impacts on innovation
in related sectors through industry-university knowledge flows. Only a small body of litera-
ture examines the industry-to-academia feedback loop empirically (Furman and MacGarvie
(2007)[15] and Sohn (2014)[35]). To our best knowledge our paper is one of the few that looks
at both sides of the feedback loop and focuses on causal identification. Second, contrary to
the previous research that mostly focuses on localized knowledge spillovers and local agglom-
eration, we examine the roles of both geographic proximity and technological similarity in the
transmission of knowledge out of direct transferred-technology-receiving firms. We find that
in this special case of knowledge spillovers from firms to universities, technological similarity
plays a much more important role, suggesting that industry-university knowledge trans-
mission is usually intentional and targeted, which is likely to overcome most geographical
barriers. This implication echoes and complements previous research on university-industry
joint research projects (D’Este et. al. 2012[13]) that finds industrial firm clusters and
previous collaboration experiences relax the effects of geographic proximity on determining
university-industry collaboration.
An analogy can be drawn between this large-scale import of HSR technology and the
defense-driven R&D spending in the US during cold war. They are both plausibly exogenous
government-led pushes in a country’s technology capital in particular sectors. A major
8

difference here is that China is a developing country that is attempting to catch up with the
technology frontier whereas a ’big push’ in the US is pushing the global technology frontier
forward. There is also a small body of literature on the effects of US defense spending on
innovation. For instance, Draca (2013) [14] shows that defense procurement accounted for
6-11% of the increases in patenting during the early Reagan build-up period in the US.
The magnitude is noticeably smaller for that found in our Chinese HSR technology import
study, which could potentially reflect the differences between the difficulties of developing
new technology and adapting existing technology.
3 Background
3.1 China’s technology transfer in the HSR sector
State planning for China’s HSR began in the early 1990s, but the actual mass construction
of the HSR was not on the agenda until the first decade of the 21st century, following the
pressing need to increase railway capacity due to seriously overcrowded conventional lines. In
2003, Zhijun Liu, the then newly appointed Minister of Railway of China, proposed his ’Great
Leap Forward’ strategy, which focused on introducing HSR (Liu, 2003) [30]. From the very
beginning, the state planners in China focused on achieving indigenous HSR technology.
Developing indigenous capability based on acquired existing foreign technology appeared
to be the fastest and surest way to reach this goal. The massive introduction of foreign
technology began in 2004 and ended in 2006.
During this process, China introduced complete procedures for high-speed train manu-
facturing on four main modes (CSR-1, CRH-2, CRH-5 and CRH-3) from four companies
(Alstom, Siemens, Bombardier, and Kawasaki Heavy Industries). Typically, the Ministry
of Railway (MoR) signed train procurement and technology transfer contracts with the tar-
geted foreign firms at the same time, a classic example of ’quid-pro-quo’, also known as the
market for technology policy. The tasks of developing indigenous technologies based on the
acquired ones were then assigned to one of the subsidiaries of CSR or CNR. 3 According to
3Details on major technology transfer contracts are reported in Table A6.
9

official MoR reports as well as interviews with engineers from CSR and CNR, a technology
transfer contract normally consists of four components:
1. “Joint design” of train modes based on foreign prototypes that incorporate adaptation
to the Chinese environment
2. Access to train blueprints
3. Instructions on manufacturing procedures
4. Necessary training of engineers
It is worth noting that the principles of design, as well as the data that support them, were
not transferred. Chinese engineers were taught the how but not the why of building trains,
and they must reverse-engineer if they wish to develop new variations of the prototype.4 To
absorb and digest these technologies as quickly as possible, the responsible subsidiaries of
CSR and CNR usually work with local universities or other research institutions, creating
possible knowledge spillovers from corporations to schools. After three years of technology
assimilation, China had ’mastered the core technologies in producing high-speed trains.’,
according to the ex-chief engineer of MoR in 2007.5 Apart from acquiring manufacturing
procedures for the whole train, the MoR also managed to introduce technologies for cer-
tain critical parts, such as the traction motor, braking system and series pantograph from
Mitsubishi, Hitachi, ABB, etc., to other subsidiaries.
According to Chinese and international patent law, Chinese firms that receive trans-
ferred technology are not allowed to file these technologies in China or any other countries.
Therefore, the effects on new patents are not the mechanic effects of receiving transferred
foreign technology. However, the technology receivers can benefit from follow-up research
that adapts these technologies to other uses and patents for subsequent innovations. CSR
and CNR firms and other related firms can also draw inspiration from the design principles
for these technologies to create new inventions. On rare occasions, technology transfers ap-
pear in the form of jointly owned patents by newly formed CSR/CNR and foreign partner
4Here are more details about how the learning process works documented in a published book on HSRdevelopment (Gaotiejianwen, 2015 [16]): the two contracted foreign producers received 60 orders each of high-speed trains. Among the 60 orders,three orders were imported which the Chinese engineers were allowed toobserve the process; six orders were imported as parts and later assembled by the Chinese engineers underguidance from the foreign partners; the rest of the 51 orders were made by gradually replacing the foreignparts with domestically produced parts which facilitated the digestion of transferred technologies.
5http://finance.qq.com/a/20120702/004961.htm
10

joint ventures.
3.2 Technology-receiving firms
By 2004, 18 firms were affiliated with the CNR and 15 with the CSR, the two major Chinese
locomotive and rolling stock manufacturers. All of the major HSR-related technology transfer
contracts were awarded to their subsidiaries. As described in Figure 1, these 33 firms were
located in 25 different cities ranging from Beijing to Meishan, Sichuan, granting us a nice
layer of variation. Among them, four subsidiaries (CSR Sifang in Qingdao, CSR Zhuzhou,
CNR Tangshan, CNR Changchun) received a complete set of high-speed train manufacturing
technology. Due to the possibility that not all of the technology transfer details were reported
in the China Railway Yearbooks, our main source of technology transfer information, we
labeled all cities with CSR and CNR subsidiaries as technology-receiving cities in our main
specification. In an alternate specification, we define a city to be a technology-receiving city
only when a technology transfer contract was awarded to a firm in this city.
Several unique characteristics of China’s HSR project make it an ideal setting for studying
the impacts of massive international technology transfers on host developing countries.
First of all, the entire HSR project in China was a response to its pressing demand for
extra railway capacity and ambition to revolutionize its transportation system. Moreover,
the decision to transfer technology was made very abruptly, partially attributable to the de-
termination and maneuvering of the then MoR minister, Zhijun Liu, who wanted to advance
the Chinese HSR plan as quickly as possible. Therefore, it is quite unlikely that this wave of
technology transfer followed a latent surge in knowledge stock within the railway sector that
was expected to come into fruition around and after foreign technology transfer, a major
challenge to difference-in-differences identification that plagued previous literature on FDI
and domestic innovation.
Second, the technology transferred to China because of its HSR project covers a broad
scope of technology classes ranging from high-voltage electrical transmission and preserva-
tion, signal control systems, and precision machinery and instruments to new materials.
Thus, it is unlikely that we are only picking up a random surge in innovation in a narrowly
defined technology class. In addition, the wide range of advanced technologies that have
11
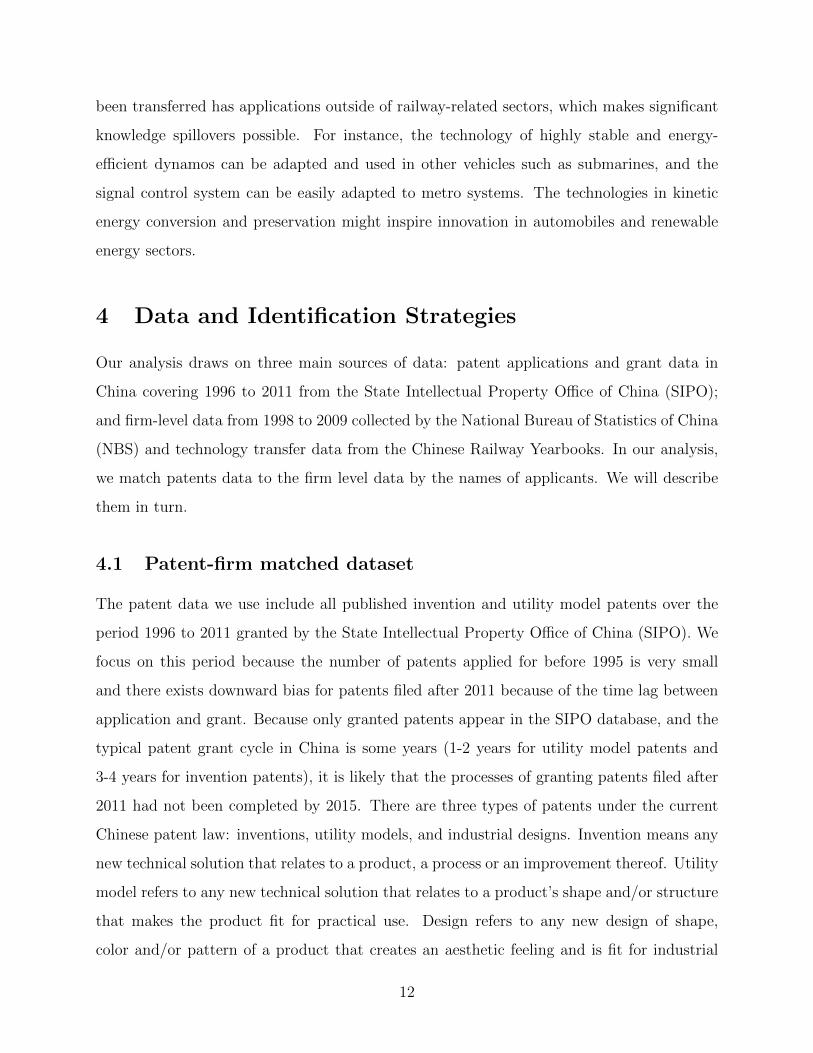
been transferred has applications outside of railway-related sectors, which makes significant
knowledge spillovers possible. For instance, the technology of highly stable and energy-
efficient dynamos can be adapted and used in other vehicles such as submarines, and the
signal control system can be easily adapted to metro systems. The technologies in kinetic
energy conversion and preservation might inspire innovation in automobiles and renewable
energy sectors.
4 Data and Identification Strategies
Our analysis draws on three main sources of data: patent applications and grant data in
China covering 1996 to 2011 from the State Intellectual Property Office of China (SIPO);
and firm-level data from 1998 to 2009 collected by the National Bureau of Statistics of China
(NBS) and technology transfer data from the Chinese Railway Yearbooks. In our analysis,
we match patents data to the firm level data by the names of applicants. We will describe
them in turn.
4.1 Patent-firm matched dataset
The patent data we use include all published invention and utility model patents over the
period 1996 to 2011 granted by the State Intellectual Property Office of China (SIPO). We
focus on this period because the number of patents applied for before 1995 is very small
and there exists downward bias for patents filed after 2011 because of the time lag between
application and grant. Because only granted patents appear in the SIPO database, and the
typical patent grant cycle in China is some years (1-2 years for utility model patents and
3-4 years for invention patents), it is likely that the processes of granting patents filed after
2011 had not been completed by 2015. There are three types of patents under the current
Chinese patent law: inventions, utility models, and industrial designs. Invention means any
new technical solution that relates to a product, a process or an improvement thereof. Utility
model refers to any new technical solution that relates to a product’s shape and/or structure
that makes the product fit for practical use. Design refers to any new design of shape,
color and/or pattern of a product that creates an aesthetic feeling and is fit for industrial
12

application.6 Here, we only focus on invention and utility model patents because industrial
design patents usually have little technology content and are not the major focus on CSR,
CNR and other railway-related firms.
Our other data source is the annual industrial surveys conducted by the National Bu-
reau of Statistics (NBS) in China. These firm-level surveys include balance-sheet data for
all industrial state-owned and non-state-owned firms with sales above 5 million yuan. The
industries here include mining, manufacturing and public utilities. A comparison with the
2004 full census of industrial firms reveals that these firms (accounting for 20% of all in-
dustrial firms) employ approximately 70% of the industrial workforce and generate 90% of
output and 98% of exports (Brandt et al., 2012) [11].
The matching of patent and firm database is described in Xie and Zhang (2015) [36].
Patents can be applied for by individuals, firms, or other institutions. Those patents applied
for by firm record only firm names rather than the unique firm identification code used in
the industrial surveys. As such, Xie and Zhang (2015) [36] had to use firm names as a bridge
to match the two databases. They showed that the matching rate was rather high and that
the matching error was less than 10 percent.
In addition to the NBS annual industrial surveys, we also attempt to identify the list of
firms that were missing from the NBS surveys from Qichacha (http : //www.qichacha.com/),
which is an online yellow page on registered firms. We were able to identify 109,078 out of
150,010 missing firms from the NBS surveys using Qichacha, which allowed us to collect the
basic registration information of the firms, including the founding year, ownership status
and registration address. It is also worth noting that we geocode the firm data from both
sources based on the firm registration address, and use the geocoded information to study
the localization effect of technology transfer.
4.2 HSR technology transfer data
The information on the types of technology transferred in China’s HSR project is drawn from
Chinese Railway Yearbooks from 2003 to 2006. The railway yearbook series contains detailed
reports about the major events that happened in the CSR and CNR and their subsidiaries,
6Source:http://www.cipahk.com/patfaqs.htm
13

including detailed descriptions about their technology transfer contracts. An example of
such a description is shown in Figure 2. It lists the name of the technology introduced, the
foreign partner involved, the receiving CSR or CNR subsidiary and, sometimes, the value of
the contracts.
To map information from the yearbooks to the SIPO patent categorizations and arrive at
a definition of HSR technology, we extract keywords from the descriptions of technology and
match them to patent descriptions in the SIPO database. After an initial coarse matching of
keywords, we also test different ways to refine our definition of introduced HSR technology.
In our main specification, we exclude technology class matches in SIPO with less than 1%
of the patents in this class filed by CSR, CNR and their subsidiaries from 2004. We use the
technology class definition with full matches in our robustness check.
4.3 Empirical strategy
The baseline estimation strategy is a triple-difference specification of the form:
LogPatenti,j,t =β0 + β1HSRCityi ∗HSRTechj ∗ Aftert+
β2HSRCityi ∗HSRTechj + β3HSRCityi ∗ Aftert+
β4HSRTechj ∗ Aftert + γY eart + θCityi + φHSRTechj
+ εi,j,t (1)
where LogPatenti,j,t is the number of patents applied by city i in year t within technology
class j, γ is a vector of year fixed effects, θ is a vector of city fixed effects, φ is a vector
of the IPC 2-digit technology class fixed effects, and HSRCityi ∗ HSRTechk ∗ Aftert is
the product of HSR technology-receiving city indicator, railway-related technology indicator
and post-technology transfer indicator, our DDD term of interest. We also control for all
three pairwise DD terms. In some regressions we also control for the time trends of cities,
technology classes and their cross-terms. The error term εi,j,t is clustered at the city level.
In our specification, we exploit three layers of variations: the difference between technology-
14
receiving cities and other cities, railway-related technology and others, and patents filed
before and after technology transfer.
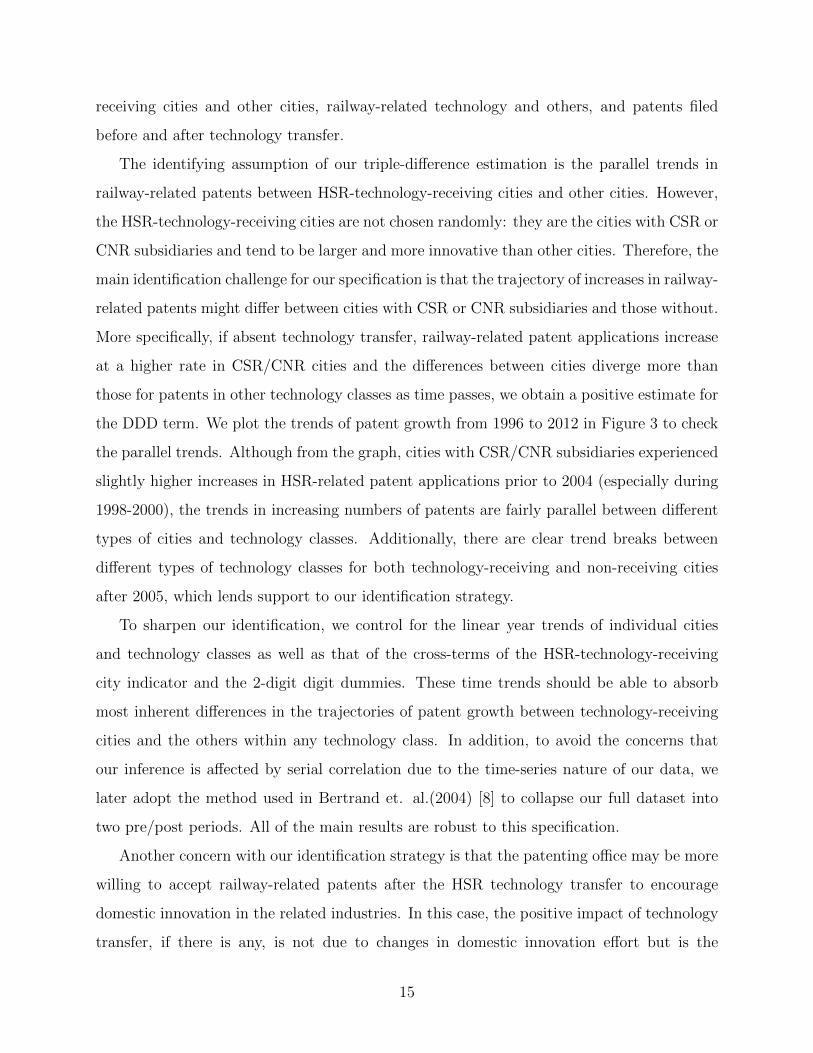
The identifying assumption of our triple-difference estimation is the parallel trends in
railway-related patents between HSR-technology-receiving cities and other cities. However,
the HSR-technology-receiving cities are not chosen randomly: they are the cities with CSR or
CNR subsidiaries and tend to be larger and more innovative than other cities. Therefore, the
main identification challenge for our specification is that the trajectory of increases in railway-
related patents might differ between cities with CSR or CNR subsidiaries and those without.
More specifically, if absent technology transfer, railway-related patent applications increase
at a higher rate in CSR/CNR cities and the differences between cities diverge more than
those for patents in other technology classes as time passes, we obtain a positive estimate for
the DDD term. We plot the trends of patent growth from 1996 to 2012 in Figure 3 to check
the parallel trends. Although from the graph, cities with CSR/CNR subsidiaries experienced
slightly higher increases in HSR-related patent applications prior to 2004 (especially during
1998-2000), the trends in increasing numbers of patents are fairly parallel between different
types of cities and technology classes. Additionally, there are clear trend breaks between
different types of technology classes for both technology-receiving and non-receiving cities
after 2005, which lends support to our identification strategy.
To sharpen our identification, we control for the linear year trends of individual cities
and technology classes as well as that of the cross-terms of the HSR-technology-receiving
city indicator and the 2-digit digit dummies. These time trends should be able to absorb
most inherent differences in the trajectories of patent growth between technology-receiving
cities and the others within any technology class. In addition, to avoid the concerns that
our inference is affected by serial correlation due to the time-series nature of our data, we
later adopt the method used in Bertrand et. al.(2004) [8] to collapse our full dataset into
two pre/post periods. All of the main results are robust to this specification.
Another concern with our identification strategy is that the patenting office may be more
willing to accept railway-related patents after the HSR technology transfer to encourage
domestic innovation in the related industries. In this case, the positive impact of technology
transfer, if there is any, is not due to changes in domestic innovation effort but is the
15

consequence of relaxed patent standards related to the transferred technologies. To rule out
this possibility, we plot the invention grant rate of the transferred technology categories and
the other categories in Figure 4.7 Generally, the grant rate of the railway-related categories
is higher than that for the rest of the inventions. However, the grant rates of the two
groups are parallel over years, showing no trend break in 2004. Therefore, we are confident
that the technology transfer in 2004 did not induce the patenting office to grant more local
railway-related innovations.
5 Findings
5.1 Descriptive statistics
Table 1 shows the summary statistics for the key variables. In Panel A, we report the key
economic indicators in technology-receiving and non-receiving cities in 1996, 2004 and 2010.
Generally, the technology-receiving cities are significantly larger than the non-receiving cities
in terms of population. The GDP per capita in technology-receiving cities is also higher than
that in the non-receiving cities in 2004 and 2010. However, the GDP growth rates are very
similar in these two types of cities in all three reported years.
Panel B reports the number of different types of patents by technology category (trans-
ferred and non-transferred technologies) and city type (technology-receiving and non-receiving
cities). The total number of HSR-related patents increased by more than six times in
technology-receiving cities from 2004 to 2010, on average. These patents also increase by
slightly less than five times in non-receiving cities during the same period, and overall, the
scale of HSR-related patents is much smaller in non-receiving cities compared with receiving
cities. The general pattern shows that technology-receiving cities have significantly more
patents in all three reported years and all technology categories, as shown in column 5.
7We only plot the grant rate of inventions because we have no information on the grant rate of utilitymodel patents.
16

5.2 Main results
Table 2 represents the baseline triple-difference estimation results. Controlling for city,
year and technology class fixed effects, as well as city and technology class specific linear
time trends, we observe a 42% increase in HSR patent applications in cities with CSR or
CNR affiliates after 2004, suggesting a large aggregate effect of HSR technology transfer
on domestic innovation. We then check the differential impacts of technology transfer on
different types of patents. The impact on utility model patents (less involved innovations) is
38.4% as indicated in column 2, and the impact on invention is relatively smaller, 26.7%, as
reported in column 3. To ensure that the results are not driven by divergent patent growth
patterns between different technology classes in technology-receiving and non-receiving cities,
we further control for city type by technology type year trend in columns 4-6. The impact
remains the same after the inclusion of the additional set of fixed effects.
To separate the effects of direct technology transfer within CSR/CNR affiliates and
broader spillover effects, we exclude patents filed by these affiliates from our sample in Table
3. We find that the effects of HSR technology transfer decrease by half, indicating the impor-
tance of direct absorption by receiving firms of technology transfers. Among different patent
categories, the reductions in utility model patents are more pronounced when CSR/CNR
affiliates are excluded, consistent with circumstances under which a larger proportion of
patents filed by direct receivers of foreign technology are smaller adaptations whereas the
innovations stimulated by foreign technology transfers in other firms are more substantial.
The finding is consistent with the “small incremental inventive steps” hypothesis raised by
Puga and Trefler (2010) [32] to explain developing countries’ progressions through the steps
on the global technological ladder.
To further separate demand-driven innovation from knowledge spillovers, we then isolate
firms that are listed as the certified suppliers to China’s railway projects by the Ministry
of Railway (MoR)8; the results are reported in Table 4. Again, we observe a small drop in
the estimated technology transfer effects on utility model patents. Surprisingly, there are
very few changes in invention patents. This finding suggests that within HSR technology
8Suppliers to China’s railway projects must apply for certification from the MoR; public information isonline. There are 1172 certified suppliers.
17

classes, the stimulation of innovation along the supply chain does not appear to be large
in magnitude compared other possible channels of spillovers, such as knowledge spillovers
across similar technology classes.
5.3 Heterogeneity
The above analysis suggests that technology transfer in the HSR sector generates sizable
direct impact to the receiving firms and knowledge spillovers to non-related industries. How-
ever, an alternative explanation is that government might direct more resources to technology
receiving cities or technology receiving categories, or both, as an attempt to facilitate the
digestion of transferred technology. Therefore, it is challenging to conclude that the observed
spillover effect is a response to the transferred technology instead of concerted government
investments.
In this subsection, we try to mitigate the concern that the spillover effects are driven by
directional government intervention instead of transferred technology. By saying that, we
explore the heterogeneity in the spillovers of HSR technology transfer in firms with different
characteristics. We are especially interested in the heterogeneous effects regarding to firms’
ownership status and age. We have two hypotheses to be examined: if the spillover effect is
mainly driven by government directed resources instead of transferred technology, 1) we are
more likely to observe larger knowledge spillovers in state-owned enterprises (SOEs) than
private-owned enterprises (POEs) since the former are better connected and hence more ac-
cessible to government resourced; and 2) we are more likely to observe larger spillover effects
in newly founded firms if the government established new firms to house R&D activities or
the availability of extra funds encouraged the spin-off companies from research institutions.
Broadly speaking, there are two types of applicants: firms and non-firms.9 We further
separate firms into SOEs and POEs and estimate the treatment effects for SOE, POE and
non-firms. Figure 5 shows the magnitude and significance of the triple-difference coeffi-
cients.10 It is apparent that the treatment effect is larger in POEs than in SOEs for both
types of patents (Panel (a) of Figure 5).11 When we further exclude the direct receivers of
9Non-firms include research institutions (such as universities) and individual applicants.10The full estimation results are available in appendix Table A.1.11For non-firms, the direct effect of technology transfer is not defined since none of them are direct receivers
18

technology transfer and the suppliers in the railway sector, the effect for POE still strongly
dominates within the sample of firms. It is also worth noting that the effect for non-firms is
even larger than the effect for POE, potentially driven by patent application from universities
or other research institutions.
To test the second hypothesis, we exploit potential heterogeneous effect by firm’s age.
If the government set up new firms to host R&D in HSR and apply for patents, we will
observe a larger spillover effect for younger firms than for older firms. We first calculate the
median age of the firm at the time of the patent application, which is nine years’ old. Then
we separately estimate the effects for younger firms and older firms. However, the effect is
similar for both types of firms which is shown in Figure 6.12
The above results on heterogeneity suggest that the spillover effect of technology transfer
is mainly contributed by POEs and non-firm applicants, such as universities. In addition,
the results are not driven by newly founded firms. Both findings indicate that although
we cannot rule out the possibility of government interventions, they do not seem to drive
the differential patterns of innovation behavior across different types of firms in response
to external transferred technology. Therefore, we believe spontaneous responses to external
surge of knowledge in relevant sectors are more likely to account for the observed spillover
effects instead of targeted government investments. In section 6, we will examine further
evidence on the channels of spillover, which is also consistent with a spontaneous knowledge
spillover story.
5.4 Robustness checks
The above main results suggest a significant positive impact of HSR technology transfer on
the domestic innovation of related technologies not only from direct receiving firms but also
from firms in non-railway-related industries. Before we proceed with the discussions of the
potential mechanisms of this impact, we provide a series of robustness checks in this section
to ensure that our estimated results are robust to various specifications.
of technology transfer. Therefore we only report the effect on non-firms in Panel (b) which represents thespillover effect of technology transfer.
12The full estimation results are available in appendix Table A.2.
19

First, we tested different definitions of technology class as well as treatment year. Table
5 shows that our DDD estimates on total patents and those that excluded directly relevant
firms are robust to an uncensored definition of technology class whereby we keep all of the
technology classes with matches from China Railway Yearbooks keywords.
Additionally, we change the year of technology transfer from 2004 to 2005 for the CSR/CNR
subsidiary cities whose technology transfer times are not precisely documented in the railway
yearbooks to account for possible delays. Again, we find similar results, as shown in Table
6.
As mentioned earlier in Section 3.2, the information about technology transfer in some
cities is quite brief. Therefore, it is a pity that we cannot code out city-specific technology
transfers based on railway yearbooks. However, it is well documented that three cities
received technology transfer for producing the whole train, including Qingdao, Changchun
and Tangshan, while the rest of the CSR/CNR branches received technologies for producing
certain parts. We take such variation as a proxy for differences in intensities of technology
transfer and separately estimate the treatment effects for the three cities with intensive
technology transfer and the rest of the cities with lower treatment intensity.
Table 7 reports the estimation results by different treatment intensity. The first row
reports the triple-difference coefficient for cities in charge of producing parts, while the
second role reports the main coefficient for cities in charge of producing the whole train.
The effect of technology transfer on patent growth is much larger for the three cities with
intensive transfers (60.2%) compared to the rest of the technology receiving cities (38.7%).
However, such effect is mainly driven by the growth of utility models instead of invention.
The effect after excluding CSR/CNR and certified suppliers also has similar pattern. One
possible explanation for the insignificant spillover effect on inventions could be the lack of
strong universities in railway-related research in the three cities, which will be discussed
further in Section 6.2.
In Table 8, we follow Bertrand et al. (2004) [8] and collapse the time dimension of
our sample into pre/post treatment groups to address serial correlation. Again, the point
estimates and standard errors stay almost the same.
As an additional effort to strengthen our triple-differences specification, we further refine
20

the selection of control cities to make the treated and control groups more comparable. Thus,
we adopt the nearest neighbor matching algorithm to find the nearest three neighbors for
each treated city regarding the population and its growth rate, GDP and the number of
patents, as well as government spending on scientific research. We arrive at 32 control cities
for the 23 treated cities in our refined sample. The control and treated cities do not have
significant differences in terms of all of the matching variables, as indicated in Table A.3. We
use this refined sample to replicate the main regressions in Tables 2 and 4, and the results
remain very similar to the main findings, as shown in Table 9.
Lastly, to confirm that the positive impact in our regressions is truly from the policy shock
in the HSR technology sectors rather than other confounding factors, we further conduct a
placebo test by randomly choosing 13 IPC4 categories to be the placebo-treated categories.
We run 100 regressions using each set of the placebo treatment and find that only 3 of them
produce significantly positive results. Thus, we are driven to believe that our estimated
results capture the real impact of technology transfer in the HSR-related sector.
6 Mechanisms of Spillovers
Because we find a significant impact of HSR technology transfer in the non-rail related
sectors, we are interested in the mechanisms that could explain these knowledge spillovers.
In this section, we first present some cross-city evidence, where we further explore the roles
of geographic distance and technological similarity, as well as the importance of university
research in the diffusion of transferred technology to other cities and technology classes.
We then present within-city evidence to understand the localized spillovers of CSR/CNR
subsidiaries on nearby firms’ innovation activities and other outcomes.
6.1 Cross-City Evidence: Geographic and Technological Proxim-
ity
To understand how a larger-scale technology transfer program changes the innovation land-
scape of a developing country as a whole, it would be interesting to see how the other sectors
21

and cities could benefit from sudden increases in knowledge stock in the railway sector. One
possibility is that the knowledge spillovers spread to nearby cities, and thus, cities closer
to the technology-receiving cities will have higher patent growth in the affected categories
compared with cities that are farther away. The other possibility is that the knowledge
spillovers spread to similar technology categories. After all, in Griliches (1992) [19], knowl-
edge spillovers are defined as “working on similar things and hence benefiting much from each
others research.” Thus, technologies that are more similar to the transferred technologies
may see higher patent growth.
Table 10 displays the results for geographic proximity. We interact the logged distance
from the centroid of a city to the closest technology-receiving cities with the technology
dummy and year dummy, and we include the pairwise difference-in-differences terms and the
main effect of distance. In general, we do not find any large effects on patent growth in cities
that are closer to HSR technology-receiving cities, both within and outside of HSR-related
technology classes. This finding indicates that either closeness in technology diffusion only
has weak impacts or this spillover effect is very local and only presents within cities. As
suggested by Rosenthal and Strange (2003) [33], the localization effects of being near similar
businesses decay rapidly with distance and may disappear after 10 miles. We will discuss
about such localization effects in the next subsection.
However, in Table 11, we observe a significant impact of technology proximity on the
spillovers of HSR technology. We measure technology proximity using Kay et al.’s (2014)
technology similarity matrix, which assigns a measure from 0 to 1 as the similarity between
two 4-digit technology classes based on co-citation. The first row in Table 11 indicates
a significant increase in patents applications in technology classes that are close to HSR
technology in HSR technology-receiving cities after the introduction of foreign technology:
doubling the similarity measure increases the patents by more than 3%, compared with a
direct impact of 40%. Excluding CSR and CNR firms as well as direct suppliers to China’s
HSR projects from the sample does not appear to greatly diminish the role of technology
similarity, which indicates that the knowledge spillovers across similar technologies occur
largely outside of the railway sector. It is worth noting that these effects are mainly restricted
to utility model patents. A somewhat puzzling finding is a small but significant negative
22

effect of technology proximity in patent applications in non-technology-receiving cities after
2004. We think that this finding might be attributable to competition in both output and
input markets, but it is open to other interpretations.
It is also worth noting that the significant impact of technology proximity on the spillovers
of HSR technology provides a compelling evidence of technology-driven (instead of government-
driven) spillovers: if the results are driven by government’s investment in HSR technology
in the technology receiving cities, we would not observe a significant correlation between
technology similarity and knowledge spillovers.
6.2 Cross-City Evidence: University research
Universities play a central role in local technology spillovers, not only as producers of basic
research but also by promoting the exchanges of ideas and mobility of highly skilled labor
through firm-university cooperation. Understanding the role played by basic research insti-
tutions in transmitting a knowledge stock shock within a few firms in one particular sector
to other firms and related sectors is crucial. This mechanism of firm-university knowledge
transmission is especially relevant in our HSR technology example because the MoR explic-
itly mobilized universities, colleges and science research centers to work along with CSR and
CNR in the digestion, absorption and re-innovation of imported foreign technology. Most
notably, in 2008, the MoR signed an agreement13 with the MoS (Ministry of Science) of
China to help develop technologies to create a network that could support train speeds of
350 kph or more, a significant breakthrough relative to the foreign technology that was in-
troduced, which only applied to a system of trains with speeds of 250 kph. According to
the agreement, the MoS is responsible for providing funding opportunities to universities,
national laboratories and engineering research centers for relevant research programs, which
usually involves the cooperation of one of the CSR or CNR subsidiaries and the funded re-
search institutes. We believe that during this process, these research institutions gain access
to the transferred technology, study the fundamentals and benefit other firms with related
technology problems through either public knowledge sharing or private cooperation.
In testing the role of universities in promoting technology spillovers, our hypothesis is
13http://www.most.gov.cn/tpxw/200802/t20080227_59350.htm
23

that we should observe more rapid patent growth in HSR or closely related sectors filed by
non-CSR/non-CNR firms after the introduction of foreign technology into cities with more
university research activities in relevant technology classes prior to the massive technology
transfer project. We define “relevant technology” as the 2-digit technology classes that
encompass our 4-digit HSR technology, which includes basic research in transportation and
electricity conversion and distribution. Prior to 2004, only 63 cities had patents applied for by
universities in relevant technology classes, and they were heavily skewed. Therefore, instead
of using the actual previous university patent applications as the measure of university
research strength, we define a dummy that switches on for the 63 cities with early relevant
university patent applications.
Table 12 shows the estimation results in cities with and without relevant university patent
applications prior to 2004. As seen, the spillover of imported technology to non-CSR/non-
CNR firms as well as firms that are not certified MoR suppliers occurs almost exclusively
in cities with previous university research experience in relevant fields (Panel A). In cities
without patents applied for by universities before 2004 in broad HSR-relevant technology
classes, the direct impact on total patents is similar to that estimated in the baseline but
there is almost no impact of technology transfer on patent applications outside of the direct
receivers of the imported technology (Panel B).14 This finding is consistent with our previous
evidence on the importance of technology similarity rather than geographic proximity in
knowledge spillovers: technology transmission to related fields is likely to occur through
firm-university or university-university cooperation in cities with strong academic research
backgrounds in relevant fields, rendering geographic distance less of a barrier.
One limitation of the dummy measure mentioned above is that it might be capturing
not only the university research strength but also the city’s general research strength in
the relevant areas. Thus, we alternatively use the ratio of university-applied patents to
total patent applications in those areas as our second measure. The results are shown in
Appendix Table A.5. The effects are largely consistent with those using the dummy of
14We also apply a DDDD design where we interact the dummy of university research with the triple-difference and pairwise difference-in-difference terms. The results are consistent with Table 11 which areavailable in Appendix Table A.4. Interestingly, we also observe higher patent growth in narrowly defined HSRtechnology classes in cities that are not directly receiving HSR technology but that have relevant universityresearch experience.
24

previous university research activities. Cities with higher university patents/total patents
ratios witness higher growth in patents in HSR technology classes filed by firms that do not
directly receive transferred technology. This evidence shows the complementarity between
basic research and specific technology. With regard to policy, governments should take
into consideration the country’s or region’s basic research strength in decisions that involve
foreign technology transfers and allocations of transferred technology to different regions.
6.3 Within-City Firm Level Analysis
In the above subsection, we show that cross-city geographic proximity has little effect on the
magnitude of technology transfer spillovers. One possibility is that the localized knowledge
spillovers of being near similar businesses decay rapidly with distance and are limited within
cities. To further examine the within-city technology spillovers, we identify the geographic
location of the technology receiving firms (i.e., CSR/CNR subsidiaries) and estimate such
localization effect using geocoded firm-level data. More importantly, leveraging data on firm
outcomes including revenue and TFP allows us to evaluate the real economic impacts of for-
eign technology transfer on domestic firms, in addition to innovation outcomes. Specifically,
we estimate the following model,
Outcomei,j,t =β0 +10∑d=1
βdDistanceBandi,j,d ∗ Aftert +10∑d=1
γdDistanceBandi,j,d
+ CountyFE ∗ Aftert + IndustryFE ∗ Aftert + Y earFE + εi,j,t (2)
where Outcomei,j,t represents the logs of firm level outcomes of firm j in city i in year t,
including innovation output, such as the total number of patents, utility model and invention
patents, and other performance outcomes including firm revenue, total factor productivity
(TFP) and firm entry. DistanceBandd is a series of dummy variables for each distance
band, which takes the value one if firm j lies within band d. We consider ten distance bands,
each spanning two miles, until 20 miles from the technology receiving firms. Aftert is a
dummy variable indicating if year t is after the technology transfer. Thus, the coefficients
25
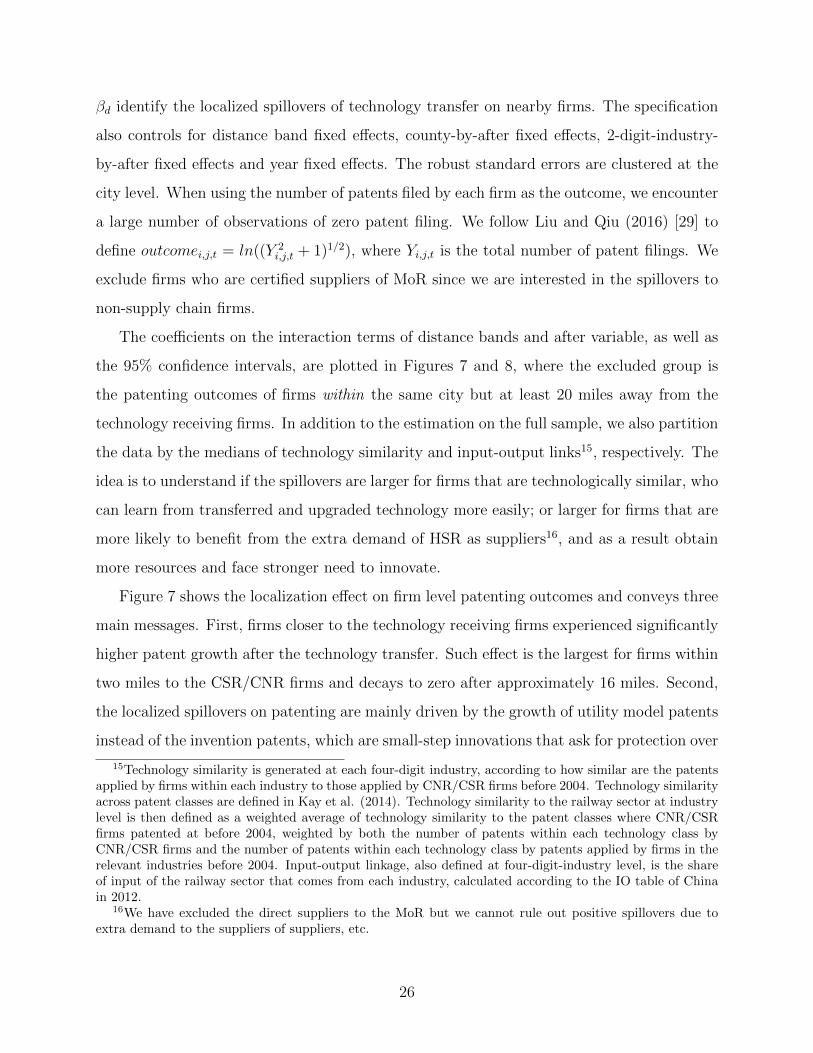
βd identify the localized spillovers of technology transfer on nearby firms. The specification
also controls for distance band fixed effects, county-by-after fixed effects, 2-digit-industry-
by-after fixed effects and year fixed effects. The robust standard errors are clustered at the
city level. When using the number of patents filed by each firm as the outcome, we encounter
a large number of observations of zero patent filing. We follow Liu and Qiu (2016) [29] to
define outcomei,j,t = ln((Y 2i,j,t + 1)1/2), where Yi,j,t is the total number of patent filings. We
exclude firms who are certified suppliers of MoR since we are interested in the spillovers to
non-supply chain firms.
The coefficients on the interaction terms of distance bands and after variable, as well as
the 95% confidence intervals, are plotted in Figures 7 and 8, where the excluded group is
the patenting outcomes of firms within the same city but at least 20 miles away from the
technology receiving firms. In addition to the estimation on the full sample, we also partition
the data by the medians of technology similarity and input-output links15, respectively. The
idea is to understand if the spillovers are larger for firms that are technologically similar, who
can learn from transferred and upgraded technology more easily; or larger for firms that are
more likely to benefit from the extra demand of HSR as suppliers16, and as a result obtain
more resources and face stronger need to innovate.
Figure 7 shows the localization effect on firm level patenting outcomes and conveys three
main messages. First, firms closer to the technology receiving firms experienced significantly
higher patent growth after the technology transfer. Such effect is the largest for firms within
two miles to the CSR/CNR firms and decays to zero after approximately 16 miles. Second,
the localized spillovers on patenting are mainly driven by the growth of utility model patents
instead of the invention patents, which are small-step innovations that ask for protection over
15Technology similarity is generated at each four-digit industry, according to how similar are the patentsapplied by firms within each industry to those applied by CNR/CSR firms before 2004. Technology similarityacross patent classes are defined in Kay et al. (2014). Technology similarity to the railway sector at industrylevel is then defined as a weighted average of technology similarity to the patent classes where CNR/CSRfirms patented at before 2004, weighted by both the number of patents within each technology class byCNR/CSR firms and the number of patents within each technology class by patents applied by firms in therelevant industries before 2004. Input-output linkage, also defined at four-digit-industry level, is the shareof input of the railway sector that comes from each industry, calculated according to the IO table of Chinain 2012.
16We have excluded the direct suppliers to the MoR but we cannot rule out positive spillovers due toextra demand to the suppliers of suppliers, etc.
26

a shorter period. Third, the effect is generally larger for technologically-similar firms but not
for firms with closer input-output linkages with the technology receivers, suggesting that the
localized spillover is likely to be driven by technology similarity instead of increased demand
along the supply chain.
In addition to firms’ patenting outcomes, Figure 8 reports the localization effects on other
firm performance measurements, including firms’ revenue, total factor productivity (TFP)
and new entry.17 We find that firms closer to the technology receiving firms experienced
higher revenue growth and increased TFP and marginally more firm entry after the tech-
nology transfer. The evidence also suggests that the localization effect on revenue is mainly
driven by firms with above-median technology similarity instead of closer input-output link-
ages.
We also conduct a series of robustness checks by further refining the technology receiving
firms to only the ones with R&D centers of CSR/CNR subsidiaries18 and find consistent
evidence (see Appendix Figures B.1 and B.2). The localization effects on firms’ patenting
activities are positive and significant for firms within two miles of the R&D centers, and
only driven by nearby firms with similar technologies (Figure B.1). The localization effect
on nearby firms’ revenue and TFP is also larger for firms with above-median technology
similarity but not for firms with above-median input-output linkages. The positive effects
are generally larger for the sample of cities that house R&D centers of CSR/CNR firms, which
indicates that the spillovers to other firms are stronger where the transferred technology is
more intensely studied and digested.
To summarize, the within-city firm level analysis suggests positive localization effect
on nearby firms’ patenting activities, revenue, and productivity. Such effect is generally
stronger for firms with higher similarity to the transferred technologies, but not for firms
with stronger input-output links with the technology receiving firms. The positive and large
revenue and productivity effects suggest that firms closer to direct technology receivers not
only innovate more, but also experience economic gains. In another word, the large surge in
patent activities in our main findings are associated with significant real economic benefits
17We calculate firm-level TFP following Brandt et al. (2012). We define a firm to be a new entrant if itappears in the industrial firm survey for the first time in a particular year.
18There are 25 cities with CSR/CNR subsidiaries, but only 13 of them also have CSR/CNR R&D centers.
27
to the innovators and the whole economy, other than purely driven by extra incentives
to patent.19 The results are also consistent with the cross-city evidence that technology
similarity serves as the major mechanism affecting the magnitude of knowledge spillovers.
7 Concluding Remarks
This paper aims to make two primary contributions. First, we evaluate the impacts of one of
the largest technology transfer plans in the world, i.e., the introduction of HSR technology
into China. This unprecedented natural experiment provides us with an excellent opportu-
nity to evaluate the effectiveness and limitations of ‘quid pro quo’ markets for technology
strategy in catching up with global technology frontiers. Second, we further examine different
mechanisms that might contribute to the absorption, digestion and diffusion of introduced
foreign technology in developing countries. Although the direct impacts within receiving
firms are the largest, firms outside of the railway sector also experience significantly large
increases in related patents, and consequently, larger economic gains in terms of revenue
and productivity. We find a significant role of technology proximity both across cities and
within the technology receiving cities that could explain the technological spillovers. In addi-
tion, university research also help facilitate the digestion of foreign technology and stimulate
domestic innovation.
Concerns regarding the external validity of this natural experiment may arise because
some of the special institutional features in our example, such as the large Chinese market
for railway and the monopoly power of CSR and CNR in this market, might have facilitated
or hindered implementing the full market for technology policy. However, the fact that
we still find large and significant treatment effects after excluding CSR/CNR affiliates as
well as MoR certified supplies suggests that many of the activities are in sectors other
than the directly-impacted sector. Our further investigation reveals sizable spillovers to
technologically similar firms, suggesting that absorptive capacity of foreign technologies,
other than government initiatives, might be the primary explanation of patent booms in the
19Hu et al. (2017) [21] finds that non-innovation related motives for acquiring patents may have playedan important role in the patenting surge.
28

indirectly affected sectors.
References
[1] Abramovsky, Laura, and Helen Simpson. ”Geographic proximity and firm: university in-
novation linkages: evidence from Great Britain.” Journal of Economic Geography (2011)
[2] Abramovsky, Laura, Rupert Harrison, and Helen Simpson. ”University research and the
location of business R&D.” The Economic Journal 117.519 (2007): C114-C141.
[3] Anselin, Luc, Attila Varga, and Zoltan Acs. ”Local geographic spillovers between univer-
sity research and high technology innovations.” Journal of Urban Economics 42.3 (1997):
422-448.
[4] Audretsch, David B., and Maryann P. Feldman. ”Knowledge spillovers and the geography
of innovation.” Handbook of Regional and Urban Economics 4 (2004): 2713-2739.
[5] Barrell, Ray, and Nigel Pain. ”Foreign Direct investment, technological change, and
economic growth within Europe.” The Economic Journal 107.445 (1997): 1770-1786.
[6] Blalock, Garrick, and Paul J. Gertler. ”Learning from exporting revisited in a less devel-
oped setting.” Journal of Development Economics 75.2 (2004): 397-416.
[7] Belenzon, Sharon, and Mark Schankerman. ”Spreading the word: Geography, policy, and
knowledge spillovers.” Review of Economics and Statistics 95.3 (2013): 884-903.
[8] Bertrand, Marianne, Esther Duflo, and Sendhil Mullainathan. How much should we trust
differences-in-differences estimates?. No. w8841. National Bureau of Economic Research,
2002.
[9] Bloom, Nicholas, Mark Schankerman, and John Van Reenen. ”Identifying technology
spillovers and product market rivalry.” Econometrica 81.4 (2013): 1347-1393.
[10] Borensztein, Eduardo, Jose De Gregorio, and Jong-Wha Lee. ”How does foreign direct
investment affect economic growth?.” Journal of International Economics 45.1 (1998):
115-135.
29
[11] Brandt, Loren, Johannes Van Biesebroeck, and Yifan Zhang. ”Creative accounting or
creative destruction? Firm-level productivity growth in Chinese manufacturing.” Journal
of Development Economics 97.2 (2012): 339-351.
[12] Cheung, Kui-yin, and Lin Ping. ”Spillover effects of FDI on innovation in China: Evi-
dence from the provincial data.” China Economic Review 15.1 (2004): 25-44.
[13] D’Este, Pablo, Frederick Guy, and Simona Iammarino. ”Shaping the formation of uni-
versity: industry research collaborations: what type of proximity does really matter?.”
Journal of Economic Geography (2012)
[14] Draca, Mirko. ”Reagan’s innovation dividend? Technological impacts of the 1980s US
defense build-up.” (2013).
[15] Furman, Jeffrey L., and Megan J. MacGarvie. ”Academic science and the birth of
industrial research laboratories in the US pharmaceutical industry.” Journal of Economic
Behavior & Organization 63.4 (2007): 756-776.
[16] Gaotiejianwen. ”High-speed rail in colour.” (2015) Hunan Literature and Art Publishing
House, Changsha, China.
[17] Hale, Galina, and Cheryl Long. ”Are there productivity spillovers from foreign direct
investment in China?.” Pacific Economic Review 16.2 (2011): 135-153.
[18] Giorcelli, Michela. ”The Long-Term Effects of Management and Technology Transfers.”
(2016). unpublished mimeo.
[19] Griliches, Zvi. ”The Search for R&D Spillovers.” The Scandinavian Journal of Eco-
nomics (1992): S29-S47.
[20] Holmes, Thomas J., Ellen R. McGrattan, and Edward C. Prescott. ”Quid pro quo:
technology capital transfers for market access in China.” (2015) Review of Economic
Studies, forthcoming
30
[21] Hu, Albert GZ, Peng Zhang, and Lijing Zhao. ”China as number one? Evidence from
China’s most recent patenting surge.” Journal of Development Economics 124 (2017):
107-119.
[22] Hu, Albert GZ, Gary H. Jefferson, and Qian Jinchang. ”R&D and technology transfer:
firm-level evidence from Chinese industry.” Review of Economics and Statistics 87.4
(2005): 780-786.
[23] Jaffe, Adam B., Manuel Trajtenberg, and Rebecca Henderson. ”Geographic Localization
of Knowledge Spillovers as Evidenced by Patent Citations.” The Quarterly Journal of
Economics 108.3 (1993): 577-598.
[24] Javorcik, Beata Smarzynska. ”Does foreign direct investment increase the productiv-
ity of domestic firms? In search of spillovers through backward linkages.” American
Economic Review (2004): 605-627.
[25] Kantor, Shawn, and Alexander Whalley. ”Knowledge spillovers from research universi-
ties: evidence from endowment value shocks.” Review of Economics and Statistics 96.1
(2014): 171-188.
[26] Kay, Luciano, et al. ”Patent overlay mapping: Visualizing technological distance.” Jour-
nal of the Association for Information Science and Technology 65.12 (2014): 2432-2443.
[27] Keller, Wolfgang. ”International trade, foreign direct investment, and technology
spillovers.” Handbook of the Economics of Innovation 2 (2010): 793-829.
[28] Liu, Z.(2003): tie lu shi shi kua yue shi fa zhan zhan lue.
[29] Liu, Qing, and Larry D. Qiu. ”Intermediate input imports and innovations: Evidence
from Chinese firms’ patent filings.” Journal of International Economics 103 (2016): 166-
183.
[30] Liu, Xiaming, Chengang Wang, and Yingqi Wei. ”Causal links between foreign direct
investment and trade in China.” China Economic Review 12.2 (2001): 190-202.
31

[31] Lu, Yi, Zhigang Tao, and Lianming Zhu. ”Identifying FDI Spillovers.” Journal of Inter-
national Economics (2017).
[32] Puga, Diego and Trefler, Daniel (2010), ”Wake up and smell the ginseng: International
trade and the rise of incremental innovation in low-wage countries”, Journal of Develop-
ment Economics, 91(1):64-76.
[33] Rosenthal, Stuart S. and Strange, W. ”Geography, industrial organization, and agglom-
eration”, Review of Economics and Statistics, 85.2 (2003):377-393.
[34] Sabirianova, Klara, Jan Svejnar, and Katherine Terrell. ”Distance to the efficiency fron-
tier and foreign direct investment spillovers.” Journal of the European Economic Asso-
ciation 3.2-3 (2005): 576-586.
[35] Sohn, Eunhee (2014). ”The Impact of Local Industrial R&D on Academic Science: Evi-
dence From the Agricultural Biotechnology Industry.” Academy of Management Annual
Meetings Best Paper Proceedings.
[36] Xie, Zhuan and Zhang, X. ”The Patterns of Patents in China”, China Economic Journal
8.2 (2015): 122-142.
32

Figure 1: Technology-Receiving Cities
Note: Technology-receiving cities are labeled and marked with large black dots.
Source of the map: Michigan China Data Center.
33

Figure 2: An Example of a Technology Transfer Document
Data Source: China Railway Yearbook (2005). Translation: In this project, we (CNR DalianSubsidiary) received technology transfer from Toshiba on AC drive system, AC drive control andcomputer network control systems, main converter, main transformer, traction motor, auxiliarysystem and auxiliary converter, bogie and the design of train body. We also received technologytransfer from Voith, on the design and manufacturing of the actuating system (gearbox assemblyand axle suspension, etc.).
34

Figure 3: Growth Trend of Patents
Data Source: Authors’ calculations based on the SIPO database. This graph depicts the timetrends of the averages of the (log) total patent number granted within each IPC 4 digit category-city combination of four groups: HSR-technology receiving cities and HSR-relevant technologyclasses (blue line), HSR-technology receiving cities and non-HSR technology classes (red line),non-HSR-technology-receiving cities and HSR-relevant technology classes (green line), and non-HSR-technology-receiving cities and non-HSR-relevant technology classes (yellow line).
35

Figure 4: Patent Grant Rates of HSR-related Inventions and Other Inventions
Data Source: Authors’ calculations based on the SIPO database. This graph depicts the timetrends of patent grant rate across HSR-related and non-HSR-related technology classes.
36

Figure 5: Coefficients comparison: Private/State/Non firms
(a) Full sample
(b) Exclude CSR/CNR/Certified Suppliers
Notes: 1. This figure visualizes the triple difference coefficients in Table A.1. Panel (a) correspondsto columns 1-3 in Table A.1, while panel (b) corresponds to columns 4-6 in Table A.1; 2. Thecoefficients are presented in bar charts as well as shown in numbers, with their 95% confidenceintervals.
37
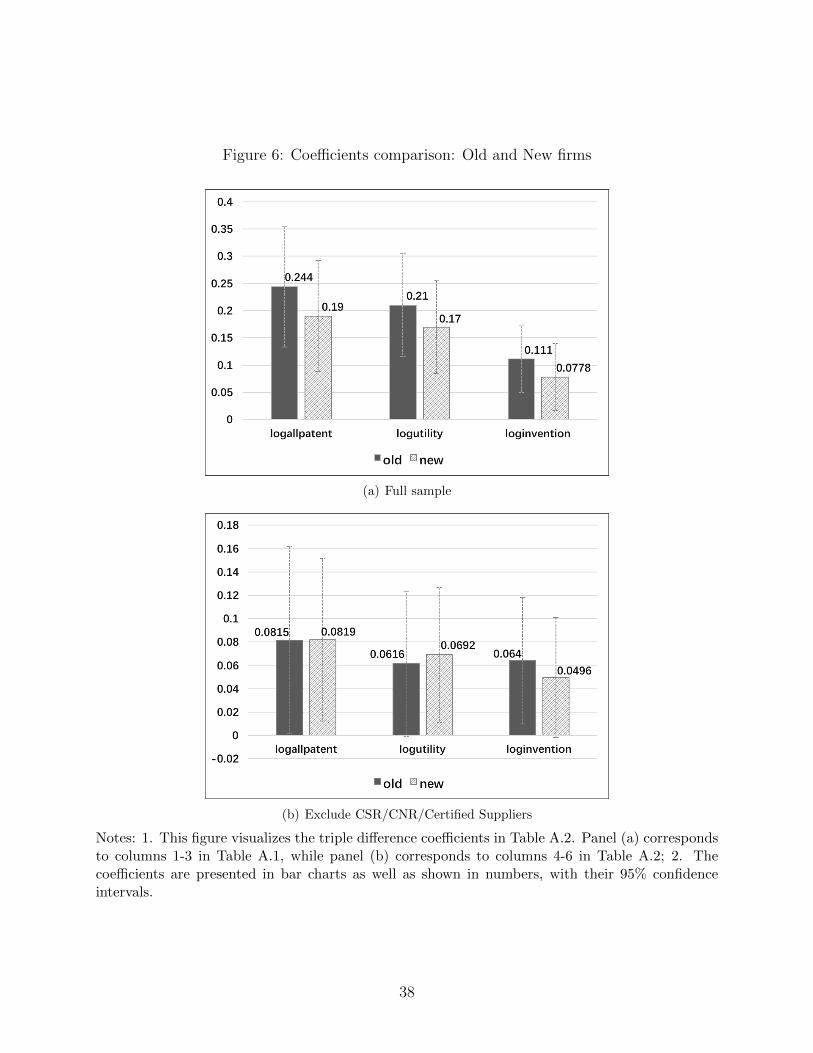
Figure 6: Coefficients comparison: Old and New firms
(a) Full sample
(b) Exclude CSR/CNR/Certified Suppliers
Notes: 1. This figure visualizes the triple difference coefficients in Table A.2. Panel (a) correspondsto columns 1-3 in Table A.1, while panel (b) corresponds to columns 4-6 in Table A.2; 2. Thecoefficients are presented in bar charts as well as shown in numbers, with their 95% confidenceintervals.
38

Figure 7: Distance to CSR/CNR firms and Firm Patenting Outcomes
(a) Total Patents
(b) Utility Model Patents
39

Figure 7: Distance to CSR/CNR firms and Firm Patenting Outcomes
(c) Inventions
Notes: 1. This figure visualizes the βd coefficients in Equation (2). The regression tables areavailable upon request. 2. The coefficients are presented in dots, with their 95% confidence intervals.
40
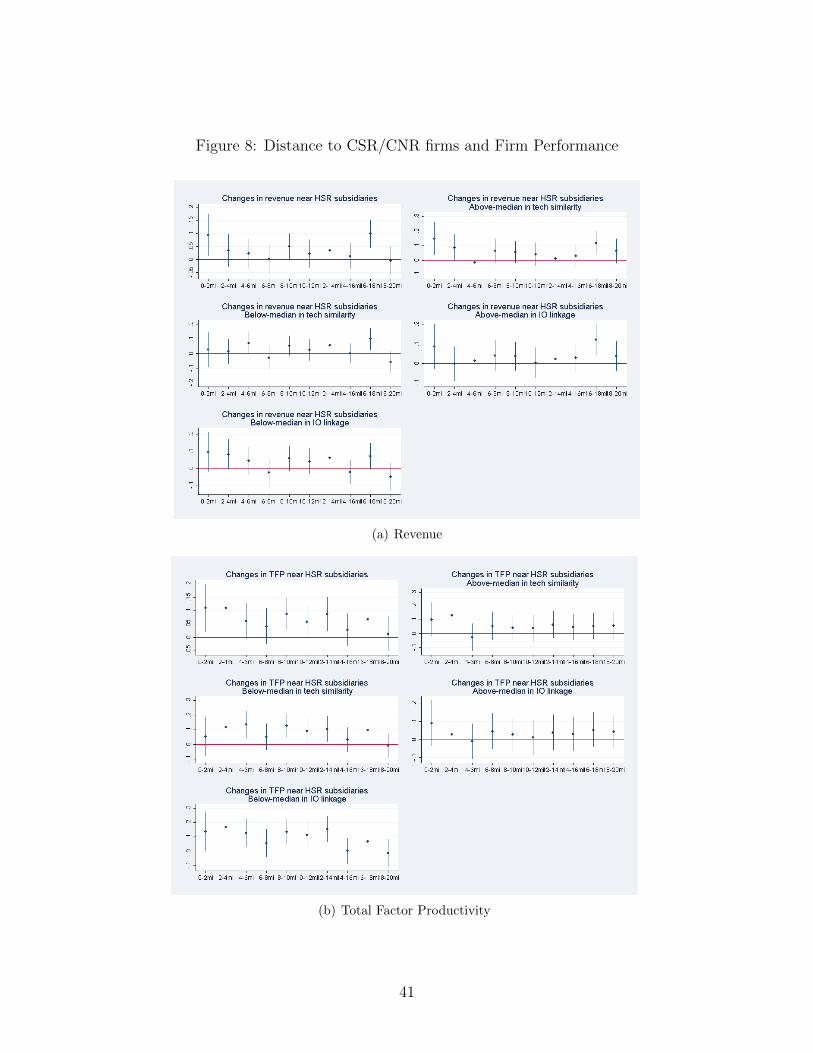
Figure 8: Distance to CSR/CNR firms and Firm Performance
(a) Revenue
(b) Total Factor Productivity
41

Figure 8: Distance to CSR/CNR firms and Firm Performance
(c) Firm Entry
Notes: 1. This figure visualizes the βd coefficients in Equation (2). The regression tables areavailable upon request. 2. The coefficients are presented in dots, with their 95% confidence intervals.
42

Table 1: Summary Statistics
Panel A: City Level Economic Variables
HSR cities Non-HSR cities Difference between HSR and Non-HSR citiesMean Std Dev Mean Std Dev Mean Std Dev
GDP per capita 1996 9.681 (3.291) 7.351 (8.755) 2.331 ( 1.928)GDP growth 1996 0.193 (0.053) 0.174 (0.075) 0.019 (0.017)GDP per capita 2004 21.550 (10.128) 13.381 (23.110) 8.169 (3.518)**GDP growth 2004 0.195 (0.036) 0.194 (0.058) 0.001 (0.012)GDP per capita 2010 50.734 (23.111) 28.370 (22.289) 22.364 (4.751)***GDP growth 2010 0.184 (0.029) 0.197 (0.039) -0.013 (0.008)population 1996 5766.776 (2557.171) 3019.944 (2498.963) 2746.832 (573.772)***population 2004 6358.079 (2474.543) 4015.468 (2827.906) 2342.611 (599.160)***population 2010 7271.600 (3727.994) 3987.834 (3137.841) 3283.766 (677.262)***
Panel B: Patents by City Type and Technology Type
HSR cities Non-HSR citiesHSR tech Non-HSR tech HSR tech Non-HSR tech
total patents 1996 12.64 601.96 1.59 71.68(3.49) (179.03) (0.23) (7.55)
utility patents 1996 11.6 523.76 1.53 65.55(3.08) (145.68) (0.22) (6.80)
invention patents 1996 1.04 78.2 0.06 6.13(0.45) (34.64) (0.02) (0.82)
total patents 2004 62.64 1604.48 11.61 242.56(28.41) (481.79) (5.85) (43.27)
utility patents 2004 29.08 1030.16 6.01 188.29(7.96) (245.53) (1.12) (28.79)
invention patents 2004 33.56 574.32 5.6 54.27(20.51) (241.75) (3.59) (14.48)
total patents 2010 383.76 5758.72 52.81 858.07(142.67) (1649.93) (14.46) (147.76)
utility patents 2010 170.96 3718 30.96 652.24(42.87) (862.51) (6.05) (104.24)
invention patents 2010 188.56 1979.84 19.77 198.09(101.47) (933.55) (7.46) (42.27)
Notes:1. Data source is from China Statistical Yearbooks (1997,2005 and 2011) and SIPO database; 2. * significant at the 0.1 level; **significant at the 0.05 level; *** significant at the 0.01 level.
43

Table 2: Impact of Technology Transfer on Domestic Innovation
Full Sample
VARIABLES logallpatent logutility loginvention logallpatent logutility loginvention
HSRCity*Tech*After 0.423*** 0.384*** 0.267*** 0.423*** 0.384*** 0.267***(0.0587) (0.0533) (0.0451) (0.0587) (0.0533) (0.0451)
HSRCity*After -0.0171 -0.0337** -0.00456 -0.0170 -0.0336** -0.00453(0.0157) (0.0150) (0.00860) (0.0157) (0.0150) (0.00860)
Tech*After 0.0199** -0.00271 0.0355*** 0.0200** -0.00264 0.0356***(0.00913) (0.00772) (0.00776) (0.00914) (0.00772) (0.00776)
HSRCity*Tech 0.0720** 0.0698*** 0.0259 0.0595*** 0.0194 0.0577***(0.0284) (0.0239) (0.0176) (0.0229) (0.0202) (0.0170)
Tech -0.0208*** -0.0290*** 0.0106*** -0.0182*** -0.0225*** 0.00897***(0.00539) (0.00494) (0.00296) (0.00535) (0.00506) (0.00274)
Observations 1,677,088 1,677,088 1,677,088 1,677,088 1,677,088 1,677,088R-squared 0.334 0.297 0.274 0.338 0.303 0.282CITY, YEAR, IPC2 FE YES YES YES YES YES YESIPC2*YEAR YES YES YES YES YES YESCITY*YEAR YES YES YES YES YES YESHSRCITY*IPC2*YEAR NO NO NO YES YES YES
Notes:1. The table reports triple difference estimation results from equation 1. logallpatent is the log sum of patents granted within eachIPC 4 digit category-city group for each year. logutility is the log sum of utility-model patents. loginvention is the log sum of inventionpatents. HSRCity is an indicator on whether or not the city is a HSR-technology receiving city. Tech is an indicator on whether or notthe patents belong to HSR-related IPC 4-digit technology classes. After is a dummy that switches on for all years after 2004. All theregressions include city, year and IPC2 fixed effects, as well as IPC2 and city specific year trends. The last three columns report resultsby controlling for HSR-city*IPC2 specific year trend as well. 2. Robust clustered standard error at the city level. 3. * significant at the0.1 level; ** significant at the 0.05 level; *** significant at the 0.01 level.
44

Table 3: Impact of Technology Transfer on Domestic Innovation (Excluding CSR/CNR Subsidiaries)
Exclude CSR/CNR Subsidiaries
VARIABLES logallpatent logutility loginvention logallpatent logutility loginvention
HSRCity*Tech*After 0.207*** 0.181*** 0.191*** 0.207*** 0.181*** 0.191***(0.0463) (0.0416) (0.0401) (0.0463) (0.0416) (0.0401)
HSRCity*After -0.0140 -0.0307** -0.00284 -0.0140 -0.0306** -0.00281(0.0161) (0.0155) (0.00859) (0.0161) (0.0155) (0.00859)
Tech*After 0.0191** -0.00350 0.0356*** 0.0192** -0.00343 0.0356***(0.00911) (0.00769) (0.00774) (0.00912) (0.00769) (0.00774)
HSRCity*Tech 0.0689** 0.0676*** 0.0243 0.0626*** 0.0226 0.0581***(0.0281) (0.0236) (0.0176) (0.0232) (0.0206) (0.0171)
Tech -0.0211*** -0.0293*** 0.0106*** -0.0190*** -0.0233*** 0.00864***(0.00538) (0.00493) (0.00296) (0.00533) (0.00504) (0.00273)
Observations 1,677,088 1,677,088 1,677,088 1,677,088 1,677,088 1,677,088R-squared 0.333 0.296 0.273 0.337 0.302 0.282CITY, YEAR, IPC2 FE YES YES YES YES YES YESIPC2*YEAR YES YES YES YES YES YESCITY*YEAR YES YES YES YES YES YESHSRCITY*IPC2*YEAR NO NO NO YES YES YES
Notes:1. The table reports triple difference estimation results from equation 1, on a sample that excludes the patents applied by CSR/CNRsubsidiaries. logallpatent is the log sum of patents granted within each IPC 4 digit category-city group for each year. logutility is the logsum of utility-model patents. loginvention is the log sum of invention patents. HSRCity is an indicator on whether or not the city is aHSR-technology receiving city. Tech is an indicator on whether or not the patents belong to HSR-related IPC 4-digit technology classes.After is a dummy that switches on for all years after 2004. All the regressions include city, year and IPC2 fixed effects, as well as IPC2and city specific year trends. The last three columns report results by controlling for HSR-city*IPC2. 2. Robust clustered standard errorat the city level. 3. * significant at the 0.1 level; ** significant at the 0.05 level; *** significant at the 0.01 level.
45

Table 4: Impact of Technology Transfer on Domestic Innovation in Non-Railway Related Firms
Exclude CSR/CNR/Certified Suppliers
VARIABLES logallpatent logutility loginvention logallpatent logutility loginvention
HSRCity*Tech*After 0.201*** 0.174*** 0.190*** 0.201*** 0.174*** 0.190***(0.0456) (0.0407) (0.0400) (0.0456) (0.0407) (0.0400)
HSRCity*After -0.0136 -0.0303* -0.00263 -0.0136 -0.0302* -0.00260(0.0161) (0.0155) (0.00851) (0.0161) (0.0155) (0.00851)
Tech*After 0.0192** -0.00368 0.0362*** 0.0193** -0.00361 0.0363***(0.00909) (0.00763) (0.00792) (0.00909) (0.00763) (0.00792)
HSRCity*Tech 0.0660** 0.0660*** 0.0230 0.0602*** 0.0218 0.0568***(0.0274) (0.0230) (0.0174) (0.0228) (0.0205) (0.0169)
Tech -0.0216*** -0.0294*** 0.00977*** -0.0196*** -0.0235*** 0.00788***(0.00525) (0.00492) (0.00249) (0.00525) (0.00504) (0.00236)
Observations 1,677,088 1,677,088 1,677,088 1,677,088 1,677,088 1,677,088R-squared 0.333 0.296 0.273 0.337 0.302 0.282CITY, YEAR, IPC2 FE YES YES YES YES YES YESIPC2*YEAR YES YES YES YES YES YESCITY*YEAR YES YES YES YES YES YESHSRCITY*IPC2*YEAR NO NO NO YES YES YES
Notes:1. The table reports triple difference estimation results from equation 1, on a sample that excludes the patents applied byCSR/CNR subsidiaries and the certified suppliers to CSR/CNR. logallpatent is the log sum of patents granted within each IPC 4 digitcategory-city group for each year. logutility is the log sum of utility-model patents. loginvention is the log sum of invention patents.HSRCity is an indicator on whether or not the city is a HSR-technology receiving city. Tech is an indicator on whether or not the patentsbelong to HSR-related IPC 4-digit technology classes. After is a dummy that switches on for all years after 2004. All the regressionsinclude city, year and IPC2 fixed effects, as well as IPC2 and city specific year trends. The last three columns report results by controllingfor HSR-city*IPC2 specific year trend as well. 2. Robust clustered standard error at the city level. 3. * significant at the 0.1 level; **significant at the 0.05 level; *** significant at the 0.01 level.
46
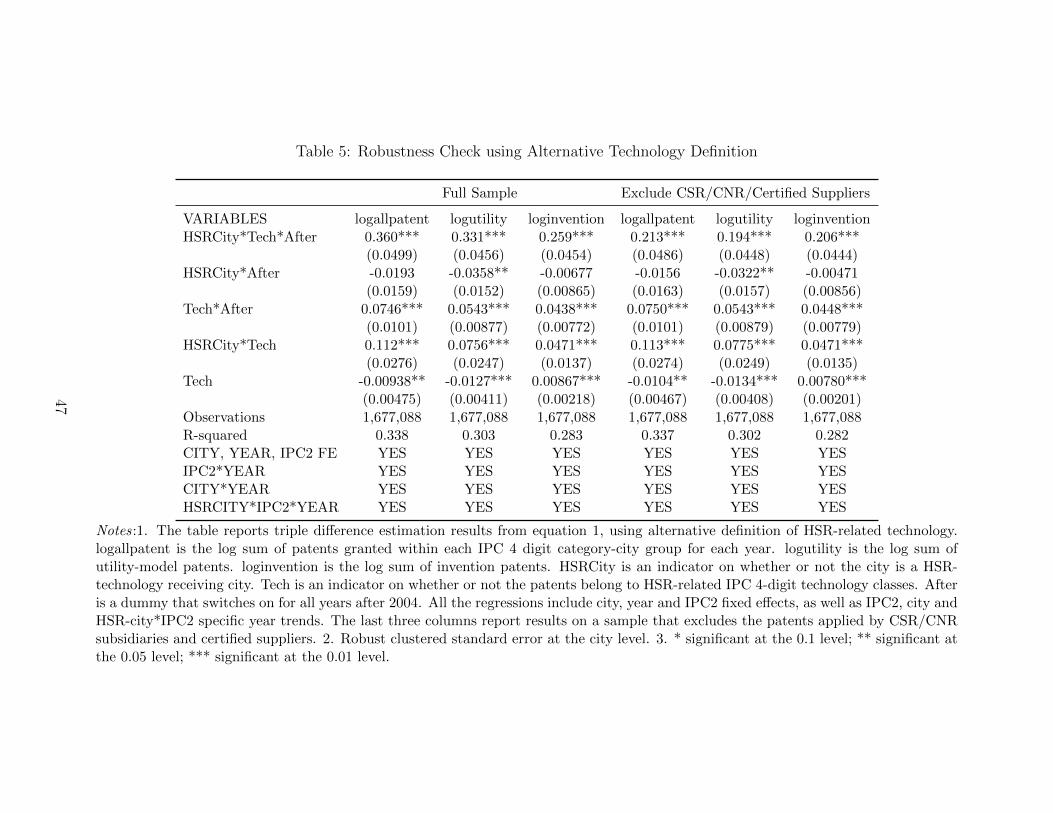
Table 5: Robustness Check using Alternative Technology Definition
Full Sample Exclude CSR/CNR/Certified Suppliers
VARIABLES logallpatent logutility loginvention logallpatent logutility loginventionHSRCity*Tech*After 0.360*** 0.331*** 0.259*** 0.213*** 0.194*** 0.206***
(0.0499) (0.0456) (0.0454) (0.0486) (0.0448) (0.0444)HSRCity*After -0.0193 -0.0358** -0.00677 -0.0156 -0.0322** -0.00471
(0.0159) (0.0152) (0.00865) (0.0163) (0.0157) (0.00856)Tech*After 0.0746*** 0.0543*** 0.0438*** 0.0750*** 0.0543*** 0.0448***
(0.0101) (0.00877) (0.00772) (0.0101) (0.00879) (0.00779)HSRCity*Tech 0.112*** 0.0756*** 0.0471*** 0.113*** 0.0775*** 0.0471***
(0.0276) (0.0247) (0.0137) (0.0274) (0.0249) (0.0135)Tech -0.00938** -0.0127*** 0.00867*** -0.0104** -0.0134*** 0.00780***
(0.00475) (0.00411) (0.00218) (0.00467) (0.00408) (0.00201)Observations 1,677,088 1,677,088 1,677,088 1,677,088 1,677,088 1,677,088R-squared 0.338 0.303 0.283 0.337 0.302 0.282CITY, YEAR, IPC2 FE YES YES YES YES YES YESIPC2*YEAR YES YES YES YES YES YESCITY*YEAR YES YES YES YES YES YESHSRCITY*IPC2*YEAR YES YES YES YES YES YES
Notes:1. The table reports triple difference estimation results from equation 1, using alternative definition of HSR-related technology.logallpatent is the log sum of patents granted within each IPC 4 digit category-city group for each year. logutility is the log sum ofutility-model patents. loginvention is the log sum of invention patents. HSRCity is an indicator on whether or not the city is a HSR-technology receiving city. Tech is an indicator on whether or not the patents belong to HSR-related IPC 4-digit technology classes. Afteris a dummy that switches on for all years after 2004. All the regressions include city, year and IPC2 fixed effects, as well as IPC2, city andHSR-city*IPC2 specific year trends. The last three columns report results on a sample that excludes the patents applied by CSR/CNRsubsidiaries and certified suppliers. 2. Robust clustered standard error at the city level. 3. * significant at the 0.1 level; ** significant atthe 0.05 level; *** significant at the 0.01 level.
47

Table 6: Robustness Check using Alternative Year of Treatment
Full Sample Exclude CSR/CNR/Certified Suppliers
VARIABLES logallpatent logutility loginvention logallpatent logutility loginventionHSRCity*Tech*After2005 0.443*** 0.402*** 0.276*** 0.204*** 0.176*** 0.193***
(0.0561) (0.0513) (0.0446) (0.0460) (0.0411) (0.0396)HSRCity*After2005 0.00814 -0.00158 0.0149 0.00819 -0.00107 0.0153
(0.0170) (0.0161) (0.0112) (0.0174) (0.0164) (0.0113)Tech*After2005 0.0207** -0.00155 0.0361*** 0.0199** -0.00268 0.0367***
(0.00908) (0.00763) (0.00773) (0.00904) (0.00753) (0.00790)HSRCity*Tech 0.0690*** 0.0275 0.0664*** 0.0680*** 0.0281 0.0648***
(0.0254) (0.0216) (0.0201) (0.0250) (0.0218) (0.0199)Tech -0.0185*** -0.0231*** 0.00873*** -0.0199*** -0.0240*** 0.00768***
(0.00534) (0.00503) (0.00273) (0.00524) (0.00501) (0.00234)Observations 1,677,088 1,677,088 1,677,088 1,677,088 1,677,088 1,677,088R-squared 0.338 0.303 0.282 0.337 0.302 0.282CITY, YEAR, IPC2 FE YES YES YES YES YES YESIPC2*YEAR YES YES YES YES YES YESCITY*YEAR YES YES YES YES YES YESHSRCITY*IPC2*YEAR YES YES YES YES YES YES
Notes: 1. The table reports triple difference estimation results from equation 1. logallpatent is the log sum of patents granted withineach IPC 4 digit category-city group for each year. logutility is the log sum of utility-model patents. loginvention is the log sum ofinvention patents. HSRCity is an indicator on whether or not the city is a HSR-technology receiving city. Tech is an indicator on whetheror not the patents belong to HSR-related IPC 4-digit technology classes. After2005 is a dummy that switches on for all years after 2005.All the regressions include city, year and IPC2 fixed effects, as well as IPC2, city and HSR-city*IPC2 specific year trends. The lastthree columns report results on a sample that excludes the patents applied by CSR/CNR subsidiaries and certified suppliers. 2. Robustclustered standard error at the city level. 3. * significant at the 0.1 level; ** significant at the 0.05 level; *** significant at the 0.01 level.
48
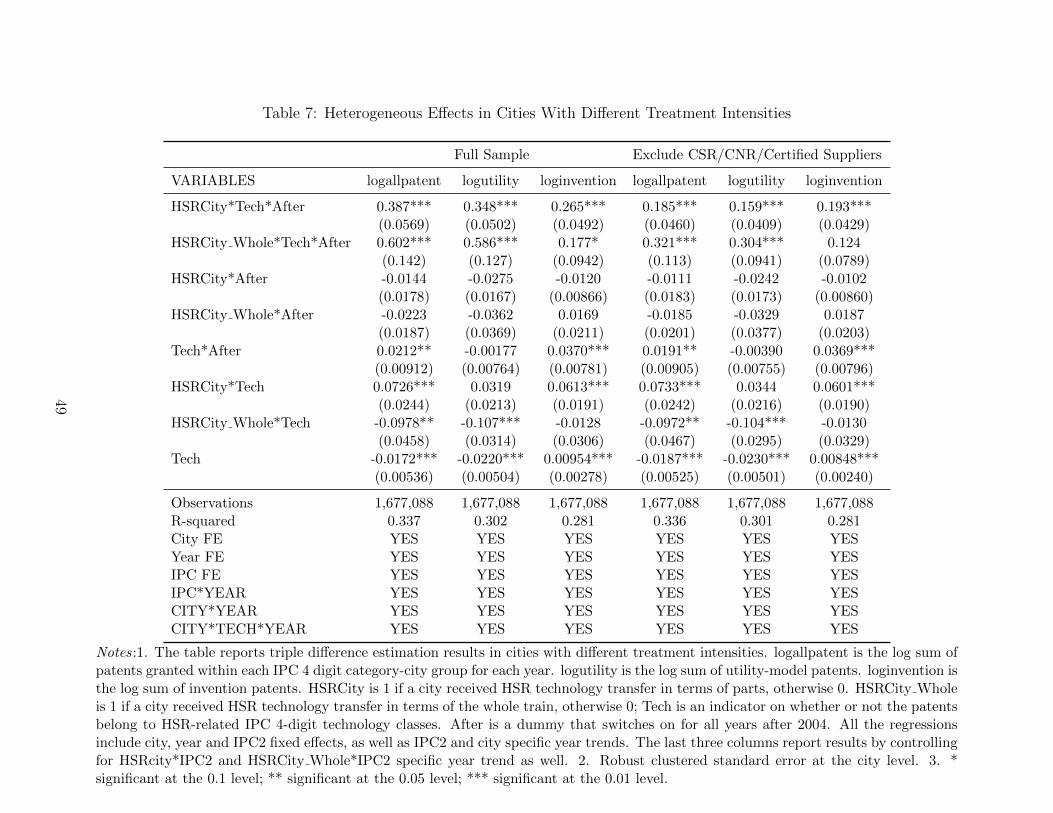
Table 7: Heterogeneous Effects in Cities With Different Treatment Intensities
Full Sample Exclude CSR/CNR/Certified Suppliers
VARIABLES logallpatent logutility loginvention logallpatent logutility loginvention
HSRCity*Tech*After 0.387*** 0.348*** 0.265*** 0.185*** 0.159*** 0.193***(0.0569) (0.0502) (0.0492) (0.0460) (0.0409) (0.0429)
HSRCity Whole*Tech*After 0.602*** 0.586*** 0.177* 0.321*** 0.304*** 0.124(0.142) (0.127) (0.0942) (0.113) (0.0941) (0.0789)
HSRCity*After -0.0144 -0.0275 -0.0120 -0.0111 -0.0242 -0.0102(0.0178) (0.0167) (0.00866) (0.0183) (0.0173) (0.00860)
HSRCity Whole*After -0.0223 -0.0362 0.0169 -0.0185 -0.0329 0.0187(0.0187) (0.0369) (0.0211) (0.0201) (0.0377) (0.0203)
Tech*After 0.0212** -0.00177 0.0370*** 0.0191** -0.00390 0.0369***(0.00912) (0.00764) (0.00781) (0.00905) (0.00755) (0.00796)
HSRCity*Tech 0.0726*** 0.0319 0.0613*** 0.0733*** 0.0344 0.0601***(0.0244) (0.0213) (0.0191) (0.0242) (0.0216) (0.0190)
HSRCity Whole*Tech -0.0978** -0.107*** -0.0128 -0.0972** -0.104*** -0.0130(0.0458) (0.0314) (0.0306) (0.0467) (0.0295) (0.0329)
Tech -0.0172*** -0.0220*** 0.00954*** -0.0187*** -0.0230*** 0.00848***(0.00536) (0.00504) (0.00278) (0.00525) (0.00501) (0.00240)
Observations 1,677,088 1,677,088 1,677,088 1,677,088 1,677,088 1,677,088R-squared 0.337 0.302 0.281 0.336 0.301 0.281City FE YES YES YES YES YES YESYear FE YES YES YES YES YES YESIPC FE YES YES YES YES YES YESIPC*YEAR YES YES YES YES YES YESCITY*YEAR YES YES YES YES YES YESCITY*TECH*YEAR YES YES YES YES YES YES
Notes:1. The table reports triple difference estimation results in cities with different treatment intensities. logallpatent is the log sum ofpatents granted within each IPC 4 digit category-city group for each year. logutility is the log sum of utility-model patents. loginvention isthe log sum of invention patents. HSRCity is 1 if a city received HSR technology transfer in terms of parts, otherwise 0. HSRCity Wholeis 1 if a city received HSR technology transfer in terms of the whole train, otherwise 0; Tech is an indicator on whether or not the patentsbelong to HSR-related IPC 4-digit technology classes. After is a dummy that switches on for all years after 2004. All the regressionsinclude city, year and IPC2 fixed effects, as well as IPC2 and city specific year trends. The last three columns report results by controllingfor HSRcity*IPC2 and HSRCity Whole*IPC2 specific year trend as well. 2. Robust clustered standard error at the city level. 3. *significant at the 0.1 level; ** significant at the 0.05 level; *** significant at the 0.01 level.
49
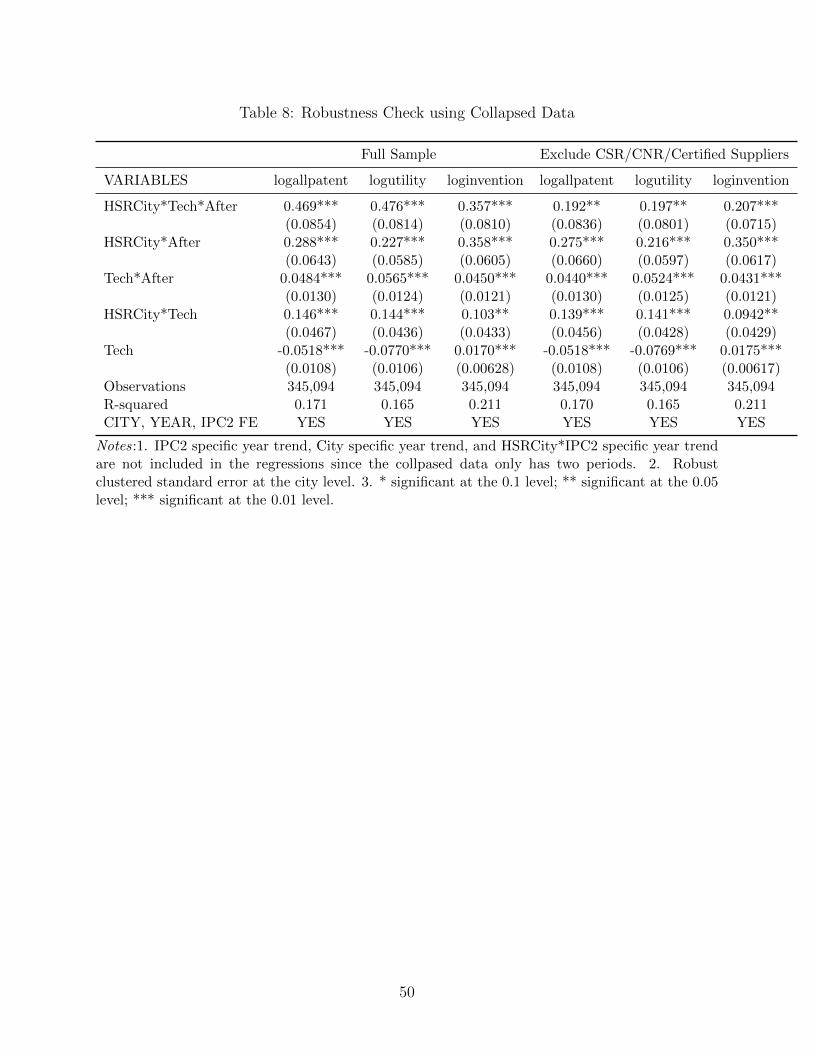
Table 8: Robustness Check using Collapsed Data
Full Sample Exclude CSR/CNR/Certified Suppliers
VARIABLES logallpatent logutility loginvention logallpatent logutility loginvention
HSRCity*Tech*After 0.469*** 0.476*** 0.357*** 0.192** 0.197** 0.207***(0.0854) (0.0814) (0.0810) (0.0836) (0.0801) (0.0715)
HSRCity*After 0.288*** 0.227*** 0.358*** 0.275*** 0.216*** 0.350***(0.0643) (0.0585) (0.0605) (0.0660) (0.0597) (0.0617)
Tech*After 0.0484*** 0.0565*** 0.0450*** 0.0440*** 0.0524*** 0.0431***(0.0130) (0.0124) (0.0121) (0.0130) (0.0125) (0.0121)
HSRCity*Tech 0.146*** 0.144*** 0.103** 0.139*** 0.141*** 0.0942**(0.0467) (0.0436) (0.0433) (0.0456) (0.0428) (0.0429)
Tech -0.0518*** -0.0770*** 0.0170*** -0.0518*** -0.0769*** 0.0175***(0.0108) (0.0106) (0.00628) (0.0108) (0.0106) (0.00617)
Observations 345,094 345,094 345,094 345,094 345,094 345,094R-squared 0.171 0.165 0.211 0.170 0.165 0.211CITY, YEAR, IPC2 FE YES YES YES YES YES YES
Notes:1. IPC2 specific year trend, City specific year trend, and HSRCity*IPC2 specific year trendare not included in the regressions since the collpased data only has two periods. 2. Robustclustered standard error at the city level. 3. * significant at the 0.1 level; ** significant at the 0.05level; *** significant at the 0.01 level.
50

Table 9: Robustness Check using Nearest Neighbor Matching
Full Sample Exclude CSR/CNR/Certified Suppliers
VARIABLES logallpatent logutility loginvention logallpatent logutility loginventionHSRCity*Tech*After 0.366*** 0.340*** 0.224*** 0.162*** 0.146*** 0.148***
(0.0728) (0.0659) (0.0593) (0.0586) (0.0525) (0.0547)HSRCity*After 0.0160 0.00319 -0.00248 0.0189 0.00601 -0.000381
(0.0203) (0.0190) (0.0116) (0.0206) (0.0194) (0.0116)Tech*After 0.0683* 0.0196 0.0909*** 0.0701** 0.0213 0.0934***
(0.0345) (0.0298) (0.0336) (0.0346) (0.0298) (0.0336)HSRCity*Tech 0.0623** 0.0288 0.0580*** 0.0617** 0.0304 0.0559***
(0.0296) (0.0276) (0.0201) (0.0295) (0.0278) (0.0200)Tech -0.0106 -0.0193 0.0173* -0.0141 -0.0225 0.0161*
(0.0171) (0.0173) (0.00940) (0.0171) (0.0173) (0.00938)Observations 426,896 426,896 426,896 426,896 426,896 426,896R-squared 0.342 0.313 0.306 0.341 0.312 0.306CITY, YEAR, IPC2 FE YES YES YES YES YES YESIPC2*YEAR YES YES YES YES YES YESCITY*YEAR YES YES YES YES YES YESHSRCITY*IPC2*YEAR YES YES YES YES YES YES
Notes:1. The table reports triple-difference -matching estimation results from equation 1, on amatched sample where we match the technology receiving cities to similar cities on 2003 pollution,GDP, patents application and the 1996-2003 growth trends of these variables. logallpatent is thelog sum of patents granted within each IPC 4 digit category-city group for each year. logutility isthe log sum of utility-model patents. loginvention is the log sum of invention patents. HSRCity isan indicator on whether or not the city is a HSR-technology receiving city. Tech is an indicatoron whether or not the patents belong to HSR-related IPC 4-digit technology classes. After is adummy that switches on for all years after 2004. All the regressions include city, year and IPC2fixed effects, as well as IPC2, city and HSR-city*IPC2 specific year trends. The last three columnsreport results on a sample that excludes the patents applied by CSR/CNR subsidiaries and certifiedsuppliers. 2. Robust clustered standard error at the city level. 3. * significant at the 0.1 level; **significant at the 0.05 level; *** significant at the 0.01 level.
51

Table 10: Mechanisms: Geographic Proximity
Full Sample Exclude CSR/CNR/Certified Suppliers
VARIABLES logallpatent logutility loginvention logallpatent logutility loginvention
Ln(Distance)*Tech*After -0.0115 -0.00700 -0.00767 -0.0114 -0.00741 -0.00676(0.0110) (0.00962) (0.0101) (0.0111) (0.00960) (0.0106)
Tech*After 0.0867 0.0418 0.0805 0.0841 0.0415 0.0757(0.0592) (0.0517) (0.0548) (0.0598) (0.0515) (0.0569)
Ln(Distance)*After 0.00833* 0.00936** 0.00235 0.00836* 0.00931** 0.00245(0.00474) (0.00439) (0.00292) (0.00477) (0.00440) (0.00300)
Ln (Distance)*Tech 0.0108 0.00639 0.00623 0.00983 0.00611 0.00482(0.00683) (0.00506) (0.00503) (0.00613) (0.00493) (0.00371)
Ln (Distance) -10.31*** -7.657*** -4.821*** -10.33*** -7.673*** -4.818***(2.470) (2.119) (1.089) (2.476) (2.112) (1.097)
Tech -0.0782** -0.0599** -0.0258 -0.0735** -0.0587** -0.0191(0.0367) (0.0280) (0.0253) (0.0335) (0.0274) (0.0191)
Observations 1,452,976 1,452,976 1,452,976 1,452,976 1,452,976 1,452,976R-squared 0.299 0.270 0.238 0.299 0.270 0.238CITY, YEAR, IPC2 FE YES YES YES YES YES YESIPC2*YEAR YES YES YES YES YES YESCITY*YEAR YES YES YES YES YES YES
Notes:1. This table reports the results on spillovers of transferred technology to other cities, on a sample that excludes the HSR-technologyreceiving cities. logallpatent is the log sum of patents granted within each IPC 4 digit category-city group for each year. logutility is thelog sum of utility-model patents. loginvention is the log sum of invention patents. Ln(Distance) is the straight line distance from thecity examined to the closest Technology receiving city. HSRCity is an indicator on whether or not the city is a HSR-technology receivingcity. Tech is an indicator on whether or not the patents belong to HSR-related IPC 4-digit technology classes. After is a dummy thatswitches on for all years after 2004. All the regressions include city, year and IPC2 fixed effects, as well as IPC2, city and HSR-city*IPC2specific year trends. The last three columns report results on a sample that excludes the patents applied by CSR/CNR subsidiaries andcertified suppliers. 2. Robust clustered standard error at the city level. 3. * significant at the 0.1 level; ** significant at the 0.05 level;*** significant at the 0.01 level.
52
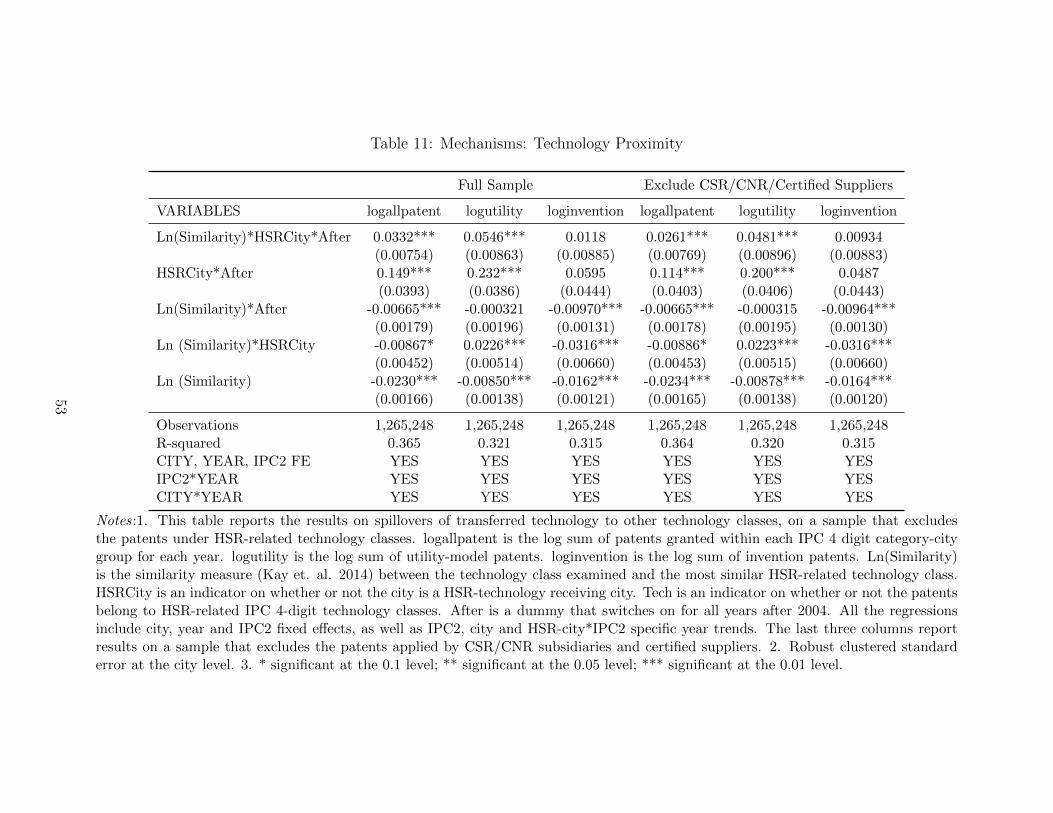
Table 11: Mechanisms: Technology Proximity
Full Sample Exclude CSR/CNR/Certified Suppliers
VARIABLES logallpatent logutility loginvention logallpatent logutility loginvention
Ln(Similarity)*HSRCity*After 0.0332*** 0.0546*** 0.0118 0.0261*** 0.0481*** 0.00934(0.00754) (0.00863) (0.00885) (0.00769) (0.00896) (0.00883)
HSRCity*After 0.149*** 0.232*** 0.0595 0.114*** 0.200*** 0.0487(0.0393) (0.0386) (0.0444) (0.0403) (0.0406) (0.0443)
Ln(Similarity)*After -0.00665*** -0.000321 -0.00970*** -0.00665*** -0.000315 -0.00964***(0.00179) (0.00196) (0.00131) (0.00178) (0.00195) (0.00130)
Ln (Similarity)*HSRCity -0.00867* 0.0226*** -0.0316*** -0.00886* 0.0223*** -0.0316***(0.00452) (0.00514) (0.00660) (0.00453) (0.00515) (0.00660)
Ln (Similarity) -0.0230*** -0.00850*** -0.0162*** -0.0234*** -0.00878*** -0.0164***(0.00166) (0.00138) (0.00121) (0.00165) (0.00138) (0.00120)
Observations 1,265,248 1,265,248 1,265,248 1,265,248 1,265,248 1,265,248R-squared 0.365 0.321 0.315 0.364 0.320 0.315CITY, YEAR, IPC2 FE YES YES YES YES YES YESIPC2*YEAR YES YES YES YES YES YESCITY*YEAR YES YES YES YES YES YES
Notes:1. This table reports the results on spillovers of transferred technology to other technology classes, on a sample that excludesthe patents under HSR-related technology classes. logallpatent is the log sum of patents granted within each IPC 4 digit category-citygroup for each year. logutility is the log sum of utility-model patents. loginvention is the log sum of invention patents. Ln(Similarity)is the similarity measure (Kay et. al. 2014) between the technology class examined and the most similar HSR-related technology class.HSRCity is an indicator on whether or not the city is a HSR-technology receiving city. Tech is an indicator on whether or not the patentsbelong to HSR-related IPC 4-digit technology classes. After is a dummy that switches on for all years after 2004. All the regressionsinclude city, year and IPC2 fixed effects, as well as IPC2, city and HSR-city*IPC2 specific year trends. The last three columns reportresults on a sample that excludes the patents applied by CSR/CNR subsidiaries and certified suppliers. 2. Robust clustered standarderror at the city level. 3. * significant at the 0.1 level; ** significant at the 0.05 level; *** significant at the 0.01 level.
53

Table 12: Mechanisms: Spillover Effects in Cities With and Without Railway-related Re-
search Universities
In cities with university patents in railway before 2004
Full Sample Exclude CSR/CNR/Certified Suppliers
VARIABLES logallpatent logutility loginvention logallpatent logutility loginvention
HSRCity*Tech*After 0.384*** 0.359*** 0.252*** 0.175*** 0.160*** 0.168***(0.0783) (0.0722) (0.0559) (0.0528) (0.0493) (0.0499)
HSRCity*After -0.00574 -0.0167 -0.00727 -0.00304 -0.0135 -0.00601(0.0192) (0.0164) (0.0139) (0.0194) (0.0166) (0.0140)
Tech*After 0.120*** 0.0519** 0.143*** 0.125*** 0.0556** 0.148***(0.0264) (0.0219) (0.0287) (0.0266) (0.0218) (0.0297)
HSRCity*Tech 0.0679* 0.0357 0.0588** 0.0688* 0.0379 0.0595**(0.0345) (0.0305) (0.0252) (0.0344) (0.0309) (0.0247)
Tech 0.00732 -0.0129 0.0356*** 0.00229 -0.0160 0.0312***(0.0156) (0.0132) (0.0115) (0.0149) (0.0132) (0.00941)
Observations 508,272 508,272 508,272 508,272 508,272 508,272R-squared 0.334 0.312 0.298 0.333 0.311 0.298
In cities without university patents in railway before 2004
Full Sample Exclude CSR/CNR/Certified Suppliers
VARIABLES logallpatent logutility loginvention logallpatent logutility loginvention
HSRCity*Tech*After 0.276*** 0.262*** 0.0916** 0.0189 0.0239 0.0235(0.0537) (0.0506) (0.0429) (0.0451) (0.0414) (0.0363)
HSRCity*After -0.0155 -0.0189 -0.0141 -0.0101 -0.0147 -0.0105(0.0410) (0.0429) (0.00947) (0.0427) (0.0447) (0.00984)
Tech*After -0.00163 -0.0112 0.0118*** -0.00437 -0.0138** 0.0109***(0.00754) (0.00693) (0.00387) (0.00736) (0.00678) (0.00372)
HSRCity*Tech 0.0194 0.0123 0.0111 0.0238 0.0160 0.0116*(0.0152) (0.0159) (0.00706) (0.0152) (0.0167) (0.00635)
Tech -0.0268*** -0.0275*** 0.000477 -0.0271*** -0.0278*** 0.000381(0.00511) (0.00501) (0.00118) (0.00509) (0.00499) (0.00117)
Observations 1,168,816 1,168,816 1,168,816 1,168,816 1,168,816 1,168,816R-squared 0.221 0.208 0.139 0.220 0.207 0.138
City FE YES YES YES YES YES YESYear FE YES YES YES YES YES YESIPC FE YES YES YES YES YES YESIPC*YEAR YES YES YES YES YES YESCITY*YEAR YES YES YES YES YES YESCITY*TECH*YEAR YES YES YES YES YES YES
Notes: Robust standard errors in parentheses. * significant at the 0.1 level; ** significant at the0.05 level; *** significant at the 0.01 level.
54
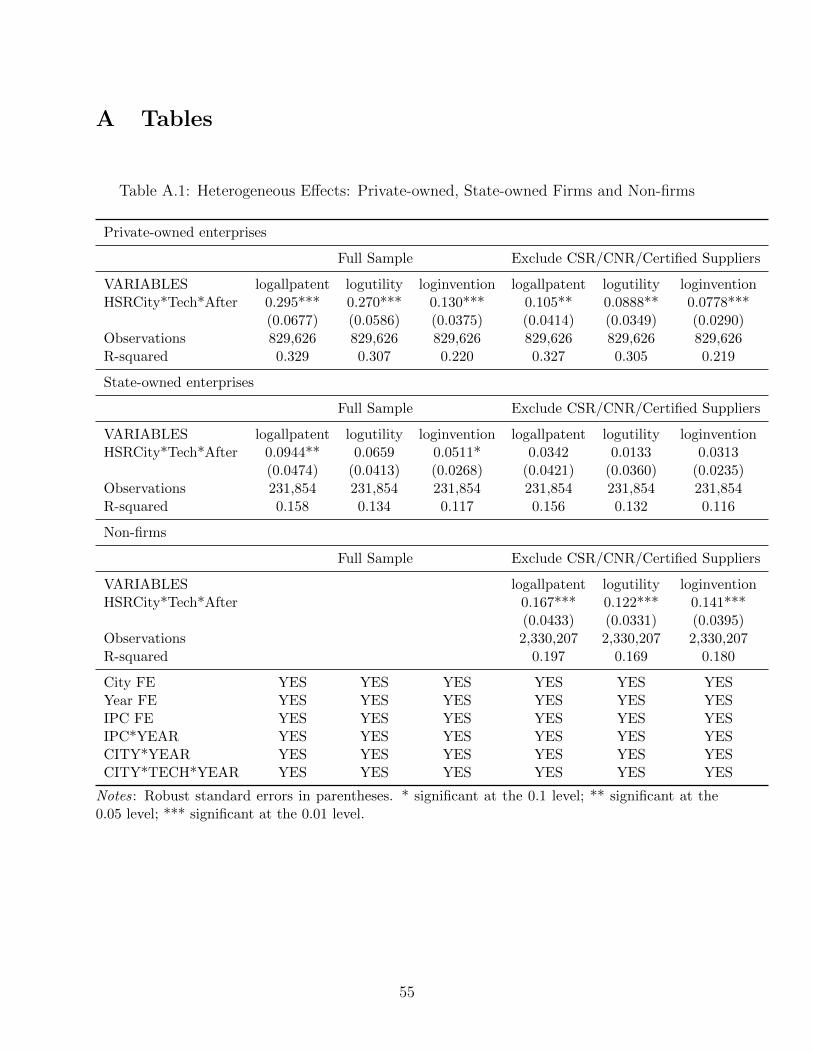
A Tables
Table A.1: Heterogeneous Effects: Private-owned, State-owned Firms and Non-firms
Private-owned enterprises
Full Sample Exclude CSR/CNR/Certified Suppliers
VARIABLES logallpatent logutility loginvention logallpatent logutility loginventionHSRCity*Tech*After 0.295*** 0.270*** 0.130*** 0.105** 0.0888** 0.0778***
(0.0677) (0.0586) (0.0375) (0.0414) (0.0349) (0.0290)Observations 829,626 829,626 829,626 829,626 829,626 829,626R-squared 0.329 0.307 0.220 0.327 0.305 0.219
State-owned enterprises
Full Sample Exclude CSR/CNR/Certified Suppliers
VARIABLES logallpatent logutility loginvention logallpatent logutility loginventionHSRCity*Tech*After 0.0944** 0.0659 0.0511* 0.0342 0.0133 0.0313
(0.0474) (0.0413) (0.0268) (0.0421) (0.0360) (0.0235)Observations 231,854 231,854 231,854 231,854 231,854 231,854R-squared 0.158 0.134 0.117 0.156 0.132 0.116
Non-firms
Full Sample Exclude CSR/CNR/Certified Suppliers
VARIABLES logallpatent logutility loginventionHSRCity*Tech*After 0.167*** 0.122*** 0.141***
(0.0433) (0.0331) (0.0395)Observations 2,330,207 2,330,207 2,330,207R-squared 0.197 0.169 0.180
City FE YES YES YES YES YES YESYear FE YES YES YES YES YES YESIPC FE YES YES YES YES YES YESIPC*YEAR YES YES YES YES YES YESCITY*YEAR YES YES YES YES YES YESCITY*TECH*YEAR YES YES YES YES YES YES
Notes: Robust standard errors in parentheses. * significant at the 0.1 level; ** significant at the0.05 level; *** significant at the 0.01 level.
55

Table A.2: Heterogeneous Effects: Old Firms and New Firms
Old firms (established years¿9)
Full Sample Exclude CSR/CNR/Certified Suppliers
VARIABLES logallpatent logutility loginvention logallpatent logutility loginventionHSRCity*Tech*After 0.244*** 0.210*** 0.111*** 0.0815** 0.0616* 0.0640**
(0.0566) (0.0485) (0.0310) (0.0409) (0.0317) (0.0277)Observations 659,848 659,848 659,848 659,848 659,848 659,848R-squared 0.300 0.282 0.182 0.298 0.279 0.180
New firms (established years ≤ 9)
Full Sample Exclude CSR/CNR/Certified Suppliers
VARIABLES logallpatent logutility loginvention logallpatent logutility loginventionHSRCity*Tech*After 0.190*** 0.170*** 0.0778** 0.0819** 0.0692** 0.0496*
(0.0521) (0.0440) (0.0314) (0.0355) (0.0295) (0.0262)Observations 656,488 656,488 656,488 656,488 656,488 656,488R-squared 0.277 0.253 0.185 0.276 0.252 0.185
City FE YES YES YES YES YES YESYear FE YES YES YES YES YES YESIPC FE YES YES YES YES YES YESIPC*YEAR YES YES YES YES YES YESCITY*YEAR YES YES YES YES YES YESCITY*TECH*YEAR YES YES YES YES YES YES
Notes: Robust standard errors in parentheses. * significant at the 0.1 level; ** significant at the0.05 level; *** significant at the 0.01 level.
56

Table A.3: Balancing Test of the Matching Sample
Variables Treated Control Difference
(N=23) (N=32)population at 2003 649.24 607.03 42.21
(90.23) (96.2) (121.35)GDP at 2003 12.91 9.86 3.05
(1.64) (2.17) (2.92)Gov spend in scientific research at 2003 8486.78 5887.31 2599.47
(4594.37) (3532.59) (5702.11)No. of patents at 2003 473.78 238.62 235.15
( 172.90) (108.28) ( 194.24)GDP growth (96-03) 1.58 2.01 -0.42
(0.46) (0.67) (0.88)population growth (96-03) 0.407 0.84 -0.43
(0.345) (0.115) (0.76)patents growth (96-03) 5.14 4.07 1.07
(0.66) (0.73) (1.03)
Notes:1. Standard errors are reported in parentheses. 2. T-test result is reported in the lastcolumn. * significant at the 0.1 level; ** significant at the 0.05 level; *** significant at the 0.01level.
57

Table A.4: Mechanisms: University Research (Dummy)
Full Sample Exclude CSR/CNR/Certified Suppliers
VARIABLES logallpatent logutility loginvention logallpatent logutility loginvention
HSRCity*Tech*After*School D 0.100 0.0953 0.147** 0.148** 0.134** 0.131**(0.0945) (0.0877) (0.0704) (0.0690) (0.0638) (0.0614)
HSRCity*After*School D 0.00983 0.00223 0.00699 0.00709 0.00127 0.00468(0.0452) (0.0459) (0.0168) (0.0468) (0.0477) (0.0170)
Tech*After*School D 0.165*** 0.124*** 0.152*** 0.169*** 0.127*** 0.156***(0.0297) (0.0258) (0.0326) (0.0303) (0.0260) (0.0338)
HSRCity*Tech*School D 0.0202 0.0183 0.0201 0.0181 0.0170 0.0209(0.0485) (0.0412) (0.0298) (0.0459) (0.0395) (0.0279)
Tech*School D 0.0417** 0.0355** 0.0201 0.0380** 0.0339** 0.0158(0.0198) (0.0145) (0.0159) (0.0178) (0.0141) (0.0122)
HSRCity*Tech*After 0.280*** 0.263*** 0.0985** 0.0233 0.0254 0.0304(0.0538) (0.0507) (0.0430) (0.0449) (0.0410) (0.0362)
HSRCity*After -0.0155 -0.0189 -0.0142 -0.0101 -0.0147 -0.0106(0.0410) (0.0429) (0.00947) (0.0427) (0.0447) (0.00983)
Tech*After -0.0182** -0.0314*** 0.000548 -0.0198** -0.0329*** 0.000278(0.00854) (0.00790) (0.00540) (0.00832) (0.00774) (0.00521)
HSRCity*Tech 0.0269 -0.00885 0.0348*** 0.0308 -0.00496 0.0352***(0.0252) (0.0255) (0.00965) (0.0235) (0.0244) (0.00888)
Tech -0.0277*** -0.0306*** 0.00435* -0.0283*** -0.0312*** 0.00425*(0.00563) (0.00544) (0.00244) (0.00552) (0.00537) (0.00228)
After*School D -0.0177 -0.0327*** 0.00868 -0.0176 -0.0328*** 0.00887(0.0130) (0.0112) (0.00922) (0.0130) (0.0112) (0.00946)
Observations 1,677,088 1,677,088 1,677,088 1,677,088 1,677,088 1,677,088R-squared 0.338 0.303 0.282 0.337 0.302 0.282CITY, YEAR, IPC2 FE YES YES YES YES YES YESIPC2*YEAR YES YES YES YES YES YESCITY*YEAR YES YES YES YES YES YESHSRCITY*IPC2*YEAR YES YES YES YES YES YES
Notes:1. This table reports the results on the relevance of university research activities on spillovers of transferred technology. SchoolDis an indicator of whether or not there are any university patents within HSR-related technology classes in the city. HSRCity is anindicator on whether or not the city is a HSR-technology receiving city. Tech is an indicator on whether or not the patents belong toHSR-related IPC 4-digit technology classes. After is a dummy that switches on for all years after 2004. The last three columns reportresults on a sample that excludes the patents applied by CSR/CNR subsidiaries and certified suppliers. Robust clustered standard errorat the city level.
58

Table A.5: Mechanisms: University Research (Ratio)
Full Sample Exclude CSR/CNR/Certified Suppliers
VARIABLES logallpatent logutility loginvention logallpatent logutility loginvention
HSRCity*Tech*After*Ratio 0.125 0.191 0.153 0.283* 0.287* 0.281*(0.272) (0.266) (0.197) (0.167) (0.170) (0.157)
HSRCity*After*Ratio 0.137* 0.135* 0.0183 0.136 0.135* 0.0145(0.0808) (0.0794) (0.0423) (0.0823) (0.0813) (0.0418)
Tech*After*Ratio 0.409*** 0.245** 0.405*** 0.416*** 0.251*** 0.408***(0.0897) (0.0963) (0.0928) (0.0899) (0.0964) (0.0934)
HSRCity*Tech*Ratio -0.0774 -0.0578 0.0145 -0.0916 -0.0653 0.00974(0.155) (0.129) (0.0884) (0.150) (0.124) (0.0891)
Tech*Ratio 0.108** 0.106** 0.0293 0.109** 0.106** 0.0318(0.0495) (0.0439) (0.0277) (0.0489) (0.0437) (0.0265)
HSRCity*Tech*After 0.328*** 0.302*** 0.167*** 0.0715 0.0708 0.0621**(0.0855) (0.0760) (0.0553) (0.0461) (0.0433) (0.0299)
HSRCity*After -0.0325 -0.0428 -0.00809 -0.0288 -0.0394 -0.00520(0.0275) (0.0280) (0.0118) (0.0283) (0.0289) (0.0116)
Tech*After -0.000437 -0.0162* 0.0173*** -0.00160 -0.0177** 0.0179***(0.00925) (0.00867) (0.00652) (0.00919) (0.00856) (0.00690)
HSRCity*Tech 0.0610* 0.0188 0.0489*** 0.0646** 0.0227 0.0487***(0.0326) (0.0300) (0.0150) (0.0326) (0.0301) (0.0145)
Tech -0.0252*** -0.0302*** 0.00845*** -0.0269*** -0.0313*** 0.00705***(0.00615) (0.00591) (0.00319) (0.00594) (0.00588) (0.00242)
After*Ratio -0.0824* -0.114*** -0.00251 -0.0827* -0.114*** -0.00295(0.0436) (0.0429) (0.0214) (0.0438) (0.0429) (0.0216)
Observations 1,497,472 1,497,472 1,497,472 1,497,472 1,497,472 1,497,472R-squared 0.335 0.301 0.282 0.334 0.300 0.282CITY, YEAR, IPC2 FE YES YES YES YES YES YESIPC2*YEAR YES YES YES YES YES YESCITY*YEAR YES YES YES YES YES YESHSRCITY*IPC2*YEAR YES YES YES YES YES YES
Notes:1. This table reports the results on the relevance of university research activities on spillovers of transferred technology. Ratio isthe ratio between university patents and total patents within HSR-related technology classes in the city prior to 2004, which takes zero ifthere are no university patents in related fields by 2004. HSRCity is an indicator on whether or not the city is a HSR-technology receivingcity. Tech is an indicator on whether or not the patents belong to HSR-related IPC 4-digit technology classes. After is a dummy thatswitches on for all years after 2004. The last three columns report results on a sample that excludes the patents applied by CSR/CNRsubsidiaries and certified suppliers. Robust clustered standard error at the city level.
59

Table A.6: Major technology transfer contract details
ModeTechnologyprovider
CSR/CNRreceiver
TypeTechnology transferfee (billion RMB)
No. of trainsTotal contractvalue (billion RMB)
Source
CRH1 Bombadier Qingdao Sifang Joint venture 0 40 5.2 Bombadier website 1CRH2 Kawasaki Qingdao Sifang Technology transfer 0.6 60 9.3 Kawasaki website 2CHR3 Siemens Tangshan Technology transfer 0.8 60 13 Railway yearbookCHR5 Alstom Changchun Technology transfer 0.9 60 4.7 Alstom website 3
Notes:1. ”High speed Train CRH1 – China”, 10/2004, http://www.bombardier.com/en/transportation/projects/project.
emu-china.html?f-region=all&f-country=all&f-segment=all&f-name=SPACIUM
2. ”Kawasaki Wins High-Speed Train Order for China”, 20/10/2004, http://www.khi.co.jp/en/corp/newsroom/news/detail/
ba041020.html
3. ”From Savigliano to Changchun: The First EMU Train to China is on its way”, 14/12/2006, http://www.alstom.com/press-centre/2006/12/From-Savigliano-to-Changchun-The-First-EMU-Train-to-China-is-on-its-way-20061214/
4. Information on technology transfer fee is collected by Caixin reporters featured in Caixin cover story in July 12, 2012 (Volume 26).
60
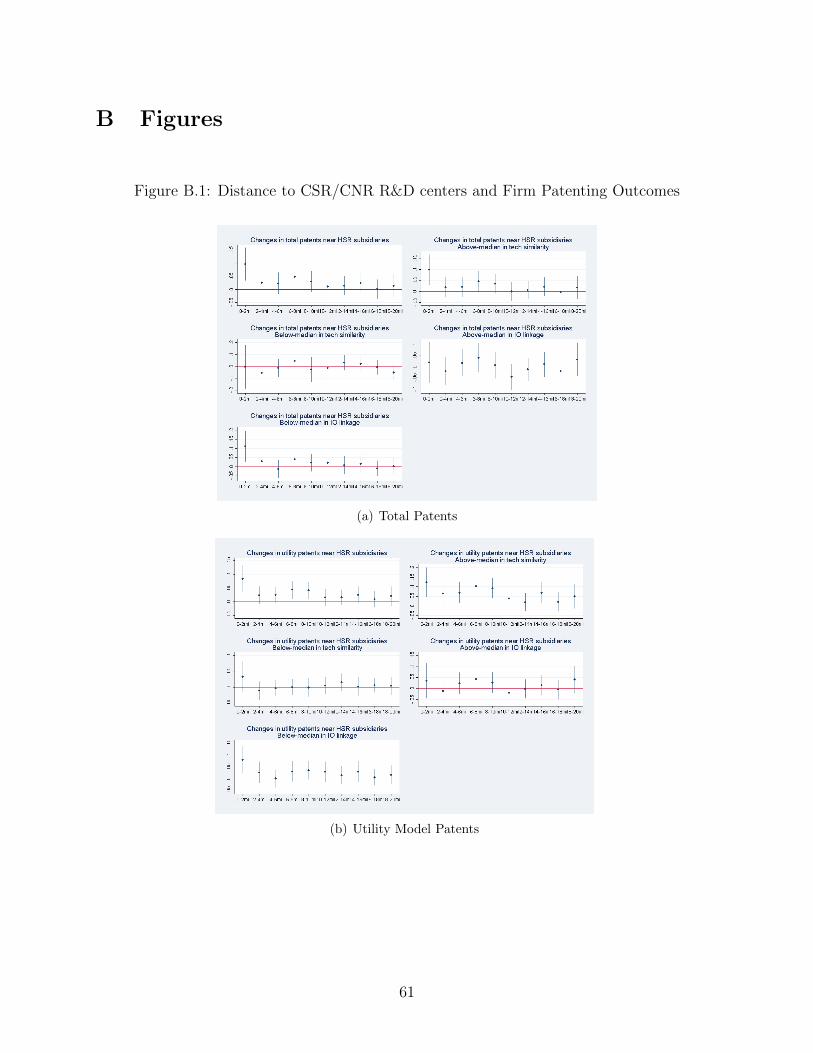
B Figures
Figure B.1: Distance to CSR/CNR R&D centers and Firm Patenting Outcomes
(a) Total Patents
(b) Utility Model Patents
61

Figure B.1: Distance to CSR/CNR R&D centers and Firm Patenting Outcomes
(c) Inventions
Notes: 1. This figure visualizes the βd coefficients in Equation (2). The regression tables areavailable upon request. 2. The coefficients are presented in dots, with their 95% confidence intervals.
62

Figure B.2: Distance to CSR/CNR R&D centers and Firm Performance
(a) Revenue
(b) Total Factor Productivity
63
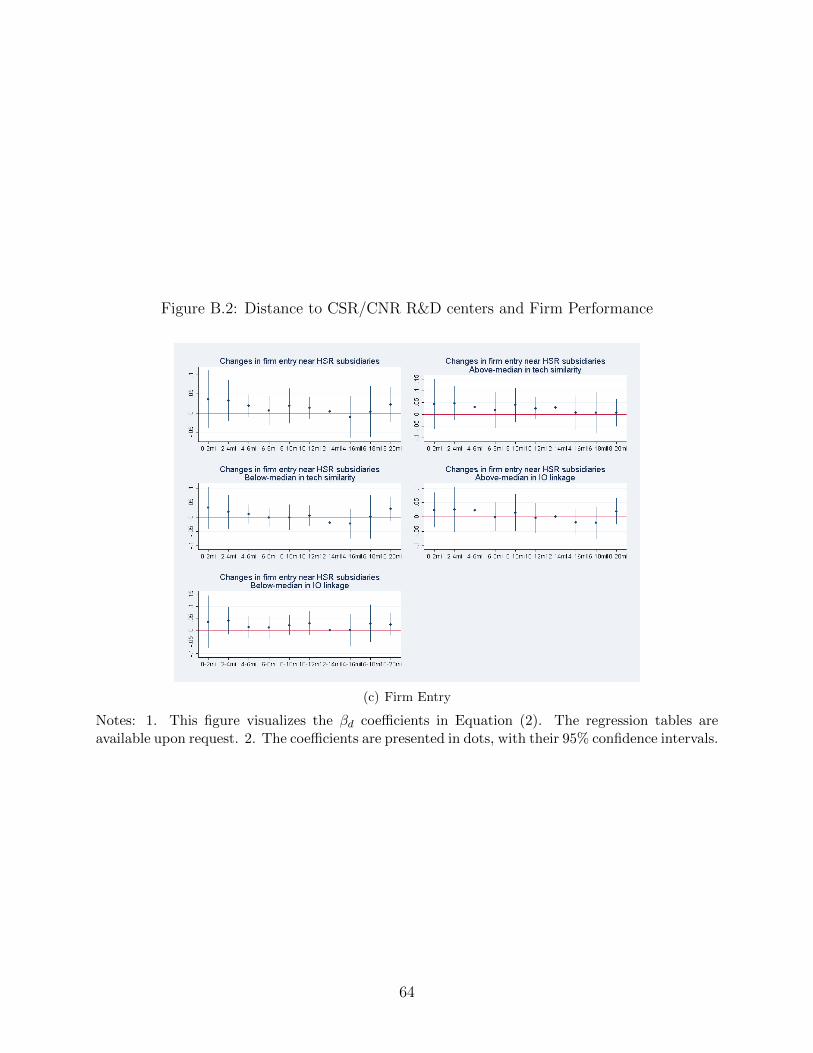
Figure B.2: Distance to CSR/CNR R&D centers and Firm Performance
(c) Firm Entry
Notes: 1. This figure visualizes the βd coefficients in Equation (2). The regression tables areavailable upon request. 2. The coefficients are presented in dots, with their 95% confidence intervals.
64