technology & operational management
TRANSCRIPT
Technology & Operation Management | sarojpandey.com.np 1
TECHNOLOGYAND
OPERATIONAL MANAGEMENTPurbanchal University: BCA IV Semester
S@R0Z

Technology & Operation Management | sarojpandey.com.np 2
TECHNOLOGY AND OPERATIONAL MANAGEMENT
BCA 256MS
Year: II Semester: IITeaching scheduleHours/Week
Examination SchemeTheory Tutorial Practical Internal Assessment Final Total3 1 2 Theory Practical * Theory ** Practical 10020 - 80 -* Continuous** Duration: 3 HrsObjective:The basic objective of this course is to provide students with the fundamental Knowledgeof Technology and operation function of an organization.
1. Nature and Concept of Operation Management:
What is operation management Difference and similarities between manufacturing and services. Operation management and organization A case study of successful Japanese owned facilities in United States.
2. Operation Strategy
Corporate strategy Market analysis Competitive priorities Flow strategy Flow strategy and competitive priorities Breakeven analysis Preference matrix
Technology & Operation Management | sarojpandey.com.np 3
3. Process Management
Major process decision: Process choice, Vertical integration, resource flexibility, capitalintensity Relationship between decisions
4. Management of Technology
Meaning and Role of Technology Information Technology
5. Total Quality Management
Quality as a management philosophy Employee involvement Continuous improvement The cost of poor quality Improving quality through TQM A case study of Cranston Nissan
6. Capacity
Measures of capacity7. Location
Factor affecting location decisions8. Layout
Layout types9. Forecasting
Concepts Judgment methods
Technology & Operation Management | sarojpandey.com.np 4
Casual method: Linear regression Time series methods.
10. Material requirement planning
Inputs to material requirement planning Planning factors Outputs from material requirement planning
11. Just in time system
Characteristic of just in time system The KANBAN systemTest Books1. Krajewski, Ritzman, Operation Management, Strategy and Analysis, Addison- WesleyPublishing CompanyReference Books1. Elwood, S. Buffa, Rakesh Sarin, Modern Production/ Operation Management, John Wileyand Sons2. James B. Dilworth, Production and Operations Management. McGraw Hill PublishingCompany3. Everett E. Adam Jr., Ronald J. Fbert, Production and Operation Management, Prentice –Hall of India Pvt. Ltd.
Technology & Operation Management | sarojpandey.com.np 5
Chapter 1: Nature and Concept of Operation Management
Operation Management
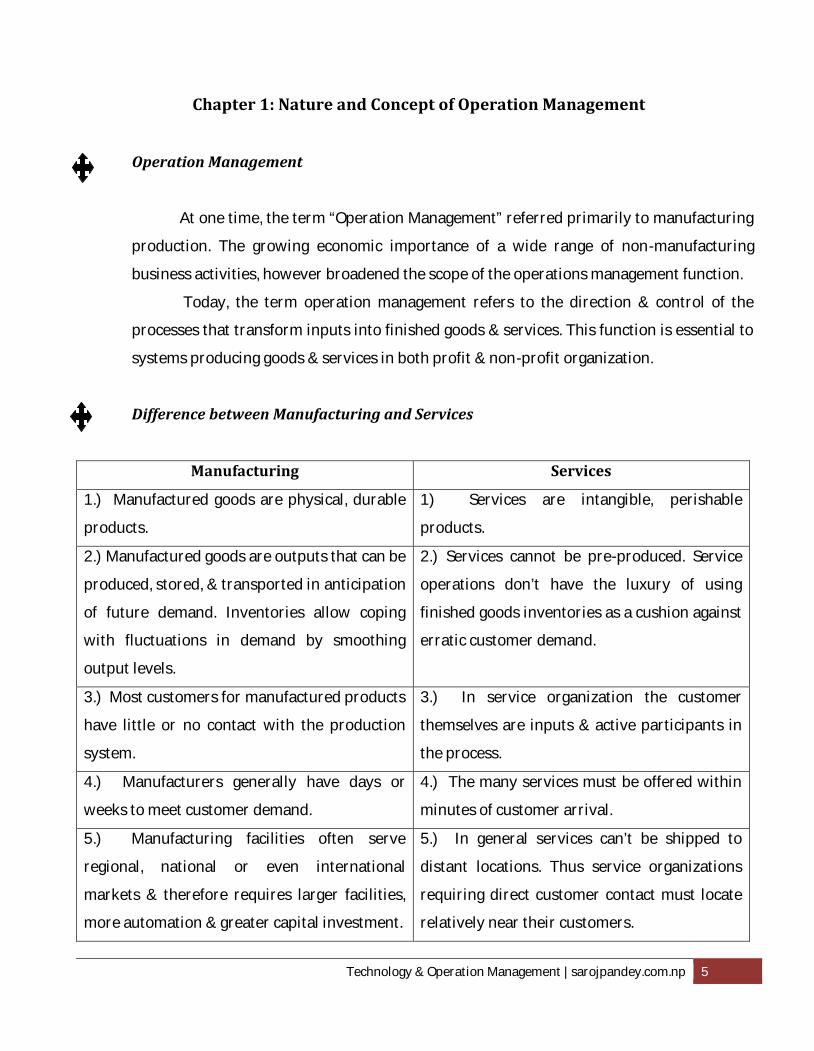
At one time, the term “Operation Management” referred primarily to manufacturingproduction. The growing economic importance of a wide range of non-manufacturingbusiness activities, however broadened the scope of the operations management function.Today, the term operation management refers to the direction & control of theprocesses that transform inputs into finished goods & services. This function is essential tosystems producing goods & services in both profit & non-profit organization.Difference between Manufacturing and Services
Manufacturing Services1.) Manufactured goods are physical, durableproducts. 1) Services are intangible, perishableproducts.2.) Manufactured goods are outputs that can beproduced, stored, & transported in anticipationof future demand. Inventories allow copingwith fluctuations in demand by smoothingoutput levels.
2.) Services cannot be pre-produced. Serviceoperations don’t have the luxury of usingfinished goods inventories as a cushion againsterratic customer demand.3.) Most customers for manufactured productshave little or no contact with the productionsystem.
3.) In service organization the customerthemselves are inputs & active participants inthe process.4.) Manufacturers generally have days orweeks to meet customer demand. 4.) The many services must be offered withinminutes of customer arrival.5.) Manufacturing facilities often serveregional, national or even internationalmarkets & therefore requires larger facilities,more automation & greater capital investment.5.) In general services can’t be shipped todistant locations. Thus service organizationsrequiring direct customer contact must locaterelatively near their customers.
Technology & Operation Management | sarojpandey.com.np 6
6.) As manufacturing systems tends to havetangible products & less customer contact,quality is relatively easy to measure.6.) The quality of service systems, whichgenerally produce intangibles, is harder tomeasure. Moreover individual preferencesaffect assessments of services quality makingobjective measurements is difficult.
Similarities between Manufacturing & ServicesDespite of distinctions, the similarities between manufacturing & service operationsare compelling. Every organization is concerned about quality, productivity & the timelyresponse to customers. A service provider like a manufacturer must make choices aboutthe capacity, location & layout of its facilities.The similarities between manufacturing & services are listed below:
Manufacturers do not just offer products, & service organization does not just offerservices. Both types of organization normally provide a package of goods & services.Manufacturing firms offer many customer services, & a decreasing proportion of thevalue added by them directly involves the transportation of materials.Despite the fact that service providers can’t inventory their outputs, they mustinventory the inputs for their products. These inputs must undergo furthertransformations during provision of the services. Hospital, for example, must maintainan adequate supply of medications. Manufacturing firms that make customizedproducts or limited-shelf-line products can’t inventory their outputs.As for customer contact, many service operations have little outside customer contact,such as the back-room operations of a bank or the luggage handling area at an airport.However, everyone in an organization has some customers-outside customers or insidecustomers, whether in service or in manufacturing,Clearly, operations management is relatively to both manufacturing and serviceoperations.
Technology & Operation Management | sarojpandey.com.np 7
Operation Management and Organization
Operation Management as an Inter-functional Imperative:Operations managers need to build & maintain solid relationship both inter-organizationally & intra-organizationally. Too often managers allow artificial barriers tobe erected between functional areas & departments. In these situations jobs or tasksmove sequentially from marketing to engineering to operations. This result is oftenslow or poor decision making because each department bases its decisions solely on itsown limited perspective, not the organization’s overall perspective.A new approach being tried by many organizations is to replace sequential decisionsmaking with the cross-functional co-ordination & flatter organizational structure.Cross-functional Co-ordinationCross-functional co-ordination is essential to effective operationsmanagement. The strongest connection is with the marketing function, whichdetermines the need for new products & services & the demand for existing ones.Operations Manager must bring together human & capital resources to handledemand effectively. Marketing & sales makes delivery promises to customers, whichmust be related to current operations capabilities. Marketing’s demand forecastsguide the operations manager in planning output rates & capabilities.The operations manager also needs feedback from the accounting function tounderstand current performance. Accounting can help the operations managermonitor the production system’s vital signs by developing multiple trackingmethods.The engineering function also can have a big impact on operations. Inbeginning new products, engineering needs to consider technical trade offs. It mustensure that product designs do not create costly specifications or exceed operationscapabilities.
Technology & Operation Management | sarojpandey.com.np 8
Achieving Cross-functional Co-ordinationSeveral approaches may be used to achieve cross-functional co-ordination. Eachorganization should select some blend of them to get everyone pulling in the somedirection. A unified strategy should be developed as a starting point, giving eachdepartment a vision of what it must do to help to fulfill the overallorganizational strategy. The organizational structure & management hierarchy can be re-designed to promote cross-functional co-ordination. The goal setting process & reward systems can encourage cross-functional co-ordination. So, can bringing people or committees tomake decisions & solve problems. Improvements to information systems also can boost co-ordination.Sharing information helps harmonize the efforts of managers fromdifferent parts of the organization & enables them to make decisionsconsistent with organizational goals. Informal social systems are another device that can be used toencourage better understanding across functional lines. Employee selection & promotion also can help foster more cross-functional co-ordination by encouraging broad perspectives &common goals.
Operations Management as a Competitive WeaponBusiness & government leaders increasingly are recognizing the importance ofinvolving the whole organization in making strategic decisions in order to completeglobally. Because the organization usually commits the bulk of its human & financial assetsto operations, operations is an important function in meeting global competition.Largely, because of foreign competition & the explosion of new technologies,recognition is growing that a firm completes not only by offering new products & services,creative marketing, & skillful finance, but also with unique competencies in operations. Theorganization that offers superior products & services at lower prices is a formidable.
Technology & Operation Management | sarojpandey.com.np 9
Chapter 2: Operation Strategy
Operation strategy specifies how operations can help implement the firm’s corporate strategy.Basically, operation strategy links long & short term operates decisions to corporate strategy. Continuouscross-functional interaction must occur in implementing operation strategy or any other functionalstrategy.Corporate StrategyCorporate Strategy defines the business that the company will pursue, new opportunities &threats in the environment & the growth objectives that it should achieve. Corporate Strategy provides anoverall direction that serves as the framework for carrying out all the organization’s functions.
Strategic Choices:Corporate Strategy defines the direction of the organization over the long term &determines the goals that must be achieved for the firm to be successful. Management sets corporatestrategy by making three strategic choices: determining the firm’s mission, monitoring & adjusting tochanges in the environment & identifying & developing the firm’s core competencies.
Contd. …

Technology & Operation Management | sarojpandey.com.np 10
MissionA firm’s mission statement answers several fundamentals questions: What business are we in ? Who are our customers ( or clients ) ? What are our basic beliefs ? What are the key performance, objectives, such as profits, growth, ormarket-share, by which we measure success ?An understanding of the firm’s mission helps managers generate ideas &design new producers & services. If its mission is too broadly defined, thefirm could enter areas in which it has no expertise. If the mission is toonarrowly defined, the firm could miss promising growth opportunities.
Market analysis Segmentation Needs assessments
Socioeconomic and
business
environment
Corporate Strategy Missions Goals Distinctive competencies
Future directions Global
strategy New products/
services
Competitivepriorities
Operations Marketing Cost Quality finance Time Flexibility others
Capabilities Current Needed Plans
Functional area strategies Finance Marketing Operations Others
Fig: Link between Corporate Strategy & Functional Strategies

Technology & Operation Management | sarojpandey.com.np 11
EnvironmentThe external business environment in which a firm competes changes continually &an organization needs to adapt to those changes. Adaptation begins with environmentalscanning, the process by which managers monitor trends within the socioeconomicenvironment, including the industry, the marketplace, and the society, for potentialopportunities or threats. A crucial reason for environmental scanning is to stay ahead of thecompetition. Important environmental concerns include economic trends, technologicalchanges, political conditions, social changes (such as attitudes towards work), theavailability of vital resources, & the collective power of customers & suppliers.Core competenciesCore competencies are an organization’s unique resources & strengths thatmanagement considers when formulating strategy. They reflect the collective learning ofthe organization, especially in how to co-ordinate diverse processes & integrate multipletechnologies. These competencies include the following:
Work force :- A well-trained & flexible work-force is anadvantage that allows organizations to respond to marketneeds in a timely fashion. Facilities :- Having well-located facilities – offices, stores andplants – is a primary advantage because of the long lead timeneeded to build new ones. Expansion into new products orservices may be accomplished quickly. Market & Financial know-how :- An organization that caneasily attract capital from stock sales, market & distribute itsproducts, or differentiate its products from similar productson the market has a competitive edge. System & Technology :- Organizations within expertise ininformation systems will have an edge in industries that aredata & information intensive, such as banking. Having thepatents on a new technology is also a big advantage.

Technology & Operation Management | sarojpandey.com.np 12
Global StrategiesA global strategy may include buying foreign parts or services, combatingthreats from foreign competitors, or planning ways to enter markets beyond traditionalnational boundaries. One way for a firm to open foreign markets is to create a strategicalliance. A strategic alliance is an agreement with another firm that may take the form of a: Collaborative effort,
Joint venture, or
Licensing of technology
A collaborative effort often arises when one firm has core competencies that another needs but is unwilling (or unable ) to duplicate. The two companies agree to worktogether to the mutual benefit of both.In a joint venture two firms agree to jointly produce a product or service. Thisapproach often is used by firms to gain access to foreign markets.Licensing technology is a form of strategic alliance in which one company licensesits production or service methods to another firm. Licenses may be used to gain access toforeign markets.Another way to enter in the foreign market is to locate operations in foreigncountry. However, manager must recognize that what work well in their home countrymight not work well elsewhere.Market AnalysisOne key to success in formulating a customer-driven operations strategy for both manufacturing &service firms understands what the customer wants & how to provide it better than the competitiondoes. Market analysis first divides the firm’s customers into market segments & then identifies theneeds of each segment.
Market segmentationMarket Segmentation is a process of identifying groups of customers with enough incommon to warrant the design & provision of products or services that the larger groupswants & needs. In general, to identify market segment the analyst must determine thecharacteristics that clearly differentiate each segment. A sound marketing program can thenbe devised & an effective operating system developed to support the marketing plan.

Technology & Operation Management | sarojpandey.com.np 13
Once the firm has identified the market segment, it can incorporate the needs ofcustomers into the design of the product or service & the operations system for itsproduction. The following characteristics are among those that can be used to determinemarket segments: Demographic factors :- Age, income, educational level, occupation, 7location are example of facts that differentiate the markets. Psychological factors :- Factors such as pleasure, fear, innovativeness, &boredom can serve to segment to markets. Industry factors :- Customers may utilize specific technologies (e.g.electronics, or microwave telecommunications ), use certain materials ( e.g.rubber, oil, or wood ), or participate in a particular industry (e.g. banking,health-care, or automotive ). These factors are used for marketsegmentation when the firm’s customers use its goods or services toproduce other goods or services for sale.
Needs AssessmentsThe second step in Market Analysis is to make a need assessment, whichidentifies the needs of each segment & assesses how well competitors are addressing thoseneeds. The needs assessment should include both the tangible & the intangible productattributes & features a customer desires.Each market segment has market needs that can be related toproduct/service, process, or demand attributes. Markets needs may be grouped as follows: Product/Service needs :- Attributes of the product or service, such asprice, quality, & degree of customization desired. Delivery system needs:- Attributes of the process & the supportingsystems & resources needed to deliver the product or service, suchas availability, convenience, courtesy, safety, delivery speed, &delivery dependability. Volume needs:- Attributes of the demand for the product or service, suchas high or low volume, degree of variability in volume, & degree ofpredictability in volume.
Technology & Operation Management | sarojpandey.com.np 14
Other needs:- Other attributes not directly relating to operations, such asreputation & number of years in business, technical after sale support,accurate & reliable billing & accounting systems, ability to invest ininternational financial markets, competent legal services, &product/service design capability.Competitive Priorities
Market analysis identifies the market needs that a firm can exploit to gain competitiveadvantage in each market segment. Translating these needs into desirable capabilities for each ofthe functional areas of the firm is followed by developing the selected capabilities. There are eightpossible competitive priorities for operation, which fall into four groups:Cost 1) Low-cost operations.Quality 2) High-performance design.3) Consistent quality.Time 4) Fast delivery time.5) On-time delivery.6) Development speed.Flexibility 7) Customization.8) Volume flexibility.
CostLowering prices can increase demand for products or services, but it also reducesprofit margins if the product or service cannot be produced at lower cost. Often,lowering costs requires additional investment in automated facilities & equipmentQualityTwo competitive priorities deal with quality. The first, High-performance design,may include superior features, close tolerances, & greater durability, helpfulness,courteousness, & availability of service employees, convenience if access to servicelocations, & safety of products or services. High-performance design determines thelevel of operations performance required in making a product or performing aservice.
Technology & Operation Management | sarojpandey.com.np 15
The second quality priority, consistent quality, measures the frequency withwhich the product or service meets design specifications. Customers want productsor services that consistently meet the specifications they contracted for, have cometo expect, or saw advertised. A firm that doesn’t have consistent quality doesn’t lastlong in a competitive global marketplace.Time Three competitive priorities deal with time:
Fast delivery time:- is the elapsed time between receiving a customer’s order &filling it. Industrial buyers often call it lead-time. Manufacturers can shorten thedelivery times by storing inventory, manufacturers & service providers can doso having excess capacity. On-time delivery:- measures the frequency with which delivery-time promisesare met. Manufacturers measure on-time delivery as the percentage of customerorders shipped when promised. Development speed:- measures how quickly a new product or service isintroduced, covering the elapsed time from idea generation through final design& production. Development speed is important in the fashion apparel industry.Many companies focus on the competitive priorities of developmentspeed and fast delivery time with a time based competition managers carefullydefine the steps & time needed to deliver a product or services & then criticallyanalyze each step to determine whether time can be saved without hurting quality.
FlexibilitySome firms give top priority to two types of flexibility: Customization:- is the ability to satisfy the unique needs of each customerby changing product or service designs. However, products or servicestailored to individual preferences may not have long lives. Customizationtypically implies that the operating system must be flexible to handlespecific customer needs & changes in designs. Volume flexibility:- is the ability to accelerate or decelerate the rate ofproduction. Quickly to handle large fluctuations in demand. Volume
Technology & Operation Management | sarojpandey.com.np 16
flexibility is an important operating capability that often supports theachievement of other competitive priorities ( e.g. fast delivery times ).Flow StrategyFlow Strategy determines how the operations system is organized to handle the volume &variety of products or services for a specific market segment. With a flexible flow strategy thesystem is organized around the processes used to produce the product or service. With a line flowstrategy the system is organized around the product or service itself.
Flexible Flow StrategyFirms use a flexible flow strategy to produce a wide range of low-volume productsor services. Different types of machines or employees with different sets of skills aregrouped to handle all products or services requiring a specific function to be performed, &various products or services move from one process to another. Although the flexible flowstrategy enables the production of a wide variety of products or services with low volume, itcreates a jumbled flow through the facility. Machine shop that takes many small jobs utilizesa flexible flow strategy because each product can require a different sequence of resources.Line Flow StrategyIn line-flow strategy, equipment & employees are organized around the product orservice. A line flow strategy fits high-volume production of a few products or services, &lends itself to highly automated facilities. With a line-flow strategy, all products or customerfollow a linear pattern in the facility. The firms which follow the line flow strategy are fast-food restaurant, car washes, appliance manufactures etc.Strategies Based On FlowsFive fundamentals manufacturing & service strategies based on flows are made-to-
stock, standardized services, assemble-to-order, make-to-order, & customized
services.
Technology & Operation Management | sarojpandey.com.np 17
Make-to-Stock :- Manufacturing firms with line flows tends to use a make-to-stockstrategy, in which the firms hold items in stock for immediate delivery, therebyminimizing customer delivery times. This strategy is also applicable to situations inwhich the firm is producing a unique product for a specific customer if the volumesare high enough. The example of products produced with a make-to-stock strategyincludes garden tools, electronic components, soft drinks, & chemicals. Standardized Services Strategy:- Service firms with line flows tend to use astandardized services strategy, in which the firms provide services with little varietyin high volumes. This strategy in analogous to make-to-stock strategy ofmanufacturing firms. Assemble-to-Order Strategy:- In manufacturing, the assemble-to-order strategy isan approach to producing products with many options firm relatively few assembles& components, after customer orders are received. The assemble-to-order strategytypically addresses two competitive priorities, customization & fast delivery time.In services, the assemble-to-order strategy involves packaging a variety ofstandardization services for specific customer needs. Make-to-Order Strategy:- Manufacturers with flexible flows tends to use a make-to-strategy, whereby they make products to customer specification in low volumes.This strategy provides a high degree of customization, which is a major competitivepriority of these firms. Customization Services Strategy:- Service provides with flexible flows can utilize acustomized services strategy, whereby they provide highly individualized services,often in low volumes. Sometimes service providers utilize the customized services.Strategy in high-volume situations such is the case in large facilities that serviceelectronic equipment needing periodic maintenance or repair.
Flow Strategy & Competitive Priorities
Operations managers use flow strategy to translate product or service plans & competitivepriorities for each market segment the firm serves into decisions throughout the operationsfunctions that support those market segments.Contd. …

Technology & Operation Management | sarojpandey.com.np 18
Flow Strategy
Flexible Flows Line FlowsTendency for customized products andservices, with low volume. Tendency for standardized products andservices, with high volume.High performance design quality. Consistent quality.More emphasis on customization and volumeflexibility. More emphasis on low cost.Long delivery time. Short delivery time.
Break-Even Analysis
Break-even analysis helps the manager identify how mach change in volume or demand isnecessary before a second alternative becomes better than the first one. The break-even point isthe volume at which total revenues equal total costs. Use of this technique is known as break-evenanalysis. Break-even analysis can also be used to compare production methods by finding thevolume at which two different processes have equal total costs.Evaluating Products or ServicesThis technique helps the manager answer questions such as the following:
Is the predicted sales volume of the product or service sufficient to break-even ? How low must the variable cost per unit to be break even, based on currentprices & sales processes ?
Fig: - Linking flow strategy with competitive priorities
Technology & Operation Management | sarojpandey.com.np 19
How low must the fixed cost to be break-even ? How do price levels affect the break-even volume ?
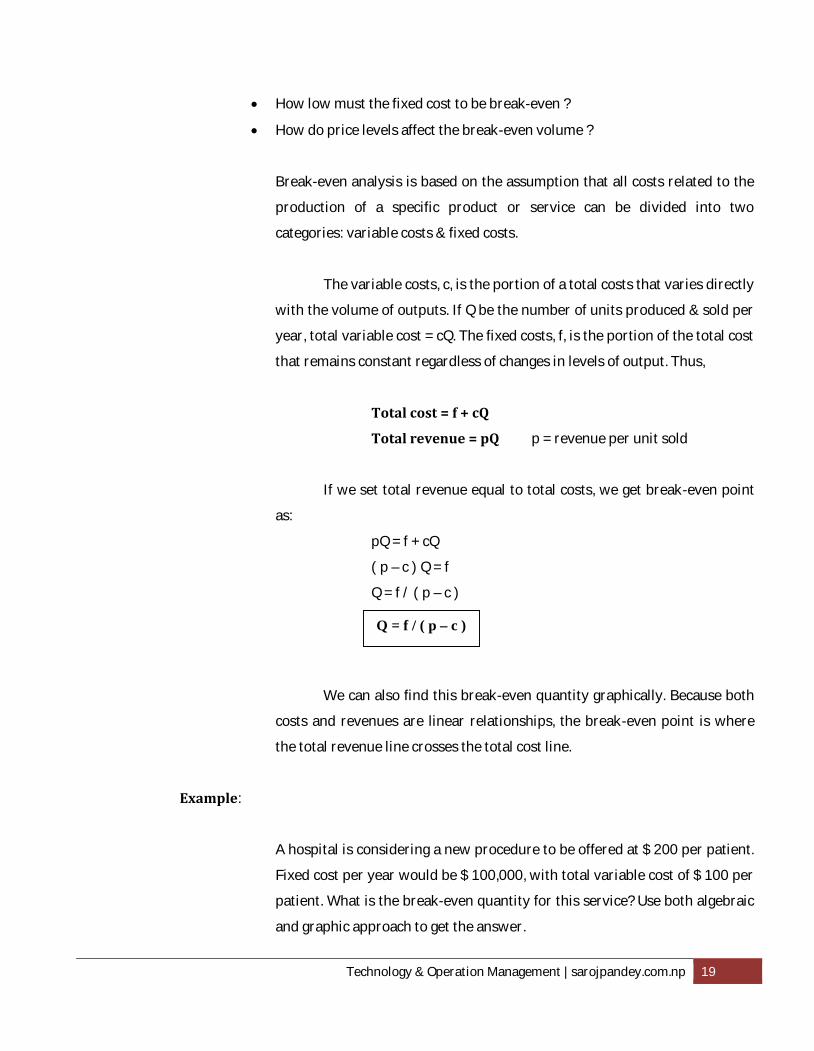
Break-even analysis is based on the assumption that all costs related to theproduction of a specific product or service can be divided into twocategories: variable costs & fixed costs.The variable costs, c, is the portion of a total costs that varies directlywith the volume of outputs. If Q be the number of units produced & sold peryear, total variable cost = cQ. The fixed costs, f, is the portion of the total costthat remains constant regardless of changes in levels of output. Thus,
Total cost = f + cQ
Total revenue = pQ p = revenue per unit soldIf we set total revenue equal to total costs, we get break-even pointas: pQ = f + cQ( p – c ) Q = fQ = f / ( p – c )
We can also find this break-even quantity graphically. Because bothcosts and revenues are linear relationships, the break-even point is wherethe total revenue line crosses the total cost line.Example:
A hospital is considering a new procedure to be offered at $ 200 per patient.Fixed cost per year would be $ 100,000, with total variable cost of $ 100 perpatient. What is the break-even quantity for this service? Use both algebraicand graphic approach to get the answer.
Q = f / ( p – c )
Technology & Operation Management | sarojpandey.com.np 20
Solution:
Algebraic approach:
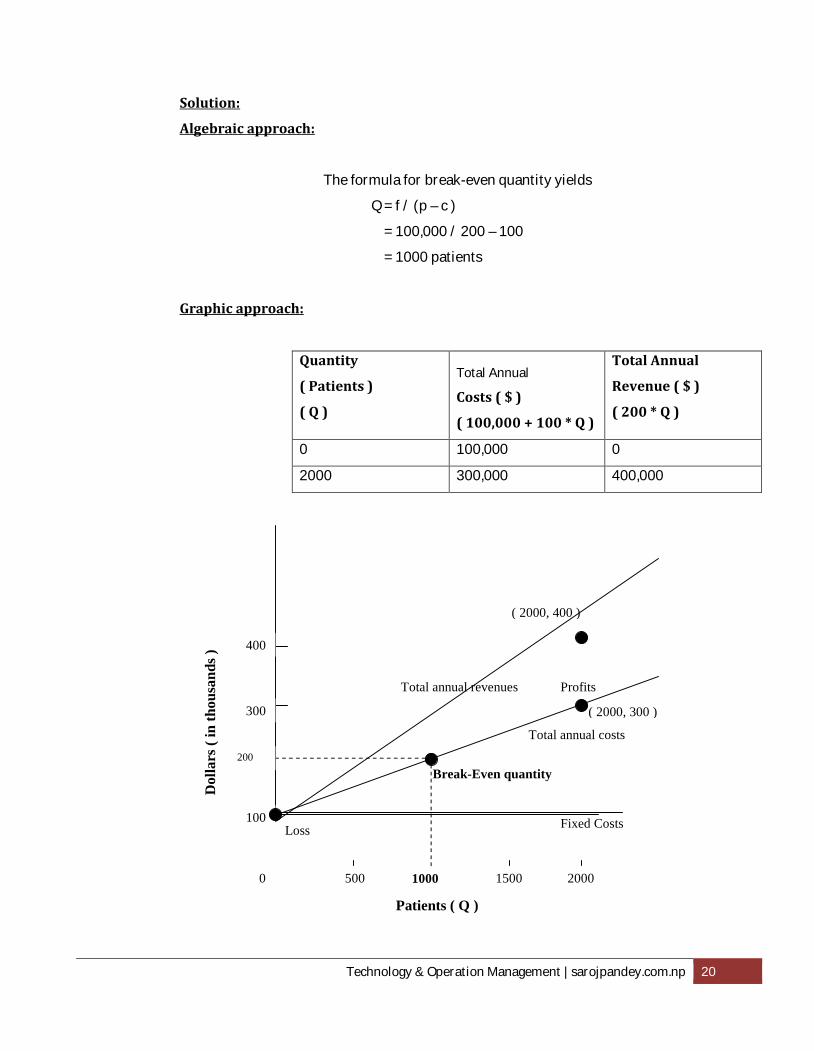
The formula for break-even quantity yieldsQ = f / (p – c )= 100,000 / 200 – 100= 1000 patientsGraphic approach:
Quantity
( Patients )
( Q )
Total AnnualCosts ( $ )
( 100,000 + 100 * Q )
Total Annual
Revenue ( $ )
( 200 * Q )0 100,000 02000 300,000 400,000
Total annual revenues
Dol
lars
( in
tho
usan
ds )
Loss
Profits
Total annual costs
Break-Even quantity
Fixed Costs
( 2000, 300 )
( 2000, 400 )
5000 1000 1500 2000
100
200
300
400
Patients ( Q )

Technology & Operation Management | sarojpandey.com.np 21
Break-even analysis can’t tell a manager whether to pursue a new product orservice idea to drop an existing line. The technique can only show what is likely to happenfor various forecasts of costs & sales volumes. To evaluate a variety of “ what if “ questions,we use an approach called sensitivity analysis, a technique for systematically changingparameters in a model to determine the effects of which changes.Preference Matrix
A preference matrix is a table that allows the manager to rate an alternative according toseveral performance criteria. The preference matrix helps a manager deal with multiple criteriathat cannot be evaluated with a single measure of merit, such as total profit or cost.Not all managers are comfortable with preference matrix technique. It requires themanager to state criteria weights before examining the alternatives, although the properweights may not be readily apparent.

Technology & Operation Management | sarojpandey.com.np 22
Example:- The following table shows the preference criteria, weights, & scores ( 1 = worst, 10 =best ) for a new product: a thermal storage air conditioner. If the management wants tointroduce just one new product & the highest total score of any of the other products ideasis 800, should the firm pursue making the air conditioner?Performance
Criterion
Weight
( A )
Score
( B )
Weighted Score
( A * B )Market potential 30 8 240Unit profit margin 20 10 200Operationscompatibility 10 6 120Competitive advantage 15 10 150Investment requirement 10 2 20Profit risk 5 4 20
Weighted Score =750Solution:-
Because the sum of the weighted scores is 750, it falls short of the score of 800 for anotherproduct. So management would not pursue the thermal storage air conditioner idea at thistime.
Technology & Operation Management | sarojpandey.com.np 23
Chapter 3: Process Management
What is Process Management?A process involves the use of an organization’s resources to provide something ofvalue. No product can be made and no service provided without a process, and noprocess can exist without a product or service.Process Management is the selection of the inputs operations, workflows, andmethods that transform inputs into outputs. Input Selection begins by deciding whichprocesses are to be done in-house and which processes are done outside and purchasedas materials and services. Process decisions also deal with the proper mix of human skillsand equipment and which parts of the process are to be performed by each.Process decisions must be made when:
A new or substantially modified product or service is being offered, Quality must be improved, Competitive priorities have changed, Demand for a product or service is changing, Current performance is inadequate, Competitors are gaining by using a new process or technology, or The cost or availability of inputs has changed.
Major Process DecisionsWhether dealing with processes for offices, service providers, or manufacturers,operations managers must consider five common process decisions. The common 5process decisions are listed below:Process ChoiceProcess Choice determines whether resources are organized aroundproducts or processes in order to implement flow strategy. The process choice

Technology & Operation Management | sarojpandey.com.np 24
decision depends on the volume and degree of customization to be provided. Themanager has five process types, which form a continuum, to choose from:Project ProcessA project process is characterized by a high degree of job customization,the large scope of each project, and the release of substantial resources oncea project is completed. A project process lies at the high-customization, low-volume end of the process-choice continuum. Although some projects maylook similar, each is unique. A project process is based on a flexible flowstrategy, with work flows redefined with each new project. E.g. building ashopping center, running a political campaign, developing a new technologyor product etc.Job ProcessA job process creates the flexibility needed to produce a variety of products orservices in significant quantities. Customization is relatively high and volume forany one product or service is low. A job process primarily involves the use of aflexible flow strategy, with resources organized around the process. E.g. machininga metal casting for a customized order, providing emergency room care, handlingspecial-delivery mail, or making customized cabinets.Batch ProcessA batch process differs from the job process with respect to volume, variety andquality. The primary difference is that volumes are higher because the same orsimilar products or services are provided repeatedly. Another difference is that anarrower range of products and services is provided. A third difference is thatproduction lots or customer groups are handled in larger quantities than they arewith job processes. A batch process implements an intermediate flow strategy. It hasaverage or moderate volumes, but variety is still to great to warrant dedicating

Technology & Operation Management | sarojpandey.com.np 25
substantial resources to each product or service. The flow pattern is jumbled, withno standard sequence of operations throughout the facility.Line ProcessA line process lies between the batch and continuous processes on thecontinuum, volumes are high, and products or services are standardized,which allows resources to be organized around a product or service.Manufacturers with line processes often follow a make-to-stock strategy,with standard products held in inventory so that they are ready whencustomer places an order. This use of a line process is sometimes called massproduction. A line process fits primarily with the line flow strategy, althoughit can overlap into the intermediate flow strategy. When mass customizationor assemble-to-order strategies are pursued. Products created by a lineprocess include automobiles, appliances, and toys.
Difference between Line Process and Job Process:
Line Process Job Process1.) Customization is low. 1.) Customization is high.2.) Little variety of products. 2.) More variety of products.3.) Line flow strategy is also calledmake to stock strategy. 3.) Flexible flow strategy.E.g. Cement plant, TV assemblingplant etc. 4.) E.g. Machine shop, Emergencyunits in the hospital etc.Continuous ProcessA continuous process is the extreme end of high volume, standardizedproduction with rigid line flows. The process often is capital intensive andoperated round the clock to maximize utilization and to avoid expensiveshutdowns and start-ups. Continuous processes are used almost exclusively

Technology & Operation Management | sarojpandey.com.np 26
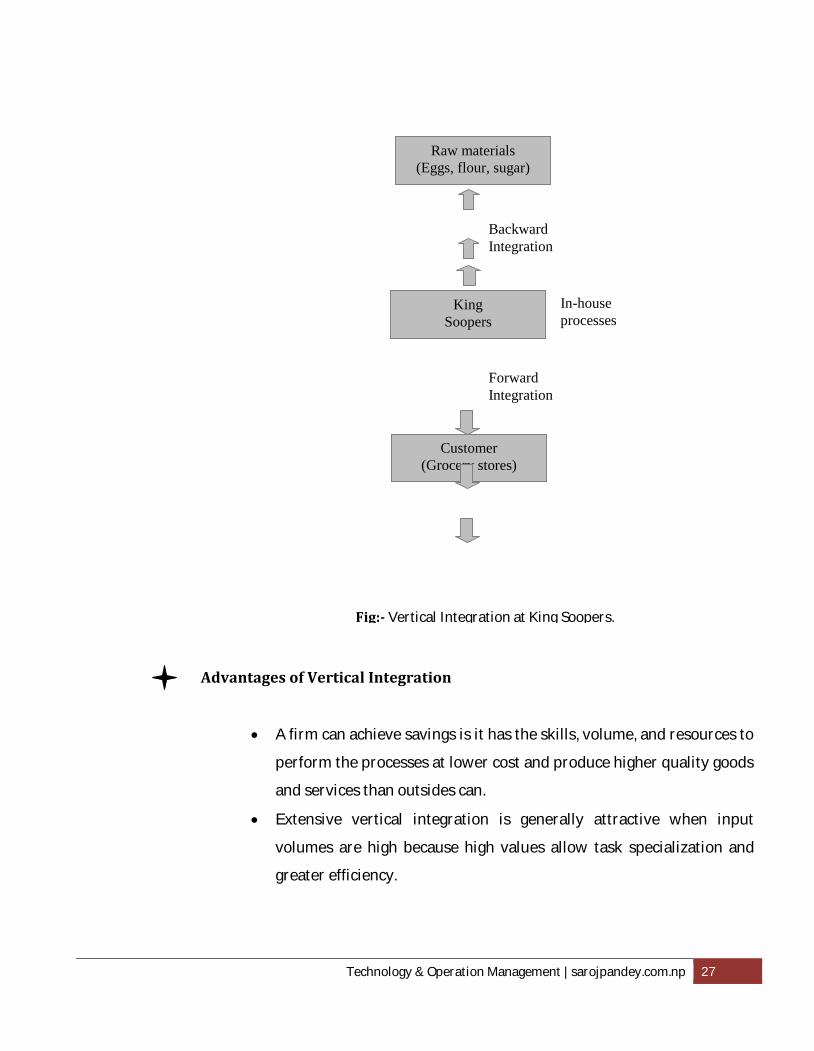
in manufacturing and fit perfectly a line flow strategy. E.g. petroleumrefineries, chemical plant etc.Vertical IntegrationVertical Integration is a degree to which a firm own production system orservice facility handles the entire supply chain. Management decides the level ofvertical integration by looking at all the activities performed by betweenacquisition of raw materials or outside services and delivery of finished productsor services. The more processes in the supply chain that the organization performsitself, the more vertically integrated it is. Vertical Integration can be in twodirections.
Backward IntegrationBackward Integration represents movement upstream towardssources of raw materials and parts, such as a major grocery chain having itsown plants to produce house brands of ice cream, peanut butter etc.Forward IntegrationForward Integration means that the firm acquires more channels ofdistribution, such as its own distribution centers (warehouses) and retailstores. It can also mean that the firm goes even further, acquiring itsindustrial customers.
Contd. …
Technology & Operation Management | sarojpandey.com.np 27
Advantages of Vertical Integration
A firm can achieve savings is it has the skills, volume, and resources toperform the processes at lower cost and produce higher quality goodsand services than outsides can. Extensive vertical integration is generally attractive when inputvolumes are high because high values allow task specialization andgreater efficiency.
Raw materials(Eggs, flour, sugar)
KingSoopers
Customer(Grocery stores)
BackwardIntegration
ForwardIntegration
In-houseprocesses
Fig:- Vertical Integration at King Soopers.

Technology & Operation Management | sarojpandey.com.np 28
It is also attractive if the firm has the relevant skills and views theprocesses into which it is integrity as particularly important to itsfuture success.Resource FlexibilityResource Flexibility is the case with which employees and equipment canhandle a wide variety of products, output levels, duties, and functions. The choicethat management makes concerning competitive priorities determine the degree offlexibility required a company’s resources- its employees, facilities and equipment.
Work ForceOperations manager must decide whether to have a flexible workforce. Members of a flexible work force are capable of doing many tasks,either at their own workstations or as they move one workstation to another.The type of work force required depends on the need for volume flexibility.When conditions allows for a smooth, steady rate of outputs, the likely choiceis a permanent work force that expects regular full time employment. If theprocess is subject to hourly, daily, or seasonal peaks and valleys in demand,the use of part-time or temporary employees to supplement a smaller core offull-time employees may be the best solution. However, this approach maynot be practical if knowledge and skill requirements are too high for atemporary worker to group quickly.EquipmentWhen a firm’s product or service has a short life cycle and a high degree ofcustomization, low production volumes mean that a firm should selectflexible, general-purpose equipment.

Technology & Operation Management | sarojpandey.com.np 29
Customer InvolvementThe fourth significant process decision is the extent to which customersinteract with the process. Customer Involvement reflects the ways in whichcustomers become part of the production process and the extent to theirparticipation. The amount of customer involvement may range from self-service tocustomization of product to deciding the time and place that the service is to beprovided.Self ServiceSelf Service is the process decision of many retailers, particularly whenprice is a competitive priority. To save money, some customers prefer to do part ofthe process formerly performed by the manufacturer or dealer.Product SelectionA business that competes an customization frequently allowscustomers to come up with their own product specifications or even becomeinvolved in designing the product.Time and LocationWhen services can’t be provided in the customer’s absence, customersmay determine the time and location that the service is to be provided. If theservice is delivered to the customer, client, or patient by appointment,decisions involving the location become part of process design.
Capital IntensityCapital intensity is the mix of equipment and human skills in the process; thegreater the relative cost of equipment, the greater is the capital intensity. Addingcapital intensity can significantly increase productivity and improve quality. One bigdisadvantage of capital intensity can be the prohibitive investment cost for low-volume operations.

Technology & Operation Management | sarojpandey.com.np 30
Relationship between DecisionsEach of the 5 process decisions has an underlying relationship with volume. Highvolume occurs when demand for a product or service is heavy, when each unit made orserved requires significant work content, and when parts or tasks are standard andtherefore used often. The figure below shows how process choice and the other keyprocess decisions are tied to volume:
The vertical arrows reflect the link between volume and the process choice, and the horizontalarrow represents the subsequent link between process choice and the other process decisions.
VolumeHighLow
Flexible Flow
Proje
ct
proce
ss
Intermediateflow
Line flow
Job
proce
ssBatch
proce
ssLine
proce
ssConti
n-
uous
proce
ss
Low Volume Less vertical integration More resource flexibility More customer involvement Less capital intensity
High Volume More vertical integration Less resource flexibility Less customer involvement More capital intensity
Pro
cess
des
ign
choi
ces
Fig:- Volume and major process decisions
Technology & Operation Management | sarojpandey.com.np 31
High volumes typically mean:
A line or continuous process.
More vertical integration. High volumes create more opportunities forvertical integration. Less resource flexibility. When volumes are high, there is no need forflexibility to utilize resources effectively, and specialization can lead tomore efficient processes. Less customer involvement. At high volumes, firms cannot meet theunpredictable demands required by customized orders. More capital intensity. High volumes justify the large fixed costs of anefficient operation.
Low volumes typically mean:
A project or job process.
Less vertical integration. Low volumes eliminate most opportunitiesfor backward or forward vertical integration. More resource flexibility. When volumes are low, as in the custom cakeprocess, workers are trained to handle all types of customer requests. More customer involvement.
Less capital intensity. The custom cake line is very labor intensive andrequires little investment to equip the workers.
Technology & Operation Management | sarojpandey.com.np 32
Chapter 4: Management Technology
The meaning and Role of Technology
Technology is defined to be the know-how, physical things, and procedures used toproduce products and services. Know-how is the knowledge and judgment of how, whenand why to employ equipment and procedures. Physical things are the equipment andtools. Procedures are the rules and techniques for operating the equipment and performingthe work.Primary Areas of TechnologyWithin an organization, technologies reflect what people are working on and whatthey are using to do that work. The most widespread view of technology is that of producttechnology, process technology, and information technology. Operations managers areinterested in all three aspects of technologies.
Product technology is important because the production system must be designed toproduce products and services. Process technology is important because it can improve themethods currently used in production system. Information technology is important becauseit can improve how information is used to operate the production system.Product technologyDeveloped within the organization, product technology translates ideas intonew products and services for the firm’s customers. Primarily engineers andresearchers develop product technology. Developing new product technologiesrequires close co-operation with marketing, to find out what customers really want,and with operations to determine how the goods or services can be producedeffectively.

Technology & Operation Management | sarojpandey.com.np 33
Process TechnologyThe methods by which an organization does the things rely on theapplication of process technology. Some of the large number of processtechnologies used by an organization is unique to a functional area; others are usedmore universally.Information TechnologyManagers use information technology to acquire, process, and transmitinformation so that they can make more effective decisions. Information technologypervades every functional area in the workplace. Nowhere is it more revolutionarythan in offices, be they main offices, branch offices, back offices, front offices, salesoffices, or functional area offices.
Information Technology
Information technology is crucial to operations everywhere along the supplychain and to every functional area. Computer-based information technology, inparticular, has greatly influenced how operations are managed and how officeswork.Components of Information TechnologyInformation technology is made up of four sub-technologies:
Hardware Software Database, and Telecommunications
Hardware: A computer and the devices connected to it, which can include Intel’ssemiconductor or Pixel Version’s flat-panel computer monitors, are called

Technology & Operation Management | sarojpandey.com.np 34
hardware. Scientists and engineers at computer and telecommunicationscompanies and academies are the primary sources of these advances.Software: The computer programs written to make the hardware work and tocarry out different application tasks are called software. Software is essential tomany manufacturing capabilities, such as computer-aided design andmanufacturing, robots, automated materials handling etc. Software also providesvarious executive support systems, including management information systemand decision support systems.
Databases: A database is a collection of interrelated data or information storedon a data storage device such as a computer hard drive, a floppy disk, or tape. Adatabase can be a firm’s inventory records, time standards for different kinds ofprocesses, customer demand information.Telecommunications: The final component of information technology, whichmany believe might be the most important, is telecommunications. Fiber optics,telephones, modems, are their related components make electronic networkspossible. Such networks, and the use of compatible software, allow computerusers at one location to communicate directly with computer users at anotherlocation and can pay big dividends.
Technology & Operation Management | sarojpandey.com.np 35
Chapter 5: Total Quality Management
Total quality management (TQM) stresses three principles: customer satisfaction,employee involvement, and continuous improvements in quality. TQM also involvesbenchmarking, product and service design, process design, purchasing, and problemsolving toolsQuality: A Management PhilosophyThe global economy of the 1990’s and beyond dictates that companies provide thecustomer with an ever-widening array of products and services having high levels ofquality.The two competitive priorities that deal with quality are: high-performance design andconsistent quality. These priorities characterize an organization’s competitive thrusts.Strategic plans that recognize quality as an essential competitive priority must be based onsome operational definition of quality. Some various definitions of quality are:Customer-Driven Definition of QualityCustomers define quality in various ways. In general sense, quality may be defined asmeeting or exceeding the expectations of the customer. For practical purposes, it isnecessary to be more specific. Quality has multiple dimensions in the mind of the customer,and one or more of the following definitions may apply at any one time. Conformance to Specifications:- Customers expect the products or services they buyto meet or exceed certain advertised levels of performance. In service systems also,conformance to specifications is important, even though tangible outputs are notproduced. Specifications for a service operation may relate to on-time delivery orresponse time. Value:- Another way customers define quality is through value, or how well theproduct or service serves its intended purpose at a price customers are willing to pay.

Technology & Operation Management | sarojpandey.com.np 36
Fitness for Use:- In assessing fitness for use, or how well the product or serviceperforms its intended purpose, the customer may consider the mechanical features ofa product or the convenience of a service. Other aspects of fitness for use includeappearance, style, durability, reliability, and serviceability. Support:- Often the product or service support provided by the company is asimportant to customers as the quality of the product or service itself. Customers getupset with a company if financial statements are incorrect, responses to warrantyclaims are delayed, or advertising is misleading. Psychological Impressions:- People often evaluate the quality of a product or serviceon the basis of psychological impressions: atmosphere, image, or aesthetics. In theprovision of services, where the customer is in close contact with the provider theappearance and actions of the provider are very important.
Quality as a Competitive WeaponAttaining quality in all areas of business is a difficult task. To make the things more difficult,consumers change their perceptions of quality. For instance, changes in life-style and economicconditions have drastically altered consumer perceptions of automobile quality.In general, a business’s success depends on the accuracy of its perceptions of consumerexpectations and its ability to bridge the gap between those expectations and operatingcapabilities. Moreover, perception plays as important a role as performance: A product orservice that is perceived by customers to be of higher quality stands a much better chance ofgaining market share than does one perceived to be of low quality, even if the actual levels ofquality are the same. Good quality can also pay off in higher than comparable lower qualityones and yield a greater return for the same sales dollar.
Technology & Operation Management | sarojpandey.com.np 37
Employee InvolvementOne of the important elements of TQM is employee involvement. A complete program inemployee involvement includes changing organizational culture, forecasting individualdevelopment through training, establishing awards and incentives, and encouragingteamwork. The three aspects of employee involvement in quality programs are:Cultural ChangeThe challenge of quality management is to instill an awareness of the importance of qualityin all employees and to motivate them to improve product quality. TQM involves all thefunctions that relate to a product or service. One of the main challenges in developing theproper culture for TQM is to define customer for each employee. In general, customers areinternal and external. External customers are the people or firms who buy the product orservice. In this sense the entire firm is a single unit that must do its best to satisfy externalcustomers. Internal customers are employees in the firms who rely on the output of otheremployees. For example, a machinist who drills holes in a component and passes it on to awelder has the welder as her customer. All employees must do a good job of serving theirinternal customer if external customers ultimately are to be satisfied.
In TQM, everyone in the organization must share the view that quality control is an end initself. Errors or defects should be caught and corrected at the source, not passed along to aninternal customer. This philosophy is called quality at the source. However, in TQM, qualityconsistency has a higher priority than the level of output.Individual DevelopmentOn-the-job training programs can help improve quality. Teaching new work methods toexperienced workers or training new employees in current practices can increase theproductivity and reduce the number of product defects. Managers too need to develop newskills- not only those directly relating to their own duties, but also those needed to teach theirsubordinates. Many companies are putting their managers through “train-the-trainer”programs that give managers the skills to train others in quality improvement practices.
Technology & Operation Management | sarojpandey.com.np 38
Awards and IncentivesThe prospective of merit pay and bonuses can give employees some incentive forimproving quality. Companies may tie monetary incentives directly to quality improvements.Non-monetary awards, such as recognition in front of co-workers, also can motivate qualityimprovements. Each month some companies select an employee who has demonstratedquality workmanship and give that person special recognition, such as a privileged parkingspot, a dinner at a fine restaurant, or a plaque. Typically the event is reported in the companynewsletter.Continuous Improvement
Continuous improvement, based on a Japanese concept called kaizen, is the philosophy ofcontinually seeking ways to improve operations. Continuous improvement involves identifyingbenchmarks of excellent practice and instilling a sense of employee ownership in the process.The focus can be on reducing the length of time required to process requests for loans at abank, the amount of scrap generated at a milling machine, or the number of employee injuriesat a construction site. Continuous improvement also can focus on problems with customers orsuppliers, such as customer who request frequent changes in shipping quantities and suppliersthat fail to maintain high quality.Getting Started with Continuous ImprovementInstilling a philosophy of continuous improvement in an organization may be a lengthyprocess, and several steps are essential to its eventual success.
Train employees in the methods of statistical process control (SPC) and other tools forimproving quality and performance. Make SPC methods a normal aspect of daily operations. Build work teams and employee involvement. Utilize problem-solving tools within the work teams. Develop a sense of operator ownership in the process.
Technology & Operation Management | sarojpandey.com.np 39
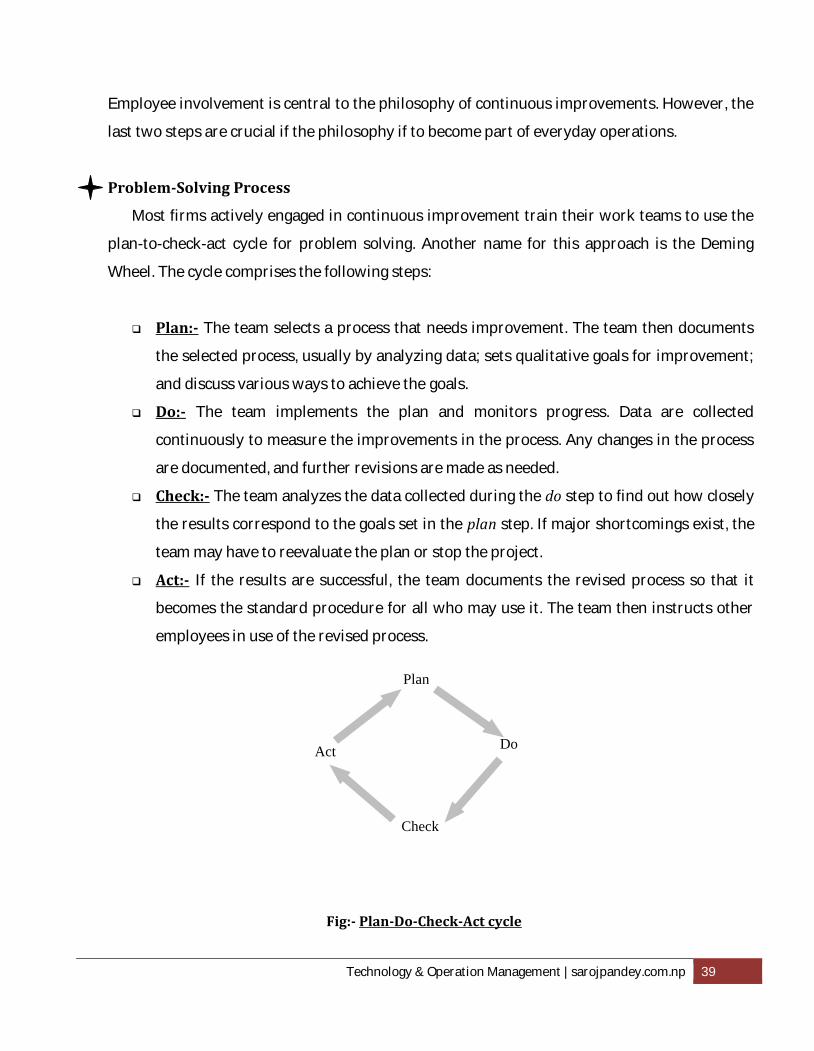
Employee involvement is central to the philosophy of continuous improvements. However, thelast two steps are crucial if the philosophy if to become part of everyday operations.Problem-Solving ProcessMost firms actively engaged in continuous improvement train their work teams to use theplan-to-check-act cycle for problem solving. Another name for this approach is the DemingWheel. The cycle comprises the following steps:
Plan:- The team selects a process that needs improvement. The team then documentsthe selected process, usually by analyzing data; sets qualitative goals for improvement;and discuss various ways to achieve the goals. Do:- The team implements the plan and monitors progress. Data are collectedcontinuously to measure the improvements in the process. Any changes in the processare documented, and further revisions are made as needed. Check:- The team analyzes the data collected during the do step to find out how closelythe results correspond to the goals set in the plan step. If major shortcomings exist, theteam may have to reevaluate the plan or stop the project. Act:- If the results are successful, the team documents the revised process so that itbecomes the standard procedure for all who may use it. The team then instructs otheremployees in use of the revised process.
Plan
Do
Check
Act
Fig:- Plan-Do-Check-Act cycle

Technology & Operation Management | sarojpandey.com.np 40
The Costs of Poor QualityMost experts on the costs of poor quality estimate losses in the range of 20 to 30 percent ofgross sales for defective or unsatisfactory products. Four major categories of costs are associatedwith quality management: prevention, appraisal, internal failure, and external failure.Prevention CostsPrevention costs are associated with preventing defects before they happen. They includethe cost of redesigning the process to remove the causes of poor quality, redesigning theproduct to make it simpler to produce, training employees in the methods of continuousimprovement, and working with suppliers to increase the quality of purchased items orcontracted services.Appraisal CostAppraisal costs are incurred in assessing the level of quality attained by the operatingsystem. Appraisal helps management identify quality problems.Internal Failure CostsInternal failure costs result from defects that are discovered during the production of aproduct or service. They fall into two major cost categories: yield losses, which are incurred ifa defective item must be scrapped, and rework cost, which are incurred if the item is reroutedto some previous operation to correct the defect or if the service must be performed again. Theadditional time spent correcting such a mistake results in lower productivity for the sandingand painting departments.External Failure CostsExternal failure costs arise when a defect is discovered after the customer has received theproduct or service. External failure costs also include warranty service and litigation costs. Awarranty is a written guarantee that the producer will replace or repair defective parts orperform the service to the customer’s satisfaction. Usually, the warranty is given for a specific
Technology & Operation Management | sarojpandey.com.np 41
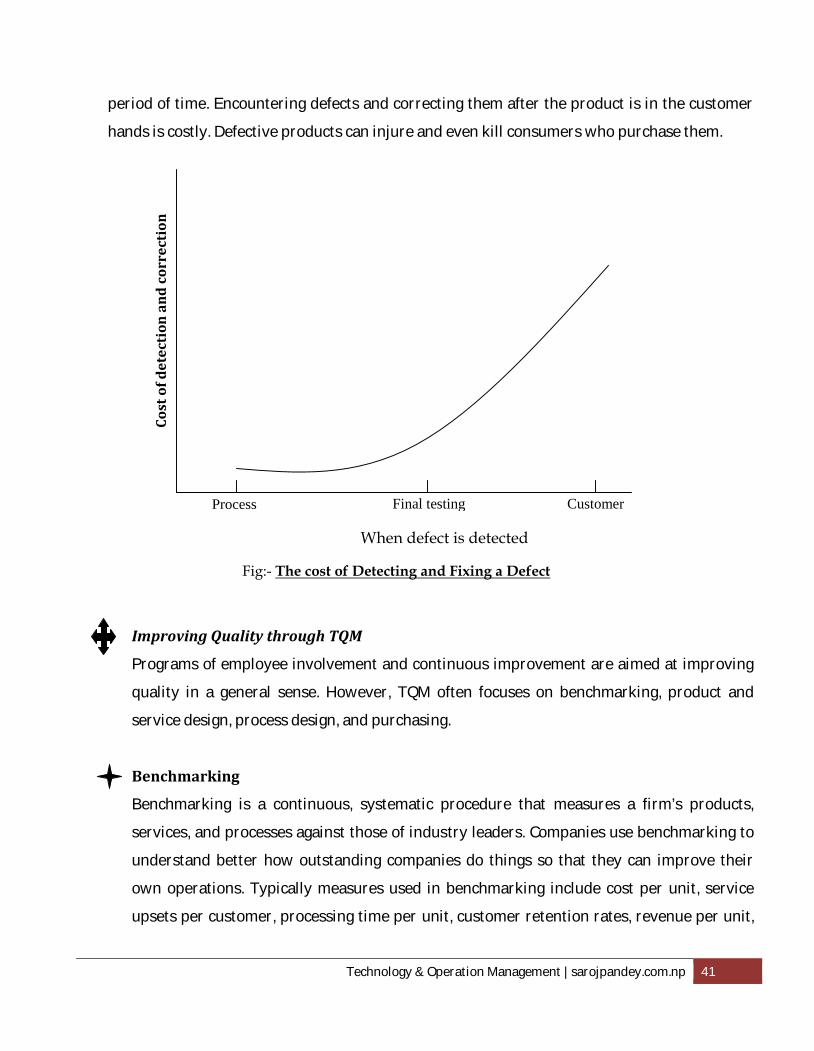
period of time. Encountering defects and correcting them after the product is in the customerhands is costly. Defective products can injure and even kill consumers who purchase them.
Improving Quality through TQMPrograms of employee involvement and continuous improvement are aimed at improvingquality in a general sense. However, TQM often focuses on benchmarking, product andservice design, process design, and purchasing.BenchmarkingBenchmarking is a continuous, systematic procedure that measures a firm’s products,services, and processes against those of industry leaders. Companies use benchmarking tounderstand better how outstanding companies do things so that they can improve theirown operations. Typically measures used in benchmarking include cost per unit, serviceupsets per customer, processing time per unit, customer retention rates, revenue per unit,
Fig:- The cost of Detecting and Fixing a Defect
Cost
of d
etec
tion
and
cor
rect
ion
When defect is detected
Process Final testing Customer
Technology & Operation Management | sarojpandey.com.np 42
return on investment, and customer satisfaction levels. Benchmarking consists of four basicsteps: Planning:- Identify the product, service, or process to be benchmarked and the firms tobe used for comparison, determine the measure of performance for analysis, and collectthe data. Analysis:- Determine the gap between the firm’s current performance and that of thebenchmark firms and identify the causes of significant gaps. Integration:- Establish goals and obtain the support of managers who must provide theresources for accomplishing the goals. Action:- Develop cross-functional teams of those most affected by the changes, developaction plans and team assignments, implement the plans, monitor progress, andrecalibrate benchmarks as improvements are made.The benchmarking is similar to the plan-do-check-act cycle in continuous improvement,but benchmarking focuses on setting quantitative goals for continuous improvement.Product and Service DesignBecause design changes often require changes in methods, material, orspecifications, they can increase defect rates. Stable designs may not be possible when aproduct or service is sold in markets globally. If a firm needs to make design changes toremain competitive, it should carefully test new designs and redesign the product orservice and/or the process with a focus on the market.
Another dimension of quality related to product design is reliability, which refersto the probability that the product will be functional when used. Sometimes product can bedesigned with extra components so that if one component fails another can be activated.

Technology & Operation Management | sarojpandey.com.np 43
Process DesignThe design of the process used to produce a product or service greatly affects inquality. One of the keys to obtaining high quality is concurrent engineering, in whichoperations managers and designers work closely together in the initial phases of productor service design to ensure that production requirements and process capabilities aresynchronized. The result is better quality and shorter development time.Quality Function Deployment
Quality function deployment (QFD) is a means of translating customerrequirements into the appropriate technical requirements for each stage of product orservice development and production. This approach seeks to answers to the following sixquestions: Voice of customer. What do our customers need and want? Competitive analysis. In terms of our customers, how well are we doing relative toour competition? Voice of the engineer. What technical measures relate to our customer needs? Correlations. What are the relationships between the voice of the customer and thevoice of the engineer? Technical comparison. How does our product or service performance compare tothat of our competition? Trade-offs. What are the potential technical trades-offs?A QFD approach provides a way to set targets and debate their effects on product quality.QFD encourages inter-functional communication for the purpose of improving the qualityof products and services.
Purchasing ConsiderationsMost businesses depend on outside suppliers for some of the materials, services, orequipment used in producing their products and services. Large companies have hundredsand even thousands of suppliers, some of which supply same types of parts. The quality ofthese inputs can affect the quality of the firm’s work, and purchased parts of poor qualitycan have a devastating effect.

Technology & Operation Management | sarojpandey.com.np 44
The specifications for purchased parts and materials must be clear and realistic. As acheck on specifications, buyers in some companies initiate process capability studies forimportant products. Management needs a sufficient time for purchasing department toidentify several low-cost, qualified suppliers and to analyze the information they submit.An unrealistic deadline can lead to poor selection based on incomplete information aboutsupplier qualifications.
Technology & Operation Management | sarojpandey.com.np 45
Chapter 6: Capacity
Capacity is the maximum rate of output for a process. The operations manager must provide thecapacity to meet current and future demand; otherwise, the organization will miss opportunitiesfor growth and profits.Capacity plans are made at two levels, long-term capacity plans: deals with investments innew facilities and equipment. These plans covers at least 2 years into the future, but constructionlead times alone can force much longer time horizons. Short-term capacity plans focus onworkforce size, overtime budgets, inventories, and other types of decisions.Some terminologies:
Peak capacity:- The maximum output that a process or facility can achieve underideal conditions is called peak capacity. It can be sustained for only a short time,such as a few hours in a day or a few days in a month. Effective capacity:- The maximum output that a process or firm can economicallysustain under normal conditions is its effective capacity. Rated capacity:- When capacity is measured relative to equipment alone, theappropriate measure is rated capacity: an engineering assessment of maximumannual output, assuming continuous operation except for an allowance for normalmaintenance and repair downtime.
Capacity planning: Capacity planning is central to the long-term success of an organization.When choosing a capacity strategy, managers have to consider questions such asfollowing: How much of a cushion is needed to handle variable, uncertain demand? Should we expand capacity before the demand is there or wait until demand is morecertain?

Technology & Operation Management | sarojpandey.com.np 46
A systematic approach is needed to answer these and similar questions andto develop a capacity strategy appropriate for each situation.1) Estimate Capacity Requirements:- For estimating long-term capacity needsis forecasts of demand, productivity, competition, and technological changesthat extend well into the future. The farther ahead we look, the more chancewe have of making an inaccurate forecast.2) Identify Capacity Gaps:- A capacity gap is any difference (positive ornegative) between projected demand and current capacity. Identifying gapsrequires use of the correct capacity measure.3) Develop Alternatives:- The next step is to develop alternative plans to copewith projected gaps. One alternative, called the base case is to do nothing andsimply lose orders from any demand that exceeds capacity.4) Evaluate the Alternatives:- In this final step, the manager evaluates eachalternative, both quantitatively and qualitatively.
a) Qualitative concerns:- Qualitatively, the manager has to look at howeach alternative fits the overall capacity strategy and other aspects ofthe business not covered by the financial analysis. Some factorscannot be quantified, and have to be assessed on the basis ofjudgment and experience. “ what if “ analysis allows the manager toget an idea of each alternative’s implications before making a finalchoice.b) Quantitative concerns:- Quantitatively, the manager estimates thechange in cash flows for each alternative over the forecast timehorizon compared to the base case. Cash flow is the differencebetween the flows of funds into and out of an organization over aperiod of time, including revenues, costs, and changes in assets and

Technology & Operation Management | sarojpandey.com.np 47
liabilities. The manager is concerned here only with calculating thecash flows attributable to the project.Economies of ScaleHistorically, organizations have accepted a concept known as economies of scale, whichstates that the average unit cost of a goods and services can be reduced by increasing itsoutput rate. There are 4 principal reasons why economies of scale can drive costs down whenoutput increases: fixed costs are spread over more units, construction costs are reduced, costsof purchased materials are cut, and process advantages are found.
Spreading fixed costs: - In short-term, certain costs do not vary with changes in theoutput rate. These fixed costs include heating costs, debt services, and managementsalaries. As increments of capacity often are rather large, a firm initially might have to buymore capacity than it needs. However, demand increases in subsequent years can then beabsorbed without additional fixed costs. Reducing construction cost: - Certain activities and expenses are required in buildingsmall and large facilities alike: building permits, architects’ fees, rental of buildingequipment. Doubling the size of the facility usually does not double construction costs. Theconstruction cost of equipment or a facility often increases relative to its surface area,whereas its capacity increases in proportion to its cubic volume. Cutting costs of purchased materials: - Higher volumes can reduce the costs ofpurchased materials and services. They give the purchaser a better bargaining position andthe opportunity to take advantage of quantity discounts.
Finding process advantage: - High-volume production provides many opportunities for costreduction. At a higher output rate, the process shifts towards a line process, with resourcesdedicated to individual’s products. The benefits from dedicating resources to individualproducts or services may include speeding up the learning effect, lowering inventory,improving process and job designs, and reducing the number of changeover.
Technology & Operation Management | sarojpandey.com.np 48
Chapter 7: Location
Factors Affecting Location DecisionsFacility location is the process of determining a geographic site for a firm’s operations.Managers of both service and manufacturing organizations must weigh many factors whenassessing the desirability of a particular site, including proximity to customers and suppliers,labor costs, and transportation costs. Managers can disregard factors that fail to meet at leastone of the following two conditions: The factor must be sensitive to location. That is, managers shouldn’t consider afactor that isn’t affected by the location decision. For example, if communityattitudes are uniformly good at all the locations under consideration, communityattitudes shouldn’t be considered as a factor. The factor must have a high impact on the company’s ability to meet its goals. Forexample, although different locations will be at different distances from suppliers, ifshipments and communication can take place by overnight delivery, faxing, andother means, distance to suppliers shouldn’t be considered as a factor.Managers can divide location factors into dominant and secondary factors.Dominant factors are those derived from competitive priorities (cost, quality, timeand flexibility) and have a particularly strong impact on sales or costs. Secondaryfactors are also important, but management may downplay or even ignore some ofthem if other factors also are important.
Dominant factors in Manufacturing:Six groups of factors dominate location decisions for few manufacturing plants.They are: Favorable labor climate: A favorable labor climate may be the mostimportant factor in location decisions for labor-intensive firms in industriessuch as textiles, furniture, and consumer electronics. Labor climate is afunction of wage rates, training requirements, attitudes toward work, workerproductivity, and union strength.

Technology & Operation Management | sarojpandey.com.np 49
Proximity to Markets: After determining where the demand for goods andservices is greatest, management must select a location for the facility thatwill supply that demand. Locating near markets is particularly importantwhen the final goods are bulky or heavy and outbound transportation ratesare high. Quality of Life: Good schools, recreational facilities, cultural events, and anattractive life-style contribute to quality of life. This factor is relativelyunimportant on its own, but it can make the difference in location decisions. Proximity to Suppliers and Resources: Firms dependent on inputs ofbulky, perishable, or heavy raw materials emphasize proximity to suppliersand resources. In such cases inbound transportation costs become adominant factor, encouraging such firms to locate facilities near suppliers. Proximity to the Parent Company’s Facilities: In many companies, plantssupply parts to other facilities or rely on other facilities for management andstaff support. These ties require frequent coordination and communication,which can become more difficult as distance increases. Utilities, Taxes, and Real Estate Costs : Other important factors that mayemerge include utility costs(telephone, energy, and water), local and statetaxes, financing incentives offered by local or state governments, relocationcosts, and land costs.
Reasons for GlobalizationFour developments have spurred the trend toward globalization: improved transportationand communication technologies, loosened regulations on financial instruction, increaseddemand for imported goods, and lowered international trade barriers.

Technology & Operation Management | sarojpandey.com.np 50
Improved Transportation & communication technologies:Improvements in communications technology and transportation arebreaking down the barriers of time and space between countries.Telecommunications (voice and data) technology- including electronicmail, Internet allows facilities to serve larger market areas and allowsfirms to centralize some operations and provide support to brancheslocated near their customers. Opened Financial Systems: The world’s financial systems have becomemore open, making it easier for firms to locate where capital, supplies,and resources are cheapest. Increased Demand for Imports: Import penetration of the majoreconomies is increasing, as political barriers to international trade havecrumbled. Penetration has been increased by locating productionfacilities in foreign countries because a local presence reduces customeraversion to buying imports. Reduced Import Quotas and Other Trade Barriers: Producing goodsor service in the country where the customers live also circumventsimport quotas and other trade barriers. Japanese markets also are farmore open to foreign entrants than in the past, creating an explosion ofpartnership opportunities that were unthinkable just 5 years ago.
Disadvantages of GlobalizationThe disadvantages of globalization are listed below: A firm may have to relinquish proprietary technology if it turns oversome of its component manufacturing to offshore suppliers or if suppliersneed the firms technology to achieve desired quantity and cost goals. There may be political risks. Each nation can exercise its sovereignty overthe people and property within its borders. The extreme case isnationalization, in which a government may take over a firm’s assetswithout paying compensation.

Technology & Operation Management | sarojpandey.com.np 51
Employee skills may be lower in foreign countries, requiring additionaltraining time. When a firm’s operation are scattered, customer response times can belonger. Effective cross-functional connections also may be more difficult ifface-to-face discussions are needed.
Technology & Operation Management | sarojpandey.com.np 52
Chapter 8: Layout
What is Layout Planning?
Layout planning involves decisions about the physical arrangement of economic activitycenters within a facility. The goal of layout planning is to allow workers and equipment tooperate more effectively. Before manager can make decisions regarding physicalarrangement, four questions must be addressed. They are: What centers should the layout include? Centers should reflect process decisionsand maximize productivity. For example, a central storage area for tools of tools ismost efficient for certain processes, but keeping tools at individual workstationsmakes more sense for other processes. How much space and capacity does each center need? Inadequate space canreduce productivity, deprive employees of privacy, and even create health andsafety hazards. How should each center’s space be configured? The amount of space, its shape,and the elements in a center are interrelated. Providing a pleasing atmosphere alsoshould be considered as part of the layout configuration decisions, especially inretail outlets and offices. Where should each center be located? Location can significantly affectproductivity. For example, employee who must frequently interact with one anotherface to face should be placed in central location rather than in separate, remotelocations to reduce time lost traveling back and forth.
Technology & Operation Management | sarojpandey.com.np 53
Layout TypesThe choice of layout type depends largely on the firm’s flow strategy. There are fourbasic types of layout:Process Layout:
With a flexible flow strategy, which is best for low-volume, high varietyproduction, the operations manager must organize resources (employeesand equipment) around the process. A process layout, which groups workstations or departments according tofunction, accomplishes this purpose. Is most common when the same operation must intermittently producemany different products or serve many customers. Demand levels are too low or unpredictable for management to set asidehuman and capital resources exclusively for a particular product line ortype of customer.
Advantages of process layout over product layout are:
Resources are relatively general purpose and less capital intensive. Is less vulnerable to changes in product mix or new marketing strategiesand is therefore more flexible. Equipment utilization is higher. Employee supervision can be more specialized, an important factor whenjob content requires a good deal of technical knowledge.
Disadvantages of process layout over product layout are:
Processing rates tend to be slower. Productive time is lost in changing from one product or services to another. More space and capital are tied up in inventory, which helps workstationsto work independently despite their variable output rates. The time lags between job starts and end points are relatively long. Materials handling tends to be costly.
Technology & Operation Management | sarojpandey.com.np 54
Product Layout:
With a line flow strategy, which is best for repetitive or continuousproduction, the operations manager dedicates resources to individualproducts or tasks. This strategy is achieved by a product layout. Are common in high-volume types of operations. Often follow a straight line, a straight line isn’t always best, and layouts maytake an L, O, S, or U shape. Often is called a production line or an assembly line. The difference is that,an assembly line is limited to assembly processes, whereas a productionline can be used to perform other processes such as machining. Often rely heavily on specialized, capital-intensive resources.
Advantages of product layout over process layout are:
Faster processing rates, Lower inventories, and Less unproductive time lost to changeovers and materials handling.
Disadvantages of product layout are:
Greater risk of layout redesign for products or services with short oruncertain lives, Less flexibility, and Low resource utilization for low-volume products or services.
Hybrid layout:
More often, a flow strategy combines elements of both a product and aprocess focus. This intermediate flow strategy calls for a hybrid layout, in which someportions of the facility are arranged in a process layout and others arearranged in a product layout.
Technology & Operation Management | sarojpandey.com.np 55
Are used in facilities having both fabrication and assembly operations. Managers create this layout when introducing cells and flexible automation,such as a flexible manufacturing system. Retail store is an example of a hybrid layout in non-manufacturing setting.
Fixed-Position layout:
In this arrangement, the product is fixed in place; workers, along with theirtools and equipment, come to the product to work on it. Makes sense when the product is particularly massive or difficult to move. Minimizes the number of times that the product must be moved and oftenis the only feasible solution.
Technology & Operation Management | sarojpandey.com.np 56
Chapter: 9 Forecasting
Why is forecasting needed?A forecast is a prediction of future events used for planning purposes. Changing businessconditions resulting from global competition, rapid technological change, & increasingenvironmental concerns exert pressure on firm’s capability to generate accurate forecasts.Forecasts are needed to aid in determining what resources are needed, scheduling existingresources, and acquiring additional resources. Managers may need forecast to anticipatechanges in prices or costs or to prepare for new laws or regulations, competitors, resourcestorages, or technologies.Forecasting methods may be based on mathematical models using historical dataavailable, qualitative methods, drawing on managerial experience, or a combination of both.
Patterns of DemandThe repeated observation of demand for a product or service in their order of occurrencefrom a pattern is known as time series. The 5 basic patterns of most demand time series are: Horizontal, or the fluctuation of data around a constant mean, Trend, or systematic increase or decrease in the mean of the series over time, Seasonal or a repeatable pattern of increases or decreases in demand, depending onthe time of day, week, month, or season. Cyclic, or less predictable gradual increases or decreases in demand over periods oftime (years or decades); & Random or un-forecast able, variation in demand.Factors Affecting DemandWhat factors cause changes in the demand for a particular product or service overtime? Generally, such factors can be divided into two main categories: external and internal.External factors: External factors that affect demand for a firm’s products or services arebeyond management’s control. A booming economy may positively influence demand,
Technology & Operation Management | sarojpandey.com.np 57
although the effect may not be the same for all products and services. Certain governmentagencies and private firms compile statistics on general economic time series to helporganizations predict the direction of change in demand of their products or services.Leading indicators, such as the rate of business failures, are external factors withturning points that typically precede the peaks and troughs of the general business cycle.
Coincident indicators, such as unemployment figures, are time series with turning pointsthat generally match those of the general business cycle. Lagging indicators, such as retailsales, follow those turning points, typically by several weeks or months. Knowing that aseries is a lagging indicator can be useful. For example, a firm needing, a business loan forexpansion should realize that interest rates will drop to a low point several weeks after thebusiness cycle reaches its trough.Internal factors: Internal decisions about product or service design, price and advertisingpromotions, packaging design, salesperson quotas or incentives, and expansion orcontraction of geographic market target areas all contribute to changes in demand volume.The term demand management describes the process of influencing the timing and volumeof demand or adapting to the undesirable effects of unchangeable demand patterns. Forexample, automobile manufacturers use rebates to boost car sales.
Management must carefully consider the timing of demand, an extremely importantfactor in efficiently utilizing resources and production capacity. Trying to produce for peakcustomer demand during the peak demand period can be very costly. To avoid this situation,firms often use price incentives or advertising promotions to encourage customers to makepurchases before or after traditional times of peak demand.Finally, some companies schedule delivery dates for products or services according tothe current workload and capacity.

Technology & Operation Management | sarojpandey.com.np 58
Judgment MethodsWhen adequate historical data are lacking, as when a new product is introduced ortechnology is expected to change, firms rely on managerial judgment and experience togenerate forecasts. Judgment methods can also be used to modify forecasts generated byquantitative methods. The four successful methods currently in use are:Sales Force EstimatesSometimes the best information about future demand comes from the people closer to thecustomer. Sales force estimates are forecasts compiled from estimates of future demandsmade periodically by members of a company’s sales force.
This approach has several advantages:
The sales force is the group most likely to know which products or services customerswill be buying in the near future, and in what quantities. Sales territories often are divided by district or region. Information broken down in thismanner can be useful for inventory management, distribution, and sales force staffingpurposes. The forecasts of individual sales force members can be combined easily to get regionalor national sales.The disadvantages are:
Individual biases of the salesperson may taint the forecast; moreover, some people arenaturally optimistic, others more cautious. Salesperson may not always be able to detect the difference between what a customers“wants” and what a customer “needs”. If the firm uses individual sales as a performance measure, salesperson mayunderestimate their forecasts so that their performance will look good when theyexceed their projections or may work hard only until they reach their projections ormay work hard only until they reach their required minimum sales.
Technology & Operation Management | sarojpandey.com.np 59
Executive OpinionWhen a new product or service is contemplated, the sales force may be able to makeaccurate demand estimates. Executive opinion is a forecasting method in which the opinions,experience, & technical knowledge of one or more managers are summarized to arrive at asingle forecast. Executive opinion can also be used for technological forecasting. The quickpace of technological change makes keeping abreast of the latest advances difficult.This method of forecasting has several disadvantages:
Is costly, because it takes valuable executive time. If executives are allowed to modify a forecast without collectively agreeing to thechanges, the resulting forecast will not be useful.The key to effective use of executive opinion is to ensure that the forecast reflects not a seriesof independent modifications but consensus among executives on a single forecast.
Market ResearchMarket research is a systematic approach to determine consumer interest in a product orservice by creating and testing hypotheses through data-gathering surveys. Conducting amarket research study includes:1. Designing a questionnaire that requests economic and demographic information fromeach person interviewed and asks whether the interviewee would be interested in theproduct or services.2. Deciding how to administer the survey, whether by telephone polling, mailings, orpersonal interviews.3. Selecting a representative sample of households to survey, which should include arandom selection within the market area of the proposed product or service; and4. Analyzing the information using the judgment and statistical tools to interpret theresponses, determine their adequacy, make allowance for economic or competitive
Technology & Operation Management | sarojpandey.com.np 60
factors not included in the questionnaire, and analyze whether the survey represents arandom sample of the potential market.Market research may be used to forecast demand for the short, medium, and long term.Although market research yields important information, one shortcoming is the numerousqualifications and hedges typically included in the findings.
Delphi MethodThe Delphi method is a process of gaining consensus from a group of experts whilemaintaining their anonymity. This form of forecasting is useful when there are no historicaldata from which to develop statistical models and when managers inside the firm have noexperience on which to base informed projections. Anonymity is important when somemembers of the group tend to dominate discussion or command a high degree of respect intheir fields.The Delphi method can be used to develop long-range forecasts of product demand andnew products sales projections. It can be used to obtain a consensus from a panel of expertswho can devote their attention to following scientific advances, governmental regulations,and the competitive environment.The Delphi method has some shortcomings, including the following major ones:
The process can take a long (sometimes a year or more). During that time the panel ofpeople considered to be experts may change, confounding the results or at least furtherlengthening the process. Responses may be less meaningful than if experts were accountable for their responses. There is little evidence that Delphi forecasts achieve high degrees of accuracy. However,they are known to be fair good in identifying turning points in new product demand. Poorly designed questionnaires will result in ambiguous or false conclusions.
Technology & Operation Management | sarojpandey.com.np 61
Causal Methods: Linear RegressionCausal methods are used when historical data are available and the relationship betweenthe factor to be forecasted and other external or internal factors can be identified. Casualmethods provide the most sophisticated forecasting tools and are very good for predictingturning points in demand and preparing long-range forecasts.In linear regression, one variable, called a dependent variable, is related to one or moreindependent variables by linear equation. In simplest linear regression models, thedependent variable is a function of only one dependent variable, and therefore thetheoretical relationship is a straight line:
The objective of linear regression analysis is to find values of a and b that minimizethe sum of the squared deviations of the actual data points from the graphed line. Twomeasures commonly reported are the sample correlation coefficient and the samplecoefficient of determination.
Y = a + bX WhereY = dependent variableX = independent variablea = Y-intercept of the lineb = slope of the line
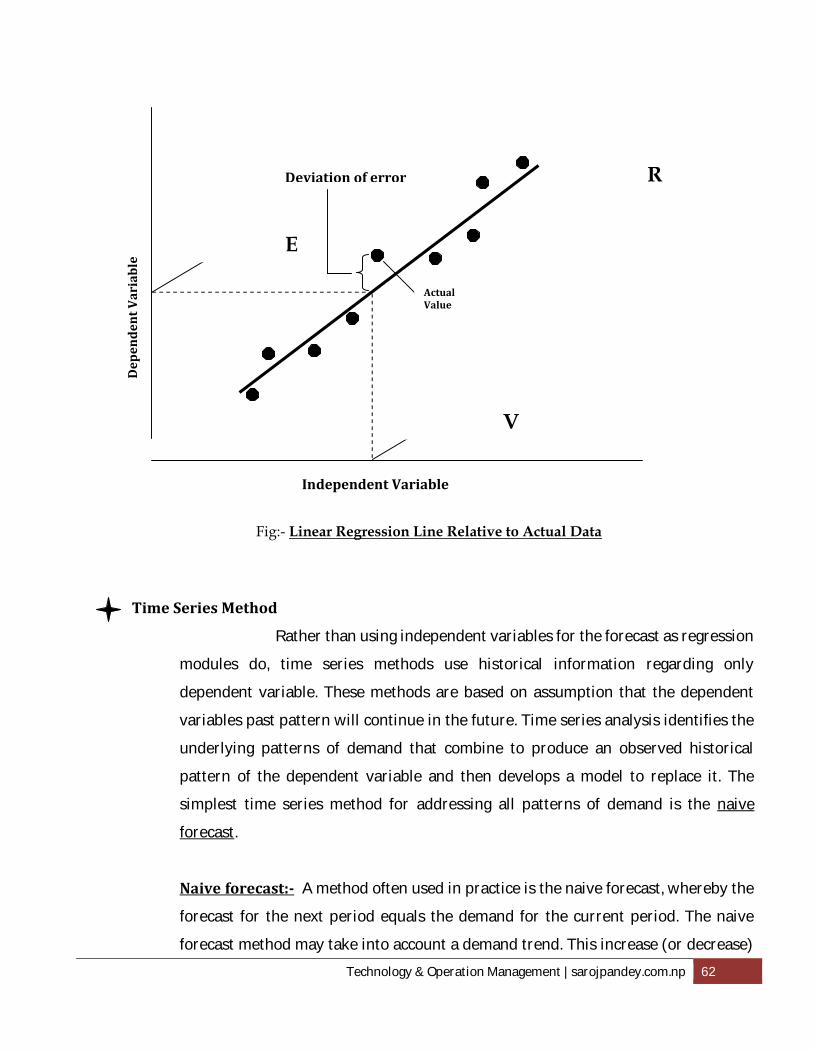
Technology & Operation Management | sarojpandey.com.np 62
Time Series MethodRather than using independent variables for the forecast as regressionmodules do, time series methods use historical information regarding onlydependent variable. These methods are based on assumption that the dependentvariables past pattern will continue in the future. Time series analysis identifies theunderlying patterns of demand that combine to produce an observed historicalpattern of the dependent variable and then develops a model to replace it. Thesimplest time series method for addressing all patterns of demand is the naiveforecast.Naive forecast:- A method often used in practice is the naive forecast, whereby theforecast for the next period equals the demand for the current period. The naiveforecast method may take into account a demand trend. This increase (or decrease)
Independent Variable
ActualValue
Deviation of error
Estimation ofY fromregressionequation V
alue ofX used
toestima
te Y
Regressionequation
Y= a +bX
Dep
ende
nt V
aria
ble
Fig:- Linear Regression Line Relative to Actual Data
Technology & Operation Management | sarojpandey.com.np 63
in demand observed between the last two periods is used to adjust the currentdemand to arrive at a forecast.The advantages of the naïve forecast method is:
Simple and low cost. Best when horizontal, trend, or seasonal patterns are stable and randomvariation is small. Level of accuracy is acceptable.

Technology & Operation Management | sarojpandey.com.np 64
Chapter 10: Material Requirement Planning
Benefits of Material Requirement PlanningMaterial requirement planning (MRP)- a computerized information system- was developedspecially to aid in managing dependent demand inventory and scheduling replenishmentorders. The MRP system enables businesses to reduce inventory levels, utilize labor andfacilities better, and improve customer service.The three advantages of Material requirement planning are:
Statistical forecasting for components with lumpy demand results in large forecastingerrors. MRP calculates the dependent demand of components from the productionschedules of their parents, thereby providing a better forecast of componentrequirements. MRP systems provide managers with information useful for planning capacities andestimating financial requirements. Planners can use the information on parent itemschedules to identify times when needed components may be unavailable because ofcapacity shortages, supplier delivery delays, and the like. MRP systems automatically update the dependent demand and inventoryreplenishment schedules of components when the production schedules of parent itemchange. The MRP system alerts the planners whenever action is needed on anycomponent.
Inputs to Material Requirement PlanningThe key inputs of MRP system are bill of materials database, master production schedules,and an inventory record database. Using this information, the MRP system identifies actionsthat operations must take to stay on schedule, such as releasing new production orders,adjusting order quantities, and expediting later orders.An MRP system translates the master production schedule and other sources of demand,such as independent demand for replacement parts and maintenance items, into the
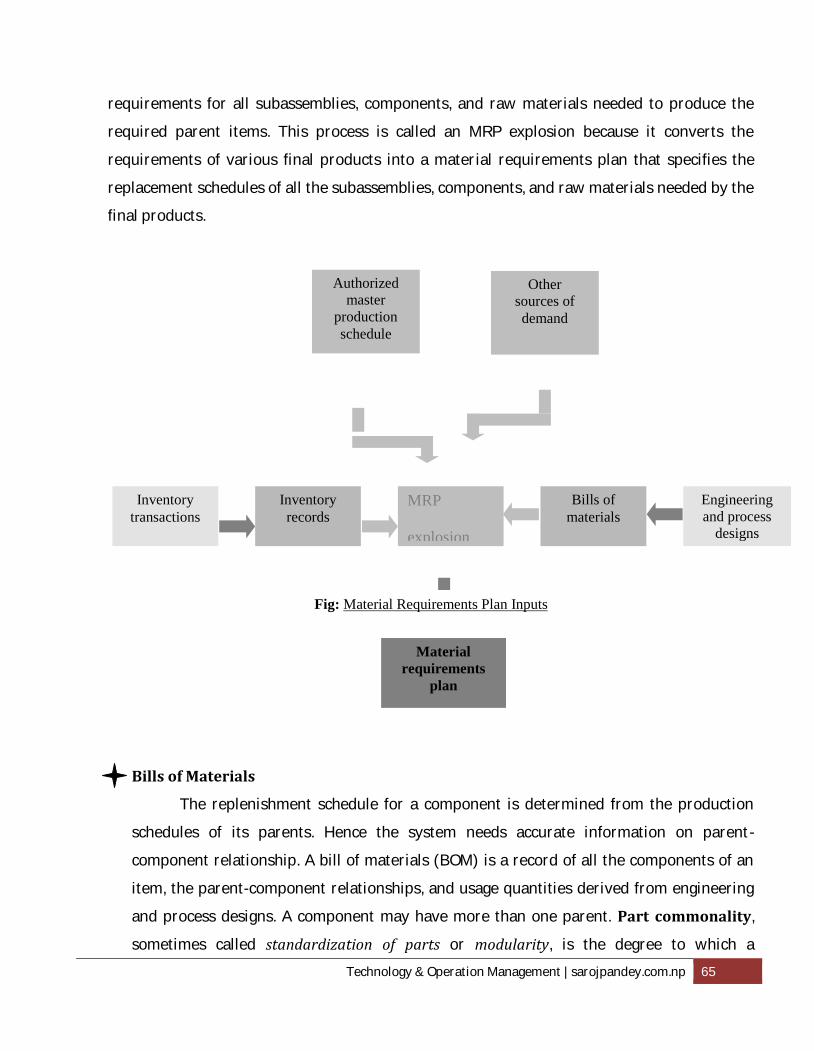
Technology & Operation Management | sarojpandey.com.np 65
requirements for all subassemblies, components, and raw materials needed to produce therequired parent items. This process is called an MRP explosion because it converts therequirements of various final products into a material requirements plan that specifies thereplacement schedules of all the subassemblies, components, and raw materials needed by thefinal products.
Bills of MaterialsThe replenishment schedule for a component is determined from the productionschedules of its parents. Hence the system needs accurate information on parent-component relationship. A bill of materials (BOM) is a record of all the components of anitem, the parent-component relationships, and usage quantities derived from engineeringand process designs. A component may have more than one parent. Part commonality,sometimes called standardization of parts or modularity, is the degree to which a
Authorizedmaster
productionschedule
Othersources ofdemand
Inventorytransactions
Inventoryrecords
MRP
explosion
Engineeringand process
designs
Bills ofmaterials
Materialrequirements
plan
Fig: Material Requirements Plan Inputs
Technology & Operation Management | sarojpandey.com.np 66
component has more than one immediate parent. As a result of commonality, the sameitem may appear in the bills of materials for several different products.Master Production ScheduleThe second input into a material requirement plan is the master productionschedule (MPS), which details how many end items will be produced within specifiedperiod of time. It breaks the aggregate production plan into specific product schedules. Thefigure below shows how an aggregate plan for a family of chairs breaks down into theweekly master production schedule for each specific chair type (the time period can behours, day, weeks, or month). The chair example demonstrates the following aspects ofmaster scheduling.
The sums of the quantity in the MPS must equal those in the aggregate productionplan. The consistency between the plans in desirable because of the economicanalysis done to arrive at the aggregate plan. The aggregate production quantities must be allocated efficiently over time. Thespecific mix of chairs types- the amount of each type as a percentage of the totalaggregate quantity- is based on historic demand and marketing and promotionalconditions. The planner must select lot sizes for each chair type, taking intoconsideration economic factors such as production setup costs and inventorycarrying costs. Capacity limitations, such as machine or labor capacity, storage space, or workingcapital, may determine the timing and size of MPS quantities.The MPS start quantities are used in the MRP system to determine the componentsneeded to support the schedule.

Technology & Operation Management | sarojpandey.com.np 67
April May1 2 3 4 5 6 7 8Ladder-backchair 150 150Kitchen chair 120 120Desk chair 200 200 200 200Aggregateproduction planfor chair family 670 670
Inventory RecordInventory records are the final input for MRP, and the basic building blocks of up-to-date records are inventory transactions. Transactions include releasing new orders,receiving scheduled receipts, adjusting due dates for scheduled receipts, withdrawinginventory, canceling orders, correcting inventory errors etc. Recording such transactions isessential for maintaining the accurate records of on-hand inventory balances andscheduled receipts necessary for an effective MRP system.The inventory record divides the future into time periods called time buckets.The purpose of the inventory record is to keep track of inventory levels and componentreplenishment needs. The time-phased information contained in the inventory record consistsof: 1. gross requirements,2. scheduled receipts,3. projected on-hand inventory,4. planned receipts, and5. Planned order releases.
Fig: Master Production for a Family of Chairs

Technology & Operation Management | sarojpandey.com.np 68
Gross requirements:- The gross requirements are the total demand derived from allparent production plans. They also include demand not otherwise accounted for, such asdemand for replacement parts for units already sold. Scheduled receipts:- Recall that scheduled receipts are orders that have been placed butnot yet completed. For a purchased item, the scheduled receipt could be in one of severalstages: being processed by a supplier, being transported to purchaser, or being inspectedby the purchaser’s receiving department. Projected On-Hand Inventory:- The projected on-hand inventory is an estimate of theamount of inventory available each week after gross requirements have been satisfied. Aswith scheduled receipts, entries are made for each actual withdrawal and receipt to updatethe MRP database.
Contd. …

Technology & Operation Management | sarojpandey.com.np 69
Item: c Lot size: 230unitsDescription: Seat subassembly lead time: 2weeksWeek1 2 3 4 5 6 7 8Grossrequirements 150 0 0 120 0 150 120 0
Scheduledreceipts 230 0 0 0 0 0 0 0Projectedon-hand 37inventory
117 117 117 -3 -3 -153 -273 -273PlannedreceiptsPlannedorderreleases
+ -Gross
requirementsin week t Hand at end of
Week t-1
=inventory onhand at endof week t-1
Hand at end of
Week t-1
Projected on-handinventory balanceat end of week t
inventory balanceat end of week t
Scheduled orplannedreceipts inweek t-1
Hand at end of
Week t-1
Week 1: 37 + 230 – 150 = 117Week 2 and 3: 117 + 0 – 0 = 117Week 4: 117 + 0 – 120 = - 3Week 5: - 3 + 0 – 0 = -3Week 6: - 3 + 0 – 150 = -153Week 7: - 153 + 0 – 150 = -273Week 8: - 273 + 0 – 0 = -273
Technology & Operation Management | sarojpandey.com.np 70
Planned Receipts:- Planning for receipt of new orders will keep the projected on-handbalance from dropping below zero. The planned receipt row is developed as follows:1. Weekly on-hand inventory is projected until a shortage appears. The addition of thenewly planned receipt should raise the projected on-hand balance so that it equalsor exceeds zero.2. Projection of on-hand inventory continues until the next shortage occurs. Thisshortage signals the need for the need for the second planned receipt.This process is repeated until the end of the planning horizon by proceeding column bycolumn through the MRP record- filling in planned receipts as needed and completing theprojected on-hand inventory row. Planned Order Releases:- A planned order release indicates when an order for a specifiedquantity of an item is to be issued. We must place the planned order release quantity in theproper time bucket.
Contd. …

Technology & Operation Management | sarojpandey.com.np 71
Item: c Lot size: 230unitsDescription: Seat subassembly lead time: 2weeksWeek1 2 3 4 5 6 7 8Grossrequirements 150 0 0 120 0 150 120 0
Scheduledreceipts 230 0 0 0 0 0 0 0Projectedon-hand 37inventory
117 117 117 227 227 77 187 187Plannedreceipts 230 230Plannedorderreleases
230 230
Planning FactorsThe planning factors in an MRP record play an important role in the overall performanceof the MRP system. By manipulating these factors, managers can fine-tune inventoryoperations. Planning factors are:Planning Lead TimePlanning lead time is an estimate of the time between placing an order for an item andreceiving it in inventory. Accuracy is important in planning lead time. If an item arrives in
Technology & Operation Management | sarojpandey.com.np 72
inventory sooner than needed, inventory cost increase. If an item arrives too late, stock-outs, excessive expediting costs, or both occur.For purchased items, the planning lead time is the time allowed for receiving a shipmentfrom the supplier after the order has been sent, including the normal time to place theorder. For items manufactured in-house, the planning lead time consists of estimates for
Setup time, Process time, Materials handling time between operations, and Waiting time.
Lot-Sizing RulesA lot-sizing rule determines the timing and size of order quantities. A lot-sizing rulemust be assigned to each time before planned receipts and planned order releases can becomputed. The choice of lot-sizing rules is important because they determine the numberof setups required and recovery holding costs for each time.Fixed Order QuantityThe fixed order quantity (FOQ) rule maintains the same order quantity each time anorder is issued. For example, the lot size might be the size dedicated by equipment capacitylimits, as when a full lot must be loaded into a furnace at one time. For purchased items theFOQ could be determined by the quantity discount level, truckload capacity, or minimumpurchase quantity. FOQ might be insufficient to avoid shortage. In such unusual cases, theinventory planner must increase the lot size beyond the FOQ, typically to a size largeenough to avoid a shortage.Periodic Order QuantityThe periodic order quantity (POQ) rule allows a different order quantity for each orderissued but tends to issue the order at predetermined time interval such as every twoweeks. The order quantity equals the amount of the item needed during the predeterminedtime between orders and must be large enough to prevent shortages.
Technology & Operation Management | sarojpandey.com.np 73
The POQ rule does not mean that operations must issue a new order every P weeks.Rather, when an order is planned, its lot size must be enough to cover P successive weeks.Safety StockAn important managerial issue is the quantity of safety stock to require. It is morecomplex for dependent demand items than for independent demand items. Safety stock fordependent demand items with lumpy demand is valuable only when future grossrequirements, the timing or size of scheduled receipts, and the amount of scrap areuncertain. Safety stock should be reduced and ultimately removed as the causes of theuncertainty are eliminated.Outputs from Material Requirement PlanningMaterial Requirement Planning systems provide many reports, schedules, andnotices to help managers control dependent demand inventories. The outputs ofMRP systems are:
Material Requirement Planning ExplosionMRP translates, or explodes, the master production schedule and other sources ofdemand into the requirements for all subassemblies, components, and raw materialsneeded to produce parent items. This process generates the material requirement plan foreach component parts. An item’s gross requirements are derived from three sources.1. the MPS for immediate parents that are end items,2. the planned order releases for parents below the MPS level, and3. Any other requirements not originating in the MPS, such as the demand for replacementparts.
Technology & Operation Management | sarojpandey.com.np 74
Action NoticesOnce computed, inventory records for each item appearing in the bills of materials canbe printed in hard copy or displayed on a computer video screen. Inventory planners use acomputer-generated memo called an action notice to make decisions about releasing neworders and adjusting the due dates of scheduled receipts. An action list can simply be a listof parts numbers for items needing attention. Or it can be the full record for such items,with a note at the bottom identifying the action needed. Releasing New Orders:- If there is a nonzero quantity in the first week’s entry ofthe planned order release row, sometimes called the action bucket, the computerissues an action notice. An order in the action bucket is the call to release theplanned order. Adjusting Due Dates of Scheduled Receipts:- If subtracting the scheduledreceipt from the projected on-hand inventory for the week in which it is duedoesn’t cause a shortage, the scheduled receipt is arriving too early. In this case,the inventory planner can delay the scheduled receipt. If the projected on-handbalance for the week prior to the arrival of the scheduled receipt is arriving toolate. In this case, the planner should expedite the arrival of the scheduled receipt. Making Decisions:- Although the computer generates action notices, decisionsbased on them are made by the inventory planner. The planner reviews the item’scomplete MRP inventory record, along with those components. When releasing anew order, the planner can also prepare documentation for tool requisition,routings, or parts lists.
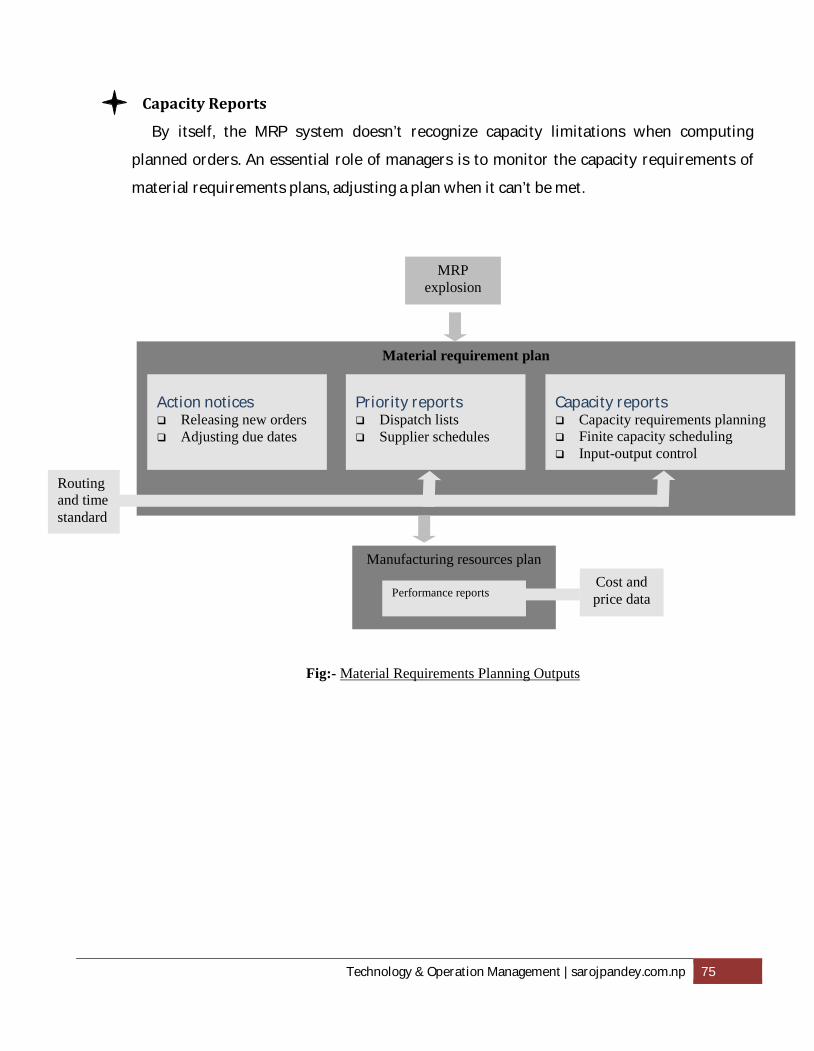
Technology & Operation Management | sarojpandey.com.np 75
Capacity ReportsBy itself, the MRP system doesn’t recognize capacity limitations when computingplanned orders. An essential role of managers is to monitor the capacity requirements ofmaterial requirements plans, adjusting a plan when it can’t be met.MRP
explosion
Material requirement plan
Manufacturing resources plan
Performance reportsCost andprice data
Routingand timestandard
Fig:- Material Requirements Planning Outputs
Action notices Releasing new orders Adjusting due dates
Priority reports Dispatch lists Supplier schedules
Capacity reports Capacity requirements planning Finite capacity scheduling Input-output control

Technology & Operation Management | sarojpandey.com.np 76
Chapter 11: Just in Time
To gain and maintain a competitive advantage, firms are using the Just-In-Time (JIT)philosophy, which is to eliminate waste by cutting unnecessary inventory and removing delaysin operations. A JIT system is an organization of resources, information flows, and decision rulesthat can enable an organization to realize the benefits of operations. JIT system is known bymany different names including zero inventory, synchronous manufacturing, lean production,stockless production, materials as needed, and continuous flow manufacturing.Characteristics of Just-In-Time SystemsJIT systems focus on reducing inefficiency and unproductive time in the production processto improve continuously the process and quality of the product or service. Employeeinvolvement and inventory reduction are essential to JIT operations. Some of the characteristicsof JIT system are:
Pull Method of Material FlowJIT systems utilize the pull method of materials flow. Another popular method is the pullmethod. In push method; the customer demand activates the production of the item.Whereas in pull method; the production of the item begins in advance of customer needs.Consistently High QualityJIT system seek to eliminate scrap and rework in order to achieve a uniform flow ofmaterials. JIT systems control quality at source, with workers acting as their own qualityinspectors. Management must realize the enormous responsibility this method places onthe workers and must prepare them properly.Small Lot SizesRather than building up a cushion of inventory, users of JIT systems maintain inventorywith lot sizes that are small as possible. Small lot sizes have three benefits:
Technology & Operation Management | sarojpandey.com.np 77
Reduce cycle inventory, the inventory in excess of the safety stock carriedbetween orders. Help cut lead times. A decline in lead-time in turn cuts pipeline inventorybecause the total processing time at each workstations is greater for large lotsthan for small lots. Help to achieve a uniform operating system workload.
Uniform Workstation LoadsThe JIT system works best if daily load on individual workstations is relatively uniform.Uniform loads can be achieved by assembling the same type and number of units each day,thus creating a uniform daily demand at all workstations.Standard Components and Work MethodsThe standardization of components, called part commonality or modularity, increasesrepeatability. Productivity tends to increase because, with increased repetition, workerslearn to do the task more efficiently. Standardization of components and work methodsaids in achieving the high-productivity, low-inventory objectives of JIT systems.Close Suppliers TiesBecause JIT system operates with very low levels of inventory, close relationships withsuppliers are necessary. Stock shipments must be frequent, have short lead times, arrive onschedule, and be of high quality. A contract might require a supplier to deliver goods to afactory as often as several times per day. Purchasing managers focus on three areas:reducing the number of suppliers, using local suppliers, and improving supplier relations.Flexible Work ForceWorkers in flexible work force can be trained to perform more than one job. Flexibilitycan be very beneficial: workers can be shifted among workstations to help relievebottlenecks as they arise without resorting to inventory buffers- an important aspect of theuniform flow of JIT system. Assigning workers to tasks they don’t usually perform mayreduce efficiency; some rotation relieves boredom and refreshes workers.
Technology & Operation Management | sarojpandey.com.np 78
Line Flow StrategyA line flow strategy can reduce the frequency of setups. If volumes of specific productsare large enough, groups of machines and workers can be organized into a product layoutto eliminate setups entirely. Another tactic used to reduce or eliminate setups is the one-worker, multiple machines (OWMM) approach, which essentially is a one-person line.Automated ProductionAutomation plays a big role in JIT systems and is a key to low-cost production. SakichiToyoda, the founder of Toyota, once said, “Whenever there is money, invest it into themachinery.” Money freed up because of JIT inventory reductions can be invested inautomation to reduce the costs.Preventive MaintenanceBecause JIT emphasizes finely tuned flows of materials and little buffer inventorybetween workstations, unplanned machine downtime can be disruptive. Preventivemaintenance can reduce the frequency and duration of machine downtime. Another tacticis to make workers responsible for routinely maintaining their own equipment anddevelop employee pride in keeping their machines in top conditions. Doing even simplemaintenance tasks goes a long way toward improving machine performance, though.The KANBAN System
One of the most publicized aspects of JIT systems is the Kanban system developed byToyota. Kanban, meaning “card” or “visible card” in Japanese, refers to cards used to control theflow of production through a factory.Working of KANBAN system
A card is attached to each container of items that have been produced. The container holds a given percentage of the daily requirements for an item.
Technology & Operation Management | sarojpandey.com.np 79
When user of the parts empties the container, the card is removed from thecontainer and put on the receiving post. The empty container is taken in the storage area. The card signals the need to produce another container of the part. When the container has been refilled, the card is put on the container, which is thenreturned to a storage area. The cycle begins again when the user of the parts retrieves the container with thecard attached.
General Operating RulesThe operating rules for the single-card system are simple and are designed to facilitate theflow of materials, while maintaining control of inventory levels. Each container must have a card. The assembly line always withdraws materials from the fabrication cell. Thefabrication cell never pushes parts to the assembly line because, sooner or later,parts will be supplied that are not yet needed for production. Containers of parts must never be removed from a storage area without a kanbanfirst being posted on the receiving post. The containers should always contain same number of good parts. The use ofnonstandard containers or irregularly filled containers disrupts the production flowof the assembly line. Only non-defective parts should be passed along to the assembly line to make thebest use of materials and worker’s time. Total production should not exceed the total amount authorized on the kanban inthe system.