technologies for urban transport filepkm (w.r.t to a gasoline engine) ** 70-80% lower 11-22% lower...
TRANSCRIPT

General rights Copyright and moral rights for the publications made accessible in the public portal are retained by the authors and/or other copyright owners and it is a condition of accessing publications that users recognise and abide by the legal requirements associated with these rights.
• Users may download and print one copy of any publication from the public portal for the purpose of private study or research. • You may not further distribute the material or use it for any profit-making activity or commercial gain • You may freely distribute the URL identifying the publication in the public portal
If you believe that this document breaches copyright please contact us providing details, and we will remove access to the work immediately and investigate your claim.
Downloaded from orbit.dtu.dk on: Dec 19, 2017
Technologies for Urban Transport
Dhar, Subash; Shukla, P.R.
Publication date:2013
Link back to DTU Orbit
Citation (APA):Dhar, S., & Shukla, P. R. (2013). Technologies for Urban Transport [Sound/Visual production (digital)].Experience Sharing Workshop in preparation of Low-carbon Comprehensive Mobility Plans in Indian Cities,Udaipur, India, 22/08/2013
Technologies for Urban Transport
Experience Sharing Workshop on Low Carbon Comprehensive Mobility Plans in India
22 23 August, 2013Udaipur
P.R. ShuklaIndian Institute of ManagementAhmedabad, India
Subash DharUNEP Risø CentreRoskilde, Denmark

Contents
1. Trends of technological change2. Scenarios : National 3. Conclusions

Trends for technological change

Motorisation
• India has very low motorisation but is increasing • At similar income levels of motorisation can be different
Data Source: World Bank

Average Fuel Economy – Cross Country
120
140
160
180
200
220
240
Tested
Fue
l econo
my (gCO
2/km
)
2005
2008
5.2
6.0
6.9
7.8
8.6
9.5
10.3
India
Portugal
Italy
Malta
France
Japan
Belgium
Poland
Spain
Czech Re
public
Hung
ary
Sloven
iaRo
mania
Slovakia
Austria
EU‐27
Denm
ark
Ireland
Greece
Indo
nesia
Turkey
Luxembo
urg
Brazil
Egypt
UK
Netherla
nds
Cyprus
Mexico
Germ
any
Chile
Argentina
Malaysia
South Afric
aFinlan
dCh
ina
Ukraine
Estonia
Lithua
nia
Latvia
Russia
Thailand
Sweden
USA
Australia
Tested
Feu
l Econo
my (lge/10
0km)
Registrations
1 million
10 millions
Source : Cuenot, F., and L. Fulton. 2011. International comparison of light-duty vehicle fuel economy and related characteristics. OECD/IEA, Paris.

Technology Options

Scenarios : National
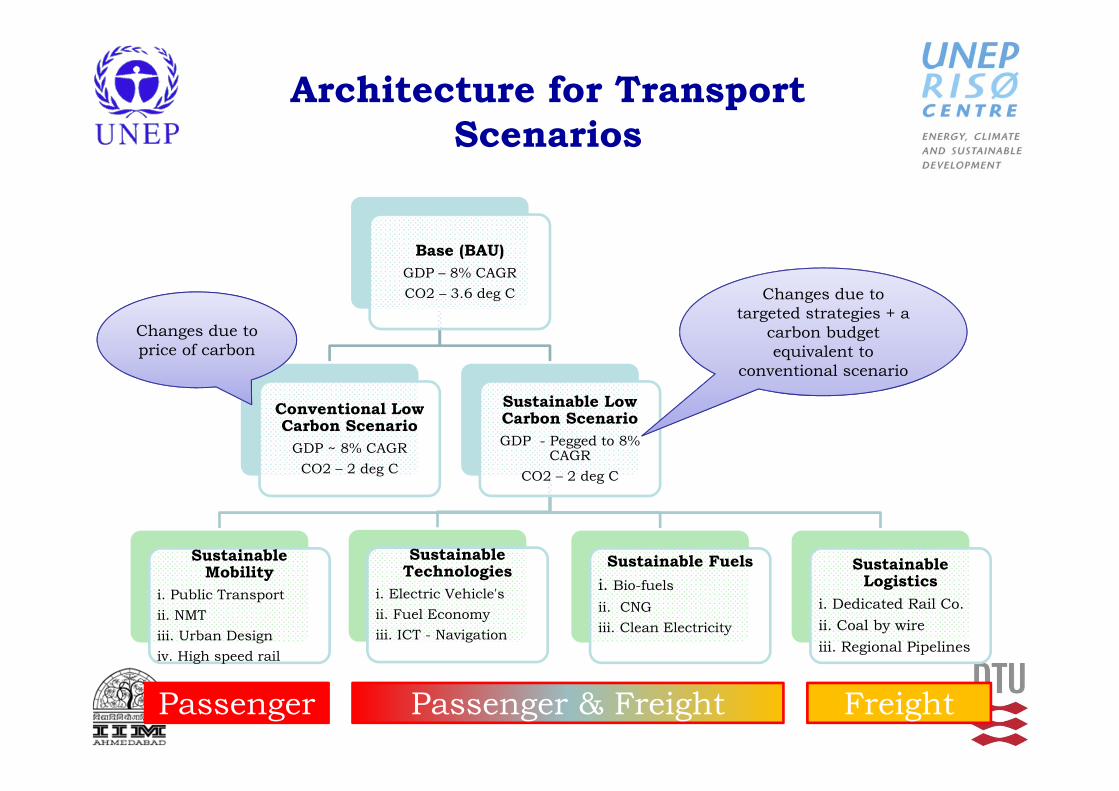
Architecture for Transport Scenarios
Base (BAU)GDP – 8% CAGRCO2 – 3.6 deg C
Conventional Low Carbon Scenario
GDP ~ 8% CAGRCO2 – 2 deg C
Sustainable Low Carbon ScenarioGDP - Pegged to 8%
CAGRCO2 – 2 deg C
Sustainable Mobility
i. Public Transport ii. NMTiii. Urban Designiv. High speed rail
Sustainable Technologies
i. Electric Vehicle'sii. Fuel Economyiii. ICT - Navigation
Sustainable Fuelsi. Bio-fuelsii. CNGiii. Clean Electricity
Sustainable Logistics
i. Dedicated Rail Co.ii. Coal by wireiii. Regional Pipelines
Changes due to price of carbon
Changes due to targeted strategies + a
carbon budget equivalent to
conventional scenario
Passenger FreightPassenger & Freight

Emission Identity

Mass Transit Options
Bus Rapid Transit Light Rail system Metro
Capacity (passengers per line in one hour)
10,000 to 20,000 (Sometimes going to 40,000 Bogota
BRT)
10,000 to 20,000 12,000 - 45,000 (Sometimes going
upto to 80,000 Hong Kong Metro)
Costs (Million USD per km of length)**
5 to 27 13 to 40 27 to 330
Existing Networks in 2011**(km)
2139 15000 10000
CO2 per passenger **(gCO2/pkm)
14 to 22 4 to 22 3 to 21
Typical Fuel Diesel Electricity Electricity
** Data from IEA, 2012 Energy Technology Perspectives 2012
• Wide diversity in costs and emission reduction potentials• Electricity based options become attractive in low carbon scenarios

Alternative Drive Train Technologies
Battery Electric vehicles
Hybrid Gasoline
Plug in Hybrids
Fuel Cells
Drive Range 100 - 160 km for cars, 60 km for 2 wheelers
Same as gasoline cars
20 - 50 km on battery alone, remaining using ICE
Same as gasoline cars
Drive Train Electric Motor Internal Combustion Engine
ICE, Electric Motor
Fuel Cell, Electric Motor
Existing Vehicles 120 Million Electric 2 wheelers in China,
More than 5.8 million vehicles globally sold till end of 2012
Few hundred globally
Energy consumption per pkm (w.r.t to a Gasoline engine) **
70-80% lower 11-22% lower 20-60% lower 55% - 70% lower
Typical Fuel Electricity Electricity / Gasoline /Diesel
Electricity / Gasoline /Diesel
Hydrogen
** IEA, 2009 Transport Energy & CO2; Kobayachi et. al., 2009 Energy efficiency technologies for road11 vehicles. Energy Efficiency 2, 125–137; Plotkin et. al., 2009 Multi‐path transportation futures study : vehicle12 characterization and scenario analyses

Scenario storylines: Fuel Economy
• BAU Storyline - Fuel economy standards for 2015 and 2020 announced by BEE are implemented by the government.
• Increasing incomes mean that an increasing weightage for safety, reliability and comfort from car buyers.
• Increasing preference for medium size cars
• Fuel Economy storyline– The vision of 4 lit / 100
km in 2030 according to GFEI. The efficiencies can not be delivered by conventional drive train technologies and rather it is technologies such as hybrids which would be required for this scenario especially if vehicle weights increase. The improvements in engine technologies for cars also diffuse into 2 wheelers and buses

Fuel Efficiency: BAU and Fuel Economy
‐
1.0
2.0
3.0
4.0
5.0
6.0
7.0
2010 2015 2020 2025 2030 2035 2040 2045 2050
Fuel Economy (Cars)(lit gasoline / 100 km)
BAU Fuel Economy 3.0
4.0
5.0
6.0
7.0
8.0
9.0
600 800 1000 1200 1400 1600 1800 2000
Corporate Average
Fue
l Con
sumption (litres
(petrol)/
100
km)
CAFC Standards 2015 and 2020
CAFC 2015
CAFC 2020

CO2 Emissions transport: BAU & BAU + Fuel Economy
(*) Natural Gas emissions include both emissions from energy and fugitive emissions
Emission Intensity of Grid (Million tCO2/GWh)
Scenario 2010 2020 2030 2040 2050
Base Case 0.99 0.94 0.86 0.74 0.69
Cumulative reductions between 2010 and 2050 are 1,696 Million tonnes

Fuel Mix: BAU & LCS

Mitigation Wedges : Transport

Conclusions
1. Fuel Economy can deliver mitigation plus co-benefits for environment and energy security
2. Cleaning of electricity is crucial for a low carbon transport
3. Bio fuels are essential for a low carbon strategy

Thank You
Questions / Suggestions