techniques in scalable and effective performance analysis thesis defense - 11/10/2009 by chee wai...
TRANSCRIPT
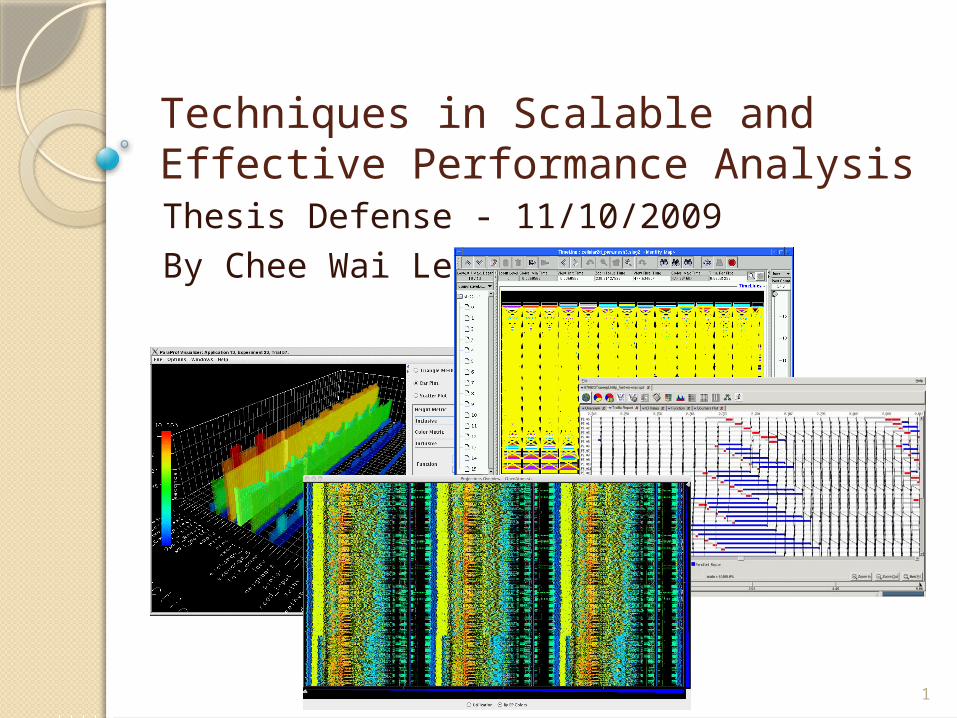
Techniques in Scalable and Effective Performance AnalysisThesis Defense - 11/10/2009By Chee Wai Lee
1
2
OverviewIntroduction.Scalable Techniques:
◦Support for Analysis Idioms◦Data Reduction◦Live Streaming◦Hypothesis Testing
Conclusion.
3
Introduction
What does performance analysis of applications with visual tools entail?
What are the effects of application scaling on performance analysis?
4
Effects of Application ScalingEnlarged performance-space.
Increased performance data volume.
Reduces accessibility to machines and increases resource costs◦Time to queue.◦CPU resource consumption.
5
Main ThrustsTool feature support for Scalable
Analysis Idioms.Online reduction of performance
data volume.Analysis Idioms for applications
through live performance streaming.
Effective repeated performance hypothesis testing through simulation.
6
Main ThrustsTool feature support for Scalable
Analysis Idioms.Online reduction of performance
data volume.Analysis Idioms for applications
through live performance streaming.
Effective repeated performance hypothesis testing through simulation.
7
Scalable Tool Features: Motivations
Performance analysis idioms need to be effectively supported by tool features.
Idioms must avoid using tool features that become ineffectual at large processor counts.
We want to catalog common idioms and match these with scalable features.
8
Scalable Tool Feature Support (1/2)
Non-scalable tool features require analysts to scan for visual cues over the processor domain.
How do we avoid this requirement on analysts?
9
Scalable Tool Feature Support (2/2)
Aggregation across processor domain:◦Histograms.◦High resolution Time Profiles.
Processor selection:◦Extrema Tool.
10
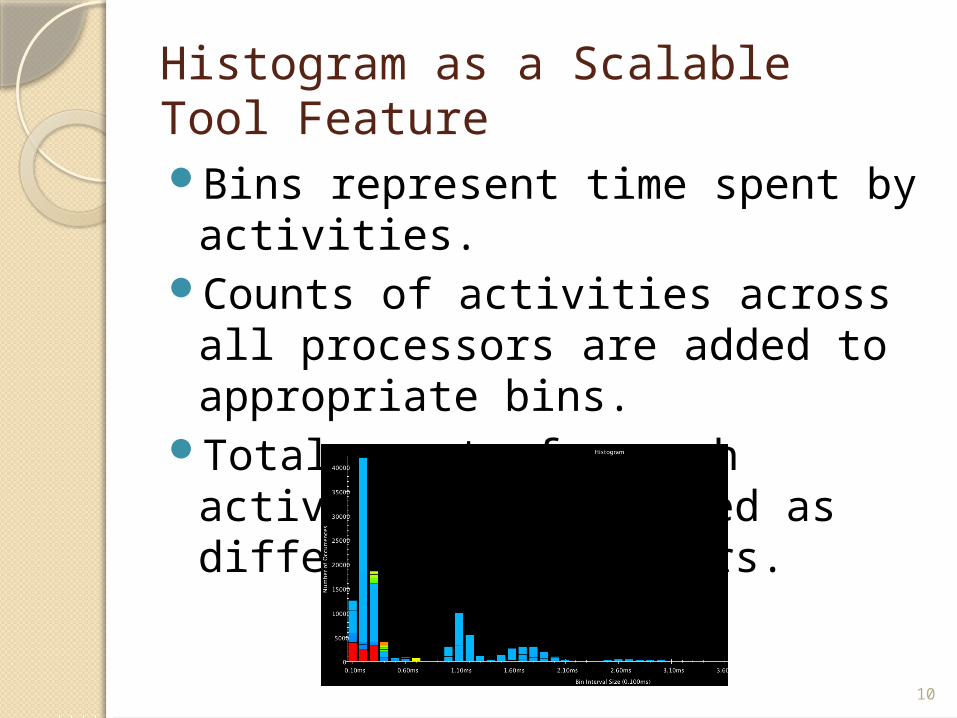
Histogram as a Scalable Tool FeatureBins represent time spent by
activities.Counts of activities across all
processors are added to appropriate bins.
Total counts for each activity are displayed as different colored bars.
11
Case Study: Apparent load imbalance.No strategy appeared to solve
imbalance.Picked overloaded processor
timelines.*Found longer-than-expected activities.Longer activities associated with
specific objects.Possible work grainsize distribution
problems.*As we will see later, not effective with large numbers of processors.
12
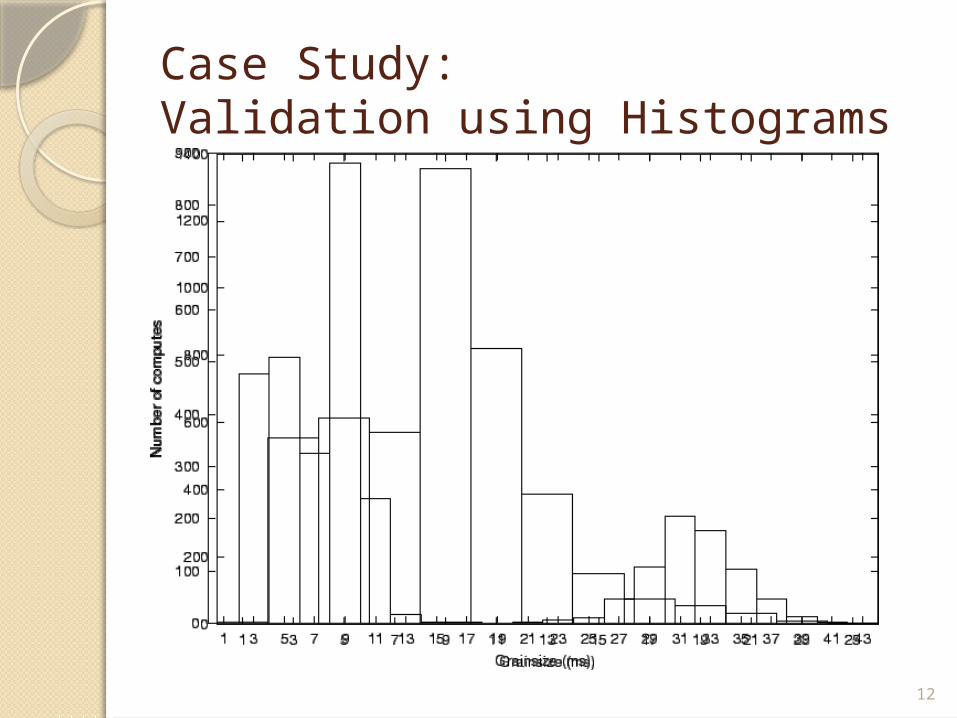
Case Study:Validation using Histograms
13
Effectiveness of IdiomNeed to find way to pick out
overloaded processors. Not scalable!
Finding out if work grainsize was a problem simply required the histogram feature.
14
High Resolution Time ProfilesShows activity-overlap over time
summed across all processors.Heuristics guide the search for visual
cues for various potential problems:◦Gradual downward slopes hint at possible
load imbalance.◦Gradual upward slopes hint at
communication inefficiencies.At high resolution, gives insight into
application sub-structure.
16
Finding Extreme or Unusual Processors
A recurring theme in analysis idioms.
Easy to pick out timelines in datasets with small numbers of processors.
Examples of attributes and criteria:◦Least idle processors.◦Processors with late events.◦Processors that behave very
differently from the rest.
17
The Extrema Tool
Semi-automatically picks out interesting processors to display.
Decisions based on analyst-specified criteria.
Mouse-clicks on bars load interesting processors onto timeline.
19
Scalable Tool Features: Conclusions
Effective analysis idioms must avoid non-scalable features.
Histograms, Time Profiles and the Extrema Tool offer scalable features in support of idioms.
20
Main ThrustsTool feature support for Scalable
Analysis Idioms.Online reduction of performance
data volume.Analysis Idioms for applications
through live performance streaming.
Effective repeated performance hypothesis testing through simulation.
21
Data ReductionNormally, scalable tool features
are used with full event traces.What happens if full event traces
get too large?We can:
◦Choose to keep event traces for only a subset of processors.
◦Replace event traces of discarded processors with interval-based profiles.
23
Choosing Useful Processor Subset (1/2)
What are the challenges?◦No a priori information about
performance problems in dataset.◦Chosen processors need to capture
details of performance problems.
24
Choosing Useful Processor Subsets (2/2)
Observations:◦Processors tend to form equivalence
classes with respect to performance behavior.
◦Clustering can be used to discover equivalence classes in performance data.
◦Outliers in clusters may be good candidates for capturing performance problems.
25
Applying k-Means Clustering to Performance Data (1/2)
k-Means Clustering algorithm is commonly used to classify objects in data mining applications.
Treat the vector of recorded performance metric values on each processor as a data point for clustering.
26
Applying k-Means Clustering to Performance Data (2/2)
Measure similarity between two data points using the Euclidean Distance between the two metric vectors.
Given k clusters to be found, the goal is to minimize similarity values between all data points and the centroids of the k clusters.
27
Choosing from ClustersChoosing Cluster Outliers.
◦Pick processors furthest from cluster centroid.
◦Number chosen by proportion of cluster size.
Choosing Cluster Exemplars.◦Pick a single processor closest to the
cluster centroid.Outliers + Exemplars = Reduced
Dataset.
28
Applying k-Means Clustering Online
Decisions on data retention are made before data is written to disk.
Requires a low-overhead and scalable parallel k-Means algorithm which was implemented.
30
Important k-Means ParametersChoice of metrics from domains:
◦Activity time.◦Communication volume (bytes).◦Communication (number of
messages).
Normalization of metrics:◦Same metric domain = no
normalization.◦Min-max normalization across
different metric domains to remove inter-domain bias.
34
Evaluating the techniqueClustering and choice heuristics
presented us with a reduced dataset.
How useful is the reduced dataset to analysis?
We know least-idle processors can be useful for analysis.
How many top least-idle processors will show up in the reduced dataset?
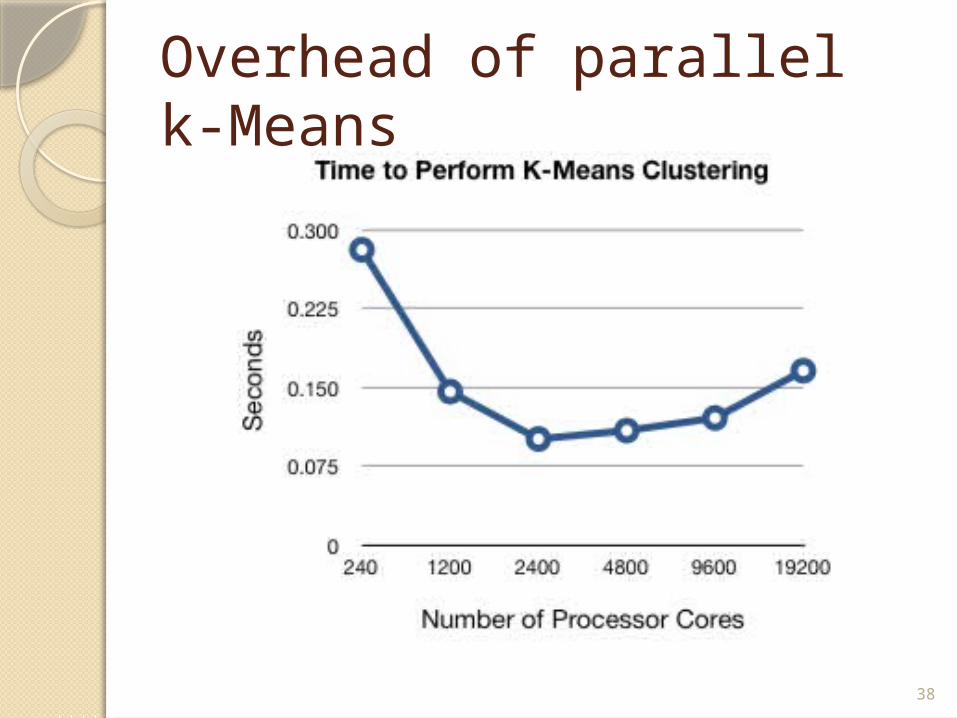
What was the overhead?
35
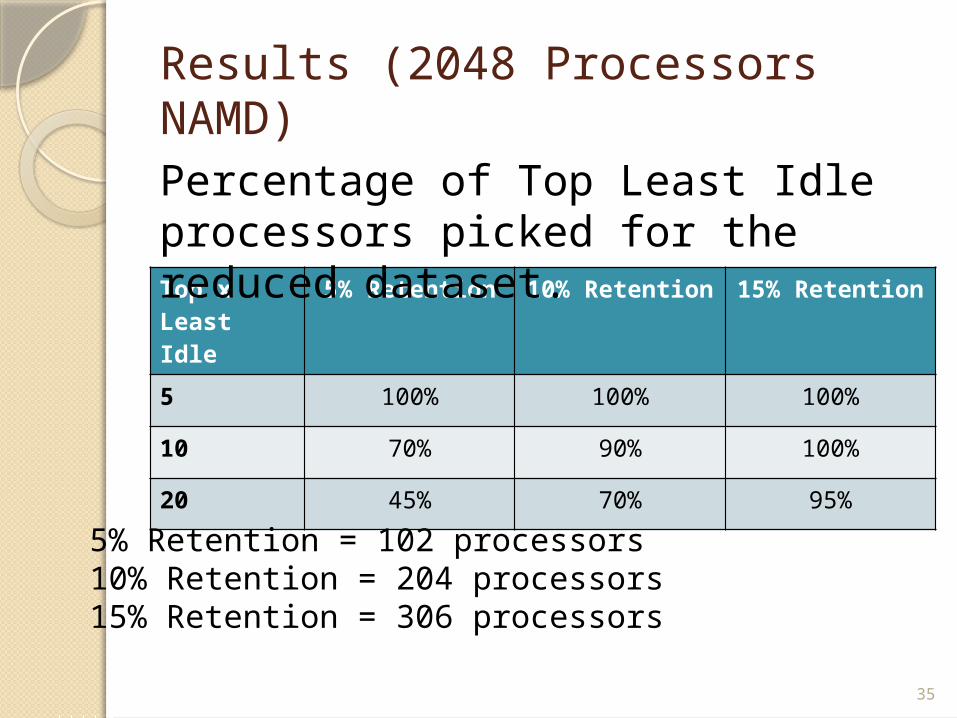
Results (2048 Processors NAMD)
Top x Least Idle
5% Retention 10% Retention
15% Retention
5 100% 100% 100%
10 70% 90% 100%
20 45% 70% 95%
5% Retention = 102 processors10% Retention = 204 processors15% Retention = 306 processors
Percentage of Top Least Idle processors picked for the reduced dataset.
38
Overhead of parallel k-Means
39
Data Reduction: ConclusionsShowed combination of techniques for
online data reduction is effective*.Choice of processors included in
reduced datasets can be refined and improved◦Include communicating processors.◦Include processors on critical path.
Consideration of application phases can further improve quality of reduced dataset.
*Chee Wai Lee, Celso Mendes and Laxmikant V. Kale. Towards Scalable Performance Analysis and Visualization through Data Reduction. 13th International Workshop on High-Level Parallel Programming Models and Supportive Environments, Miami, Florida, USA, April 2008.
40
Main ThrustsTool feature support for Scalable
Analysis Idioms.Online reduction of performance
data volume.Analysis Idioms for applications
through live performance streaming.
Effective repeated performance hypothesis testing through simulation.
41
Live Streaming of Performance DataLive Streaming mitigates need to
store a large volume of performance data.
Live Streaming enables analysis idioms that provide animated insight into the trends application behavior.
Live Streaming also enables idioms for the observation of unanticipated problems, possibly over a long run.
42
Challenges to Live StreamingMust maintain low overhead for
performance data to be recorded, pre-processed and disposed-of.
Need efficient mechanism for performance data to be sent via out-of-band channels to one (or a few) processors for delivery to a remote client.
43
Enabling MechanismsCharm++ adaptive runtime as
medium for scalable and efficient:◦Control signal delivery.◦Performance data capture and
delivery.Converse Client-Server (CCS)
enables remote interaction with running Charm++ application through a socket opened by the runtime.
45
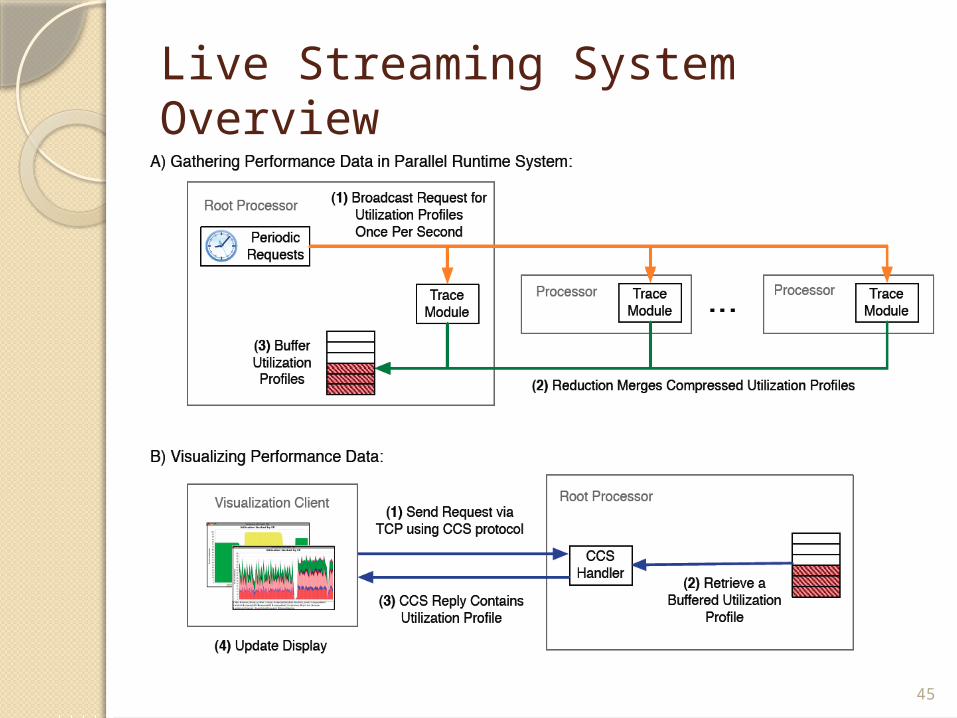
Live Streaming System Overview
48
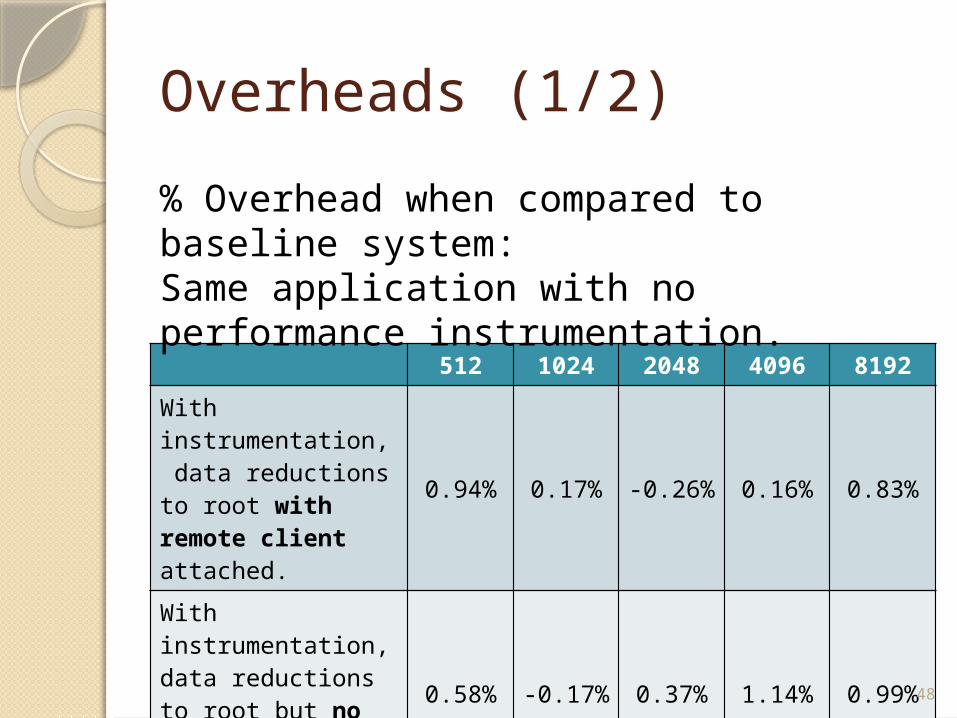
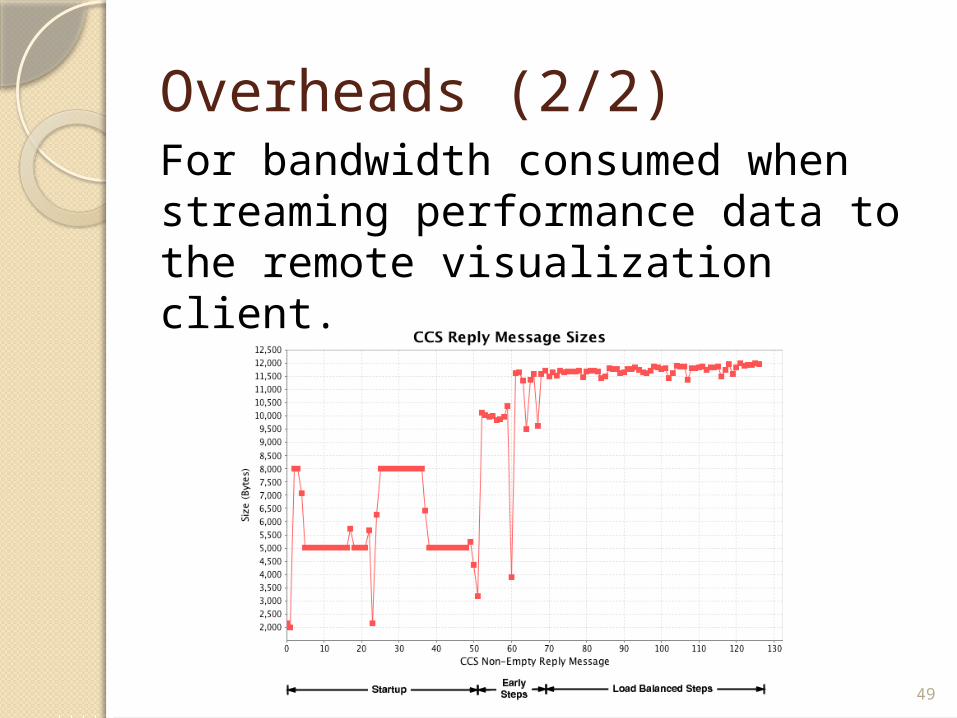
Overheads (1/2)
512 1024 2048 4096 8192
With instrumentation, data reductions to root with remote client attached.
0.94% 0.17% -0.26% 0.16% 0.83%
With instrumentation, data reductions to root but no remote client attached.
0.58% -0.17% 0.37% 1.14% 0.99%
% Overhead when compared to baseline system:Same application with no performance instrumentation.
49
Overheads (2/2)For bandwidth consumed when streaming performance data to the remote visualization client.
50
Live Streaming: Conclusions*Adaptive runtime allowed out-of-
band collection of performance data while in user-space.
Achieved with very low overhead and bandwidth requirements.
*Isaac Dooley, Chee Wai Lee, and Laxmikant V. Kale. Continuous Performance Monitoring for Large-Scale Parallel Applications. Accepted for publication at HiPC 2009, December-2009.
51
Main ThrustsTool feature support for Scalable
Analysis Idioms.Online reduction of performance
data volume.Analysis Idioms for long-running
applications through live performance streaming.
Effective repeated performance hypothesis testing through simulation.
52
Repeated Large-Scale Hypothesis Testing
Large-Scale runs are expensive:◦Job submission of very wide jobs to
supercomputing facilities.◦CPU resources consumed by very
wide jobs.
How do we make repeated but inexpensive hypothesis testing experiments?
53
Trace-based Simulation
Capture event dependency logs from a baseline application run.
Simulation produces performance event traces from event dependency logs.
54
AdvantagesThe time and memory requirements
at simulation time are divorced from requirements at execution time.
Simulation can be executed on fewer processors.
Simulation can be executed on a cluster of workstations and still produce the same predictions.
55
Using the BigSim Framework (1/2)BigSim emulator captures:
◦Relative event time stamps.◦Message dependencies.◦Event dependencies.
BigSim emulator produces event dependency logs.
56
Using the BigSim Framework (2/2)
BigSim simulator uses a PDES engine to process event dependency logs to predict performance.
BigSim simulator can generate performance event traces based on the predicted run.
57
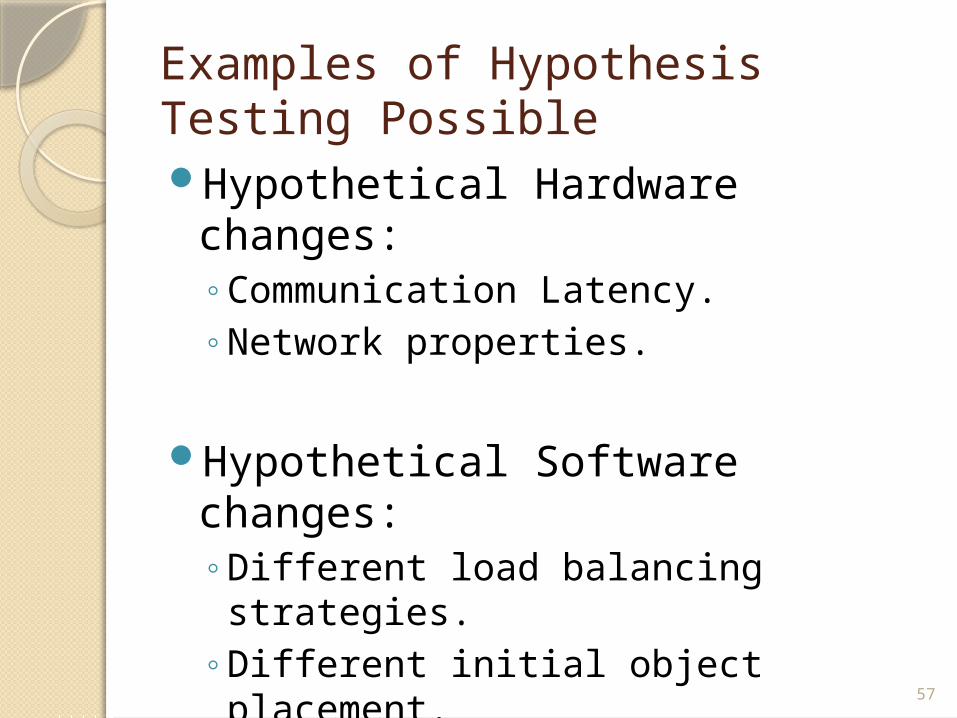
Examples of Hypothesis Testing PossibleHypothetical Hardware changes:
◦Communication Latency.◦Network properties.
Hypothetical Software changes:◦Different load balancing strategies.◦Different initial object placement.◦Different number of processors with
the same object decomposition.
58
Example: Discovering Latency Trends
Study the effects of network latency on performance of seven-point stencil computation.
59
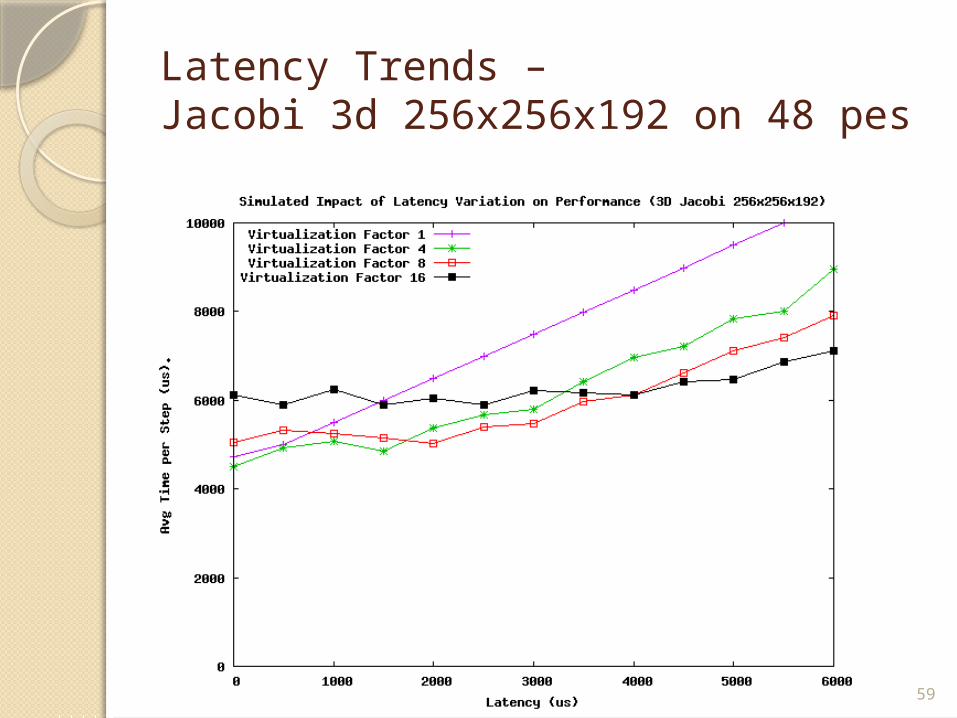
Latency Trends –Jacobi 3d 256x256x192 on 48 pes
60
Testing DifferentLoad Balancing Strategies (1/2)
Load Balancing Strategies make decisions as object-to-processor maps based on object load and inter-object communication costs.
How do we make the simulator produce predictions about new load balancing strategies without re-executing the original code?
61
Testing Different Load Balancing Strategies (2/2)
Record object-load and communication information of baseline run.
Different Load Balancing strategies create different object-to-processor maps.
A log transformation tool I wrote, transforms event dependency logs to reflect new object-to-processor mapping.
62
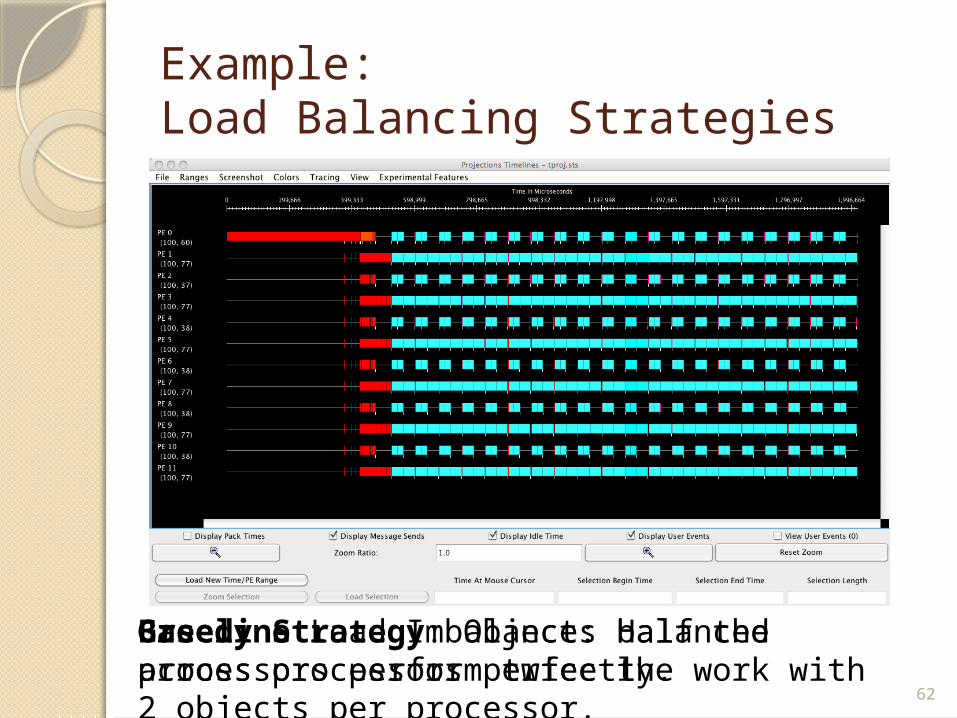
Example:Load Balancing Strategies
Baseline Load Imbalance: Half the processors perform twice the work with 2 objects per processor.
Greedy Strategy: Objects balanced across processors perfectly.
64
Hypothesis Testing: ConclusionsFlexible repeated performance
hypothesis testing can be achieved via trace-based simulation.
No analytical models need to be constructed for each application to enable software changes such as load balancing strategies.
65
Extending Scalability TechniquesCan the techniques described in this
thesis be adopted by other tools quickly?
This was investigated through the results of a collaboration with the TAU group*.
Flexible Performance call-back interface in Charm++ enabled an easy mechanism for a popular tool like TAU to record and process key runtime and application events.*Scott Biersdorff, Chee Wai Lee, Allen D. Malony and Laximkant V.
Kale. Integrated Performance Views in Charm++: Projections Meets TAU. ICPP-2009, Vienna, Austria, September 22-25, 2009.
66
Benefits of Extension of CapabilitiesScalable TAU tools features can
be used to grant different performance insights into Charm++ applications.
TAU can make use of the adaptive runtime for live streaming of TAU data.
TAU can make use of BigSim for repeated hypothesis testing.
67
Thesis Contributions (1/2)Identified and developed scalable tool
feature support for performance analysis idioms.
Showed the combination of techniques and heuristics effective for data reduction.
Showed how an adaptive runtime can efficiently stream live performance data out-of-band in user-space to enable powerful analysis idioms.
68
Thesis Contributions (2/2)Showed trace-based simulation
to be an effective method for repeated hardware and software hypothesis testing.
Highlighted importance of flexible performance frameworks for the extension of scalability features to other tools.