1 scalable collaborative filtering with jointly derived neighborhood interpolation weights robert m....
TRANSCRIPT

1
Scalable Collaborative Filtering with Jointly Derived Neighborhood Interpolation Weights
Robert M. Bell and
Yehuda KorenSpeaker: Ming Wai <- Supervisor: Nikos Mamoulis

2
Outline Introduction to CF Netflix Prize BellKor
Remove Global Effect Correlation Experiment
BellKor more

3
Motivation
Personalized Recommandation
Non-personalize example: Reviewer Movie review
Book review
Food review
4
Collaborative Filtering Opinions from Similar friends
How to capture the preferences of people? How to measure Similarity? How to make a prediction?

5
User-Item Matrix
v1 gave j3 rating 3
j1 j2 j3 j4 j5 i
u 1 2 3 4 5 ?
v1 1 2 3 4 5 5
v2 5 4 3 2 1 1User profile
6
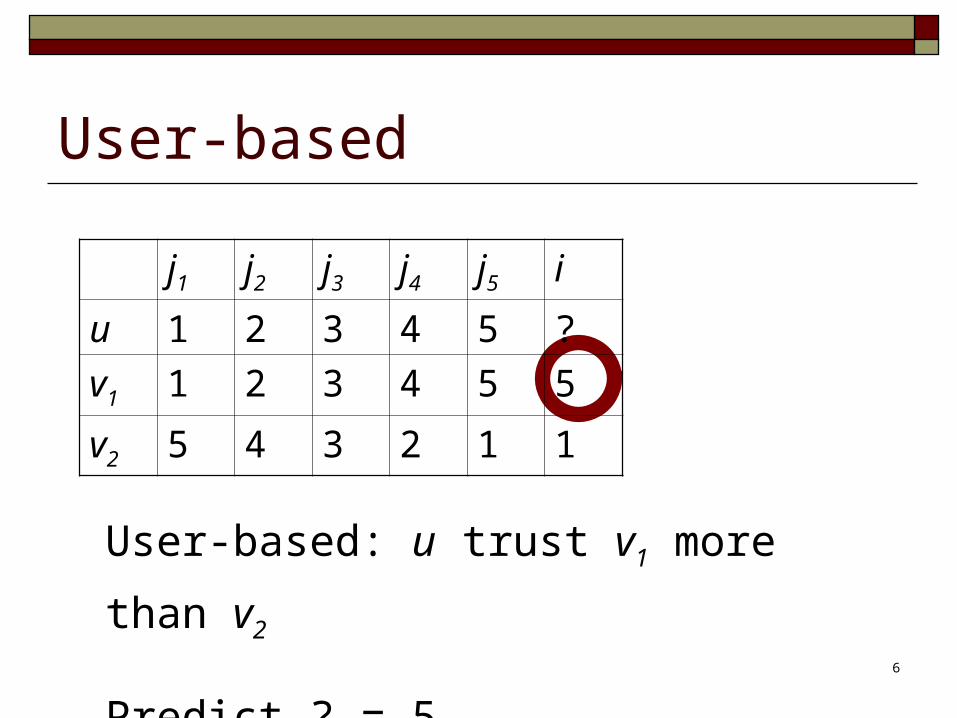
User-based
User-based: u trust v1 more than v2
Predict ? = 5
j1 j2 j3 j4 j5 i
u 1 2 3 4 5 ?
v1 1 2 3 4 5 5
v2 5 4 3 2 1 1
7
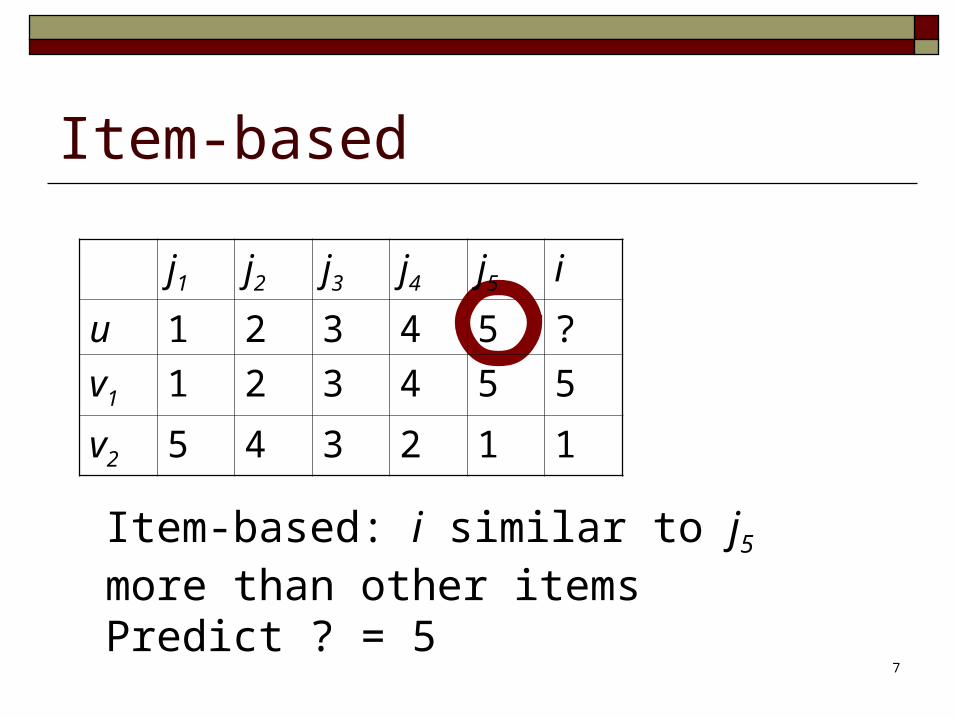
Item-based
Item-based: i similar to j5 more than other itemsPredict ? = 5
j1 j2 j3 j4 j5 i
u 1 2 3 4 5 ?
v1 1 2 3 4 5 5
v2 5 4 3 2 1 1
8
Matrix nature The matrix is incomplete
1-5% of the entries have values Most of the users rated small subset of items How many movies in IMDB did you watched? Many Rating on few Items
More users than items Number of audience >> Number of Music

9
More Realistic Matrix
j1 j2 j3 j4 j5 j6
v1 1 - - - - -
v2 - 2 - - 3 -
v3 - - 3 - 4 -
v4 3 - - - 5 -
v5 5 - - - 4 -
… … … … … … …Many users below

10
Similarity The most popular one in CF:
Pearson Correlation Coefficient
Set of Items rated by both u and v, or the intersection of the profiles of u and v
We can find sij as well

11
The following applies to any Similarity metric based on the intersection of profiles The set of items could be different for every pair
of users (the intersection) No triangle inequality (in extreme, u is similar to
v1, v2; but the intersection of v1 and v2 is empty)
Similarity nature
12
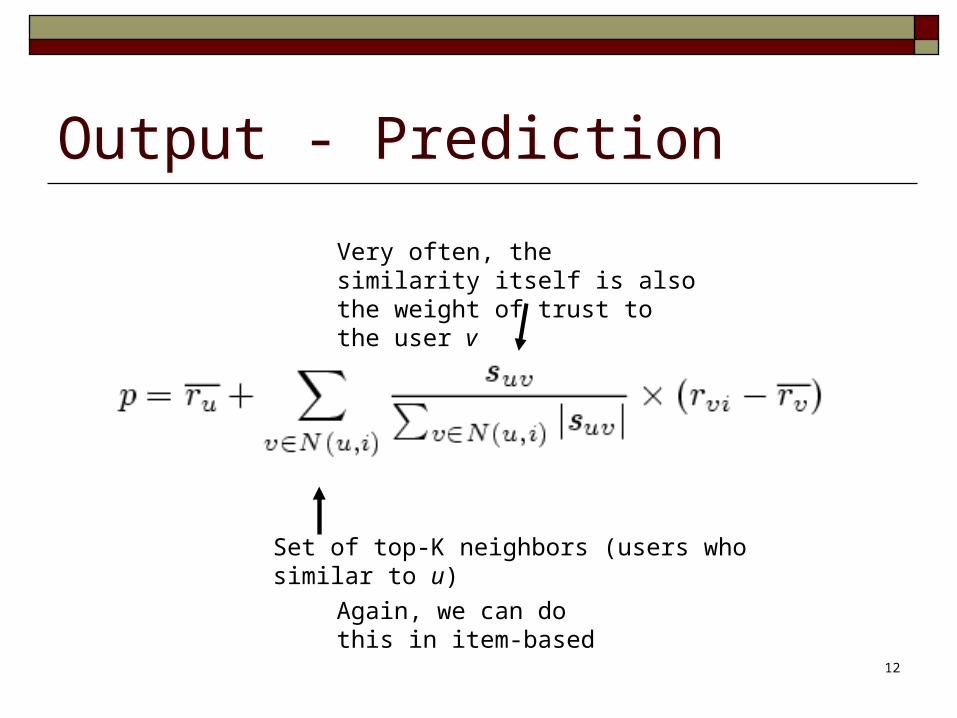
Output - Prediction
Set of top-K neighbors (users who similar to u)
Again, we can do this in item-based
Very often, the similarity itself is also the weight of trust to the user v

13
Systematic tendencies Accuracy of a prediction depends on
neighbors Systematic tendencies may be misleading,
and hence decreases the quality of neighbor E.g. Tendency of rating higher or lower than
normal Solution: Data Normalization
14
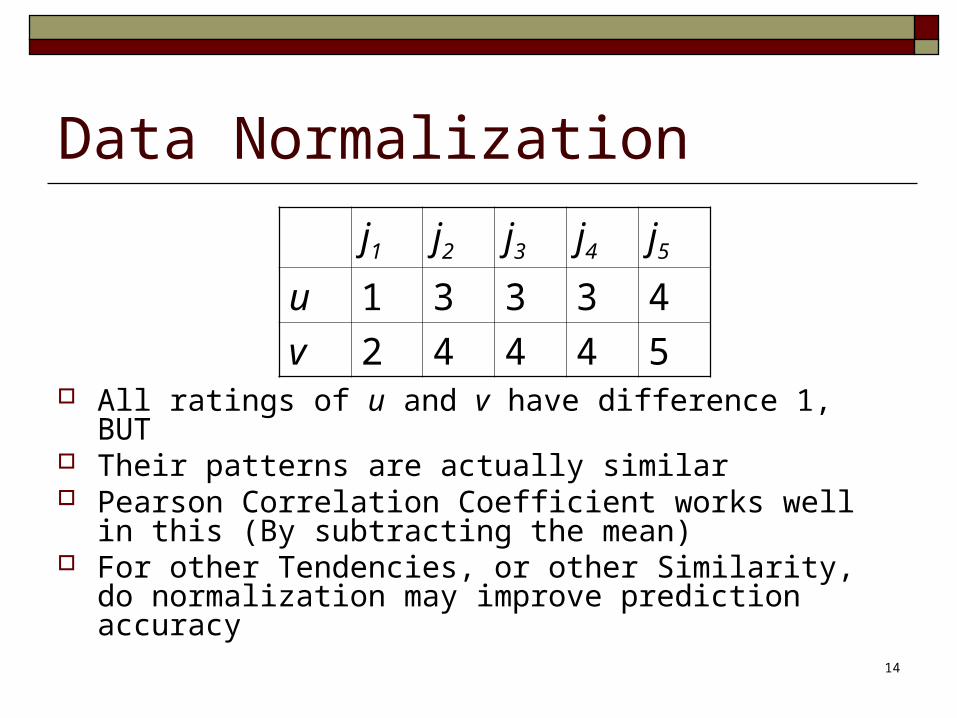
Data Normalization
All ratings of u and v have difference 1, BUT Their patterns are actually similar Pearson Correlation Coefficient works well in this
(By subtracting the mean) For other Tendencies, or other Similarity, do
normalization may improve prediction accuracy
j1 j2 j3 j4 j5
u 1 3 3 3 4
v 2 4 4 4 5
15
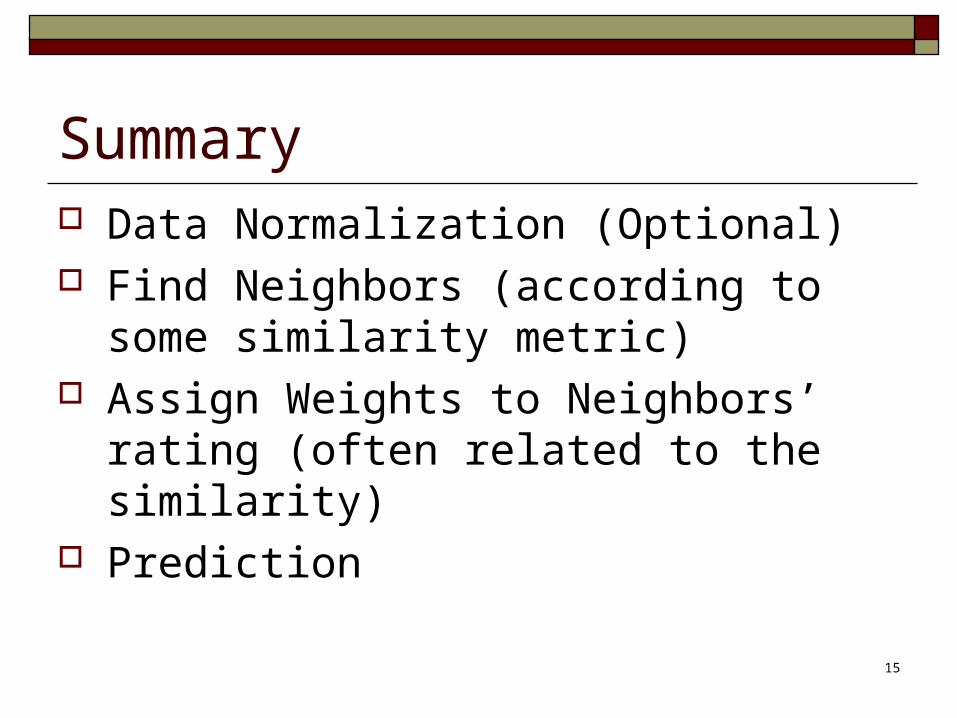
Summary Data Normalization (Optional) Find Neighbors (according to some similarity
metric) Assign Weights to Neighbors’ rating (often
related to the similarity) Prediction

16
Netflix Prize
Contest begins October 2, 2006 and continues through at least October 2, 2011. Contest is open to anyone, anywhere (except certain countries listed below).
You have to register to enter.
Once you register and agree to these Rules, you’ll have access to the Contest training data and qualifying test sets.
To qualify for the $1,000,000 Grand Prize, the accuracy of your submitted predictions on the
qualifying set must be at least 10% better than the accuracy Cinematch can achieve on the same training data set at the
start of the Contest.
To qualify for a year’s $50,000 Progress Prize the accuracy of any of your submitted predictions that
year must be less than or equal to the accuracy value established by the judges the preceding year.
To win and take home either prize, your qualifying submissions must have the largest accuracy improvement verified by the
Contest judges, you must share your method with (and non-exclusively license it to) Netflix, and you must describe to the world how you did it and
why it works.

17
Netflix Prize
Progress Prize
$50,000
obtain the largest accuracy improvement
in the year

18
RMSE

19
Netflix Prize - Progress Prize
BellKor
Winner of
Progress Prize 2007

20
Netflix Prize Data 480189 users 17770 movies 100 million ratings Probe set
some selected entries which we know the real rating we can test to see the accuracy of our algorithm
Quiz set Some selected entries which we DON’T know the real
rating Predict these entries well wins $1,000,000

21
Robert M. Bell and Yehuda Koren
Scalable Collaborative Filtering with Jointly
Derived Neighborhood Interpolation Weights

22
Bell and Koren's concerns
Similarity function
Example:
an item is predicted perfectly by a subset of items
(the authors think in item-based way)
The subset should take all weight
Impossible in Pearson
23
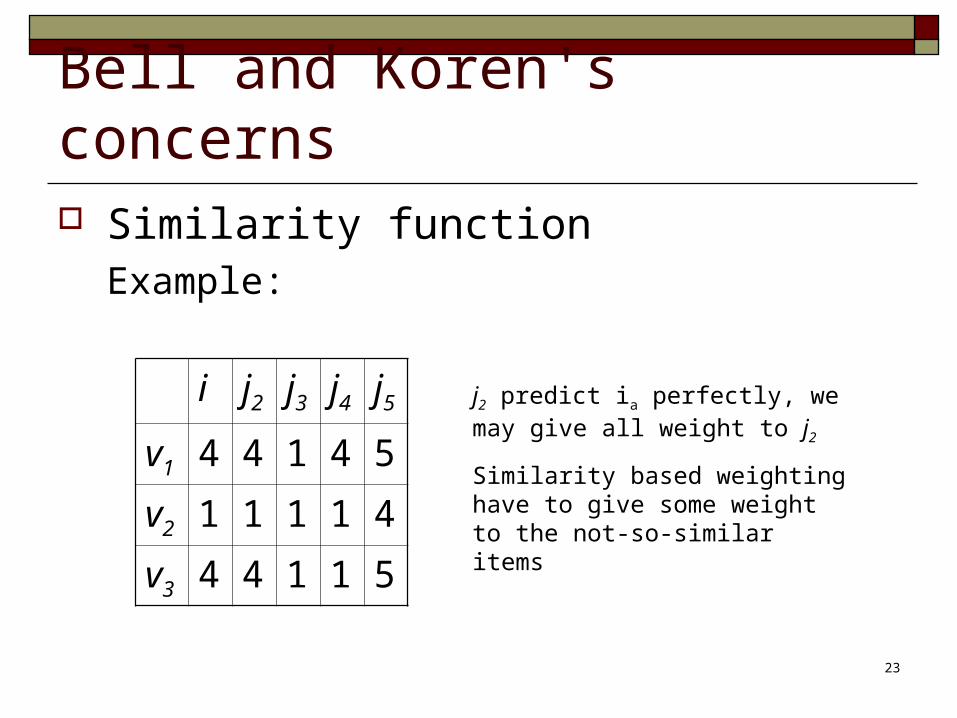
Bell and Koren's concerns Similarity function
Example:
i j2 j3 j4 j5
v1 4 4 1 4 5
v2 1 1 1 1 4
v3 4 4 1 1 5
j2 predict ia perfectly, we may give all weight to j2
Similarity based weighting have to give some weight to the not-so-similar items

24
Bell and Koren's concerns
Ignorence of interactions among neighbours
Example:
Lord of the Rings 1-3
Triple counting Lord of the Rings

25
Bell and Koren's concerns
Weights must sum to one If no good neighbor, the weights should be ignored
and predict by the mean
26
Global Effects
The tendencies
Example:
Harsh user tends to rated lower, and vise versa
The harshness may change over time

27
Global Effects u will be considered as more similar to v2 than
v3 after centering by subtracting the user mean
i1 i2 i3 i4 i5
u 3 3 4 5 3
v2 2 2 3 4 2
v3 3 3 3 3 3
i1 i2 i3 i4 i5
u -0.6 -0.6 0.4 1.4 -0.6
v2 -0.6 -0.6 0.4 1.4 -0.6
v3 0.0 0.0 0.0 0.0 0.0

28
Global Effects
Explanatory variable ResidualRating
Regression Coefficient
User effect
29
0
0.5
1
1.5
2
2.5
3
3.5
4
4.5
5
0 100 200 300 400 500 600
Support
Rating
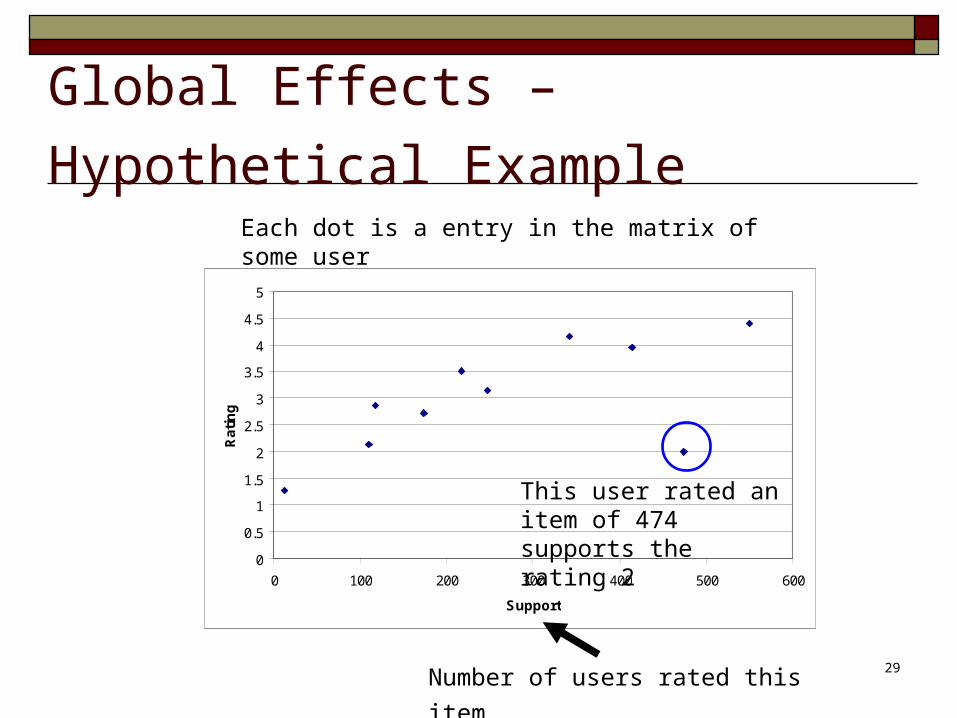
Global Effects – Hypothetical Example
Number of users rated this item
This user rated an item of 474 supports the rating 2
Each dot is a entry in the matrix of some user
30
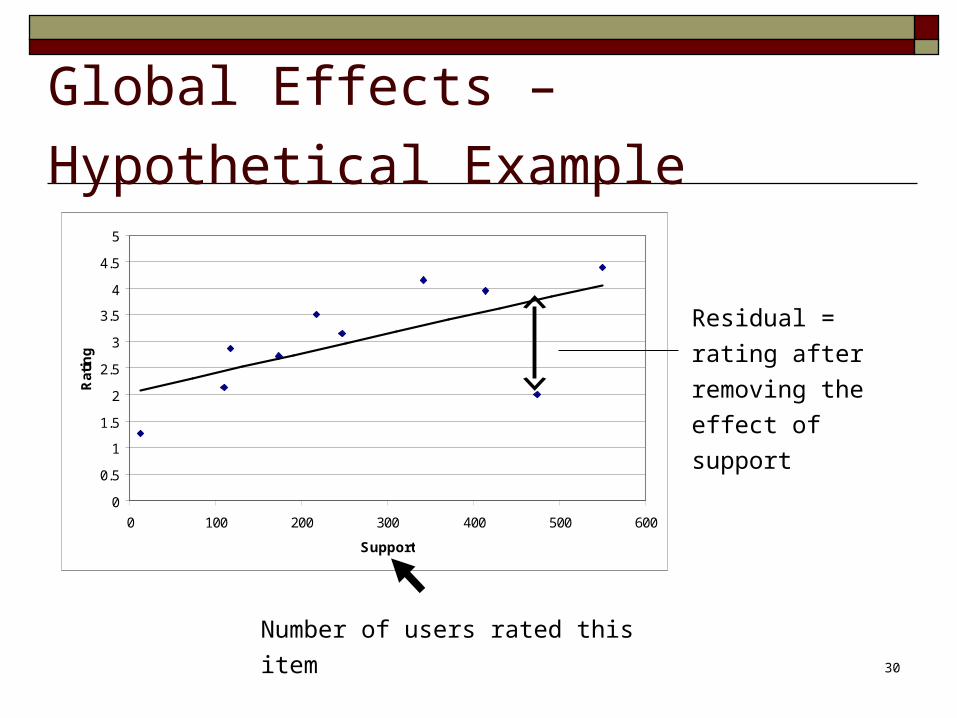
Global Effects – Hypothetical Example
Number of users rated this item
0
0.5
1
1.5
2
2.5
3
3.5
4
4.5
5
0 100 200 300 400 500 600
Support
Rating
Residual = rating
after removing the
effect of support

31
Global Effects
When considering the user effect, x's are 1 and
the result is essentially centering the data
among the user mean
Same in item effect
32
Global Effects
Time(user)1/2
Time(user) = (date of the rating - date of 1st rating)
Age of users
User's rating style may change over time
Time(movie)1/2

33
Global Effects
User x Movie Average
User x Movie Support (number of users rated
the movie)
How a user is affected by the popularity of the
movies
34
Global Effects
Movie x User Average
Movie x User Support
35
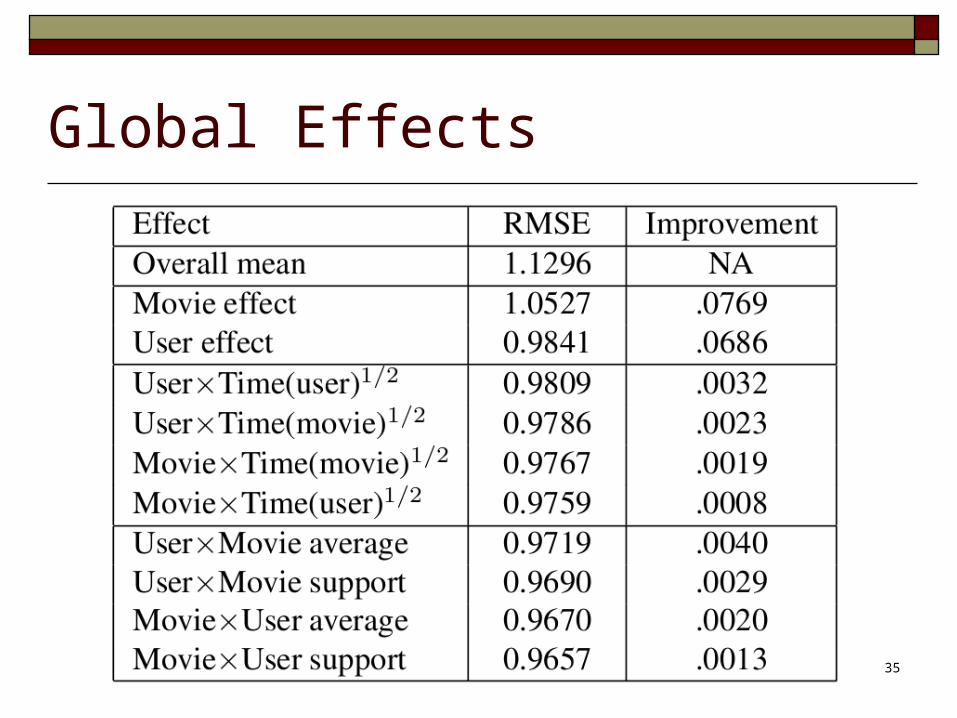
Global Effects
36
Neighbors
Item Neighors Item-based
K of the Items -> N(i; u)
K Items of highest Pearson Correlation
Coefficient

37
Predict from Neighbors
Weight (non Pearson)
38
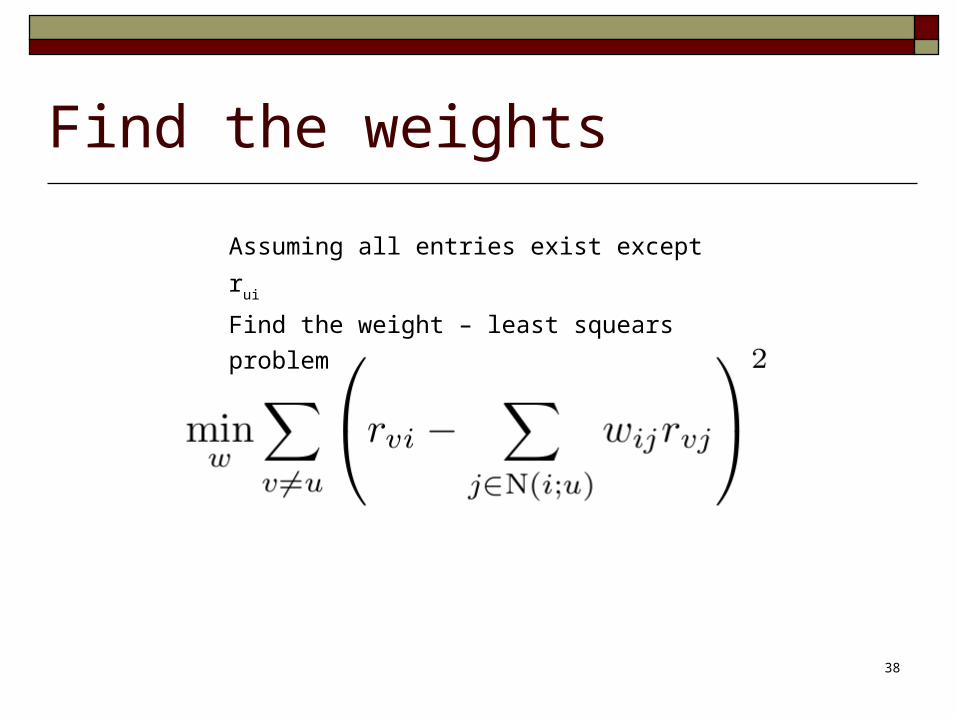
Find the weights
Assuming all entries exist except rui
Find the weight – least squears problem
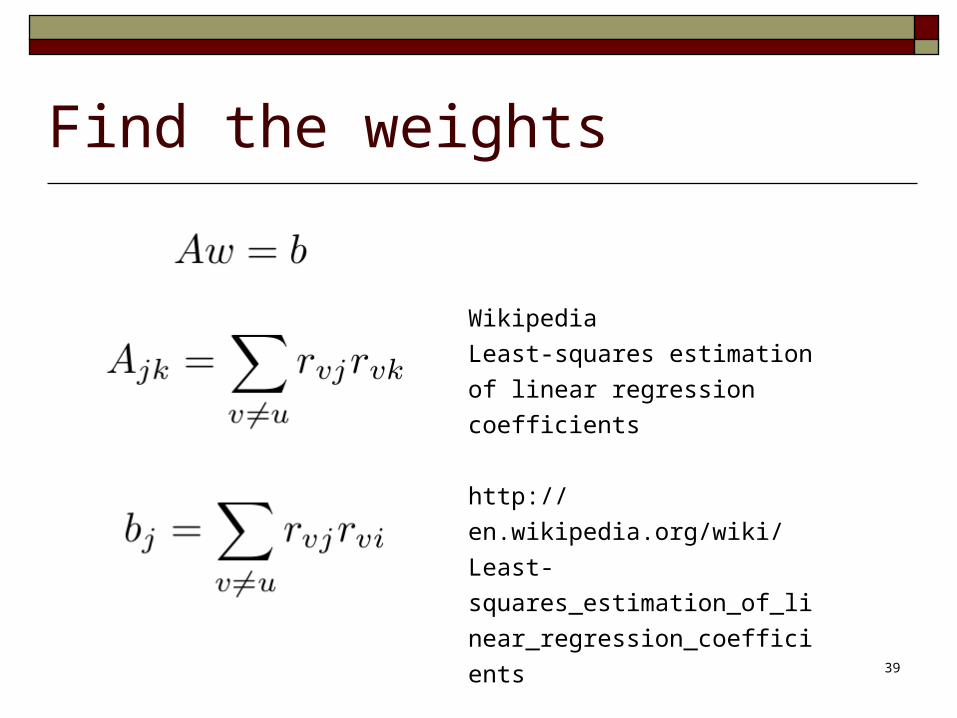
39
Find the weights
Wikipedia
Least-squares estimation of
linear regression coefficients
http://en.wikipedia.org/wiki/Least-
squares_estimation_of_linear_re
gression_coefficients

40
Find the weights
Matrix Entries may be missing
41
Experiment Netflix dataset 480189 users 17770 movies 100 million ratings (1.17%)
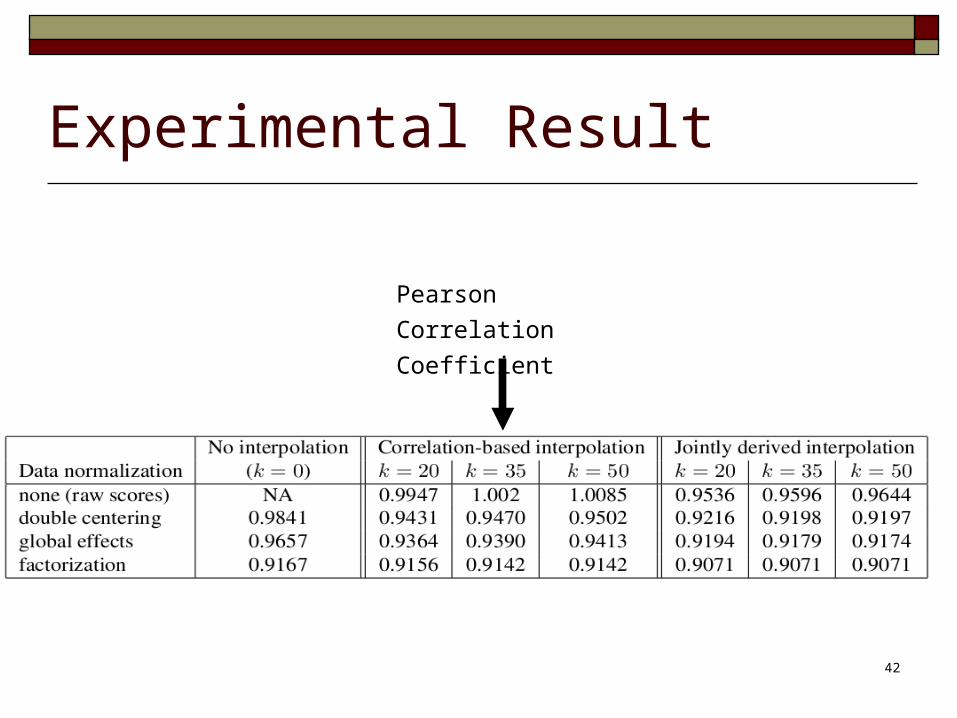
42
Experimental Result
Pearson Correlation
Coefficient
43
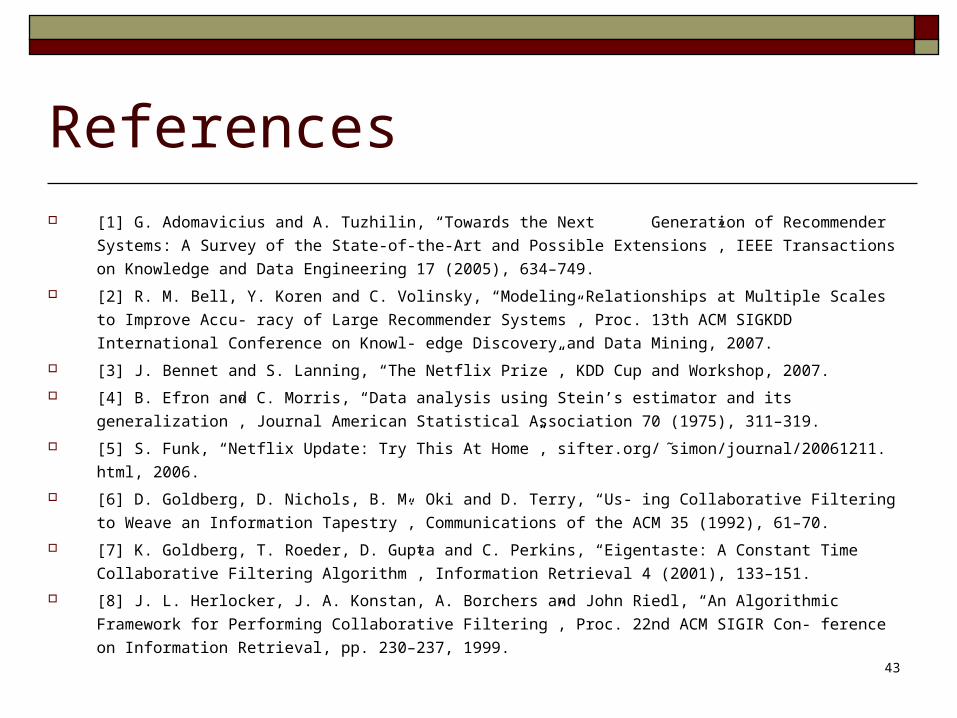
References [1] G. Adomavicius and A. Tuzhilin, “Towards the Next Generation of Recommender Systems: A Survey of the State-of-
the-Art and Possible Extensions”, IEEE Transactions on Knowledge and Data Engineering 17 (2005), 634–749.
[2] R. M. Bell, Y. Koren and C. Volinsky, “Modeling Relationships at Multiple Scales to Improve Accu- racy of Large
Recommender Systems”, Proc. 13th ACM SIGKDD International Conference on Knowl- edge Discovery and Data Mining,
2007.
[3] J. Bennet and S. Lanning, “The Netflix Prize”, KDD Cup and Workshop, 2007.
[4] B. Efron and C. Morris, “Data analysis using Stein’s estimator and its generalization”, Journal American Statistical
Association 70 (1975), 311–319.
[5] S. Funk, “Netflix Update: Try This At Home”, sifter.org/ Ssimon/journal/20061211. html, 2006.
[6] D. Goldberg, D. Nichols, B. M. Oki and D. Terry, “Us- ing Collaborative Filtering to Weave an Information Tapestry”,
Communications of the ACM 35 (1992), 61–70.
[7] K. Goldberg, T. Roeder, D. Gupta and C. Perkins, “Eigentaste: A Constant Time Collaborative Filtering Algorithm”,
Information Retrieval 4 (2001), 133–151.
[8] J. L. Herlocker, J. A. Konstan, A. Borchers and John Riedl, “An Algorithmic Framework for Performing Collaborative
Filtering”, Proc. 22nd ACM SIGIR Con- ference on Information Retrieval, pp. 230–237, 1999.
44
References [9] J. Konstan, B. Miller, D. Maltz, J. Herlocker, L. Gor- don and J. Riedl, “GroupLens: Applying Collabora- tive Filtering to
Usenet News”, Communications of the ACM 40 (1997), 77–87, www.grouplens.org.
[10] C.L. Lawson and B. J. Hanson, Solving Least Squares Problems, Prentice-Hall, 1974. n
[11] G. Linden, B. Smith and J. York, “Amazon.com Rec- ommendations: Item-to-item Collaborative Filtering”, IEEE Internet
Computing 7 (2003), 76–80.
[12] J. Nocedal and S. Wright, Numerical Optimization, Springer, 1999.
[13] R. Salakhutdinov, A. Mnih, and G. Hinton, “Re- stricted Boltzmann Machines for Collaborative Filter- ing”, Proc. 24th
Annual International Conference on Machine Learning, 2007.
[14] B. M. Sarwar, G. Karypis, J. A. Konstan, and J. Riedl, “Application of Dimensionality Reduction in Recom- mender
System – A Case Study”, WEBKDD’2000.
[15] B. Sarwar, G. Karypis, J. Konstan and J. Riedl, “Item- based Collaborative Filtering Recommendation Algo- rithms”,
Proc. 10th International Conference on the World Wide Web, pp. 285-295, 2001.

45
More Tricks by the authors Robert M. Bell, Yehuda Koren and Chris
Volinsky
Modeling Relationships at Multiple Scales to Improve Accuracy of Large Recommender Systems
46
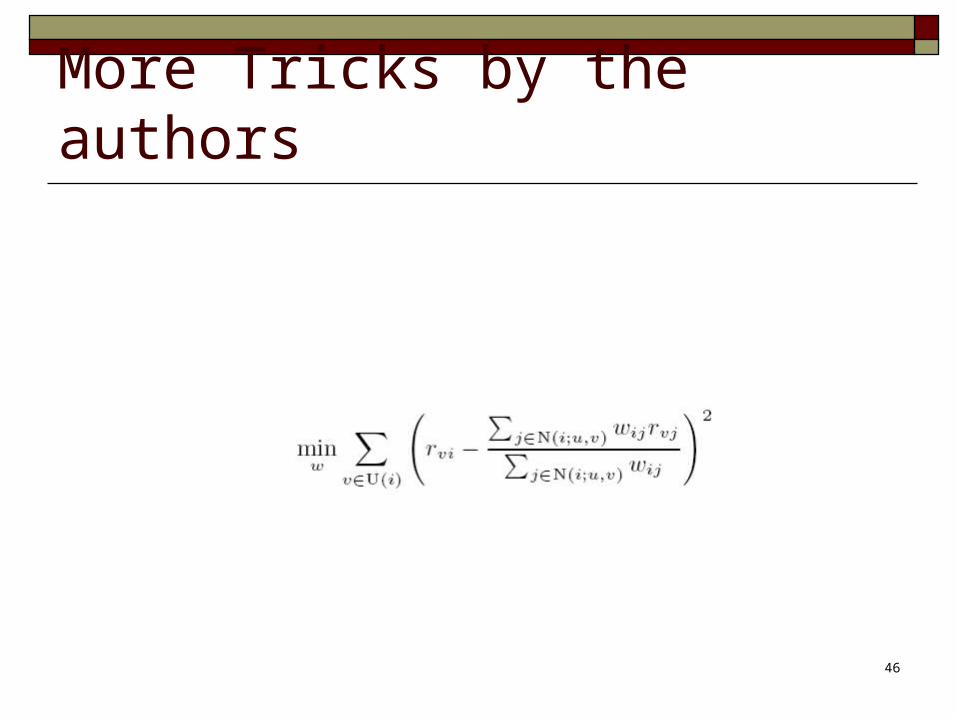
More Tricks by the authors

47
More Tricks by the authors Consider the relative importance of user

48
More Tricks by the authors

49
Integrating user-user similarity
Integrating user-user similarities
50
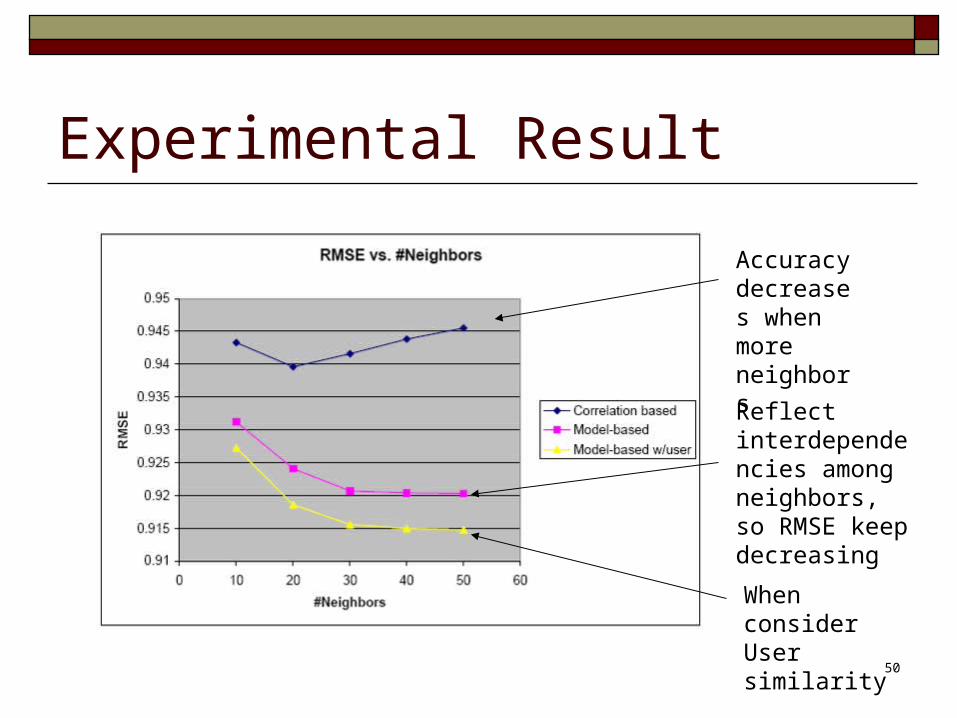
Experimental Result
Accuracy decreases when more neighbors
Reflect interdependencies among neighbors, so RMSE keep decreasing
When consider User similarity
51
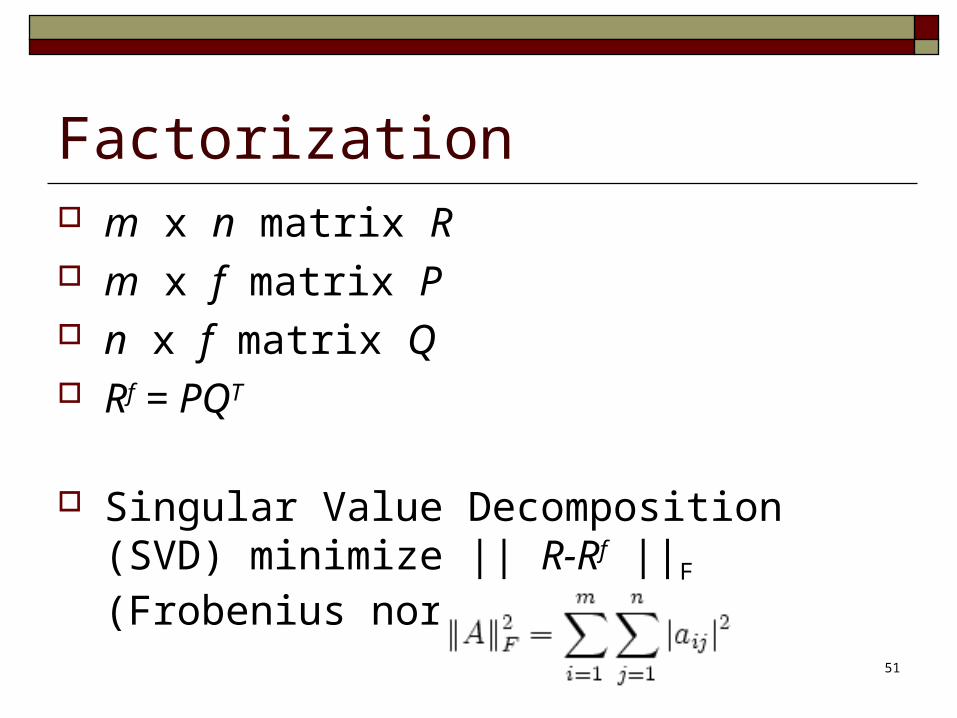
Factorization m x n matrix R m x f matrix P n x f matrix Q Rf = PQT
Singular Value Decomposition (SVD) minimize || R-Rf ||F (Frobenius norm)
52
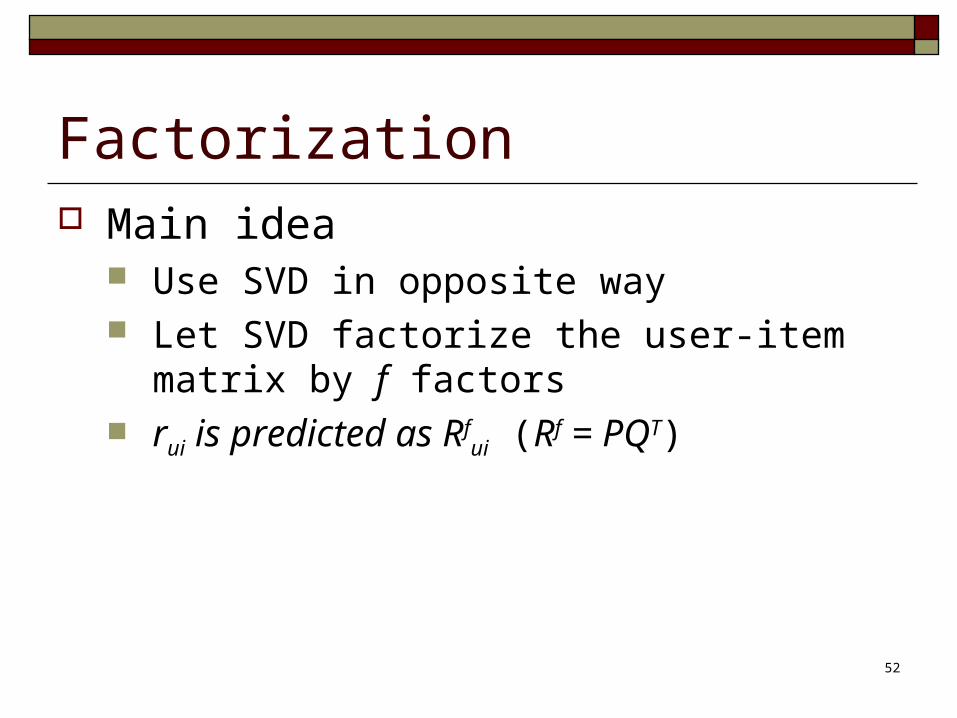
Factorization Main idea
Use SVD in opposite way Let SVD factorize the user-item matrix by f
factors rui is predicted as Rf
ui (Rf = PQT)
53
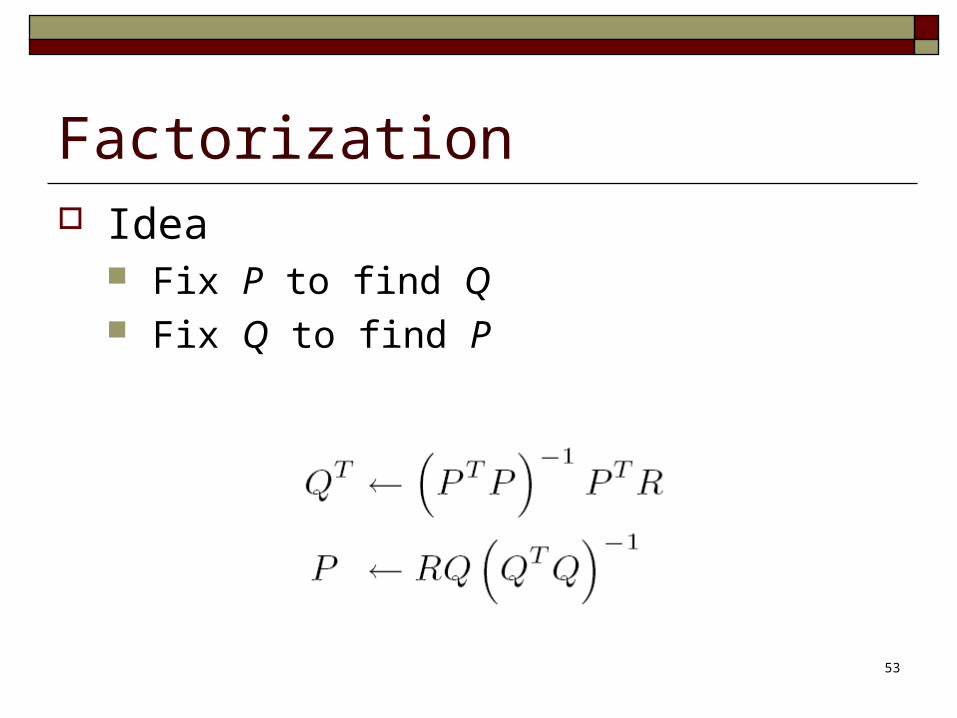
Factorization Idea
Fix P to find Q Fix Q to find P
54
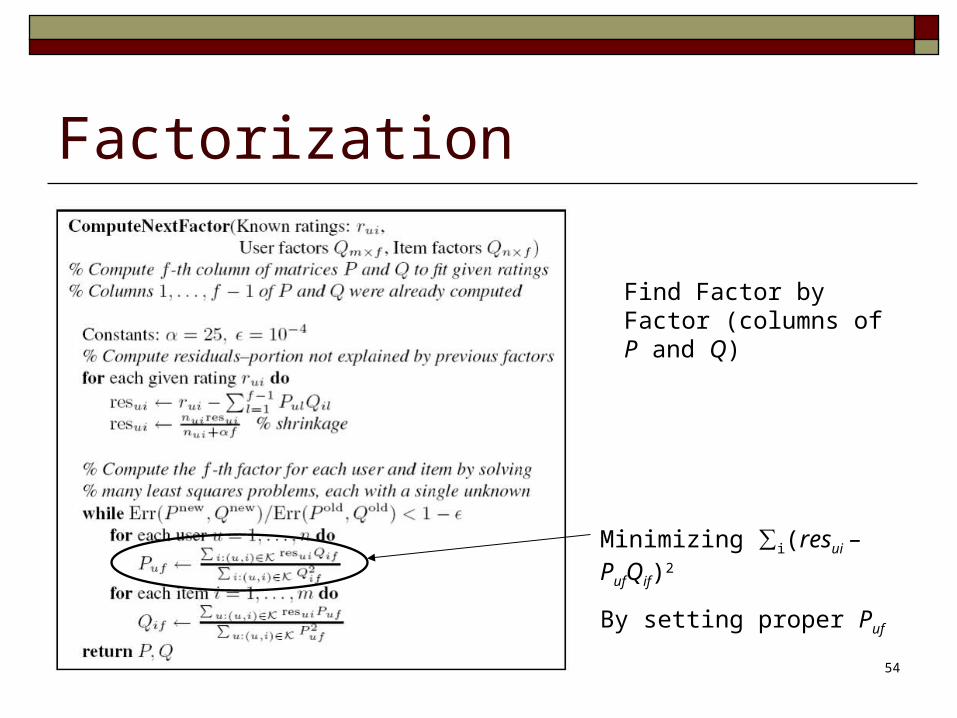
Factorization
Minimizing ∑i(resui – PufQif)2
By setting proper Puf
Find Factor by Factor (columns of P and Q)

55
Factorization
resui is shrank by multiplying a factor
nui is the support of this rui = min(#user rated i, #item rated by u). Shrink more if support less
αis a constant
f is the factor number. Earlier found factor (small f) explain higher variations; later factor (large f) lower variations of the data

56
Winning the Prize
Combine the results according to the faith in the method.
The faith is derived according to how well the error is minimized
57
References [1] G. Adomavicius and A. Tuzhilin, “Towards the Next Generation of Recommender
Systems: A Survey of the State-of-the-Art and Possible Extensions”, IEEE Transactions on Knowledge and Data Engineering 17 (2005), 634–749.
[2] R. Bell and Y. Koren, “Improved Neighborhood-based Collaborative Filtering”, submitted, 2007.
[3] S. Deerwester, S. Dumais, G. W. Furnas, T. K. Landauer and R. Harshman, “Indexing by Latent Semantic Analysis”, Journal of the Society for Information Science 41 (1990), 391–407.
[4] D. Goldberg, D. Nichols, B. M. Oki and D. Terry, “Using Collaborative Filtering to Weave an Information Tapestry”, Communications of the ACM 35 (1992), 61–70.
[5] K. Goldberg, T. Roeder, D. Gupta and C. Perkins, Eigentaste: A Constant Time Collaborative Filtering Algorithm”, Information Retrieval 4 (2001), 133–151.
[6] G.H. Golub and C.F.Van Loan, Matrix Computations, Johns Hopkins University Press, 1996.
[7] J. L. Herlocker, J. A. Konstan, A. Borchers and John Riedl, “An Algorithmic Framework for Performing Collaborative Filtering”, Proc. 22nd ACM SIGIR Conference on Information Retrieval, pp. 230–237, 1999.
[8] D. Kim and B. Yum, “Collaborative Filtering Based on Iterative Principal Component Analysis”, Expert Systemswith Applications 28 (2005), 823–830.
58
References [9] J. Konstan, B. Miller, D. Maltz, J. Herlocker, L. Gordon and J. Riedl, “GroupLens:
Applying Collaborative Filtering to Usenet News”, Communications of the ACM 40 (1997), 77–87, www.grouplens.org.
[10] Netflix prize -www.netflixprize.com. [11] G. Linden, B. Smith and J. York, “Amazon.com Recommendations: Item-to-item
Collaborative Filtering”, IEEE Internet Computing 7 (2003), 76–80. [12] J. Nocedal and S. Wright, Numerical Optimization, Springer (1999). [13] S. Roweis, “EM Algorithms for PCA and SPCA”, Advances in Neural Information
Processing Systems 10, pp. 626–632, 1997. [14] B. M. Sarwar, G. Karypis, J. A. Konstan, and J. Riedl, “Application of Dimensionality
Reduction in Recommender System – A Case Study”, WEBKDD’2000. [15] B. Sarwar, G. Karypis, J. Konstan and J. Riedl, “Item-based Collaborative Filtering
Recommendation Algorithms”, Proc. 10th International Conference on the World Wide Web, pp. 285-295, 2001.
[16] R. Tibshirani, “Regression Shrinkage and Selection via the Lasso”, Journal of the Royal Statistical Society B 58 (1996).
[17] J. Wang, A. P. de Vries and M. J. T. Reinders,“Unifying User-based and Item-based Collaborative Filtering Approaches by Similarity Fusion”, Proc. 29th ACM SIGIR Conference on Information Retrieval, pp. 501–508, 2006.