technical university of north - utn
TRANSCRIPT
TECHNICAL REPORT | Galpón “La Comarca”
1
TECHNICAL UNIVERSITY OF NORTHFACULTY OF ENGINNERING APPLIED SCIENCE
MECHATRONICS ENGINNERING CAREER
TECHNICAL REPORT
SUBJECT:
OVEN COOKED FOR PROCESSING
AVIAN BLOOD SHED FOR "LA COMARCA"
AUTHOR: ENDARA AGUAIZA MAÍCOL ANDRÉS
DIRECTOR: ING. JORGE TERÁN
Ibarra-Ecuador
2012

TECHNICAL REPORT | Galpón “La Comarca”
2
TECHNICAL REPORT | Galpón “La Comarca”
3
CONTENT
Chapter 1: 4 Introduction Process
4 Treatment of raw material
5 The process of transforming raw materials
Chapter 2: 6 System Parts
6 Drying Oven
7 Electronic Components
9 Stage Control
11 Parameters of Drying Oven
12 Description of Drying Oven
13 Production Capacity Drying Oven
Chapter 3: 15 Process Automation
16 Power Subsystem
17 Process Description Diagram
Chapter 4: 24 Methods and Process
24 Treatments
27 Feasibility of the Blood Meal
28 Experimental Design
33 Results and Analysis
33 Weight Average Weekly
42 Interpretation of Assessment Tables Weight
43 Behavioral Treatment
51 Annexes

TECHNICAL REPORT | Galpón “La Comarca”
4
CHAPTER 1: OVERVIEW OF THE PROCESS
Treatment of the raw material
The preparation by this method of application by drying in an oven automated, comprising the
following steps: Collecting and Preserving, Coagulation, pressing, drying, cooling and grinding.
• In the above scheme shows the steps of processing the raw material from slaughter plant, wherethe meat by-products will be treated and processed until the final product (blood meal).
• Generally apply different sub processes to organic products, until theirrespective recycling, but not detailed ways to assess your application to protein yield and poultryproduction.
• The raw material is processed and transformed in different ways to obtain a dried material forlater use in a worm from mill grinds flour for a right consistency.
Processing
ground
Sernido
obtaining
coagulation
cut
drying

TECHNICAL REPORT | Galpón “La Comarca”
5
• One of the essential steps of processing the raw material (avian blood) is that of drying, whichuses a tool based on a gas furnace for the production of dried blood croquettes untilprocessing and flour milling Blood.
Process Description of raw material processing
Collection and preservation
Blood must be approved by the animal health control, hygienic collection. It can alsobe used between two and three day safter slaughter.
CoagulationCan be used for this purpose any oil tank, cut longitudinally, the blood is heated above the water,previously subjected to boiling, stirring constantly until it becomes a black mass, must beavoided because of this char so no can use the resource, but one must consider that the blood hasto boil 40 to 60minutes to perform the complete coagulation and destroy any pathogen.
DryingTwo procedures may be used to dry the blood, on mats spread on cement slabs outdoors,weather permitting, or in a drying oven trays. Clotted blood may be dried and pressed efficiently ifit is not very large quantities.
GrindThe process of grinding it can be done by a hammer crusher are the most accessible in themarket, and will conclude on screening processed with a sheet of 5 mm will suffice for thispurpose.

TECHNICAL REPORT | Galpón “La Comarca”
6
CHAPTER 2: PARTS OF THE SYSTEM
Drying OvenA gas oven is a device that generates heat and which keeps within a closed compartment. It isgenerally used for cooking, heating or drying different products. The gas oven heats up fasterthan the electric.
This type of furnace burners operated as type burners or flute, which guarantee the burning of aspecific amount of fuel, which keeps the heat.
Parts of the gas drying oven
The key parts of a gas furnace are:
• A household or combustion chamber where fuel is burned, or in general is that housethe burners and the combustion gases generated. You can match the heating chamber or be aseparate chamber.
• heat exchangers consist of galvanized steel tubes, inside which circulates the gases at hightemperatures yielding heat to the fluid that is inside or overheated steam or reheating. Themain heat exchangers are economizers, screens or walls vaporizing water, super heaters andreheaters of steam.
• Ashtrays are the part of the bottom of the boiler which sets out the dross that will laterbe transported to a collection and storage silo are located at the bottom of the home. Its mostcommon form is that of a truncated rectangular pyramid inverted.
• Chamber of warming: there are different types, depending on the shape of furnaceoperation and function.
Fuelsupply
HeatDistributors
Fireplace
Home

TECHNICAL REPORT | Galpón “La Comarca”
7
• Roof insulation: covers all the cameras and equipment from the oven, preventing the spread ofheat to the outside protection for people being in contact with the furnace, whereas itsmain function is to prevent heat loss.
ELECTRONIC COMPONENTS
It needs to analyze the variables (temperature, time, gas flow) to establish control of eachof them so detailed you specify the correct components.
Temperature Control
The how to keep the temperature in a gas oven baked for a treatment of blood, is themain address that we must look to carve out the controls that govern the behaviorof temperature.
A temperature control system obtains the ambient temperature measured by a sensor, and thissignal is treated, either digitally or analogously (depending on the type of control to be treated).
It then goes into a control system which enables, disables, increases or decreases the system to beresponsible for maintaining the temperature.In the case of an oven, if the temperature is higher, the furnace power decrease, and iftoo low, increases this. Given reference input and the signal coming from the sensor.
Global System Process Furnace Operation
The overall type figured system
Block diagram of the system
CONTROL Sensors andactuators
Oven
TECHNICAL REPORT | Galpón “La Comarca”
8
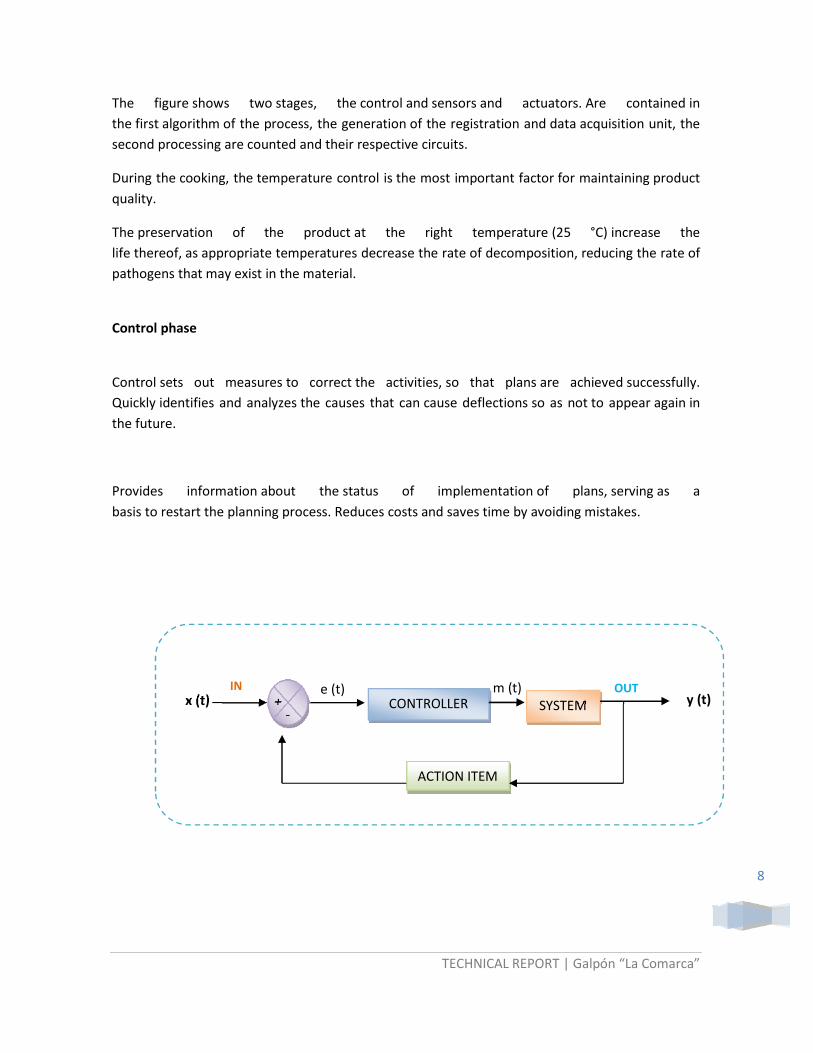
The figure shows two stages, the control and sensors and actuators. Are contained inthe first algorithm of the process, the generation of the registration and data acquisition unit, thesecond processing are counted and their respective circuits.
During the cooking, the temperature control is the most important factor for maintaining productquality.
The preservation of the product at the right temperature (25 °C) increase thelife thereof, as appropriate temperatures decrease the rate of decomposition, reducing the rate ofpathogens that may exist in the material.
Control phase
Control sets out measures to correct the activities, so that plans are achieved successfully.Quickly identifies and analyzes the causes that can cause deflections so as not to appear again inthe future.
Provides information about the status of implementation of plans, serving as abasis to restart the planning process. Reduces costs and saves time by avoiding mistakes.
CONTROLLER SYSTEM+-
ACTION ITEM
x (t)IN OUTe (t) m (t)
y (t)
TECHNICAL REPORT | Galpón “La Comarca”
9
Process Control stage
Controller
A device driver is a medium that allows the operating system with a peripheral, possibly makinga standardized interface to use.
Can be represented as an instruction manual that tells the operating system, how to control andcommunicate with a particular device.
There are many types of controllers such as types of peripherals; it is common to find a driver forthe same device as possible, each offering a different level of functionality.LOGOLOGO is the universal logic module from Siemens has integrated
• Control
• Operating and display unit with backlight
• Power supply
• Interface for expansion modules
• Interface for programming module (card) and cable for PC
• Basic functions widely used pre-programmed, for example for connection delayed, delayedswitch, relay socket, and switch software
• Timer
• Analog and digital brands
• Inputs and outputs depending on model.
With a framed LOGO tasks are solved in the art of installation and thehome (eg stair lighting, outdoor lighting, awnings, blinds, lighting, display, etc..) And theconstruction of cabinets, machinery and equipment (eg door controls, ventilation,drinking water pumps, etc..).

TECHNICAL REPORT | Galpón “La Comarca”
10
PARAMETERS OF DRYING OVEN
Building a Drying Oven
A drying oven gas is the facility where transforms chemical energy of fuel into heat which isused to increase the temperature of those materials deposited on the inside and so raise thestate necessary for subsequent industrial processes.
The desiccator resembles a comfortable base with trays containing the blood pressed.Hot air is blown through the trays and the material deposited therein,eliminating moisture slowly. To simplify operation, you should put the trays in a kindof wagon for easy transport to and from the dryer.
According to Moreno (2005), states that based on methodologies is passed hot air oven walls bymeans of heat sinks, allowing even heat distribution to each of the different levels of the home.
Performance of Heat Sinks

TECHNICAL REPORT | Galpón “La Comarca”
11
Determining the IP Number
For the implementation and measurements were determined accordingto the appropriate IP number is detailed in the following chart:
Meaning of letters and numbers, IP rating
In the figure we note that the number efficient development of the treatment process withavian blood, because it has the characteristics of protection against dust, limitedpenetration (no harmful deposit), and protection against low pressure jets of water fromall Limited entry directions and allowed.
DESCRIPTION OF THE DRYING OVEN
The drying kiln versatile characterizations research presents the conditions of work whichtakes advantage of the spaces to give greater productivity and economy while preservingthe traditional model of ovens for drying.
Meets the requirements of ISO 14001, which is the basis of environmental development, indetermining the implementation of an EMS (Environmental Management System),consisting of processes covering the consecutive study of electrical warnings,improvement of sub-commodity , gas consumption, determines the use of materials forindustry.
Through research and operating ranges should be developed in an oven that workspermissible temperature ranges (up to 300 ° C), eligible for this development application tothe food products industry.
The forced draft is an excellent method to comply with environmental conditions to beimplemented, and also allows combustion gases are expelled by aspiration achieved by aspecial fan, temperature resistant and aggressions of the components of smoke, anddriven by the fire, whose career depends solely on the conditions of the facilities.
IP 55WIP(International Protection)First figure(Protection against solid objects 0-6)Second Figure(Protection against water, 0-8)Optional letter for applications underSpecial environmental(Agreed between the user and the manufacturer)

TECHNICAL REPORT | Galpón “La Comarca”
12
This system has the advantage of not requiring stack height, since the emissions are inlarge quantities, contributing to the cleaning site atmospheric.
In this way we can determine the variables as temperature and humidity, determine thatthe galvanized steel is effective to meet the needs of work, giving us the guideconstruction of the drying furnace, the base having the foundation of processes forceddraft.
Production Capacity Drying Oven
The capacity is directly related to the structural design of the drying oven, whereas thedimensions of both the home and trays allow us to the knowledge of the productioncapacity per process. It is also essential to analyze the raw materials and resources withwhich you work.
The raw material is obtained based on the monthly slaughter of 200 chickens with anaverage weight of 2.2 kg or 4.84 pounds each and should be averaged with 1 liter of bloodfaenada of which only 75% is usable, yielding 0.825 liters per bird, giving a total of165litros for each process.
And in the case of not enough use of the resources of the slaughter of the shed, was takenas the secondary source EMRI (Enterprise Municipal Slaughter of Ibarra), which providesthe amount needed for the processing of avian blood meal.
The production capacity of the drying furnace, is in the range of 60 pellets by the process,being produced in 2 hours, is performed once per week slaughtering, thereby producing anaverage of 240 pellets per shift in one month .
The size of the three trays allows placing the pellets in each tray 20 with a suitabledimensioning of 5cm wide and 8 cm long, and once the furnace heated to a temperature of70 ° C the raw material to be completed in 1 hour and 20 minutes.
TECHNICAL REPORT | Galpón “La Comarca”
13
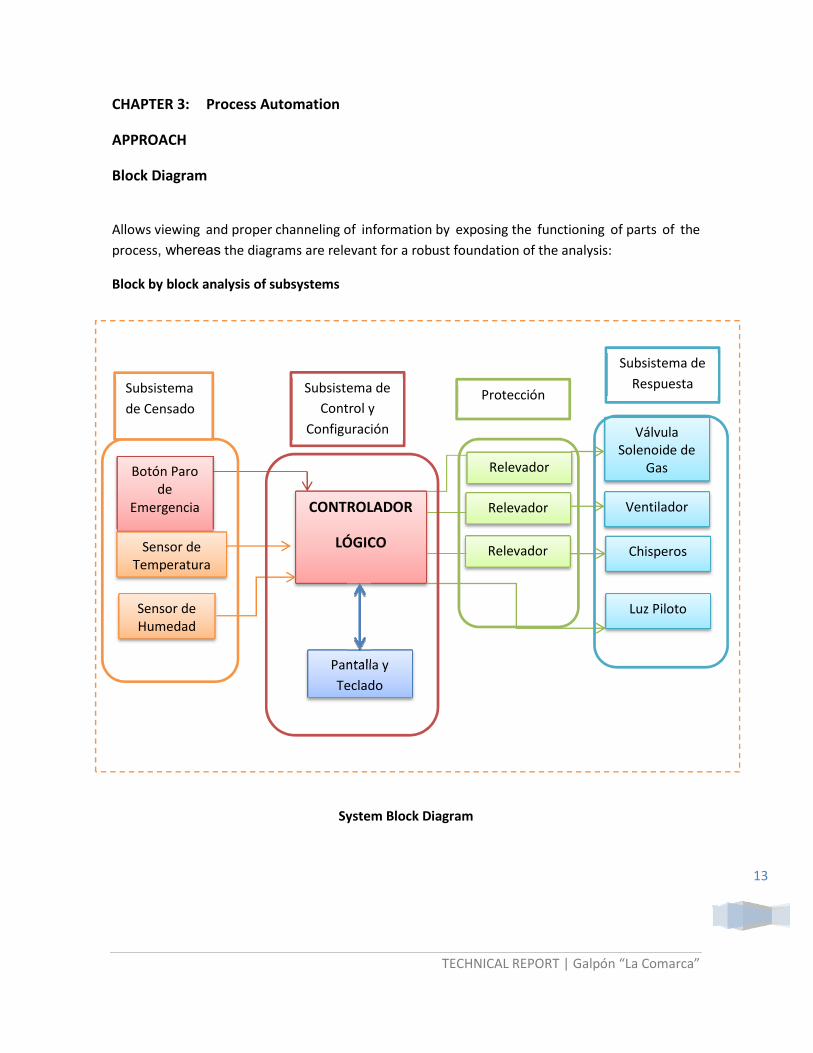
CHAPTER 3: Process Automation
APPROACH
Block Diagram
Allows viewing and proper channeling of information by exposing the functioning of parts of theprocess, whereas the diagrams are relevant for a robust foundation of the analysis:
Block by block analysis of subsystems
System Block Diagram
Botón Parode
Emergencia
Sensor deTemperatura
Sensor deHumedad
CONTROLADOR
LÓGICO
Pantalla yTeclado
Relevador
Relevador
VálvulaSolenoide de
Gas
Ventilador
Chisperos
Luz Piloto
Relevador
Subsistemade Censado
Subsistema deControl y
Configuración
Protección
Subsistema deRespuesta

TECHNICAL REPORT | Galpón “La Comarca”
14
In the electronic control board will have different equipment and electrical and electronicelements that make the processing of croquettes blood is controlled, monitored for efficientperformance in avian blood meal.
Power Subsystem
Block Diagram Power Subsystem
System power control processing is the basis for development of the project and that variablessuch as availability, malleability, and easy access to additional tools are completely differentleague linked to magnitudes that are offered in the Galpón “La Comarca”.
110v AC Fuse Source 12vDC

TECHNICAL REPORT | Galpón “La Comarca”
15
DESCRIPTION OF THE PROCESSFlowchart Drying System

TECHNICAL REPORT | Galpón “La Comarca”
16
FLOWCHART SUBSYSTEM CENSUS
FLOWCHART SUBSYSTEM TEMPERATURE CENSUS

TECHNICAL REPORT | Galpón “La Comarca”
17
FLOWCHART SUBSYSTEM MOISTURE CENSUS
FLOWCHART SUBSYSTEM EMERGENCY STOP

TECHNICAL REPORT | Galpón “La Comarca”
18
FLOWCHART SUBSYSTEM CONTROL AND CONFIGURATION

TECHNICAL REPORT | Galpón “La Comarca”
19
FLOWCHART SUBSYSTEM LOGO

TECHNICAL REPORT | Galpón “La Comarca”
20
CHAPTER 4: METHODS AND TESTING
FACTORS IN STUDY
For the manufacture of blood meal is done by using a drying oven automatic tests should analyzetheir performance and behavior of the variables to be interpreted during processing of theproduct, whereas, we study three key variables which allow the correct development ofproduction.
Drying Temperature: fundamental factor which depends on that of the correct instantiation forcroquettes se4r when dried retain and improve their nutritional value and protein.Humidity: essential indicator that processed kibble is at its optimum point of drying, whichindicates that to obtain a range (%) will be defined for the better use of the pellets to form flour.
Drying time: necessary to obtain optimal processing of croquettes as if time is too short or you willnot get a food with nutrients, so it must be instantiated as accurate as possible to avoid waste ofraw materials whereas it saves energy and reduces production costs.
TREATMENTS
By having different factors under study, the basis is the combination of cooking and drying time.
These factors are very essential and rigorous line when configuring the processing requirements ofavian blood croquettes, so has been given different types of treatments to achieve optimaltreatment and satisfactory according to the needs of the product.
FACTOR NUMBER TREATMENTa bC1 S1 1 45 min cook en 2 hours dryingC1 S2 2 45 min cook en 3 hours dryingC1 S3 3 45 min cook en 4 hours dryingC2 S1 4 60 min cook en 2 hours dryingC2 S2 5 60 min cook en 3 hours dryingC2 S3 6 60 min cook en 4 hours dryingC3 S1 7 75 min cook en 2 hours dryingC3 S2 8 75 min cook en 3 hours dryingC3 S3 9 75 min cook en 4 hours drying
Treatment provision for the Preparation of Blood Meal

TECHNICAL REPORT | Galpón “La Comarca”
21
Nomenclature:
Factor a: Cooking Time Factor b: Drying time
C1: 45 minutes S1: 2 hours
C2: 60 minutes S2: 3 hours
C3: 75 minutes S3: 4 hours
In conducting the performance analysis of the raw material according to the variables of thedifferent treatments performed in the drying oven is concluded that the best performance, bothmaterial processed as saving resources, which details the process that C1S1el blood should becooked 45 minutes and maintained for two hours in the drying process.
Furthermore, this process is clearly observed that the creation, color and presence of ash in theproduct is minimal, which is a deductive analysis that helps us to determine that the process iscorrect.
Seeing that is verified and found that the process is more efficient, to take contact with thefurnace and the response of sensors and actuators analysis indicates that this treatment meets thestandard test values is to have a drying temperature 110 ° C and reach a moisture content of 5% tomake maximum use of the avian blood pellets.
Best Treatment to Apply
C1 S1 C1 S2 C1 S3 C2 S1 C2 S2 C2 S3 C3 S1 C3 S2 C3 S3RENDIMIENTO (%) 98 60 32 40 35 22 20 10 5
0
20
40
60
80
100
120
% P
ERFO
RMAN
CE
PERFORMANCE(%)

TECHNICAL REPORT | Galpón “La Comarca”
22
Raw materials needed in the blood meal
Protein.Fiber.Fat.Humidity.
According to analyzes made croquettes, is determined that the best procedure is the C1S1, sincethe study was conducted in chemical laboratory, which gives us an answer of the components ofeach treatment with percentages indicating the presence of each component , which is attachedto the verification.
Treatments Evaluated For the Balanced Feasibility
TREATMENTS AVAILABLE1 T02 T13 T24 T35 T4
Blood meal Treatment Feasibility
Nomenclature:
Treatment 0: Balanced trade.
Treatment 1: Balanced formulated with a 20% replacement of blood meal.
Treatment 2: Balanced formulated with a 40% replacement of blood meal.
Treatment 3: Balanced formulated with 60% replacement of blood meal.
Treatment 4: Balanced formulated with a 100% replacement of blood meal.

TECHNICAL REPORT | Galpón “La Comarca”
23
Treatment Feasibility Food
Experimental Design
Type of design
The type of experimental design applied in this research project is structured such random butbased on five treatments and proper repetitions, still requires at least two, so reliability wasconducted for four.
Characterization of Experiments
Reps to perform: 4
Treatments: 5
Experimental unit: 10
Characteristics of the experimental unit: stood out as experimental basis a number of 10 chickensBB, the same age, race and weight, and 10 chickens comparative BB as those bred normally shedthe Shire. To perform comparative analysis.
1 2 3 4 5Balanceado Comercial 100 80 60 40 0Harina de Sangre 0 20 40 60 100
0
20
40
60
80
100
120
FEASIBILITY OF BLOOD MEAL

TECHNICAL REPORT | Galpón “La Comarca”
24
Outline of Analysis
SOURCE OF VARIATION DEGREES OF FREEDOMTotal 15Treatments 5Experimental Error 10
Data Analysis
Functional Analysis
For optimum development, reliable and functional analysis, the analysis was developed based onthe coefficient of variation, and in the case of evident differences that are relevant, apply theTukey test, since it declares to us that two measures between treatments are significantlydifferent, with the case study can be applied to 5% to avoid errors.
The Experiment Management
Data obtained and Evaluation Methods
To analyze the efficiency of blood meal in feed for poultry shed the experiment should beperformed methods of assessment performance data to highlight the use of the product, whereasit should be analyzed:
Weekly weight gain
Feed conversion
Feed efficiency
Acceptability of meat, using the Friedman test
Weekly Weight Increase
We analyze the initial weight and its determination is based on each bird weighing, batch andrepeat, hence the weighing should be performed once a week, whereas in the final stagedetermines the final average weight.
The weekly weight gain must be performed by performing the weighing of all birds according tothe disposal of the treatments and repetitions, then determine the average weight of each.
The values of weekly weight gain and weight reference from the date of acquisition of chickens BB(day 1), are reflected in the table in Annex.

TECHNICAL REPORT | Galpón “La Comarca”
25
Food Conversion
This variable is essential and the consumption determined by the birds with feed of dry matter,based on the gradual increase in average weight exists.
This variable is evaluated to assess the performance of balanced prepared, which is determined bythe following formula:
. = . . .. .Nomenclature:
C.A = Food Conversion.
CAMS = Average consumption of food in dry matter.
I.M.P = Average increase in weight.
The study of food conversion is performed in order to check and see if the sample bone specimenstaken as the basis of the experiment have internalized and accepted the proposal as a balancedblood meal.
The values of feed conversion are shown in Tables 2, we show the behavior of the bird whenweight versus the average consumption of food giving us a clear conception of how it is workingwith the bird variables as a function of growth.
Feed efficiency
The efficiency and performance of the blood meal can be calculated using the followingformulation:
. = . ∙ 100Nomenclature:E.A = Efficiency of Food.
Px = Average weight of the bird.
C.A = Food Conversion.

TECHNICAL REPORT | Galpón “La Comarca”
26
The feed efficiency factor was taken into account in developing the process and step by stepindicates the evolution and acceptance of performance that leaves the use of blood meal, givingus the best results based on the analysis of average weight poultry and feed conversion, theanalysis in Table.
Acceptability of Meat
The focus of research should focus on the acceptability, to check the incidence of blood meal asfactors such as taste or aroma.
Therefore in the analysis we used the Friedman test, as it applies to two factors in the parametricversion, the method is to sort the data by rows or blocks, replacing them with their respectiveorder. In sort, we must consider the existence of identical data.
The collaboration of a sample of tasters, helps verify the acceptability of the meat obtained byraising chickens with blood meal, it should be emphasized that prior to analysis people wereinstructed in sensory evaluation of meat to taste. Test was used and Table evaluator the last stepof the project was carried out by the acceptance of the meat and gave reference to the treatmentof birds sipping prepared and bred on the basis of blood meal, leaving you a great satisfaction withvalues found in the surveys, appreciating and project success.
Method for management of the experiment
Method of obtaining blood meal
It begins with the collection process from the slaughter of chickens shed the Shire, which must beplaced on a previously clean container and properly sterilized, approximately 15 liters for eachprocess used weekly.
From this it evaluates and characterizes the blood to the variables of baking and drying, having 4repetitions of 5 experiments, with each of the times raised, which results highlight based onproximal practiced, the optimum amount of protein and acceptable S1 treatment was C1 S1, theyhad a cooking time of 45 minutes and 2 hours of drying, in which a stability was reached betweenthe factors necessary amount of protein required humidity.

TECHNICAL REPORT | Galpón “La Comarca”
27
Diagram Preparation of blood meal
Process for Obtaining Blood Flour
Description of the Preparation Of Blood Meal
Blood obtained from chickens slaughtered in the Warehouse District
COLLECTION: We carried out in sterile plastic containers for the capacity of 15 liters.
COOLING: recommended at T = 2 ° C partially.
COOKING: performed in water at boiling temperature is 92 ° C followed by bone attached bloodand proceeds to measure the specific time of 45 minutes of cooking
DESIGN: Blood should be properly cooked according to the needs shape having a thickness ofabout 3 mm, 5 cm long and 8 cm wide, in line to expose the largest possible area for drying.
DRYING: the oven must reach a temperature of 70 ° C, as initial condition, must be worked in astandard 110 ° C, then threaded portions are located in the trays 3 and proceeds to parameterizethe time of 2 hours.
CRUSH: it comes to proper grinding mill using a sieve artisanal 2 mm fine grain point.ENPAQUETADO: was packed in polyethylene bags properly conditioned, non-transparent andhermetically sealed.
Blood
COLLECTIONREFIRGERATION
=2°C
Cookt =45 min
DRYINGT=110°C
CRUSH PACKAGING
BLOODMEAL

TECHNICAL REPORT | Galpón “La Comarca”
28
RESULTS AND ANALYSIS
The variables analyzed in the preparation of avian blood meal, are detailed in the followinganalysis with the data obtained in breeding birds shed the Shire, under the terms of treatments,schedules and requirements by which describe each:
AVERAGE WEEKLY FEED
AVERAGE WEIGHT WEEK 1
The table shows us the different average weights obtained during the course of the First Weekfrom T0 to T4 for the best treatment selection application.
Treatments Average (gr)T0 100.1T1 95T2 101.5T3 93.4T4 90.2Average Weight Week 1
Average Weight Analysis First Week
The following shows the values of average weight of the first week of the sample, which cananalyzer that the best treatments are the T2 with a weight of 101.5 grams and 100.1 grams withT0.
100,1
95
101,5
93,4
90,2
T0 T1 T2 T3 T4
Average Weight Week 1PROMEDIO (gr)

TECHNICAL REPORT | Galpón “La Comarca”
29
TREATMENTS Nº DATA AVERAGE RANK
T4 5 90,2 B
T3 5 93,4 B
T1 5 95 MB
T0 5 100,1 S
T2 5 101,5 S
Tukey test S1
Table is made at 5%, and we express that the control treatment and T2 are the treatments thathave greater range of feasibility in terms of average weight in the birds tested during the firstweek.
Average Weight Week 2
The table shows us the different average weights obtained during the course of the Second Weekfrom the T0 to T4 for analyst the best treatment in the application.
TREATMENTS AVERAGE (gr)T0 602,1
T1 590,8
T2 595,7T3 610,7
T4 600,03
Average Weight Second Week

TECHNICAL REPORT | Galpón “La Comarca”
30
Average Weight Analysis S2
The following table shows the values of average weight of the second week of the sample, whichwe emphasize that the best treatments are the T3 with 610.7 grams and 602.1 grams with T0.
TREATMENTS Nº DATA AVERAGE RANK
T1 5 590,8 B
T2 5 595,7 B
T4 5 600,03 MB
T0 5 602,1 S
T3 5 610,7 S
Tukey test S2
Table is made of 5% and we expressed that treatment T0 and T3, are the best treatments thathave greater range of acceptability and warranties as to the average weight for birds in the secondweek.
Average Weight Week 3
The table shows us the different average weights obtained during the course of the Third Weekfrom the T0 to T4 for selecting the best treatment in the application.
T0 T1 T2 T3 T4
602,1
590,8
595,7
610,7
600,03
AVERAGE WEIGHT WEEK 2PROMEDIO (gr)

TECHNICAL REPORT | Galpón “La Comarca”
31
TREATMENTS AVERAGE (gr)
T0 990,5
T1 998,7
T2 1000,3
T3 1005,7
T4 1002,5
Average Weight Third Week
Average Weight analysis S3
The following shows the values of average weight of the third week of the sample, which weemphasize that the best treatments are the T3 and T4 1005.7 g 1002.5 g with.
TREATMENTS Nº DATA AVERAGE RANK
T0 5 990,5 B
T1 5 998,7 B
T2 5 1000,3 MB
T4 5 1002,5 S
T3 5 1005,7 S
Tukey test S3
T0 T1 T2 T3 T4
990,5
998,7 1000,3
1005,71002,5
Average Weight Third WeekPROMEDIO (gr)

TECHNICAL REPORT | Galpón “La Comarca”
32
Table is made of 5% and we express to testing, states that the T4 t T3, are the best treatments thathave been showing us senior weight gain by accepting blood meal.
Average Weight Week 4
The table shows us the different average weights obtained during the course of the Fourth Weekfrom T0 to T4 and for selecting the best treatment option for the application.
TREATMENTS AVERAGE (gr)
T0 1700,6
T1 1780,2
T2 1785,9
T3 1800,5
T4 1850,7
Average weight Fourth Week
S4 Average Weight Analysis
The following table shows the values of average weight of the Fourth Week of the sample, whichcan analyst that the best treatments are the 1800.5 g T3, and T4 with 1850.7 g.
T0 T1 T2 T3 T4
1700,6
1780,2 1785,9 1800,5
1850,7
Average weight Fourth WeekPROMEDIO (gr)

TECHNICAL REPORT | Galpón “La Comarca”
33
TREATMENTS Nº DATA AVERAGE RANK
T0 5 1700,6 B
T1 5 1780,2 B
T2 5 1785,9 MB
T3 5 1800,5 S
T4 5 1850,7 S
Tukey test S4
Table is made at 5%, and expresses when testing the T4 and T3, are the best treatments that havebeen approved, showing weight gain by accepting blood meal.
Average Weight Week 5
The table shows us the different average weights obtained during the course of the Fifth Weekfrom the T0 to T4 for selecting the best treatment in the application.
TREATMENTS AVERAGE (gr)
T0 2563,2
T1 2662,1
T2 2400,3
T3 2823,6
T4 2913,9
Average Weight Fifth Week

TECHNICAL REPORT | Galpón “La Comarca”
34
S5 Average Weight Analysis
The following table shows the values of average weight of the Fifth Week of the sample, which weemphasize that the best treatments are the T3 and T4 2823.6 g 2913.9 g with, and a decrease inthe application of T2.
TREATMENTS Nº DATA AVERAGE RANK
T2 5 2400,3 B
T0 5 2563,2 B
T1 5 2662,1 MB
T3 5 2823,6 S
T4 5 2913,9 S
Tukey test S5
T0 T1 T2 T3 T4
2563,2 2662,12400,3
2823,6 2913,9
Average Weight Fifth WeekPROMEDIO (gr)

TECHNICAL REPORT | Galpón “La Comarca”
35
Table is made at 5%, and we express when testing the T4 and T3, are the best treatments thathave been given approval, showing weight gain by accepting blood meal.
Average Weight Week 6
The table shows us the different average weights obtained during the course of the sixth weekfrom the T0 to T4 for selecting the best treatment option for the application.
TREATMENTS AVERAGE (gr)
T0 7300,31
T1 7563,21
T2 7483,19
T3 7658,98
T4 7700,17
Average Weight Sixth Week
S6 Average Weight Analysis
The Table shows the values of average weight for the last week of implementation, the sixth weekof the sample with which we can realize that the best treatments of the process are the T4 with7700.17 g equivalent to 16.94 lb, as well as a second best option we have the T3 application with7658.98 g equivalent to 16.85 lbs.
T0 T1 T2 T3 T4
7300,31
7563,217483,19
7658,98 7700,17
Average Weight Sixth WeekPROMEDIO (gr)

TECHNICAL REPORT | Galpón “La Comarca”
36
TREATMENTS Nº DATA AVERAGE RANK
T0 5 7300,31 B
T2 5 7483,19 B
T1 5 7563,21 MB
T3 5 7658,98 S
T4 5 7700,17 S
Tukey S6
Table is made at 5%, and we express when testing the T4 and T3, are the best treatments thathave been approved, showing weight gain by accepting blood meal.
Interpreting Weight Tables
It gives us the information necessary to demonstrate that the better performance of the process itcan be done by applying the T4 supply 100% through blood meal, which we obtain a betteraverage weight of birds, and thus maximize resources.
WEEK WITNESS (T0) T1 T2 T3 T41 100,1 95 101,5 93,4 90,22 602,1 590,8 595,7 610,7 600,033 990,5 998,7 1000,3 1005,7 1002,54 1700,6 1780,2 1785,9 1800,5 1850,75 2563,2 2662,1 2400,3 2823,6 2913,96 7300,31 7563,21 7483,19 7658,98 7700,17
Cumulative Average Weights
The table presents the cumulative average weights, which is detailed the best treatment is the T4,with the implementation of 100% feeding of blood meal. Being optimal for processing and poultryfeed.

TECHNICAL REPORT | Galpón “La Comarca”
37
T0 behavior during the 6 weeks of implementation
T1 behavior during the 6 weeks of implementation
S 1; 100,1S2; 602,1
S3; 990,5
S4; 1700,6
S5; 2563,2
S6; 7300,31
0
1000
2000
3000
4000
5000
6000
7000
8000
0 1 2 3 4 5 6 7
T0 CONDUCT
TESTIGO (T0)
S 1; 95S2; 590,8
S3; 998,7
S4; 1780,2
S5; 2662,1
S6; 7563,21
0
1000
2000
3000
4000
5000
6000
7000
8000
0 1 2 3 4 5 6 7
T1 CONDUCT
T1
TECHNICAL REPORT | Galpón “La Comarca”
38
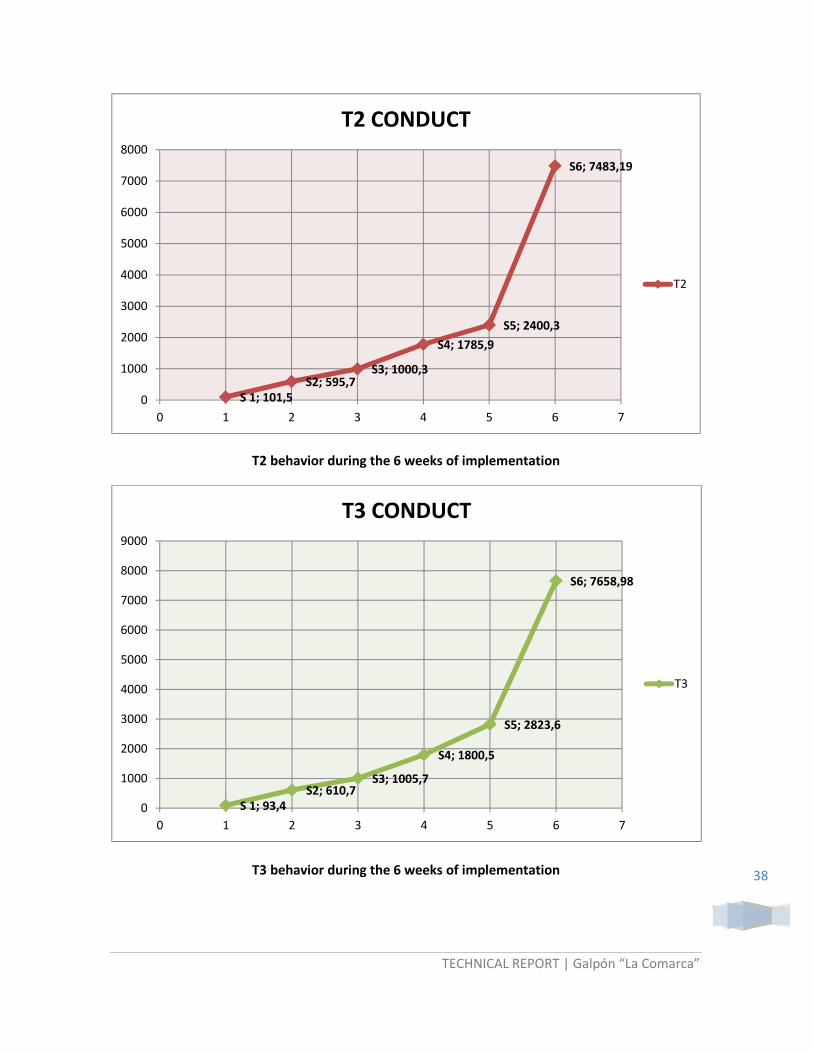
T2 behavior during the 6 weeks of implementation
T3 behavior during the 6 weeks of implementation
S 1; 101,5S2; 595,7
S3; 1000,3
S4; 1785,9S5; 2400,3
S6; 7483,19
0
1000
2000
3000
4000
5000
6000
7000
8000
0 1 2 3 4 5 6 7
T2 CONDUCT
T2
S 1; 93,4S2; 610,7
S3; 1005,7
S4; 1800,5
S5; 2823,6
S6; 7658,98
0
1000
2000
3000
4000
5000
6000
7000
8000
9000
0 1 2 3 4 5 6 7
T3 CONDUCT
T3

TECHNICAL REPORT | Galpón “La Comarca”
39
T4 behavior during the 6 weeks of implementation
S 1; 90,2S2; 600,03
S3; 1002,5
S4; 1850,7
S5; 2913,9
S6; 7700,17
0
1000
2000
3000
4000
5000
6000
7000
8000
9000
0 1 2 3 4 5 6 7
T4 CONDUCT
T4

TECHNICAL REPORT | Galpón “La Comarca”
40
FOOD CONVERSION
In Table, we detail the data to see which is the best treatment in the process of obtaining avianblood meal
TREATMENTS HALFT0 2,38T1 2,45T2 2,38T3 2,34T4 2,5
Food Media Conversion
Feed conversion behavior
Table shows that the T3 at the end of the process, bone Week 6, is the one with the lowest yield offeed conversion with a mean value of 2, 34.
What is clear is that this treatment reduced feed intake needed to produce 1000 g of body weightcompared to other treatments.
T0; 2,38
T1; 2,45
T2; 2,38
T3; 2,34
T4; 2,5
T0 T1 T2 T3 T4
Food Media Conversion

TECHNICAL REPORT | Galpón “La Comarca”
41
Apparent digestibility
The key step is to investigate how the body assimilates the food of the bird as are the proteinconcentrations, and this is what was observed by analyzing the excreta of the bird in differentstages of the process and was performed at 14 days and 42 days bone at week 6, which detail theresults in the following table:
TREATMENTS 14 DAY (%) 24 DAY (%)T0 6,44 7,78T1 7,92 12,75T2 6,75 9,1T3 6,22 10,44T4 7,1 9,76
Analysis of Protein in excreta Bird
Comparative Analysis of the protein at 14 and 42 days
6,447,92
6,75 6,227,1
7,78
12,75
9,110,44 9,76
0
5
10
15
20
25
T0 T1 T2 T3 T4
Analysis of Protein in the excreta of the Ave
24 DÍA (%)
14 DÍA (%)

TECHNICAL REPORT | Galpón “La Comarca”
42
FOOD EFFICIENCY
Applying the formulas we get the Table No. 23, which highlights the efficiency percentage of eachtreatment to obtain better acceptance and profitability for the process.
TREATMENTS HALFT0 94,3T1 91,2T2 93,5T3 101,4T4 90,7
Average feed efficiency
Analysis of the Average feed efficiency
We can see clearly that the best treatment is with a feed efficiency T3 Week 6 of 101.4% alsohighlights the T0 to 94.3%. Being the best treatments with high feed efficiency.
94,3
91,293,5
101,4
90,7
T0 T1 T2 T3 T4
Average feed efficiencyMEDIA

TECHNICAL REPORT | Galpón “La Comarca”
43
ACCEPTABILITY OF MEAT
It is the powerful symbol of the optimization of breeding and feeding birds (chickens), with avianblood meal, exposing how the meat is acceptable for human consumption.
TREATMENTS AVERAGET0 3,8T1 3,2T2 2,7T3 2,9T4 2,5
Average Acceptability of Meat
Average Analysis of Acceptability of Meat
In conducting the analysis of the averages obtained can realize that there is a working range of 2.5to 3.8 of acceptability of the meat, being cataloged from soft to slightly soft flesh of the bird,which emphasized that the best T4 process has an average hardness of 2.5 equivalents to soft andvery acceptable for human consumption.
3,8
3,22,7 2,9
2,5
T0 T1 T2 T3 T4
AVERAGEPROMEDIO

TECHNICAL REPORT | Galpón “La Comarca”
44

TECHNICAL REPORT | Galpón “La Comarca”
45
ANNEXES

TECHNICAL REPORT | Galpón “La Comarca”
46

TECHNICAL REPORT | Galpón “La Comarca”
47
Drying Oven
Ventilation systemGas
(Fireplace)
ElectronicSystem
Gas ControlValve
Viewers GasFlow Control
Raw materialtrays
Heat sinks

TECHNICAL REPORT | Galpón “La Comarca”
48
Automatic Control System with Logo! OBA6 12/24RC
Source 12/24v
EquipmentProtection
Module
Humidity sensormodule
InformationDisplay TD
TemperatureSensor Module
AM2PT100
Control ModuleLogo! OBA6
Start andEmergency Stop

TECHNICAL REPORT | Galpón “La Comarca”
49
Gear System
Fan Relay Protection
Protection Relay Powersparks
Protection Relay GasValve
Contact (+)
Power Supply Voltage
Contact (-)
Fuse32A protection

TECHNICAL REPORT | Galpón “La Comarca”
50
Display Data Visualization TD
Access Arrows
On Pilot Light EmergencyStop
Display Screen
Access to Board
Configuration KeysF1= Descent DataF2= Home / Up DataF3= Time ConfigurationF4= Return to Menu

TECHNICAL REPORT | Galpón “La Comarca”
51
Sensors Control of Raw Material
Samples
Sensortemperature
Sensormoisture