technical report music-theoretic estimation of chords and keys
TRANSCRIPT

Technical Report EHU-KZAA-TR-2012-04
UNIVERSITY OF THE BASQUE COUNTRYDepartment of Computer Science and Artificial
Intelligence
Music-Theoretic Estimation ofChords and Keys from Audio
Thomas RocherPierre Hanna
Matthias RobineDarrell Conklin
September 2012
San Sebastian, Spainwww.ccia-kzaa.ehu.eshttp://hdl.handle.net/10810/4562

Music-Theoretic Estimation of
Chords and Keys from AudioThomas Rocher, Pierre Hanna, Matthias Robine, and Darrell Conklin
Abstract
This paper proposes a new method for local key and chord estimation from audio signals. This
method relies primarily on principles from music theory, and does not require any training on a corpus
of labelled audio files. A harmonic content of the musical piece is first extracted by computing a
set of chroma vectors. A set of chord/key pairs is selected for every frame by correlation with fixed
chord and key templates. An acyclic harmonic graph is constructed with these pairs as vertices,
using a musical distance to weigh its edges. Finally, the sequences of chords and keys are obtained
by finding the best path in the graph using dynamic programming. The proposed method allows a
mutual chord and key estimation. It is evaluated on a corpus composed of Beatles songs for both
the local key estimation and chord recognition tasks, as well as a larger corpus composed of songs
taken from the Billboard dataset.
I. INTRODUCTION
Harmony, like rhythm, melody or timbre, is a central aspect of Western music. This paper focuses
on chord sequences and key changes, which are basic components of harmony. The field of automatic
audio chord and key estimation has been a very active field in recent years. The aim of these
methods is high accuracy, with the highest rate of audio frames labelled with correct chords (chords
that musicologists would annotate identically). In particular, the increasing popularity of Music
Information Retrieval (MIR) with applications using mid-level tonal features have clearly established
chord estimation as task of central importance in the field. For more than 5 years now, a variety of
T. Rocher is with the Department of Computer Science and Artificial Intelligence, University of the Basque Country
UPV/EHU, San Sebastian, Spain. [email protected]
P. Hanna and M. Robine are with LaBRI, University of Bordeaux, Talence, France. {robine,hanna}@labri.fr
D. Conklin is with the Department of Computer Science and Artificial Intelligence, University of the Basque
Country UPV/EHU, San Sebastian, Spain, and IKERBASQUE, Basque Foundation for Science, Bilbao, Spain.
2
methods have competed in the annual MIREX competition (an annual community-based framework
for the evaluation of MIR systems and algorithms) for audio chord extraction.
Over the years, several approaches to audio chord estimation have been proposed [1]–[5], generally
integrated in a Hidden Markov Model (HMM) approach [6], [7], which serves to decode the underlying
(or hidden) chord sequence. In 2010, three works used joint estimation of chord and tonal context
[8]–[10] to enhance chord estimation, relying on the fact that chords and local keys strongly interact to
form harmony. Those works led to a recent state-of-the-art method, which combines joint estimation
of chord, bass notes and local keys with a learning approach [11]. Despite achieving the best results
to date, the authors state the risk of over-fitting by pursuing a high accuracy on a limited training
corpus.
This paper proposes a complementary approach to jointly estimate sequences of chords and local
keys from audio. Few assumptions are made in terms of musical style, no training is required and the
only hypothesis is that the proposed system is meant to analyse tonal music, as it relies on Lerdahl’s
Tonal Pitch Step distance [12]. This distance is based on the properties of a chord in its harmonic local
context, and uses a geometric superposition to measure patterns of tension in the variations of the
harmony. Lerdahl’s approach was to provide a model to understand music experience and expectations
through patterns of tension and attraction, by taking into account research from cognitive science and
musicology.
The main contributions of the method described in the paper are the consideration of different time
resolutions, the use of music-theoretic information and the evaluation of chords and local keys on
the Beatles dataset, as well as the evaluation, on the chord level, of the newly released Billboard
dataset. The proposed method used for concurrent key and chord estimation is described in Section
II. Section III presents the experiments performed to evaluate the accuracy of the proposed method.
Conclusions and ideas for future work follow in Section IV.
II. METHOD DESCRIPTION
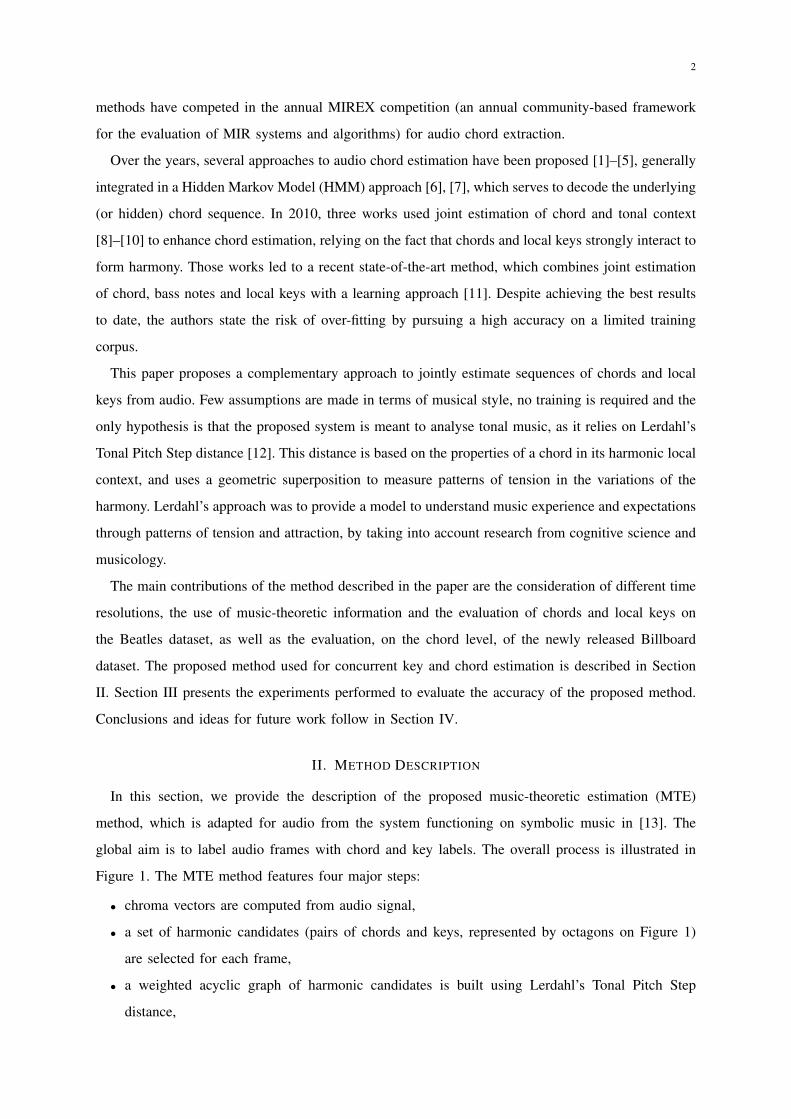
In this section, we provide the description of the proposed music-theoretic estimation (MTE)
method, which is adapted for audio from the system functioning on symbolic music in [13]. The
global aim is to label audio frames with chord and key labels. The overall process is illustrated in
Figure 1. The MTE method features four major steps:
• chroma vectors are computed from audio signal,
• a set of harmonic candidates (pairs of chords and keys, represented by octagons on Figure 1)
are selected for each frame,
• a weighted acyclic graph of harmonic candidates is built using Lerdahl’s Tonal Pitch Step
distance,

3
����
��
����
������
������
������
������
�����
����
����
�
Fig. 1. Graph of harmonic candidates (represented by octagons). Time appears from left to right. The thick line represent
the best path, and is produced by the MTE, providing a sequence of chords and keys.
• a dynamic programming step selects the final sequence of chords/keys corresponding to the best
path (illustrated with a thick line on Figure 1).
An additional step consists in post-smoothing the sequence, to correct isolated fragmentation in the
output.
A. Chroma Computation
The Non-Negative Least Squares (NNLS) chroma [14], widely popular in the recent chord estima-
tion literature, provides a pitch class description of an audio frame in the form of a 12 dimensional
vector. The influence of each pitch-class (C, C#, D, ...) is thus described by a real-valued number. This
number indicates the energy assigned to that particular pitch-class on the considered audio frame.
1) Feature parameters: The MTE method is evaluated using two datasets: the Beatles and Billboard
datasets (see Section III for more details). The Billboard dataset provides, along with the chord
annotations, the chromagram of each song, computed with the following parameters:
• a frame length of 16384 samples (∼ 0.37 sec),
• a hopsize of 2048 samples (∼ 0.05 sec),
• a rolloff of 1%, as recommended for pop songs [15].
We have thus chosen to apply the same parameters for both datasets (Billboard and Beatles) to get
a base chromagram, with the parameters described above.

4
2) Filter: In order to reduce the influence of noise, transients or sharp edges, we filter the
chromagram on several frames, as suggested in [3]. The filtering method used here is median filtering,
which has been widely used in image processing in order to correct random errors.
B. Selection of Harmonic Candidates
A harmonic candidate for a given frame is a pair C/K, where C represents a potential chord
and K represents a potential local key. This section presents the process for selecting one or several
chord/key pairs as harmonic candidate(s), and discard others.
1) Chord: The chords studied here are major and minor triads (12 major and 12 minor). Several
studies [1]–[3] have used chord templates to determine the likelihood of each of the 24 chords
according to a chroma vector. With 12 dimensional vectors, major/minor triadic chord profiles may
be defined as follows:
Cmaj = (1, 0, 0, 0, 1, 0, 0, 1, 0, 0, 0)
Cmin = (1, 0, 0, 1, 0, 0, 0, 1, 0, 0, 0)
with the remaining 11 major (resp. minor) chord templates being obtained by rotation of the Cmaj
(resp. Cmin) profile.
For each of the 24 chord templates, we compute a correlation score by scalar product between a
chord template T and a 12 dimensional chroma vector V :12∑i=1
(T [i]× V [i])
so that the higher the correlation, the more likely the chord corresponding to the template T is played
in the considered frame.
A direct template-based method (DTBM) for chord estimation thus consists in proposing the highest
correlated chord for the considered frame. In the multi-scale approach as described below, it is possible
to consider different highest correlated chords from different windowed chromas as candidates for
the same frame, since those different chord candidates may thus be reflecting different temporal
information.
2) Key: Key selection is carried out with the same approach as for chords, but with larger time
frame (∼30 sec) as keys have a larger time persistence than chords. The key profiles used are presented
in [16], and measure the 12 different pitch stabilities for a given key. These profiles led to the best
results in terms of key recognition in Temperley’s work [17].
Cmaj = (5, 2, 3.5, 2, 4.5, 4, 2, 4.5, 2, 3.5, 1.5, 4)
Cmin = (5, 2, 3.5, 4.5, 2, 4, 2, 4.5, 3.5, 2, 1.5, 4)

5
As with chord candidate computation, the correlation of each of the 24 keys (12 minors + 12 majors)
are computed using a scalar product between shifted key template and chroma vectors. A direct
template-based method (DTBM) for key estimation consists in proposing the highest correlated key
for the considered frame.
3) Harmonic Candidates: The harmonic candidates finally enumerated are all the possible com-
bination of previously selected keys and chords. If n chords and m keys are selected for a given
audio frame, n x m pairs are enumerated. For example, with Cmaj and Amin as selected chords
and Cmaj and Gmaj as compatible keys, the harmonic candidates enumerated would be Cmaj/Cmaj,
Cmaj/Gmaj, Amin/Cmaj and Amin/Gmaj.
4) Multi-scale Approach: Instead of relying exclusively on the base chromagram described in II-A1,
the MTE method considers two chromagrams for chord analysis using two distinct time resolutions,
one being qualified as “long”, the other as “short”. For each date, these chromagrams bring out
different temporal information, and may thus lead to an interesting combination. The general idea is
to add highest correlated chord candidates from shorter chromas to the highest chord candidate of
a given long chroma. We thus propose to consider, for each long chroma the two best candidates
from the two middle adjacent short chromas in addition to the best candidate from the long chroma.
These candidates can be identical, and thus, the theoretical number of distinct chords candidates can
vary from 1 to 3 (see Figure 2). If only the base chromagram is available and not the original audio
(the case for the Billboard dataset), the long and short chromagrams can be inferred from the base
chromagram described above (instead of being computed if the audio is available).
C. Lerdahl’s Tonal Pitch Step Distance
Once the harmonic candidates are enumerated for two consecutive frames, candidates of the first
frame are linked to each candidate of the second frame by an oriented edge. This edge is weighted
by a transition cost between the two harmonic candidates. This transition cost must take into account
both the different selected chords and the different selected local keys. To define such a transition
cost, we propose to consider Lerdahl’s Tonal Pitch Step (TPS) distance [12]. Several other distances
between chords and keys can be considered, but Lerdahl’s TPS distance is the only one to take into
account both chords and local keys, and has proved the most accurate on symbolic music analysis of
harmony [18]. This distance is based on the notion of a basic space. Figure 3.I shows the basic space
of the Cmaj chord in the Cmaj key, where each box represents a pitch class component. Lerdahl
defines the basic space of a given chord in a given key as the geometrical layering of:
a) the root of the given chord (root level),
b) the root and dominant of the given chord (fifths level),
c) the triad pitches of the given chord (triadic level),

6
� �
long
short short
Fig. 2. Illustration of the multi-scale approach. The top correlated chord from a long chroma (frame in plain line) is
considered as a candidate along with the two top correlated chord from two short chromas (frames in dotted line). The
number of distinct candidates per evaluation frame can thus vary from 1 to 3.
d) the diatonic pitches of the given key (diatonic level),
e) the chromatic pitches of the given key (chromatic level).
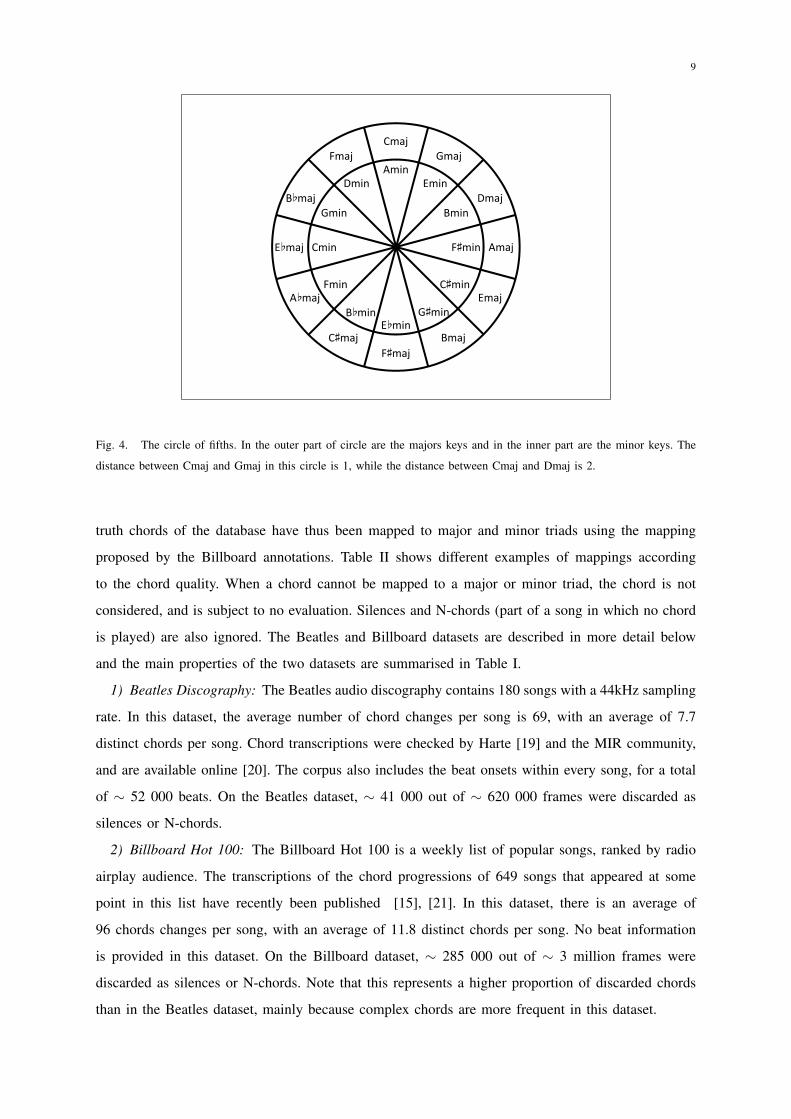
The circle of fifths, a common geometric representation of musical keys, is also used by Lerdahl’s
TPS distance. Figure 4 presents the circle of fifth, with major keys in the outer circle and minor keys
in the inner circle. Lerdahl proposes to consider distances in the circle of fifths, by considering the
minimal number of steps needed to shift one element into the other. If C/K represents the chord C
in the key K, Lerdahl defines the transition cost from C/K to C ′/K ′ as follows:
δ(C/K → C ′/K ′) = i+ j + k
where i is the distance between K and K ′ in the circle of fifths, j is the distance between C and C ′
in the circle of fifths and k is the number of non-common pitches (which are pitch class contributions
present in the basic space of C ′/K ′ and not in the basic space of C/K).
A calculation of transition between two harmonic candidates is illustrated in Figure 3, from
Cmaj/Cmaj to Gmaj/Gmaj (whose basic spaces are represented in Figures 3.I and 3.II). In this
example, i=j=1 because 1 step is needed to go from Cmaj to Gmaj in the circle of fifths. k=5 is the
number of contributions appearing in the basic space of of C ′/K ′ and not in the basic space of C/K
(greyed boxes in Figure 3.II). The distance is therefore 1+1+5=7.

7
The distance provides an integer cost from 0 to 13, and is adequate for a transition cost in the MTE
method, since both compatible chords and keys are involved in the cost computation. Nevertheless, this
distance offers a small range of possible values. This small range induces a lot of equality scenarios.
The Lerdahl’s TPS distance is thus slightly modified and the cost between two consecutive candidates
is set to iα + jβ + k, with i, j and k defined above. We choose α > 1 to discourage immediate
transitions between distant keys, and encourage progressive key changes, since modulations often
involve two keys close to each other in the circle of fifths. For the same reason with chords, we also
choose β > 1. After experiments, α and β have been set to 1.1 and 1.01.
D. Finding the Best Path
Once the graph between all the harmonic candidates is formed, the best path is found by dynamic
programming. The final selected path is the path minimizing its total cost along its edges. The final
path is illustrated in thick lines in Figure 1.
E. Post-smoothing Computation
Among the chord sequence selected by dynamic programming, some errors may still be corrected
by applying a post-smoothing treatment. For example, if an instrument (or a singer) plays a flattened
third (E[) as a blue note, it may induce a mode error on the selected chord (making Cmin as a chord
candidate and discarding Cmaj for the considered frame). For example, the chord sequence may thus
present several consecutive frames analysed as Cmaj which are followed by a single frame analysed
as Cmin, and then by another several Cmaj. A simple treatment on the sequence of chords may
resolve these kinds of errors.
Therefore it is proposed to apply a post-smoothing treatment to the chord sequence, by looking for
sequence of one or two chords surrounded by an uniform context of more than two symbols long.
When such a sequence is identified, it is replaced by symbol of the uniform context.
III. EXPERIMENTS
This section presents the datasets used for experiments, the evaluation procedure, and the influence
on the different parameters on the MTE method accuracy.
A. Datasets
Two different audio chord transcription datasets, the Beatles discography and the Billboard Hot 100
dataset, were used to evaluate the effect of the oracle on audio chord estimation. In the transcriptions,
chords have a root note and a type which belongs to a vast dictionary [19]. In this paper, we only focus
on the root note (C, C#, D, ..., B) and the mode (maj/min) of chords, as in [11]. All of the ground

8
(b)
(a)
(e)
(d)
(c)
C Cᅊ D Dᅊ E F Fᅊ G Gᅊ A Aᅊ B
(e)
I
(b)
(a)
(e)
(d)
(c)
C Cᅊ D Dᅊ E F Fᅊ G Gᅊ A Aᅊ B
(e)
II
Fig. 3. I: The basic space of the Cmaj chord in the Cmaj key. Levels (a) to (e) are respectively root, fifths, triadic, diatonic
and chromatic levels. II: The basic space of the Gmaj chord in the Gmaj key. Contributions appearing in Gmaj/Gmaj and
not in Cmaj/Cmaj are represented by greyed boxes.
9
E♭maj Amaj
Cmaj
B♭maj
Gmaj
Dmaj
Fmaj
Amin
Cmin F♯min
Gmin
Dmin Emin
Bmin
E♭maj Amaj
F♯maj
Emaj
C♯maj
A♭maj
Bmaj
E♭min
Cmin F♯min
Fmin
B♭min G♯min
C♯min
Fig. 4. The circle of fifths. In the outer part of circle are the majors keys and in the inner part are the minor keys. The
distance between Cmaj and Gmaj in this circle is 1, while the distance between Cmaj and Dmaj is 2.
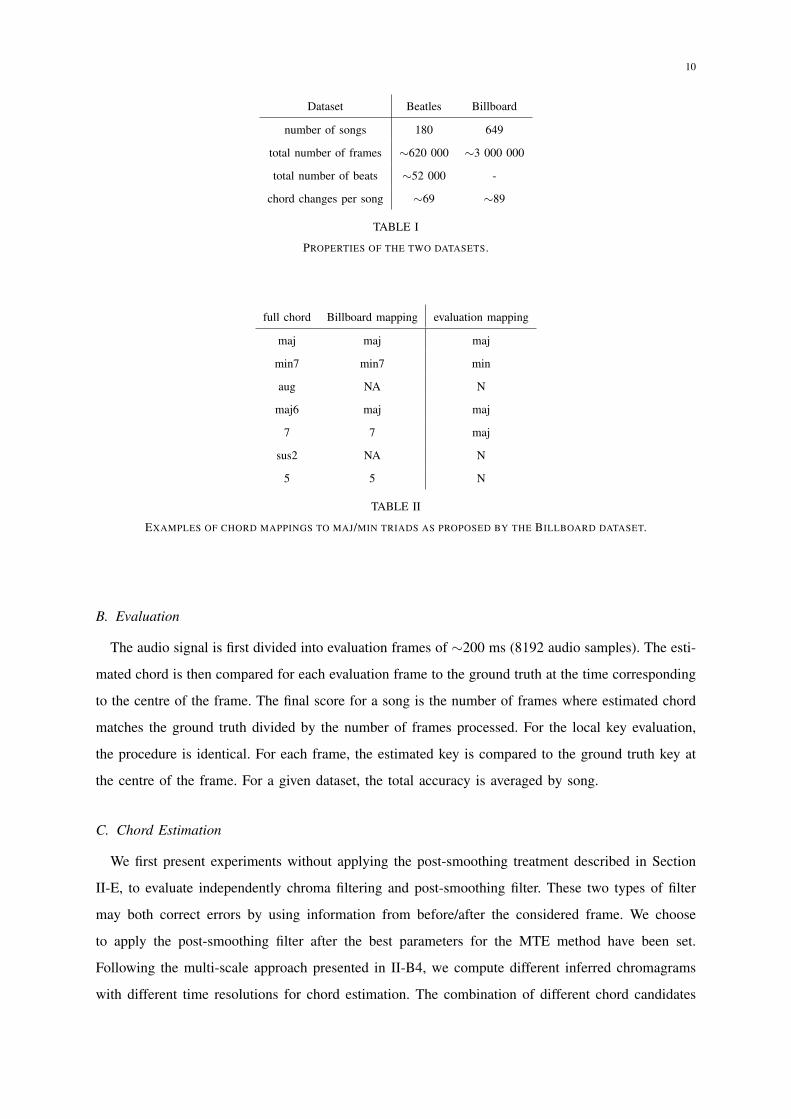
truth chords of the database have thus been mapped to major and minor triads using the mapping
proposed by the Billboard annotations. Table II shows different examples of mappings according
to the chord quality. When a chord cannot be mapped to a major or minor triad, the chord is not
considered, and is subject to no evaluation. Silences and N-chords (part of a song in which no chord
is played) are also ignored. The Beatles and Billboard datasets are described in more detail below
and the main properties of the two datasets are summarised in Table I.
1) Beatles Discography: The Beatles audio discography contains 180 songs with a 44kHz sampling
rate. In this dataset, the average number of chord changes per song is 69, with an average of 7.7
distinct chords per song. Chord transcriptions were checked by Harte [19] and the MIR community,
and are available online [20]. The corpus also includes the beat onsets within every song, for a total
of ∼ 52 000 beats. On the Beatles dataset, ∼ 41 000 out of ∼ 620 000 frames were discarded as
silences or N-chords.
2) Billboard Hot 100: The Billboard Hot 100 is a weekly list of popular songs, ranked by radio
airplay audience. The transcriptions of the chord progressions of 649 songs that appeared at some
point in this list have recently been published [15], [21]. In this dataset, there is an average of
96 chords changes per song, with an average of 11.8 distinct chords per song. No beat information
is provided in this dataset. On the Billboard dataset, ∼ 285 000 out of ∼ 3 million frames were
discarded as silences or N-chords. Note that this represents a higher proportion of discarded chords
than in the Beatles dataset, mainly because complex chords are more frequent in this dataset.
10
Dataset Beatles Billboard
number of songs 180 649
total number of frames ∼620 000 ∼3 000 000
total number of beats ∼52 000 -
chord changes per song ∼69 ∼89
TABLE I
PROPERTIES OF THE TWO DATASETS.
full chord Billboard mapping evaluation mapping
maj maj maj
min7 min7 min
aug NA N
maj6 maj maj
7 7 maj
sus2 NA N
5 5 N
TABLE II
EXAMPLES OF CHORD MAPPINGS TO MAJ/MIN TRIADS AS PROPOSED BY THE BILLBOARD DATASET.
B. Evaluation
The audio signal is first divided into evaluation frames of ∼200 ms (8192 audio samples). The esti-
mated chord is then compared for each evaluation frame to the ground truth at the time corresponding
to the centre of the frame. The final score for a song is the number of frames where estimated chord
matches the ground truth divided by the number of frames processed. For the local key evaluation,
the procedure is identical. For each frame, the estimated key is compared to the ground truth key at
the centre of the frame. For a given dataset, the total accuracy is averaged by song.
C. Chord Estimation
We first present experiments without applying the post-smoothing treatment described in Section
II-E, to evaluate independently chroma filtering and post-smoothing filter. These two types of filter
may both correct errors by using information from before/after the considered frame. We choose
to apply the post-smoothing filter after the best parameters for the MTE method have been set.
Following the multi-scale approach presented in II-B4, we compute different inferred chromagrams
with different time resolutions for chord estimation. The combination of different chord candidates
11
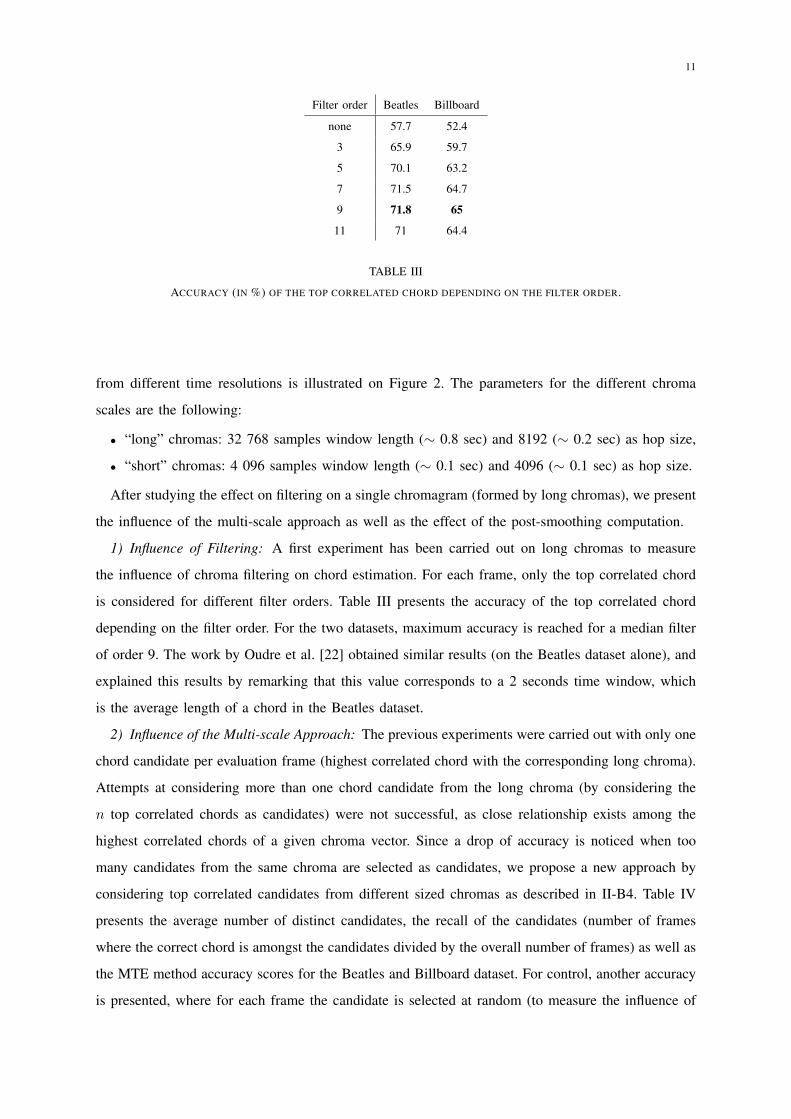
Filter order Beatles Billboard
none 57.7 52.4
3 65.9 59.7
5 70.1 63.2
7 71.5 64.7
9 71.8 65
11 71 64.4
TABLE III
ACCURACY (IN %) OF THE TOP CORRELATED CHORD DEPENDING ON THE FILTER ORDER.
from different time resolutions is illustrated on Figure 2. The parameters for the different chroma
scales are the following:
• “long” chromas: 32 768 samples window length (∼ 0.8 sec) and 8192 (∼ 0.2 sec) as hop size,
• “short” chromas: 4 096 samples window length (∼ 0.1 sec) and 4096 (∼ 0.1 sec) as hop size.
After studying the effect on filtering on a single chromagram (formed by long chromas), we present
the influence of the multi-scale approach as well as the effect of the post-smoothing computation.
1) Influence of Filtering: A first experiment has been carried out on long chromas to measure
the influence of chroma filtering on chord estimation. For each frame, only the top correlated chord
is considered for different filter orders. Table III presents the accuracy of the top correlated chord
depending on the filter order. For the two datasets, maximum accuracy is reached for a median filter
of order 9. The work by Oudre et al. [22] obtained similar results (on the Beatles dataset alone), and
explained this results by remarking that this value corresponds to a 2 seconds time window, which
is the average length of a chord in the Beatles dataset.
2) Influence of the Multi-scale Approach: The previous experiments were carried out with only one
chord candidate per evaluation frame (highest correlated chord with the corresponding long chroma).
Attempts at considering more than one chord candidate from the long chroma (by considering the
n top correlated chords as candidates) were not successful, as close relationship exists among the
highest correlated chords of a given chroma vector. Since a drop of accuracy is noticed when too
many candidates from the same chroma are selected as candidates, we propose a new approach by
considering top correlated candidates from different sized chromas as described in II-B4. Table IV
presents the average number of distinct candidates, the recall of the candidates (number of frames
where the correct chord is amongst the candidates divided by the overall number of frames) as well as
the MTE method accuracy scores for the Beatles and Billboard dataset. For control, another accuracy
is presented, where for each frame the candidate is selected at random (to measure the influence of

12
Distinct chords
Dataset per frame Recall Accuracy Control Accuracy
Beatles 1.55 79.4 72.8 61.6
Billboard 1.58 73.5 66.3 56.3
TABLE IV
INFLUENCE OF THE MULTI-SCALE APPROACH: NUMBER OF DISTINCT CHORDS IN ENUMERATION, RECALL AND MTE
METHOD ACCURACY (IN %) FOR THE BEATLES AND BILLBOARD DATASETS.
Method Beatles Billboard
DTBM 57.7 52.4
MTE 73.7 67.1
TABLE V
COMPARISON OF ACCURACY (IN %) BETWEEN MTE AND DTBM METHODS ON THE CHORD LEVEL.
Lerdahl’s TPS distance).
A first way to explain the improvement induced by the the multi-scale approach is by considering
the decrease of average number of distinct chord candidates, which is always less than 2 (even if in
theory, it could reach 3). This decrease means fewer chord candidates to consider for the MTE, thus
decreasing the likelihood to select an incorrect chord. Another is to underline the impact of the the
chord candidate selection with the multi-scale configuration, as opposed to the single scale chroma
configuration which only provides one origin for chord candidates. By applying the post-smoothing,
the MTE method accuracy on chord estimation reaches 73.7% for the Beatles dataset, and 67.1% for
the Billboard dataset.
3) Comparison with a Direct Template-based Method: We compare the MTE method to a direct
template-based method (DTBM). Such a method labels each frame according to the top correlated
chord template. Results can be found in Table V, and show that MTE method outperforms the DTBM
by more than 15% on each dataset.
D. Local Key Estimation
Key estimation is performed on the Beatles dataset. We compare the key sequence output of the
MTE to a direct template-based method (DTBM), also with a window size of ∼ 30 sec. For the MTE
method, the number of key candidates per frame is set to 3. Results, shown in Table VI, detail the
estimated key error made by the two compared method, by presenting relative and neighbor errors
as well as correct key accuracy. Relative keys share the same key signature (for example, Cmaj and

13
Errors
Method Correct Relative Neighbor Unrelated
MTE 66.4 2.1 13.6 16.4
DTBM 59.4 1.8 18.2 20.6
TABLE VI
ACCURACY (IN %) DEPENDING ON THE TYPES OF ERROR FOR KEY ESTIMATION ON THE BEATLES DATASET. ERROR
TYPES: CORRECT KEYS, RELATIVE KEYS, NEIGHBOR KEYS AND UNRELATED.
Chord Key Both
C K C K
Accuracy 72.1 57.8 73.7 66.4
TABLE VII
MTE METHOD ACCURACY (IN %) CONSIDERING CHORD/KEY, ONLY CHORD AND ONLY KEY AS HARMONIC
CANDIDATES, ON THE BEATLES DATASET.
Amin are relative keys of each other). A neighbor key differs from the original key by one step in the
circle of fifths. Each key has two neighbors (for instance, Cmaj has Fmaj and Gmaj as neighbors).
The MTE method outperforms the DTBM by estimating more correct keys (66.4% compared to
59.4%). Fewer errors due to unrelated key (different from neighbor or relative) can be observed for
the MTE method compared to the DTBM (16.4% compared to 20.6%).
E. Reciprocal Benefit of Simultaneous Estimation
We present here an evaluation to measure the reciprocal influence of the chord and key simultaneous
estimation. We compared the MTE method, which takes into account harmonic candidates (i.e. pairs
of chord and key candidates), to the same method with only chord or only key candidates. When
only chords (resp. keys) are considered, the distance used to weigh edges in the harmonic graph
is edited to take only chord (resp. key) into account. Results on the Beatles dataset are shown in
Table VII. We note that both key and chord estimation are better when the harmonic candidate is
the chord/key pair. Chord estimation increases from 72.1% to 73.7% (which represents 2323 more
evaluation frames correctly estimated and a p-value of 1e-22 according to a two-proportion z-test),
while key estimation accuracy increases from 57.8% to 66.4%. The chord estimation difference is
less important than the key estimation as the average number of chord candidates is smaller than the
average number of key candidates (∼1.5 for chords compared to 3 for keys).

14
IV. CONCLUSION AND FUTURE WORK
This paper presented a new method for chord and local key estimation where the estimation of chord
sequence and key changes are performed simultaneously. Contrary to state-of-the-art methods [11],
no training is required and any risk of over-fitting may thus be avoided. It therefore will be of
great interest to see the relative performance of our untrained method versus trained methods on
completely unseen data, as more audio chord transcriptions become available. The MTE method
described in this paper uses music-theoretic considerations, and mainly relies on Lerdahl’s Tonal
Pitch Step Distance [12] to model tension and movements of the harmony through time. A multi-
scale approach for chroma vectors was proposed, and showed an increase in accuracy when the
chords are selected from different sized chromas. Both key and chord estimation outperform direct
template-based methods. We have notably shown the effect of filtering, as well as the effect of taking
into account different time resolutions. Also notable is the fact that separate evaluations show that
both local key and chord estimations complement each other, as a direct consequence of the use of
music-theoretic chord distances.
Future work will involve analysis of different chord types, silences and no-chord detection as
well as weighting the harmonic graph of the MTE method in a probabilistic approach. Applications
for MIR using both local key and chord information will also be studied. For example, harmonic
information may be helpful for estimating the musical structure of pieces since changes of local key
generally occur at the beginning of new structural segments.
ACKNOWLEDGMENTS
This research was partially supported by a grant Modelos segmentales por deteccion de acordes
de audio from the Departamento de Industria, Innovacion, Comercio y Turismo (programme Saiotek
2010), Gobierno Vasco, Spain.
REFERENCES
[1] C. Harte and M. Sandler, “Automatic chord identification using a quantised chromagram,” in Proceedings of the Audio
Engineering Society, Barcelona, Spain, 2005, pp. 291–301.
[2] K. Lee, “Automatic chord recognition from audio using enhanced pitch class profiles,” in Proceedings of the
International Computer Music Conference (ICMC), New Orleans, USA, 2006, pp. 306–313.
[3] L. Oudre, Y. Grenier, and C. Fevotte, “Template-based chord recognition: influence of the chord types,” in Proceedings
of the International Society for Music Information Retrieval (ISMIR), Kobe, Japan, 2009, pp. 153–158.
[4] J. Bello and J. Pickens, “A robust mid-level representation for harmonic content in music signals,” in Proceedings of
the International Society for Music Information Retrieval (ISMIR), London, UK, 2005, pp. 304–311.
[5] J. Pauwels, J. Martens, and M. Leman, “The influence of chord duration modeling on chord and local key extraction,”
in Proceedings of the International Conference on Machine Learning and Applications. Honolulu, Hawaı, USA:
IEEE, December 2011, pp. 136–141.

15
[6] K. Lee and M. Slaney, “Acoustic chord transcription and key extraction from audio using key-dependent HMMs
trained on synthesized audio,” IEEE Transactions on Audio, Speech and Language Processing, vol. 16, no. 2, pp.
291–301, 2008.
[7] M. Khadkevich and M. Omologo, “Use of hidden markov models and factored language models for automatic chord
recognition,” in Proceedings of the International Society for Music Information Retrieval (ISMIR), Kobe, Japan, 2009,
pp. 561–566.
[8] M. Mauch and S. Dixon, “Simultaneous estimation of chords and musical context from audio,” IEEE Trans. on Audio,
Speech and Language Processing, pp. 1280–1289, 2010.
[9] T. Rocher, M. Robine, P. Hanna, and L. Oudre, “Concurrent estimation of chords and keys from audio,” in Proceedings
of the International Society on Music Information Retrieval (ISMIR), Utrecht, Netherlands, August 2010, pp. 141–146.
[10] J. Pauwels and J. Martens, “Integrating musicological knowledge into a probabilistic framework for chord and key
extraction,” in Proceedings of the 128th AES Convention. London, UK: Audio Engineering Society (AES), 2010,
p. 9.
[11] Y. Ni, M. McVicar, R. Santos-Rodriguez, and T. De Bie, “An end-to-end machine learning system for harmonic
analysis of music,” IEEE Transactions on Audio, Speech, and Language Processing, vol. 20, no. 6, pp. 1771 –1783,
aug. 2012.
[12] F. Lerdahl, Tonal Pitch Space. Oxford University Press, 2001.
[13] T. Rocher, M. Robine, P. Hanna, and R. Strandh, “Dynamic chord analysis for symbolic music,” in Proceedings of
the International Computer Music Conference (ICMC), Montreal, Quebec, Canada, August 2009.
[14] M. Mauch and S. Dixon, “Approximate note transcription for the improved identification of difficult chords,” in
Proceedings of the International Society for Music Information Retrieval (ISMIR), Utrecht, Netherlands, October
2010, pp. 135–140.
[15] “Billboard “Hot 100” website,” http://ddmal.music.mcgill.ca/billboard, [Online; accessed April-14-2012].
[16] D. Temperley, The Cognition of Basic Musical Structures. The MIT Press, 1999.
[17] ——, “What’s Key for Key? The Krumhansl-Schmuckler Key-Finding Algorithm Reconsidered,” Music Perception,
vol. 17, no. 1, pp. 65–100, 1999.
[18] T. Rocher, M. Robine, P. Hanna, and M. Desainte-Catherine, “A survey of chord distances with comparison for chord
analysis,” in Proceedings of the International Computer Music Conference (ICMC), New York, New York, USA, June
2010, pp. 187–190.
[19] C. Harte, M. Sandler, and A. Samer, “Symbolic representation of musical chords: A proposed syntax for text
annotations,” in Proceedings of the 4th International Society for Music Information Retrieval (ISMIR), 2005, pp.
66–71.
[20] “Isophonics website,” http://www.isophonics.net, [Online; accessed April-14-2012].
[21] J. Burgoyne, J. Wild, and I. Fujinaga, “An expert ground truth set for audio chord recognition and music analysis,” in
Proceedings of the International Society for Music Information Retrieval (ISMIR), Miami, USA, October 2011, pp.
633–638.
[22] L. Oudre, Y. Grenier, and C. Fevotte, “Chord recognition using measures of fit, chord templates and filtering methods,”
in Proceedings of the IEEE Workshop on Applications of Signal Processing to Audio and Acoustics (WASPAA), New
York, USA, 2009, pp. 9–12.