technical notes on the updated dfc star rating … · technical notes on the updated dialysis ......
TRANSCRIPT

June 2016
Technical Notes on the Updated Dialysis Facility
Compare Star Rating Methodology
Contents
Introduction ..................................................................................................................................................... 2
DFC Quality Measures Used in Calculating the Star Ratings ............................................................................ 2
Quality Measures Used in Star Rating Calculation .............................................................................. 2
Overview of the Methodology ......................................................................................................................... 3
Developing Quality Measure Domains ............................................................................................... 3
Measure Scoring ................................................................................................................................. 5
Calculating Measure Scores for the Current Year .............................................................................. 9
Combining Measure Scores into Final Facility Scores ..................................................................................... 9
Translating Final Scores to Star Ratings ......................................................................................................... 10
Defining Final Score Cutoffs in the Baseline Year ............................................................................. 10
Assigning Star Ratings in the Current Year ....................................................................................... 10
Updated Scoring Methodology: Results ....................................................................................................... 11
Summary of Changes Implemented for the DFC Star Ratings ....................................................................... 13
Appendix ........................................................................................................................................................ 14
A detailed example of scoring standardized measures .................................................................... 14
A detailed example of scoring percentage measures ....................................................................... 14
References ..................................................................................................................................................... 15

June 2016
Introduction
The Centers for Medicare & Medicaid Services (CMS), through a contract with the University of Michigan
Kidney Epidemiology and Cost Center (UM-KECC), developed the Dialysis Facility Compare (DFC) Star
Rating System to rate the overall quality of care provided by dialysis facilities. Each facility receives a
rating of between 1 and 5 stars. Facilities with 5 stars are considered to deliver much above average
quality of care and those with 1 star are considered to deliver care that is rated much below average
quality compared to other dialysis facilities in the United States. This technical report describes the
updated methodology developed for the DFC Star Rating system, and highlights changes to the
methodology originally implemented in January 2015 on the Medicare DFC website. The changes
primarily focus on measure scoring relative to a baseline year in order to show facility improvement. The
update reflects input received from a Technical Expert Panel (TEP) and other stakeholder input on the
scoring of measures and calculation of the final Star Ratings.
The technical report is organized as follows: (1) Identification of DFC measures used in the Star Rating
and description of methods used to develop measure domains. (2) Definition of measure scores in a
baseline year and implementation of these scores in any subsequent current year (the current year
refers to the calendar year of data that is being presented as new on DFC). (3) Description of combining
measure scores to create a final score for each facility. (4) Discussion of final score cutoff definitions for
the Star Rating categories in the baseline year and implementation in any subsequent current year.
DFC Quality Measures Used in Calculating the Star Ratings
The Dialysis Facility Compare (DFC) Quality Measures (QMs) used in the updated Star Ratings are the
same measures that were included in the original Star Rating reported on DFC in January 2015, but are
updated to include more current results. Specifically, nine of the thirteen QMs reported on the
Medicare DFC website are used to calculate the Star Rating for facilities based on the October 2016
release date (Calendar Year 2015 data).
Quality Measures Used in Star Rating Calculation
1. Standardized Transfusion Ratio (STrR) (lower is better, updated yearly)
2. Standardized Mortality Ratio (SMR) (lower is better, updated yearly)
3. Standardized Hospitalization Ratio (SHR) (lower is better, updated yearly)
4. Percentage of adult hemodialysis patients (HD adult) who had enough wastes removed from their blood during dialysis: Kt/V greater than or equal to 1.2 (higher is better, updated quarterly)
5. Percentage of pediatric hemodialysis patients (HD pediatric) who had enough wastes removed from their blood during dialysis: Kt/V greater than or equal to 1.2 (higher is better, updated quarterly)

June 2016
6. Percentage of adult peritoneal dialysis patients (PD adult) who had enough wastes removed from their blood during dialysis: Kt/V greater than or equal to 1.7 (higher is better, updated quarterly)
7. Percentage of adult patients who received treatment through an arteriovenous fistula (AV fistula) (higher is better, updated quarterly)
8. Percentage of adult patients who had a catheter (tube) left in a vein 90 days or longer, for their regular hemodialysis treatment (catheter >90 days) (lower is better, updated quarterly)
9. Percentage of adult dialysis patients who had an average calcium over the past three months greater than 10.2 mg/d (hypercalcemia) (lower is better, updated quarterly)
To improve the ability to compare facilities with HD adult, HD pediatric, and PD adult patients, the three
Kt/V measurements are combined into a single measure. The percentage of patients achieving Kt/V
greater than the specified thresholds for each of the three respective patient populations (adult PD
patients, adult HD patients, and pediatric HD patients) was weighted based on the number of patient-
months of data available. The resulting measure (all Kt/V) represents the percentage of total dialysis
patients eligible for the measure who had enough wastes removed from their blood (Kt/V greater than
or equal to the specified threshold). After combining these measures, seven final quality measures are
used to calculate the Star Rating.
Overview of Methodology
Developing Quality Measure Domains
The seven final quality measures are further grouped into different quality measure domains, which are
derived in the same way as in the original Star Rating methodology.
Domains are empirically derived by using factor analysis, which assesses correlations among quality
measures used in the Star Rating. Factor analysis detects underlying latent factors that are the source of
correlations between variables. The method informed the creation of three domains of quality
measures for previous iterations of the DFC Star Rating. Three outcome measures for transfusions,
mortality, and hospitalization (STrR, SMR, and SHR) form the first domain, which is named “Standardized
Outcomes (SHR, SMR, STrR)”. The AV fistula and catheter measures formed the second domain, which is
named “Other Outcomes 1 (fistula, catheter >90 days).” The all Kt/V and hypercalcemia QMs form the
third domain which is named “Other Outcomes 2 (Kt/V, hypercalcemia).” These domains are equally
weighted in determining the final score for the Star Rating.
In the updated methodology, factor analysis is only conducted for the baseline year. The updated
common factor analysis with 2014 data (the baseline year used to set scores for the quality measures in
the updated DFC Star Rating) confirmed the appropriateness of retaining the current domains. Results
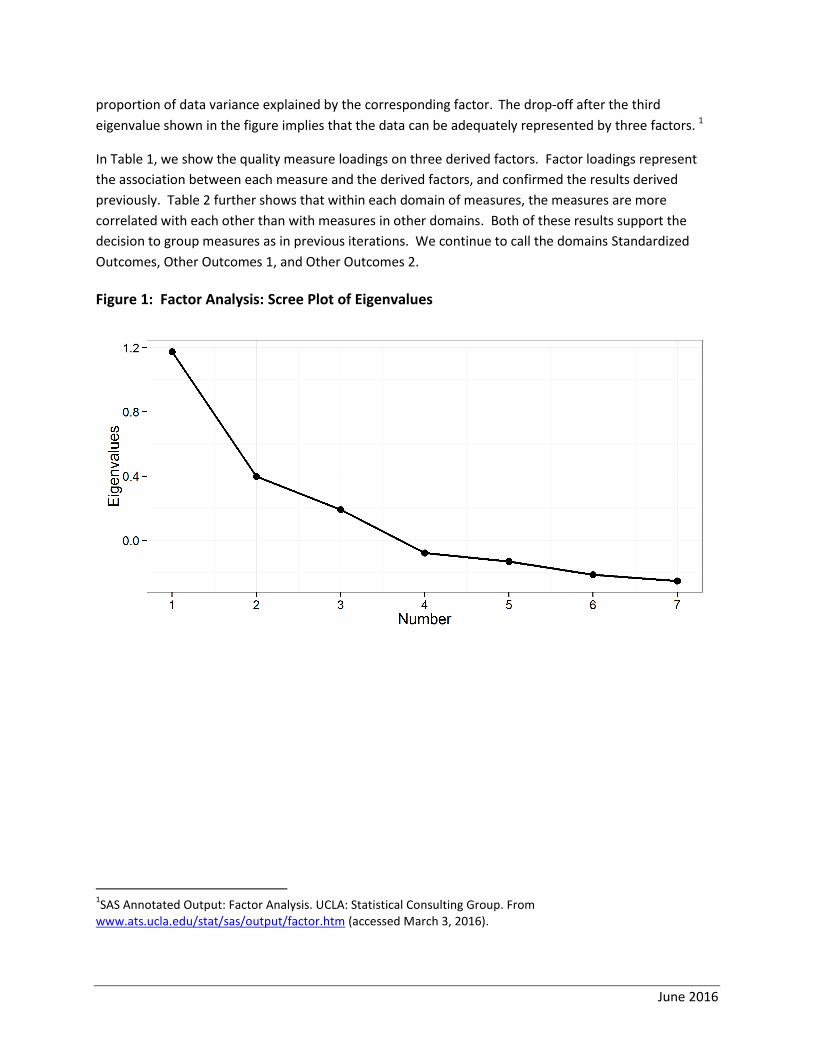
of the updated analysis are summarized in Figure 1 and Table 1. In Figure 1, each eigenvalue reflects the
June 2016
proportion of data variance explained by the corresponding factor. The drop-off after the third
eigenvalue shown in the figure implies that the data can be adequately represented by three factors. 1
In Table 1, we show the quality measure loadings on three derived factors. Factor loadings represent
the association between each measure and the derived factors, and confirmed the results derived
previously. Table 2 further shows that within each domain of measures, the measures are more
correlated with each other than with measures in other domains. Both of these results support the
decision to group measures as in previous iterations. We continue to call the domains Standardized
Outcomes, Other Outcomes 1, and Other Outcomes 2.
Figure 1: Factor Analysis: Scree Plot of Eigenvalues
1SAS Annotated Output: Factor Analysis. UCLA: Statistical Consulting Group. From
www.ats.ucla.edu/stat/sas/output/factor.htm (accessed March 3, 2016).

June 2016
Table 1: Factor Analysis: Loadings on Rotated Factors
Factor 1 Factor 2 Factor 3
SMR 37* 17 12
SHR 55* 13 4
STrR 53* 8 1
Kt/V 11 -9 36*
Hypercalcemia 1 7 35*
Fistula 14 55* 12
Catheter >90 days
17 55* 16
Table 2: Spearman Correlation of Measures (Measures realigned so higher values are better)
Measures STrR SHR SMR All Kt/V Hypercalcemia Fistula Catheter >90 days
STrR 1.000 0.423 0.227 0.083 0.008 0.134 0.131
SHR 1.000 0.239 0.139 0.016 0.152 0.189
SMR 1.000 0.145 0.018 0.149 0.100
All Kt/V 1.000 0.277 0.094 0.102
Hypercalcemia 1.000 0.091 0.102
Fistula 1.000 0.410
Catheter >90 days
1.000
Measure Scoring
As the DFC QMs have different distributions and scales, we transform the values of individual
measures to measure scores in order to make them comparable across different measures and
different facilities. In this report, the term “measure value” refers to the original value that a facility
obtains on a quality measure (e.g., 65% with fistula). The term “measure score” refers to the score
associated with a specific measure value that is used in generating the DFC Star Rating. The scoring
methodology is described further below.
Baseline Year
In the updated methodology, the measure scores associated with a measure value are defined according
to the criteria established in the baseline year. That is, every possible value for a quality measure is

June 2016
assigned a measure score based on analyzing the baseline year data. The initial baseline year will be data
from 2014, which was released publically on Dialysis Facility Compare in October of 2015.This allows
facilities to maintain or improve their Star Rating if they maintain or improve performance on the quality
measures compared to the baseline year score. A new baseline will be established when the Star Rating
distribution becomes ineffective at communicating differences in outcomes between facilities due to
shifting to the extreme and/or when individual measures are added or removed.
In order to implement the baseline year score, it is important to recognize that SMR, SHR, and STrR
measures represent ratios (observed events/expected events) based on expected events relative to the
current year. Before applying scores to standardized ratio measures in the current year, we multiply
these ratios by an adjustment factor. The adjustment factor, which accounts for differences in
population event rates between the baseline year and the current year, is applied so that an adjusted
current year ratio value reflects the same value it would have taken on in the baseline year. The
adjustment factor multiplied to the standardized ratio is the same for all facilities in the current year; it
is the average national observed event rate in the current year divided by the average national observed
event rate in the baseline year. Current year refers to the calendar year of data that is being presented
as new on DFC. For this iteration of the Star Ratings, the current year will be data from Calendar Year
2015, which will be released publically on the Dialysis Facility Compare web site in October 2016.
To illustrate, we provide an example using the 2013 data as a baseline with 2014 serving as the current
year. In Table 3, the STrR example shows the adjustment that would be made for data collected in 2014
(i.e., current year) if the baseline year being implemented was 2013:
Table 3: Developing STrR adjustment factor for 2014 data (with 2013 as baseline year)
Year
2013 2014
Transfusions per patient year 0.433 0.408
Adjustment factor 0.408
0.433 = 𝟎. 𝟗𝟒𝟏
Since the transfusion event rate was lower in 2014 than in 2013, the expected number of events for the
average facility is lower in 2014. By multiplying STrR in 2014 by a factor of 0.941 to create an adjusted
STrR to use in the Star Rating, these facilities are effectively being measured by 2013 criteria.
Implementation of the baseline year fundamentally changes the interpretation of the measure scores
and the resulting final facility scores and Star Ratings. In the original system, the values and ratings
reflected the comparison of the specific facility to its peers in the same year. The revised system’s
values and ratings have the interpretation of how the facility performed in the current year relative to
the typical facility in the baseline year. For example, if the current year is 2016 and the baseline year is

June 2016
2014, a facility’s values and ratings will reflect how well its current year performance would have rated
in comparison the performance of peer facilities two years earlier.
Baseline Year Measure Scoring Methodology
This section outlines how the baseline year data is used to define measure scores. The measure
values in the current DFC Star Rating are either ratios or percentages. Different scoring methods are
applied to these two different types of measures when developing scores in the baseline year.
Percentage Measures
The four percentage measures (Kt/V, hypercalcemia, catheter >90 days, and fistula) vary in their
distribution. These measures are scored with truncated z-scores in the updated methodology.
Truncated z-scores represent the number of standard deviations away from the mean, truncated at a
maximum/minimum allowed value. During the truncation process, these measures are iteratively re-
scored to ensure a final mean of 0 and variance of 1.
The scoring algorithm follows:
Percentage measures in the baseline year are realigned so that the highest value (100) represents care much above average and the lowest value (0) represents care that is much below average. This is to ensure scored measures have the same directionality before they are combined.
Calculate the z-scores of realigned measures. All scored measures now have mean of 0 and variance of 1 at this step. Variance stabilization ensures that measures are given equal influence if equally weighted in the rating.
Perform truncation of the z-scores at an upper and lower bound on the z-score distribution for each measure.
These truncated scores are then subtracted by their mean and divided by their standard deviation to ensure the final truncated z-scores still have mean of 0 and variance of 1. The upper and lower truncation bounds are different for each measure and are chosen so that all final measure scores have a maximum range of -2.58 to 2.58. A detailed example is shown in the Appendix.
Highly skewed measures have the potential to result in large z-scores for facilities in the tail of the
measure. These large scores may exert too much influence on the Star Rating. Limiting the range of the
scores through truncation ensures that Star Ratings are not determined by outlier performance on a
single measure. Figure 2 shows the distribution of measure values for Kt/V on the left and the
distribution of measure scores for Kt/V on the right.

June 2016
Figure 2: Example of Scoring Kt/V
Standardized Ratio Measures
The three standardized ratio measures are scored differently than the four percentage measures since
the quality associated with a unit change in a ratio measure is not likely to be equally spaced. For
example, the quality difference between ratios of 0.1 and 1 is not the same as the quality difference
between ratios of 1 and 1.9. Probit scoring, a ranking approach described below, better reflects spacing
differences than z-scores, which assume equal spacing. In addition, since the probit function maps
percentiles of the standardized ratio measures to a distribution with mean 0 and variance 1, this type of
scoring can be easily combined with the percentage measures (Kt/V, hypercalcemia, catheter >90 days,
fistula), which are scored with truncated z-scores that also have mean 0 and variance 1. For this reason,
the probit scoring technique is used for the ratio measures to define scores in the baseline year.
To create probit scores, we input a “percentile/100” into the probit function, ɸ -1, the inverse cumulative
distribution function for the standard normal distribution. This produces the normal quantile associated
with the input percentile. Minimum and maximum values of probit scores are determined by precision
of the percentile input into the probit function. The DFC Star Rating uses percentiles ranging from 0.5 to
99.5 in increments of 0.5, resulting in 199 distinct percentiles. The associated minimum probit score is
ɸ-1(0.5/100) = -2.58 and the maximum probit score is ɸ -1(99.5/100) = 2.58.
The probit scores for ratio based measures and the truncated z-scores for percentage based measures
need to have the same range of values when scoring. Therefore, the maximum and minimum probit
scores (±2.58) are chosen as the cutoffs to truncate the z-scores.
The probit scoring algorithm at the baseline year follows:
1. Calculate the percentiles of the baseline year measure values, which are to be fed into the probit function.
2. Realign the percentiles so that the highest value (99.5) represents care much above average and the lowest value (0.5) represents care much below average. This is to ensure the same directionality before combining measures.
3. Map the percentiles to the probit scores: probit score = ɸ-1 (percentile ÷ 100). All scored measures now have mean 0 and variance 1 at this step.

June 2016
Figure 3 shows the distribution of measure values for SMR on the left (where lower values are better)
and the distribution of measure scores for SMR on the right (where higher scores are better).
Figure 3: Example of Scoring SMR
Calculating Measure Scores for the Current Year
Percentage Measures
The key idea behind scoring measures relative to the baseline year data is to map each measure
value to the same score that the measure value would have been mapped to if it had been observed
in the baseline year. Z-scores in the current year are therefore calculated by subtracting the mean
and dividing by the standard deviation of the measure in the baseline year. These z-scores are then
truncated at the same values as truncated in the baseline year and re-standardized using the mean
and the standard deviation of the truncated z-scores in the baseline year. A detailed example is
shown in Tables 5 and 6 in the Appendix.
Ratio Measures
Current year facility ratios are first multiplied by the adjustment factor described earlier in the report
(Table 3) to create individual facility adjusted ratios. Each adjusted ratio is mapped to the same
percentile that the ratio would have been mapped to if it had been observed in the baseline year. The
cutoffs used for the percentiles are determined by the best measure value within each percentile in the
baseline year. More detail is provided in the appendix.
Combining Measure Scores into Final Facility Scores
In the DFC Star Rating, the measure scores are combined to create a final facility score for each facility.
Each facility is first given domain scores between -2.58 and 2.58 by averaging the measure scores within
each of the three domains. Facilities are then given a final score between -2.58 and 2.58 by averaging
the domain scores. Facilities are given final scores as long as they have at least one measure in each
domain. However, a few facilities serve PD patients only and therefore do not have values for the two

June 2016
measures in the Other Outcomes 1 domain (fistula, catheter >90 days). These facilities are not excluded
from the Star Rating, but, instead, will be rated based on the average scores for the other domains.
As noted above, with the exception of PD-only facilities, all facilities will receive a rating if they have at
least one measure in each domain. Missing values for facilities that qualify for ratings are assigned the
mean of the scores given to that measure in the current year. This method of imputation ensures that
one measure does not exert too much influence on the domain score, and in turn, the final score used
to determine the Star Rating. For example, if one facility had the maximum measure score of 2.58 for
STrR and had missing values for SMR and SHR, it would not be appropriate to assume that the
Standardized Ratio Measure Domain should be given the maximum score of 2.58 based on the one
measure for that domain (e.g., STrR). By imputing the average score for the SMR and SHR measure, we
instead give the domain a submaximal above average score. In this example, this facility is still
recognized as above average for this domain, but the domain score will not be based solely on the one
observed score for STrR. This limits the measure score of STrR from being too influential on the final
facility score.
Translating Final Scores to Star Ratings
To translate the final facility scores into 5 Star Rating categories, 4 cut-offs for the final facility scores are
determined by data from the baseline year (2014). Determining these cutoffs in the baseline year
further ensures that facilities are rated by the same criteria in subsequent years until a future re-
baselining.
Defining Final Score Cutoffs in the Baseline Year
Final scores for the 2014 baseline year facilities were calculated for the purpose of determining final
score cutoffs for the Star Ratings. Final score cutoffs for the baseline year (CY 2014) are set so that 10%,
20%, 40%, 20%, 10% facilities are 1-, 2-, 3-, 4-, 5-star facilities, respectively. These cutoffs are retained
and further used to define Star Rating categories in the October 2016 Star Ratings, and in future Star
Ratings (until a new baseline year is established).
Assigning Star Ratings in the Current Year
The final score cutoffs that are defined using the baseline year data are then used to assign Star Ratings
to facilities for the current year. If the population of facilities improves in their measure performance
from the baseline year, more facilities are likely to be in the higher Star Rating categories compared to
the baseline year as they are being compared to the lower average performance that prevailed in the
earlier baseline year rather than relative to the performance of their peers in the current year. In
contrast to the original methodology, in this updated methodology the distribution of Star Ratings is not
fixed for determining current year Star Ratings. When facilities move up in Star Ratings other facilities
will not necessarily move down into lower Star Ratings, unless their performance declined compared to
the baseline year.

June 2016
Updated Scoring Methodology: Results
Due to the current data availability, we provide an example of implementing the updated methodology
with 2014 as the current year and 2013 as the baseline year for determining measure scores and Star
Rating cutoffs. In Figure 4, we show the distribution of final facility scores in 2014 using scoring criteria
developed with 2013 as the baseline year. The vertical lines in the figure represent the Star Rating
boundaries developed in the baseline year (2013). Since average measure values were better in 2014
than 2013, the final score distribution has shifted right, resulting in more facilities in the higher Star
Rating categories.
Figure 4: Distribution of Final Facility Scores in 2014 (scored and rated by 2013 baseline year
criteria)
* Red Lines represent Star Rating boundaries defined in the baseline year (2013 in this example)
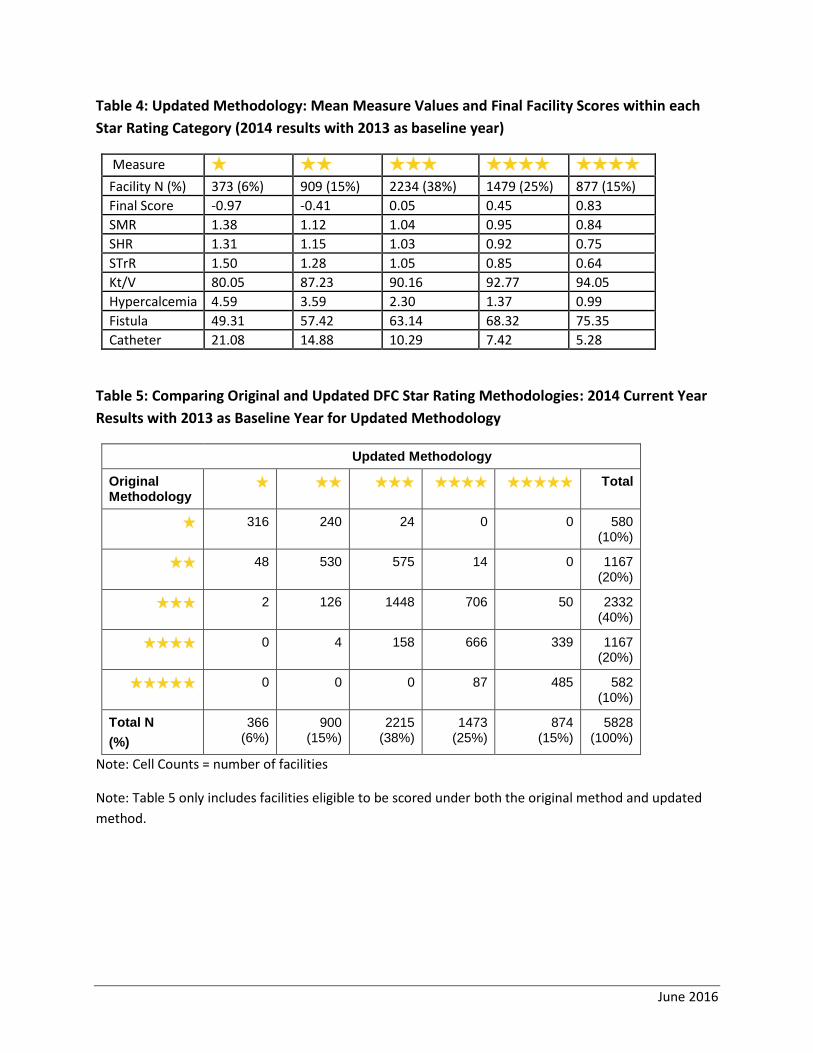
In Table 4, we show the mean final score and measure value within each Star Rating category for this
example. The average measure values observed in a given Star Rating category in 2014 are consistently
better than the average measure values observed in a lower Star Rating category. Additionally, we
provide the number and percentage of facilities in each category. In this example, there were
approximately 5% more facilities in each of the 4 and 5 star categories than in 2014 compared to the
baseline year (i.e., in the 2013 baseline year 20% of facilities were assigned 4-stars; 10% assigned 5-
stars). Similarly, there are fewer facilities assigned 1-star in 2014 compared to the baseline year (6% vs
10%).
June 2016
Table 4: Updated Methodology: Mean Measure Values and Final Facility Scores within each
Star Rating Category (2014 results with 2013 as baseline year)
Measure ★ ★★ ★★★ ★★★★ ★★★★★ Facility N (%) 373 (6%) 909 (15%)
15.48%
15.48%
2234 (38%) 1479 (25%) 877 (15%)
Final Score -0.97 -0.41 0.05 0.45 0.83
SMR 1.38 1.12 1.04 0.95 0.84
SHR 1.31 1.15 1.03 0.92 0.75
STrR 1.50 1.28 1.05 0.85 0.64
Kt/V 80.05 87.23 90.16 92.77 94.05
Hypercalcemia 4.59 3.59 2.30 1.37 0.99
Fistula 49.31 57.42 63.14 68.32 75.35
Catheter 21.08 14.88 10.29 7.42 5.28
Table 5: Comparing Original and Updated DFC Star Rating Methodologies: 2014 Current Year
Results with 2013 as Baseline Year for Updated Methodology
Updated Methodology
Original Methodology
★ ★★ ★★★ ★★★★ ★★★★★ Total
★ 316
240
24
0
0
580 (10%)
★★ 48
530
575
14
0
1167 (20%)
★★★ 2
126
1448
706
50
2332 (40%)
★★★★ 0 4
158
666
339
1167 (20%)
★★★★★ 0
0
0
87
485
582 (10%)
Total N
(%)
366 (6%)
900 (15%)
2215 (38%)
1473 (25%)
874 (15%)
5828 (100%)
Note: Cell Counts = number of facilities
Note: Table 5 only includes facilities eligible to be scored under both the original method and updated
method.

June 2016
Summary of Changes Implemented for the DFC Star Ratings
This report describes the methodology that will be used to calculate dialysis facility Star Ratings in the
upcoming October 2016 DFC release. It describes the updated methods used, and highlights changes
from the methodology originally implemented in the January 2015 release. Major changes include:
1. Baseline Year
Star Ratings will be based on measure thresholds and Star Rating cutoffs developed using the 2014 DFC measure scoring results.
Defining the measure scores and Star Rating cutoffs in the baseline year allows the dialysis community to observe changes in performance over time, as the distribution of the Star Ratings is not constrained after the baseline year. This is illustrated in Table 5 showing the change in the distribution of the Star Ratings using the updated methodology. Facility improvement in Star Ratings in the current year will therefore not necessarily result in other facilities moving down in the Star Ratings.
A new baseline should be established when the Star Rating distribution becomes ineffective at communicating differences in outcomes between facilities due to shifting to the extreme and/or when individual measures are added or removed.
2. Measure Scoring
Apply truncated z-scores for all the percentage measures included in the Star Ratings. At present, these include: hypercalcemia, Kt/V, AV fistula, and catheter > 90days. Using truncated z-scores is appropriate for all the percentage measures, and will handle subsequent measure shifts and skewness that could develop over time.
Retain the probit scoring technique for the standardized (ratio) measures. The probit scoring will be on the same scale and have the same mean (0) and variance (1) as the measures scored with truncated z- scores, facilitating the combination of all measures when calculating a final facility score.
3. Star Rating Cutoffs in the Baseline Year
Star Rating cutoffs in the baseline year are set based on the final facility score. These cutoffs will be retained and further used to assign Star Ratings to facilities in the current year.

June 2016
Appendix
A detailed example of scoring standardized measures
In order to map measures in the current year to the percentiles defined in the baseline year, percentile
cutoffs must be established. Here, the cutoffs are determined by the best measure value within each
percentile in the baseline year. For any measure value in the current year that falls in the gap between
percentile cutoffs in the baseline year, the measure value in the current year will be “rounded up” to the
higher of the two percentile values. For example, suppose we are considering a measure for which a
higher ratio is worse. If the lowest value receiving a ratio measure percentile of 47.5 in the baseline
year is 1.092 and the highest value receiving the next higher percentile value of 48.0 is 1.089, then the
ratio measure in a future year (after the adjustment factor is applied) of 1.090 would be given a
percentile of 48.0. These “percentiles” are then fed into the probit function to determine the measure
scores for the current year.
A detailed example of scoring percentage measures
Here we show how truncated z-scores are defined in the baseline year and applied in the current year.
Table 5 shows how scoring is defined in the baseline year. In the first row, we display Kt/V and its
summary statistics in 2013. In the second row, the z-score is obtained by subtracting each Kt/V value by
its mean (87.32) and dividing by its standard deviation (11.73). In the third row, initial truncated z-
scores are formed by truncating the z-score at a lower bound (-1.39) and upper bound (no truncation
needed for the upper bound of Kt/V). Finally, in the fourth row, the initial Kt/V truncated z-score is re-
standardized by subtracting each value by its mean (0.10) and dividing by its standard deviation (0.58).
Note that the truncation bounds in row 2 are chosen by an iterative algorithm that ensures that the re-
standardized measure lies within -2.58 and 2.58. The summary statistics in this table are then used to
formulate the scores in the current year (2014).
Table 5: Defining Scores for Kt/V in the baseline year (2013)
Variable Mean Std Dev Minimum Maximum
Kt/V 87.32 11.73 0 100
Kt/V Z-score 0 1 -7.44 1.08
Initial Kt/V Truncated Z-score
0.10 0.58 -1.39 1.08
Final Kt/V Truncated Z-score (re-standardized)
0 1 -2.58 1.71
Table 6 shows how scoring is defined in the current year. In the first row, we display Kt/V and its
summary statistics in 2014. In the second row, the z-score is obtained by subtracting each Kt/V value by

June 2016
the baseline year mean (87.32) and dividing by the baseline year standard deviation (11.73) in Table 5.
In the third row, initial truncated z-scores are formed by truncating the z-score at the lower bound (-
1.39) and upper bound (no bound needed for Kt/V) used in the baseline year. Finally, in the fourth row,
the initial Kt/V truncated z-score is re-standardized by subtracting each value by the mean (0.10) and
dividing by the standard deviation (0.58) of the initial truncated z-scores in the baseline year. By using
the summary statistics from the baseline year (Table 5), we score Kt/V values by criteria defined in the
baseline year. Note that the mean of the re-standardized score in Table 6 is higher than 0, indicating the
population average improvement of Kt/V from the baseline year.
Table 6: Defining Scores for Kt/V in the Current Year (2014)
Variable Mean Std Dev Minimum Maximum
Kt/V 89.95 8.98 0.00 100.00
Kt/V “Z-score” 0.22 0.77 -7.44 1.08
Initial Kt/V Truncated Z-score
0.27 0.50 -1.39 1.08
Final Kt/V Truncated Z-score (re-standardized)
0.30 0.87 -2.58 1.71
References
1. SAS Annotated Output: Factor Analysis. UCLA: Statistical Consulting Group. From www.ats.ucla.edu/stat/sas/output/factor.htm (accessed March 3, 2015).