technical application note: utilization of a novel kla
TRANSCRIPT
1 | p a g e
w w w . z e t a . c o m
Technical Application Note: Utilization of a Novel kLa Measurement
Procedure for Bioreactor Characterization and Optimization to Assist with
Compliance of Regulatory Guidelines
Background Information and Introduction
CGMP regulations stipulate that sampling and testing of in-process materials and drug products requires
control procedures to “be established to monitor the output and to validate the performance of those
manufacturing processes that may be responsible for causing variability in the characteristics of in-process
material and the drug product”. (1)
According to USFDA guidelines, utilizing validated processes is critical to ensuring a drug is fit for its intended
use. This guidance describes process validation activities in three stages:
Stage 1 – Process Design: The commercial manufacturing process is defined during this stage based
on knowledge gained through development and scale-up activities.
Stage 2 – Process Qualification: During this stage, the process design is evaluated to determine if the
process is capable of reproducible commercial manufacturing.
Stage 3 – Continued Process Verification: Ongoing assurance is gained during routine production that
the process remains in a state of control.
Information and data should demonstrate that the commercial manufacturing process is capable of
consistently producing acceptable quality products within commercial manufacturing conditions.
Manufacturers should:
Understand the sources of variation.
Detect the presence and degree of variation.
Understand the impact of variation on the process and ultimately on product attributes.
Control the variation in a manner commensurate with the risk it represents to the process and
product. (2)
The FDA’s Biotechnology Inspection Guide (11/91) states that “it is important for a bioreactor system to be
closely monitored and tightly controlled to achieve the proper and efficient expression of the desired product.
The parameters for the fermentation process must be specified and monitored.” (3)
The bioreactor is at the heart of any cell culture process in which microbial, mammalian, insect or plant cells
are used to manufacture biological drug products. The main function of a bioreactor is to provide a controlled
environment to achieve optimal growth and/or product formation in the particular cell system employed (4).
However, by definition, being a biological system – albeit designed to be controlled – a bioreactor culture is
subject to the same variations that exist in any other biological system in nature.
In such a context, where natural variations can occur, it is critical to ensure optimal bioreactor performance
based on a validated process design. Guaranteeing reproducible, steady-state conditions requires accurate
measurement and control of factors that influence the process. These factors include a number of chemical
and physical parameters, including culture media type and components, pH, aeration, agitation, temperature
and culture time. (5)
2 | p a g e
w w w . z e t a . c o m
The Importance of kLa
It has long been established that, as a function of aeration and agitation, one of the most pertinent
performance parameters to measure consistently is the volumetric mass transfer coefficient (kLa). It describes
the efficiency of gas (oxygen) transfer from the gaseous to liquid phase and is often used to monitor the
efficacy of bioreactors and as an important factor in scale-up operations. Dissolved oxygen (DO) is a limiting
factor in bioreactors. Therefore, for optimum cell growth, it is important that DO concentrations are
maintained - throughout the whole bioreactor - at or above the critical oxygen thresholds for the cells being
cultured. To be effective, the oxygen transfer rate (OTR) - following its gaseous introduction into the
bioreactor, via the sparger, into the liquid phase of the culture medium - must equal or exceed the oxygen
uptake rate (OUR) of the cells in the vessel. The OTR, and the kLa in particular, are critical parameters in the
design of bioreactors. (6) (7)
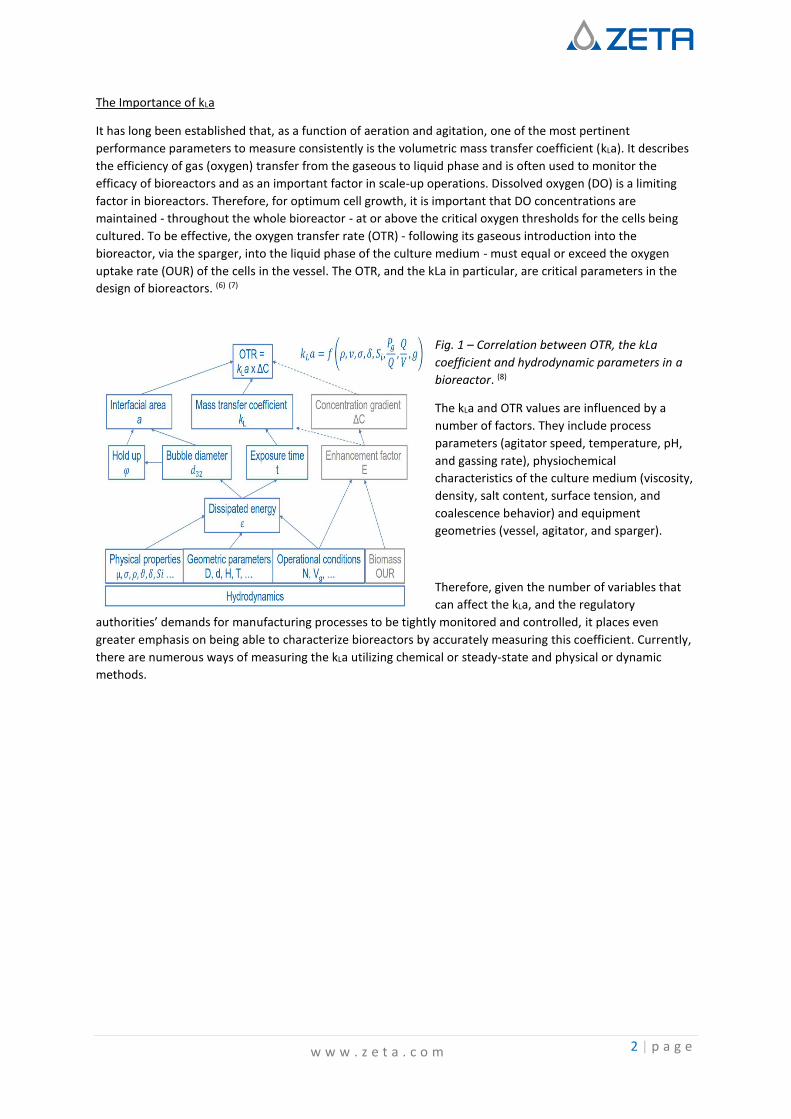
Fig. 1 – Correlation between OTR, the kLa
coefficient and hydrodynamic parameters in a
bioreactor. (8)
The kLa and OTR values are influenced by a
number of factors. They include process
parameters (agitator speed, temperature, pH,
and gassing rate), physiochemical
characteristics of the culture medium (viscosity,
density, salt content, surface tension, and
coalescence behavior) and equipment
geometries (vessel, agitator, and sparger).
Therefore, given the number of variables that
can affect the kLa, and the regulatory
authorities’ demands for manufacturing processes to be tightly monitored and controlled, it places even
greater emphasis on being able to characterize bioreactors by accurately measuring this coefficient. Currently,
there are numerous ways of measuring the kLa utilizing chemical or steady-state and physical or dynamic
methods.
3 | p a g e
w w w . z e t a . c o m
Standard Methodology for Measuring kLa
Typically, two approaches are adopted for measuring the kLa:
1. Dynamic - These methods consist of producing an oxygen concentration change in the entering gas,
recording the dissolved oxygen change in the liquid and fitting the transient curve to a proper model:
a. The “gassing-in” method (GIM) consists of a step-change in the gas while keeping the gas
flow rate and agitation unchanged.
b. the “gassing-out” method (GOM) utilizes the opposite interchange.
c. The “dynamic start-up method” (DSM) consists of starting agitation and simultaneously
feeding air or pure oxygen to the liquid deoxygenated by stripping with nitrogen, (Linek et
al., 1987a).
d. The “dynamic pressure method” (DPM) relies upon inducing a concentration variation in the
liquid by step-wise changing the pressure in the system (Linek et al., 1989).
2. Steady-state methods – These methods rely upon a chemical or a biochemical reaction taking place in
the liquid, which acts as an oxygen sink. A number of variants have been used that depend on the
specific reaction:
a. Sodium sulphite oxidation method
b. Carbon dioxide absorption method
c. Hydrazine oxidation method
d. Catechol bio-oxidation method
e. Glucose oxidase method
f. Krypton absorption method
More details of these techniques, and the relative merits of each, can be found elsewhere in the scientific
literature and will not be discussed further here.
Fig.1 illustrates that the kLa value depends on a number of hydrodynamic conditions, therefore, it cannot be
predicted precisely. Mathematical models describing the system kinetics represent an important base for
prediction of kLa values. Oxygen sensors typically are used for determination of the actual kLa in a culture, and
until recently, such measurements took place at only one point in a bioreactor - at the probe belt near the
bottom of the vessel – thus introducing a greater risk of increased and undetected process variation, a reduced
state of control and reproducibility, monitoring inaccuracies and sub-optimal performance. In practice, DO
varies greatly in its distribution throughout the bioreactor, so a single measurement is not representative for
the whole vessel and does not take into account any “zoning” effects that may occur.
New Methodology for Measuring kLa
This application note details a new and novel technique, utilizing a dynamic start-up method (DSM), outlined
above, to accurately determine the coefficient, which is then extrapolated into characterizing the whole
bioreactor, thus making it easier to comply with the regulatory requirements. A number of case studies where
the technique has been applied will also be discussed. Strategies employed to improve the accuracy of kLa
measurement for bioreactor characterization are as follows:

4 | p a g e
w w w . z e t a . c o m
DSM Methodology – Under experimental conditions, the bioreactor was filled with deionized water. The water was then degassed with nitrogen until the oxygen concentration was constant and below a value of 0.1% saturation. Then the gassing was immediately switched to air, at a pre-determined rate, to increase the concentration of oxygen to 100% air saturation, before the kLa values were measured.
Fig.2. - Schematic illustration of the concentration change when using the DSM.
Flow-Through Cell - This method, incorporating the use of a flow-through cell oxygen sensor, strips all
gas bubbles from the sample allowing the sensor to read a more accurate noise-free signal (see
patent number A20182/2018). The in-line sensor has been developed to be compatible with any
sampling port on a bioreactor. As the measuring method positions the sensor outside of the vessel,
with the sample being drawn through tubing inside the bioreactor, it allows for any part of the vessel
to be surveyed (See Fig.3.). A peristaltic pump – run at a pre-calibrated speed - guides sample material
to an optical high-speed sensor that measures DO within 0.25 seconds.
Fig.3. - Schematic illustration of the
measuring method. (1) membrane and frit
(2) sample inlet pipeline (3) Connector to the
reactor (nozzle). (4) flow-through cell (5)
peristaltic pump for sample return.
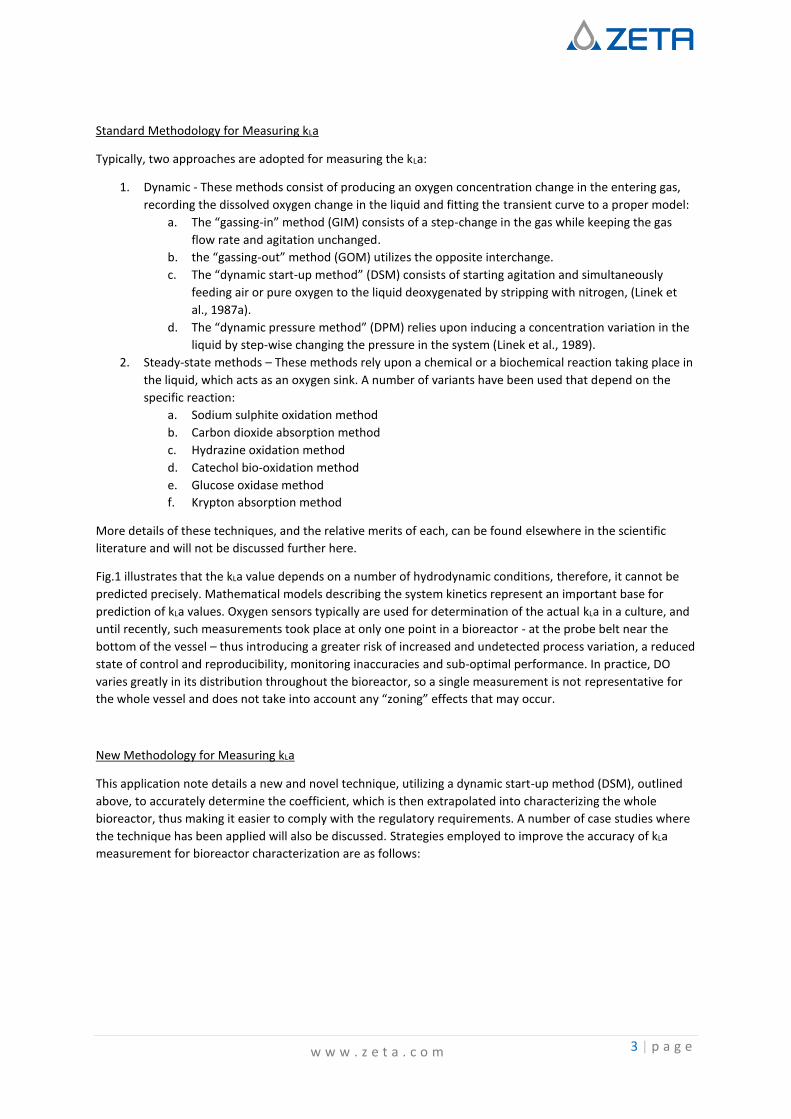
Fig.4. illustrates that there is no significant difference in the calculation of kLa when using the bubble-
stripping flow-through cell method compared to the traditional standard sensor. This allows for the
DO distribution of the whole of the bioreactor to be reproducibly and repeatedly mapped, giving full
visibility of any zoning or areas of oxygen under-supply, for any given set of process parameters.
Research on varying process parameters or bioreactor design can then be carried out to investigate
the removal or reduction of these zones.
5 | p a g e
w w w . z e t a . c o m
Fig.4. – Oxygen concentration curves
comparing the standard method with
that of the flow-through cell.
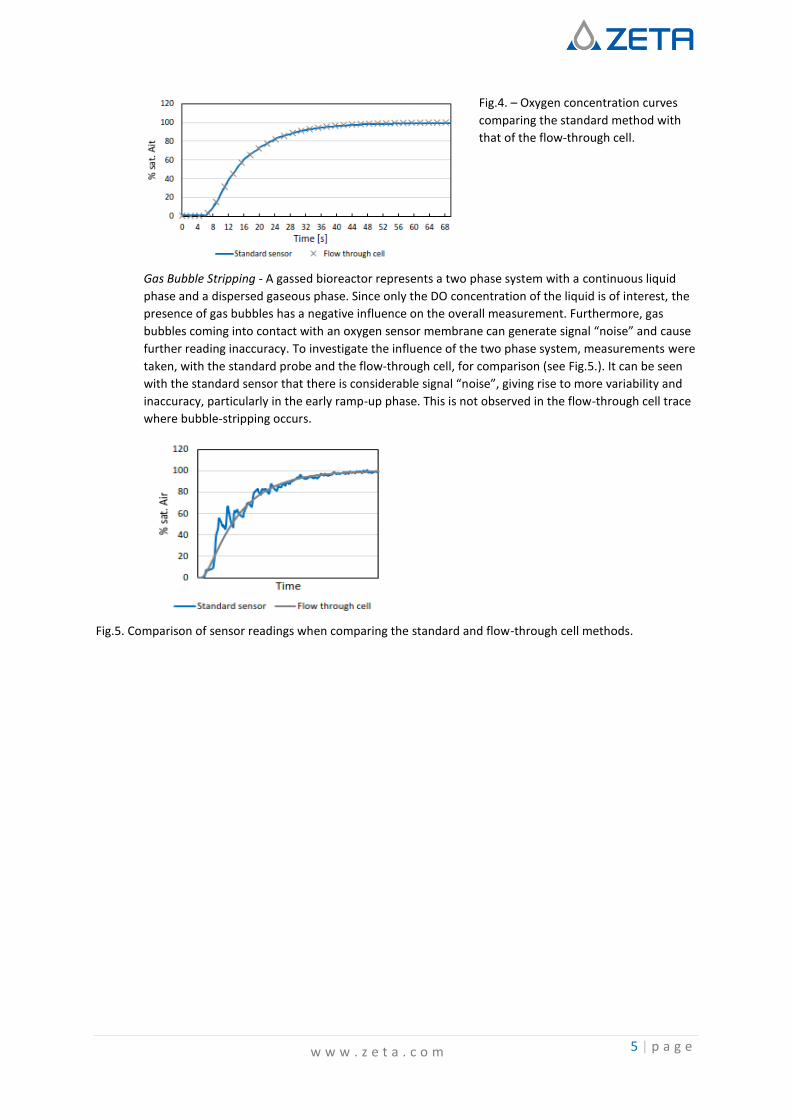
Gas Bubble Stripping - A gassed bioreactor represents a two phase system with a continuous liquid
phase and a dispersed gaseous phase. Since only the DO concentration of the liquid is of interest, the
presence of gas bubbles has a negative influence on the overall measurement. Furthermore, gas
bubbles coming into contact with an oxygen sensor membrane can generate signal “noise” and cause
further reading inaccuracy. To investigate the influence of the two phase system, measurements were
taken, with the standard probe and the flow-through cell, for comparison (see Fig.5.). It can be seen
with the standard sensor that there is considerable signal “noise”, giving rise to more variability and
inaccuracy, particularly in the early ramp-up phase. This is not observed in the flow-through cell trace
where bubble-stripping occurs.
Fig.5. Comparison of sensor readings when comparing the standard and flow-through cell methods.
6 | p a g e
w w w . z e t a . c o m
Case Studies Utilizing New Methodology for Measuring kLa
1. Optimization of Existing Production Scale Bioreactors
As this newly developed measuring procedure is also mobile it can be applied to bioreactor systems
already in existence without the need for structural changes. In this application, a 12,000L working
volume, commercial scale bioreactor – used for recombinant protein production in E. coli - required
characterization. For the analysis, the previously described DSM method was employed in three
defined areas of the vessel: at the top, in the middle and at the bottom. Across 20 trials,
measurements were taken to explore the effects of different agitator speeds, gassing rates, head
pressures and salt and anti-foam levels in the fermentation medium. Fig.6. shows the positioning of
the oxygen sensors within the bioreactor.
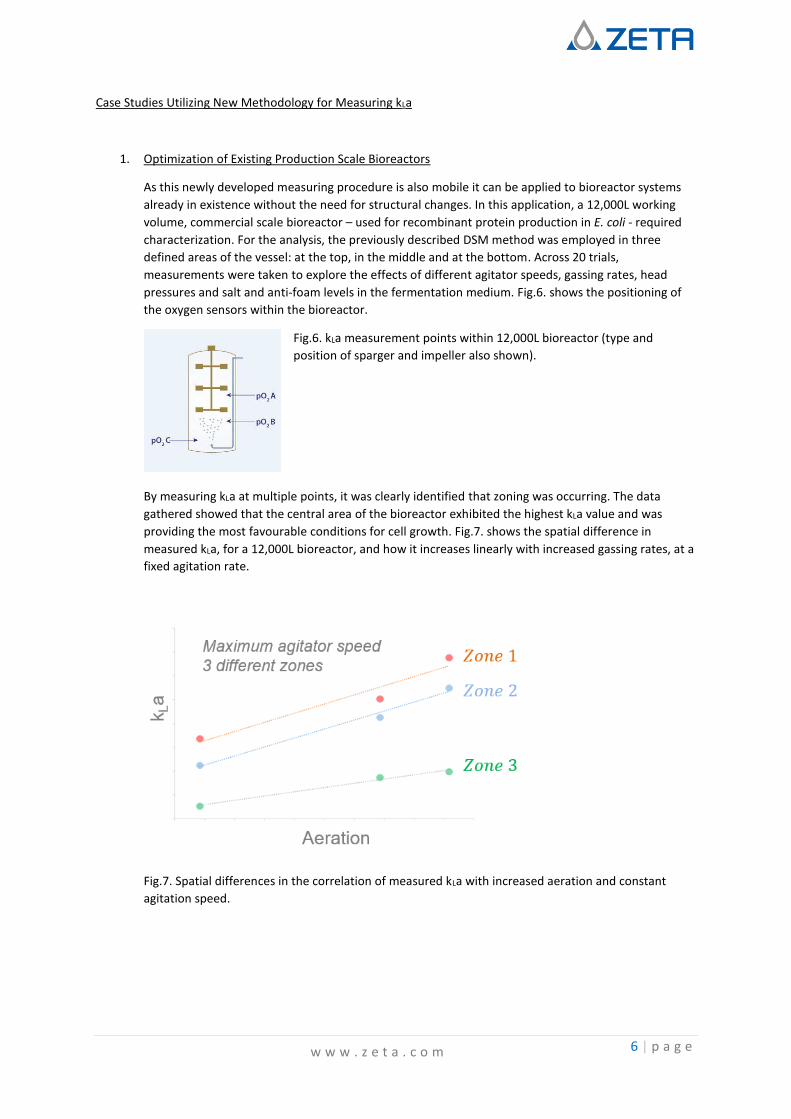
Fig.6. kLa measurement points within 12,000L bioreactor (type and
position of sparger and impeller also shown).
By measuring kLa at multiple points, it was clearly identified that zoning was occurring. The data
gathered showed that the central area of the bioreactor exhibited the highest kLa value and was
providing the most favourable conditions for cell growth. Fig.7. shows the spatial difference in
measured kLa, for a 12,000L bioreactor, and how it increases linearly with increased gassing rates, at a
fixed agitation rate.
Fig.7. Spatial differences in the correlation of measured kLa with increased aeration and constant
agitation speed.
7 | p a g e
w w w . z e t a . c o m
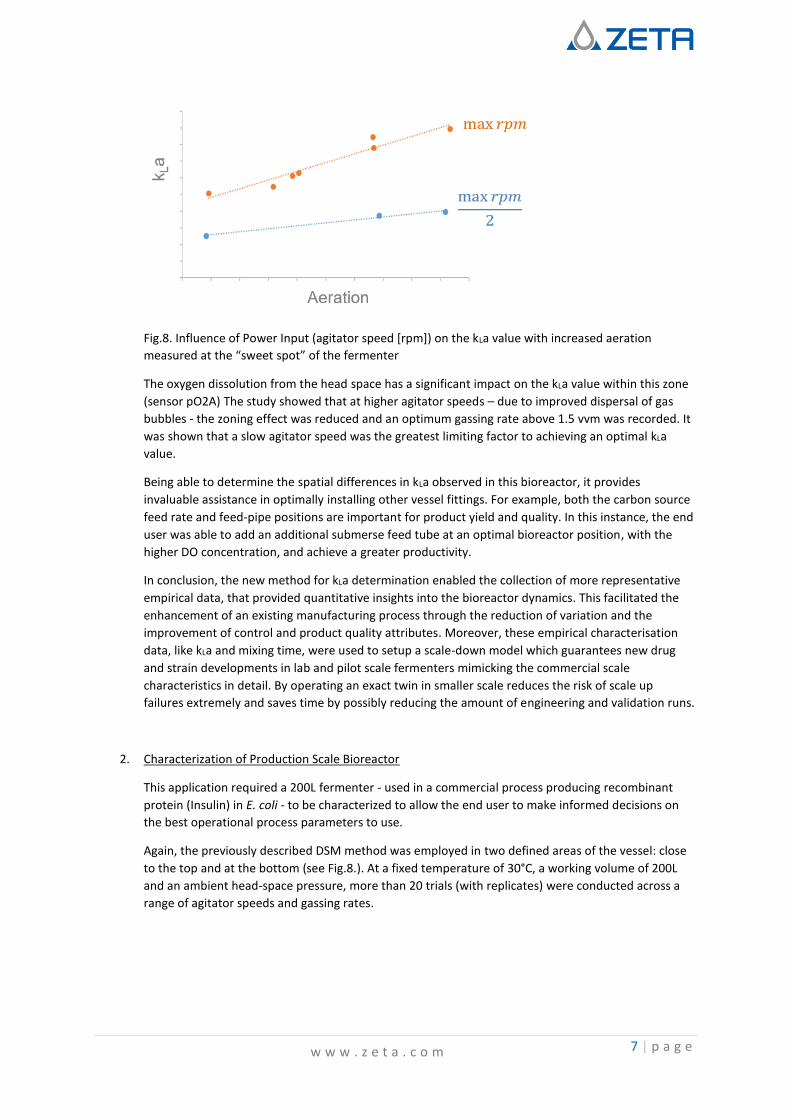
Fig.8. Influence of Power Input (agitator speed [rpm]) on the kLa value with increased aeration
measured at the “sweet spot” of the fermenter
The oxygen dissolution from the head space has a significant impact on the kLa value within this zone
(sensor pO2A) The study showed that at higher agitator speeds – due to improved dispersal of gas
bubbles - the zoning effect was reduced and an optimum gassing rate above 1.5 vvm was recorded. It
was shown that a slow agitator speed was the greatest limiting factor to achieving an optimal kLa
value.
Being able to determine the spatial differences in kLa observed in this bioreactor, it provides
invaluable assistance in optimally installing other vessel fittings. For example, both the carbon source
feed rate and feed-pipe positions are important for product yield and quality. In this instance, the end
user was able to add an additional submerse feed tube at an optimal bioreactor position, with the
higher DO concentration, and achieve a greater productivity.
In conclusion, the new method for kLa determination enabled the collection of more representative
empirical data, that provided quantitative insights into the bioreactor dynamics. This facilitated the
enhancement of an existing manufacturing process through the reduction of variation and the
improvement of control and product quality attributes. Moreover, these empirical characterisation
data, like kLa and mixing time, were used to setup a scale-down model which guarantees new drug
and strain developments in lab and pilot scale fermenters mimicking the commercial scale
characteristics in detail. By operating an exact twin in smaller scale reduces the risk of scale up
failures extremely and saves time by possibly reducing the amount of engineering and validation runs.
2. Characterization of Production Scale Bioreactor
This application required a 200L fermenter - used in a commercial process producing recombinant
protein (Insulin) in E. coli - to be characterized to allow the end user to make informed decisions on
the best operational process parameters to use.
Again, the previously described DSM method was employed in two defined areas of the vessel: close
to the top and at the bottom (see Fig.8.). At a fixed temperature of 30°C, a working volume of 200L
and an ambient head-space pressure, more than 20 trials (with replicates) were conducted across a
range of agitator speeds and gassing rates.
8 | p a g e
w w w . z e t a . c o m
Fig.9. Oxygen sensor locations within 200L bioreactor.
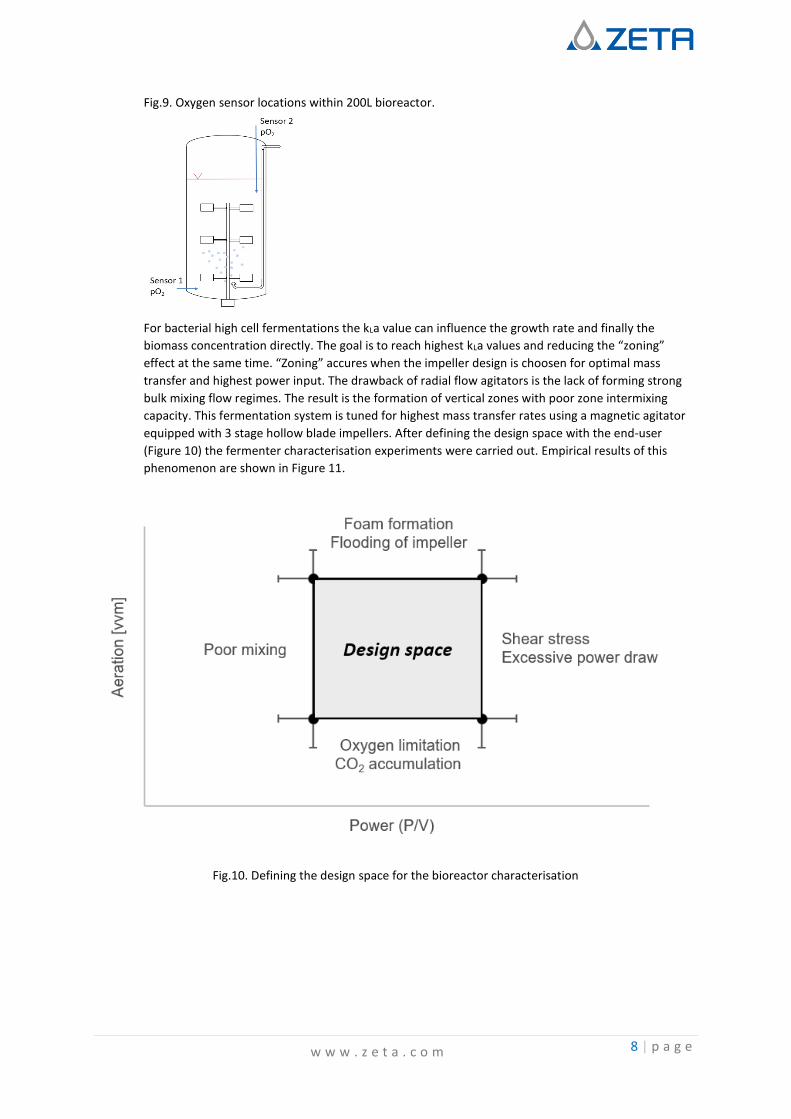
For bacterial high cell fermentations the kLa value can influence the growth rate and finally the
biomass concentration directly. The goal is to reach highest kLa values and reducing the “zoning”
effect at the same time. “Zoning” accures when the impeller design is choosen for optimal mass
transfer and highest power input. The drawback of radial flow agitators is the lack of forming strong
bulk mixing flow regimes. The result is the formation of vertical zones with poor zone intermixing
capacity. This fermentation system is tuned for highest mass transfer rates using a magnetic agitator
equipped with 3 stage hollow blade impellers. After defining the design space with the end-user
(Figure 10) the fermenter characterisation experiments were carried out. Empirical results of this
phenomenon are shown in Figure 11.
Fig.10. Defining the design space for the bioreactor characterisation
9 | p a g e
w w w . z e t a . c o m
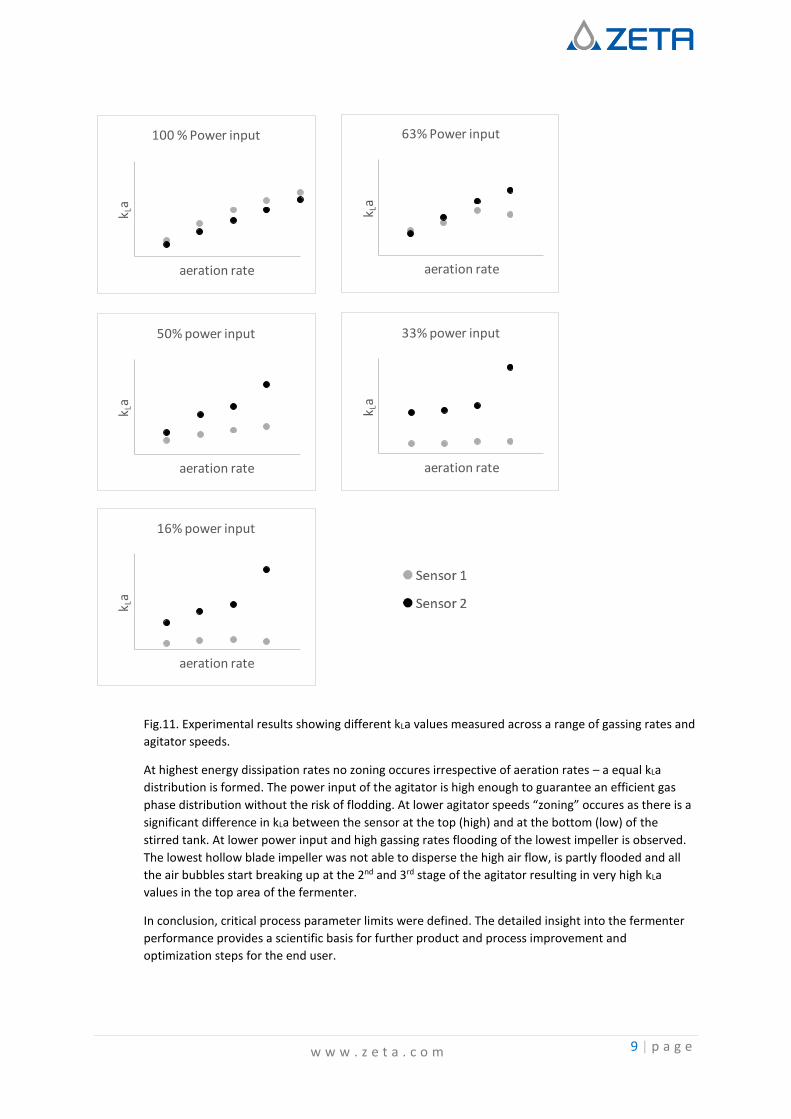
Fig.11. Experimental results showing different kLa values measured across a range of gassing rates and
agitator speeds.
At highest energy dissipation rates no zoning occures irrespective of aeration rates – a equal kLa
distribution is formed. The power input of the agitator is high enough to guarantee an efficient gas
phase distribution without the risk of flodding. At lower agitator speeds “zoning” occures as there is a
significant difference in kLa between the sensor at the top (high) and at the bottom (low) of the
stirred tank. At lower power input and high gassing rates flooding of the lowest impeller is observed.
The lowest hollow blade impeller was not able to disperse the high air flow, is partly flooded and all
the air bubbles start breaking up at the 2nd and 3rd stage of the agitator resulting in very high kLa
values in the top area of the fermenter.
In conclusion, critical process parameter limits were defined. The detailed insight into the fermenter
performance provides a scientific basis for further product and process improvement and
optimization steps for the end user.
k La
aeration rate
100 % Power input
k La
aeration rate
63% Power inputk L
a
aeration rate
50% power input
k La
aeration rate
33% power input
k La
aeration rate
16% power input
10 | p a g e
w w w . z e t a . c o m
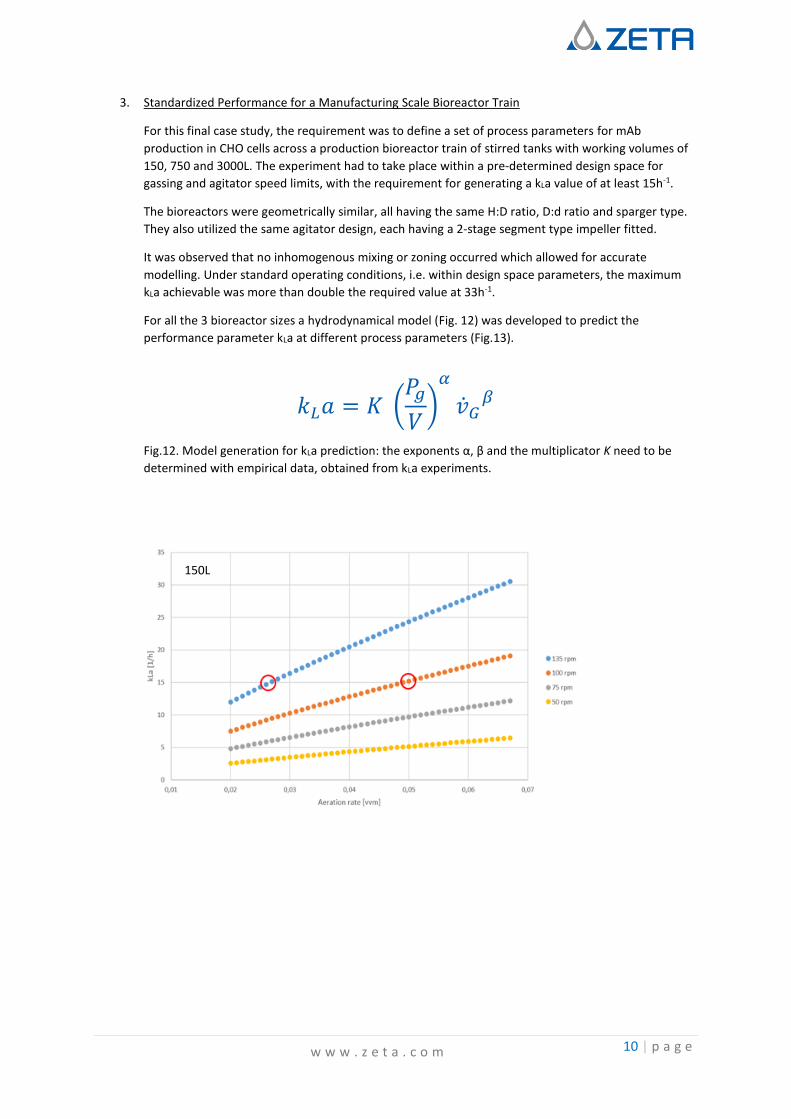
3. Standardized Performance for a Manufacturing Scale Bioreactor Train
For this final case study, the requirement was to define a set of process parameters for mAb
production in CHO cells across a production bioreactor train of stirred tanks with working volumes of
150, 750 and 3000L. The experiment had to take place within a pre-determined design space for
gassing and agitator speed limits, with the requirement for generating a kLa value of at least 15h-1.
The bioreactors were geometrically similar, all having the same H:D ratio, D:d ratio and sparger type.
They also utilized the same agitator design, each having a 2-stage segment type impeller fitted.
It was observed that no inhomogenous mixing or zoning occurred which allowed for accurate
modelling. Under standard operating conditions, i.e. within design space parameters, the maximum
kLa achievable was more than double the required value at 33h-1.
For all the 3 bioreactor sizes a hydrodynamical model (Fig. 12) was developed to predict the
performance parameter kLa at different process parameters (Fig.13).
Fig.12. Model generation for kLa prediction: the exponents α, β and the multiplicator K need to be
determined with empirical data, obtained from kLa experiments.
𝑘𝐿𝑎 = 𝐾 (𝑃𝑔
𝑉)
𝛼
�̇�𝐺𝛽
150L

11 | p a g e
w w w . z e t a . c o m
Fig.13. kLa values predicted against increasing aeration rates for varying agitator speeds in 150, 750
and 3000L bioreactors.
Utilizing this model, at 150L, it can be seen that the required kLa value could be reached using two of
the power inputs modelled: 165W/m³ and 400W/m³. Within the functional limits of the system a 15h-
1 kLa value could be achieved at 400W/m³ at approximately half the aeration rate of that required at
165W/m³ (0.05vvm).
At the 750L scale, the desired kLa value could be reached with three of the four power inputs tested:
13, 45 and 204W/m³. Similarly, this could also be achieved at the 3000L with 50, 145 and 250W/m³.
As the required kLa value was achievable within the configurable limits of the system, the end user
was able create an improved output from all three vessels and maintain a fixed superficial gas velocity
of at least 7*10-3 m/sec, across the whole bioreactor train, to standardize the production process,
reduce the variation in parameters and make it easier to control.
750L
3000L
12 | p a g e
w w w . z e t a . c o m
Thomas Maischberger
Process Engineer & Project Development
ZETA GmbH
M: + 43 664/808 528-415
As process engineer with a master degree in food and biotechnology Thomas Maischberger has
highest skills in industrial microbiology, enzyme technology and bioprocess optimization. After
successfully completing his PHD at the University of Natural Resources and Life Sciences in Vienna
started his professional career as engineer for production plants in pharma and food industry in 2012.
References
[1] USFDA – Current Good Manufacturing Practice for Finished Pharmaceuticals
[2] USFDA – Process Validation: General Principles and Practices
[3] USFDA – Biotechnology Inspection Guide Reference Materials and Training Aids
[4] Ghasem D. Najafpour, Biochemical Engineering and Biotechnology, pages 142-169, 2007
[5] Yong Zhou et al. Effects of Agitation, Aeration and Temperature on Production of a Novel Glycoprotein GP-
1 by Streptomyces kanasenisi ZX01 and Scale-Up Based on Volumetric Oxygen Transfer Coefficient. Molecules
2018, 23, 125
[6] J. Kane. Measuring kLa for Better Bioreactor Performance. BioProcess International, 2012.
[7] D. Moutafchieva et al. Experimental Determination of the Volumetric Mass Transfer Coefficient. Journal of
Chemical Technology and Metallurgy, 48, 4, 2013, 351-356.
[8] F. Garcia-Ochoa, E. Gomez, Bioreactor scale-up and oxygen transfer rate in microbial processes: An
overview, Biotechnol. Adv. 27 (2009) 153–176. doi: 10.1016/j.biotechadv.2008.10.006.
Additional References
Linek V et al.: Analysis of differences in kLa values determined by steady-state and dynamic methods
in stirred tanks. Chem Engin J 1982, 25, p77-88.
Tobajas, M. & García-Calvo, E. Heat and Mass Transfer (2000) 36: 201.
https://doi.org/10.1007/s002310050385