teapot dome: site characterization of a co2- enhanced oil
TRANSCRIPT

UCRL-JRNL-217774
Teapot Dome: Site Characterization of aCO2- Enhanced Oil Recovery Site inEastern Wyoming
S. J. Friedmann, V. Stamp
December 16, 2005
Environmental Geoscience

Disclaimer
This document was prepared as an account of work sponsored by an agency of the United States Government. Neither the United States Government nor the University of California nor any of their employees, makes any warranty, express or implied, or assumes any legal liability or responsibility for the accuracy, completeness, or usefulness of any information, apparatus, product, or process disclosed, or represents that its use would not infringe privately owned rights. Reference herein to any specific commercial product, process, or service by trade name, trademark, manufacturer, or otherwise, does not necessarily constitute or imply its endorsement, recommendation, or favoring by the United States Government or the University of California. The views and opinions of authors expressed herein do not necessarily state or reflect those of the United States Government or the University of California, and shall not be used for advertising or product endorsement purposes.

Teapot Dome: Site Characterization of a CO2- Enhanced Oil Recovery Site
in Eastern Wyoming
S. Julio Friedmann1 and Vicki Stamp2
1Energy and Environment Directorate, Lawrence Livermore National Laboratory, L-640, 7000
East St., Livermore, CA 94550-9234, [email protected]
2Rocky Mountain Oilfield Testing Center, 907 North Poplar, Suite 150, Casper, WY 82601
Abstract
Naval Petroleum Reserve No. 3 (NPR-3), better known as the Teapot Dome oil field, is
the last U.S. federally-owned and -operated oil field. This provides a unique opportunity
for experiments to provide scientific and technical insight into CO2-enhanced oil
recovery (EOR) and other topics involving subsurface fluid behavior. Towards that end, a
combination of federal, academic, and industrial support has produced outstanding
characterizations of important oil- and brine-bearing reservoirs there. This effort provides
an unparalleled opportunity for industry and others to use the site. Data sets include
geological, geophysical, geochemical, geomechanical, and operational data over a wide
range of geological boundary conditions. Importantly, these data, many in digital form,
are available in the public domain due to NPR-3’s federal status. Many institutions are
already using portions of the Teapot Dome data set as the basis for a variety of
geoscience, modeling, and other research efforts.
Fifteen units, 9 oil-bearing and 6 brine-bearing, have been studied to varying
degrees. Over 1200 wells in the field are active or accessible, and over 400 of these
penetrate 11 formations located below the depth that corresponds to the supercritical

point for CO2. Studies include siliciclastic and carbonate reservoirs; shale, carbonate,
and anhydrite cap rocks; fractured and unfractured units; and over-pressured and under-
pressured zones. Geophysical data include 3D seismic and vertical seismic profiles.
Reservoir data include stratigraphic, sedimentological, petrologic, petrographic, porosity,
and permeability data. These have served as the basis for preliminary 3D flow
simulations. Geomechanical data include fractures (natural and drilling induced), in-situ
stress determination, pressure, and production history. Geochemical data include soil gas,
noble gas, organic, and other measures. The conditions of these reservoirs directly or
indirectly represent many reservoirs in the U.S., Canada, and overseas.
Introduction
Carbon capture and storage (CCS), or carbon sequestration, has emerged as a critical
technology pathway to reduce atmospheric greenhouse gas emissions. Specifically,
storage of carbon dioxide in geological reservoirs has become a primary focus of
industrial, academic, and government research (e.g., U.S. DOE, 2005; IEA GHG, 2002;
IPIECA, 2003). Due to economic, policy, and engineering concerns, a great deal of effort
has focused on these sectors. However, concerns about the fate of injected CO2 and
uncertainties associated with subsurface operations and risks have prompted efforts to
generate new knowledge that would help demonstrate the safety, ease, cost, and efficacy
of geological carbon storage (e.g., Klara et al., 2003; Hawkins, 2003).
Ultimately, much of this new knowledge will come from the study of large field
projects (Friedmann, in press). Some of these are active demonstration projects, such as
Sleipner and Weyburn (e.g., Torp & Gale, 2003; Preston, 2003). The primary project goal
of these large-scale efforts is to store large CO2 volumes. In that context, scientific and
technological research proceeds in the context of project economic and operational
concerns. Some CO2 sequestration projects are intimately linked to industry-driven
enhanced oil recovery; in those cases both injection scenarios and monitoring
technologies are focused on optimization of oil production. Other projects are field
experiments, such as the Frio Brine Pilot (Hovorka et al., 2005). The goal in these is to
develop knowledge through scientific experimentation. In that context, the primary limits
to investigation come from geological constraints, budget, ownership, and the regulatory
framework.
In order to maximize new knowledge covering a variety of settings and contexts,
the U.S. Department of Energy (DOE) has built a research program aimed at
understanding better both carbon storage and enhanced oil recovery (e.g., U.S. DOE,
2005). This has led to the work at the Frio Brine Pilot, the establishment of the Regional
Sequestration Partnership programs, and designs for the zero-emission FutureGen power
plant. To help maximize learnings around subsurface CO2 injection, the Teapot Dome oil
field is an ideal location for site characterization and CO2 storage studies (Figure 1). This
is the only oil field currently owned and operated by the U.S. federal government, which
makes it possible to propose and carry out scientific experiments and technical
development programs within a long-term, stable business context, free of the
commercial drivers of a privately-owned oil field.

Background and Data Character
The Teapot Dome research program presents a unique opportunity to conduct CO2 -
storage experiments, largely as a consequence of its history (Friedmann et al., 2004). The
public-domain data set is key to mapping structural and stratigraphic attributes and
heterogeneities at depth (Table 1). The field covers nearly 10,000 acres (40.5 km2) and
contains over 2200 wells total, of which over 1200 may be accessed (Figure 2). Of these,
~600 are currently producing (~600 non-producing) and more than 400 penetrate to a
depth greater than 2700 ft (823 m). All cores, well logs, mud logs, completion
descriptions, and production data from these wells are in the public domain. In addition,
the Rocky Mountain Oilfield Testing Center (RMOTC), co-located with DOE’s office
that manages and operates the field, acquired a full-field 3D seismic volume in 2000,
which is also in the public domain.
Field infrastructure includes roads, pipelines, water lines, water treatment
facilities, a gas processing plant, workover rig, several buildings, telephone lines, and
dedicated internet connections. Currently, RMOTC owns and operates one drilling rig
and 600 pump jacks of varying sizes. Drilling costs for certain work are covered by
RMOTC, and an internal committee of scientists and engineers approves drilling
programs in coordination with all other efforts (e.g., the current site characterization /
CO2 program). As of September 2005, there is no dedicated CO2 pipeline into Teapot
Dome. However, Anadarko Petroleum Corporation recently completed a new CO2
pipeline to their Salt Creek field, immediately adjacent to Teapot Dome’s northern field
boundary (Figure 1). The pipeline configuration provides for 250 million ft3/day (7.1
million m3) of anthropogenic CO2, which originates at the Shute Creek gas processing

facility (owned by ExxonMobil) located in western Wyoming. RMOTC and the DOE are
currently discussing the pipeline right-of-way, interim trucked delivery and compression
of CO2, and CO2 price with Anadarko and other private companies. Given this, the
earliest likely date for initial CO2 injection into Teapot would be with trucked delivery in
2006; pipeline delivery of CO2 could not begin until 2007 or ’08.
Recently, RMOTC digitized data from over 400 deep wells and placed them in a
newly acquired Landmark-based data environment. These data include wireline logs,
lithology curves, and limited porosity and permeability data. By mid-2006, these data
should all be publicly available and ready to be loaded into typical subsurface geology
packages.
Site Characterization
The CO2 effort formally began at RMOTC in 2003. At that time, site
characterization began in order to modernize and fill gaps in the field data set, to enhance
the understanding of Teapot Dome’s complex subsurface, and to build the scientific
foundation necessary to support future CO2 injection experiments. This work took
advantage of the field’s abundant data, the recently acquired 3D seismic volume, and
prior field characterization work. The program has since expanded, and many aspects of
the field geology in both hydrocarbon- and brine-bearing units are now well understood.
Stratigraphy and Sedimentology
The main stratigraphic units at Teapot Dome were identified early in the 20th
century. They include Devonian to Upper Cretaceous units that occur widely throughout
the intermountain West (Thom and Spieker, 1931). Within the field, they comprise nine

oil-bearing and six water-bearing units, and include terrestrial sandstones, marine and
lacustrine carbonates, and shallow shelf siliciclastics (Figure 4). On the whole, relative
fluctuations in base level interleaved porous and permeable units with impermeable rocks
that serve as seals (Table 2). Both oil-bearing and brine-bearing strata at Teapot Dome
hold hydrocarbon accumulations elsewhere in Wyoming, Montana, and Colorado. Many
of these are excellent targets for CO2 EOR (Nummedal et al., 2003). Although various
studies present the stratigraphy and sedimentology of many field strata, only two
reservoir and cap-rock pairs are discussed in this paper: The Pennsylvanian Tensleep
Sandstone and overlying Goose Egg Formation, and the Upper Cretaceous Second Wall
Creek Sandstone with overlying shales of the Frontier Formation. These two reservoir-
cap-rock pairs are addressed in this paper because the Tensleep has been selected by the
project team as the first and most promising reservoir target for specific proposed CO2
injection experiments. Thus it and the Goose Egg cap rock have been the primary focus
of recent characterization and pre-CO2 baseline studies. The Second Wall Creek is also
considered an excellent injection target for specific experiments currently under
consideration, and is the first and largest zone being CO2 flooded in the neighboring Salt
Creek EOR project initiated by Anadarko Petroleum in 2004. A preliminary CO2 EOR
screening study performed by RMOTC (Giangiacomo, 2001) laid the groundwork for
additional, more thorough review of both of these reservoirs. Other zones at Teapot
Dome are also being considered for possible future injection, but will not be covered in
this paper.
Tensleep Sandstone

The Pennsylvanian Tensleep Sandstone represents an enormous rock volume suitable for
CO2 storage, both in saline aquifers and oil-bearing zones. It covers large areas of
Wyoming, Montana, and Colorado (Figure 5a,b) and is the primary oil-bearing unit at
Rangely in Colorado (the Weber Sandstone is equivalent) and Lost Soldier and Wertz
Fields in Wyoming, all three of which have received continuous CO2 injections for
roughly 20 years. It holds two-thirds of Wyoming’s oil (Nummedal et al., 2003), and is a
thick, continuous, porous and permeable sandstone aquifer where oil is not trapped.
Within NPR-3, about 35 wells have penetrated the Tensleep Sandstone, including 13
cored wells. All have traditional well-log suites, with six recent wells having FMI
(Formation Micro Imaging) logs. Core samples and special core tests provide porosity
and permeability information (Table 3; Figure 6b), petrographic samples, and
petrophysical characterizations. Within the field, multiple cores have been recovered and
described for both sedimentary and fracture characterizations (Figure 7).
The Tensleep Sandstone consists predominantly of thick-bedded porous and
permeable aeolian sandstones. Average porosity is 8% with 80 mD permeability,
although data vary widely as a function of depositional sub-environment and degree of
local cementation. Within the field, the thickest and most continuous of these bodies is
the “B” sand, which is well over 100 ft (30.5 m) thick; permeable zones include the
overlying “A” sand and underlying “C” sands. These are separated by thin sabkha
carbonates, minor evaporites (mostly anhydrite), and thin but widespread extensive beds
of very low permeability dolomicrites. These units represent periods of relative sea level
rise (transgression) followed by exposure and unconformity; they also represent low-
permeability zones that act as flow baffles or barriers (Figure 6a, Figure 7).

The overlying cap rock is the Permian Phosphoria Formation, locally called the
Goose Egg Shale, which consists of over 300 ft (91.4 m) of shale, carbonate, and
anhydrite cap rock in the field. This is the primary regional seal allowing for large
hydrocarbon accumulations. The longest of these is the 48-x-28 well (May 2004) from
which over 150 feet (45.7 m) of core were recovered and described in detail. At Teapot
Dome, this seal trapped more than 35 million barrels (5.6 million m3) of oil and dissolved
natural gas, demonstrating its effectiveness.
Within the Tensleep Sandstone, 14 wells penetrate a small closure and
hydrocarbon accumulation in Section 10 near the southern end of the field (Figure 2).
The closure has a structural crest at 5500 ft (1676 m) depth. The closure is bounded by an
oblique-slip fault to the north that is part of the S1 fault network (Figure 2; see below).
To the south, the closure dips away from the structural crest, covering an area of roughly
0.4 mi2 (1 km2). It is small enough to be managed well yet large enough to capture most
critical reservoir aspects, including heterogeneities, seal characteristics, and pressure
response. Baseline characterization to date serves as the basis for the static geological
model and full-field flow simulation.
Second Wall Creek Sandstone
The Second Wall Creek Sandstone is one of a series of fluvial/deltaic tongues
within the Frontier Formation. These were deposited in a tectonically active basin within
the Cretaceous interior seaway in Wyoming during the early Upper Cretaceous. This unit
is the source of a large percentage of production within Wyoming and is the largest oil-
bearing unit in Salt Creek field, and the second-largest (after the Shannon sandstone) in
NPR-3. It is qualitatively similar to the Etive and Ness formations within the Brent Group

of the North Sea in terms of connectivity, overall reservoir geometry, sequence
stratigraphic characteristics, and relative permeability. Within NPR-3, the sandstone is
relatively thin (60 ft, 18.3 m) but massively bedded, fairly quartzose and homogeneous in
composition. It may represent a low-stand fluvial/estuarine depositional environment
deposited above a regional sequence boundary.
In anticipation of and during waterflooding in NPR-3, over 45 cores from the
Second Wall Creek were collected and analyzed, including special analyses from 37
cores. Average porosity is high at 15% with average permeability of 100 mD. The
variance in permeability is a function of both patchy cements and variation in grain size
(e.g., Dutton et al., 2002).
The overlying cap rock is a shale tongue within the Frontier Formation. It consists
of approximately 250 ft (76 m) of shale and mudstone, and represents the primary
regional seal trapping hydrocarbons within the Powder River basin. The trapping of more
than 57 million barrels (9 million m3) of oil and 45 billion scf (1.3 billion m3) natural gas
at Teapot Dome has demonstrated its effectiveness.
The Second Wall Creek Reservoir at Teapot Dome is divided into a Northern and
Southern Reservoir by a sealing northeast-southwest trending strike-slip fault (S2 fault
network) which cuts across Sections 33 and 34. Geological and reservoir studies on the
Northern Second Wall Creek waterflood were conducted by Lawrence-Allison &
Associates (1987) on behalf of DOE. The flood initiated in 1979; details of its
characterization and likely production effects can be found in the report.

Basic field geology and static geomodels
Various studies have described key aspects of the site-specific field geology for
almost 100 years (e.g., Wegemann, 1918; Thom and Spieker, 1931). Since then, surface
geology, wells, and 3D seismic have defined unambiguously the large-scale field
structure, depth to key horizons, major unit thickness, and secondary fault networks
(Figure 3). Recent mapping by McCutcheon Energy has produced high-precision time-
structure and depth-structure maps of key horizons (e.g., top Tensleep Sandstone, top
Second Wall Creek Sandstone). These data serve as a basis for large 3D static geomodels
(e.g., Wagoner et al., 2005), which can be populated with detailed reservoir information.
Main structural elements The main structural elements of Teapot Dome are a SW verging anticline that
developed above a Laramide-style thrust fault. This thick-skinned fault offsets
Precambrian igneous and metamorphic basement mapped in outcrop in adjacent ranges.
Deformation timing is interpreted to be broadly coeval with Laramide shortening (Late
Cretaceous to Late Paleocene). This faulting produced an asymmetric anticline with
shallow dips (<20°) on the east flank and fairly steep dips (20-50°) on the west.
Several large NE-SW trending faults transect NPR-3. These faults can be mapped
both at the surface and subsurface (Fig. 2) and have been noted by many workers
(Wegemann 1918; Horn 1959; McCutcheon 2003). These faults offset the basement (Fig.
2b,c) and are parallel to both the vergence direction of the main fold and basement
foliation in neighboring outcrops. They have locally complex geometries (e.g.,
Friedmann et al. 2004) and generally have steep dips. At the surface, these faults have
apparent lateral offsets and are characterized by sub-horizontal or oblique-slip striations

(e.g., Cooper et al., 2003). For all these reasons, they are commonly interpreted as
oblique-slip or lateral slip fault networks that reactivate older basement fabrics, acting as
tear faults or accommodation faults during major deformation (e.g., Harding, 1985).
Their timing is interpreted to be broadly coeval with Laramide shortening (Late
Cretaceous to Late Paleocene), but thickness changes across the faults in Paleozoic and
Mesozoic strata suggest that there was some earlier fault slip and growth strata
(Friedmann et al. 2004).
Reservoir Characterization
Substantial characterization of NPR-3 reservoirs exists beyond the stratigraphic
and sedimentological characterization described above. McCutcheon Energy has
investigated the acoustic response of various units to interpret hydrocarbon, porosity, and
stratigraphic signatures (T. McCutcheon, pers. comm.). More detailed data and
assessments are discussed below.
Hydrocarbon character:
Over the years, operators and the United States Geological Survey (USGS) built
datasets of basic information on the hydrocarbon character (e.g., API gravity), original
oil-water contact, and initial gas saturation. Recently, the USGS has undertaken more
detailed analyses of the hydrocarbon system at both Teapot Dome and Salt Creek
(Brennan et al., 2005; Dennen et al., 2005), including whole gas chromatography, source-
rock kerogen characterization, and fluid-inclusion analyses of cements. These data
support interpretations regarding the degree of microbial degradation, reservoir
compartmentalization and communication, and leakage risk. Primary conclusions suggest
that the Tensleep Sandstone hydrocarbon system appears to be connected between Salt

Creek and Teapot Dome, but that the Cretaceous oils are not connected. Moreover,
variable degrees of biodegradation in the Upper Cretaceous oils suggest fault
compartmentalization of the Second Wall Creek and other oil-bearing units, which may
indicate long-term isolation. Finally, hydrocarbon minerals encountered at the present-
day ground surface in NPR-3 appear to have formed at depth, suggesting that
hydrocarbon leakage at the field is not active today and thus may not reflect current
geological leakage potential.
Inorganic Geochemistry
Basic compositional descriptions and petrography on all lithologic units have
been completed. This includes the framework and matrix composition for all coarse-
grained units. Yin (2005) organized much of the specific petrography of the key
reservoirs. Some work has even focused on the reactive chemistry of the Tensleep
Sandstone (Shiraki and Dunn, 2000). In addition to the rock system, RMOTC has
collected a database of brine composition and temperature for all producing units and
some saline aquifers. These data commonly consist of TDS and major element
constituents. One saline aquifer of particular interest is the Crow Mountain aquifer, at
approximately 4500 ft (1372 m) depth, which contains three permitted EPA Class 2 water
disposal wells at NPR-3.
Fractures
The key producing reservoirs at Teapot Dome, and much of the Rocky
Mountains, are fractured. Substantial fracture permeability has resulted in dual porosity
networks that are difficult to characterize and integrate into flow simulations. At Teapot
Dome, several of the producing zones are from fractured shales, including the Niobrara
and Steele Shales (Figure 4), and zones of high fracture density have been targets for
enhanced production.
Several historical or current studies at Teapot Dome have focused on discrete
characterization of the fracture trends. Cooper et al. (2004) studied both outcrop and
surface fracture distribution in order to generate predictions of subsurface fracture density
(Figure 8). They identified orthogonal fracture trends that were used in history matching
simulations performed at both the field scale and within Section 10, for the purposes of
preliminary design and performance predictions of the proposed Section 10 CO2 project
described below (Lorenz and Cooper, 2004). Based on their azimuths, striations, and
cementation patterns, these probably formed during Laramide shortening. This
interpretation is supported by curvature analyses on individual seismic reflections that
reveals anomalies with azimuths and locations parallel to surface oblique faults (Figure
8a). Additional studies by Wadleigh (Aflotech) on characterizing Tensleep natural
fractures in dual porosity, dual permeability reservoir models, and fracture aperture and
geometry data gathered by CT scans of actual fractures in the Teapot Dome 48-x-28 core
by Schechter (Texas A&M) are still in progress and not yet published. Gilbertson and
Hurley (2005) studied Tensleep Sandstone outcrops in the nearby Alcova anticline using
LIDAR (Light Imaging Detection and Ranging) outcrop mapping. The LIDAR survey
was designed to collect sufficient data points (10’s of millions) to resolve fracture planes
≥1 m2 in area (Figure 9). Additionally, high-resolution photomosaics were draped over
the data set. Fracture planes were detected using automated and handpicking approaches.
One goal of the study was to populate a 3D geological model with a fracture network.

Extracted fracture data from the LIDAR dataset determine the parameters used to seed
the fracture-generating model.
The fracture and fault networks of the Tensleep Sandstone, and their role in
controlling oil production, are currently being investigated at West Virginia University
(T. Wilson, personal communication). One of the goals is to verify FMI (Formation
Micro Imaging) fracture data against actual fractures in the core. Summer 2005 field
work included recording Tensleep Sandstone fracture spacing, character and orientation
on the homoclinal section in Fremont Canyon and the anticlinal section at Alcova Dam
(Figure 9), both sites located roughly 30 miles (48.3 km) southwest of Teapot Dome, and
studying the entire rock section from the Precambrian basement through Cretaceous
sedimentary rocks as exposed along the shorelines. Much of the fieldwork focused on
fracture characterization of the Tensleep Sandstone section at Fremont Canyon. Fracture
orientation, intensity, and aperture measurements from the FMI logs and 3D seismic data
will be incorporated into the characterization and future flow simulations. These new
understandings will be of immense value in any Tensleep Sandstone CO2 injection effort.
The natural fractures seen in both the Tensleep Formation sandstones and dolomites
impact performance and reservoir flow. The fractures form a high fluid-conductivity
network that has supplied producing completions with over 166 million barrels of water
with no measurable drop in reservoir pressure. Five Tensleep Sandstone completions in
Section 10 have achieved cumulative water production in excess of 16 million barrels of
water per well. A recent reservoir pressure measured in one of these wells (44-1-TPX-
10) indicated a 3 psi (20.7 kPa) pressure, which reflects the subtle reservoir pressure
increase as wells have been shut in. The 1.8 million barrels (0.29 million m3) of

recovered Tensleep Sandstone oil represent less than 20% recovery of the original oil-in-
place as the water readily bypasses the oil by flowing along the least resistance fracture
pathways between the aquifer and the producing wells. These studies suggest that the
Tensleep Sandstone is a good analog for fractured reservoir systems suitable for either
CO2 flooding or storage.
Previous reservoir production and floods
Nine producing units provide data on original oil-in-place, production history, and
response to various reservoir floods. We focus here on production from the Tensleep
Sandstone and water-flooding of the Second Wall Creek. Other floods in the field have
included a large steam flood of the Shannon Sandstone, an in-situ combustion project,
polymer test, and others.
Tensleep Sandstone: The small closure in Section 10 south of the S1 fault
network (Figure 2) originally contained 3.8 million barrels (0.6 million m3) of 32 API
gravity oil and 11 million scf (0.31 million m3) of natural gas. To date, over 1.8 million
barrels (0.29 million m3) have been produced and over 170 million barrels (27 million
m3) of water, in large part due to the strong bottom water drive. Reservoir pressure
remains high at 2350 psi (16.2 mPa) and the reservoir temperature is 190 oF (88 oC). The
expected reservoir temperature at this depth (5500 ft, 1676 m) would be roughly 125 oF
(52 oC), assuming a regional geothermal gradient of about 1 oF per 100 ft. Initial CO2
swelling tests show excellent response to CO2, including substantial swelling, interfacial
tension reduction of 90%, and five-fold viscosity reduction (Hycal, 2004). This suggests
that a Tensleep Sandstone CO2 flood would be miscible or near miscible, and modeling
predicts good EOR response.

Second Wall Creek water flood:
Waterflooding and produced gas re-injection were both initiated in 1979 to help
slow rapid production decline. Objectives of this publication do not include a thorough
review of the 1987 geological and reservoir studies that focused on those floods. Rather
it is sufficient to note that the waterflood was discontinued in 1992, and during its
operation experienced many challenges related to the complex geology, faulted and
fractured reservoir, low matrix permeability, aging wells (some dating back to the 1920s),
well spacing issues and limited budgets (Lawrence-Allison, 1987). Though the reservoir
is now in a pressure-depleted state, several wells continue production, gas cycling is still
conducted, and produced natural gas liquids are stripped out at the NPR-3 gas plant and
sold with the NPR-3 oil. Ultimate recovery from the reservoir is estimated at
approximately 18.4% of original oil in place (US DOE, 2004).
Reservoir flow simulation
A series of computer reservoir simulations has been performed for the Tensleep
Sandstone in Section 10 to confirm high reservoir fracture connectivity, and as part of the
design work for a proposal in progress for a CO2 EOR/storage pilot project. A sensitivity
study, using the best estimate of sandstone matrix properties in a simulated dual-porosity
solution of matrix and fracture flow, confirmed that fractures provide 20-100 times better
flow capacity than the rock matrix. The high flow capacity of the fractures essentially
equalized the pressure around the matrix pore volume, where most of the oil remains.
Simulations indicated good probability for using precise pressure measurements
to determine the flow path of water as it moves to operating completions. Pressure

observation while activating and idling producing wells was also shown to be a means for
simulator validation by matching field and reservoir simulation pressure characteristics.
The reservoir simulation was tuned with equation-of-state parameters, matched to
the 2004 oil laboratory testing of base and CO2-enhanced fluid properties. Lab results
indicated that the injection of CO2 would result in swelling of the oil by over 20%, a
significant reduction in oil viscosity, and a 95% reduction in interfacial tension (Hycal,
2004). This near-miscible fluid characteristic was accounted for in simulations to
quantify enhanced oil recovery potential. Carbon dioxide injection could improve oil
recovery by 30-40%.
The substantial recovery improvement would result from excluding the water
from the fracture flow system high within the reservoir structure as the carbon dioxide
replaces the water. The carbon dioxide would then process oil in the exposed blocks of
matrix pores. The oil would swell, reduce in both viscosity and interfacial tension, and
then drain into the fracture system for production at completions lower within the
reservoir structure.
Simulations have demonstrated the potential for rapid testing of carbon dioxide
for EOR in the pilot area. Conversion of one crestal well for injection of trucked carbon
dioxide could mobilize oil for rapid response along the fractures to several down-
structure producing “observation” wells operated to observe and capture the oil response.
This gravity-stable project design would demonstrate a low-cost EOR operation
applicable to many fractured reservoirs with high structural relief (Wadleigh, personal
communication).
Current Status of Baseline Monitoring
RMOTC and partner institutions commenced baseline monitoring programs in
late 2003 as part of the comprehensive site characterization necessary to support
proposed CO2 injection and other experiments. Work includes noble gas characterization
(University of Manchester), soil gas surveys (Colorado School of Mines), vertical seismic
profiling, including extended techniques (Lawrence Berkeley National Laboratory),
electrical resistance tomography (Lawrence Livermore National Laboratory), and
hyperspectral airborne surveys (Lawrence Livermore National Laboratory). Some of the
results are presented here.
Noble gas tracing:
The University of Manchester is investigating the use of noble gases (helium,
argon, etc.) as tracers for CO2 movement in both EOR and carbon storage applications.
These gases exist in low concentrations in the CO2 supply stream provided by the
Anadarko CO2 pipeline. Field sampling and analysis of produced fluid samples from
both the Salt Creek EOR project and Teapot Dome began in May 2005. Initial results are
encouraging, but analysis and interpretation of the results are still in the early stages.
Soil Gas:
Soil gas composition and gas flux baseline conditions field-wide at NPR-3 were
established over two years of study, beginning in fall 2003 and documented in two annual
reports (e.g., Klusman, 2004 and 2005). Surface and shallow soil gas and gas fluxes
measured from 40 locations field-wide, and samples from five 10-meter wells of gases
from one to 10 meters depth provide C-13/C-12 ratio, methane, CO2, and C-14 content of
baseline CO2 (Klusman, 2005). The monitoring phase of this work is planned to begin
with initiation of CO2 injection. Carbon dioxide fluxes averaged 227.1 mg CO2 m-2 day-1
and a standard deviation of 186.9 mg m-2 day-1. Methane fluxes averaged 0.137 mg CH4
m-2 day-1 and a standard deviation of 0.326 mg m-2 day-1. Isotopic and soil-gas
concentration data suggested that increased CO2 concentrations with depth were due to
biological oxidation of soil organic matter.
Shallow Geophysics:
A VSP (vertical seismic profile) project to develop “designer seismic” monitoring
is underway at Teapot Dome in collaboration with Lawrence Berkeley National
Laboratory. This project is focused on using shallow microholes (provided through an
experimental drilling program jointly pursued by the National Energy Technology
Laboratory (NETL), Los Alamos National Laboratory (LANL) and RMOTC) specifically
drilled and completed to be used as receivers, and attempting to image deeper horizons
(three to four times the depth of the microholes) for CO2 monitoring; these lines require
processing. At the same location, researchers from Brigham Young University have
conducted shallow reflection seismic profiles to compare with projected fault predictions,
shallow well-log correlations, and the VSP work.
Airborne hyperspectral mapping:
The method uses high-resolution hyperspectral imagery to detect and map the
effects of elevated CO2 soil concentrations on the roots of the local plants (Pickles and
Coven, 2005). The method also detects subtle or hidden faulting systems that localize the
CO2 pathways to the surface. As part of an induced natural gas pipeline leakage detection
study at RMOTC in fall 2004, hyperspectral data were collected both as a baseline for
CH4 effect detection and for future CO2 monitoring.

Leakage Risk Characterization
Fault zone fluid migration:
In addition to the USGS work (Brennan et al, 2005; Dennen et al, 2005) on
organic chemistry of surface hydrocarbon minerals, RMOTC undertook work to directly
investigate the leakage potential of faults within the field. Towards that end, RMOTC
dug two shallow trenches across the S2 fault network in 2004-05 in order to look for
direct evidence of prior or current fluid migration. To date, there is no evidence of current
or recent migration of fluids from reservoir depth. However, chemical analysis of
effluorescence pans along fault strands may indicate shallow groundwater recirculation
along the fault (Klusman, 2005).
In order to better predict the risks associated with fault reactivation due to fluid
injection and pressure transients, new studies have begun to characterize the fault
geometry and in-situ stress patterns near the proposed Section 10 injection site. The
predictions will follow well-established methodologies for fault fluid-migration risk (e.g.,
Wiprut and Zoback, 2002). This work is based on RMOTC data, interpretation of the 3D
seismic volume and well logs, and new analyses by Stanford University.
Well-bore and cement integrity:
Public direct access to wells and lack of a strong production driver provides an
unprecedented potential for analysis of well-bore integrity at Teapot Dome. In 2004,
researchers from Princeton gathered direct well-bore cement samples from multiple
horizons within a Section 10 Tensleep Sandstone well to assess the baseline character of
the vintage cement prior to CO2 injection. Samples ranged from relatively pristine to
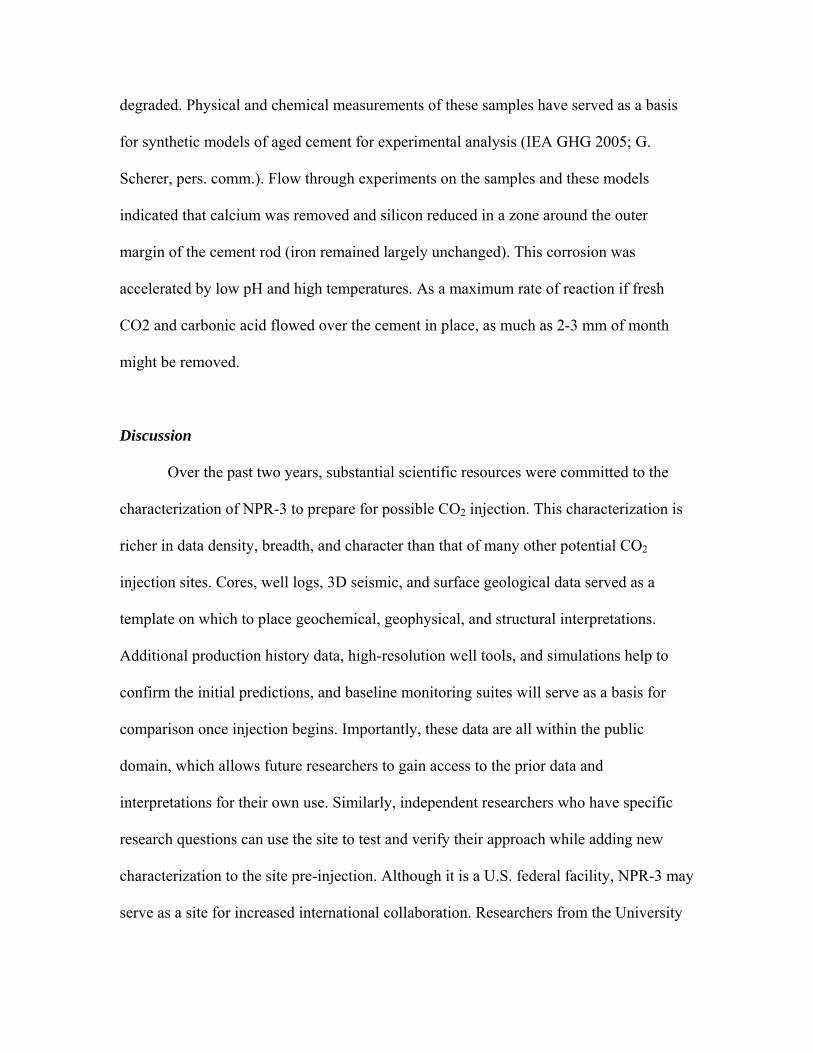
degraded. Physical and chemical measurements of these samples have served as a basis
for synthetic models of aged cement for experimental analysis (IEA GHG 2005; G.
Scherer, pers. comm.). Flow through experiments on the samples and these models
indicated that calcium was removed and silicon reduced in a zone around the outer
margin of the cement rod (iron remained largely unchanged). This corrosion was
accelerated by low pH and high temperatures. As a maximum rate of reaction if fresh
CO2 and carbonic acid flowed over the cement in place, as much as 2-3 mm of month
might be removed.
Discussion
Over the past two years, substantial scientific resources were committed to the
characterization of NPR-3 to prepare for possible CO2 injection. This characterization is
richer in data density, breadth, and character than that of many other potential CO2
injection sites. Cores, well logs, 3D seismic, and surface geological data served as a
template on which to place geochemical, geophysical, and structural interpretations.
Additional production history data, high-resolution well tools, and simulations help to
confirm the initial predictions, and baseline monitoring suites will serve as a basis for
comparison once injection begins. Importantly, these data are all within the public
domain, which allows future researchers to gain access to the prior data and
interpretations for their own use. Similarly, independent researchers who have specific
research questions can use the site to test and verify their approach while adding new
characterization to the site pre-injection. Although it is a U.S. federal facility, NPR-3 may
serve as a site for increased international collaboration. Researchers from the University

of Manchester (U.K.) have already worked at the site, and other international groups have
expressed an interest in testing their equipment and techniques as well.
The current state of reservoir characterizations provides an excellent baseline for
certain kinds of studies. For example, the USGS work on reservoir segmentation and lack
of communication in certain reservoirs would provide a technical basis for studying
geomechanical effects and pressure build-up characterizations; aspects of this problem
will be the focus of a new Stanford Ph.D. study. Similarly, given the ease of access to
cement samples and well bores, the field is an ideal site for well-bore integrity studies.
The abundance of accessible and non-producing wells also creates a natural facility to
test and deploy monitoring arrays with great density. Finally, the abundance of well-
constrained geological information, including geochemical and petrophysical data, could
provide a community model for intercomparison of codes between different research
groups in a predictive (forward) context. As CO2 injection activities are scheduled in the
field, there will be new opportunities to investigate these and other scientific and
technical questions.
Acknowledgements
The authors would like to acknowledge the technical contributions of the
following individuals: Mark Milliken, Tom Anderson, Brian Black, Dag Nummedal,
Peigui Yin, Neil Hurley, Nathan Gilbertson, Gene Wadleigh, Tim McCutcheon, Ronald

Klusman, Scott Cooper, John Lorenz, Ernie Majer, Mike Hoversten, Mark Zoback, Laura
Chiaramonte, Tom Wilson, Robert Burruss, Sean Brennan, Kristen Dennen, Chris
Ballentine, Sarah Mackintosh, David Schechter, George Scherer, Andrew Duguid, Jeff
Wagoner, Tor Nilsen, and Leo Giangiacomo. Special thanks to Doug Tunison and Jim
States who helped gain approval for this manuscript. The Lawrence Livermore National
Laboratory is operated by the University of California for the U.S. Department of Energy
under contract W-7405-Eng-48.

References Cited
Brennan, S., Dennen, K., Burruss, R., 2005, Potential for gas leakage along fracture
conduits within the proposed national CO2 Storage Test Site, Teapot Dome (NPR-3),
Wyoming, NETL 4th Annual Carbon Sequestration Conference Proceedings,
Alexandria, VA, Exchange Monitor Publications, 6 p.
Cooper, S.P., Hart, B., Goodwin, L.B., Lorenz, J.C., and Milliken, M., 2003, Outcrop and
Seismic Analysis of Natural Fractures, Faults and Structure at Teapot Dome,
Wyoming, Wyoming Geological Association September 2003 Field Guidebook, 12
pp.
Davis, T.L., Terrell, M.J., Benson, R.D., and Kendall, R.R., 2002, Seismic monitoring of
a CO2 flood at Weyburn field, Saskatchewan, EAGE Annual Meeting, Extended
Abstract
Dennen, K., Burns, W., Burruss R., Hatcher, K., 2005, Pre-CO2 injection reservoir
assessment, Naval Petroleum Reserve No. 3, Natrona County, Wyoming, NETL 4th
Annual Carbon Sequestration Conference Proceedings, Alexandria, VA, Exchange
Monitor Publications, poster.
Dennen, K., Burns, W., Burruss, R., and Hatcher, K., 2005, Geochemical Analyses of
Oils and Gases, Naval Petroleum Reserve No. 3, Teapot Dome Field, Natrona
County, Wyoming, OFR (Open-File Report) 2005-1275, USGS, 69 pp.
Dutton, S.P., White, C.D., Willis, B.J., Novakovic, D., 2002, Calcite cement distribution
and its effect on fluid flow in a deltaic sandstone, Frontier Formation, Wyoming,
AAPG Bulletin, v. 86, p. 2001-2027

Friedmann, S.J., in press, Thinking big: Science & technology needs for large-scale
geological carbon storage experiments, Energy – the International Journal
Friedmann, S.J., Nummedal, D., Stamp, V.W., 2004, Science and technology goals of the
Teapot Dome field experimental facility, NETL 3rd Annual Carbon Sequestration
Conference Proceedings, Alexandria, VA, Exchange Monitor Publications, 8 p.
Giangiacomo, L.A., 2001, CO2 Flood Screening Study, Teapot Dome Field, July 2001.
Gilbertson, N.J., and Hurley, N.F., 2005, 3D Geologic Modeling and Fracture
Interpretation of the Tensleep Sandstone, Alcova Anticline, Wyoming, AAPG
Bulletin, Vol. 89, Program Abstracts, AAPG Annual Meeting, Calgary.
Harding, T.P. 1985. Seismic characteristics and identification of negative flower
structures, positive flower structures, and positive structural inversion. American
Association of Petroleum Geologists Bulletin, 69, 582-600
Hawkins, D., 2003, Passing Gas: Policy implications of leakage from geological carbon
storage sites, in Kaya Y and Gale J (eds), Abstracts of the 6th International
conference on Greenhouse Gas Control Technology (GHGT-6), Kyoto, Japan, 1-4
October 2002, Amsterdam, Elsevier
Horn, G.H., 1959, Geologic and structure map of Teapot Dome and vicinity, Natrona
County, Wyoming, USGS OFR-348
Hovorka SD, Collins D, Benson SM, Myer LA, Byrer C, Cohen K, 2005, Update on the
Frio Brine Pilot: Eight months after injection, NETL 4th Annual Conference on
Carbon Capture and Sequestration Alexandria, Virginia, May 2–5, 2005

Hycal Energy Research Laboratories Ltd., 2004, DOE-RMOTC- Teapot Dome
Miscibility Study, Final Report, December 13, 2004, 29 p.
IEA GHG (International Energy Agency Greenhouse Gas R&D Programme), 2002,
Opportunities for early application of CO2 sequestration technologies, Report
PH4/10, Paris, 38 p.
IEA GHG (International Energy Agency Greenhouse Gas R&D Programme), 2005,
Report on Wellbore Integrity workshop, Houston,
http://www.co2captureandstorage.info/docs/wbifinalreport.pdf
IPIECA (International Petroleum Industrial Environmental Conservation Association),
2003, Carbon dioxide capture and geological storage: contributing to climate change
solutions. Workshop Summary Brochure, Brussels, Belgium, 21-22 October 2003.
Klara, S.M., Srivastava, R.D., McIlvried, H.G., 2003, Integrated collaborative technology
development program for CO2 sequestration in geologic formations--United States
Department of Energy R&D, Energy Conv. & Management, 44, p. 2699-2712.
Klusman, R. W., 2004, Naval Petroleum Reserve No. 3 CO2 storage test site soil gas
baseline studies: Annual report: Casper, Wyoming, Rocky Mountain Oilfield Testing
Center, 98 pp.
Klusman, R.W., July 2005, Naval Petroleum Reserve No. 3 CO2 storage test site soil gas
baseline studies: Final Report: Casper, Wyoming, Rocky Mountain Oilfield Testing
Center, 117 pp.
Klusman, R. 2005, Baseline studies of surface gas exchange and soil-gas composition in
preparation for CO2 sequestration research: Teapot Dome, Wyoming, AAPG
Bulletin, v. 89, p. 981 -1003.

Lawrence-Allison & Associates West, Inc., Wyoming Division, 1987, Northern Second
Wall Creek Reservoir Engineering Study, NPR #3, 51 pp.
Lorenz JC, and Cooper SP, 2004, Analysis of fracture characteristics and distribution of
48-x-2 well, RMOTC report, 31 p.
McCutcheon, T., Working map of NPR-3 surface geology, including surface faults and
projections of fault networks from depth, 2003.
Nummedal, D., Towler, B., Mason, C., and Allen, M., 2003, Enhanced Oil Recovery in
Wyoming - Prospects and Challenges; White Paper prepared for Dave Freudenthal,
Governor of Wyoming; 22 pp.
Pickles, W.L., and Coven, W.A., 2005, Hyperspectral Geobotanical Remote Sensing for
CO2 Storage Monitoring, in Carbon Dioxide Capture for Storage in Deep Geologic
Formations, Vol. 2, Thomas, D.C., and Benson, S.M., eds., Elsevier
Preston, C., 2003, The Weyburn CO2 monitoring & storage project, 2nd Annual Carbon
Sequestration Conference, NETL/DOE, Conference proceedings, Alexandria, 11 p.
Stamp, V., Nummedal, D., and Friedmann, SJ, 2004, The Teapot Dome Field
Experimental Facility: Characterization of a Century-Old Oil Field for Carbon
Sequestration Research, Abstract and Poster, 7th Annual Greenhouse Gas Technology
Conference, Vancouver
Shiraki, R., and Dunn, T.L., 2000, Experimental study on water-rock interactions during
CO2 flooding in the Tensleep Formation, Wyoming, USA, Applied Geochemistry, V
15, p. 265-279.

Thom, W.T. Jr., and Spieker, E.M., 1931, The significance of geological conditions in
Naval Petroleum Reserve No. 3, Wyoming, USGS Professional Paper 163, 64 pp.
Torp, T.A., and Gale, J., 2003: Demonstrating storage of CO2 in geological reservoirs:
The Sleipner and SACS projects. In Kaya Y and Gale J (eds.), Abstracts of the 6th
International conference on Greenhouse Gas Control Technology (GHGT-6), Kyoto,
Japan, 1-4 October 2002, Amsterdam, Elsevier
U.S. Climate Change Technology Program, 2003, Research and Current Activities, US
DOE, http://www.climatetechnology.gov/library/2003/currentactivities/index.htm
U.S. Climate Change Technology Program, 2003, Technology Options for the Near &
Long Term, US DOE, http://www.climatetechnology.gov/library/2003/tech-options/
U.S. DOE, 1999, Carbon Sequestration Research & Development, Office of Fossil
Energy, Washington, DC,
http://www.netl.doe.gov/coalpower/sequestration/pubs/seqprgpl.pdf
U.S. DOE, 2005, Carbon Sequestration Technology Roadmap, Office of Fossil Energy,
Washington, DC,
http://www.netl.doe.gov/coalpower/sequestration/pubs/Sequestration Roadmap 3-13-
03amfinal.pdf
U. S. DOE, Naval Petroleum Reserve No. 3, June 30, 2004, Oil and Gas Reserves Report
as of June 30, 2004, 14 pp.
Wagoner J, Anderson T, Milliken M, Friedmann SJ, 2005, 3D EarthVision static
geomodel for Teapot Dome, www.rmotc.comT

Wegemann, C.H., 1918, The Salt Creek oil field, Wyoming, USGS Bulletin, 452, p. 37-
82
WGA (Wyoming Geological Association) Guidebook, 2000, Classical Wyoming
Geology in the New Millennium, 51st Field Conference Guidebook, Wyoming
Geological Association, Casper, 205 p.
WGA (Wyoming Geological Association) Guidebook, 2003, Wyoming Basins/Wyoming
Oil Resources & Technology, Wyoming Geological Association, Casper, 150 p.
Wiprut, D., and Zoback, M., 2002, Fault Reactivation, Leakage Potential, and
Hydrocarbon Column Heights in the Northern North Sea, Hydrocarbon seal
quantification: Amsterdam, Elsevier, 2002
Yin, P., 2005, Reservoir characterization for reservoir modeling, simulation, and EOR
practice, Report, Enhanced Oil Recovery Institute, Univ. of Wyoming, Laramie,
[file:///C:/Documents%20and%20Settings/friedmann2/Local%20Settings/Temporary
%20Internet%20Files/Content.IE5/GL4ZOFKZ/257,1,EORI Geologic Component ]

Tables
Table 1: Data types and formats available of Teapot Dome
Data Type Format Accessibility
3D Seismic Volume Digital Direct 3D seismic interpretations, including horizons & faults
Digital Indirect through vendor
Wireline logs: 423 deep wells (>2700’)
Digital Direct
Wireline logs: 800 shallow wells Paper/raster format Direct and indirect (WOGCC) Cores Boxed samples Direct and indirect Core descriptions Reports, paper and
raster Direct and indirect
Formation tops and picks Digital and paper Direct and indirect Well completion reports Paper Direct Well and formation production data Paper and raster Direct Reports on field experiments and studies
Raster Direct
Production tests Raster Direct Geochemical analyses, incl. hydrocarbon and brine composition
Paper and raster Direct
Full 3D flow simulations Digital and raster Indirect Static geomodels of Tensleep Sandstone, Section 10
Digital Indirect

Table 2: Key oil-bearing and brine-bearing reservoir targets
Unit Age Lithology; Depositional Environment
Depth/ Thickness
ft (m)
Seal Pore fluid
Shannon Sandstone
Upper Cretaceous
Sandstone; fluvial/tidal
515 (157)/ 120 (37)
Carlisle Shale Oil
1st Wall Creek Sandstone
Upper Cretaceous
Sandstone; deltaic 2650 (808)/ 160 (49)
Frontier shale Brine
2nd Wall Creek Upper Cretaceous
Sandstone; fluvial/deltaic
3086 (941)/ 65 (20)
Frontier shale Oil
3rd Wall Creek Upper Cretaceous
Sandstone; deltaic 3325(1013)/ 5 (1.5)
Frontier shale Oil
Muddy Sandstone
Lower Cretaceous
Sandstone; shoreface
3840(1170)/ 15 (4.6)
Mowry Shale Oil
Dakota Sandstone
Lower Cretaceous
Sandstone; fluvial 3975(1212) / 85 (26)
Thermopolis Shale
Oil
Lakota Sandstone
Lower Cretaceous
Conglomeratic sandstone; fluvial
4060(1237) / 10 (3)
Thermopolis Shale
Oil
Sundance Sandstone
Jurassic Sandstone; shoreface
4340(1323) / 95 (29)
Morrison Fm. Shales
Brine
Crow Mt. Triassic Sandstone; fluvial 4585(1378)/ 80 (24)
Lower Sundance shales
Brine
Tensleep Sandstone
Pennsylvanian Sandstone & dolostone; eolianite & sabkha
5205(1586) / 320 (98)
Goose Egg shales & evaporites
Oil
Amsden Fm. Pennsylvanian Limestone; carbonate platform
5845(1782) / 160 (49)
Dolomicrites Brine
Madison Fm. Mississippian Limestone; carbonate platform
6005(1830) / 300 (91)
Dolomicrites & evaporites
Brine
“Flathead” Sandstone
Devonian Sandstone; braided fluvial
6865(2092) / 200 (61)
Devonian shales
Brine
Table 3: Tensleep Sandstone Characteristics at NPR-3
Average 2σ range Porosity (φ) 8 1 – 19 Permeability (mD) 80 0 – 110 Thickness (ft, m) 320 (97.5 m) 300-350 (91.4-107 m ) Salinity (mg/L) 3100 2600-3600 Gravity (API units) 32 32-40 Cap rock thickness (ft, m) 300 (91.4 m) 310-330 (94.5-101 m)

Figure Captions:
Figure 1: Location for Teapot Dome. (Left) Shaded relief map of Wyoming with location
of CO2 pipelines. Orange line (Bairoil to Salt Creek) was completed in early 2004. Red
areas are large gas fields, and green areas are large oil fields. Image is courtesy of
Anadarko Petroleum Corporation. (Right) Structure map on the top Second Wall Creek
Sandstone at the Salt Creek and Teapot Dome oil fields. Heavy outline shows NPR-3
field boundary. Small squares (sections) = 1 mi2 (2.6 km2). Distance from Casper to
Teapot Dome is roughly 40 miles; field outline of Teapot Dome extends roughly 7 miles
from northern to southern end.
Figure 2: (a) Map of NPR-3 surface geology, including surface faults and projections of
fault networks from depth (McCutcheon, 2003; after Horn, 1959). Light red zones are
surface projections of faults mapped at depth based on 3D seismic interpretations; darker
red lines are mapped locations of faults at surface. Dark green lines in center of field are
Sussex Sandstone outcrops. The S1 and S2 fault networks are marked. Red box in lower
field center is section 10. Thin blue line shows field outline; black dots are wells. (b)
Time-structure map of the basement. Note parallel structure to surface (c) Contoured
time-structure map of basement (Stamp et al. 2004)
Figure 3: 3D seismic visualization showing the top of the Second Wall Creek Sandstone
viewed towards the northeast. Sticks represent the main faults within the S2 fault
network.

Figure 4: Stratigraphic column for the Teapot Dome field. Dark-grey boxes on the far
right represent oil-bearing zones, and light-grey units represent brine-bearing zones.
Figure 5. (a) Paleogeographic map of early Permian Tensleep extent; dark area represents
area of thickest deposition. After Miller (1992) (b) Stratigraphic correlation diagram for
the late Paleozoic in Wyoming. The Tensleep Formation is shown in the center. Revised
from WGA guidebook, 2000. (c) Core from 48-x-28. Note the oil staining in the upper
(left) core sandstone and the underlying brine aquifer in the lower (right) core.
Figure 6. (a) Diagram of depositional boundaries within the Tensleep at Bighorn
Mountain. The thick blue lines are marine carbonates that overlie the terrestrial dune
deposits of the main sandstones. Black lines are boundaries between migrating dunes, and
thin brown lines show the original stratal inclination of the dune foreset beds. (b)
Tensleep porosity and permeability by sedimentological unit: DUC=dune uncemented;
DC = dune cemented; DDC = dune dolomite cemented; IDUC = interdune uncemented;
IDC = interdune cemented.
Figure 7. Core description, environmental interpretation, and sequence stratigraphic
architecture of Tensleep well 54-TPX-10 from within section 10. Note the variable
permeability in the “A” and “B” sandstones as a function of cementation and sub-
environment.

Figure 8: Fracture systems within NPR-3. (a) Curvature analysis of the 2nd Wall Creek
Horizon. Note NE-SW trends. Dashed black line is the fold axis. (b, c) Outcrop fractures
of the Parkman Sandstone (Cooper et al., 2003) around the end of the field. (b) fractures
parallel to surface faults interpreted as tear faults; (c) fractures at a high angle to surface
faults. (d) Rosette diagram of natural fractures within the Tensleep Sandstone as imaged
by FMI logs, well 48-x-28. (e) Photo of segment of 25 ft. (7m) long cemented fracture in
Tensleep reservoir.
Figure 9: Outcrop fracture studies on the Tensleep Sandstone along an analogous
structure: the Alcova Anticline. (a) Outcrop photomosaic of the north side of the canyon.
(b) LIDAR 3D projection of point cloud of the same outcrop. The inset rosettes show the
fracture trends derived from the LIDAR point clouds. (c) Close-up segment of the NE
side of the northern canyon wall. Inset blow-up shows details of digitally derived strike
and dip maps and derived fracture geometries. From Gilbertson and Hurley (2005).
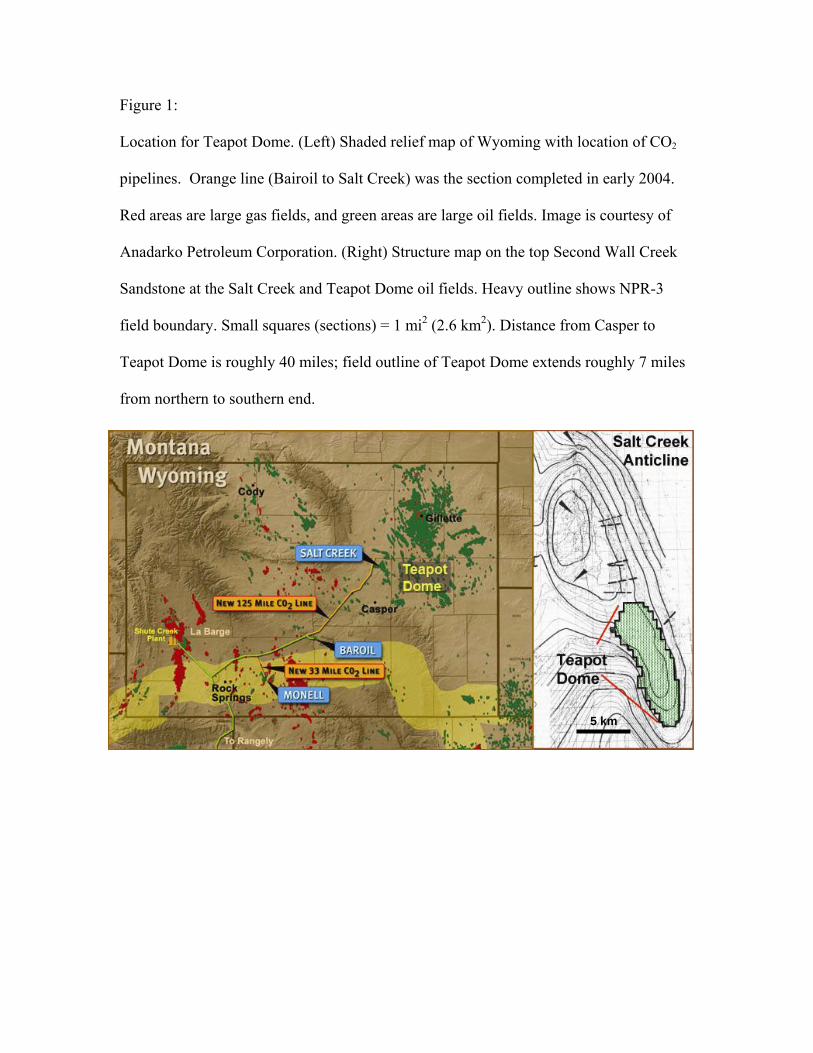
Figure 1:
Location for Teapot Dome. (Left) Shaded relief map of Wyoming with location of CO2
pipelines. Orange line (Bairoil to Salt Creek) was the section completed in early 2004.
Red areas are large gas fields, and green areas are large oil fields. Image is courtesy of
Anadarko Petroleum Corporation. (Right) Structure map on the top Second Wall Creek
Sandstone at the Salt Creek and Teapot Dome oil fields. Heavy outline shows NPR-3
field boundary. Small squares (sections) = 1 mi2 (2.6 km2). Distance from Casper to
Teapot Dome is roughly 40 miles; field outline of Teapot Dome extends roughly 7 miles
from northern to southern end.
5 km

Figure 2: (a) Map of NPR-3 surface geology, including surface faults and projections of
fault networks from depth (McCutcheon, 2003; after Horn, 1959). Light red zones are
surface projections of faults mapped at depth based on 3D seismic interpretations; darker
red lines are mapped locations of faults at surface. Dark green lines in center of field are
Sussex Sandstone outcrops. The S1 and S2 fault networks are marked. Red box in lower
field center is section 10. Thin blue line shows field outline; black dots are wells. (b)
Time-structure map of the basement. Note parallel structure to surface (c) Contoured
time-structure map of basement (Stamp et al. 2004)
C
BA

Figure 3: 3D seismic visualization showing the top of the Second Wall Creek Sandstone
viewed towards the northeast. Sticks represent the main faults within the S2 fault
network.

Figure 4: Stratigraphic column for the Teapot Dome field. Dark-grey boxes on the far
right represent oil-bearing zones, and light-grey units represent brine-bearing zones.
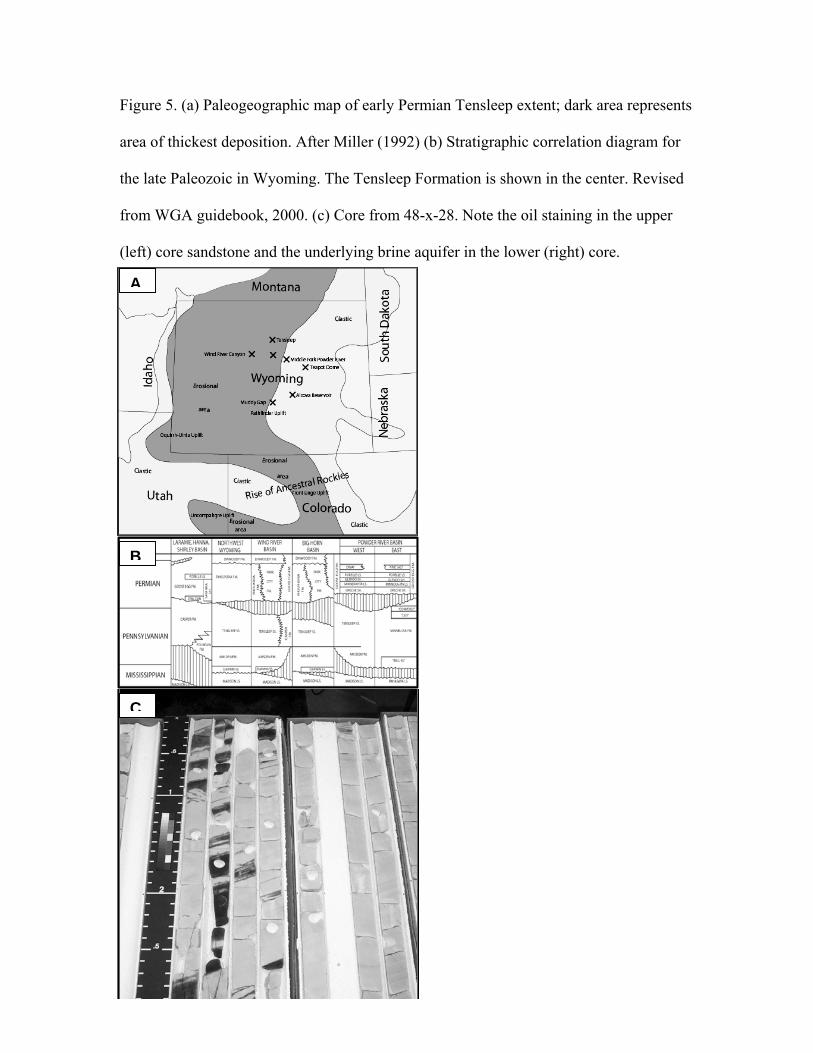
Figure 5. (a) Paleogeographic map of early Permian Tensleep extent; dark area represents
area of thickest deposition. After Miller (1992) (b) Stratigraphic correlation diagram for
the late Paleozoic in Wyoming. The Tensleep Formation is shown in the center. Revised
from WGA guidebook, 2000. (c) Core from 48-x-28. Note the oil staining in the upper
(left) core sandstone and the underlying brine aquifer in the lower (right) core.
C
B
A
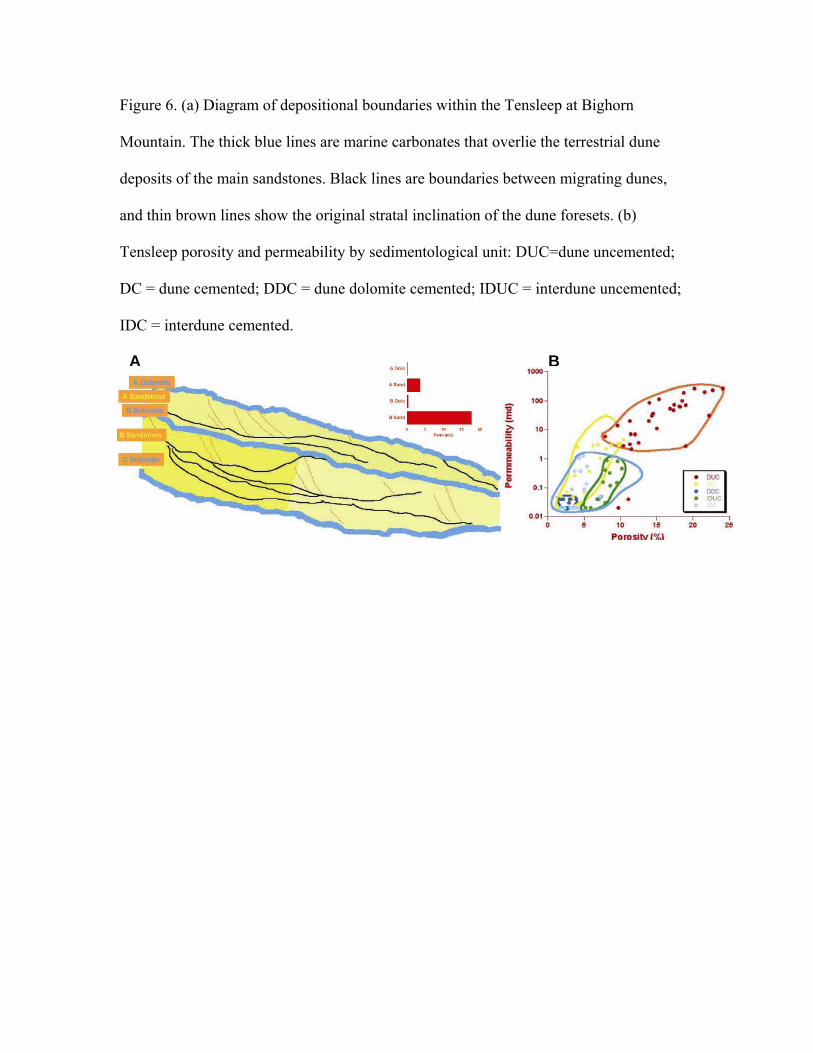
Figure 6. (a) Diagram of depositional boundaries within the Tensleep at Bighorn
Mountain. The thick blue lines are marine carbonates that overlie the terrestrial dune
deposits of the main sandstones. Black lines are boundaries between migrating dunes,
and thin brown lines show the original stratal inclination of the dune foresets. (b)
Tensleep porosity and permeability by sedimentological unit: DUC=dune uncemented;
DC = dune cemented; DDC = dune dolomite cemented; IDUC = interdune uncemented;
IDC = interdune cemented.
BA

Figure 7. Core description, environmental interpretation, and sequence stratigraphic
architecture of Tensleep well 54-TPX-10 from within section 10. Note the variable
permeability in the “A” and “B” sandstones as a function of cementation and sub-
environment.
11/1/2005 11:45 AM

Figure 8: Fracture systems within NPR-3. (a) Curvature analysis of the 2nd Wall Creek
Horizon. Note NE-SW trends. Dashed black line is the fold axis. (b, c) Outcrop fractures
of the Parkman Sandstone (Cooper et al., 2003) around the end of the field. (b) fractures
parallel to surface faults interpreted as tear faults; (c) fractures at a high angle to surface
faults. (d) Rosette diagram of natural fractures within the Tensleep Sandstone as imaged
by FMI logs, well 48-x-28. (e) Photo of segment of 25 ft. (7m) long cemented fracture in
Tensleep reservoir.
D
CB
E
A

Figure 9: Outcrop fracture studies on the Tensleep Sandstone along an analogous
structure: the Alcova Anticline. (a) Outcrop photomosaic of the north side of the canyon.
(b) LIDAR 3D projection of point cloud of the same outcrop. The inset rosettes show the
fracture trends derived from the LIDAR point clouds. (c) Close-up segment of the NE
side of the northern canyon wall. Inset blow-up shows details of digitally derived strike
and dip maps and derived fracture geometries. From Gilbertson and Hurley (2005).
SW NE
100 m
SW NE
100 m
100 m100 m
5 m5 m
C
A
B