deformation within a basement-cored anticline: teapot dome … · teapot dome, wyoming . scott...
TRANSCRIPT

DEFORMATION WITHIN A BASEMENT-CORED ANTICLINE:
TEAPOT DOME, WYOMING
Scott Patrick Cooper
Department of Earth and Environmental Science
New Mexico Tech
Socorro, New Mexico
Submitted in partial fulfillment of the requirements for the degree of
Master of Science in Geology
May 2000


i
ABSTRACT
Teapot Dome is an asymmetric, doubly plunging, basement-cored, Laramide-age
anticline. A systematic study of natural fractures within the Cretaceous Mesaverde
Formation at Teapot Dome, Wyoming indicates that lithology and structural position
control outcrop fracture patterns. Lithology controls fracture, deformation band and fault
patterns in the following ways: 1) fracture intensity increases with increased cementation,
2) fracture spacing increases proportionally with bed thickness within two sandstone
facies, but not in carbonaceous shales where fracture spacing is inversely proportional to
bed thickness, 3) coal cleats are generally oblique, by up to 20 degrees, to fractures in
sandstones, 4) most fractures in sandstone units terminate at contacts with shale layers, 5)
deformation bands occur almost exclusively in a poorly cemented, high porosity, beach-
sand facies, 6) normal faults within well cemented sandstones are generally expressed as
fracture zones, whereas the same faults within poorly cemented sandstones are diffuse
zones of subparallel deformation bands.
Three primary throughgoing fracture sets were documented at Teapot Dome. The
oldest fracture set is oblique to the fold hinge. The vast majority of these fractures strike
NW to WNW. A small number of these oblique fractures strike roughly NNE. Fractures
that strike oblique to the fold hinge appear to predate folding. The most common
fractures, which are found throughout the fold, are bed-normal extension fractures
striking subparallel to the fold hinge. A third set consists of bed-normal extension
fractures striking perpendicular to the fold hinge. In many areas this fracture set is
spatially related and subparallel to NE-striking, normal oblique-slip faults. The normal
oblique-slip faults are common along the eastern limb, but more than 90% of these faults

ii
terminate before intersecting the western limb. Conjugate fractures, deformation bands
and faults, oriented such that they have a vertical bisector to the acute angle and striking
subparallel to the axis of the anticline, are common in the southwestern limb and southern
arc of the anticline. Hinge-parallel and hinge-perpendicular fractures and faults are
probably broadly contemporaneous with basement-involved thrusting and folding at
Teapot Dome, as suggested by their spatial relationship to the fold. Further observations
suggest that fault-related, hinge-perpendicular fractures are generally the same age as
hinge-parallel fractures, and NE-striking, normal oblique-slip faults are oriented roughly
perpendicular to the fold hinge, even where it bends, and terminate toward the SW limb
of the anticline. The oblique movement recorded on some of these NE-striking faults
may be related to differential movement across individual segments of the basement-
involved thrust.
Based on the Teapot Dome natural fracture data set, a 3-D conceptual model of
fractures associated with basement-cored anticlines suggests significant horizontal
permeability anisotropy. Depending on structural position and the interaction between
fracture sets, the direction of maximum permeability can be either parallel or
perpendicular to the fold hinge.

iii
This work is dedicated to my family and, in particular, to the memory of my father
Patrick H. Cooper

iv
ACKNOWLEDGEMENTS
I would like to thank Laurel B. Goodwin, John C. Lorenz, Lawrence W. Teufel,
and Peter S. Mozley for serving on my thesis committee. Each provided valuable help
throughout the entire thesis and graduate study process. Dr. Laurel Goodwin deserves
special thanks for serving as my advisor, for her input into this project and the critical
reviews of each paper and presentation that was developed from this research. Special
thanks also to Dr. John Lorenz for his advice, help, time invested in the field, and for
arranging my internship with Sandia National Laboratories. I would also like to
acknowledge John for suggesting Teapot Dome as a thesis topic and research area – I am
grateful. I have been fortunate to have both Laurel Goodwin and John Lorenz providing
advice and support - Thank you.
I wish thank to Dr. Lawrence Teufel for providing the funding and the
opportunity to work with him, the Naturally Fractured and Stress Sensitive Reservoir
Consortium, and New Mexico Tech. Thanks Larry. I would also like to thank Dr. Bruce
Hart at the New Mexico Bureau of Mines and Mineral Resources for all his help and
support – especially in things seismic. Thanks to Dr. Steve Ralser for all the great
comments and advice.
I gratefully acknowledge and thank the landowners and operators (Tom Allemand
and family, Bill and Mary Owens, John Beaton, and Leland Bertagnole) surrounding
NPR #3 for permission to describe and measure the outcrops on their property. This
project would not have been possible without their understanding and support.
Thanks also to the Rocky Mountain Oilfield Testing Center, The Department of
Energy and the previous contractor Fluor Daniel for providing safety training, logistical

v
support, funding and data. I would also like to thank all the great people at NPR #3 who
have helped with this project over the last two years, including Mark Milliken, Steve
Hardy, Jay LaBeau and everyone else who has come and gone over the life of this
project.
Thanks to Matt Herrin and Tony Lupo for taking the time to review the roughest
forms of this manuscript. I would also like to acknowledge every member of Dr.
Goodwin’s structural research group – each of you has listened intently (even when you
were not interested hearing another petroleum junkie talk). Your comments and
interactions have helped mold my thoughts and research.
Last, but definitely not least, thanks to my family. What can I say – Karen, your
understanding, love, support and willingness to help a middle-aged student keep the
dream of a higher education alive is what made this whole thing possible and worthwhile
(I owe you big time!). To my in-laws (Rick and Hilde Doyle), for supporting us
monetarily and for supporting our decision to leave the work place and enter college. To
my Mom (Jean Cooper), I know it has not been easy since Dad died and Karen and I left
for New Mexico – but every time I talked with you I gained support from the love and
pride in your voice for a son who chose a college education. Thanks also for coming
down these last two semesters and being a Granny-nanny for the boys. Dad, any success
I have is from simply trying to live like the man you were/are and this thesis is dedicated
to you. To my boys, Sean and Ryan, I know you do not understand why you had to leave
Daddy alone to work so much or why you had to stay behind when I was working in the
field, however you have always kept me conscious of those things that really do matter
most in this life – I promise to never forget.

vi
TABLE OF CONTENTS
Abstract …………………………………………………………………………………...i
Dedication …………………………………………………………………………….…iii
Acknowledgments ………………………………………………………………………iii
Table of Contents ………………………………………………………………………...v
List of Appendices ……………………………………………………………………...vii
List of Figures ….………………………………………………………………………viii
INTRODUCTION ………………….……………………………………………………1
Part I: LITHOLOGIC CONTROLS ……………………………………………………..6
Introduction ………………………………………………………………………6
Previous Work …………………………………………………………………...8
Geologic setting ……………………………………………………….…8
Lithologic controls on fracturing ……………………………………….11
Influence of porosity on deformation processes ………………………..14
Teapot Dome ……………………………………………….…………….……..16
Methods …………………………………………………………………16
Mesaverde Formation Stratigraphy ……………………………………..17
Fractures at Teapot Dome ………………………..….……….…………21
Lithologic controls ..…………………………………….………23
Bed thickness ………………………………………..………….27
Porosity …………………………………………………………35

vii
Lithologic controls on faulting ………………………………….42
Mineralization …………………...…………………….…….….42
Discussion ………………………………………………………………………44
Fracture spacing vs. bed thickness ……………………………………...44
Impact of structures on fluid flow ………………………………………46
Conclusions ……………………………………………………………………..48
Part II: STRUCTURAL CONTROLS ………………………………………………….50
Introduction ……………………………………………………………………..50
Fracture-Fold Relationships …………………………………………………….53
Folds associated with thin-skinned thrusts ……………………………..53
Folds associated with deep-seated thrusts ………………………………55
Geologic Setting ………………………………………………………………...57
Structural Analysis of Teapot Dome ……………………………………………61
Distribution of faults and fractures with respect to the fold ……………61
Faults ……………………………………………………………61
Fractures ………………………………………………………...65
Spatial relationship between faults and fractures ……………………….74
Discussion ………………………………………………………………………74
3-D conceptual model of basement-cored anticlines ……..…………….78
Fluid flow implications …………………………………………82
Conclusions ……………………………………………………………………..84
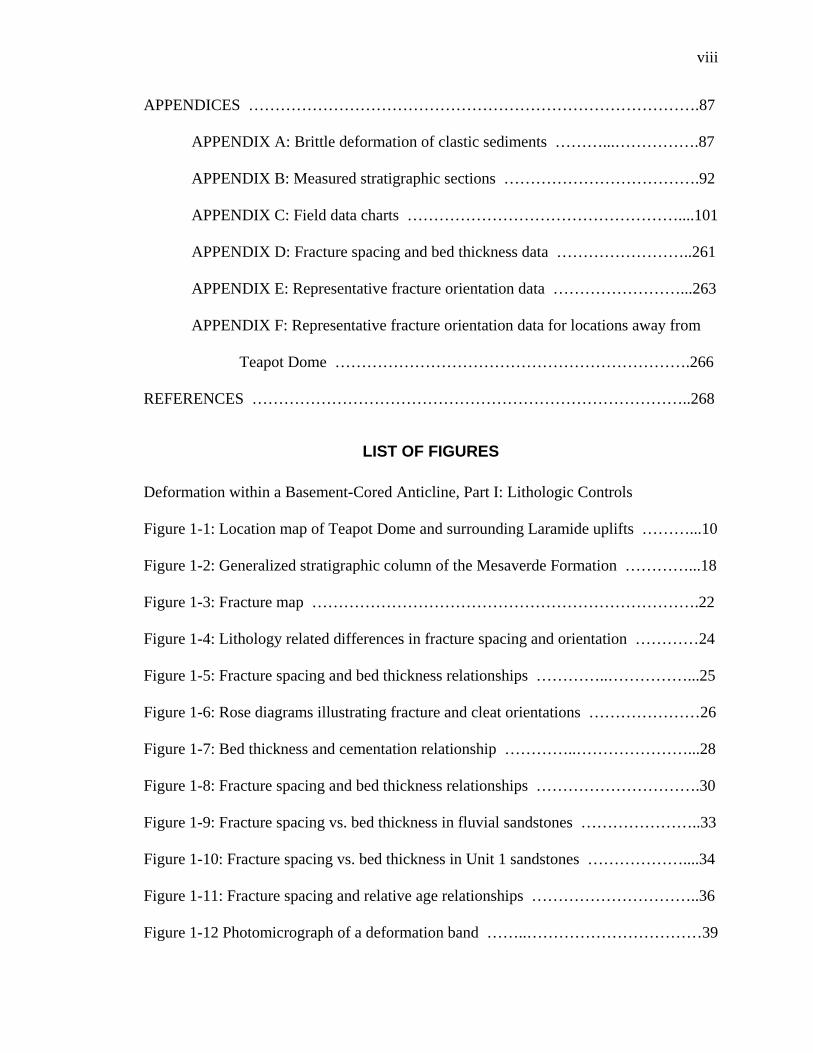
viii
APPENDICES ………………………………………………………………………….87
APPENDIX A: Brittle deformation of clastic sediments ………...…………….87
APPENDIX B: Measured stratigraphic sections ……………………………….92
APPENDIX C: Field data charts ……………………………………………....101
APPENDIX D: Fracture spacing and bed thickness data ……………………..261
APPENDIX E: Representative fracture orientation data ……………………...263
APPENDIX F: Representative fracture orientation data for locations away from
Teapot Dome ………………………………………………………….266
REFERENCES ………………………………………………………………………..268
LIST OF FIGURES
Deformation within a Basement-Cored Anticline, Part I: Lithologic Controls Figure 1-1: Location map of Teapot Dome and surrounding Laramide uplifts ………...10
Figure 1-2: Generalized stratigraphic column of the Mesaverde Formation …………...18
Figure 1-3: Fracture map ……………………………………………………………….22
Figure 1-4: Lithology related differences in fracture spacing and orientation …………24
Figure 1-5: Fracture spacing and bed thickness relationships …………..……………...25
Figure 1-6: Rose diagrams illustrating fracture and cleat orientations …………………26
Figure 1-7: Bed thickness and cementation relationship …………..…………………...28
Figure 1-8: Fracture spacing and bed thickness relationships ………………………….30
Figure 1-9: Fracture spacing vs. bed thickness in fluvial sandstones …………………..33
Figure 1-10: Fracture spacing vs. bed thickness in Unit 1 sandstones ………………....34
Figure 1-11: Fracture spacing and relative age relationships …………………………..36
Figure 1-12 Photomicrograph of a deformation band ……..……………………………39

ix
Figure 1-13: Conjugate deformation bands ……………………..……………………...41
Figure 1-14: Fracture/fault relationship ………………………………………………...43
Deformation within a Basement-Cored Anticline, Part II: Structural Controls
Figure 2-1: Stearns and Friedman (1972) model of preferred fracture orientations ……54
Figure 2-2: Location map of Teapot Dome and surrounding Laramide uplifts .………..59
Figure 2-3: Diagrammatic cross-section of Teapot Dome ……………………………...60
Figure 2-4: Teapot Dome fault map …………………………………………………….63
Figure 2-5: Western limb segmentation ………………………………………………...64
Figure 2-6: Equal area net plot of representative fracture orientations ………………...66
Figure 2-7: Map of WNW striking fracture set at Teapot Dome ………………..……...68
Figure 2-8: Map of fracture sets at and away from Teapot Dome ……………….……..69
Figure 2-9: Map of the hinge-perpendicular fracture set at Teapot Dome ……………..71
Figure 2-10: Map of the hinge-parallel fracture set at Teapot Dome …….…..…….......72
Figure 2-11: Photograph and fracture map illustrating fracture patterns ……………….73
Figure 2-12: Outcrop transect across a fault …………………..………………………...75
Figure 2-13: Comparison of 3-D conceptual fracture models ………………………….80
Figure 2-14: Conceptual 3-D model of fracture patterns from Teapot Dome data …….83
Tables
Deformation within a Basement-Cored Anticline, Part I: Lithologic Controls
Table 1-1: Fracture spacing and lithology relationships ………………………………..29
Table 1-2: Deformation band petrographic data ………………………………………..37
1
INTRODUCTION
Basement-cored anticlines within the Rocky Mountain region have been
hydrocarbon exploration targets since the turn of the century. Structures of this type can
also be found in many other areas of the world (e.g. DeSitter, 1964; Harding and Lowell,
1979). One of the primary reasons basement-cored anticlines are exploration targets is
that they can provide excellent four-way closure. Four-way closure can allow the
entrapment of migrating hydrocarbons in economically significant amounts. To
maximize recovery of these trapped hydrocarbons it is essential to accurately model any
permeability anisotropy associated with these structures.
An important first step in understanding the nature of permeability anisotropy is
developing a conceptual model of the orientations and distribution of structures that
influence flow, such as fractures and faults. Various models have been proposed to
explain the variation in orientation, location and spacing of fractures in basement-cored
anticlines (DeSitter, 1956; Stearns and Friedman, 1972; Pollard and Aydin, 1988; Lorenz,
1997). Many of these conceptual models were developed from field observations at
petroleum reservoirs and outcrops. These models are then applied to similar reservoirs
for predictive purposes. This use of analogous reservoirs for prediction of permeability
anisotropy and localized areas of hydrocarbon accumulation is quite common within the
petroleum industry (Stearns and Friedman, 1972; Nelson, 1985; Pollard and Aydin,
1988).
The main purpose of this research was to evaluate the utility of existing
conceptual models by comparing the orientation and distribution of predicted structures
with those observed at Teapot Dome, Wyoming. Similarities exist between the patterns

2
observed at Teapot Dome and those described or postulated by DeSitter (1956), Murray
(1967), Garrett and Lorenz (1990), Engelder et al. (1997), Hennings et al. (1998) and
Unruh and Twiss (1998). However, the orientations of two primary fracture sets
predicted by one of the most widely used models (i.e. Stearns and Friedman, 1972) are
significantly different from those observed at Teapot Dome. The importance of using a
model most analogous to a specific petroleum reservoir for analysis and prediction of
permeability anisotropy cannot be overemphasized. In general, the most analogous
reservoirs and models would be those with mechanically similar stratigraphic units,
which formed under a similar tectonic regime.
Geologic setting
Teapot Dome is located in central Wyoming, near the southwestern edge of the
Powder River Basin. It is an asymmetrical, doubly plunging, Laramide age anticline with
a curvilinear fold hinge in map view. NE-striking normal oblique faults, striking
predominately perpendicular to the curvilinear fold hinge, are common along the eastern
limb (Thom and Speiker, 1931). Mesaverde Formation sandstones are exposed within a
resistant rim along the eastern, southern and western limbs of the anticline. Maximum
dips along the western limb are near 30o, along the eastern limb dips range from 7o to 14o.
Exposures of the Mesaverde Formation along the northern portion are absent due to
erosion. The Steele Shale is exposed at the surface within the central portion of this
breached anticline. Teapot Dome is one of several productive hydrocarbon traps in
Wyoming associated with Laramide structures.
Oil seeps were known to exist in the Teapot Dome and Salt Creek areas prior to
1880. The first oil well in the area was drilled in 1889 near one of the seeps north of the

3
Salt Creek anticline. The well was drilled to a depth of approximately 213 m (700 ft) and
had a production of 10-15 barrels per day (b/d) from sand lenses in the Steele Shale
(Curry, 1977). Teapot Dome was established as a Naval Petroleum reserve by President
Wilson in 1915 (Doll et al., 1995). The first production at Teapot Dome was 830 barrels
in October 1922, representing two days of flow from a shale well (ID # 301-2; Trexel,
1930). Peak production in 1923 was 138,081 barrels in October from 51 wells or 4460
barrels per day (Trexel, 1930).
The infamous Teapot Dome scandal of the Harding Administration involved
leasing of this Government-owned reserve to Harry F. Sinclair’s Mammoth Oil Company
in 1922. Daily production when placed in the hands of the receivers in 1924 was
approximately 3790 barrels per day (b/d). Trexel (1930) provides monthly sales and
royalty figures for this period. These data show total oil and gas sold by that date by
Mammoth Oil Company was 1,442,496 barrels. Trexel (1930) also indicates that
Mammoth Oil produced between 2 and 2.5 billion cubic feet of gas by March 13, 1924.
Reports indicate that during this period some shale-crevice wells had production rates as
high as 25,000 b/d (Curry, 1977). Production dropped to 22,626 barrels per month by
December 1927. Therefore, during the scandal, wells were producing at a maximum rate
and much of the reservoir pressure was depleted (Curry, 1977; Doll et al., 1995).
The current manager of Teapot Dome, also known as Naval Petroleum Reserve
#3 (NPR #3), is The Department of Energy. Cumulative production for the year 1998
was 250,000 barrels of sweet crude oil, and 26,000 barrels of sour crude oil from an
average of 500 production wells (Milliken, pers. com., 1999). NPR#3 is slated for
closure and reclamation by 2003. At present one of the major uses of the Teapot Dome

4
Field is as a testing center for new technologies. This research is managed through the
Rocky Mountain Oilfield Testing Center located in Casper, Wyoming and on site at
Teapot Dome.
Organization
This thesis provides a new look at how fractures and faults can be formed above a
basement-involved thrust. The 3-D model developed herein conceptually illustrates the
possible orientations of fractures, deformation bands and faults in this type of
deformational regime, which in turn allows one to assess the permeability anisotropy
associated with these features. In the interest of disseminating this information to the
public and thereby providing industry with another reservoir analog, portions of this
thesis are designed as separate papers to be submitted for publication in professional
journals. With this in mind, the thesis comprises two papers to be published as Parts I &
II. Part I is focused on lithologic controls, whereas Part II addresses structural controls
on the distribution and character of faults, fractures and deformation bands. The possible
influence of fault, fracture, and deformation band characteristics, such as spacing and
orientation, on permeability is also discussed. Field data are included in the appendices.
Additional questions
The 3-D conceptual model developed in this thesis should not be applied equally
to all anticlines. Although the model does provide another useful tool to help determine
fluid flow directionality in one type of fractured reservoir, several questions remain
unresolved: 1) How deep into the subsurface can the model adequately predict fracture
and fault orientations and distributions? Further study of fractures at basement-cored
anticlines with exposures of strata lower in the section, such as work done by Hennings et
5
al. (1998), may help. 2) Are the qualitative permeability anisotropy observations
accurate? These could be tested by comparing in-situ well tests with a fluid flow
simulation based on Teapot Dome stratigraphy and structure, as provided from well data,
seismic sections, and the 3-D conceptual model. 3) How tight can the anticline be before
the model becomes invalid? This may require an outcrop study of anticlines with limbs
that dip at angles higher than the maximum 30 degree dip angle observed at Teapot
Dome. Other important considerations in comparing various sites are differences or
similarities in lithology, mechanical stratigraphy and tectonic setting.

6
Deformation within a Basement-Cored Anticline, Part I:
Lithologic Controls
Introduction
Structures such as fractures, fracture networks and faults can influence
permeability and therefore fluid flow within an aquifer or petroleum reservoir (Lorenz
and Finley, 1989; Lorenz et al., 1991; Teufel and Farrell, 1992). A distinct permeability
anisotropy has been observed in reservoirs with low matrix permeability and a well
developed, open fracture system (Elkins and Skov, 1960; Lorenz and Finley, 1989;
Teufel and Farrell, 1992), with the highest permeability parallel to the fractures. Within
a given rock volume fractures generally result in an overall permeability increase. There
may also be significant interaction between the fracture surface and the matrix, allowing
for better drainage of the rock matrix. This matrix/fracture interaction could allow for a
substantial increase in recoverable hydrocarbon reserves.
In contrast, mineralized fractures and deformation bands (small-displacement
faults, characterized by cataclasis and/or pore reduction through compaction) are
typically characterized by significant permeability reduction (Nelson, 1985; Antonellini
and Aydin, 1994; Antonellini et al., 1994). Where fractures are mineralized or the rock is
cut by deformation bands, the rock matrix is more permeable than the structures, so the
rock is most permeable parallel to, and between, fractures and deformation bands.
Therefore, within a given rock volume containing mineralized fractures and/or
deformation bands there will be an overall permeability decrease and possible reservoir

7
compartmentalization. Partially mineralized fractures may still have some permeability.
However, there could be a significant reduction in the interaction between the remaining
open fracture fluid pathway and the rock matrix (Nelson, 1985). Either mineralized or
partially mineralized fractures could have the effect of decreasing the total amount of
producible reserves.
Because structures such as fractures and faults can increase or decrease
permeability in certain directions and thus introduce permeability anisotropy and
heterogeneity it is important, from a production standpoint, that they be modeled
accurately. It can be very difficult, however, to predict the location, spacing, and
orientation of fractures and small-displacement faults in the subsurface (e.g., Lorenz,
1997). Most regional fractures are subvertical, and are thus unlikely to be sampled in
vertical boreholes (Lorenz and Hill, 1992). Reasonable predictions of permeability
anisotropy require an understanding of controls on the distribution and orientation of
such features.
Previous work indicates that lithology and bed thickness are primary controls on
fracture spacing and orientation, reflecting the fact that different rock units are
mechanically distinct (Nelson, 1985; Fjaer et al., 1992; Long et al., 1997; Lorenz, 1997).
Fracture spacing (also referred to as fracture density) has been correlated with the
mineralogical composition of the matrix grains, porosity, and bed thickness. In general,
more brittle rocks will have more closely spaced fractures than less brittle rocks (Nelson,
1985). Therefore, rock units that contain high percentages of well-cemented brittle
constituents will generally have more closely spaced fractures. The primary brittle
constituents within a rock are quartz, feldspar, dolomite and calcite. However, it should
8
be noted that the elastic properties of a given rock unit, which have a direct influence
upon fracture spacing, need not always be associated with the amount of brittle
constituents. For example cleat or fracture spacing within carbonaceous shales and coals
with few quartz grains is in many cases much closer than the fracture spacing within
quartz-rich sandstone beds of similar thickness. Even though coal has fewer brittle
constituent grains relative to sandstone, Price (1966) notes that Young’s modulus for coal
is significantly higher than sandstone. Therefore the difference in fracture spacing is
more directly attributed to Young’s modulus than to brittle constituents.
When loading conditions and all other rock parameters are equal, thin beds will
have a higher fracture density than thicker beds (Price, 1966; Ladeira and Price, 1981;
Nelson, 1985). With a few exceptions fracture spacing is locally proportional to bed
thickness (Price, 1966; Hobbs, 1967; Nelson, 1985; Huang and Angelier, 1989; Lorenz et
al., 1996; Bai and Pollard, 2000).
Examination of natural fracture and fault patterns within Mesaverde Formation
outcrops at Teapot Dome, Wyoming was undertaken, in part, to develop a better
understanding of the influence of lithology and bed thickness on the development of
these structures. Additional work (presented in Part II) addresses variations in fault and
fracture density and orientation with respect to structural position within the dome.
Together, these two studies provide insight into controls on deformation of a
heterogeneous sequence of clastic sedimentary rocks in a basement-cored anticline.
Previous Work
Geologic Setting
Teapot Dome is located in central Wyoming, near the southwestern edge of the

9
Powder River Basin (Figure 1-1). The deepest portions of the Powder River Basin
contain nearly 5,500 m of sedimentary rocks, approximately 2,440 m of which are
nonmarine Upper Cretaceous and lower Tertiary clastic sedimentary rocks related to
Laramide orogenesis (Fox et al., 1991). Fox et al. (1991) note that the tectonic style of
Laramide uplifts varies around the basin, with the greatest deformation along the western
and southern margins. Teapot Dome is one of several productive structural-style
hydrocarbon traps associated with Laramide structures in this area.
A resistant rim of Mesaverde Formation sandstones is exposed along the eastern,
southern and western limbs of Teapot Dome. At this location, the Mesaverde Formation
can be subdivided into two members: the Teapot Sandstone Member and the Parkman
Sandstone Member (Wegemann, 1918; Thom and Spieker, 1931). The Teapot Sandstone
Member overlies the Parkman Sandstone Member with an intervening layer of marine
shale between the two members. This relationship suggests sea regression during
deposition of the Parkman Sandstone Member, followed by a brief transgression, then
regression during the deposition of the Teapot Sandstone Member (Weimer, 1960; Zapp
and Cobban, 1962; Gill and Cobban, 1966). An unconformity at the base of the Teapot
Sandstone Member represents probable subaerial exposure and erosion associated with
eustatic sea level change driven by regional tectonism (Gill and Cobban, 1966; Weimer,
1984; Merewether, 1990; Martinsen et al., 1993). Fractures within the Parkman
Sandstone Member are the principle focus of this study.
The Steele Shale is exposed at the surface within the central portion of this
breached anticline. An exploratory well (No. 1-G-10) near the apex of the anticline
encountered granitic basement at a depth of 2084 m (6849 ft; Gribbin, 1952).
10
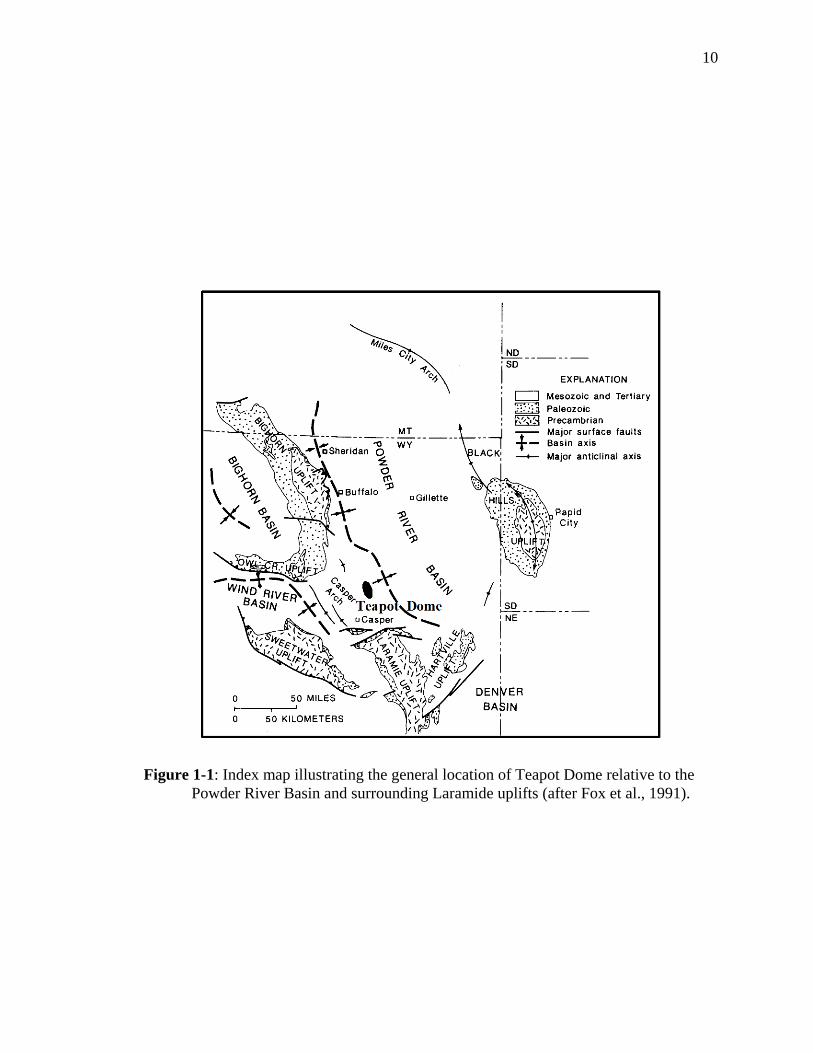
Figure 1-1: Index map illustrating the general location of Teapot Dome relative to the Powder River Basin and surrounding Laramide uplifts (after Fox et al., 1991).

11
The shallowest reservoirs at Teapot Dome are within the Shannon Formation. This
formation is also one of the major producing intervals and is located at depths between
75-200m. The sandstones within this formation were deposited as offshore bars along
the margin of the Cretaceous Western Interior Seaway (Tillman and Martinsen, 1984).
A major set of faults and fractures striking perpendicular to the hinge of the
anticline and a secondary set parallel to the fold hinge were recognized and described at
Teapot Dome by Thom and Spieker (1931). Thom and Spieker (1931) suggested that
these faults and fractures may inhibit fluid flow if they are cemented, and discussed the
possibility of increased hydrocarbon flow if a production well should intersect open
fracture zones. They assumed that fractures would penetrate both sandstones and shales.
These fractures would therefore allow communication between reservoir units and
pressures would equalize. Because different pressures were observed within different
reservoirs the authors assumed that fractures did not significantly influence hydrocarbon
flow.
Part II (Structural Controls) describes three dominant fracture patterns observed at
Teapot Dome. Two of the fracture sets appear to be related to the folding process and are
oriented roughly parallel and perpendicular to the fold hinge. The third set predates
folding and predominately strikes WNW.
Lithologic Controls on Fracturing
Fracture spacing is generally proportional to bed thickness (McQuillan, 1973;
Narr and Suppe, 1991; Gross, 1993; Ji and Saruwatari, 1998; Bai and Pollard, 2000). Bai
and Pollard (2000) evaluated previous studies and showed that spacing to layer thickness
ratios range from greater than 10 to less than 0.1. Bogdanov (1947) mathematically

12
described a relationship where spacing (S) varied as a function of bed thickness (B) and
some constant (K). The constant (K) has been related to lithology (Ladeira and Price,
1981).
Equation 1: S = K B
Price (1966) attributed differences in spacing between fractures in a sandstone
and coal cleats in an adjacent carbonaceous unit to differences in Young’s modulus. In
beds of similar thickness and within the same area, coal cleat spacing can be less than 3
cm whereas fracture spacing within sandstone can be over 35 cm. In evaluating this
relationship, Price (1966) equated strain energy (w) to the applied stress (σ) and Young’s
modulus (E):
Equation 2: w = σ2 / 2E
Given generalized Young’s moduli of E= 2 x 10⁵ and E = 1x 10⁷ for coal and sandstone,
respectively, the strain energy stored in the carbonaceous unit can be several times that of
the sandstone. The difference in stored strain energy is the same order of magnitude as
the difference in fracture spacing.
With respect to fracture spacing within a single bed Price (1966) suggests that at
some distance L from a preexisting fracture forces become large enough to form a second
fracture. Therefore L is the limit of influence of the preexisting fracture and is the
minimum distance at which a second fracture can be formed. Further, if bed thickness is
doubled, a distance of 2L is required for the forces to become large enough to form a
second fracture. Essentially Price (1966) implies a linear relationship between bed
thickness and fracture spacing. Harris et al. (1960) suggests that fracture density is
nearly the inverse of bed thickness. However, bed orientation, thickness of cover, and

13
the degree of cohesion between adjacent units all influence normal stress on the rock
units. Also small lithologic changes, such as grain size, sorting and cementation, will
influence both tensile strength and the coefficient of friction (Price, 1966). Price (1966)
suggested these mitigating factors produce only second-order fluctuations in the bed
thickness to fracture spacing relationship. Other workers (Stearns and Friedman, 1972;
Lorenz et al., 1991; Agarwal et al., 1997; Lorenz, 1997) have observed that lithologic
changes and sedimentary heterogeneities, such as grain composition, cementation and
orientation of lenticular fluvial sandbodies relative to the stress field, can influence
mechanical behavior and have a visible effect on fracture distribution and spacing.
Fracture spacing has also been related to the rock properties and thickness of the adjacent
rock units as well as the rock properties of the fractured bed (Ladeira and Price, 1981; Ji
and Saruwatari, 1998; Bai and Pollard, 2000). Hobbs (1967) suggested that fracture
spacing is proportional to the square root of Young’s modulus for the fractured bed and
the inverse of the square root of the neighboring units’ shear moduli. Ji and Saruwatari
(1998) devised a mathematical model to describe a fractured bed interlayered between
two unfractured beds. In the model fracture spacing (s) depends on the fractured layer
thickness (t) and the surrounding non-fractured layer thickness (d).
Equation 3: s = n (td)1/2
The constant n is dependent on material properties of the rock units and the decay modes
of the shear stress in the bounding layers. The model is supported by field data from
Ladeira and Price (1981).
Methods of evaluating layer thickness to fracture spacing include the Fracture
Spacing Index (Narr and Suppe, 1991), Fracture Spacing Ratio (Gross, 1993) and
14
Fracture Spacing to Layer Thickness Ratio (Bai and Pollard, 2000). The Fracture
Spacing Index (FSI) is the slope of a best-fit line through the origin on plots of
mechanical layer thickness vs. median fracture spacing from a number of layers of
varying thickness. In these plots thickness is on the y-axis however fracture spacing is
held as the dependent variable. The plots are arranged in this manner so that FSI values
correlate to higher fracture density. The Fracture Spacing Ratio (FSR) is the ratio of
median fracture spacing vs. layer thickness for a single layer. Bia and Pollard (2000) use
the Spacing to Layer Thickness Ratio (S/Tf) as the inverse of either of the two previous
measures assuming equal spacing (i.e. mean and median spacing values are the same).
Mean rather than median fracture spacing has also been described as directly proportional
to bed thickness (Huang and Angelier, 1988). The Spacing to Layer Thickness Ratio was
used by Bia and Pollard (2000) because they wished to focus on “fracture spacing rather
than on fracture density”.
Influence of Porosity on Deformation Processes
Rock strength has generally been shown to decrease in a nonlinear fashion with
increasing porosity (Price, 1966; Dunn et al., 1973; Hoshino, 1974). Therefore, the
breaking or fracturing strength of clastic sedimentary rocks is closely related to porosity.
Hoshino (1974) derived an empirical relationship between rock strength and porosity:
Equation 4: n = A e-bσs
Where rock strength (σs) is proportional to porosity (n). A is the porosity at strength zero
and b is related to the amount of strength change for a specific change in porosity. Dunn
et al. (1973) expressed this relationship as:
Equation 5: y = a nb ,

15
where y is the stress difference at failure, n equals porosity, constants a > 0 > b and
“through-going fractures develop by coalescence of grain-boundary cracks, porosity and
extension fractures”. In the case of low porosity rocks, where there is limited open pore
space, a through-going fracture will consist primarily or exclusively of linked extension
fractures and grain boundary cracks. Therefore, low-porosity rocks are relatively strong
because extension fractures must propagate through a relatively large number of grains
within a given volume. In contrast, rocks of higher porosity have numerous open pore
spaces, which requires fewer grains to be fractured. As through-going fractures develop,
they will use open pore spaces whenever possible because crack propagation in this way
requires the least energy (Dunn et al., 1973).
High porosity sandstones commonly deform by a mechanism different than less
porous, more brittle sandstones. Deformation within relatively high porosity sandstones
can occur by a combination of sand grain fragmentation and pore collapse localized
within very narrow bands accommodating displacements of a few millimeters to
centimeters (Engelder, 1974; Aydin, 1978; Jamison and Stearns, 1982; Antonellini et al.,
1994). These generally planar small-displacement faults are defined as deformation
bands (cf. Aydin, 1978). They are typically thin (1mm wide average) with along strike
lengths from a few centimeters to some tens of meters in length. Three major groups of
these small-displacement faults have been described (Antonellini et al., 1994):
1) deformation bands with no cataclasis, 2) deformation bands with cataclasis and 3)
deformation bands with clay smearing. Formation of deformation bands of the first
group is believed to be the result of early, transient dilatancy during grain boundary
sliding. This can be followed by the formation of deformation bands of the second

16
group through grain breakage and pore collapse (Antonellini et al., 1994). The rotation
and crushing of grains results in reduced permeability relative to the surrounding matrix
(Antonellini et al., 1994). Experimental analyses indicate that the effective pressure
required for failure at the transition between brittle faulting and cataclastic flow in porous
sandstones decreases with increasing porosity and grain size (Wong et al., 1997). This
observation is in accordance with field and experimental observations that porous
sandstones tend to be less brittle and fail through a combination of early dilatancy, then
pore collapse and grain fragmentation (Wong et al., 1992; Antonellini et al., 1994; Wong
et al., 1997; Wong, 1998).
There is a direct relationship between grain size and deformation band width.
This relationship is generally described as linear, with the thickness of deformation bands
as some multiple (5-15) of average grain diameter (Roscoe, 1970; Muhlhaus and
Vardoulakis, 1988; Antonellini et al., 1994). Further discussion of deformation bands is
provided in Appendix A.
Teapot Dome
Methods
Data collection sites were chosen to provide 1) a generally uniform distribution
with regard to the large-scale anticlinal structure, and 2) representative samples from the
five different stratigraphic units within the Mesaverde Formation. Data were collected
by systematically recording the grain size, degree of cementation, bed thickness, and
orientation of a given lithologic unit and the type, orientation, spacing, trace length,
degree of mineralization, aperture width, surface characteristics, and abutting

17
relationships of fractures cutting that unit (Appendix C). At certain charted locations the
fracture patterns were mapped to scale. These maps help to illustrate the abutting
relationships in areas where two or more sets exist. Preference was given to localities
that provided a 3-D view (e.g., combined pavement and cross-sectional views).
Mesaverde Formation Stratigraphy
As previously described, early workers (Wegemann, 1918; Thom and Spieker,
1931) subdivided the Mesaverde Formation at Teapot Dome into two members: the
Parkman Sandstone Member and the Teapot Sandstone Member. For this study, a
different approach was utilized. The Parkman Sandstone Member was divided into five
units according to lithology and depositional environment. These divisions best create
units with inherently different mechanical properties. Separating units according to
mechanical properties is important due to mechanical influences on fracture
characteristics. The majority of the fracture measurements were obtained from these five
newly defined lithologic units within the Parkman Sandstone Member. From oldest to
youngest, these units are a shallow-marine, interbedded sandstone/shale, foreshore/beach
sandstone, a white beach sandstone, a non-marine carbonaceous shale, and lenticular
fluvial sandstones within the carbonaceous shale unit. Appendix B details five measured
sections at Teapot Dome; a generalized stratigraphic column is provided in Figure 1-2.
18
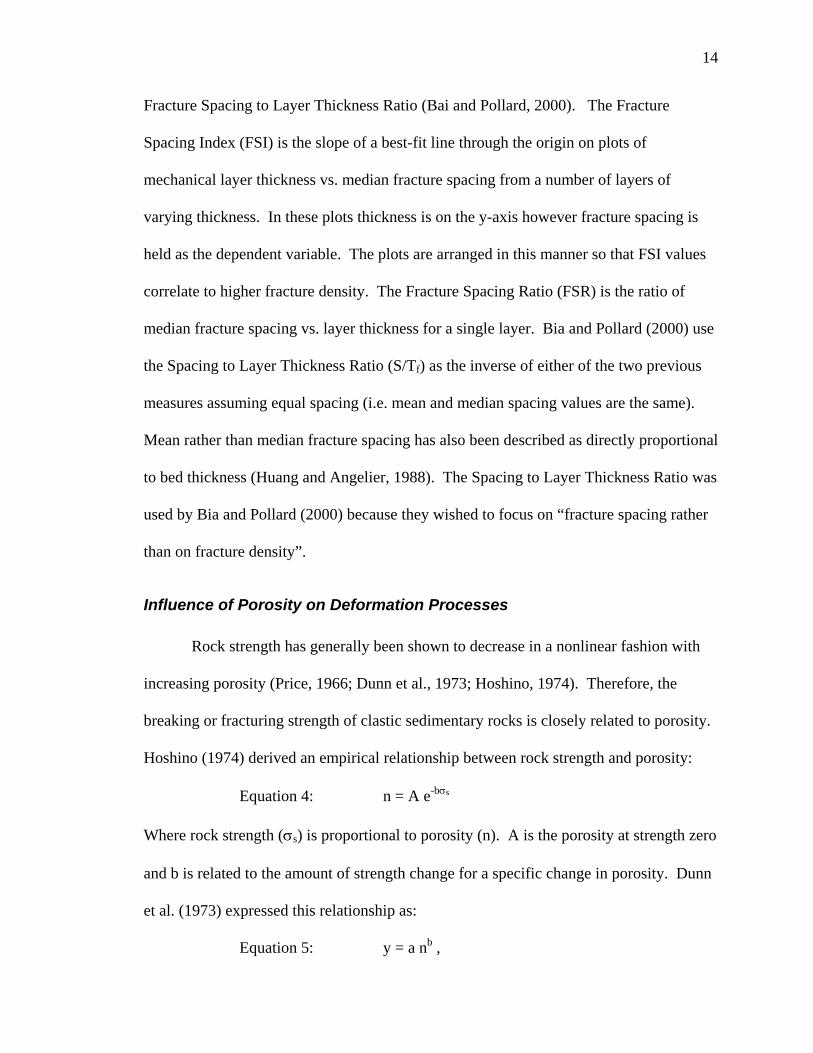
Figure 1-2: Generalized stratigraphic column based on measured sections illustrating the relative positions and thicknesses of the five Parkman Sandstone Member stratigraphic units from which fracture orientation data were recorded at Teapot Dome. Location of measured sections shown in map view and keyed to sections provided in Appendix B.
The stratigraphic sections allow consideration of spatial variations in thickness as
well as facies variations within the units studied. Key observations and justifications for
the environments of deposition within this progradational sequence are summarized in
the following paragraphs.
19
Unit 1 consists of interbedded shallow-marine sandstones and shales and ranges
in thickness from 10 to 20 m, with individual bed thicknesses from 5 cm to 150 cm. This
unit is similar to a basal unit described by Thom and Spieker (1931). This unit is thicker
in the northern half of the anticline. Grain sizes coarsen upward from 62-125 µ in the
lower sandstones to 88-177 µ in the upper beds. The alternating beds of shale and
sandstone, numerous trace fossils, current ripples and occasional hummocky cross-
stratified beds found within this unit are evidence that these sandstones were deposited in
a shallow-marine environment near wave base. When below wave base, the clay was
deposited and not reworked/redistributed farther offshore into the deeper marine
environments. When above wave base, sands were reworked into hummocky cross-
stratified beds. Reworking was intermittent because trace fossils and current ripples were
not always destroyed before burial.
The foreshore/beach sandstone unit (Unit 2) has an average thickness of 15-20 m.
Grain sizes average between 88 and 177 µ. The thickest portion of this unit is found
along the southeastern extent of the anticline (up to 20m thick). The basal (transitional)
portion of this unit locally displays rip-up clasts, ball, pillow and flame primary
structures, and Ophiomorpha trace fossils. The lack of trace fossils (except for the
armored Ophiomorpha burrows) indicates that these deposits were shallow enough for
constant reworking by wave and storm processes. Half-meter scale unidirectional
crossbedding is suggestive of long-shore currents and offshore bars. Thicker sandstone
beds with fewer and thinner shale beds relative to the shallow-marine facies suggest
stronger shoreface currents during transport. The ball and pillow structures may
represent rapidly deposited sandstones. The sands could be derived from surging
20
currents directed offshore, after storms flooded low-lying coastal areas. Alternatively,
these structures could be related to synsedimentary earthquake activity (Kuenen, 1958;
Potter and Pettijohn, 1977).
The white beach sandstone unit (Unit 3) is distinctive due to its snowy white
color, higher porosity and lesser amount of cementation relative to any of the other
Mesaverde Formation sandstones. Thom and Spieker (1931) also described this unit.
This unit is absent along the northwestern portion of the dome, is present as a thin (up to
2 m) unit along the western and southern portions, and thickens to a maximum of 4.5 m
along the eastern limb of the anticline. Grain sizes are between 125 and 250 µ. While
sedimentary structures in this unit are typically obscure, carbonaceous shales deposited in
paludal/swamp environments directly overlie it, suggesting this unit represents the
bedding deposits expected between shallow marine and paludal environments.
The non-marine carbonaceous shale (Unit 4) averages 40 m in thickness and is
locally interbedded with coal. A distinctive black color, generally poor induration, and a
very fine grain size (less than 62 µ) characterize this unit. These organic-rich
carbonaceous shales are indicative of swampy environments. There are no distinct
paleosols or rooted zones to indicate subaerial exposure. However, there are pieces of
fossilized wood as well as twig/leaf imprints in the rock.
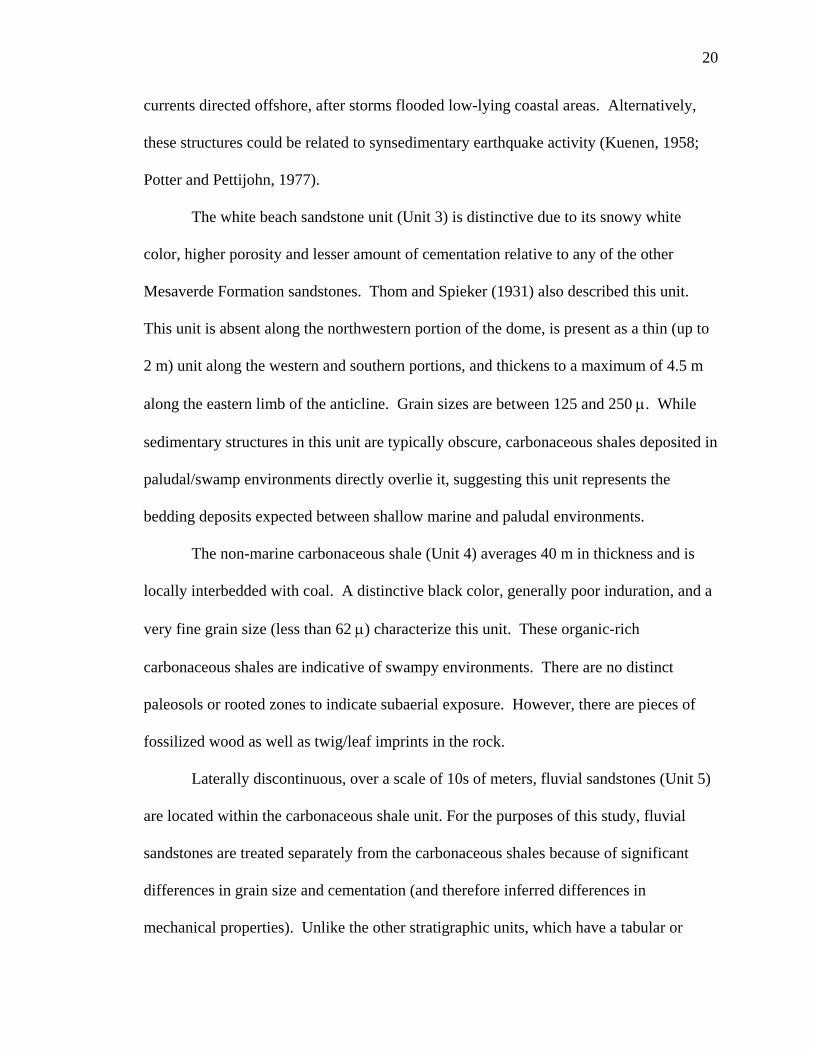
Laterally discontinuous, over a scale of 10s of meters, fluvial sandstones (Unit 5)
are located within the carbonaceous shale unit. For the purposes of this study, fluvial
sandstones are treated separately from the carbonaceous shales because of significant
differences in grain size and cementation (and therefore inferred differences in
mechanical properties). Unlike the other stratigraphic units, which have a tabular or

21
sheeted geometry, the fluvial sandstones are lenticular. Individual fluvial sandstone units
range between 1 and 6 m in thickness. Sandstone lenses are generally poorly sorted with
grain sizes varying between 88 and 250 µ. Crossbeds are generally uniformly oriented at
any single outcrop, but are variable from channel to channel or from location to location
along a channel, reflecting channel sinuosity. Associated ripple-bedded, finer-grained,
thin-bedded overbank and levee deposits occur lateral to the channels or overlie the
channel deposits. In the later case these deposits may have formed during channel
abandonment.
Fractures at Teapot Dome
The dominant type of fractures observed at Teapot Dome is extension fractures that are
primarily oriented parallel or perpendicular to the fold hinge (see Part II). At most
sample locations there are multiple fracture sets, including throughgoing fractures and
cross fractures (Figure 1-3). The majority of apertures measured at these locations are
the result of recent erosion and thus are not discussed here. Surface features such as
plume and rib structures were noticeably absent on almost all exposed throughgoing
fracture surfaces. Due to the limited size of outcrop exposures, fracture trace length data
were generally unobtainable at Teapot Dome. The throughgoing fractures generally
extended from outcrop edge to outcrop edge. In one large pavement surface, within Unit
2 beach sandstones, fracture zones extend along strike over 100m (Appendix C, Chart
34).

22
Figure 1-3: Fracture map of a pavement surface illustrating the nature of throughgoing fractures and cross fractures at the top of a single sandstone bed at Teapot Dome Wyoming (Appendix D, Chart 15).
Lithologic Controls
Both fracture spacing and orientation vary with lithology at Teapot Dome. In
general, fractures are most closely spaced in carbonaceous shales (Unit 4), more widely
23
spaced in fluvial (Unit 5) and beach (Unit 2) sands, and most widely spaced in marine
shales (Unit 1). Fractures are generally absent, replaced by deformation bands, within
the white beach sandstones of Unit 3. Details of these relationships follow.
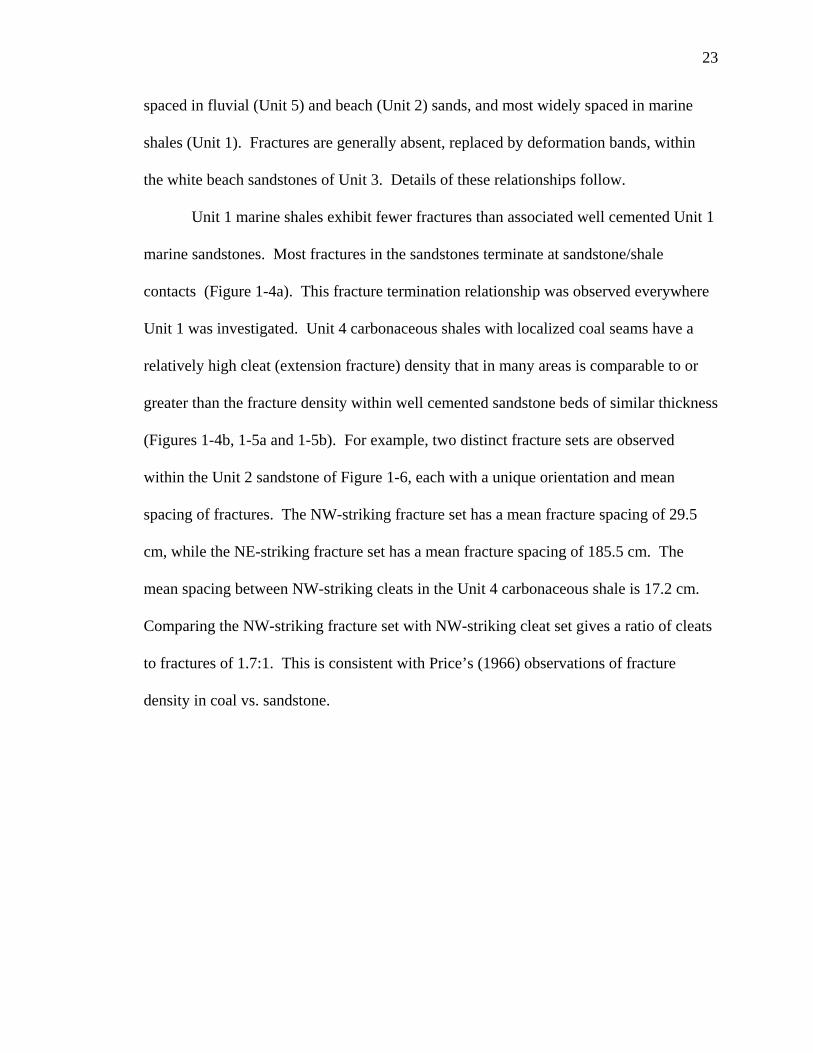
Unit 1 marine shales exhibit fewer fractures than associated well cemented Unit 1
marine sandstones. Most fractures in the sandstones terminate at sandstone/shale
contacts (Figure 1-4a). This fracture termination relationship was observed everywhere
Unit 1 was investigated. Unit 4 carbonaceous shales with localized coal seams have a
relatively high cleat (extension fracture) density that in many areas is comparable to or
greater than the fracture density within well cemented sandstone beds of similar thickness
(Figures 1-4b, 1-5a and 1-5b). For example, two distinct fracture sets are observed
within the Unit 2 sandstone of Figure 1-6, each with a unique orientation and mean
spacing of fractures. The NW-striking fracture set has a mean fracture spacing of 29.5
cm, while the NE-striking fracture set has a mean fracture spacing of 185.5 cm. The
mean spacing between NW-striking cleats in the Unit 4 carbonaceous shale is 17.2 cm.
Comparing the NW-striking fracture set with NW-striking cleat set gives a ratio of cleats
to fractures of 1.7:1. This is consistent with Price’s (1966) observations of fracture
density in coal vs. sandstone.
24
A
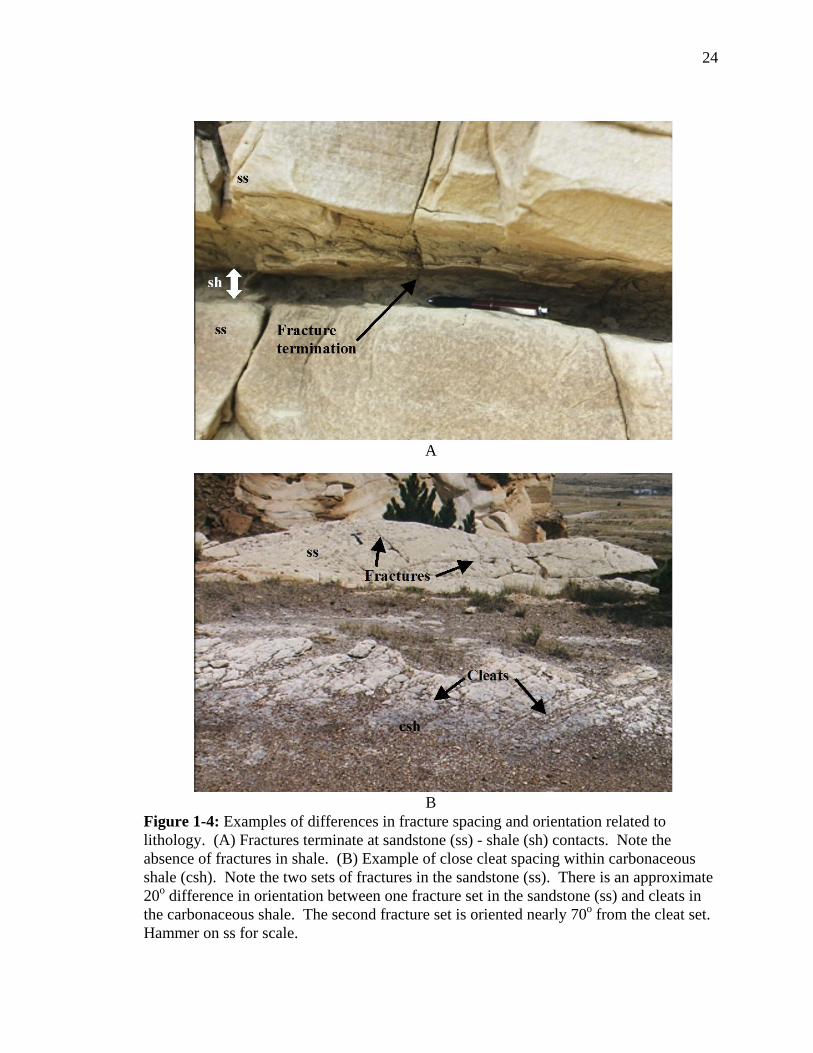
B Figure 1-4: Examples of differences in fracture spacing and orientation related to lithology. (A) Fractures terminate at sandstone (ss) - shale (sh) contacts. Note the absence of fractures in shale. (B) Example of close cleat spacing within carbonaceous shale (csh). Note the two sets of fractures in the sandstone (ss). There is an approximate 20o difference in orientation between one fracture set in the sandstone (ss) and cleats in the carbonaceous shale. The second fracture set is oriented nearly 70o from the cleat set. Hammer on ss for scale.
25
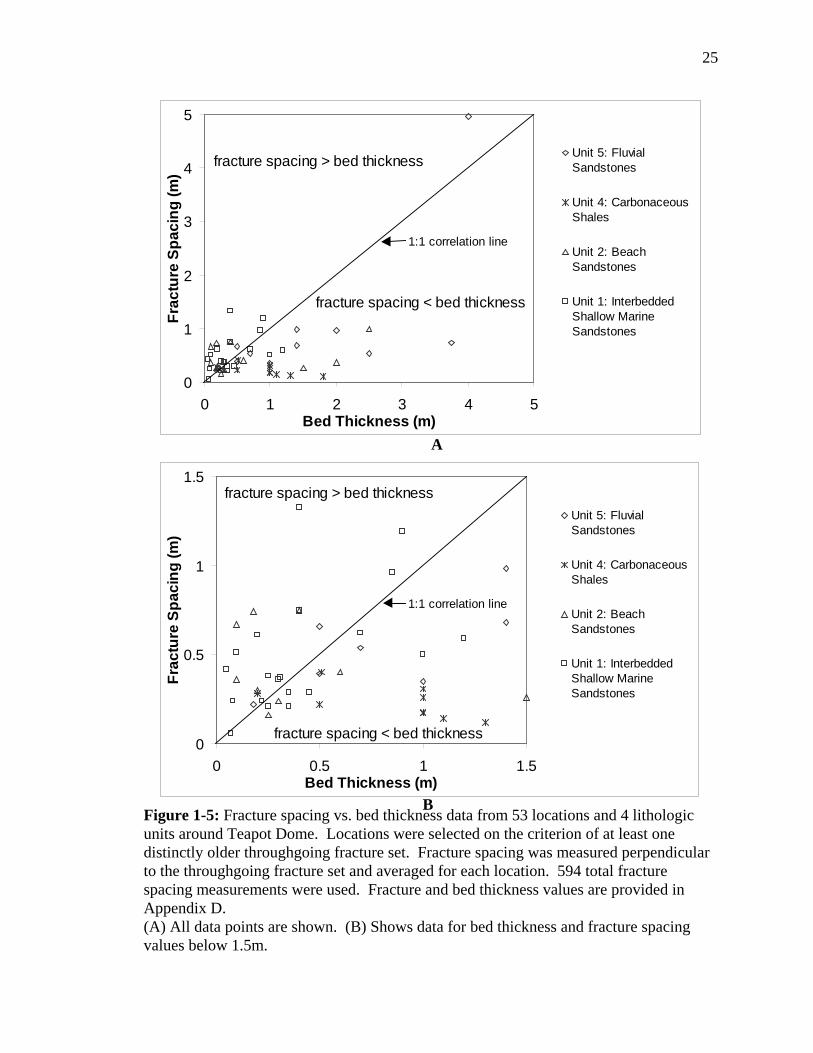
Figure 1-5: Fracture spacing vs. bed thickness data from 53 locations and 4 lithologic units around Teapot Dome. Locations were selected on the criterion of at least one distinctly older throughgoing fracture set. Fracture spacing was measured perpendicular to the throughgoing fracture set and averaged for each location. 594 total fracture spacing measurements were used. Fracture and bed thickness values are provided in Appendix D. (A) All data points are shown. (B) Shows data for bed thickness and fracture spacing values below 1.5m.
0
1
2
3
4
5
0 1 2 3 4 5Bed Thickness (m)
Frac
ture
Spa
cing
(m)
Unit 5: FluvialSandstones
Unit 4: CarbonaceousShales
Unit 2: BeachSandstones
Unit 1: InterbeddedShallow MarineSandstones
1:1 correlation line
fracture spacing < bed thickness
fracture spacing > bed thickness
0
0.5
1
1.5
0 0.5 1 1.5Bed Thickness (m)
Frac
ture
Spa
cing
(m)
Unit 5: FluvialSandstones
Unit 4: CarbonaceousShales
Unit 2: BeachSandstones
Unit 1: InterbeddedShallow MarineSandstones
1:1 correlation line
fracture spacing < bed thickness
fracture spacing > bed thickness
B
A

26
Figure 1-6: Example of the approximate 20-degree difference in orientation between fractures in sandstone and in carbonaceous shale. As illustrated by the rose diagrams, the sandstone unit and carbonaceous shale have two distinct fracture sets.

27
A further comparison suggests a significant difference in orientation between
fractures and cleats. Fractures are oblique to cleats by up to 20o within beds of similar
thickness and relatively close proximity (Figure 1-6).
Given sandstone beds of similar thickness, fractures are more closely spaced
within better-cemented sandstones. Measurements obtained from seven adjacent
sandstone beds within Unit 2 illustrate the relationship between the amount of
cementation and fracture spacing in sandstones observed throughout Teapot Dome
(Figure 1-7). Fracture spacing of the oldest throughgoing set was measured
perpendicular to fracture strike. The oldest throughgoing set at this location is oblique to
the fold hinge and has a representative orientation of N55oW 75oNE. Note that porosity
is inversely related to the amount of cementation within a specific rock unit (Table1-1).
Bed Thickness
Data from Figure 1-5 were subdivided by lithology in order to evaluate the
common belief that fracture spacing is proportional to bed thickness. Locations with bed
normal extension fractures that have unambiguous abutting relationships and are not
related to faulting are used in Figures 1-5 and 1-8. Data compiled from Appendix C data
charts for this analysis are provided in Appendix D. Only the spacing between fractures
in the oldest through-going fracture sets was plotted. This eliminated the necessity of
determining the influence of pre-existing fractures on secondary fracture spacing. These
data suggest that there is a broad linear relationship as described by Bai and Pollard
(2000).

28
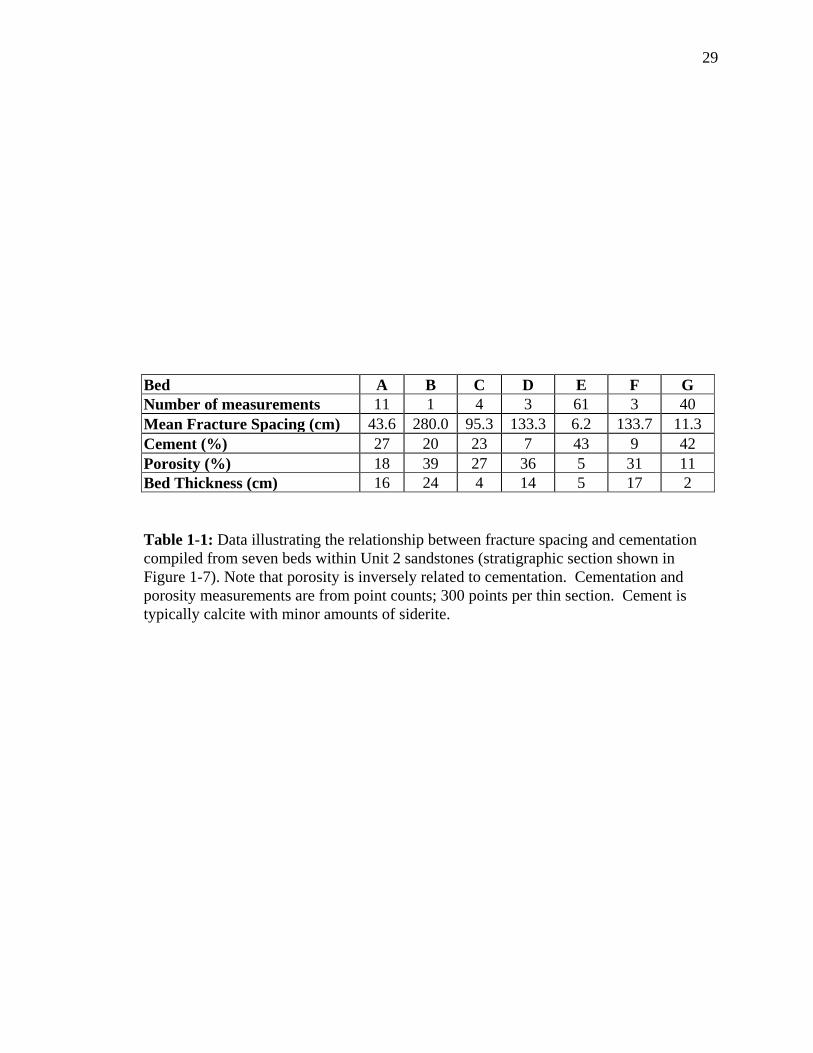
Figure 1-7: Fracture spacing generally decreases nonlinearly with increased cementation in a comparison of seven adjacent beds within the shoreface/beach sandstones of Unit 2. Cement percentages were determined from thin section point count data. Fracture spacing is average of measurements from each bed (Table 1). Data table provided in Appendix D – Chart 50.
R2 = 0.7889
0
50
100
150
200
250
300
0 10 20 30 40 50
% cement
Frac
ture
spa
cing
(cm
)
B
D F
C
AG
E
A – 27 %
B – 19.7 %
C – 22.7 % D – 7.3 %
E – 43.3 %
F – 9.0 %
G – 42.3 %
0
10 cm
Diagrammatic stratigraphic section Unit 2: shoreface/beach sandstones
Beds A-G shown with cementation percentages
29
Bed A B C D E F G Number of measurements 11 1 4 3 61 3 40 Mean Fracture Spacing (cm) 43.6 280.0 95.3 133.3 6.2 133.7 11.3 Cement (%) 27 20 23 7 43 9 42 Porosity (%) 18 39 27 36 5 31 11 Bed Thickness (cm) 16 24 4 14 5 17 2 Table 1-1: Data illustrating the relationship between fracture spacing and cementation compiled from seven beds within Unit 2 sandstones (stratigraphic section shown in Figure 1-7). Note that porosity is inversely related to cementation. Cementation and porosity measurements are from point counts; 300 points per thin section. Cement is typically calcite with minor amounts of siderite.

30
Figure 1-8: Bed thickness vs. fracture spacing from 53 locations and 4 lithologic units around Teapot Dome. Locations were selected on the criterion that there is at least one throughgoing fracture set. Fracture spacing was measured perpendicular to the throughgoing fracture set and averaged for each location. 594 total fracture spacing measurements were used. Fracture and bed thickness values are provided in Appendix D. This is the same data set used in Figure 1-5. Mean fracture spacing is the dependent variable in all three linear regression analyses.
It is important to consider that bed thickness may or may not be the effective
Unit 5: Fluvial Sandstonesy = 0.6771x - 0.1009
R2 = 0.4388
0
1
2
3
4
5
0 1 2 3 4 5
Bed thickness (m)
Mea
n fr
actu
re s
paci
ng (m
)
Unit 4: Carbonaceous Shalesy = -0.1432x + 0.3537
R2 = 0.4806
0
0.5
1
1.5
2
0 0.5 1 1.5 2
Bed thickness (m)
Mea
n fr
actu
re s
paci
ng (m
)Unit 1: Interbedded Shallow
Marine Sandstones y = 0.4938x + 0.2983
R2 = 0.2421
0
0.5
1
1.5
2
0 0.5 1 1.5 2
Bed thickness (m)
Mea
n fra
ctur
e sp
acin
g (m
)
Color Key: Blue Hinge-parallel fracture set Green Hinge-perpendicular fracture set Red Hinge-oblique fracture set
Unit 2: Beach Sandstonesy = 0.0962x + 0.4062
R2 = 0.0932
0
0.5
1
1.5
2
2.5
0 0.5 1 1.5 2 2.5
Bed thickness (m)
Mea
n fra
ctur
e sp
acin
g (m
)
31
mechanical thickness. Gross (1993) defines a lithology-controlled mechanical layer as
having boundaries where lithologic variation produces distinctly different mechanical
properties, so that the layer will respond homogeneously to an applied force. Effective
bed thickness is a term used within this paper to describe the total thickness of adjoining
stratigraphic units that respond to a deformation process as a single mechanical unit.
Therefore, at Teapot Dome, poor correlation coefficients could be attributed to
differences between measured bed thickness and effective bed thickness (Figure 1-8).
When evaluating Figures 1-5 and 1-8 it is important to consider the possible
mechanical stratigraphic controls on the various units. For example, marine sandsheets
separated by shale (shale/sandstone/shale) may be mechanically different than a
contiguous sequence of sandstone beds. Unit 1 sandstones are interbedded in shale.
They are laterally continuous shallow-marine sandsheets that have a tabular or sheeted
geometry. Unit 2 includes beach sandstones generally interbedded within other beach
sandstones. These sandstones have a tabular geometry and are laterally continuous. Unit
4 is laterally continuous and is composed of poorly indurated carbonaceous shales and
coal. Unit 5 fluvial sandstones have a lenticular geometry and are laterally discontinuous
over a scale of 10’s of meters. These fluvial sandstones are interbedded with
carbonaceous shales.
Unit 5 fluvial sandstones have a fracture to bed thickness relationship closest to a
1:1 correlation line (Figure 1-5). Though the correlation coefficient is poor (r2 = 0.4388),
Figure 1-8 does illustrate a broad positive linear relationship between fracture spacing
and bed thickness within Unit 5 sandstones. Ladeira and Price (1981) and Huang and
Angelier (1988) indicate that the linear correlation between fracture spacing and bed

32
thickness is no longer observed after beds become a few meters thick. If the three
thickest beds are removed from the Unit 5 analysis, a correlation coefficient of 0.6546 is
recorded and the equation of the line indicates predicted fracture spacing is
approximately 1/3 bed thickness (Figure 1-9). The spacing between cleats within Unit 4
carbonaceous shales is inversely proportional to bed thickness (Figures 1-5 and 1-8). The
correlation coefficient for the Unit 4 linear regression is still poor at 0.4806. Fracture
spacing within Unit 2 is the most variable with respect to bed thickness of all the units (r2
= 0.2421; Figure 1-8). Unit 1 shallow marine sandstones at first glance show almost no
correlation between fracture spacing and bed thickness (Figures 1-5 and 1-8). However,
the data in Figure 1-8 are subdivided by orientation of the measured fracture set, and a
review of these data shows that hinge-perpendicular fractures within Unit 1 sandstones
are better correlated to bed thickness than other fractures (r2 = 0.6719; Figure 1-10). This
may be due to Unit 1 sandstones being interbedded with an incompetent (shale) layer and
thereby creating the condition wherein bed thickness is equivalent to effective bed
thickness. Evaluation of fracture orientations within the remaining lithologic units
suggests that better correlation coefficients could be obtained once broken into specific
fracture sets. However, breaking the data down into smaller segments (i.e. into fracture
sets) can increase the correlation coefficient simply because there are fewer data points
relative to the initial data set. There are enough (8) Unit 1 hinge-perpendicular fractures
in the sample to suggest that analysis is statistically significant.

33
Figure 1-9: Fracture spacing vs. bed thickness correlation for Unit 5 fluvial sandstones. This is the same data set as provided in Figures 1-5 and 1-8 minus the three thickest beds.
Unit 5: Fluvial Sandstones y = 0.3729x + 0.2408R2 = 0.6546
0
0.5
1
1.5
2
0 0.5 1 1.5 2
Bed Thickness (m)
Frac
ture
Spa
cing
(m)

34
Figure 1-10: Spacing vs. bed thickness chart for the fracture set oriented perpendicular to the fold hinge within Unit 1 sandstones. This is the same data set as provided in Figures 1-5 and 1-8 for Unit 1 sandstones minus the other two primary fracture orientations (i.e. parallel and oblique to the fold hinge).
Preexisting fracture sets may affect the spacing of younger fracture sets. For this
analysis, data from Appendix D were subdivided in to the oldest throughgoing set,
Unit 1: Interbedded Shallow Marine Sandstonesy = 0.8634x + 0.0756
R2 = 0.6719
0
0.2
0.4
0.6
0.8
1
0 0.2 0.4 0.6 0.8 1
Bed thickness (m)
Frac
ture
spa
cing
(m)
35
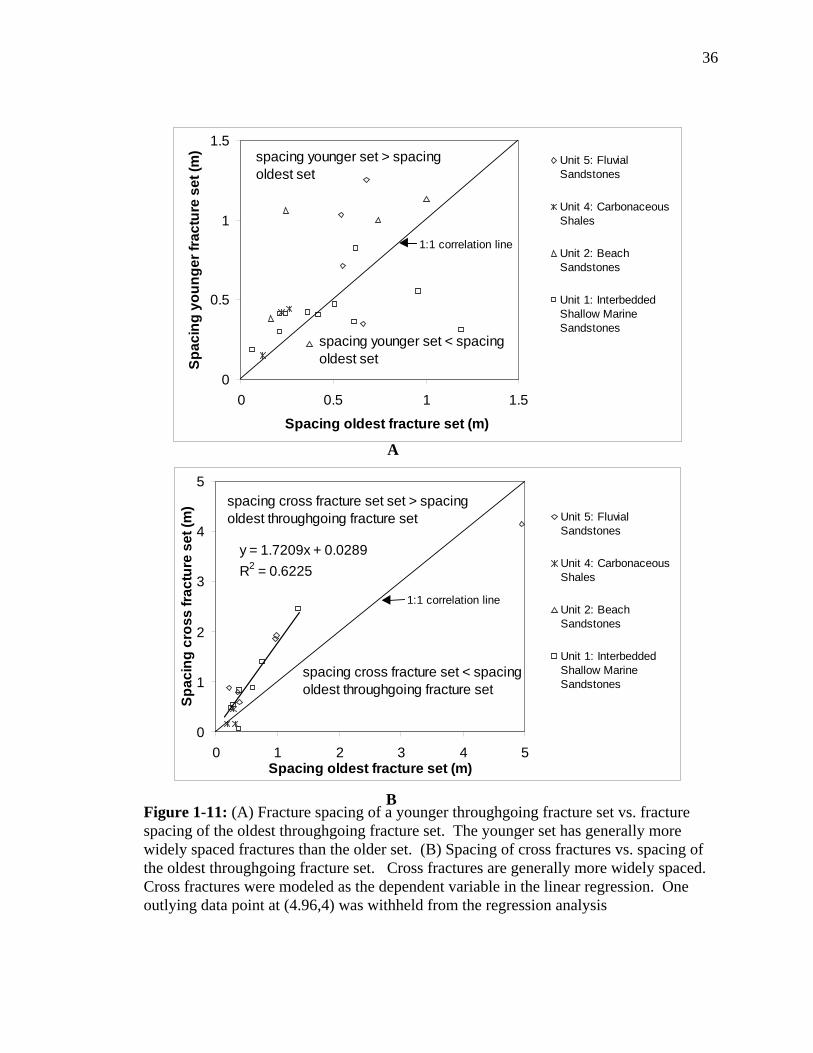
younger throughgoing sets and cross fractures. Cross fractures strike nearly
perpendicular to throughgoing fractures and terminate at intersection with throughgoing
fractures. Younger throughgoing fractures can strike oblique or perpendicular to older
throughgoing fracture sets. Younger throughgoing fracture sets can extend through
points of intersection with an older set. However, after some distance, the younger set
will terminate at intersection with an older throughgoing fracture set. In general fracture
spacing is greater in younger throughgoing fractures than in the oldest throughgoing
fracture set (Figure 1-11a). Specifically, a sampling of 23 locations which have two
throughgoing fracture sets indicates that at 16 locations the younger set is more widely
spaced than the older set (Figure 1-11a). A comparison of cross fracture spacing to
spacing of the oldest throughgoing set indicates cross fracture spacing is greater at 12 out
of 16 locations (Figure 1-11b). A linear correlation between the spacing of these two
fracture sets is evident for spacing less than 3m. If the outlying data point (4.96,4) is not
used in the regression analysis, a correlation coefficient of 0.6225 is obtained.
Porosity
One-millimeter wide deformation bands are common in the high porosity, poorly
cemented sandstones of the Unit 3 white beach facies (Unit 3: Figure 1-11). Point count
data from four thin sections at two locations within Unit 3 indicate that the rock matrix
has a average porosity of 38% at one site and 41% at the second site (Table 1-2).
Average cementation within the matrix is less than 1% at both sites.
36
Figure 1-11: (A) Fracture spacing of a younger throughgoing fracture set vs. fracture spacing of the oldest throughgoing fracture set. The younger set has generally more widely spaced fractures than the older set. (B) Spacing of cross fractures vs. spacing of the oldest throughgoing fracture set. Cross fractures are generally more widely spaced. Cross fractures were modeled as the dependent variable in the linear regression. One outlying data point at (4.96,4) was withheld from the regression analysis
0
0.5
1
1.5
0 0.5 1 1.5
Spacing oldest fracture set (m)
Spac
ing
youn
ger f
ract
ure
set (
m)
Unit 5: FluvialSandstones
Unit 4: CarbonaceousShales
Unit 2: BeachSandstones
Unit 1: InterbeddedShallow MarineSandstones
1:1 correlation line
spacing younger set < spacing oldest set
spacing younger set > spacing oldest set
0
1
2
3
4
5
0 1 2 3 4 5Spacing oldest fracture set (m)
Spac
ing
cros
s fra
ctur
e se
t (m
)
Unit 5: FluvialSandstones
Unit 4: CarbonaceousShales
Unit 2: BeachSandstones
Unit 1: InterbeddedShallow MarineSandstones
spacing cross fracture set set > spacing oldest throughgoing fracture set
1:1 correlation line
spacing cross fracture set < spacing oldest throughgoing fracture set
y = 1.7209x + 0.0289R2 = 0.6225
A
B
37
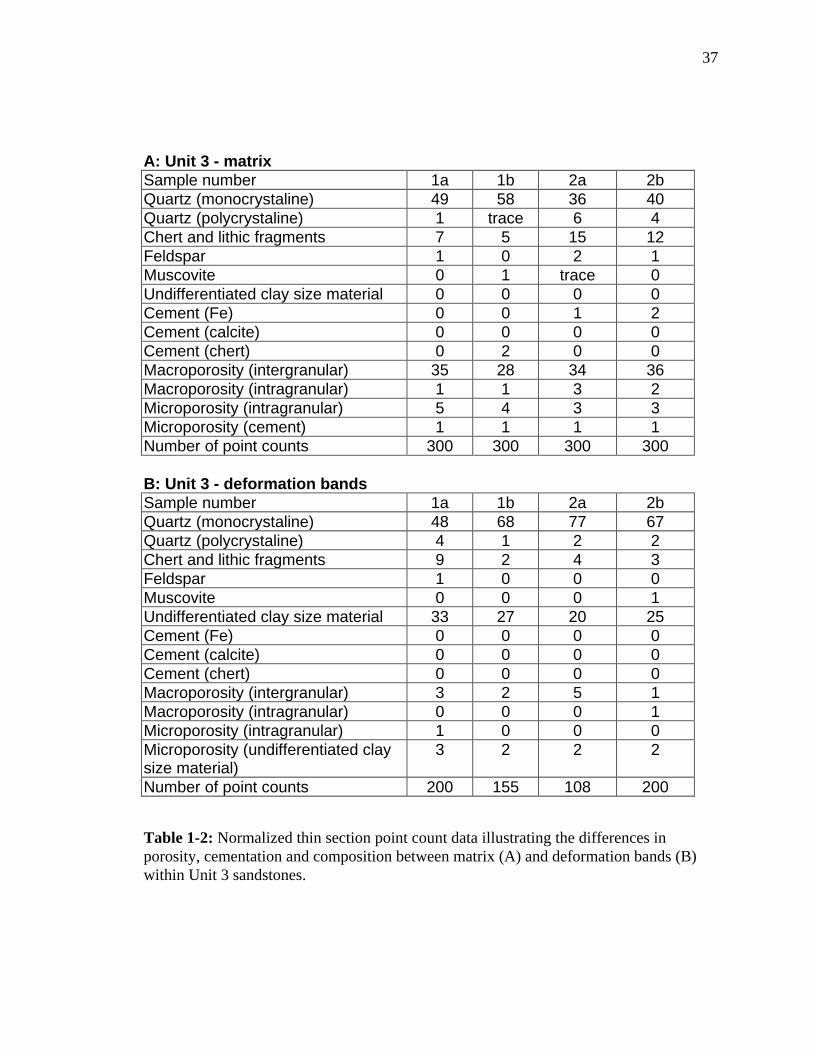
A: Unit 3 - matrix Sample number 1a 1b 2a 2b Quartz (monocrystaline) 49 58 36 40 Quartz (polycrystaline) 1 trace 6 4 Chert and lithic fragments 7 5 15 12 Feldspar 1 0 2 1 Muscovite 0 1 trace 0 Undifferentiated clay size material 0 0 0 0 Cement (Fe) 0 0 1 2 Cement (calcite) 0 0 0 0 Cement (chert) 0 2 0 0 Macroporosity (intergranular) 35 28 34 36 Macroporosity (intragranular) 1 1 3 2 Microporosity (intragranular) 5 4 3 3 Microporosity (cement) 1 1 1 1 Number of point counts 300 300 300 300
B: Unit 3 - deformation bands Sample number 1a 1b 2a 2b Quartz (monocrystaline) 48 68 77 67 Quartz (polycrystaline) 4 1 2 2 Chert and lithic fragments 9 2 4 3 Feldspar 1 0 0 0 Muscovite 0 0 0 1 Undifferentiated clay size material 33 27 20 25 Cement (Fe) 0 0 0 0 Cement (calcite) 0 0 0 0 Cement (chert) 0 0 0 0 Macroporosity (intergranular) 3 2 5 1 Macroporosity (intragranular) 0 0 0 1 Microporosity (intragranular) 1 0 0 0 Microporosity (undifferentiated clay size material)
3 2 2 2
Number of point counts 200 155 108 200
Table 1-2: Normalized thin section point count data illustrating the differences in porosity, cementation and composition between matrix (A) and deformation bands (B) within Unit 3 sandstones.

38
A comparison of this information with the cementation and porosity data supplied
in Table 1-1 for seven sandstone beds within Unit 2 indicates that cementation may be
more important than porosity in determining whether a unit deforms through fracturing or
formation of deformation bands. Porosities within the Unit 2 sandstones ranged from 5-
39% while cementation ranged between 9 and 43%. Therefore, some of the porosity
values are similar but the cementation values are at least an order of magnitude higher in
the Unit 2 sandstones.
The point count data for Unit 3 sandstones described above can also be used for
comparing the physical characteristics of the rock matrix to those of the deformation
bands. These data suggest that the deformation bands are composed of crushed sand
grains within roughly planar margins (Table 1-2; Figure 1-12). The rock matrix has an
average porosity of 38% at site 1 and 41% at site 2. Point counts within deformation
bands and within the same thin sections indicates average porosity is 5% within
deformation bands at sites 1 and 2 (Table 1-2). This is almost a ten-fold reduction in
porosity from the matrix. Average cementation within the matrix is 1% at site 1 and site
2. The deformation bands at both sites have no measurable cementation.
Undifferentiated clay-sized material is abundant within the deformation bands, but is
absent from the matrix. Deformation bands at site 1 are composed of 30% clay-sized
material on average while deformation bands at site 2 include an average of 23% of this
material.
At five locations, deformation bands were recorded within other lithologic units
(Charts 22, 32, 33, 46, and 57 in Appendix C). Two locations are within Unit 5 fluvial
sandstones and three are within Unit 2 sandstones.
39
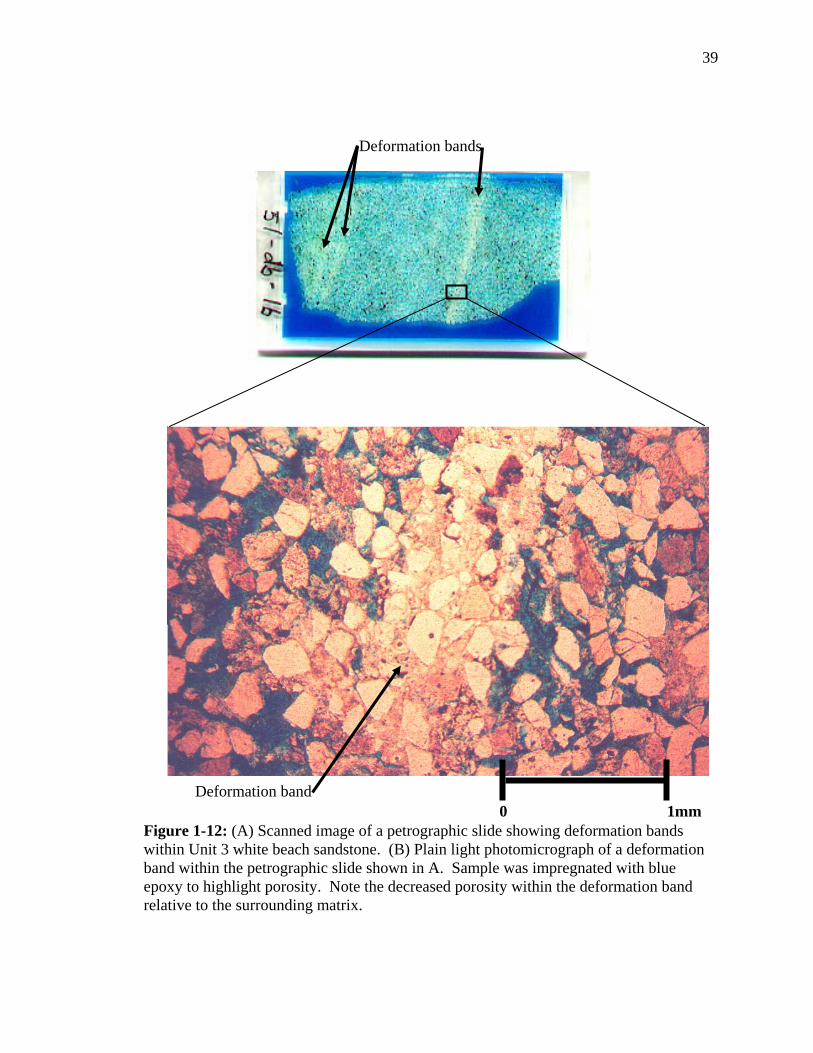
Deformation band 0 1mm
Deformation bands
Figure 1-12: (A) Scanned image of a petrographic slide showing deformation bands within Unit 3 white beach sandstone. (B) Plain light photomicrograph of a deformation band within the petrographic slide shown in A. Sample was impregnated with blue epoxy to highlight porosity. Note the decreased porosity within the deformation band relative to the surrounding matrix.
40
Four of these units were observed in the field to be poorly cemented. The field criterion
for a poorly cemented sandstone is that it be easily friable with a knife, which will also
leave a deep scratch mark. Deformation bands and fractures where found together at four
of these locations. At one of these locations, two beds of differing cementation within
Unit 2 sandstones were recorded (Chart 57, Appendix C). The upper unit was better
cemented and contained a majority of the fractures. These fractures typically terminated
at the boundary with the underlying poorly cemented sandstone. At two of the sites,
deformation bands were parallel to fractures. At a single Unit 2 site, the deformation
bands were nearly perpendicular to the throughgoing fracture set and terminated at
intersection with the fracture set (Chart 33, Appendix C). Therefore, at this site the
deformation bands post-date fracture formation. Age of the deformation bands relative to
fractures at the other sites is undetermined.
Field observations of differential iron staining, related to fluid/groundwater flow,
indicate that iron may be reduced on one side of a deformation band, but oxidized on the
other (Figure 1-13). It is evident from petrographic study that deformation bands have a
lower porosity relative than the surrounding matrix (Figure 1-12; Table 1-2) due to grain
breakage and pore collapse. These observations suggest that deformation bands are
partial barriers to ground water flow.

41
Figure 1-13: Conjugate deformation bands with a vertical bisector to the acute angle. Note reduced iron above the deformation bands and oxidized iron below.

42
Lithologic controls on faulting
Faults at Teapot Dome show variable characteristics associated with differences
in porosity and cementation of the rock units cut by the fault. Fault character changes
radically where a given fault cuts both poorly cemented sandstone and well cemented
sandstone. These changes reflect the differences in deformation behavior documented in
previous sections. Faults within well cemented sandstones typically have damage zones
characterized by high fracture density (Figure 1-14). The fractures associated with these
faults typically strike parallel to the faults and dip normal to bedding. Faults that transect
the high porosity, poorly cemented sandstones of the white beach facies (Unit 3) are
expressed as zones of subparallel deformation bands.
Mineralization
Faults and associated fractures are variably cemented. Well cemented faults tend
to stand out as erosion-resistant ridges or spurs; poorly cemented or uncemented faults, in
contrast, weather into gullies. Cements observed at Teapot Dome are typically calcite,
but pyrite is also locally present. Iron staining along fractures and up to 4 cm into the
matrix parallel to fracture planes is observed locally. This indicates some fluid flow
communication between the fracture and matrix. The degree of cementation of structures
varies abruptly in space. In one area, a well cemented fault is located just 50 m from a
highly weathered fault that is inferred to have little or no cement.
Thirty-eight sites around Teapot Dome were mineralized with either calcite or
iron oxides. Iron oxide mineralization was evidenced by iron staining, both on the
fracture surface and at some distance (1 - 4cm) into the matrix from the fracture.

43
Figure 1-14: Histogram of an outcrop transect starting at, and perpendicular to, a fault on the northeastern limb of Teapot Dome. The histogram shows fractures in the damage zone of the fault increasing in number with proximity to the fault. The fault and fractures strike perpendicular to the fold hinge.
Sixteen of the sites were within Unit 1 sandstones, of which eleven were mineralized

44
with calcite, two were mineralized with calcite and small amounts of pyrite, two were
iron stained, and one contained both iron staining and calcite mineralization. The calcite
mineralized locations were generally associated with NE-SW oriented faults along the
northeastern segment of the anticline. Eleven of the remaining mineralized sites were
iron-oxide mineralized cleats within Unit 4 carbonaceous shales. Four sites within Unit 5
fluvial sandstones were mineralized, two with calcite, one with iron oxides and the other
with gypsum. Two sites within Unit 3 sandstones were iron stained. Three sites within
Unit 2 sandstones were mineralized, two with calcite and one with iron oxides. The two
remaining sites were within the Steele Shale and were mineralized with calcite. The
majority of mineralized fractures were partially occluded. Four of the five sites
containing fractures generally sealed with calcite were within Unit 1 sandstones. The
remaining site was within Unit 2 sandstones.
Discussion
Fracture spacing vs. bed thickness
Exposures of the Mesaverde Formation at Teapot Dome provide an excellent
opportunity to study fracture and fault variability related to lithology. One of the first
assumptions relating lithology to fractures is that fracture spacing is directly proportional
to bed thickness (Bogdanov, 1947; Price, 1966; McQuillan, 1973; Narr and Suppe, 1991;
Gross, 1993; Ji and Saruwatari, 1998; Bai and Pollard, 2000). Data at Teapot Dome
indicates that this relationship although broadly proportional under certain conditions is
not 1:1. In fact, cleat spacing in Unit 4 carbonaceous shales and coals consistently
remains below 0.5m no matter what the bed thickness. The data also show that there is
45
an inverse relationship between cleat spacing and bed thickness within this unit (Figure
8). Price (1966), as noted earlier, uses Young’s modulus to explain the differences
between fracture spacing in sandstones and cleat spacing in coals; it appears that
mechanical controls dominate over bed thickness in these lithologies. The difference
between cleat and fracture strike in carbonaceous shales and sandstones respectively,
may also be due to differences in mechanical properties. A possible explanation
regarding the inverse spacing relationship from a mechanical standpoint is that thinner
coals may be less brittle than thicker coals, therefore cleats are more widely spaced in
thin units relative to thicker units. However, it is equally possible that there is some
difference between measured bed thickness and effective bed thickness, perhaps due to
horizontal layering within the carbonaceous shale beds.
As previously discussed Bogdanov (1947) mathematically described a
relationship where spacing (S) varied as a function of bed thickness (B) and some
constant (K). The amount of variation from an idealized 1:1 fracture spacing to bed
thickness ratio can provide some visualization as to how the constant (K) varies with
lithology and mechanical controls. Fracture spacing in Unit 2 sandstones is poorly
correlated with bed thickness (Figures 1-5 and 1-8). These sandstone beds are generally
interbedded with other sandstone beds. In contrast Unit 1 and 5 sandstones, interbedded
with marine shale and carbonaceous shale respectively, exhibit the strongest correlation
between fracture spacing and bed thickness. Therefore, sandstones within these units
have distinctly different boundary layers than Unit 2 sandstones and these bounding
layers may contribute significantly to the fracture spacing to bed thickness ratio. Unit 5
is the nearest to 1:1 fracture spacing to bed thickness ratio (when combining all fracture

46
sets). The Unit 5 sandstones are laterally discontinuous while the other sandstone units
are laterally continuous suggesting that there is some lateral mechanical influence on
fracturing. The spacing relationships between oldest throughgoing fractures, younger
throughgoing fractures and cross fractures also indicates some lateral mechanical
influence on fracture spacing. Specifically the younger throughgoing and cross fracture
sets have spacings larger than the oldest throughgoing fracture set, suggesting the older
fractures are planes of discontinuity that influence fracture spacing in younger fracture
sets.
No data was collected concerning the paleoflow direction within any of the units.
Therefore, a word of caution is added that some of the variability observed in fracture
spacing and fracture orientation may be due to mechanical anisotropy inherent to a bed
with a grain fabric related to deposition. Depositional trends such as thickening and
thinning of units may also influence local fracture spacing.
Impact of structures on fluid flow
Depending upon the lithology of the faulted rock unit, a single fault can be
expressed as either a zone of deformation bands (partial barriers to flow) or a fault with a
primary slip plane and an associated fracture zone (a possible fluid pathway). Unit 3
sandstones, which deform through formation of deformation bands, vary in thickness
across the anticline, and are locally absent along the western limb. How this change in
thickness influences regional fluid flow is undetermined. However, in both units with
deformation-band faults and those with fracture-based faults, maximum permeability
would be parallel to fault strike. In the former, fluid flow would be largely confined to
the matrix. In the latter, fluid flow would occur preferentially along fractures as long as

47
they remained unmineralized. Therefore, in low permeability rocks, fractures will be the
primary pathways for fluid flow. In contrast, in the high porosity sandstones that host
deformation bands, the matrix will provide the main pathway for fluid flow.
Relatively well cemented, low porosity sandstones should not make a better
reservoir than poorly cemented, high porosity sandstones. However, it is apparent from
this study that fracturing will help increase production in more brittle sandstones while
deformation bands may hinder production within high porosity sandstones.
As discussed previously, Thom and Spieker (1931) also recognized that
mineralized faults and fractures may inhibit fluid flow and that open fractures could
allow for increased fluid flow. However, they assumed that fractures would penetrate
both sandstones and shales and that reservoir pressures would equalize. Because
pressures within different reservoirs were not equal, the authors concluded that fractures
did not significantly influence fluid flow. However, the current study shows that
sandstones and shales do not fracture in similar ways. In fact, fractures within sandstone
beds often terminate at sandstone/shale contacts. This relationship suggests that shales
can create an effective seal between production zones and that pressures need not be
similar in this fractured reservoir.
From a production standpoint, fracture permeability is also highly dependent
upon the following variables: 1) trace length, 2) aperture width, 3) interconnectivity of
the fracture system, and 4) the number of fractures intersecting the well bore. Core data
can provide information on aperture width and number of fractures intersecting the well
bore. Due to the small size of the core, information with regard to trace length and
fracture interconnectivity can be limited. Outcrop fracture studies can help fill in

48
information for the last two items.
Fractures, in a sense, work like a plumbing system for the reservoir. The longer
and more interconnected the drainage system the better the recovery. Fractures with
extensive trace lengths have the potential of more effectively draining a reservoir than
shorter fractures. The increased fracture surface area associated with increased trace
length allows for increased fluid flow communication between the rock matrix and the
fracture. Therefore, a well that intersects a fracture set with extensive trace lengths has
the potential of draining a significantly larger area than a well that intersects no fractures
or fractures with a limited trace length.
Conclusions
Fractures, deformation bands and faults within the Cretaceous Mesaverde
Formation at Teapot Dome display patterns that vary with lithology in the following
ways: 1) Most fractures in sandstone units terminate at contacts with shale layers. 2)
Carbonaceous shales (Unit 4) have cleat spacing densities comparable to or greater than
those within sandstones, however, unlike fractures in sandstone, cleat spacing has a
unique inverse correlation to bed thickness. 3) In beds of similar thickness and close
proximity cleat strike is oblique to fracture strike by up to 20o. 4) Fracture density
increases with increased cementation. 5) Sandstones interbedded with marine shales or
carbonaceous shales have a fracture spacing to bed thickness ratio that is closer to 1:1
than sandstones interbedded with other sandstones. 6) Fluvial sandstones with lenticular
geometries interbedded with carbonaceous shales have a fracture spacing to bed
thickness relationship that is closer to 1:1 than that of other units. 7) The poorly
cemented, high porosity sandstones of Unit 3 contain deformation bands rather than

49
fractures. 8) Deformation bands have significantly lower porosities relative to the matrix
due to crushing of grains within the deformation band. 9) Normal faults within well
cemented sandstones are generally expressed as fracture zones, whereas faults within
poorly cemented sandstones are diffuse zones of subparallel deformation bands. 10)
Thinner sandstones (< 1m) interbedded within shale may be more likely to be
mineralized than thicker sandstone packages.
In the absence of significant subsurface data and because factors such as porosity,
cementation and lithology can change with depth, a data set built from observations of
outcropping strata that are lithologically analogous to subsurface reservoir rocks may
allow a first-order approximation of what features (i.e. fractures, faults, and deformation
bands) are present within the subsurface, their spacing and how they may influence
permeability and fluid flow.

50
Deformation within a Basement-Cored Anticline, Part II:
Structural Controls
Introduction
Fractures can increase effective porosity and permeability and introduce
permeability anisotropy, particularly in rocks with low matrix permeability (Rice, 1983;
Nelson, 1985; Fassett, 1991; Teufel and Farrell, 1992). Faults can also function as fluid
migration pathways, barriers, or a combination of both (e.g. Caine et al., 1996). For
modeling and production purposes it is important to document directions of preferred
fracture and fault orientations within primary hydrocarbon traps, such as anticlines. By
understanding controls on fracture and fault orientation and distribution in a given
reservoir the accuracy of flow modeling can be improved, thereby increasing primary and
secondary hydrocarbon recovery. Lithologic controls on fracturing as well as some of
the consequences of fracture permeability are reviewed in a companion paper (Part I:
Lithologic Controls). This paper addresses variations in fracture and fault characteristics,
such as spacing and orientation, with structural position on Teapot Dome, Wyoming.
Murray (1968) noted that the relationships between bed thickness, structural
curvature and fracture porosity and permeability can be effective in evaluating geologic
structures as hydrocarbon reservoirs. Rocks, in general, exhibit increased fracture
density with increased deformation (Nelson, 1985). One method of predicting fracture
density relative to structural position is the radius-of-curvature or rate-of-change
approach (Murray, 1968). The major assumption of this approach is that the greatest
density of flexure-related fracturing will occur where the rate of change of dip or

51
curvature of beds is at a maximum (Nelson, 1985), such as in a fold hinge. Further
discussion of fracture initiation and propagation is provided in Appendix A.
Faults also exert structural controls on fracturing. Fault zones in rock generally
consist of a fault core and a damage zone, which have permeabilities distinctly different
from the protolith (e.g. Caine et al., 1996). The damage zone may include small
subsidiary faults, fractures and veins. These structures can vary in character and density
along the length of a fault due to variations in lithology and mineralization (see Part I).
Displacement also varies along a single fault from a maximum at the center to a
minimum at the fault tips (e.g., Nicol et al., 1996). Therefore, the density of secondary
fault structures may be greatest near the center of the fault and decrease toward the fault
tips, along both strike and dip. Secondary fault structures such as fractures within a
damage zone can create areas of increased transmissivity. This can result in preferential
fault-parallel fluid flow (e.g. Haneberg, 1995). Huntoon and Lundy (1979) describe a
field example near Laramie, Wyoming which suggests increased transmissivity within
rock units of the Casper aquifer system adjacent to fault zones and monoclines. The
transmissivities of the fracture zones were found to be approximately 100 times greater
than transmissivities of unfractured areas. In other situations, decreased porosity within a
fault zone could produce a capillary seal given two liquids such as water and oil (e.g.
Antonellini and Aydin, 1995; Sigda et al., 1999). Compartmentalization of a petroleum
reservoir could occur should the capillary seal prevent cross-fault flow of the nonwetting
phase (e.g. oil in a water-wet reservoir; Antonellini and Aydin, 1994).
The permeability of fractures can also be influenced by changes in pore fluid
pressure. The effective normal stress can be increased by a decrease in pore fluid

52
pressure causing fractures at a high angle to the maximum principal stress to close (e.g.,
Raghaven, 1972; Lorenz et al., 1996; Long et al., 1997). Therefore, as fluids are
removed during production of a fractured reservoir, in situ pore pressure may drop,
decreasing the aperture widths of critically oriented fractures, which in turn decreases
effective permeability and production. Substantial reduction in reservoir pressures at
Teapot Dome, for example, is suspected from early production reports (Trexel, 1930;
Curry, 1977; Doll et al., 1995).
A systematic study of natural fracture patterns within the outcropping Mesaverde
Formation at Teapot Dome was undertaken, in part, to understand variations in fracture
characteristics, such as spacing and orientation, with structural position on a doubly
plunging anticline. Field observations indicate that extension fractures and normal
oblique faults roughly perpendicular to the fold hinge are contemporaneous with hinge-
parallel faults and fractures. A third set of fractures with a strike oblique to the fold are
interpreted to predate folding.
These fracture and fault data and interpretations from Teapot Dome are used with
previous studies to develop a 3-D conceptual model of fractures associated with
basement-cored anticlines. A qualitative assessment of the 3-D model suggests that the
direction of maximum permeability can be either parallel or perpendicular to the fold
hinge depending on the primary fracture pattern within a specific area of the fold.
Fracture-Fold Relationships
Several authors have described preferred fracture orientations associated with
folding (DeSitter, 1956; Stearns and Friedman, 1972; Garrett and Lorenz, 1990; Cooper,
1992; Engelder et al., 1997; Hennings et al., 1998). Observations from these studies can

53
be subdivided into two main categories, those related to thin-skinned thrusts and those
related to basement-cored thrusts.
Folds associated with thin-skinned thrusts
Stearns and Friedman (1972) described five fracture sets associated with folds,
only two of which are stated as being sufficiently common to be incorporated into their
generalized fracture model. These fracture patterns were documented at the Teton
anticlines in northwestern Montana (Stearns, 1964; Stearns, 1967, Friedman and Stearns,
1971; Sinclair, 1980). The Teton anticlines are a pair of Laramide-age structures, and are
part of a thrust sheet within the sedimentary section rather than a basement-cored
anticline. The larger, western most anticline is hereafter referred to as Teton anticline.
The two main fracture sets each consist of extension fractures and conjugate shear
fractures (Figure 2-1). The sets locally occur together within the same beds. Both sets
are interpreted to record an intermediate principal stress (σ2) normal to bedding and
maximum (σ1) and minimum principal (σ3) stresses within the bedding plane. The
orientations of maximum and minimum principal stresses were inferred to be different for
each fracture set (Figure 2-1). The geometry of these patterns suggests that they
accommodated shortening both parallel and perpendicular to the fold hinge. Stearns and
Friedman (1972) suggested that these fracture sets resulted from folding because of their
consistent orientations relative to bedding and the anticlinal structure.

54
Figure 2-1: Stearns and Friedman (1972) model of fractures associated with folding. In both fracture sets the intermediate principal stress (σ2) is inferred to be normal to bedding and the maximum (σ1) and minimum (σ3) principal stresses therefore lie within the bedding plane. The inferred directions of maximum and minimum principle stresses are different for each fracture set.
A third set of fractures, described by Stearns (1964), accommodated extension due to
bending of the formations across the anticline.
Cooper (1992) used core analysis along with Formation Microscanner and Array
Sonic logs to analyze subsurface fractures associated with a fault-bend fold and a fault-

55
propagation fold in the foothills of the Canadian Rocky Mountains. Extension fractures
parallel and perpendicular to the fold hinge were recorded as were conjugate shear
fractures, all of which correspond to the two dominant fracture sets described by Stearns
and Friedman (1972).
Folds associated with deep-seated thrusts
Dominant features associated with basement-cored thrusts include hinge-parallel
and hinge-perpendicular faults and fractures. The following examples primarily describe
these features and/or describe how they may be related to the folding process. DeSitter
(1956) described normal faults parallel to a given hinge that were attributed to tension
within the upper arc of an anticline and were observed at Kettleman Hills, California;
Quitman Oilfield, Texas; Sand Draw Oilfield, Wyoming; and La Paz Oilfield, Venezuela.
Normal faults roughly perpendicular to the axes of folds were attributed to tension
resulting from the three-dimensional nature of an uplift (DeSitter, 1956). These faults
exhibit maximum displacements near the apex of a given anticline. Further, the
displacements on hinge-perpendicular faults decrease toward the limbs of the fold. Both
DeSitter (1956) and Engelder et al. (1997) discussed these types of faults using examples
from Elk Basin oilfield in Wyoming. Elk Basin anticline is a basement-cored, doubly
plunging, breached anticline in the Big Horn Basin with dips on the forelimb in excess of
30o and up to 23o on the backlimb. The anticline strikes roughly NNW and is cut by a
number of normal oblique, NE-striking, hinge-perpendicular faults. Fractures striking
roughly parallel to the fold hinge are found throughout the fold, but vary more in
orientation along the forelimb, perhaps due to local faulting (Engelder et al., 1997).
Fractures striking roughly perpendicular to the fold hinge were found in 12% of

56
measured outcrops and are composed of two basic types: fractures with trace lengths
extending several meters and fractures that are confined to the area between hinge-
parallel fractures. Thus these later hinge-perpendicular fractures terminate at
intersections with hinge-parallel fractures.
Similar joint sets oriented parallel and perpendicular to the hinge of the Grand
Hogback Monocline in Colorado were observed Murray (1967). The development of
these fractures was inferred to be related to local uplift and rotation of bedding rather
than regional shortening. Penecontemporaneous development of the two joint sets was
suggested by the lack of consistent abutting relationships to indicate which set is older.
However, Garrett and Lorenz (1990) did recognize an older fracture set along the same
Grand Hogback Monocline. They interpreted this set, composed of throughgoing
regional fractures, to be associated with shortening prior to folding. Two other fracture
sets - those recognized by Murray (1967) - were associated with folding along the
Hogback.
Hennings et al. (1998) described three joint sets within Frontier Formation
sandstones at Oil Mountain, approximately 30 miles west of Casper, Wyoming. Oil
Mountain is a NW-striking, doubly plunging, breached anticline. A NW-striking fracture
set parallels the fold hinge but is interpreted as a pre-existing regional set due to its
presence in Frontier Formation pavements away from the fold. A NE-striking set is
roughly perpendicular to the NW-striking set and is attributed to the folding process. The
third set is NNW-NNE striking and is oblique to the fold hinge and the other two joint
sets. A substantial increase in fracture density was observed within the southern
plunging region of the anticline.

57
Because these anticlines and monoclines are cored by reverse faults it is worth
considering strain around a blind thrust. Unruh and Twiss (1998) used coseismic
displacements measured after the Northridge earthquake of 1994 (which resulted from
movement along a blind thrust fault) to determine the orientations of the principal strain-
rate axes for a blind thrust. Horizontal shortening (d3) is perpendicular to the fold hinge,
maximum lengthening (d1) is horizontal and parallel to the fold hinge and d2 is vertical.
Using pseudo-three-dimensional modeling and curvature analysis, Fischer and
Wilkerson (2000) described fracture patterns in sedimentary units, modeled as elastically
deformed plates, during the evolution of a basement-involved thrust fault. They
described joints oblique to the fold hinge as being related to the formation of a fold.
These oblique fractures can form early in the folding process. Their work indicates the
fracture initiation relative to fold development is a control on fracture orientation. They
also noted that fracture orientations may vary with stratigraphic and structural position.
Geologic Setting
Early debates concerning the deformational style of the Laramide orogeny
generally centered around two main models: 1) forced folding related to near vertical
uplifts (Prucha et al., 1965; Stearns, 1971; Stearns, 1975; Stearns, 1978) and 2) high-
angle reverse faulting related to crustal shortening (Blackstone, 1940; Berg, 1962;
Blackstone, 1980). Over time, evidence has accumulated for crustal shortening
accommodated in the area of interest - Wyoming, Montana, and South Dakota - by
thrusts, many of which are basement-cored (Willis and Brown, 1993). This evidence
includes seismic reflection data (Gries, 1983; Gries and Dyer, 1985) and a deep crustal
line across the Wind River Range by COCORP (Oldow et al., 1989). Teapot Dome is

58
typical of the structures formed by this deformation process.
Teapot Dome is located in central Wyoming, near the southwestern edge of the
Powder River Basin. It is part of a larger structural complex, comprised of Salt Creek
anticline to the north and the Sage Spring Creek and Cole Creek oil fields to the south
(Figure 2-2; Doelger et al., 1993; Gay, 1999). Teapot Dome is similar to other Laramide
structures such as Elk Basin anticline and Oil Mountain (Engelder et al., 1997; Hennings
et al., 1998; described in the previous section). At Teapot Dome, a basement-involved
thrust that terminates within the sedimentary section (Figure 2-3) is evident in 2-D
seismic data (LeBeau, 1996). The dome itself is a doubly plunging anticline. Normal
oblique faults that strike predominately perpendicular to the curvilinear fold hinge are
common along the eastern limb (Olsen et al., 1993; Doll et al., 1995). Mesaverde
Formation sandstones and shales are exposed along the western, eastern and southern
limbs of Teapot Dome. Maximum dips along the western limb are near 30o; along the
eastern limb dips range from 7o to 14o.
A major set of hinge-perpendicular faults and fractures has been recognized at
Teapot Dome and described as the product of the forces that caused the folding (Thom
and Speiker, 1931). These faults and fractures were described as characteristic features
of Rocky Mountain anticlines.

59
Figure 2-2: Structure contour map of the top of the Dakota Sandstone. The map illustrates the location of Teapot Dome relative to nearby Laramide structures (Doelger et al., 1993).

60
Figure 2-3: A. Map view of cross section transect. B. Diagrammatic cross section illustrating general structure and the basement-involved thrust that tips out within the sedimentary section. Cross section was constructed from surface data, well logs and 2-D seismic reflection data. No vertical exaggeration. Numbers correlate to the following stratigraphic units and systems as provided from Doll et al. (1995) and from well logs of exploratory well no. 1-G-10: 1. Cretaceous Mesaverde Formation (Fm). 2. Cretaceous Sussex Sandstone (Ss), Shannon Ss, Steele Shale (Sh), Niobrara Sh, Frontier Fm. 3. Cretaceous Mowry Sh, Muddy Ss, Thermopolis Sh, Dakota Ss, Lakota Ss. 4. Jurassic Morrison Fm, Sundance Fm. 5. Triassic Chugwater Group. 6. Permian; Goose Egg Fm. 7. Pennsylvanian Tensleep Ss. 8. Pennsylvanian Amsden Fm. 9. Mississippian Madison Limestone (Ls). 10. Devonian through Ordovician; Undifferentiated. 11. Cambrian; Deadwood Fm. 12. Precambrian; Granite.
Thom and Speiker (1931) also documented a secondary set of faults and joints
A
B
61
that strike roughly normal to the major set of faults and fractures and are, therefore,
oriented approximately parallel to the axis of the anticline. This subsidiary fracture and
fault set was attributed to extension across the fold. Doll et al. (1995) inferred three
primary fracture directions in the subsurface from steam flood response data. These
orientations were perpendicular to the fold hinge, N65oW, and parallel to the hinge.
Using indirect surface geochemical techniques such as surface hydrocarbons, Eh, pH, soil
electrical conductivity, iodine, and bacteria, Fausnaugh and LeBeau (1997) observed
trends in the data suggesting NE-striking faults. Geochemical signatures perpendicular to
the NE-striking faults were also observed and attributed to either faulting or to
overlapping stratigraphic relationships of subsurface reservoirs.
Structural Analysis of Teapot Dome
Fractures, faults, and deformation bands were studied in five lithologically
distinct stratigraphic units within the Mesaverde Formation at Teapot Dome. These units
are (from oldest to youngest): a shallow marine interbedded sandstone/shale, a
foreshore/beach sandstone, a white beach sandstone, a non-marine carbonaceous shale,
and a unit composed of fluvial sandstones within the carbonaceous shale unit. Detailed
discussion of these units and of lithologic controls on fracturing is provided in Part I.
Distribution of faults and fractures with respect to the fold
Faults
Two dominant sets of faults are observed in outcrops of the Mesaverde Formation
at Teapot Dome. The first set consists of NE-striking normal oblique faults shown on
Figure 2-4. These faults are common along the eastern limb and most terminate before
62
intersecting the western limb; displacements therefore decrease to the SW. A normal
component of displacement is recorded by stratigraphic separation whereas the strike-slip
component is inferred from slickenlines on three fault surfaces with rakes of 20o–35o.
Sense slip for these three faults is oblique right lateral. These faults are generally
perpendicular to the fold hinge, even where it bends, and are characterized by vertical
separations that vary across the fold. The largest separations, up to 40 m, are observed
on the eastern limb. The few hinge-perpendicular faults observed on the western limb
exhibit vertical separations that range between 0.5 and 1 m. Although continuous
exposure is not available around the dome, these hinge-perpendicular faults appear to be
densest near the culmination of the fold (Figure 2-4).
The second set consists of normal faults that strike subparallel to the fold hinge
and are observed primarily along the southern arc of the anticline where curvature is at a
maximum (Figure 2-4). Normal motion on these faults is recorded by stratigraphic
separation.
Two faults observed near the apex of the anticline in 2-D seismic reflection
profiles (from the Rocky Mountain Oilfield Testing Center) can be projected into valleys
with no surface exposure along the western limb. Individual segments of the western
limb, separated by these valleys, display different bedding and fracture orientations
(Figure 2-5); in each segment the strike of one primary fracture set roughly parallels
bedding. These valleys are therefore interpreted as faults. Valley trends indicate that the
faults belong to the NE-striking fault set.

63
N
Quaternary Alluvium OutlineMesaverde FmOutlineNPR3 Boundary
0 1km
Fold Hinge
Inferred FaultFault, Normal (ball andbar on downthrown side)
Figure 2-4: Primary faults observed at Teapot Dome, Wyoming. Because of poor exposure in the core of the dome, individual faults generally cannot be traced from the eastern to the western limb. Faults and fold hinge shown in the central portion of the anticline are inferred from a structure contour map on the top of the second Wall Creek Sandstone (Lawrence Allison, 1989) and field data.
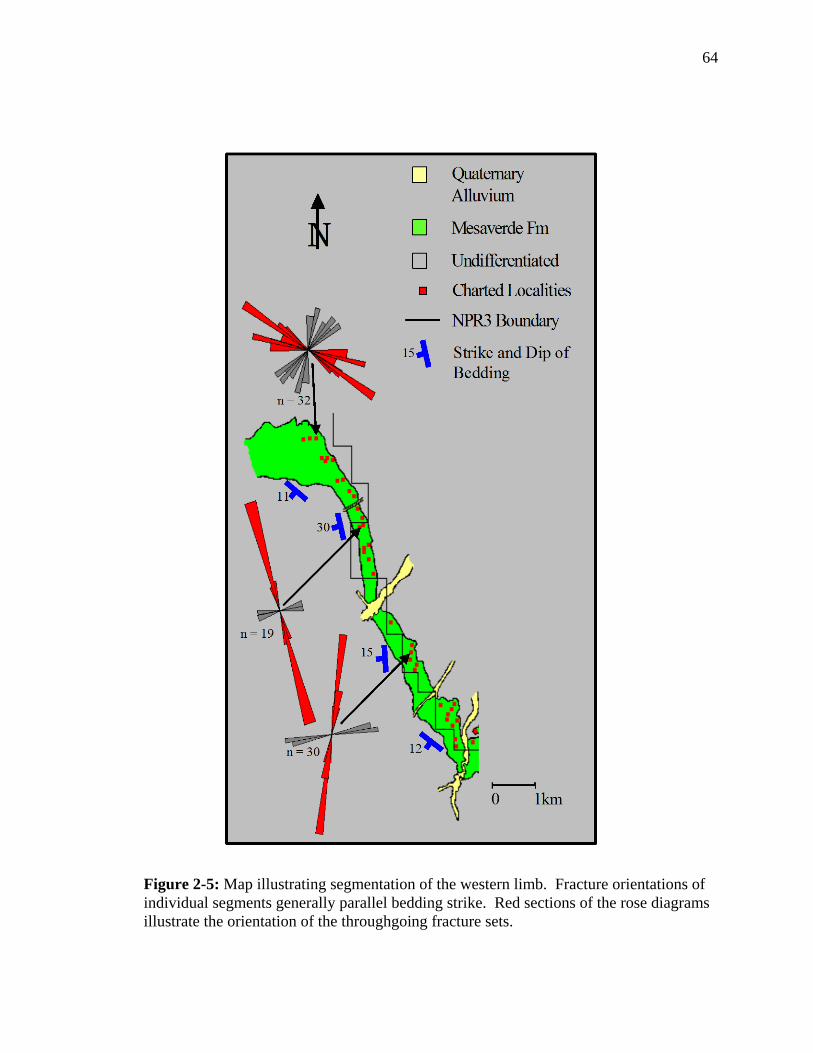
64
Figure 2-5: Map illustrating segmentation of the western limb. Fracture orientations of individual segments generally parallel bedding strike. Red sections of the rose diagrams illustrate the orientation of the throughgoing fracture sets.

65
Deformation bands (small-displacement faults characterized by pore collapse and
cataclasis; Aydin, 1978) are observed primarily within poorly-cemented sandstones.
Lithologic controls on deformation band formation are discussed in Part I. They
commonly occur as conjugate pairs near the southern and southwestern margins of the
anticline and as non-conjugate faults in other areas. The conjugate pairs are oriented
such that there is a vertical bisector to the acute angle between a given pair. These small-
displacement faults strike parallel to each of the three primary fracture orientations
recorded at Teapot Dome. Normal separation associated with deformation bands ranges
from indiscernible to approximately 20cm. The larger separations are associated with
multiple (up to 20) inosculating deformation bands (inosculating deformation bands
approach and diverge from each other but do not cross). Where displacement can be
constrained, individual bands generally have 1-3 cm of normal separation. At four sites,
deformation bands occurred within the same bed as fractures. At a single site,
deformation bands were nearly perpendicular to the throughgoing extension fracture set
and terminated where they intersected the fracture set (Chart 33, Appendix C).
Therefore, at this site the deformation bands post date fracture formation. The age of the
deformation bands relative to fracture formation at the other sites is undetermined.
Fractures
Three throughgoing fracture sets were documented at Teapot Dome (Figure 2-6).
One fracture set includes fractures oblique to the fold hinge. Most of these strike roughly
NW to WNW; a small number are roughly perpendicular to these, and thus strike NNE.
A second set is subparallel to the fold hinge.

66
Figure 2-6: (A) Lower hemisphere equal area net plot of poles to 129 representative throughgoing fractures from 87 locations around Teapot Dome (Appendix F). (B) The same data set used in A, normalized to the fold hinge (data rotated so that fold hinge has orientation shown). Fractures are considered hinge-parallel if they strike ± 20o from the hinge; hinge-perpendicular fractures strike 90o ± 20o from the hinge.
Hinge-parallel fractures Hinge-perpendicular fractures Hinge-oblique fractures Color key: Blue - Eastern limb Green - Western limb Red - Southern hinge
N
E W
S A
Fold Hinge
B
67
The third fracture set is roughly perpendicular to the fold hinge. Forty-four percent of the
documented fractures are parallel to the fold hinge, 32% are perpendicular to the fold
hinge and 24% are oblique to the fold hinge.
The set of fractures which strikes oblique to the fold hinge is found at 28 sites
throughout the fold and is equally distributed among the various lithologic units of the
Mesaverde Formation (Figure 2-7; Appendix E). Three additional sites record
deformations bands with the same general strike as the fracture set. At almost all sites
this is the oldest set of fractures or deformation bands relative to the other throughgoing
fracture sets as determined by abutting relationships. At only one site is the oblique set
younger than one of the other two fracture sets. At another site, the oblique fracture set is
the only fracture set recorded. There are two oblique fracture sets with an approximate
10o difference in strike at two locations. One of the sets at these locations is younger
than the other. However, relative age between oblique fractures and hinge parallel and/or
hinge-perpendicular fractures could not be determined, because the later two fracture sets
are not present at either of these two sites.
Data collected at a distance from Teapot Dome shows that the oblique set (Figure
2-8; Appendix F), that strikes predominately NW to WNW, can be found at surrounding
locations. Fracture orientation data from Oil Mountain are from Hennings et al. (1997).
Three sites at Teapot Dome have hinge-oblique fractures that strike NNE. Fractures
striking N to NNE were also observed at three sites at a distance from Teapot Dome,
including Oil Mountain.
The two dominant, younger, throughgoing fracture sets parallel the two fault sets
described previously. Most of these are bed-normal extension fractures.

68
Figure 2-7: Map of representative fractures striking oblique to the fold hinge at Teapot Dome. Based on data in Appendix C.
N
Fault, Normal (ball and bar on downthrown side)
Color Key: Red Unit 5: Fluvial Sandstones Black Unit 4: Carbonaceous Shales Blue Unit 3: White Beach Sandstones Green Unit 2: Beach Sandstones Brown Unit 1: Interbedded Shallow Marine Sandstones
0 1km
Fold Hinge
Quaternary Alluvium Outline
Mesaverde Fm Outline
NPR3 Boundary
Inferred Fault
Fracture
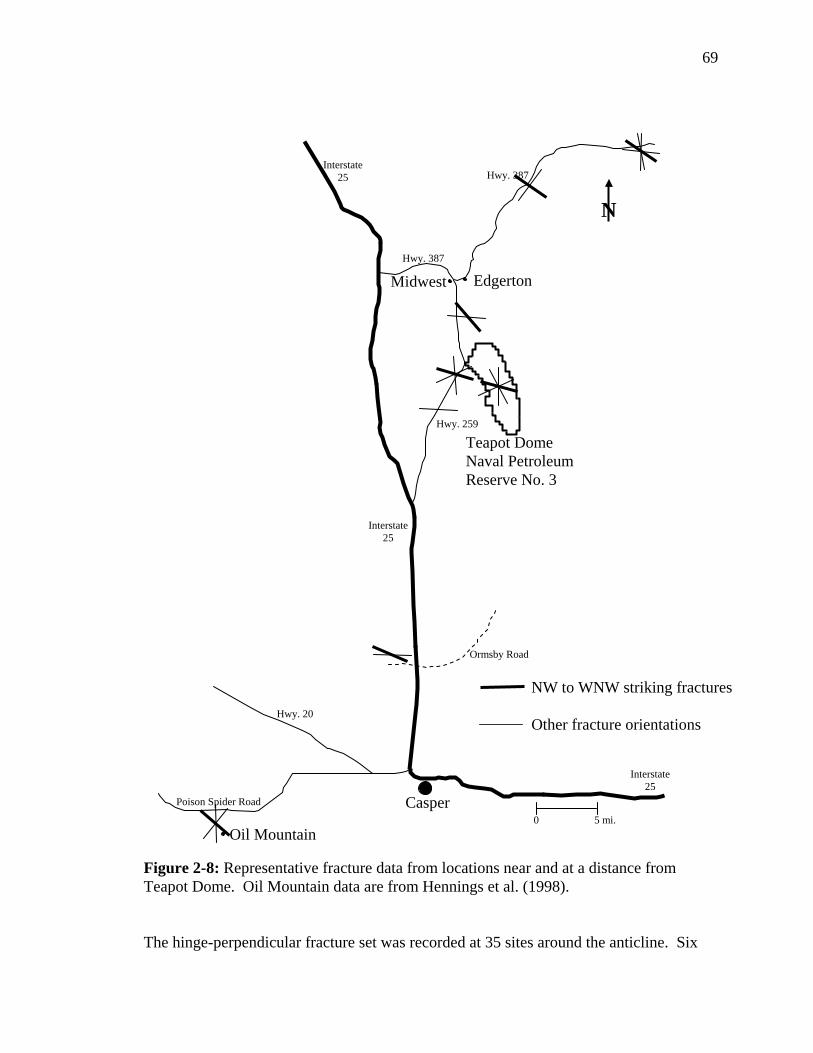
69
Figure 2-8: Representative fracture data from locations near and at a distance from Teapot Dome. Oil Mountain data are from Hennings et al. (1998).
The hinge-perpendicular fracture set was recorded at 35 sites around the anticline. Six
N
NW to WNW striking fractures Other fracture orientations
Teapot Dome Naval Petroleum Reserve No. 3
Oil Mountain
Poison Spider Road
Hwy. 20
Interstate 25
Hwy. 259
Hwy. 387
Hwy. 387
Midwest Edgerton
Casper
Ormsby Road
Interstate 25
Interstate 25
0 5 mi.

70
additional sites exhibit hinge-perpendicular deformation bands, but no fractures.
Fractures and deformation bands of this orientation are best developed along the eastern
limb where normal faults are common (compare Figures 2-4 and 2-9). The hinge-parallel
fracture set is found at 51 sites throughout the fold (Figure 2-10). Six additional sites
exhibit deformation bands without fractures of similar orientation. Locally, bed normal
extension fractures are replaced by conjugate shear fractures of the same strike.
Outcrops of the fold hinge are generally absent due to erosion of the fold core. A
portion of the hinge remains near the southern exposure of the dome, where it records an
increase in fracture density relative to the eastern and western limbs. Spacing between
hinge-parallel fractures that are not associated with faults evidence this increase. Eight
sites along the southern hinge of the anticline record a mean fracture spacing of 34.7cm
(n=71). Ten sites along the central limbs of the anticline, in contrast, record a mean
fracture spacing of 57.3cm (n=78).
Where pavement surfaces were large enough, both hinge-parallel and hinge-
perpendicular fractures were observed to extend for lengths of up to 100m. Locally,
these two dominant fracture sets typically meet at T-intersections. At certain outcrops
around the anticline, hinge-parallel fractures terminate at hinge-perpendicular fractures.
In other locations, hinge-perpendicular fractures terminate at intersections with hinge-
parallel fractures (Figure 2-11). The fracture set that does not terminate at T-
intersections (or junctions) is interpreted to be the oldest fracture set. These relationships
indicate that the two fracture sets were contemporaneous.
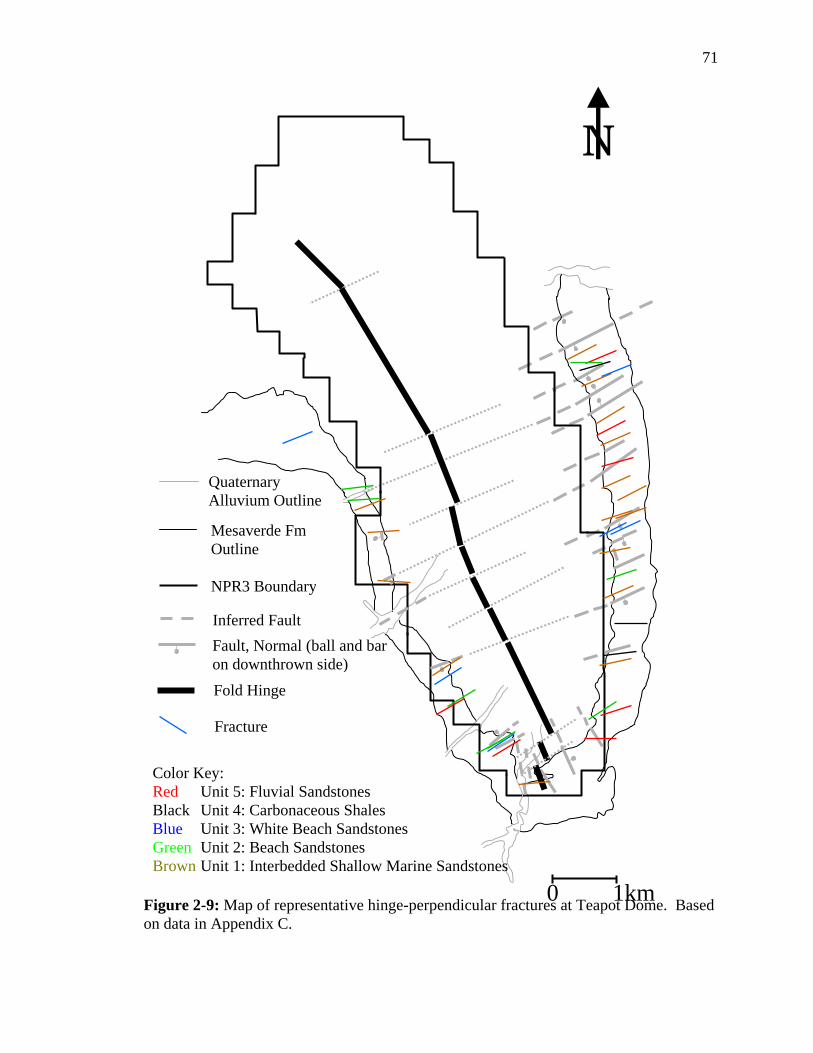
71
Figure 2-9: Map of representative hinge-perpendicular fractures at Teapot Dome. Based on data in Appendix C.
N
Fault, Normal (ball and bar on downthrown side)
Color Key: Red Unit 5: Fluvial Sandstones Black Unit 4: Carbonaceous Shales Blue Unit 3: White Beach Sandstones Green Unit 2: Beach Sandstones Brown Unit 1: Interbedded Shallow Marine Sandstones
0 1km
Fold Hinge
Quaternary Alluvium Outline
Mesaverde Fm Outline
NPR3 Boundary
Inferred Fault
Fracture

72
Figure 2-10: Map of representative hinge-parallel fractures at Teapot Dome. Based on data in Appendix C.
N
Fault, Normal (ball and bar on downthrown side)
Color Key: Red Unit 5: Fluvial Sandstones Black Unit 4: Carbonaceous Shales Blue Unit 3: White Beach Sandstones Green Unit 2: Beach Sandstones Brown Unit 1: Interbedded Shallow Marine Sandstones
0 1km
Fold Hinge
Quaternary Alluvium Outline
Mesaverde Fm Outline
NPR3 Boundary
Inferred Fault
Fracture
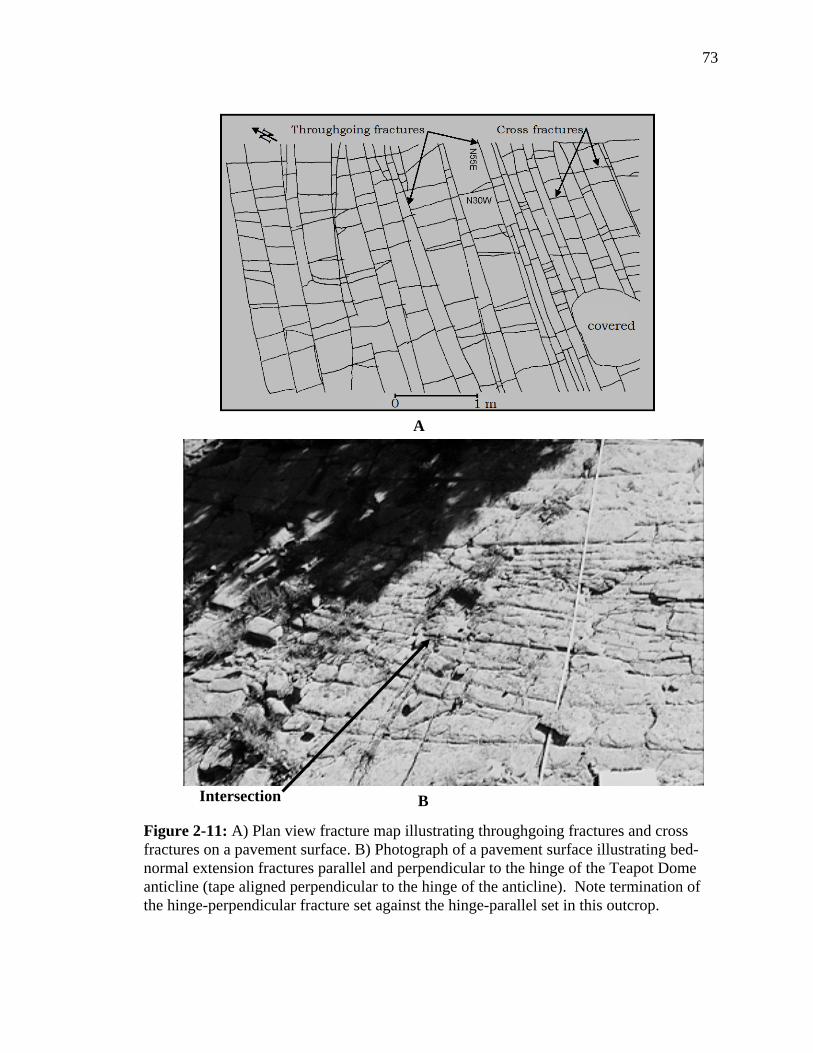
73
Figure 2-11: A) Plan view fracture map illustrating throughgoing fractures and cross fractures on a pavement surface. B) Photograph of a pavement surface illustrating bed-normal extension fractures parallel and perpendicular to the hinge of the Teapot Dome anticline (tape aligned perpendicular to the hinge of the anticline). Note termination of the hinge-perpendicular fracture set against the hinge-parallel set in this outcrop.
Intersection B
A
74
Spatial relationship between faults and fractures
As mentioned above, the two dominant fracture sets at Teapot Dome are generally
parallel to faults. That is, one set of bed-normal extension fractures is subparallel to
hinge-parallel faults, and the second set of bed-normal extension fractures is subparallel
to NE-striking faults (and thus perpendicular to the fold hinge). There is also a close
spatial relationship between hinge-perpendicular faults and fractures. The density of
these fractures increases near the faults (Figure 2-12). At the location illustrated in
Figure 2-12, hinge-perpendicular fractures are only present within a narrow zone adjacent
to hinge-perpendicular faults. Hinge-parallel fractures are limited to the area outside this
narrow zone, suggesting that the fault-related fractures formed first in this location.
Discussion
Structures observed within the Cretaceous Mesaverde Formation at Teapot Dome
include extension fractures, normal conjugate shear fractures, deformation bands, hinge-
parallel normal faults and hinge-perpendicular normal oblique faults. The dominant
fracture sets strike roughly parallel to the fault sets. The majority of the fractures are bed-
normal extension fractures. These observations agree, in general, with those made by
Thom and Speiker (1931). The single exception is in regard to fractures oblique to the
fold hinge which they did not recognize. Fischer and Wilkerson (2000) suggested that
hinge-oblique fractures could be formed in a fold associated with basement-involved
thrusting. Because these hinge-oblique fractures may form early in the folding process
they may predate both hinge-parallel and hinge-perpendicular fracture sets and still be
related to the folding process.

75
Figure 2-12: Histogram of an outcrop transect across a faulted area on the northeastern limb of Teapot Dome. The two F’s on the histogram are the locations of hinge-perpendicular faults within the transect. From 0 to 46 m and 68 to 168 m the fractures are hinge-parallel in orientation; from 46 m to 68 m fractures are subparallel to the two hinge-perpendicular faults.
Fracture/Fault Relationship
05
1015202530
0 20 40 60 80 100 120 140 160
Distance (m)
Number of Hinge- Perpend-
icular Fractures
F
F
76
However, at Teapot Dome, the fact the hinge-oblique fractures are older than the other
dominant fracture sets and that fractures with the same strike are recorded at sites away
from the anticline suggests they predate folding.
In contrast, hinge-parallel and hinge-perpendicular fracturing and faulting are
interpreted to be broadly contemporaneous with basement-involved thrusting and folding
at Teapot Dome. This interpretation is based on several observations. Fracture abutting
relationships indicate that the two fracture sets were broadly contemporaneous. The
dominant fracture sets strike roughly parallel and perpendicular to the fold hinge,
suggesting that they are related to the folding event. The fracture sets are parallel and
spatially related to the fault sets. Evidence that NE-striking normal-oblique faults are
temporally related to folding comes from the observed spatial relationships. These NE-
striking faults are oriented roughly perpendicular to the fold hinge, even where it bends,
and terminate toward the SW limb of the anticline.
As mentioned earlier, seismic data show that a basement-involved blind thrust
terminates within the lower Paleozoic section. Therefore, regional compression resulted
in shortening at the crustal level, manifest in the formation of basement-involved thrusts.
The normal-oblique movement recorded on some of the NE-striking faults indicates they
may have a transfer fault component related to differential movement across segments of
the basement-cored thrust. As noted by Gay (1999), shortening parallel and
perpendicular to the fold is required to develop four-way closure. Also using coseismic
displacements after the Northridge earthquake of 1994 to model strain in a blind thrust,
Unruh and Twiss (1998) determined that horizontal shortening (d3) was perpendicular to
the fold hinge, maximum lengthening (d1) was horizontal and parallel to the fold axis and

77
d2 was vertical. Each of these concepts are evidenced by the two dominant fracture and
fault sets and their orientation with respect to the fold hinge at Teapot Dome and by the
fold form itself. Specifically, hinge-perpendicular fractures and faults record extension
parallel to the hinge of Teapot Dome; the fold itself evidences shortening normal to the
hinge. The normal faults, extension fractures and conjugate shear fractures parallel to the
fold hinge are interpreted to have accommodated extensional strains related to bending of
the brittle sandstone beds. It is also possible that folding was accommodated by flow of
the more ductile units within the folded sedimentary section. Further work is required to
model possible variations in orientation and type of faults or fractures with increasing
depth to basement and decreasing distance to the thrust.
The orientation of structures, such as hinge-parallel and hinge-perpendicular
faults and fractures, at Teapot Dome is similar to those described by DeSitter (1956),
Murray (1967), Garrett and Lorenz (1990), Engelder et al. (1997) and Hennings et al.,
(1998). Two of the studies, Garrett and Lorenz (1990) and Hennings et al. (1998), noted
fracture sets that predated folding. In most of these studies, the fractures and/or faults
striking parallel or perpendicular to the fold hinge were attributed to the folding process.
Structures at Oil Mountain for example are similar to those at Teapot Dome, with
fractures striking both parallel and perpendicular to the fold hinge and an increase in
fracture density in the southern plunging regions of both anticlines (Hennings et al.,
1998). However, the hinge-parallel fractures at Oil Mountain were interpreted to predate
folding; also the increase in fracture density in southern exposures at Oil Mountain is
greater. It is possible the hinge-parallel fractures at Oil Mountain are related to the
folding process because the pavement surfaces used as a comparison at a distance from

78
Oil Mountain are still part of the Casper arch, which strikes subparallel to Oil Mountain.
Therefore, fractures at both locations may have formed in response to folding. It should
be noted however, that the fracture set determined to predate folding at Oil Mountain is
subparallel to the fracture set determined to predate folding at Teapot Dome. Therefore,
the age relationship between hinge-parallel fracturing and fold formation at Oil Mountain
is undetermined. The difference in fracture density between the two anticlines may be
due to Oil Mountain being a tighter fold, evidenced by the forelimb being slightly
overturned.
The structures described by Engelder et al. (1997) at Elk Basin anticline are
perhaps most similar to those at Teapot Dome. Two fracture sets, one parallel and the
other perpendicular to the fold, were documented. Changes in strike of hinge-parallel
fractures observed on the forelimb of the anticline were attributed to local faulting as they
are at Teapot Dome. At Elk Basin anticline, as at Teapot Dome, a significantly higher
percentage of hinge-parallel fractures was observed relative to hinge-perpendicular
fractures. Hinge-perpendicular fractures were also observed to extend for considerable
lengths in a few areas and to terminate against hinge-parallel fractures in other areas at
Elk Basin anticline.
3-D conceptual model of basement-cored anticlines
The observed fracture trends and interpreted genetic relationships from Teapot
Dome and similar folds have been used to create a conceptual model of fault and fracture
development in an anticline above a basement-cored thrust. The two main through-going
fracture sets incorporated into this 3-D model are: 1) bed-normal extension fractures

79
striking subparallel to NE-striking oblique normal faults and perpendicular to the fold
hinge, and 2) bed-normal extension fractures and normal faults striking parallel to the
fold hinge (Figure 2-13a). The fracture set determined to predate folding at Teapot Dome
is not incorporated into this conceptual model, as pre-existing regional fracture sets will
vary in orientation with location.
A comparison between this and an earlier conceptual model (Stearns and
Friedman, 1972) that describes fracturing associated with folding (based on data from
Teton anticline) shows significant differences as well as some similarities in the fracture
patterns (Figure 2-13). Conjugate fractures in the Stearns and Friedman (1972) model
are oriented such that the bisector of the acute angle is parallel to the plane of bedding,
while the Teapot Dome model illustrates conjugate fractures that have a vertical bisector
to the acute angle. These shear fractures obliquely transect the anticline in the Stearns
and Friedman (1972) model. The shear fracture sets in the Teapot Dome model strike
either parallel or perpendicular to the hinge. However, the extension fractures in both
models strike both parallel and perpendicular to the fold hinge in the vicinity of the
culmination. Near the plunging nose of the anticline, where bedding strike is not parallel
to the fold hinge, differences in extension fracture patterns become apparent. Bedding
strike rotates through a 180o turn around the hinge at this point. Here the Stearns and
Friedman (1972) fracture sets, by remaining parallel to bedding strike, change orientation
with respect to the fold hinge, whereas the fracture sets within the Teapot Dome model
remain parallel and perpendicular to the fold hinge (compare Figures 2-13a and b). Each
of these observations suggests a significant difference in permeability anisotropy between
models, as noted in the following section.

80
Figure 2-13: Two conceptual 3-D models of primary fracture patterns associated with anticlines. Different fracture sets are shown separately for clarity. A. Model developed from Teapot Dome data. B. Model developed by Stearns and Friedman (1972).
B
A
81
It is important to note that there may be a structural explanation for the
differences between these two 3-D models. The two anticlines are distinctly different
both in terms of the depth of the thrust relative to the fractured strata on which the
models are based and in the type of folding process. Teapot Dome is situated above a
deep-seated, basement-cored thrust. The sedimentary layers over the area of faulting are
interpreted to be essentially draped over the thrust. In contrast, Teton anticline is cored
by a thin-skinned thrust that propagated through the sedimentary section. As described
by Sinclair (1980), the Teton Anticlines, separated by an unfaulted syncline, are
essentially buckle folds in the form of a wave train over the thin-skinned thrust. It may
be that bedding-parallel shortening is significantly greater in the latter case as evidenced
by conjugate fractures with a horizontal (parallel to bedding) bisector to the acute angle.
This may also hold true for the fault propagation and fault-bend folds documented by
Cooper (1990), wherein fracture orientations representative of the Stearns and Friedman
(1972) model where recorded. Conversely, brittle sandstones at Teapot Dome indicate
lengthening in the area of flexure (drape) over the deep-seated thrust as evidenced by
conjugate fractures and faults with a vertical bisector to the acute angle. The majority of
folds that have fracture patterns similar to those at Teapot Dome are those associated
with deep-seated blind thrusts. It should also be noted that Stearns (1964) observed a
conjugate fracture set with a vertical bisector to the acute angle at Teton Anticline, which
was not considered a dominant fracture set by Stearns and Friedman (1972). This
fracture set was attributed to folding; bedding was visualized as a bent beam, wherein the
upper arc would be an area of extension but the lower arc would be an area of shortening.

82
Fluid flow implications
There are a number of implications of the fracture patterns that are incorporated
into the conceptual fracture model (Figure 2-14). Since the dominant set of throughgoing
fractures is parallel to the fold hinge, significant permeability anisotropy is expected,
with maximum permeability generally parallel to the fold hinge across the entire
anticline. Areas of greatest change in dip of bedding (i.e. the fold hinge) are areas of
increased fracture density, with fractures generally parallel to the fold hinge. The
increase in hinge-parallel fractures near the hinge of the anticline should be associated
with an increase both in permeability and permeability anisotropy. NE-striking normal
faults and associated fractures may locally cause the direction of maximum permeability
to be perpendicular to the fold hinge. Intersections of hinge-perpendicular with hinge-
parallel faults and associated fractures should be areas of enhanced permeability, where
increased interconnectivity may allow for locally increased production. The permeability
anisotropy will depend on the number of faults and fractures of each set and degree of
interconnectivity, and will thus vary from site to site.
A preexisting fracture and deformation band set oblique to the fold hinge is
specific to Teapot Dome. This fracture and deformation band set is found throughout the
fold and in all lithologies and will have an influence on fluid flow. Doll et al. (1995)
describe this fracture set, which strikes N65oW, as providing the most significant flow
directionality with respect to water response and rapid oil response time during steam
flooding.

83
Figure 2-14: Conceptual 3-D model of fracture patterns developed at Teapot Dome. Implications of these fracture patterns on fluid flow include: significant permeability anisotropy, with maximum permeability generally along the fold hinge due to numerous hinge-parallel fractures near the apex of the anticline; NE-striking normal faults and associated fractures may cause the direction of maximum permeability to be locally perpendicular to the fold hinge; and intersections between hinge-perpendicular and hinge-parallel faults and fractures may allow for increased production.

84
It should be noted that mineralization within the faults and fractures will play an
important role in all of the previous assessments. Highly mineralized fractures and faults
will reduce the overall permeability within a volume of rock. They would still result in a
direction of maximum permeability parallel to the mineralized fault or fracture set, but in
this case, the zone of highest permeability would be the matrix and not the fracture or
fault plane. The majority of fractures and faults studied were relatively unmineralized.
However, localized areas of moderate mineralization were observed. Detailed
information regarding mineralization is included in Part I: Lithologic Controls.
Conclusions
Fractures and faults associated with folding within the Cretaceous Mesaverde
Formation at Teapot Dome display variable patterns associated with structural position,
including: 1) fracture density increases near faults, 2) conjugate fractures and
deformation bands, oriented such that they have a vertical bisector to the acute angle, and
faults striking subparallel to the axis of the anticline, are common in the exposed hinge of
the anticline, 3) NE-striking normal-oblique faults and associated fractures are generally
perpendicular to the fold hinge, and are more closely spaced near the culmination of the
dome, and 4) extension fractures and faults that are parallel to the fold hinge, and are
more closely spaced near the hinge.
The deformation process that formed the faults, fractures and fold is interpreted to
have been a dynamic interactive system, wherein progressive folding was driven by
displacement on the basement-involved thrust fault. Variable displacement along the
thrust front was accommodated by transfer faults (the NE-striking normal oblique faults)
at roughly right angles to the thrust fault. These faults also accommodated a component

85
of extension associated with bending of beds across the fold. Normal faulting
perpendicular to the fold hinge accommodates the fold form in this direction. Hinge-
parallel normal faults formed to accommodate the fold form and are roughly parallel to
the thrust fault. In addition, fractures formed in brittle sandstones and carbonaceous
shales in response to the fold form (driven by the basement thrust) and to displacements
along faults (also driven by the basement thrust) while more ductile marine shales are
interpreted to have responded to shortening through flow.
These observations indicate that maximum horizontal permeability associated
with these fractures and faults will generally be hinge-parallel, especially near the apex of
the anticline. Localized areas of maximum permeability that are perpendicular to the fold
hinge may be found within the damage zones of NE-striking normal faults. A preexisting
NW-WNW fracture set specific to Teapot Dome will also influence fluid flow. This set
was observed in outcrop and inferred by Doll et al. (1995) from data collected during
steam flooding of Shannon reservoirs.
Given the importance of correctly modeling permeability and fluid flow
anisotropy it is essential to use the most appropriate reservoir analog. This study
provides a conceptual model of fault and fracture distribution that is in many ways
similar to previous descriptions of basement-involved anticlines, including a previous
study at Teapot Dome (Thom and Speiker, 1931; DeSitter, 1956; Murray, 1967; Garrett
and Lorenz, 1990; Cooper, 1992; Engelder, 1997; Hennings, 1998; Unruh and Twiss,
1998). The model is, however, significantly different from Stearns and Friedmans (1972)
model, which has been widely applied to all anticlines regardless of the folding process.
I believe that the model developed from the Teapot Dome data set is best applied to
86
basement-cored structures while the Stearns and Friedman (1972) model would be a
better analog for folds developed above thin-skinned thrusts. In other words, fracture
analogs are best applied with knowledge of the tectonic setting of the structure of
interest. Using the wrong model could result in a poorly designed secondary recovery
system, wherein early breakouts occur and/or production is not enhanced.
87
APPENDIX A
Brittle Deformation of Clastic Sediments
Deformation Bands
Deformation bands are roughly planar features that record some small amount of
displacement (i.e. small-displacement faults) (c.f. Aydin 1978). These structures are
narrow (1mm wide average) with along strike lengths from a few centimeters to some
tens of meters in length. Displacements are in the range of a few millimeters to a few
centimeters. Areas where larger amounts of displacement have been accommodated are
typified by wider zones of deformation bands (Aydin, 1978; Aydin and Johnson, 1983;
Antonellini et al., 1994). This observation, that a single deformation band can
accommodate only a limited amount of displacement, suggests the possibility of strain
hardening (Rudnicki and Rice, 1975; Aydin and Johnson, 1983; Antonellini et al., 1994;
Wong et al., 1997). Strain hardening leads to the sequential formation of more
deformation bands adjacent to the original band (Rudnicki and Rice, 1975; Antonellini et
al., 1994). Because their laboratory data were inferred to lack evidence for strain
hardening, Mair et al. (2000) suggest a different mechanism for the sequential formation
of deformation bands. The authors suggest that friction along the first deformation band
makes slip more and more difficult, conversely nearby grains are preferentially loaded
until a new sequential band is formed. This mechanism results in slip along a new band
rather than the older band without strain hardening.
Antonellini et al. (1994) described some deformation bands as more resistant to
weathering than the surrounding rock. They inferred that this difference was related to

88
preferential cementation. Preferential cementation is inferred to be related to the
relatively small pore spaces within a deformation band, since nucleation is facilitated as
the pore space decreases (Antonellini et al., 1994). Weather resistant deformation bands
can, however, also result from grain and pore size reduction and associated compaction
without cementation (Sigda et al., 1999).
Fracture initiation and propagation: Theory A fracture occurs when a rock unit breaks along a more or less planar surface and
separates into discrete parts (Stearns and Friedman, 1972). Fractures can be divided into
the following major groups based on the type of displacement observed, 1) dilating
fractures/joints, and 2) shearing fractures/faults (Long et al., 1997). A genetic
subdivision into modes of fracture is based on the relative movement of the fracture walls
with respect to each other and to the fracture front (Figure C-1). Mode I fractures have
displacements perpendicular to the fracture surfaces and are termed either extension,
tensile or dilation fractures. Mode II (shear) fractures have displacements that are
parallel to the fracture surface and perpendicular to the fracture front. Mode III (shear)
fractures have displacements that are parallel to the fracture surface and the fracture front.
These shear fractures are called faults if displacement is measurable (Pollard and Aydin,
1988; Long et al., 1997).
Generally, a fracture can initiate and propagate when the strength of the rock is
equaled or surpassed by an applied stress. However, experimentation by Griffith (1921)
showed that glass samples fractured at an applied stress level lower than their theoretical
strength. Giffith's explanation for this observation is that stresses become amplified
around preexisting flaws or microcracks within the samples. These flaws or microcracks
propagate when optimally aligned to the applied stress (Figure C-2;Griffith, 1921;

89
Weijermars, 1997).
Both extension and conjugate shear fractures can form in laboratory compression
tests (Figure D-3). Extension (opening) fractures form perpendicular to the least
compressive stress and bisect the acute angle between the conjugate shear fractures (Peng
and Johnson, 1972; Long et al., 1997). In accordance with Griffith's theory, macroscopic
failure is generally found to be preceded by microfracturing (Griffith, 1921; Jaeger and
Cook, 1969; Hallbauer et al., 1973; Nelson, 1985).
Fluid-pressure effects on fracture initiation
One of the more important controls on the strength of brittle rocks is pore pressure
(Hubbert and Rubey, 1959; Secor, 1965). Work by Hubbert and Rubey (1959) shows
that effective normal stress (σ) acting on a plane of interest is related to pore fluid
pressure (p) and the total normal stress (S).
Equation 1: σ = S – p
As described by Secor (1965), the importance of this relationship is that fracturing within
brittle rocks is a direct function of the effective stress.

90
Figure A-1: (a) Diagram illustrating the propagation front of a fracture. (b) Illustration of fracture modes. Mode I fracture - opening displacements are perpendicular to the fracture surface. Mode II fracture - shearing displacements are parallel to the fracture surface and perpendicular to the fracture front. Mode III fracture - shearing displacements are parallel to the fracture surface and the fracture front (Pollard and Aydin, 1988).

91
Figure A-2: Griffith’s crack propagation model. (a) Randomly orientated flaws in an unstressed sample. (b) Under an applied stress (axial loading) the flaws orientated parallel to the maximum stress propagate while other microcracks are sealed (Weijermars, 1997).
Figure A-3: Formation of tensile (extension) fractures and conjugate shear fractures/faults in laboratory compression tests (Weijermars, 1997). σ1 – maximum principal stress; σ2 – intermediate principal stress; σ3 – least principal stress.

92
0 1 km
N
Quaternary Alluvium Mesaverde Fm Undifferentiated
NPR3 Boundary
1
2
3 4
5 1 Section
Location, Number
APPENDIX B
Measured Stratigraphic Sections Stratigraphic sections were measured from five areas around Teapot Dome
(Figure B-1). Measured sections begin within the interbedded sandstones and shales
(Unit 1) and terminate within the fluvial sandstones and carbonaceous shales (Units 4 and
5) of the Mesaverde Formation. A brief lithologic description and thickness is provided
for each measured bed. Larger scale (Unit) divisions are keyed to Figure 1-2.
Two stratigraphic sections (sections 2 and 4) contain fracture data obtained while
measuring those sections. Fracture descriptions are included in this section to simplify
the comparison of lithologic characteristics and fracture characteristics within each bed.
Large-scale (Unit) divisions are keyed to Figure 1-2.
Figure B-1: Locations of measured sections at Teapot Dome.

93
Thick (massive) shale; weathered color gray/green; 21.6m
Moderately cemented, fine-grained sandstone with burrows; color weathered and fresh – red-brown; thin bedded; 0.127m
Shale – weathered color gray/green; 1.6m
Fine-grained sandstone; well sorted; thin bedded; burrows; color weathered and fresh – red-brown; 0.4m
Shale – weathered color gray/green; 2.22m
Fine-grained sandstone with burrows, similar to the two lower sandstone beds; thin laminae (0.5-1cm to 0.25 to1cm); 0.21m
Shale - weathered color gray/green; 1.72m
Fine-grained sandstone; weathered color – red-brown; color fresh – buff-white/gray; low angle cross-beds – possible hummocky cross-stratification; 0.6m
Shale – slightly grayer cast and less greenish than shales below; 2.72m
Interbedded sandstone and shale; individual beds 2-20cm thickness; fine-grained sandstone, well sorted and rounded; 3.10m
Thick, massive sandstone; fine-grained; moderately sorted; loading structure at base of unit; 8.72m
Thin bedded sandstone with cross-beds (0.2-1cm); possible hummocky cross stratification and loading structures; 1.2m
Massive sandstone (beach); 5.3m
Mod-poorly cemented sandstone; some individual beds better cemented than others; individual beds 0.5-1.5m thick ; 5.16m
More massive than underlying sandstone, however, many of the same characteristics; 3.44m
Poorly cemented grayish white beach sandstone; 1.7m
Carbonaceous shale; 14.46m
Fluvial sandstone; cross-bedded chart locality 50; 5.2m
Carbonaceous shale: 9.9m thick
Fluvial sandstone; 0.5m thick
Section 1
10 m
0
U
nit 4
Uni
t 5
U
nit 4
Uni
t 2
U
nit 3
Uni
t 1

94
Poorly exposed shale, local thin (less than 1-2cm) sandstone; 20m
Abrupt base, small hummocky cross bedding, very fine grained sandstone, burrows; 2 interbedded shales near top; bed strike and dip N5W 29W, Fractures: TNF – N0W; XF N54W, no remnant mineralization; marine – limit of wave base; 0.4m
Shale and cover; 0.9m
Sandstone, very fine grained, plane parallel and hummocky cross bedding, ripple marks on upper surface; bedding strike N8W 28W; fractures, N8W TNF (TNF 3.5cm spacing), and N88W XF (XF 90cm spacing), no mineralization; Fe stain 3cm in rock from fractures; 0.2m
Shale, generally covered upper, one 20cm sandstone; 4.5m
Fine-grained sandstone, hummocky cross bedding; TNF N58W; 10 – 60cm spacing, TNF N0W, age relationship obscure; marine, storm wave base; 1m
Shale and cover; 3.5m
15 cm alternating sandstone & 5cm sandy shales; bed structures obscure, possible hummocks, no definitive TNF; 1m
Alternating 5cm sandstones & 30cm shales; tracks, trails & burrows on sand surfaces, marine; bedding strike and dip N7W 30W; Fractures,N5W 15cm spacing and N56W 5-10cm spacing; age relation between the two fracture sets in determinate; 1.5m
Fine grained sandstone; possible hummocky cross bedding, TNF N68W; TNF N4W, 60cm spacing; 0.45m
Alternating beds of 5-10cm sandstones & 1-4cm shales; rounded weathered surface, Fractures strike N8E, 15cm spacing and N80E, 12cm spacing; shallower marine environment; 2.4m
Fine grained sandstone, beds 0.5-0.9m thickness; hummocky cross bedding; shales up to 0.35m at lower & upper thirds; bedding strike and dip N4W 29W; TNF N12W, 20cm fracture spacing in a 15cm thick bed; irregular XF, N12W 45W therefore, 16o off bed normal; Fractures tend to be irregular; 9.9m
Fine-grained sandstone; massive with probable hummocks; amalgamated sandstone; middle shoreface; isolated lens (~10cm thick X 10m wide) of carbonaceous shales. Fractures strike N60W, N53W, N40W with calcite & pyrite; fracture dip 72NE; fractures are not perfectly planar; spacing 75-140cm. Bedding strike N15W, dip 25W; 3.5m
Sandstone, fine-grained; 4-20cm thick sandstone beds with 2-5cm thick interbeds of sandy shales; middle sandstone, 0.6m thick. Fractures strike N7W, with 30-50cm spacing; secondary fractures strike N85W. Bedding strike N8W, dip 28W; 3.5m
Massive fine-grained sandstone – no fossils, possible hummocky cross-stratification; TNF strike 5-10W, fracture spacing within siderite bed is 9-18cm; irregular XF, N85E, very irregular spacing (20-100cm). Bedding strikes N20W, dip 25W; 4.5m
Section 2 Part I
10 m
0
U
nit 1
Uni
t 2

95
Interbedded sandstone and sandy shales. Sandstones 4-9cm, shales 2-8cm, (prodelta sequence?); 3.3m
Broadly lenticular sandstone (distributary channel?) Local zones of soft sediment deformation – prodelta shales; 3m
Similar to lower unit – no systematic fractures; 2.5m
Laterally extensive shale horizon (prodelta?); 0.6m
Sandstone (1m scale shale ripup clasts in base); low angle bedding; laterally discontinuous, 10cm shales; local ripple marks on bedding planes. Upper 6m – fine-grained, white color, porous, swash zone?; N52W, N50W, N51W, N50W, N51W, N55W, conjugate deformation bands, 1cm displacement (normal) as observed in swash zone (planar beds), 30cm-1m. Lower sandstone: medium grained, 250µ; 16m
Coal N60W cleats. Bentonite interlayered with coals; 17m up section N85W cleat strike. 1m thick splay sandstone in middle of coal section; 19m
Section 2 Part II
10 m
0
U
nit 1
Uni
t 2
U
nit 3
Uni
t 4
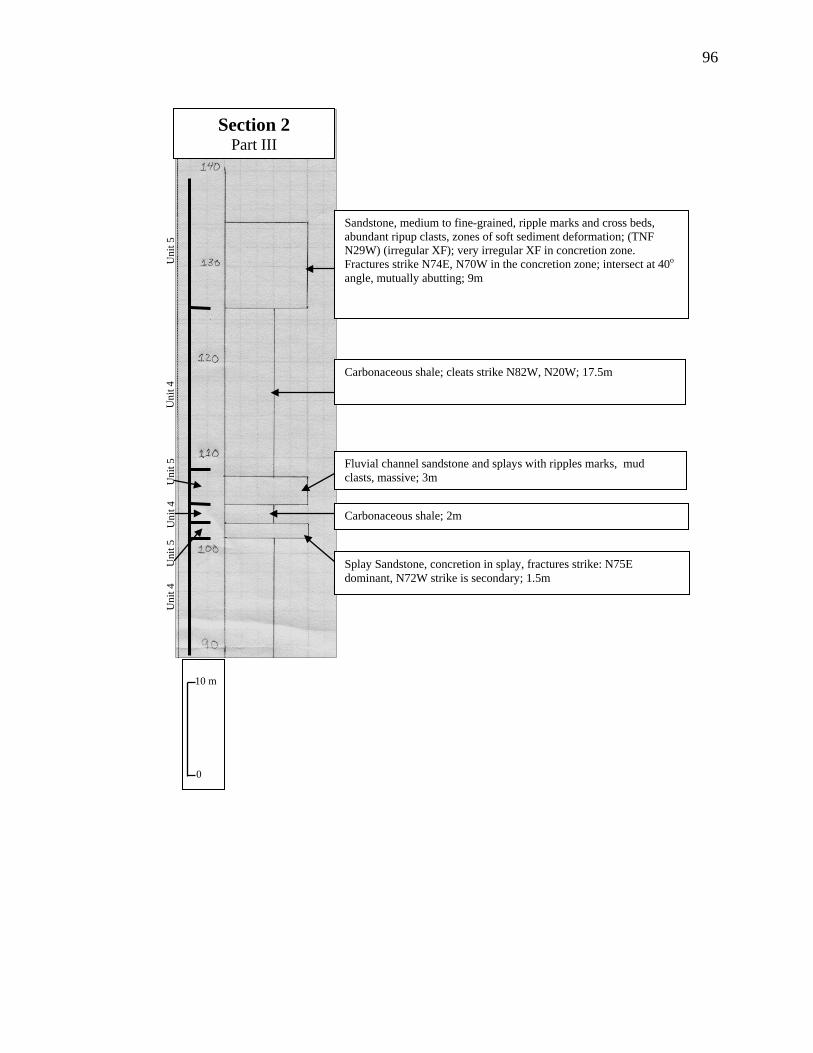
96
Splay Sandstone, concretion in splay, fractures strike: N75E dominant, N72W strike is secondary; 1.5m
Carbonaceous shale; 2m
Fluvial channel sandstone and splays with ripples marks, mud clasts, massive; 3m
Carbonaceous shale; cleats strike N82W, N20W; 17.5m
Sandstone, medium to fine-grained, ripple marks and cross beds, abundant ripup clasts, zones of soft sediment deformation; (TNF N29W) (irregular XF); very irregular XF in concretion zone. Fractures strike N74E, N70W in the concretion zone; intersect at 40o
angle, mutually abutting; 9m
Section 2 Part III
10 m
0
U
nit 4
U
nit 5
U
nit 4
U
nit 5
Uni
t 4
U
nit 5

97
Fine-grained sandstone, weathered color – gray/brown; 0.5m
Shale, color light gray; slope forming; 14.76m
Fine-grained sandstone, fine laminae (0.2 – 1cm); 0.7m
Shale; 2.2m
Interbedded sandstone & shale, progressively more sandstone toward top; individual beds 3cm to 1m at top (approximate); 13m
Progressively thicker sandstone; upper bed 1.5m alone; 4.5m
Interbedded sandstone & shale (thickest sandstone 0.5m); beds vary from 1cm sandstone and shales to 0.5m for sandstone and 14cm for shales; 3.6m
Interbedded sandstone and shale; fine-grained cross-beds; 3 individual sandstone beds (1+ m each); 4.2m
Interbedded sandstone & shale; dirty shales; 3.44m
Fine-grained sandstone, well sorted; loading structures at base; thickest bed 2m; 5.6m
Fine-grained sandstone cross-bedded; gray/white color; moderately to poorly cemented; 4.3m
White beach sandstone; poorly cemented; ~2m
Carbonaceous shale with localized coal; 10.72m
Fluvial sandstone, moderately cemented; white/gray color; 0.4m
Carbonaceous shale; 5.16m
Fluvial sandstone; 1m
Carbonaceous shale; 1.7m
Fluvial sandstone; 1.9m
Section 3
10 m
0
U
nit 5
Uni
t 4
U
nit 4
Uni
t 5
U
nit 4
Uni
t 3
U
nit 2
Uni
t 1
U
nit 5

98
Shale. A few localized sandstones, 1-5cm thick, poorly exposed; 10m
Abrupt base, hummocks, very fine-grained sandstone, marine limit of wave base; TNF N22W, XF N80E, bed N28W 18SW. Spacing (rough) – TNF 0.6cm, XF 0.5cm; 1.0m
Shale and cover; 2.5m
Very fine-grained sandstone, thin laminae, hummocks; TNF N22W bed normal, Fractures N60E possible TNF – poor exposure; limit wave base (storm deposit); 0.1m
Shale/cover; 1m
Poorly exposed very-fine grained sandstone, hummocks and trace fossils; 0.22m
Shale/cover; 1m
Very fine-grained sandstone, poorly exposed; TNF N25W; 0.18m
Shale/cover; 1.8m
Very fine-grained, thinly laminated (0.5cm), poorly exposed sandstone; 0.14cm
Silty shale/cover; 1m
Very fine-grained sandstone, thin laminae, hummocks; 0.13m
Silty shale/cover; 1.8m
V-fine grained sandstone, relative to lower units, poorly cemented, few fractures; 0.29m
Silty shale; 0.45m
V-fine grained sandstone, thin laminae, possible hummocks, poorly cemented, few fractures; 0.19cm
Silty shale/cover; 0.8m
Alternating beds of 15cm thick sandstones and 20cm thick shales (thinner sandstones at base). A few small-scale hummocks, few trace fossils. TNF N50E, XF N50W (fewer this trend); abutting relationship unclear; 3.5m
Alternating sandstone and shale – 4 beds of 0.5m thick sandstones separated by 4 units of 0.5m thick interbedded sandstone & shale. Very fine-grained sandstone, ripple marks in thicker sandstones. TNF N45-50E, XF N35-38W, fractures dip bed normal – no mineralization, abutting relationship unclear, probable the N45-50E set is older, bedding N36W 16SW; 4m
U
nit 1
10 m
0
Section 4 Part I

99
Section 4 Part II
Fine-grained sandstones and shales; sandstones 0.5-0.3m, shales 0.3-0.1m – thinner shales toward top, thicker sandstone toward top; some hummock cross beds, trace fossils. TNF N53E 85W, 0.8m spacing; TNF N35W 78NE (younger), 1m spacing; 5.5m
Covered – interbedded sandstone & shale, poorly cemented, 0.5-0.1cm thick alternating beds; 5m
Fine-grained sandstone, scoured lower contact, mud clasts at base, Fracture strike and dip, N10-15W 74NE, N55-65E vertical dips, abutting relationship unclear; 1.1m
Mostly covered – one poorly cemented, 0.5m thick, sandstone near top; 3.5m
Generally massive sandstone, large scale 1-1.5m, hummocks 3m up from lower contact, ophiomorpha burrows, upper 0.5m (laminated, Fe rich) with raised fractures. Fractures strike N0W spacing: 50, 60, 22, 20, 25 cm; N40E spacing: 50, 60, 62, 60cm. N0W older – also more distinct (positive relief). Bedding strike– N23W 14SW; 10m
Light Gray/whitish sandstone, medium-grained, very poorly cemented, and mostly covered. No fractures or deformation bands observed; 1.7m
Carbonaceous shale, N40E coal cleat; 5m
Fluvial sandstone, mod-poorly cemented, little sedimentary structure or fractures, m-grained; 1.7m
Carbonaceous shale; 2.2m
Splay sandstone; TNF N5W, TNF N62E mutually abutting; clastic dike 1m wide; 0.3m
Mostly covered, carbonaceous shale, 2 discontinuous 0.8m thick splay sandstones near center of unit; 7.5m
Splay sandstone, fracture spacing 0.2-0.4m average, some 8cm; fracture strike N60E (chart # 88); 1m
Carbonaceous shale, mostly covered; 6.5m
Fluvial sandstone, white/gray, moderate to poorly cemented, fractures N40-55E irregular, 1-3m and greater spacing.
Generally covered, mostly shale with alternating sandstones (10cm), poorly cemented very fine-grained sandstone; 2.5m
10 m
0
U
nit 1
Uni
t 2
Uni
t 3 U
nit 4
U
nit 5
U
nit 4
U
nit 5
Uni
t 4
Uni
t 5
U
nit 4
U
nit 5

100
Carbonaceous shale
Fine-grained sandstone, well sorted, well rounded; thin laminae (0.5 to 1cm); weathered color: brown-red; color fresh: gray-brown; 0.15m
Shale; weathered color – brown/gray; 2 thin streaks of sandstone; silty shale; 5.66m
Sandstone; 0.25m
Sandy shale; slope forming; 1.8m
Interbedded sandstone and silty shale; sandstone beds up to 0.5m; 7.16m
Sandy shale; slope forming; 2.72m
Interbedded sandstone and shale; bed thickness 0.2 to 0.3m; cliff forming; 4m
Possible beach sandstone, cross-bedded, fine-grained, well rounded and sorted; cliff forming; 1.5m
Sandstone and shale; slope forming; 2.3m
Interbedded sandstone and shale; cliff forming; 5m
Silty sandy shale with possible sandstone layers; partially covered; slope forming; 4.94m
Fine-grained sandstone; loading structure; 1m
Interbedded sandstone and silty/sandy shale; some loading structures in 1 middle sandstone bed 0-3m thickness; 1.3m
Fine-grained sandstone, well sorted, well rounded; 0.7m
Interbedded sandstone and sandy shale; 1m
Sandstone; medium-grained, well rounded, individual beds to 1m; pyrite on fractures (most oxidized); 5m
Beach sandstone, color light gray/whitish (less cemented than above); deformation bands; 6.16m
Siderite cemented beach sandstone; red/brown color; some calcite-filled fractures; 0.8m
Interbedded sandstone and sandy shale; gray/white color; poorly cemented; well rounded and sorted; deformation bands; 6.88m
Carbonaceous shale (mostly coal); numerous cleats and fossilized wood; 1m
Fluvial sandstone (lenticular, not laterally continuous); moderately cemented, medium grain size, well-sorted & rounded 1.9m
Section 5
U
nit 1
Uni
t 3
U
nit 4
Uni
t 2
U
nit 5
10 m
0
U
nit 4

101
APPENDIX C
This appendix primarily comprises fracture data compiled from the various sites at Teapot Dome. A key to the charts for each data collection site is given below. Locations are provided in Figure D-1. Chart #: Location and whether this is a plan or cross-sectional view. Relationship to nearby charts is also included (if necessary). Location: e.g., SWl/4 SEl/4 Sec# T#N R#W Lithology: Cretaceous Mesaverde Formation (Kmv) in ascending order as shown in Figure 1-2. Size of Area: Given in meters or acres.
Grain Size, Cementation: Visual estimate using grain-size chart. Field observations of cementation are recorded and placed on the following subjective scale: very poor (friable using fingers), poor (easily friable with a knife, which will leave a deep scratch mark), moderate (partially friable with knife and leaves scratch mark), well (leaves slight mark when scratched with knife), very well (few to no scratches with knife and produces ringing sound when struck with a rock hammer). Bed Thickness: Measured in centimeters or meters; if possible, bracketing units are also measured. Structure Strike and Dip: Recorded two or more bedding plane measurements (where possible). Curvature: Estimated radius, in meters, of plan view structural curvature. Faulting: Description of large-scale faults and associated fracture swarms. Recorded fault strike and dip and the same general descriptions as for fractures (see below). Fracture Characteristics Type, Orientation: Fractures divided into sets (A, B, C, etc.) based on characteristics and orientations. Obtained as many readings as possible (at least ten for each set). Strike and dip readings given in quadrants. Types: Abbreviations and types from John Lorenz (written. com., 1997).
CF: Conjugate shear fractures. VCF: Vertical conjugate shear fractures (CF with vertical bisector of the acute
angle).
102
HCF: Horizontal conjugate shear fractures. XF: Cross fracture (short connecting fractures that terminate at throughgoing
fractures). VE: Vertical extension fractures, typically bed normal. TNF: Throughgoing fractures have generally longer trace lengths relative to other
fracture sets. Other fracture sets generally terminate at this set.
Spacing: Fracture spacing measurements were taken in traverses across the outcrop perpendicular to strike (i.e. fracture spacing for set A measured perpendicular to strike A, spacing for set B measured perpendicular to strike of set B). Where possible a minimum of ten measurements were made of fractures from each set. Separation: Measured amount of separation, strike and type of fracture or fault. Surface Characteristics: Recorded characteristics can include slickenside stria and surfaces, plumose structures, and rib marks. Observed steps or risers will be described using terminology of Norris and Barron (1968) and Petit (1987). Accretion steps: steps formed by gouge or crystallized material. Congruous fracture steps: risers facing away from movement of the opposite block. Incongruous fracture steps: risers facing movement of the opposite block. Sense of movement of the opposing block is determined by stratigraphic separation. Relative Ages: Determined relative age using abutting or crosscutting relationships. These relationships can help determine relative ages. A fracture that curves to intersect another is interpreted as younger. A fracture set that generally terminates against a throughgoing fracture set is interpreted as younger. Apertures: Measured width of fracture opening. Determined if fracture apertures are recent. Mineralized fractures suggest open fractures at some stage in fracture history. Mineralization: Type of fracture mineralization. Measured width of crystals if possible and width of mineralized zone. Deformation Bands (width): Measured width of bands and described anastomosing or inosculating nature of bands including number of each.

103
Figure D-1: Locations of charted areas.
N
44
85 14
11
89
Mesaverde Fm Outline
0 1km
NPR3
49 48 83 50 45 44 46 47
42 43 40
39 36 15 10
12 13
9
90 80
3 4 5 6 7
8 88
68 21 17 16
22 24
23 25 26
2 1 27
20 18 19
29 30
28 38
31 34 35 37
32 33
86
55 56 57
58 59 60
61
62 65
64 63 51
52 53
54 69 71
70 72 73
74 75
84 66
82 81 77
76 67
Quaternary Alluvium Outline
88 Site Location and Number
78
79
87
104
Chart #: 1 Cliff exposure Location: SW1/4 SE1/4 Sec 23 T38N R78W Lithology: Unit 2: beach sandstone - base shows major rip-up storm clasts w/coal; some trace fossils (Ophiomorpha) Grain size, Cementation: 250 µ; rounded grain, moderate cement (calcite) Bed thickness: Approximately 10m Structure Strike and dip of bedding: N46E 8SE; N45E 9SE Structural curvature (estimated): 1000-1500m Faulting: No rock exposed in gap; gap approximately 60 ft wide by 60 ft deep; Gap area shows general N23W 68NE Fracture Characteristics Type, Orientation: TNF (VCF); measured on cliff face, south side of gap – both east and west faces N24W 61SW N15W 50SW N32W 76NE N40W 75SW – 1mm aperture – Incongruous fracture steps N56W 59NE N33W 66SW - undulatory N44W 76NE Spacing: 1-5m (average 2m) Separation: Mineralization: none Surface characteristics: Cuspate incongruous fracture steps noted on one surface Relative ages: Apertures: Generally none Deformation Bands (width): NA

105
Chart #: 2 Plan and side views Location: SW1/4 SE1/4 Sec 23 T38N R78W Lithology: Unit 2: beach sandstone; 10m below carbonaceous shale Grain size, cementation: 177-250µ; calcite cement Bed thickness: 10m – not completely exposed Structure Strike and dip of bedding: estimate – N60E 15SE Structural curvature (estimated): 1500m Faulting: Fault zone; projects trace of fault into gap in chart 1; general trend N25W 75NE; width 7m; continues south along trend 30m to carb shale/bss. Contact approximately 1.5m offset this location
Set A
Fracture Characteristics Type, Orientation: Fault-zone related fractures (TNF?)
Set B N25W 84NE N28W 81NE N20W 76SW N24W 80NE N18W 64NE N27W N28W 60NE N20W 90 N26W N22W
N65E N55E N49E N54E N53E
Spacing: Average .6m Separation: 1.5m offset 30m to south Mineralization: None observed Surface characteristics: Relative ages: A set older than set B Apertures: erosional apertures Deformation Bands (width):

106
N54
E
N25W 81NE
N25W 85NE
Cha
rt 2
: Out
crop
map

107
Chart #: 3: plan view Location: SE1/4 SW1/2 Sec 15 T38N R78W Lithology: Unit 1: marine sandstone Grain size, cementation: 125µ; rounded, moderate sorting, well cemented (calcite, siderite) Bed thickness: 22cm Structure Strike and dip of bedding: N22W 16SW; N26W 16SW; N19W 15SW Structural curvature (estimated): Faulting:
A set
Fracture Characteristics Type, Orientation: A set: VNF; average between N55-60E. B set: VXF; average between N30-35W, bed normal.
B set N52E N58E 90 N56E 90 N52E 88SW N52E 88SW N48E 88SW N52E 88SW N61E N55E N58E 85SW N57E N60E N72E 90 N59E N68E 90 N55E N58E 90 N60E N55E N62E N57E N58E N57 N60E N55E
N5W N13W N34W 74NE N33W 76NE N30W N29W 78NE N20W N15W N30W 75NE N27W N13W N20W N16W N22W N30W 73NE N27W N31W N21W N27W 76NE N25W N38W 78NE N36W N29W N30W N35W 74NE N27W
Spacing: A set average 4.2/m; B set average 4.0/m Separation: Mineralization: Surface characteristics: Relative ages: A set older Apertures:

108
Deformation Bands (width): NA
Chart 3: Photograph and outcrop map.
109
Chart #: 4 Plan and side views Location: SE1/4 SW1/4 Sec 15 T38N R78W Lithology: Unit 3: white beach sandstone (wbss); directly below carbonaceous shale Grain size, cementation: 350µ; poorly cemented; easily cut with knife; little calcite Bed thickness: 3m Structure Strike and dip of bedding: N33W 18SW; N28W 20SW; N28W 18SW Structural curvature (estimated): West limb Faulting: NA
Set A
Fracture Characteristics Type, Orientation: Vertical conjugate (VC) deformation bands
Set B N60E 55SE N55E 55SE N58E 55SE N58E 48SE N55E 48SE N58E 55SE N58E 48SE N52E 52SE N56E 48SE N55E 50SE N58E 50SE N58E 50SE N52E 55SE
N55E 52NW N55E 55NW N58E 54NW N58E 48NW N50E 55NW N55E 52NW N55E 56NW N55E 50NW N58E 50NW N58E 48NW N52E 55NW
Spacing: 47 individual bands in 20m Separation: None observed Mineralization: Iron staining within conjugate sets; deformation bands provide the plane of discontinuity in staining. Surface characteristics: Relative ages: Conjugate pairs same age Apertures: Deformation Bands (width, mm): 2,2,2,2,2,2,2,1,2,2,

110
Chart #: 5 Plan and side views Location: NE1/4 NW1/4 Sec 22 T38N R78W Lithology: Unit 2: bss; light tan color, 4m below carbonaceous shale; moderately to poorly cemented; better cemented than wbss at chart 4 Grain size, cementation: 350µ Bed thickness: 1.5m Structure Strike and dip of bedding: N5E 16NW; N1E 16NW; N2W 20NW Structural curvature (estimated): west limb nearer to southern end perhaps 2000m Faulting: Fault zone on north cliff face in thick-bedded sandstone; seen at a distance on leaving outcrop
Set A
Fracture Characteristics Type, Orientation: Set A: average strike N5E, mineralized bed normal fractures, evidenced in thin section. Set B: cross fractures; average strike N80W
Set B N6E N5E 72SE N2E 73SE N3E 74SE N12E N8E N8E N8E N5E N15E N12E N8E N12E N6E N5E N6E N10E 69SE N7E 82SE N15E 80SE N5E 75SE
N80W 90 N85W N80W N78W 90 N78W 90 N80W N78W N80W N78W 90 N80W90
Spacing: Set A: two scan lines (29 fractures in 6m and 25 fractures in 4m) average of 5.4frac/m Set B; 10 fractures in 18m; 0.55frac/m Separation: none observed Mineralization: Resistant to erosion indicating mineralization. Type of mineralization could not be ascertained. Surface characteristics: Relative ages: Set A oldest Apertures: none

111
Deformation Bands (width): NA
Cha
rt 5
: Fra
ctur
e m
ap.

112
Chart #: 6 Plan and side views Location: NE1/4 NW1/4 Sec 22 T38N R78W Lithology: Unit 4: carbonaceous shale Grain size, cementation: very fine-grained Bed thickness: 2m of thinly laminated carbonaceous shale (1-2mm) Structure Strike and dip of bedding: approximately N23W 10SE Structural curvature (estimated): 2000m Faulting:
Set A
Fracture Characteristics Type and Orientation: Cleats in carbonaceous shale, bed normal. Set A: average N18W
Set B Set C N15W 53NE N18W 60NE N20W58NE N18W N8W N18W 56NE N18W 56NE N15W N12W N5W 75SW
N58E 62NW N60E 66NW N52E 65NW N55E 65NW N55E 65NW N55E 65NW N50E 90 N46E 70NW N50E 70NW N50E 70NW N65E 60SW N60E 60SW N75E 90 N70E 90 N70E 74 SW
N37W 65NE N50W 90
Spacing: Set A 30cm average spacing; Set B spacing 5-20cm, average 10cm Separation: Mineralization: Iron staining along Set A Surface characteristics: Relative ages: Set A older Apertures: 1 aperture, 1cm wide Deformation Bands (width):

113
Chart #: 7 Plan and side views Location: NE1/4 NW1/4 Sec 22 T38N R78W Lithology: Unit 2: beach sandstone, 5m above interbedded unit Grain size, cementation: 100-175µ, moderately cemented, calcite; note – bed 1/2m directly above this unit is less well cemented and displays fewer fractures Bed thickness: .8m-1m (3x8m area) Structure Strike and dip of bedding: N15W 12SW; N20W 15SW Structural curvature (estimated): 1500m Faulting:
Set A
Fracture Characteristics Type, Orientation: Set A: TNF bed normal. Set B: XF
Set B N15E N10E N10E N10E N11E N3E N5W N5W N5W N10W N2W N15W N3W N28W N28W N28W
N72W N85E N88W N85E N80E N80E N80E N88E N60E N60E
Spacing: cm; 15,20,30,15,25,20,20,20,5,5,5 (last three measurements are a small fracture swarm). Measurements at this locality are a combination of fracture sets A and B. Separation: None Mineralization: none Surface characteristics: Fractures are eroded/weathered (negative relief) Relative ages: Set A older Apertures: erosional apertures only. Deformation Bands (width): Some deformation bands in less consolidated unit above this measured bed.
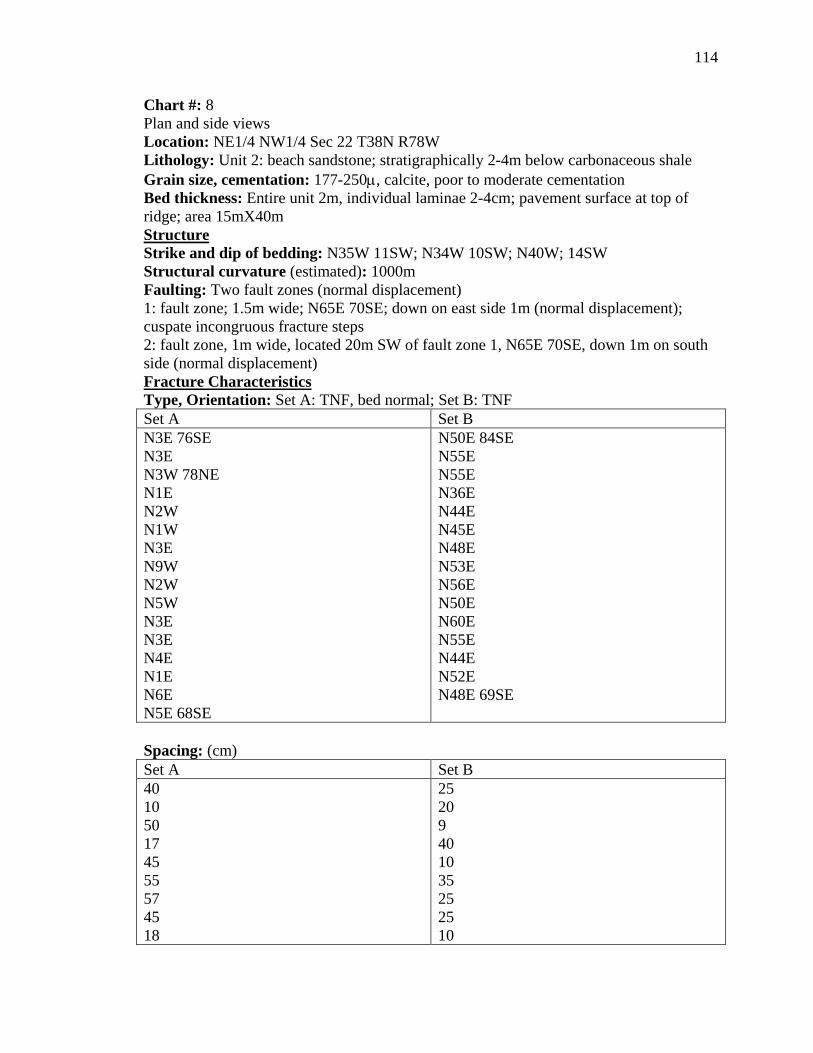
114
Chart #: 8 Plan and side views Location: NE1/4 NW1/4 Sec 22 T38N R78W Lithology: Unit 2: beach sandstone; stratigraphically 2-4m below carbonaceous shale Grain size, cementation: 177-250µ, calcite, poor to moderate cementation Bed thickness: Entire unit 2m, individual laminae 2-4cm; pavement surface at top of ridge; area 15mX40m Structure Strike and dip of bedding: N35W 11SW; N34W 10SW; N40W; 14SW Structural curvature (estimated): 1000m Faulting: Two fault zones (normal displacement) 1: fault zone; 1.5m wide; N65E 70SE; down on east side 1m (normal displacement); cuspate incongruous fracture steps 2: fault zone, 1m wide, located 20m SW of fault zone 1, N65E 70SE, down 1m on south side (normal displacement)
Set A
Fracture Characteristics Type, Orientation: Set A: TNF, bed normal; Set B: TNF
Set B N3E 76SE N3E N3W 78NE N1E N2W N1W N3E N9W N2W N5W N3E N3E N4E N1E N6E N5E 68SE
N50E 84SE N55E N55E N36E N44E N45E N48E N53E N56E N50E N60E N55E N44E N52E N48E 69SE
Spacing: (cm) Set A Set B 40 10 50 17 45 55 57 45 18
25 20 9 40 10 35 25 25 10
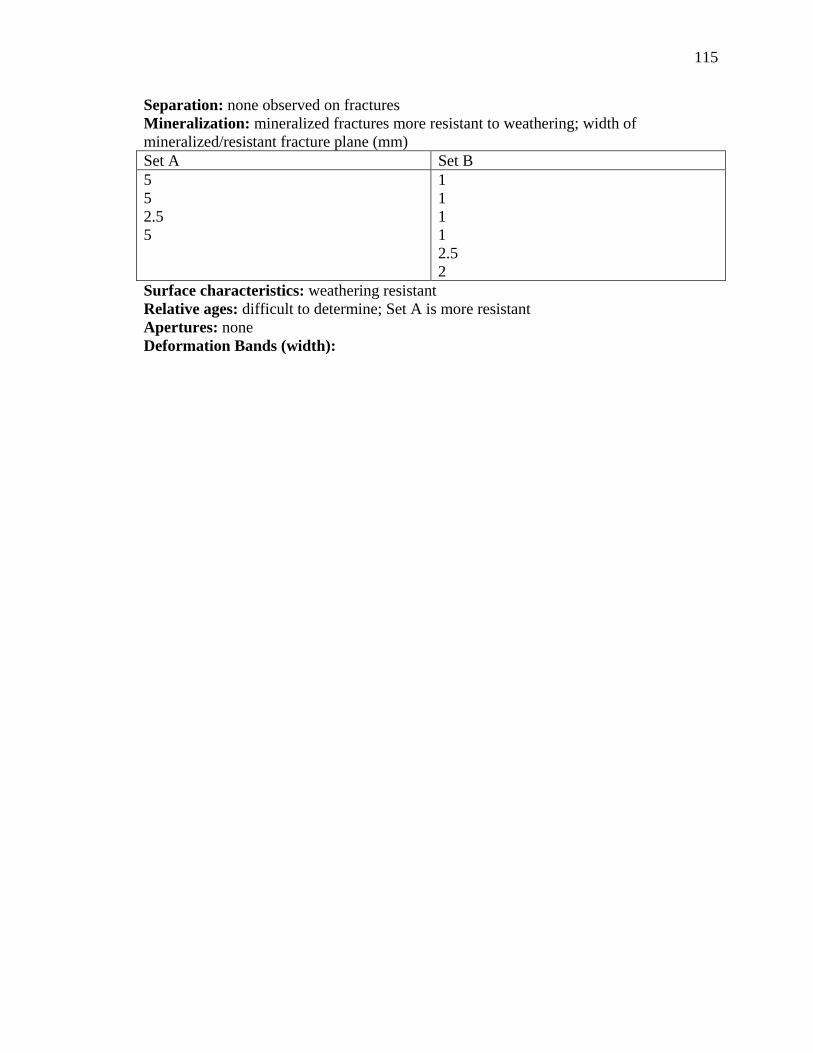
115
Separation: none observed on fractures Mineralization: mineralized fractures more resistant to weathering; width of mineralized/resistant fracture plane (mm) Set A Set B 5 5 2.5 5
1 1 1 1 2.5 2
Surface characteristics: weathering resistant Relative ages: difficult to determine; Set A is more resistant Apertures: none Deformation Bands (width):

116
Chart 8: Fracture map.

117
Chart #: 9 Plan and side views Location: SE1/4 SE1/4 Sec 9 T38N R78W Lithology: Unit 1: Interbedded marine sandstone and shale; numerous trace fossils; 5m thick shale above this unit, 2m thick shale below this unit Grain size, cementation: 62-88µ; moderately to well cemented (calcite, siderite) Bed thickness: 7cm, area 2x5m Structure Strike and dip of bedding: N3W 24SW; N3W 24SW Structural curvature (estimated): Faulting:
Set A
Fracture Characteristics Type, Orientation: Set A: TNF bed normal; Set B: TNF bed normal
Set B N84W 90 N84W 90 N85E 88SW N87W 88NE N87W N87E 90 N88W 88NE N86W
N3E 80SW N5E 81SW N1W 82NE N8W 80NE N3W N2E 82SW N5E N1E80SW N2E N8W N20W N2E
Spacing: (cm) Set A Set B 9 2 8 10 4 3 3 8
34 11 12 22 16 13 20
Separation: none observed Mineralization: calcite fills 80% of both fracture sets Surface characteristics: calcite filled Relative ages: Set A older Apertures: (mm) 2,2,1,2,1,2 Deformation Bands (width): NA
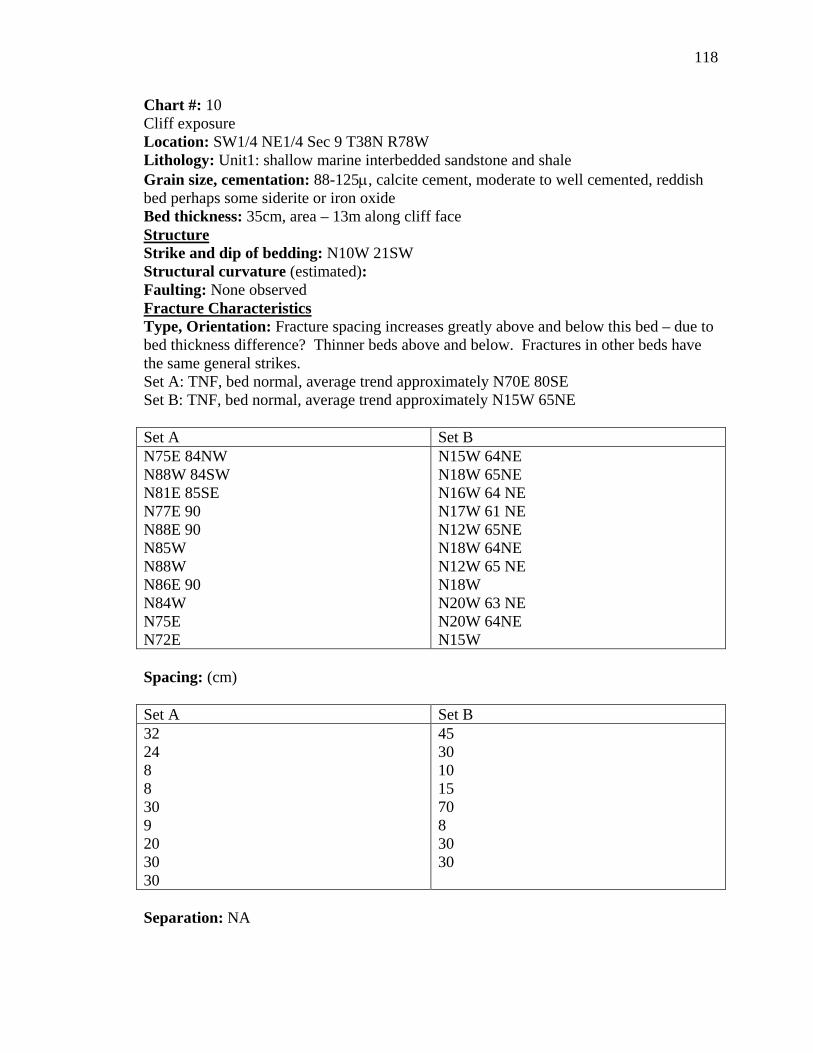
118
Chart #: 10 Cliff exposure Location: SW1/4 NE1/4 Sec 9 T38N R78W Lithology: Unit1: shallow marine interbedded sandstone and shale Grain size, cementation: 88-125µ, calcite cement, moderate to well cemented, reddish bed perhaps some siderite or iron oxide Bed thickness: 35cm, area – 13m along cliff face Structure Strike and dip of bedding: N10W 21SW Structural curvature (estimated): Faulting: None observed
Set A
Fracture Characteristics Type, Orientation: Fracture spacing increases greatly above and below this bed – due to bed thickness difference? Thinner beds above and below. Fractures in other beds have the same general strikes. Set A: TNF, bed normal, average trend approximately N70E 80SE Set B: TNF, bed normal, average trend approximately N15W 65NE
Set B N75E 84NW N88W 84SW N81E 85SE N77E 90 N88E 90 N85W N88W N86E 90 N84W N75E N72E
N15W 64NE N18W 65NE N16W 64 NE N17W 61 NE N12W 65NE N18W 64NE N12W 65 NE N18W N20W 63 NE N20W 64NE N15W
Spacing: (cm) Set A Set B 32 24 8 8 30 9 20 30 30
45 30 10 15 70 8 30 30
Separation: NA

119
Mineralization: Mineralized on fracture surfaces. Both fracture sets are mineralized. 1. euhedral calcite crystals 2. Tabular white crystals (does not react with HCl) possibly gypsum or anhydrite 3. black to very dark red cubic crystals (1mm x 1mm x 1mm) hard, pyrite in center 4. Manganese dendrites Surface characteristics: some rib and plumose structures indicating fracture propagation both into and out of cliff along both fracture sets Relative ages: With cliff face exposure age relationship is difficult to determine. Apertures: Set A; 1-3mm, 2mm average, 1 aperture is 2cm – this could be recent. Set B; 0-1mmm 2mm average, 1 aperture is 1cm – this could be recent. Deformation Bands (width): NA

120
Chart #: 11 Plan and side views Location: NW 1/4 SE 1/4 Sec 9 T38N R78W Lithology: Unit 5: Reddish/brown, fluvial sandstone, siderite-enriched lens. Grain size, cementation: 88-125µ, moderate to well cemented, siderite Bed thickness: 18cm, area – 10m X 6m Structure Strike and dip of bedding: N5E 23NW N5E 23NW Structural curvature (estimated): west limb, curvature not apparent Faulting: larger scale faulting not apparent
Set A
Fracture Characteristics Type, Orientation: Set A: TNF, N55W, 90o dip – some curvature in a few (8 approx.) of these, not all are completely through going. Fractures do not continue in less cemented sandstone underneath. Set B: XF, N12E, somewhat oblique to fracture set A. Fractures continue into underlying sandstone
Set B N70W Near vertical dips N65W N50W N60W N62W N52W N62W N52W N70W N60W N63W N67W N55W N70W N65W N72W
N11E 62SE N12E 62SE N7E N9E 58SE N28E N10E N15E N10E
Spacing: (cm) Set A Set B 27 26 40 32 21 20 15 5
95 105 50 100
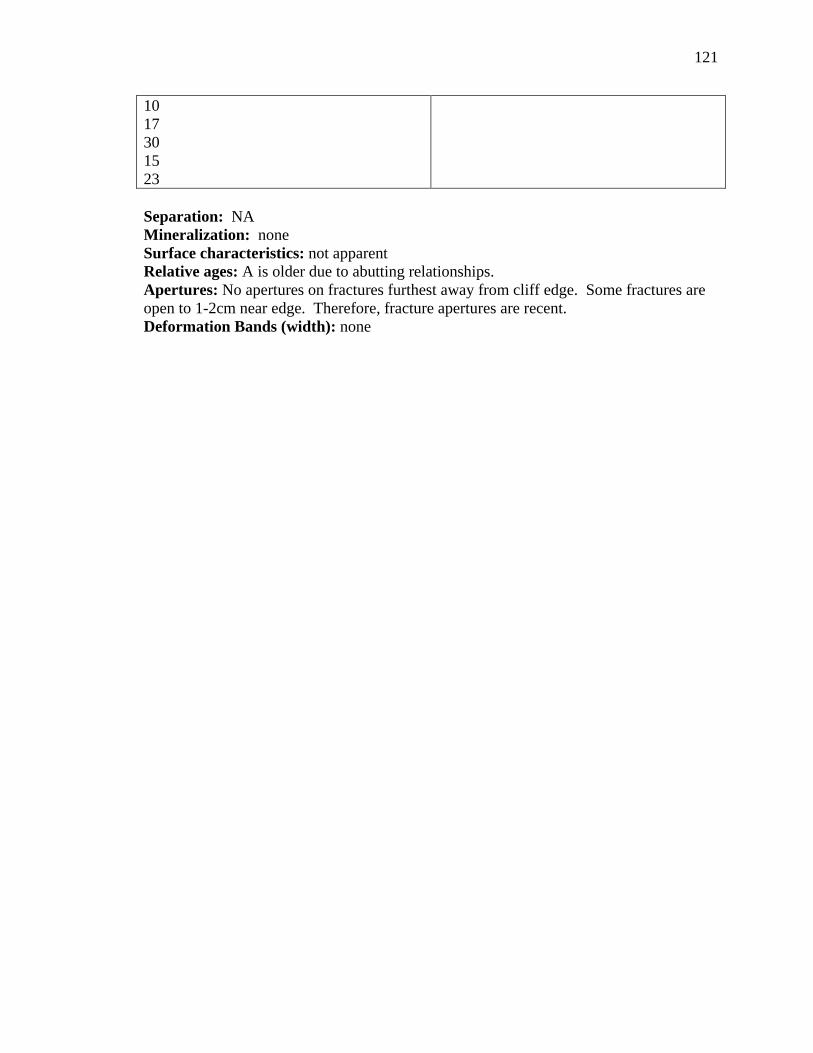
121
10 17 30 15 23 Separation: NA Mineralization: none Surface characteristics: not apparent Relative ages: A is older due to abutting relationships. Apertures: No apertures on fractures furthest away from cliff edge. Some fractures are open to 1-2cm near edge. Therefore, fracture apertures are recent. Deformation Bands (width): none

122
Chart #: 12 Plan and side views Location: NW1/4 SE1/4 Sec 9 38N R78W Lithology: Unit 5: Light brown fluvial sandstone in carbonaceous shale unit. Grain size, cementation: 125-177µ , poor to moderate cementation, very little cementation Bed thickness: 1m – dark (black) carbonaceous shale directly underneath sandstone bed Structure Strike and dip of bedding: N2W 22SE; N1E 24NW Structural curvature (estimated): west limb, curvature not apparent Faulting: no larger scale faulting observed
Set A
Fracture Characteristics Type, Orientation: Set A: TNF, bed normal, N15W 62NE Set B: XF, N85E, vertical
Set B N5W bed normal N10W 68NE N5W bed normal N5W N6W bed normal N9W N12W N10W N16W bed normal N8W 62NE bed normal
N83E vertical N76E N78E N82E N83E N87E N68E N75E N73E N72E
Spacing: (cm) Set A Set B 60 30 45 20 35 20 25 19 65
120 70 90 60 60 70 85 110 37
Separation: not apparent Mineralization: none Surface characteristics: not apparent Relative ages: Set A is older. Apertures: Open approaching outcrop edge. No apertures going into hillside (down dip direction). Deformation Bands (width): NA

123
Chart #: 13 Plan and side views Location: NW1/4 SE1/4 Sec 9 T38N R78W Lithology: Unit 1: Interbedded sandstone and shale. Bed directly overlying this sandstone bed is shale. Sandstone above is approximately 8m thick, the base of which exhibits sedimentary loading features. Grain size, cementation: 175-177µ, moderate to poor cementation (very little calcite) Bed thickness: 1 to 1.4m, area – 30m of cliff exposure Structure Strike and dip of bedding: N1W 23SW; N3W 21SW Structural curvature (estimated): west limb, curvature not apparent Faulting: No large scale faulting observed. Note inferred fault through pond and valley to the south. NE1/4 Sec 16
Set A
Fracture Characteristics Type, Orientation: Set A: TNF, N3W 46NE. Set B: XF, N89W 60NE
Set B N5W 45NE N14W 46NE N17W 45NE N4W 46NE N14W 57NE N1W 47NE N3W 49NE N4W 53NE N0 54E
N64E 82NW N82W 60NE N89W 59NE N89E 72NW N88W 81NE N88E 84NW N87E 59SE Other (cross fractures) N35W 45E N56E 81SE
Spacing: (cm) Set A Set B 80 35 65 40 80 60 55
90 29 70 180 130 60 60
Separation: Set A; N3W 46NE down 1cm NE Mineralization: none – apertures generally filled with shale/clay Surface characteristics: Somewhat conchoidal on some surfaces (Set B) to smooth Relative ages: Set B – does not have direct extension into cliff face and are therefore younger. (They do not cut Set A.) Apertures: Set A – apertures common from 0-1cm (0.3cm average) and are filled with clay/shale. Not mineralized. Set B - undetermined Deformation Bands (width): NA

124
Chart #: 14 Plan and side views Location: SW1/4 NE1/4 Sec 9 T38N R78W Lithology: Unit 2: Pavement in beach sandstone, light reddish brown. White poorly cemented beach sandstone directly on top of this pavement. One deformation band, N70E 90o, in the light colored sandstone. Grain size, cementation: average 125-177µ, some grains 177-250 (10%), moderate to well-cemented (lots of calcite, probably some siderite (reddish color)) Bed thickness: 10cm overall – this bed is thinly laminated with laminae width varying 3½ cm, 2cm, 4½ cm, some are thinner laminae - 0.5–1cm Structure Strike and dip of bedding: N11W 26SW; N14W 22SW Structural curvature (estimated): west limb curvature not apparent Faulting: Possible larger scale fault through valley and Conley Res. separating the limbs.
Set A
Fracture Characteristics Type, Orientation: Set A: VEF (TNF) bed normal – a) N10W 68NE, bed normal, b) N24W 62NE, bed normal. Set B: oblique XF (TNF?), N62W dip vertical to 85NE.
Set B N1W bed normal N4W bed normal N8W 68NE N22W 66NE N20W 66NE N5W bed normal
N60W 90 N62W 88NE N62W N62W N63W N68W N63W N68W N65W N62W N62W
Spacing: (cm) Set A Set B 55 45 102
30 33 19 30 34 49 14 18
Note: Spacing appears to increase down dip – limited exposure to prove this, but is suggestive. Separation: Offset undetermined. Mineralization: none

125
Surface characteristics: Some Set B fractures have an en echelon pattern. Some Set B fractures turn parallel to Set A at intersection. Some Set B fractures curve to intersect Set A at a 90o angle. See drawing. Relative ages: Set A is older due to the abutting relationship. Apertures: 0-0.5cm apertures decrease to 0cm with distance from edge of outcrop (to west) down dip. Deformation Bands (width): 2m in white sandstone, NA to pavement.
Cha
rt 1
4: fr
actu
re m
ap

126
Chart #: 15 Plan view Location: SW1/4 NE1/4 Sec 9 T38N R38W Lithology: Unit 2: Dark reddish brown – iron (siderite)-enriched enriched zone in upper layer of beach sandstone. Grain size, cementation: generally 125-177µ, approximately 20% 177-259µ; well cemented Bed thickness: 10cm (white beach sandstone above this bed), area – 10m X 3m, irregular, caps whitish beach sandstone, isolated Structure Strike and dip of bedding: N13W 24SE N14W 27SE Structural curvature (estimated): west limb, curvature not apparent Faulting: Not observed (large scale)
Set A
Fracture Characteristics Type, Orientation: Set A: TNF (VE). Set B: XF (oblique). Set C: other.
Set B Set C N26E 55SE N45E 65SE N42E N36E 54SE N50E 53SE N40E 59SE N36E 50SE N35E N33E 64SE N33E N36E 61SE
N60W 90 N63W 88SW N60W 90 N64W N64W N60W N55W 90 N55W N63W N60W
N4W 76NE bed normal N4W 76NE bed normal
Spacing: (cm) Set A Set B Set C 82 28 28 55 32 45 25 18 29 25
20 28 23 150 55 20 10 15 20 100 40
Separation: not observed Mineralization: none
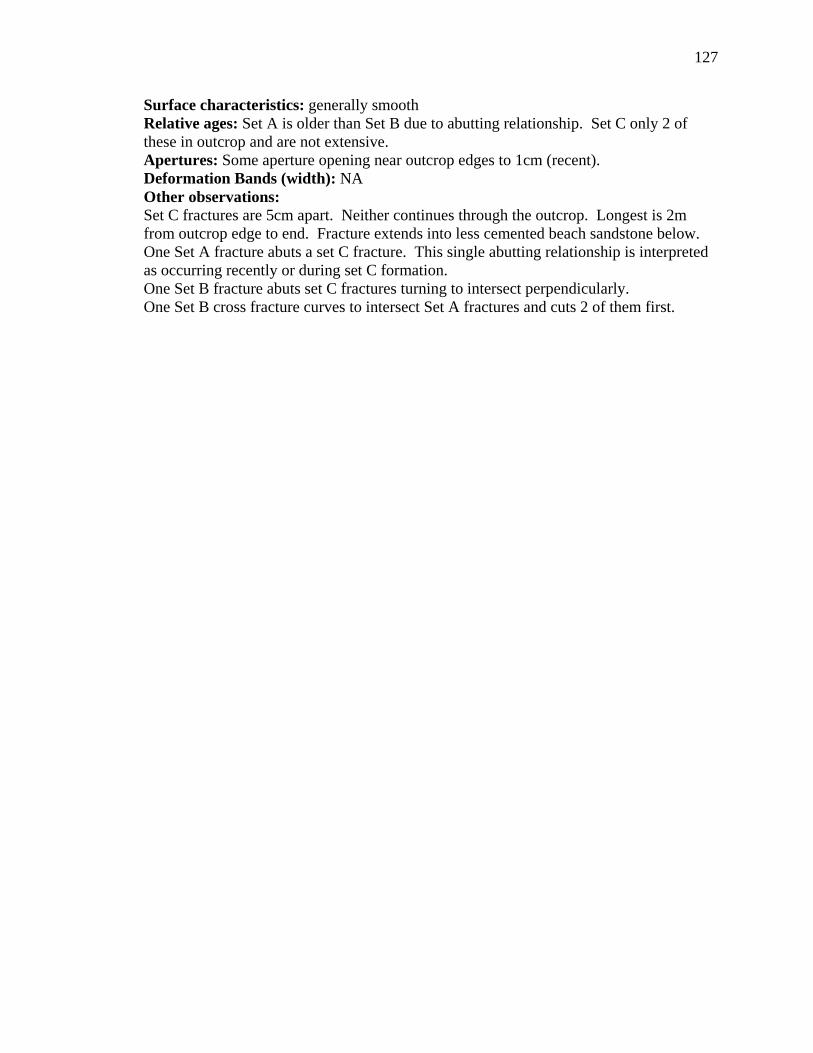
127
Surface characteristics: generally smooth Relative ages: Set A is older than Set B due to abutting relationship. Set C only 2 of these in outcrop and are not extensive. Apertures: Some aperture opening near outcrop edges to 1cm (recent). Deformation Bands (width): NA Other observations: Set C fractures are 5cm apart. Neither continues through the outcrop. Longest is 2m from outcrop edge to end. Fracture extends into less cemented beach sandstone below. One Set A fracture abuts a set C fracture. This single abutting relationship is interpreted as occurring recently or during set C formation. One Set B fracture abuts set C fractures turning to intersect perpendicularly. One Set B cross fracture curves to intersect Set A fractures and cuts 2 of them first.

128
Chart #: 16 Side view Location: NW1/4 SW1/4 Sec 9 T38N R78W Lithology: Unit 1: thin-bedded shallow marine sandstone with some ripple marks and trace fossil evidence, light brown Grain size, cementation: 66-88µ, fine grained, moderate calcite cementation Bed thickness: 30cm overall – individual beds (laminae) ½ cm – 4cm; ½ - 1cm average, area – 0.5m (enters under shale) X 15m, continues around nose of ridge to N. Structure Strike and dip of bedding: Broken blocks may have shifted due to shales above and below. Therefore, these may not be highly accurate. N47W 11SW; N50W 15SW; N48W 10SW Structural curvature (estimated): 500m radius Faulting: Large-scale (probable) N-S through bottom of draw and South terminal
Set B
Fracture Characteristics Type, Orientation: Set A: TNF, N85W 85SW. Set B: TNF, N5W 68NE.
Set A N85W 85SW N74W N80W N75W N82W vertical N79W N80W vertical N79W 87NE N88W 90 N64W 90
N5W 68NE N8W N5E N3E N4E 77SE N1E 81SE N7E 81SE N7E 73SE N10W 72SE N6E N4W 78NE N4W
* Due to differential weathering of laminae dips hard to obtain. Spacing: (cm) Set B Set A 30 30 40 30 70 30 20
35 35 25 70 30 60
* Spacing hard to measure due to infilling (alluvial cover) around blocks. Separation: Hard to evaluate with silty shales filling most apertures.

129
Mineralization: Loose slabs have iron (Fe) staining 3cm into matrix from the fracture surface. Surface characteristics: Rough – some laminae are more resistant than others are. No fracture surface characteristics. Relative ages: Very hard to determine, but it appears that some Set B fractures terminate against Set A. Therefore, Set A older. Apertures: 0-8cm – sandy brown shales from above and below fill apertures. Therefore, apertures may have widened recently. Deformation Bands (width): NA

130
Chart #: 17 Plan view. 100m SW of Chart 16. Location: NE1/4 SE1/4 Sec 22 T38N R78W Lithology: Unit 2: Base of beach sandstone (Kmv), medium tan/brown beach sandstone Grain size, cementation: 177-250µ, moderate cementation Bed thickness: 1 ½ m – unit below light tan, poorly cemented sandstone (Kmv beach sandstone). Unit above light tan poorly cemented – some iron cemented trace fossils. Area – 20m X 30m Structure Strike and dip of bedding: N52W 9SW; N90W 8S; N60W 9SW * Cross beds make finding true strike and dip surface difficult. Structural curvature (estimated): 200m R Faulting: One large-scale fault observed on east-facing cliff to west of this outcrop across draw. Appears to be 1-1 ½ m offset down on N side into anticline.
Set A
Fracture Characteristics Type, Orientation: Set A: TNF, N10W 81NE bed normal*. Set B: TNF, N55E 86SE*. Set C: XF, N70W vertical*. Set D: XF, N24W vertical*. * one example of each – not an average.
Set B Set C Set D N10W 81NE N8W 90 N2W 88NE N2E 88SE N5W 85NE N9W 83NE N8W 85NE N4E 82SE N8W 86NE N10W 75NE N8W N8W
N55E 86SE N50E 88NW N55E 78SE N50E 86SE N50E 90 N52E N56E N50E
N70W vertical N80W N55W N75W N89W
N24W vertical N10W N20W N28W
Spacing: (cm) Set A Set B Set C Set D Extensive throughout outcrop 45 20 10 40 10 12 5 10
Swarms of 2 or 3 every 2m
Closely spaced 5-30cm, average is 20
Closely spaced 5-30cm, average is 20

131
40 10 30 20 Separation: Mineralization: none Surface characteristics: Relative ages: Cross fractures are younger. Set A younger than Set B (but highly speculative). Apertures: apertures to 1cm - more at outcrop edges Deformation Bands (width): Other observations: This is a very confusing outcrop, with possibly 2 TNF and XF sets. Some of XF curve to intersect TFN perpendicularly. Some of the fracture curving may be due to siderite nodules.
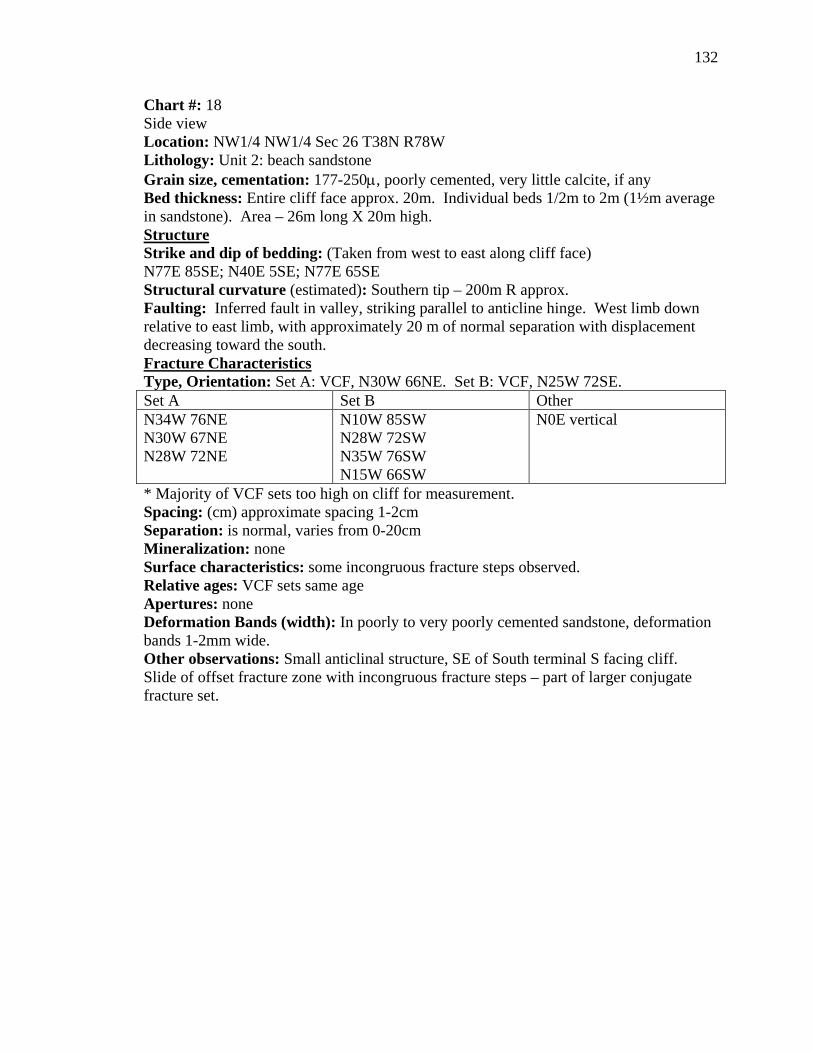
132
Chart #: 18 Side view Location: NW1/4 NW1/4 Sec 26 T38N R78W Lithology: Unit 2: beach sandstone Grain size, cementation: 177-250µ, poorly cemented, very little calcite, if any Bed thickness: Entire cliff face approx. 20m. Individual beds 1/2m to 2m (1½m average in sandstone). Area – 26m long X 20m high. Structure Strike and dip of bedding: (Taken from west to east along cliff face) N77E 85SE; N40E 5SE; N77E 65SE Structural curvature (estimated): Southern tip – 200m R approx. Faulting: Inferred fault in valley, striking parallel to anticline hinge. West limb down relative to east limb, with approximately 20 m of normal separation with displacement decreasing toward the south.
Set A
Fracture Characteristics Type, Orientation: Set A: VCF, N30W 66NE. Set B: VCF, N25W 72SE.
Set B Other N34W 76NE N30W 67NE N28W 72NE
N10W 85SW N28W 72SW N35W 76SW N15W 66SW
N0E vertical
* Majority of VCF sets too high on cliff for measurement. Spacing: (cm) approximate spacing 1-2cm Separation: is normal, varies from 0-20cm Mineralization: none Surface characteristics: some incongruous fracture steps observed. Relative ages: VCF sets same age Apertures: none Deformation Bands (width): In poorly to very poorly cemented sandstone, deformation bands 1-2mm wide. Other observations: Small anticlinal structure, SE of South terminal S facing cliff. Slide of offset fracture zone with incongruous fracture steps – part of larger conjugate fracture set.
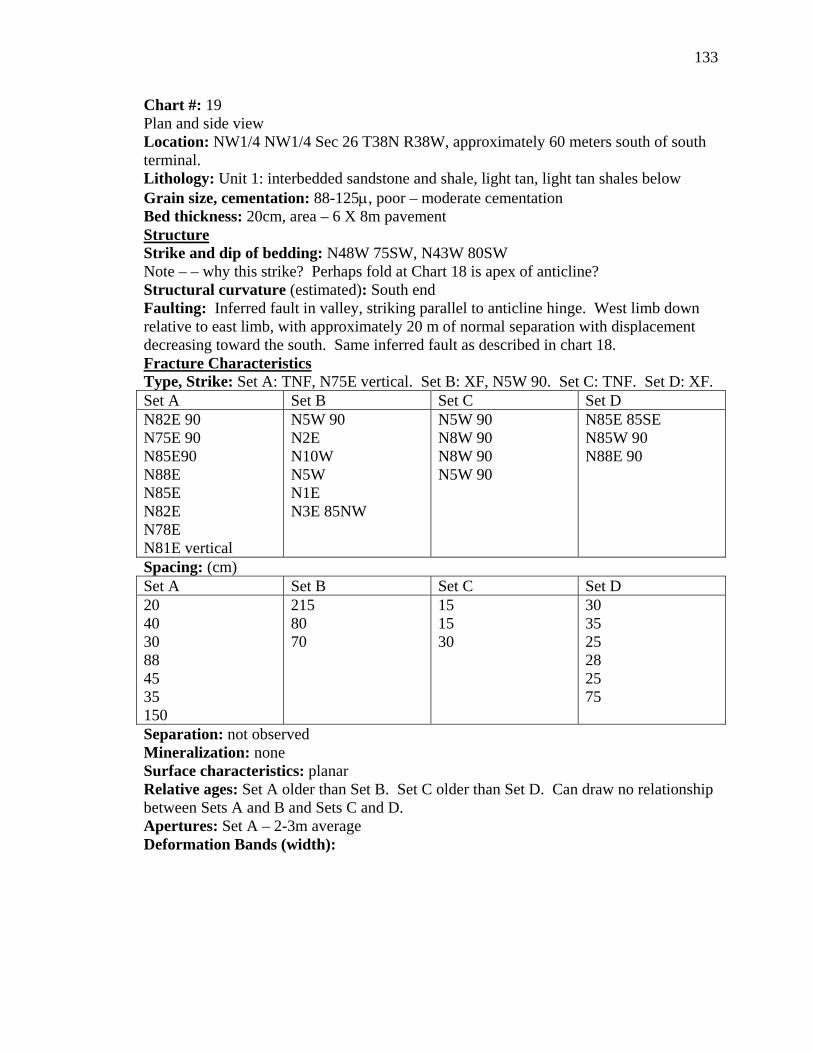
133
Chart #: 19 Plan and side view Location: NW1/4 NW1/4 Sec 26 T38N R38W, approximately 60 meters south of south terminal. Lithology: Unit 1: interbedded sandstone and shale, light tan, light tan shales below Grain size, cementation: 88-125µ, poor – moderate cementation Bed thickness: 20cm, area – 6 X 8m pavement Structure Strike and dip of bedding: N48W 75SW, N43W 80SW Note – – why this strike? Perhaps fold at Chart 18 is apex of anticline? Structural curvature (estimated): South end Faulting: Inferred fault in valley, striking parallel to anticline hinge. West limb down relative to east limb, with approximately 20 m of normal separation with displacement decreasing toward the south. Same inferred fault as described in chart 18.
Set A
Fracture Characteristics Type, Strike: Set A: TNF, N75E vertical. Set B: XF, N5W 90. Set C: TNF. Set D: XF.
Set B Set C Set D N82E 90 N75E 90 N85E90 N88E N85E N82E N78E N81E vertical
N5W 90 N2E N10W N5W N1E N3E 85NW
N5W 90 N8W 90 N8W 90 N5W 90
N85E 85SE N85W 90 N88E 90
Spacing: (cm) Set A Set B Set C Set D 20 40 30 88 45 35 150
215 80 70
15 15 30
30 35 25 28 25 75
Separation: not observed Mineralization: none Surface characteristics: planar Relative ages: Set A older than Set B. Set C older than Set D. Can draw no relationship between Sets A and B and Sets C and D. Apertures: Set A – 2-3m average Deformation Bands (width):

134
Chart #: 20 Plan and side views Location: NW1/4 NW1/4 Sec 26 T38N R78W Lithology: Unit 1: interbedded sandstone and shale Grain size, cementation: fine grained sandstone 62-88µ, poor to moderate cementation Bed thickness: 25cm in bed where most readings were taken, area – approximately 26m long X 4m wide (average) X 10m high Structure Strike and dip of bedding: N45W 7SW; N55W 5SW Structural curvature (estimated): 100m Faulting: Fault bounded. This is assumed to be a fault sliver – view to south. From this view, axis of anticline could be to east of valley near charts 18 and 19. This is interpreted to be part of the inferred fault as described in charts 18 and 19.
Set A
Fracture Characteristics Type, Orientation: Set A: TNF. Set B: XF. Location I: The fracture set A is expressed as the cliff face on SW side of this block.
Set B N20W N18W N24W 85SE
N85E vertical N68E
Location II: Siderite enriched pavement 10m north of previous measurements and 4m down Set A Set B N8W 72NE N18W 76NE N15W 76NE N15W
N75E vertical N85E N78E N85E N70W N82E N80E
Spacing: (cm) Location I: Set A: 20cm. Set B: 30cm. Location II: Set A Set B 25 45 35 39
90 35 43 39 35 30
Separation: 0-10cm down west, normal movement Mineralization: NA Surface characteristics: rough to planar Relative ages: Apertures: Deformation Bands (width): NA

135
Chart #: 21 Plan view Location: NE1/4 SE1/4 Sec 22 T38N R78W Lithology: Unit 3: white to very light tan, beach sandstone, numerous cross-beds (very rounded, eroded surface) Grain size, cementation: 80% 177-250µ, 20 % 250-350µ, very poorly to poorly cemented Bed thickness: 3m approx., area – 10 X 15m Structure Strike and dip of bedding: N35W 5SW* ; N40W 13SW* * Due to cross bedding, strike and dip are difficult to obtain with accuracy. Structural curvature (estimated): 300m approximate Faulting: One of the deformation bands in a better cemented reddish overlying bed has 6cm normal separation down on NE. No larger scale faulting observed.
Set A
Fracture Characteristics Type, Orientation: Set A: deformation bands. Set B: deformation bands
Set B N2W 90 N1W 69NE N5W N6W N2E 63NW N3W N3W 88NE N8W N4W 66NE N2W 90 N8W 64NE N6E N7W
N55E N55E N54E 77SE
Spacing: (cm) Set A: spacing of clusters – average 2m between clusters - see drawings Set B: spacing 80 and 90 cm. Few other cross fractures in exposure. Therefore, larger spacing than number has shown. Separation: One band 6cm normal offset, down on NE, see faulting data above. Mineralization: NA Surface characteristics: not observed Relative ages: Set A is older. Apertures: none Deformation Bands (width): (mm) 1-2mm average 1, 2, 4, 2, 1, 3, 1, 2

136
Cha
rt 2
1: M
ap o
f set
A d
efor
mat
ion
band
clu
ster
s.
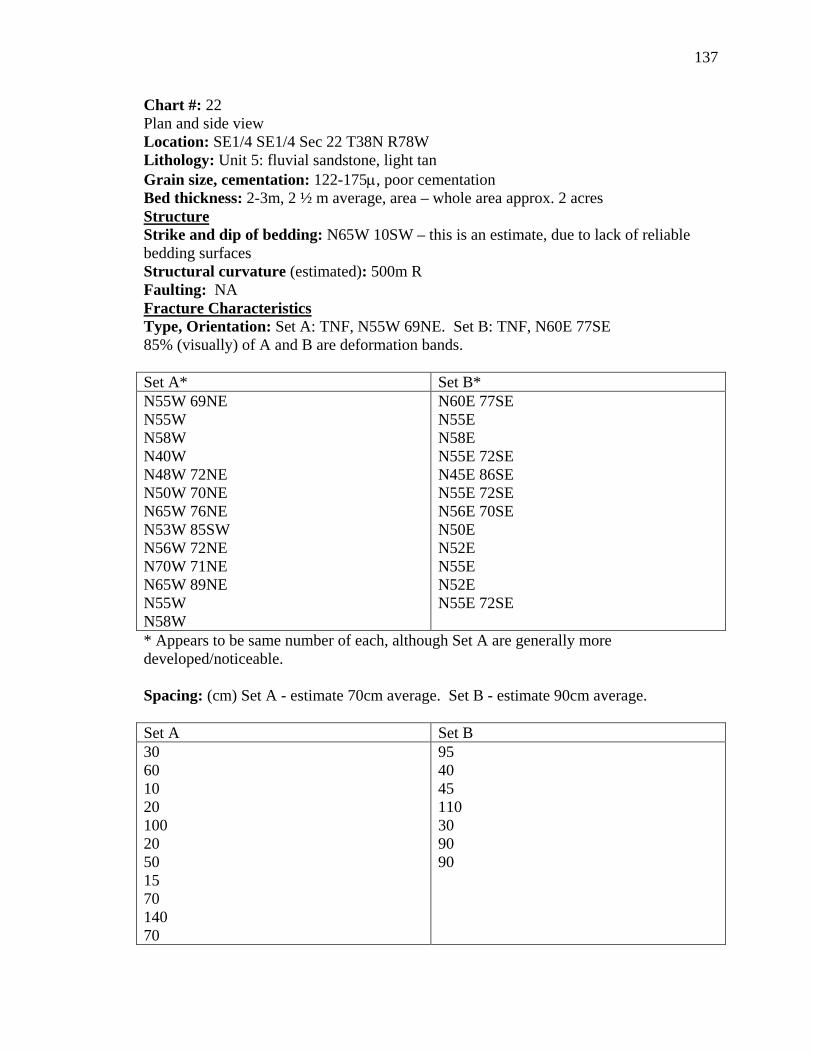
137
Chart #: 22 Plan and side view Location: SE1/4 SE1/4 Sec 22 T38N R78W Lithology: Unit 5: fluvial sandstone, light tan Grain size, cementation: 122-175µ, poor cementation Bed thickness: 2-3m, 2 ½ m average, area – whole area approx. 2 acres Structure Strike and dip of bedding: N65W 10SW – this is an estimate, due to lack of reliable bedding surfaces Structural curvature (estimated): 500m R Faulting: NA
Set A*
Fracture Characteristics Type, Orientation: Set A: TNF, N55W 69NE. Set B: TNF, N60E 77SE 85% (visually) of A and B are deformation bands.
Set B* N55W 69NE N55W N58W N40W N48W 72NE N50W 70NE N65W 76NE N53W 85SW N56W 72NE N70W 71NE N65W 89NE N55W N58W
N60E 77SE N55E N58E N55E 72SE N45E 86SE N55E 72SE N56E 70SE N50E N52E N55E N52E N55E 72SE
* Appears to be same number of each, although Set A are generally more developed/noticeable. Spacing: (cm) Set A - estimate 70cm average. Set B - estimate 90cm average. Set A Set B 30 60 10 20 100 20 50 15 70 140 70
95 40 45 110 30 90 90
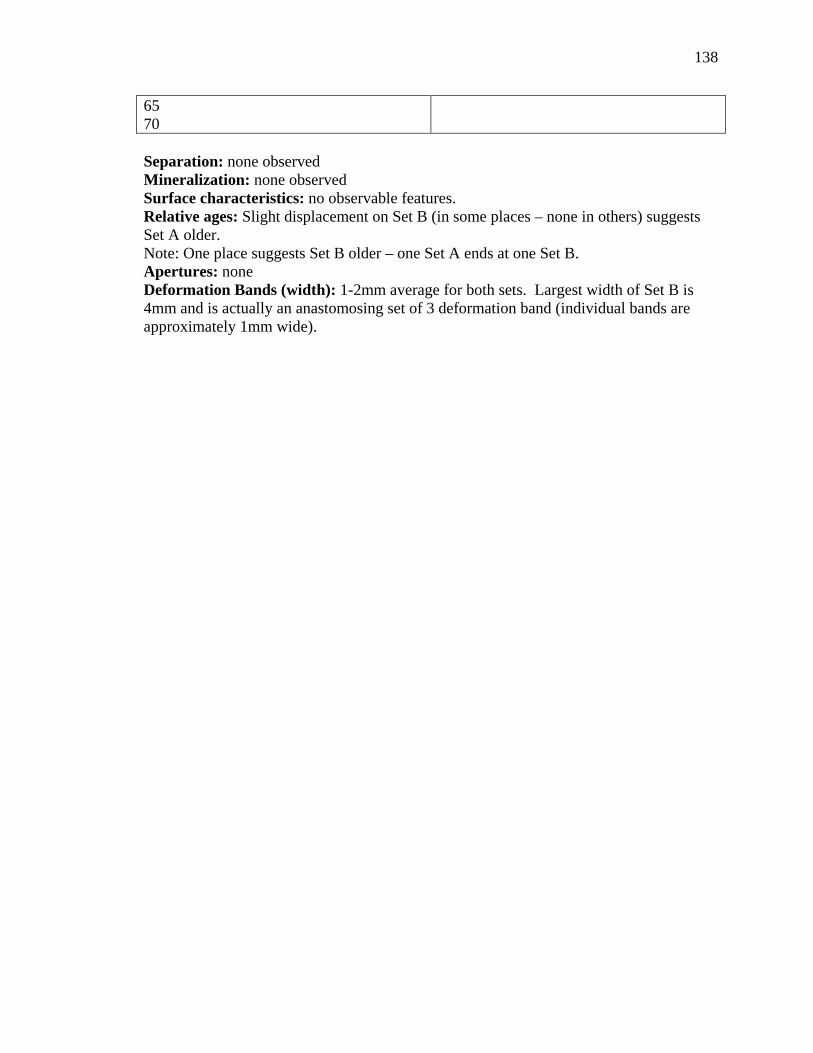
138
65 70 Separation: none observed Mineralization: none observed Surface characteristics: no observable features. Relative ages: Slight displacement on Set B (in some places – none in others) suggests Set A older. Note: One place suggests Set B older – one Set A ends at one Set B. Apertures: none Deformation Bands (width): 1-2mm average for both sets. Largest width of Set B is 4mm and is actually an anastomosing set of 3 deformation band (individual bands are approximately 1mm wide).

139
Chart #: 23 Plan view Location: SE1/4 SE1/4 Sec 22 T38N R78W Lithology: Unit 2: upper beach sandstone Grain size, cementation: 125-177µ, poorly to moderately cemented Bed thickness: 2m, area – 1 acre Structure Strike and dip of bedding: N64W 10SW Structural curvature (estimated): 250m Faulting:
Set A
Fracture Characteristics Type, Orientation: Set A: TNF, N5-10W 65NE. Set B: TNF, N55-60W 65NE. North to south traverse, fracture strike changes as follows/ all dips “appear” NE
Set B N10W N20W 70NE N30W N28W 62NE N20W N13W 64NE N5W 58NE N15W N12W
N50W 58NE N52W N40W N45W N50W 46NE N50W N70W N72W N60W
Spacing: (cm) very closely spaced, 5-10cm Separation: Not observed Mineralization: Surface characteristics: vertical slickensides north end Relative ages: Apertures: none Deformation Bands (width): Other observations: This is a very confusing area for me. Fractures appear to change strike with no overlapping or abutting relationships between the fracture sets. These fractures may be a pavement surface representation of a small scale fault that curves along strike or they could be two separate sets as shown above.

140
Chart #: 24 Location: SW1/4 SW1/4 Sec 23 T38N R78W Lithology: Unit 1: thin-bedded marine sandstone, may be equivalent unit to chart 16. Grain size, cementation: Fine-grained sandstone, 62-88µ, possible 10% 88-125µ, moderate cementation, calcite Bed thickness: 20cm, thick units of shale above and below – 5m above – total extent below unknown - at least 5m, area – 30m long X 2m wide Structure Strike and dip of bedding: N50W 10SW; N48W 8SW Structural curvature (estimated): 300m Faulting:
Set A
Fracture Characteristics Type, Orientation: Set A: TNF. Set B: TNF
Set B N72W 90 N69W 90 N70W 90 N71W 90 N62W 90 N70W86SW N70W 90 N70W 86SW N67W N80W N85W 90 N85E 90
N5W 85NE * N4W 81NE * N13W 78NE * N8W 85NE ** N10W 83NE ** N15W 83NE ** N10W N15W
* These are 10m north of measured Set A fractures – calcite mineralization on these 3 fracture surfaces, 1mm thick. ** spatially located with Set A fracture exposure – calcite mineralization, 1-2mm thick. Spacing: (cm) Set A Set B 49 57 52 110 100 47 10 65
25 (none for 1m either side – no exposure left in that area) 40 45 40 15 30 55
Separation: none observed Mineralization: Some calcite mineralization on fracture surfaces – suggesting open apertures. Calcite vein widths perpendicular to fracture surface; mineralization mainly on Set B. Crystals, in float, up to 3-4mm wide.

141
Surface characteristics: not apparent Relative ages: Set A is possibly older than Set B. Could not find an area to determine age relationship between Sets A and B – one area suggests Set A older than Set B, but is partially covered. Set A more prominent, especially at south end of exposure. Apertures: Set A – [8cm, 2cm, 4cm, 1cm – probably recent due to movement down slope.] [5mm, 3mm, 0,0] Set B – [0, 1mm, 2mm, 3mm, 2mm, 1cm] Deformation Bands (width): NA

142
Chart #: 25 Side view Location: NW1/4 NW1/4 Sec 23 T38N R78W Lithology: Unit 4: carbonaceous shale – just above beach sandstone contact Grain size, cementation: clay size, dark black carbonaceous shale, very poor cementation, very fissile Bed thickness: 1-1 ½ m, area – 25m long X 1m wide Structure Strike and dip of bedding: N42W 12SW Structural curvature (estimated): 150m R Faulting:
Set A
Fracture Characteristics Type, Orientation: very irregular, could not determine type
Set B Set C Set D N89W N75W 90 N75W 90 N85W 85SW N85E 65SE N70W 86NE N60W 85NE
N6W N2E 68SE N2W 72NE N5W 90 N8W 80NE N1W 74NE
N15E 55SE N45E 50NW N70E 75SE N65E
Magnitude of A to B – 3 :2; Set D is rare – 1 in 10; Set C is rarest – 1 in 30? Spacing: (cm) Set A: 20-40cm spacing with larger intervals – not uniformly found Set B: 5-10cm spacing with 8cm average, but not uniformly found Separation: unable to determine Mineralization: iron staining on 1/3 to 1/2 of surfaces Surface characteristics: Relative ages: unable to determine Apertures: possibly 1mm (this could be recent) Deformation Bands (width): NA

143
Chart #: 26 Plan and side views Location: NW1/4 NW1/4 Sec 26 T38N R78W Lithology: Unit 3: upper beach sandstone, cross-bedded Grain size, cementation: 125-177µ, poorly cemented Bed thickness: Measurements taken on a 1m thick cross-bed set. Total thickness here of sets approximately 15m. Area – 4m X 7m Structure Strike and dip of bedding: N45W 11SW Structural curvature (estimated): 100m R Faulting: Larger scale fault evidenced by displacement, across axis of anticline – from one limb to the other, of the beach sandstone. The deformed rock exposure 8m north of this site may be evidence for that fault.
Set A
Fracture Characteristics Type, Strike: Set A: systematic deformation bands – appear to become fractures in Fe enriched, better cemented beds below. Fractures have decreased spacing (20cm average) relative to deformation bands of set A. Set B: deformation bands, perpendicular to bedding, discontinuous.
Set B Other N7E 80SE N3W 78NE N2W 88NE N2W 78NE N3E 73SE N4E 78SE N8E 80SE N3E N8E 83SE N1E 72SE N6E 78SE
N45E 67SE N50E 58SE
N30E 70NW
Spacing: (cm) Fractures in a better cemented sandstone bed exhibits decreased spacing relative to the deformation bands. Set A – 45, 50, 78, 45, 39, 64, 50 cm Set B – 2 bands spaced 1m apart Separation: none observed Mineralization: none observed Surface characteristics: raised (resistant to erosion) deformation bands Relative ages: Set A is older. See drawing. Apertures: none Deformation Bands (width): Set A – 1mm, 2mm, 3mm, 4mm, 1mm, 2mm, 2mm Set B – 1mm, 3mm Other observations: General observation of fractures within Unit 2 (beach sandstones) near this area indicates that fractures generally strike north and dip to the east.

144
Chart 26: One example of abutting relationship.

145
Chart #: 27 Plan and side views Location: SW1/4 SE1/4 Sec 23 T38N R78W Lithology: Unit 1: interbedded sandstone and shale Grain size, cementation: Of the measured sandstone bed 90% of grains 88-125µ, and 10% of grains 125-177µ, moderate cementation at base, poor cementation toward top – possibly due to weathering, however some fractures do not continue into the more poorly cemented section, others cut through sandstone and shale above and below. Bed thickness: 1m, entire cliff at tallest point 6-7m, area – cliff face exposure approximately 15m long. Structure Strike and dip of bedding: Good bedding surfaces hard to find N60E 14SE; N50E 12SE Structural curvature (estimated): 400m R Faulting: One fault down 2cm, N25W 68NE, normal separation.
Set A
Fracture Characteristics Type, Orientation: Set A: TNF, N25W 68NE Set B: possible XF – not well exposed, N50E 70NW
Set B Other N25W 65NE N30W 75NE N28W 74NE N25W 68NE N25W 71NE N26W 64NE N26W 75NE N24W 81NE
N50E 70NW N40E 69NW N45E 82NW
N5E 81NW
Spacing: (cm) Set A: (measured E to W perpendicular to strike); 80, 90, 16, 15, 23, 94, 34 Set B: irregular, approx. 80cm – 1m Separation: Set A: see faulting Mineralization: Set A; calcite mineralization most generally filling apertures 1-2mm, calcite crystals up to 1cm on each fracture surface growing toward center Surface characteristics: Relative ages: Set A older Apertures: Set A – calcite filled generally 1-2mm, largest 2cm Set B – not observed Deformation Bands (width): NA

146
Chart #: 28 Plan and side views Location: NE1/4 SE1/4 Sec 23 T38N R78W Lithology: Unit 2: upper beach sandstone – fine cross bedding Grain size, cementation: 90% 88-125µ, 10% 125-177µ, poorly to mod cemented – some reddish color - Fe Bed thickness: 70 cm, area – 10m X 2m Structure Strike and dip of bedding: N42E 5SE – This is approximate due to poorly defined bedding planes. Structural curvature (estimated): 800m Faulting:
Set A
Fracture Characteristics Type, Orientation: Set A: TNF, N65W 78NE Set B: TNF, N25W 67NE
Set B N65W 78NE N25W 67NE
N30W N26W 77NE N35W 79NE N28W 74NE N60W 64NE N31W 78NE N26W 78NE N28W 85SW N25W 76NE N30W 86NE N30W 88SW N28W 78NE
Spacing: (cm) Set A; only 1 fracture Set B; 2 fracture zones 3m apart spacing 2-25cm within fracture zones – 15cm average. Fewer fractures in 2m thick very poorly cemented white sandstone underlying this bed, fracture spacing 50-100cm. Separation: One Set B fracture/fault [N25W 67NE] shows normal offset approximately 8cm down on east side Mineralization: none Surface characteristics: Relative ages: Set A oldest. Set B fractures curve to intersect the one Set A fracture. Intersections are perpendicular. Apertures: none Deformation Bands (width): NA

147
Chart #: 29 Plan and side views Location: NW1/4 NE1/4 Sec 26 T38NR78W Lithology: Unit 5: fluvial (splay) sandstone in carbonaceous shale unit. White color. Grain size, cementation: 62-88µ, very fine-grained, moderate cementation. Bed thickness: 70cm, area – 30m of total vertical side exposure and 20-30cm of pavement exposure. Structure Strike and dip of bedding: N55E 9SE; N60E 12 SE Structural curvature (estimated): 800m Faulting:
Set A – NE dip
Fracture Characteristics Type, Orientation: Set A: TNF and VCF, most fractures dip to NE, but some dip to SW 3 NE dipping fractures for every 2 SW dipping fractures. Set B: XF, few – possibly recent
Set A – SW dip Set B N28W 72NE N30W 71NE N31W 86NE N31W 71NE N34W 72NE N28W 79NE N31W 76NE N32W 75NE N29W 84NE N30W 78NE N34W 70NE N25W 72NE
N36W 79SW N32W74SW N34W 72SW N32W81SW N30W 73SW N33W 76SW N29W 75SW N34W 85SW
N50E 80 NW N70E 50NW
Spacing: (cm) Set A – NE dip Set A – SW dip 60 55 60 30 20 30 10 10 30 10 50 45 70
70 75 70 50 40 75 60 35

148
Separation: not able to determine Mineralization: Some fracture surfaces Fe stained (red) – some fractures continue into carbonaceous shale unit underneath with Fe staining perpendicular from fracture surface into carbonaceous shale – average 4cm of staining into carbonaceous shales. Surface characteristics: not clearly observed due to erosion. Relative ages: Set A older Apertures: (mm) 2, 2, 1, 5, 20, 6, 2, 0, 0, 0, 1, 2, 8, 10, 4 – average estimate 3mm – some apertures distinctly larger than average and interpreted to be recent. Deformation Bands (width): NA Other Observations: Shear component of this conjugate set undetermined.
Chart 29: Outcrop photograph illustrating conjugate nature of fracture set A.

149
Chart #: 30 Plan and side views Location: NW1/4 NE1/4 Sec 26 T38N R78W Lithology: Unit 1: interbedded marine Ss/Sh unit Grain size, cementation: Fine-grained sandstone, grains 88-125µ, moderate cementation, reddish color possibly due to Fe, area of exposure 15m X 3m. Bed thickness: 45cm Structure Strike and dip of bedding: N52E 5SE Structural curvature (estimated): 800m Faulting:
Set A
Fracture Characteristics Type, Orientation: Set A: TNF, major through-going set. Set B: XF
Set B N18W 84NE N22W 78NE N22W 89NE N22W 89NE N28W 86NE N20W 86NE N19W N32W N35W N32W 81NE N36W 84NE N33W N28W 86NE
N71E N62E N74E 85NW N52E 82NW N15E 90 N65E 76NW N55E N56E N66E 85NW
Spacing: (cm) Set A Set B 28 38 40 40 38 28 30 26 30 20 34 25 22 12 20
90 69 45 64 116 22 20 10 56 58

150
Separation: none observed Mineralization: none Surface characteristics: no recognizable features Relative ages: Set A older Apertures: At outcrop edge (side exposure), 2mm-3cm (interpreted to be recent). Away from outcrop edge 1mm wide apertures to no apertures. Deformation Bands (width): NA

151
Chart #: 31 Plan and side views Location: SE1/4 NE1/4 Sec 23 T38N R78W Lithology: Unit 1: sandstone within the interbedded sandstone and shale unit, 2-3m shale overlying and 5-6m shale underlying this sandstone bed. Grain size, cementation: Fine-grained sandstone 88-125µ, ripple marks, moderately to well cemented (reddish tint suggests Fe enriched cement) Bed thickness: 25cm total bed thickness, individual laminae are 5-2cm thick Structure Strike and dip of bedding: N23E 9SE, N25E 7SE Structural curvature (estimated): 800m Faulting:
Set A
Fracture Characteristics Type, Orientation: Set A: TNF Set B: XF
Set B N64W 84NE N60W 90 N55W 90 N56W 82NE N53W 90 N70W 90 N65W 90 N66W 90 N60W 87SW N62W 90 N64W 90 N72W 90 N58W 88SW N60W 90 N64W 90 N64W 90 N68W 90
N12W 90 N52E90 N4E N75E 90 N44E 84NW N60E N57E N32E
Spacing: (cm) Set A Set B 30 28 24 19 17 25 33 22 25
70 165 70 120 60 28 105 40

152
80 80 75 65 55 20 20 18 25 60 Distinctly larger spacing values for set B relative to set A. Separation: None observed Mineralization: In general Set A has 1mm wide calcite coating on the fracture surfaces. Surface characteristics: in plan view 3-4 surfaces exhibit an en echelon pattern, also 2-3 are curved at exposure edge. See diagram below:
Relative ages: Set A older Apertures: wider at outcrop edge to 8-10cm on some Set A Set A: 0, 1mm, 1mm Set B: 1-2mm average Deformation Bands (width): NA
Outcrop edge
En echelon pattern

153
Chart #: 32 Plan and side views Location: SE1/4 NE1/4 Sec 223 T38N R78W Lithology: Unit 2: upper beach sandstone, light tan Grain size, cementation: Distribution of grain sizes in this bed is 80% 88-125µ, 20% 125-177µ. poorly to moderately cemented, not as poorly cemented as Unit 3 white beach sandstones. Bed thickness: 60cm, approximate area – 10m X 8m. Structure Strike and dip of bedding: N5E 7SE, N5E 8SE, N10E 7SE (undulatory surface – leveled out and measured on clipboard) Structural curvature (estimated): 1000m-1500m Faulting:
Set A
Fracture Characteristics Type, Orientation: Set A: TNF – exposure not great for mapping, but fractures of similar strike to set A continue through ridge. Set B: XF
Set B Set C N81W 84NE N80W 87NE N82W 81NE N79W 79NE N83W 79NE N73W 84NE N78W N77W N78W N77W N79W
N40W N5E 78NW N8E N6E N30W 82SW
N60E N62E N53E 75NW 3 fractures 50cm apart – appear generally through-going – 1 ends at a Set A fracture
Spacing: (cm) Set A Set B 5 16 7 8 10 48 30 38 85 covered 24 25 68 145
Where set A is closely spaced (i.e. less than 40 cm spacing) set B is also closely spaced (40cm average). Where set A is more widely spaced (i.e. greater than 40 cm) set B is also more widely spaced (2-3 m spacing).
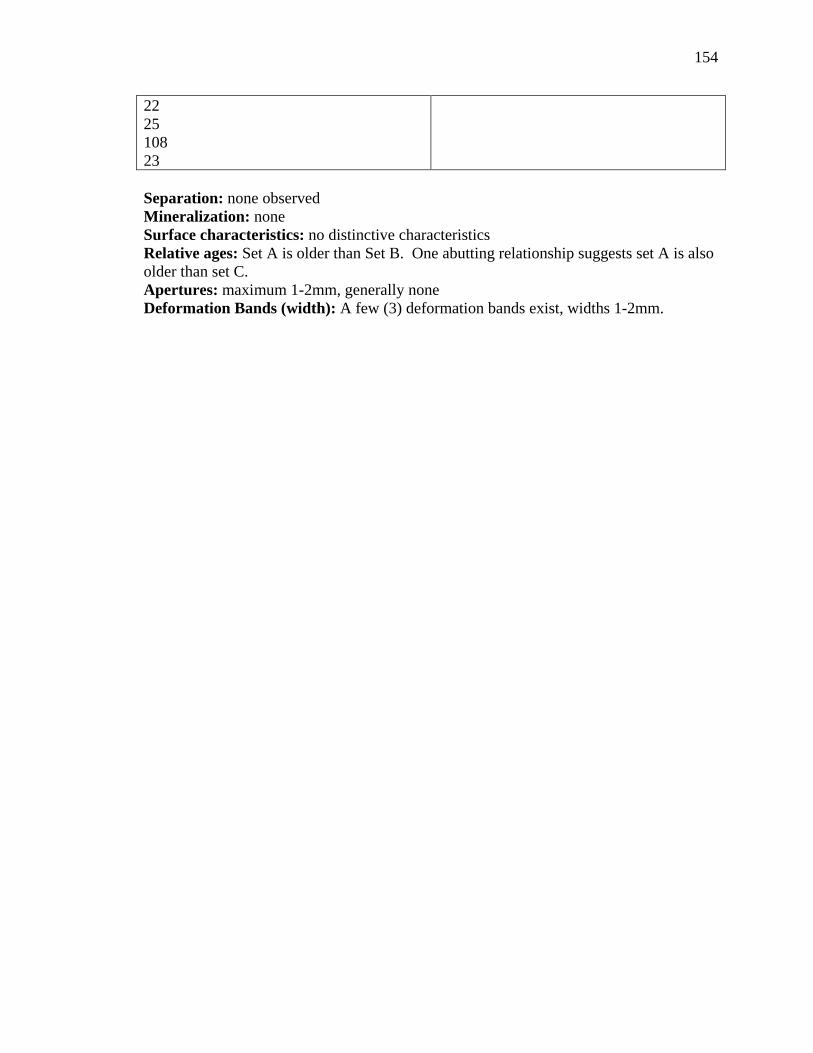
154
22 25 108 23 Separation: none observed Mineralization: none Surface characteristics: no distinctive characteristics Relative ages: Set A is older than Set B. One abutting relationship suggests set A is also older than set C. Apertures: maximum 1-2mm, generally none Deformation Bands (width): A few (3) deformation bands exist, widths 1-2mm.
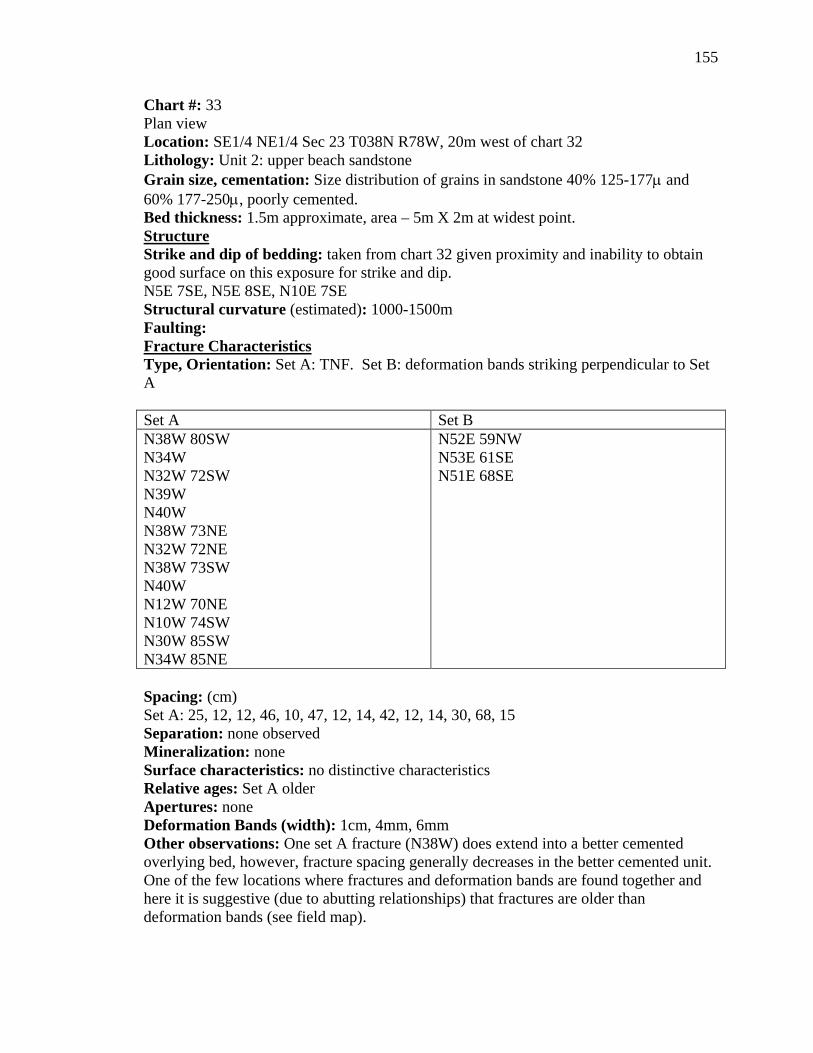
155
Chart #: 33 Plan view Location: SE1/4 NE1/4 Sec 23 T038N R78W, 20m west of chart 32 Lithology: Unit 2: upper beach sandstone Grain size, cementation: Size distribution of grains in sandstone 40% 125-177µ and 60% 177-250µ, poorly cemented. Bed thickness: 1.5m approximate, area – 5m X 2m at widest point. Structure Strike and dip of bedding: taken from chart 32 given proximity and inability to obtain good surface on this exposure for strike and dip. N5E 7SE, N5E 8SE, N10E 7SE Structural curvature (estimated): 1000-1500m Faulting:
Set A
Fracture Characteristics Type, Orientation: Set A: TNF. Set B: deformation bands striking perpendicular to Set A
Set B N38W 80SW N34W N32W 72SW N39W N40W N38W 73NE N32W 72NE N38W 73SW N40W N12W 70NE N10W 74SW N30W 85SW N34W 85NE
N52E 59NW N53E 61SE N51E 68SE
Spacing: (cm) Set A: 25, 12, 12, 46, 10, 47, 12, 14, 42, 12, 14, 30, 68, 15 Separation: none observed Mineralization: none Surface characteristics: no distinctive characteristics Relative ages: Set A older Apertures: none Deformation Bands (width): 1cm, 4mm, 6mm Other observations: One set A fracture (N38W) does extend into a better cemented overlying bed, however, fracture spacing generally decreases in the better cemented unit. One of the few locations where fractures and deformation bands are found together and here it is suggestive (due to abutting relationships) that fractures are older than deformation bands (see field map).

156
Cha
rt 3
3: F
ield
map
illu
stra
ting
rela
tions
hip
betw
een
frac
ture
s (so
lid li
nes)
and
def
orm
atio
n ba
nds
(das
hed
lines
).
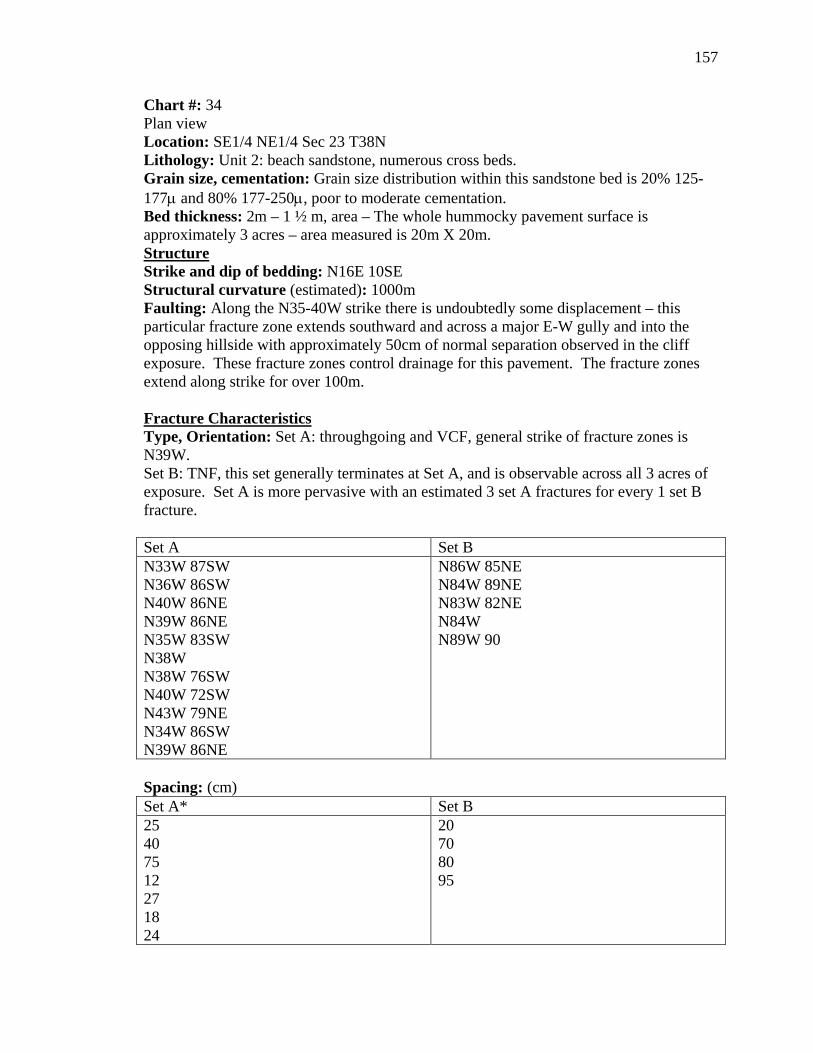
157
Chart #: 34 Plan view Location: SE1/4 NE1/4 Sec 23 T38N Lithology: Unit 2: beach sandstone, numerous cross beds. Grain size, cementation: Grain size distribution within this sandstone bed is 20% 125-177µ and 80% 177-250µ, poor to moderate cementation. Bed thickness: 2m – 1 ½ m, area – The whole hummocky pavement surface is approximately 3 acres – area measured is 20m X 20m. Structure Strike and dip of bedding: N16E 10SE Structural curvature (estimated): 1000m Faulting: Along the N35-40W strike there is undoubtedly some displacement – this particular fracture zone extends southward and across a major E-W gully and into the opposing hillside with approximately 50cm of normal separation observed in the cliff exposure. These fracture zones control drainage for this pavement. The fracture zones extend along strike for over 100m.
Set A
Fracture Characteristics Type, Orientation: Set A: throughgoing and VCF, general strike of fracture zones is N39W. Set B: TNF, this set generally terminates at Set A, and is observable across all 3 acres of exposure. Set A is more pervasive with an estimated 3 set A fractures for every 1 set B fracture.
Set B N33W 87SW N36W 86SW N40W 86NE N39W 86NE N35W 83SW N38W N38W 76SW N40W 72SW N43W 79NE N34W 86SW N39W 86NE
N86W 85NE N84W 89NE N83W 82NE N84W N89W 90
Spacing: (cm) Set A* Set B 25 40 75 12 27 18 24
20 70 80 95

158
35 35 39 30 13.9 * Spacing between set A fracture zones 15-20m. Separation: not visible on pavement surface but is visible in gully to the south (see notes on faulting). Mineralization: In depression formed by this fracture zone euhedral calcite crystals can be found lying loose. After intensive search calcite crystals were found on fracture walls of Set A. Crystals grew on opposite walls toward each other. The largest crystals are 2.5mm long as measured perpendicular to fracture surface. Apertures are cemented closed with no current openings. Surface characteristics: no obvious characteristics Relative ages: Set A older Apertures: Generally none, some to 5mm (see mineralization). Deformation Bands (width): NA

159
Chart #: 35 Plan and side view Location: SE1/4 NE1/4 Sec 23 T38N R78W Lithology: Unit 4: carbonaceous shale, black, very fissile Grain size, cementation: very fine grain size “shale”, very poorly cemented Bed thickness: 1.8m, area – 8m X 3m Structure Strike and dip of bedding: N24E 7SE – This was measurement was difficult to obtain due to irregular bedding surfaces in the carbonaceous shale. Structural curvature (estimated): 1000m Faulting: NA
Set A
Fracture Characteristics Type, Orientation: Set A: cleats, maximum extent of cleat along strike 0.5m. Set B: cleats, terminate at Set A.
Set A – 10m up ridge (3m up stratigraphically-still carbonaceous shale unit)
Set B
N70W 90 N62W 90 N32W 80SW N65W 84SW N82E N85E N80W 89SW N75W N65W 86SW N67W 88SW N65W 88SW N82W 83SW N80W 58SW N60W N55W 90 N42W 90 N70W 86SW N67W 85SW
N80W 85SW N80W 90 N81W 85SW N79W 85SW N80W 85SW N76W 86SW N77W N75W 87SW N79W N77W N78W N79W 79SW
N43E 90 N24E 90 N21E N14E 71NW N30E 81NW N20W 90 N6W N1E 90 N11E 10m up ridge (3m up stratigraphically – still carbonaceous shale unit) N5W N12W
Spacing: (cm) Set A: 18, 20, 18, 12, 10, 6, 5, 35, 2, 4, 15, 15, 5, 5, 8, 5, 8 Separation: none observed Mineralization: some red, Fe staining on surfaces Surface characteristics: planar Relative ages: Set A older Apertures: none Deformation Bands (width): NA Other observations: Some set A and set B cleats are iron stained 1cm into matrix.

160
Chart #: 36 Plan and side views Location: NW1/4 NE1/4 Sec 9 T38NR78W Lithology: Unit 1: interbedded sandstone and shale Grain size, cementation: Grain size of sandstone bed is 62-88µ, poor to moderate cementation. Bed thickness: 4-6cm thick sandstone, area – 8m X 3m Structure Strike and dip of bedding: Note: distinct increase in dip from Chart 35. N11W 31SW, N15W 30SW, N11W 26SW Structural curvature (estimated): Faulting:
Set A
Fracture Characteristics Type, Orientation: Set A: TNF Set B: TNF, in general Set B has perpendicular intersections with set A. Some fractures tend to curve near the point of intersection to accommodate this relationship. Note: spacing and strike generally the same in other sandstone beds near this location.
Set B N60W N55W 13NE N57W 74NE N57W 72NE N56W 70NE N60W 78NE N59W 76NE N58W 72NE N62W 83NE N58W 76NE N54W 79NE
N2W N10W 63NE N16W 74NE N11W N12W N11W 72NE N25W 74NE N9W 76NE N24W 67NE
Spacing: (cm) Set A - N to S Set B 40 28 40 18 33 66 40 44 47 30 70 55
35 41 60 30 34
Separation: none

161
Mineralization: none Surface characteristics: not apparent Relative ages: Set A older Apertures: aperture could be recent Set A: 2,1,1,2,2,3,2,2,3 (mm) Set B: 3,1,2,1,2,2,2,1 (mm) Deformation Bands (width): NA

162
Chart #: 37 Plan and side views Location: SE1/4 NE1/4 Sec 23 T38N R78W Lithology: Unit 5: fluvial sandstone interbedded in carbonaceous shale Grain size, cementation: Grain size distribution within the sandstone is 90% 88-125µ and 10% 125-177µ. Moderate cementation, calcite cement (strongly reactive in HCl), some Fe given reddish brown color and rounded siderite nodules nearby. Note fractures curve to parallel the edges of these round nodules. Bed thickness: 1.4m, area – 20m X 4m Structure Strike and dip of bedding: N30E 16SE – Difficult to find a good bedding surface for measurement of strike and dip. Structural curvature (estimated): 1000-1500m Faulting: no large-scale faults
Set A
Fracture Characteristics Type, Orientation: Set A: TNF. Set B: TNF
Set B XF N45W 90 N45W 90 N42W 90 N42W 90 N41W 90 N39W 90 N44W 90 N41W 90 N44W 90 N42W 90 N43W 90
N76E 75NW N66E N77E 78NW N77E 77NW N73E 80NW
N55E 90
Spacing: (cm) Set A Set B 75 35 50 85 75 70 105 15 20 155
85 165
Separation: none observed Mineralization: none

163
Surface characteristics: Set A:
Relative ages: Set A older Apertures: 0-3cm – 0.5cm average (interpreted to be recent). Deformation Bands (width): NA

164
Chart #: 38 Plan and side views Location: NW1/4 SW1/4 Sec 24 T38N R78W Lithology: Unit 5: fluvial sandstone interbedded in carbonaceous shale, light tan color. Grain size, cementation: Grain size distribution within the fluvial sandstone is 60% 88-125µ and 40% 125-177µ. Moderate cementation, very reactive with HCl. Bed thickness: 1.4m, area – 30m long X 3m wide Structure Strike and dip of bedding: N18E 14SE, N16E 9SE, N22E 13SE Structural curvature (estimated): 1000-1500m Faulting: no large scale faulting
Set A
Fracture Characteristics Type, Orientation: Set A: TNF. Set B: TNF. Set C: one fracture. Set D: XF.
Set B Set C Set D N48W 90 N48W 90 N48W 90 N45W N40W 90 N36W 90 N47W N42W 90 N44W 90 N46W 90
N88W 90 N89W 87NE N89W N86W
N45E 71NW One Set A fracture terminates at intersection with this fracture
N55E N60E 70NW
Spacing: (cm) Set A Set B 175 88 85 92 58 150 68 123 65 74
205 168 205
Separation: none observed Mineralization: Set A – calcite mineralization on fracture surface to 2mm wide. Some 1mm fractures sealed with calcite. Almost all are mineralized. Set B – no mineralization Surface characteristics: Relative ages: Set A older than B or D. Set C possibly the oldest fracture set.

165
Apertures: Apertures appear to have recently expanded in exposures near the cliff edge. Set A: Apertures near the cliff edge 0-4cm, 3 fractures away from the edge are cemented with calcite, apertures away from cliff edge between 0-2mm Set B: Few good exposures away from outcrop edge, 1-4cm at cliff edge; 0-1mm away from edge. Deformation Bands (width): NA

166
Chart #: 39 Plan and side views Location: NW1/4 NE1/4 Sec 9 T38N R78W Lithology: Unit 2: Fe-enriched pavement in upper portion of beach sandstone. Grain size, cementation: Grain size distribution in this sandstone bed is 90% 177-250µ and 10% 250-350µ. Poor to moderate cementation, units overlying and underlying this bed are very poorly cemented. Fractures do not extend into the less-cemented units. Bed thickness: 60cm. Area – 10m X 2m Structure Strike and dip of bedding: N10W 25SW, N9W 23SW, N10W 22SW Structural curvature (estimated): NA Faulting: Possible large-scale fault separating this section of the western limb and the section to the north. This fault would strike through the valley between these two sections of the western limb and would be covered by Quaternary alluvium. Conley reservoir is located in this valley.
Set A
Fracture Characteristics Type, Orientation: Set A: TNF, N89E 80NW Set B: TNF/VE; N15W 68NE bed normal. Set C: XF. Generally perpendicular to Set B.
Set B Set C N89E 80NW N14W 68NE
N17W 67NE N18W N16W 69NE N15W 72NE N18W N14W N17W 65NE N16W N19W 66NE N18W 67NE N18W N20W 69NE N19W 65NE N18W
N75E 90 N73E 90 N68E 90
Spacing: (cm) Set A: only one fracture, spacing at least 3m. Set B: Measured west to east perpendicular to strike, 72, 24, 35, 28, 13, 19, 19, 4, 9, 37, 20, 59, 22, 17, 48 Set C: spacing average 0.5cm Separation: no visible separation Mineralization: none
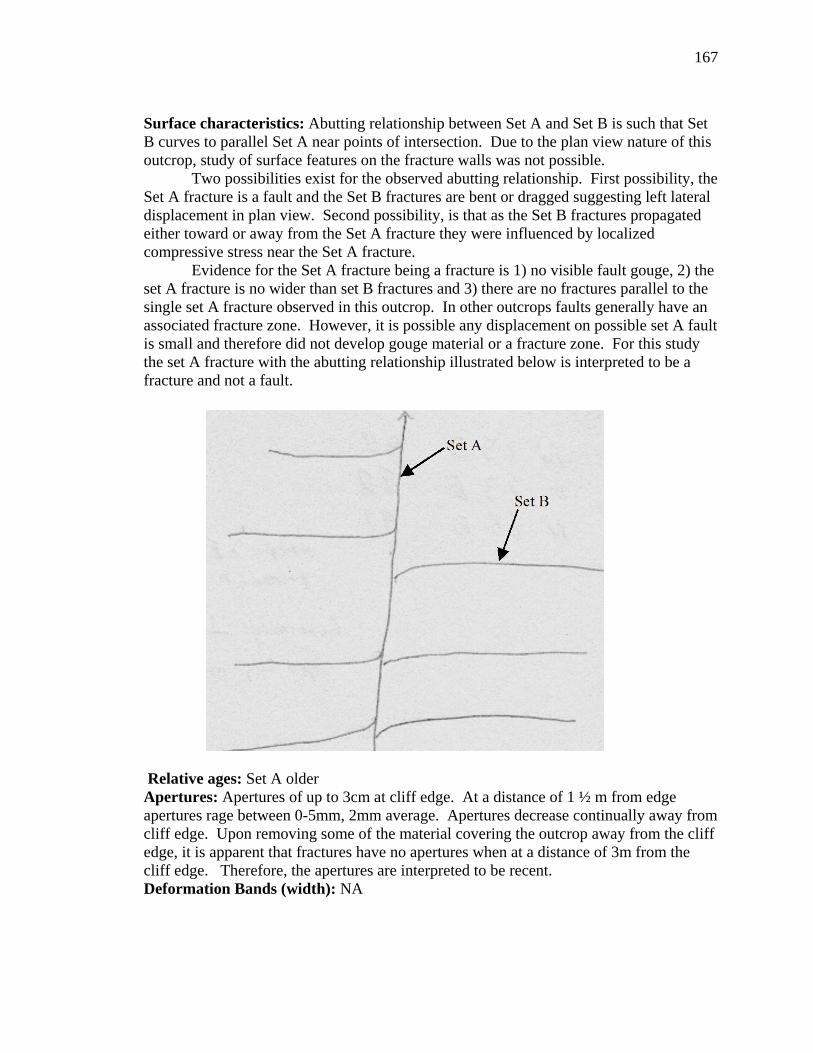
167
Surface characteristics: Abutting relationship between Set A and Set B is such that Set B curves to parallel Set A near points of intersection. Due to the plan view nature of this outcrop, study of surface features on the fracture walls was not possible.
Two possibilities exist for the observed abutting relationship. First possibility, the Set A fracture is a fault and the Set B fractures are bent or dragged suggesting left lateral displacement in plan view. Second possibility, is that as the Set B fractures propagated either toward or away from the Set A fracture they were influenced by localized compressive stress near the Set A fracture.
Evidence for the Set A fracture being a fracture is 1) no visible fault gouge, 2) the set A fracture is no wider than set B fractures and 3) there are no fractures parallel to the single set A fracture observed in this outcrop. In other outcrops faults generally have an associated fracture zone. However, it is possible any displacement on possible set A fault is small and therefore did not develop gouge material or a fracture zone. For this study the set A fracture with the abutting relationship illustrated below is interpreted to be a fracture and not a fault.
Relative ages: Set A older Apertures: Apertures of up to 3cm at cliff edge. At a distance of 1 ½ m from edge apertures rage between 0-5mm, 2mm average. Apertures decrease continually away from cliff edge. Upon removing some of the material covering the outcrop away from the cliff edge, it is apparent that fractures have no apertures when at a distance of 3m from the cliff edge. Therefore, the apertures are interpreted to be recent. Deformation Bands (width): NA

168
Chart #: 40 Plan view Location: SW1/4 SE1/4 Sec 4 T38N R78W Lithology: Unit 2: upper portion of beach sandstone – Fe enriched pavement Grain size, cementation: Grain size distribution for the sandstone bed is 90% 88-125µ and 10% 125-177µ. Moderate cementation, calcite (strong reaction to HCl), also reddish-tan color suggesting some Fe. Bed thickness: 30cm, area – 6m X 2m Structure Strike and dip of bedding: N22W 23SW, N26W 23SW, N22W 25SW Structural curvature (estimated): Faulting: After digging away some of the covering alluvium it is apparent there is no large-scale fault at this stratigraphic level through the bottom of Conley Reservoir draw. However it should be noted that there is a 12o –16o change in bedding strike from one side of this valley to the other. Chart 39 details data for the immediate south side of this east-west striking valley and Chart 40 details data for the immediate north side.
Set A
Fracture Characteristics Type, Orientation: Set A: TNF/VE. Set B: TNF
Set B N31W 68NE N34W 65NE N32W 66NE N32W 68NE N33W 65NE N30W 62NE N32W 75NE N31W 72NE N33W 67NE N30W 62NE
N80E 82NW N77E 85NW N81E N80E 80NW N80E 83NW N84E 80NW
Spacing: (cm) Set A Set B 30 18 8 34 10 4 32 30 45 26 30 21 28
160 146 213 70 12 40

169
Separation: none observed Mineralization: Set A: Iron stained 4cm into matrix from fracture plane in numerous fractures. Set B: Iron stained although not as extensively as Set A Surface characteristics: generally planar Relative ages: Set A generally older. However, age determinations were not easy to make. A couple of abutting relationships suggest Set B is older. These fracture sets may be penecontemporaneous. Apertures: (mm) Set A: 0, 1, 2, 1, 1, 1, 1 Set B: 0, 1, 1 1mm average aperture width for both sets. Note: aperture width increases to 1cm with increased proximity to outcrop edge. Deformation Bands (width): NA

170
Chart #: 41 Plan and side views Location: SE1/4 SW1/4 Sec 4 T38N R78W Lithology: Unit 4: carbonaceous shale Grain size, cementation: very fine (black carbonaceous shale), very poorly cemented Bed thickness: 1m thick, 4-5m stratigraphically above Unit 2: beach sandstone. Structure Strike and dip of bedding: Obtained from nearby Unit 2: beach sandstone N12W 25 SW, N18W 25SW Structural curvature (estimated): Faulting: No large scale faulting observed
Set A
Fracture Characteristics Type, Orientation: Set A: (TNF) cleats, N35-40W. Set B: (XF) cleats, N80W
Set B Set C N35W 70NE* N28W 64NE N24W 67NE N30W 64NE N32W N23W 84SW N35W 74NE N28W 75NE N30W 76NE N36W 75NE N30W 69NE
N82W 62NE N85W 60NE N70W 82NE N80W 71NE N80W 80NE N85W N85W 87NE N80W N86W 87NE N75W 85NE
N30E 40SE N35E 53SE
* Extends for 3m, Set B cleats terminate at this cleat. Note: Generally most cleats do not extend very far. 5-10cm along dip, ½ - 1m along strike, average along strike 0.5m. Spacing: (cm) Set A Set B 11 34 50 60 35 4 35 20
22 27 30 30 4 6 8 3 5
Separation: none observed Mineralization: Fe staining directly on fracture surface. Surface characteristics: planar Relative ages: Set A older Apertures: None Deformation Bands (width): NA

171
Chart #: 42 Plan and side views Location: NE1/4 SW1/4 Sec 4 T38N R78W (pavement) Lithology: Unit 1: interbedded sandstones and shales, light tan sandstone Grain size, cementation: Grain size distribution within the measured sandstone bed is 10% 62-88µ , 80% 88-125µ , and 10% 125-177µ. Poor to moderate cementation (moderate reaction to HCl). Bed thickness: 40cm total thickness, thin 1cm laminae/cross-beds, area – 10m X 16m Structure Strike and dip of bedding: N30W 23SW, N30W 22SW, N38W 23SW, N39W 24SW Structural curvature (estimated): Northwestern limb, estimate of curvature unavailable due to poor exposure of northern plunge as expressed within the Mesaverde section. Faulting: No large-scale faulting observed.
Set A
Fracture Characteristics Type, Orientation: Set A: VE. Set B; XF
Set B N41W 52NE N44W 58NE N42W 59NE N45W 57NE N43W 57NE N46W N44W 59NE N44W 55NE N44W 54NE N43W 46NE
N48E 89NW N45E 90 N46E N46E 90 N42E 90 N35E N25E 85SW N48E 90
Spacing: (cm) Set A Set B 1.4 1.73 1.00 0.87 0.50 1.46 1.94 1.70
4.4 1.7 2.9 2.4 2.1 1.2 some spacing greater than 5m – average is approximately 3m
Separation: No visible offset on pavement surface, partial side view suggests no offset. Mineralization: none Surface characteristics: planar on VE Set A Relative ages: Set A older Apertures: 0-1mm, generally no apertures Deformation Bands (width): NA

172
Cha
rt 4
2: fr
actu
re m
ap –
scan
line
dra
wn
perp
endi
cula
r to
Set A
.

173
Chart #: 43 Plan and side view Location: SE1/4 SW1/4 Sec 4 T38N R78W Lithology: Unit 5: fluvial sandstone interbedded in carbonaceous shale Grain size, cementation: Grain size distribution with fluvial sandstone bed 40% 62-88µ and 60% 88-125µ. Moderate cementation, light tan/red suggesting Fe enrichment, moderate to strong reaction with HCl. Bed thickness: 50cm thick; underlying sandstone is Unit 3: white beach sandstone, poorly cemented, approximately1/3 of these fracture continue into this unit as either fractures or deformation bands, area – 4m X 6m. Structure Strike and dip of bedding: Difficult to measure strike and dip due to very broken, undulatory surface. N39W 23SW, N39W 25SW Structural curvature (estimated): Northwestern limb, estimate of curvature unavailable due to poor exposure of northern plunge as expressed within the Mesaverde section. Faulting: No large scale faulting observed
Set A
Fracture Characteristics Type, Orientation: Set A: TNF. Set B: XF, this set does not extend into underlying unit.
Set B N68W 63NE N66W 79NE N67W 73NE N69W 73NE N68W 65NE N64W 69NE N69W 71NE N67W 67NE N68W 68NE N65W 70NE N66W 60NE N65W N71W 66NE N73W 87SW
N15E 90 N24E 76NW N28E 90 N25E N18E N18E 90 N43E 80NW N25E N13E 62SE N8W 65SE
Spacing: (cm) Set A; readings taken E-W perpendicular to fracture trend Set A Set B 82 15 9 35 9 30 24 20 28
75 95 25 66 70 40 50

174
32 113 29 76 Separation: On side view “possible” 1cm normal offset on 1Set A fracture, dip to NE. Separation may be recent due to gravity sliding at edge of outcrop. Mineralization: none Surface characteristics: Very rough pavement surface. No characteristic fracture surface features observed. Relative ages: Set A older Apertures: 0-5mm in Set A 0-5mm in Set B. Both possibly recent Deformation Bands (width): Deformation bands up to 3mm wide in underlying Unit 3: white beach sandstone.
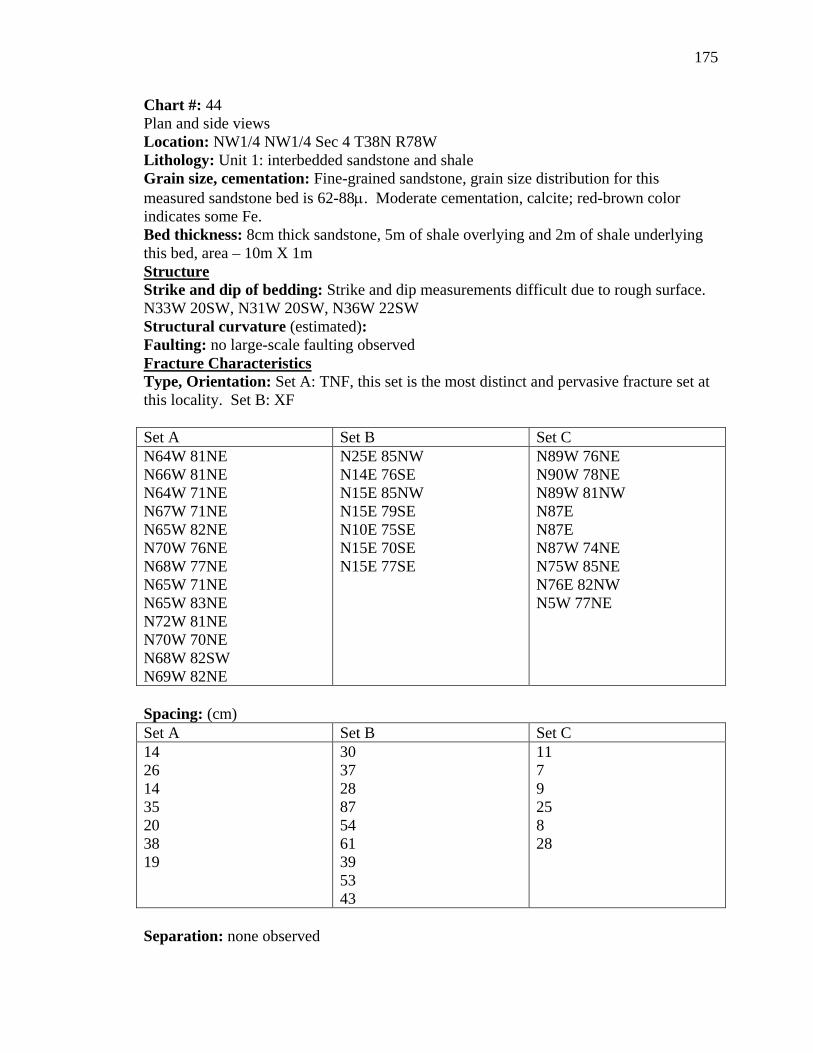
175
Chart #: 44 Plan and side views Location: NW1/4 NW1/4 Sec 4 T38N R78W Lithology: Unit 1: interbedded sandstone and shale Grain size, cementation: Fine-grained sandstone, grain size distribution for this measured sandstone bed is 62-88µ. Moderate cementation, calcite; red-brown color indicates some Fe. Bed thickness: 8cm thick sandstone, 5m of shale overlying and 2m of shale underlying this bed, area – 10m X 1m Structure Strike and dip of bedding: Strike and dip measurements difficult due to rough surface. N33W 20SW, N31W 20SW, N36W 22SW Structural curvature (estimated): Faulting: no large-scale faulting observed
Set A
Fracture Characteristics Type, Orientation: Set A: TNF, this set is the most distinct and pervasive fracture set at this locality. Set B: XF
Set B Set C N64W 81NE N66W 81NE N64W 71NE N67W 71NE N65W 82NE N70W 76NE N68W 77NE N65W 71NE N65W 83NE N72W 81NE N70W 70NE N68W 82SW N69W 82NE
N25E 85NW N14E 76SE N15E 85NW N15E 79SE N10E 75SE N15E 70SE N15E 77SE
N89W 76NE N90W 78NE N89W 81NW N87E N87E N87W 74NE N75W 85NE N76E 82NW N5W 77NE
Spacing: (cm) Set A Set B Set C 14 26 14 35 20 38 19
30 37 28 87 54 61 39 53 43
11 7 9 25 8 28
Separation: none observed

176
Mineralization: Fe staining on fracture surface Surface characteristics: Relative ages: Set A oldest, Set C next oldest, Set B youngest. Note – 1 intersection suggests Set C older than Set A. Apertures: (mm) Large apertures are interpreted to be recent. Set A Set B Set C 5 2 10 4 4 20 0 0 1 8
20 20 38 15 5 5 5 8
0 10 0 1 0 0 1 2 2
Deformation Bands (width): NA

177
Chart #: 45 Plan and side views Location: SW1/4 NW1/4 Sec 4 T38N R78W Lithology: Unit 2: upper portion of beach sandstone Grain size, cementation: Grain size distribution within this measured sandstone bed is 90% 88-125µ and 10% 125-177µ. Moderate cementation, very reactive to HCl, red-brown color – Fe enriched (siderite) pavement. Bed thickness: 20cm average thickness, laminae 0.5-1cm. Structure Strike and dip of bedding: N35W 18SW, N29W 18SW, N35W 19SW, N29W 17SW Structural curvature (estimated): Faulting: no large-scale faulting observed
Set A
Fracture Characteristics Type, Orientation: Set A: TNF. Set B: XF.
Set B N50W 74NE N59W 74NE N61W 74NE N52W 74NE N53W 82NE N62W 85NE N48W 74NE N56W 74NE N60W 79NE N64W 76NE N53W 76NE N55W 71NE N64W 78NE N62W 73NE
N25E 88SE N29E N41E 83NW N28E N35E 89NW N35E 81SE N23W 84SE N34E 81SE N21W 84NW
Spacing: (cm) Set A Set B 19 25 25 31 25 39 44 6 18 55 17 56 24
160 120 154 160 65 61 211 110 231 265 355 390 124

178
20 35 55 8
Note – distinctly wider spacing in Set B
Separation: none observed Mineralization: none Surface characteristics: Set A does not have as a uniform strike as observed in chart 44. Relative ages: Set A is older. Apertures: Apertures are only at outer (cliff side) edge of outcrop. Therefore, apertures are interpreted to be recent. Deformation Bands (width): Unit 3: white poorly cemented (2m thick) beach sandstone stratigraphically above this measured bed contains deformation bands with a variety of orientations. Other observations: 1m stratigraphically below this unit is a 14cm thick pavement, poorly cemented. Separating the 2 units is a very poorly cemented white Ss (Unit 2: beach sandstone). A 3m wide broken zone separates the 14cm thick pavement into 2 exposures (N and S). No mineralization observed in fractures. Recent apertures to 1cm at exposure edge, otherwise no apertures. N exposure (no XF) S exposure S exposure XF (oblique) N67W N68W 79NE N66W 84NE
N89E 84NW N86E 86NW N85E 85NW N76E 86NW N81E 81NW N85E 81NW N86E 82NW Spacing average 15cm
N68W N70W N66W 82NE N64W 80NE Spacing average 18cm

179
Chart #: 46 Plan and side views Location: SW1/4 NW1/4 Sec 4 T38N R78W Lithology: Unit 4: carbonaceous shale (black) Grain size, cementation: very fine-grained, very poorly cemented Bed thickness: 1m average thickness, area – 11m X 2m. Structure Strike and dip of bedding: N10E 18NW – hard to find good pavement surface. This reading is probably erroneous. More accurate measurements are described below. N36W 14SW – Taken on Unit 2: bss 15m below charted area. N38W 13SW – Taken on Unit 2: bss 15m below charted area. Also see chart 45 - readings are relatively close to this charted area. Structural curvature (estimated): Faulting: No large-scale faulting observed.
Set A
Fracture Characteristics Type, Orientation: Set A: cleats in carbonaceous shale.
Set A - continued N83W 83SW N81W 86NE N83W 86NE N51W 80NE N79W 79NE N86W N86W N84W N52W N77W 81NE N64W 87SW N80W 85NE
N40W 86NE N81W 85NE N83W 85NE N80W 90 N79W 85NE N81W 89NE N79W 84NE N44W 74NE N76W 78NE N76W 85NE N46W 74NE N84W 85NE
Spacing: (cm) Set A Vertical extent Length along strike 12 10 21 54 36 10 15 6 13 27 22 8 2
10cm – 1m average 20cm
30 45 30 10 45 35 23 21 20 25-30 average

180
34 8 10 14 17 4 Separation: none observed. Mineralization: Fe staining on fracture surfaces. Surface characteristics: planar Relative ages: N75-85W older than other fractures where abutting relationships exist. Apertures (mm): 1, 1, 1, 1, 1, 1, 2, 1, 1, 4, 2, 1, 2, 1, 1, 2, 3, 8, 10 (1mm average for most) Deformation Bands (width): Deformation bands in poorly cemented Unit 5: fluvial sandstone directly overly the Unit 4: carbonaceous shale measured here. 1mm - N60E 37SE, 22cm spacing 4mm – N62E 38SE, 18cm spacing 2mm – N60E 39SE 3mm – N45W 45NE

181
Chart #: 47 Side view (cliff exposure) Location: SW1/4 NW1/4 Sec 4 T38N R78W Lithology: Unit 5: fluvial sandstone, within Unit 4: carbonaceous shales, approximately 20m above the Unit 4: carbonaceous shale and Unit 3: beach sandstone contact. Grain size, cementation: 122-173µ, poor-mod cementation, non-reactive to HCl Bed thickness: 3-6m thick, area – 30m along cliff face Structure Strike and dip of bedding: N34W 13SW, N32W 15SW Structural curvature (estimated): Faulting: No large-scale faulting observed. However, some of the fractures do have some displacement.
Set A
Fracture Characteristics Type, Orientation: Set A: TNF
Spacing - Set A 1-N40W 55NE 6cm norm displacement 2-N45W 56NE 3-N45W 59NE 2cm norm displacement 4-N45W 53NE 8cm norm displacement 5-N43W 54NE 1cm norm displacement 6-N42W 58NE 1cm norm displacement 7-N40W 61NE 8-N36W 60NE (A-1) 9-N40W 65NE (A-2) 10-N45W 50NE (A-3)
5m 1.5m 4m 0.9m 5.0m 2.2m 0.2m 2.3m 5.3m
The last 3 measured fractures apparently curve in the upper 2m of outcrop the following strikes: A-1: N60W 84NE; A-2: N61W 81NE; A-3: N62W 81NE; see drawing. Separation: data provided in above table Mineralization: none Surface characteristics: See drawing. Other surface characteristics include a few incongruous fracture steps. Relative ages: Set A older Apertures: 0, 0, 5cm, 2cm, 0, 0. Apertures probably recent Deformation Bands (width): NA

182
30m
W
Cha
rt 4
7: fr
actu
re m
ap (c
ross
sect
iona
l vie
w)

183
Chart #: 48 Plan and side views Location: NE1/4 NE1/4 Sec 5 T38N R78W Lithology: Unit 5: fluvial sandstone within the carbonaceous shales of Unit 4. Grain size, cementation: Grain size distribution within the measured Unit 5 fluvial sandstone bed is 125-177µ. Poor to moderate cementation (generally moderate), strong reaction to HCl. Bed thickness: 4m thick (massive, Unit 5: white fluvial sandstone), area – 1 acre Structure Strike and dip of bedding: A good bedding surface to measure strike and dip is almost impossible to find. Estimate N50W 11SW. See chart 50 for measurements at that locality. Structural curvature (estimated): Northwestern limb, estimate of curvature unavailable due to poor exposure of northern plunge as expressed within the Mesaverde section. Faulting: No large-scale faulting observed.
Set A
Fracture Characteristics Type, Orientation: Set A: TNF. Set B: XF.
Set B N44W 68NE N42W 80SE N43W 62NE N45W 63NE N45W 62NE N46W 68NE N41W 64NE
N36E 88SE N46E 86SE N54E 80SE N43E 64SE N55E N30E 87SE N65E 76SE
Spacing: (m) Set A (meters) Set B (meters) 6.30 5.25 4.85 3.9 4.5
4.3 5.1 4.9 2.6 4.2 3.6 4.3
Separation: (cm) Mineralization: None. Surface characteristics: Generally planar surface. Relative ages: Set A older Apertures: (cm) Set A – 1.1, 4.0, 3.0, 2.0, 1.2, 1.5 Set B – 2.5, 2.5, 2.0, 3.0, 2.5, 2.0, 1.1, 0 Determined to be recent. Deformation Bands (width):
E
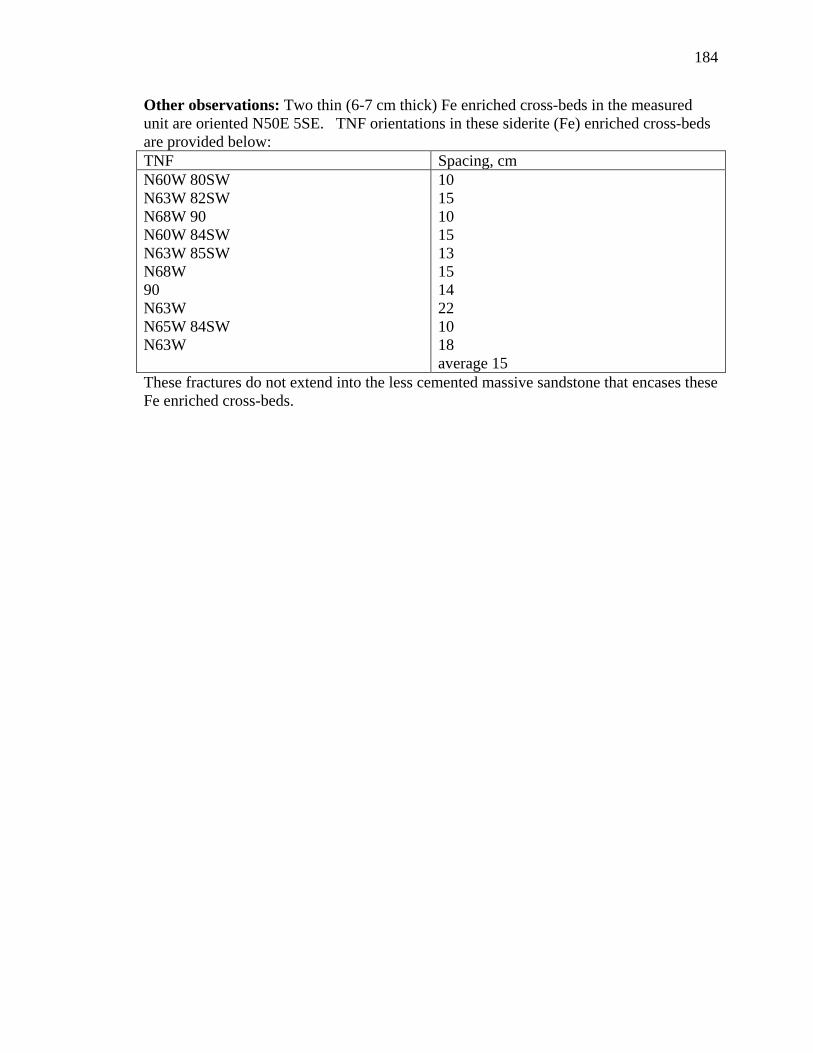
184
Other observations: Two thin (6-7 cm thick) Fe enriched cross-beds in the measured unit are oriented N50E 5SE. TNF orientations in these siderite (Fe) enriched cross-beds are provided below: TNF Spacing, cm N60W 80SW N63W 82SW N68W 90 N60W 84SW N63W 85SW N68W 90 N63W N65W 84SW N63W
10 15 10 15 13 15 14 22 10 18 average 15
These fractures do not extend into the less cemented massive sandstone that encases these Fe enriched cross-beds.

185
Cha
rt 4
8: P
avem
ent m
ap d
etai
ling
Set A
frac
ture
trac
e le
ngth
s, sp
acin
g an
d or
ient
atio
ns.
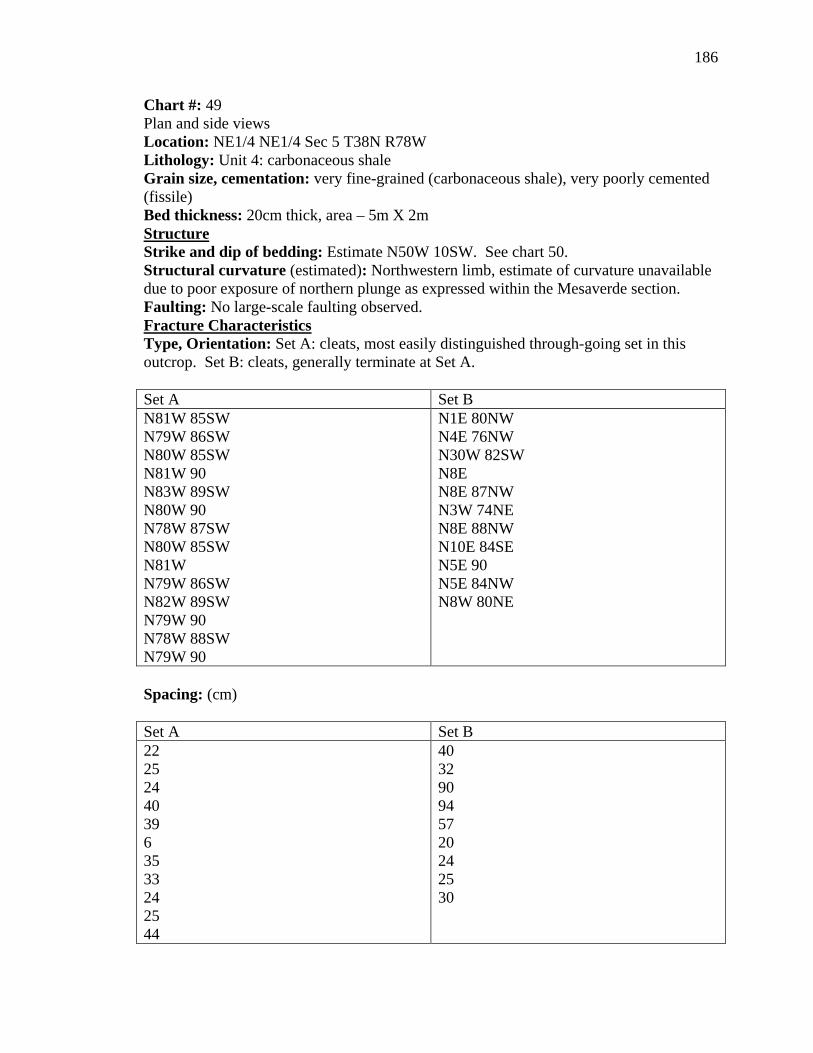
186
Chart #: 49 Plan and side views Location: NE1/4 NE1/4 Sec 5 T38N R78W Lithology: Unit 4: carbonaceous shale Grain size, cementation: very fine-grained (carbonaceous shale), very poorly cemented (fissile) Bed thickness: 20cm thick, area – 5m X 2m Structure Strike and dip of bedding: Estimate N50W 10SW. See chart 50. Structural curvature (estimated): Northwestern limb, estimate of curvature unavailable due to poor exposure of northern plunge as expressed within the Mesaverde section. Faulting: No large-scale faulting observed.
Set A
Fracture Characteristics Type, Orientation: Set A: cleats, most easily distinguished through-going set in this outcrop. Set B: cleats, generally terminate at Set A.
Set B N81W 85SW N79W 86SW N80W 85SW N81W 90 N83W 89SW N80W 90 N78W 87SW N80W 85SW N81W N79W 86SW N82W 89SW N79W 90 N78W 88SW N79W 90
N1E 80NW N4E 76NW N30W 82SW N8E N8E 87NW N3W 74NE N8E 88NW N10E 84SE N5E 90 N5E 84NW N8W 80NE
Spacing: (cm) Set A Set B 22 25 24 40 39 6 35 33 24 25 44
40 32 90 94 57 20 24 25 30

187
44 30 29 26 26 15 19 Separation: None observed Mineralization: Fe staining on cleat surfaces Surface characteristics: planar Relative ages: Set A older Apertures: (mm)range 0-5mm, 3mm average Set A: 3, 2, 1, 5, 2, 4, 6, 4, 3, 4 Set B: 5, 4, 2, 2, 1, 2, 2 Deformation Bands (width): NA

188
Chart #: 50 Plan and side views Location: NE1/4 NE1/4 Sec 5 T38N R78W Lithology: Unit 2: upper section of beach sandstone, Fe (siderite) enriched pavement (dark red/brown), poorly to moderately cemented white bss overlying and underlying the measured pavement. Grain size, cementation: Grain size distribution within the measured bed 40% 125-177µ, 55% 177-250µ, and 5% 250-350µ. Moderately to well cemented. Bed thickness: 18cm thick, area – 6m X 11m Structure Strike and dip of bedding: Note – This is the best area found for obtaining strike and dip for this area and should be used for charts 48 and 49 considering lack of good bedding planes in those areas. N47W 11SW, N49W 11SW, N59W 11SW, N49W 11SW Structural curvature (estimated): Northwestern limb, estimate of curvature unavailable due to poor exposure of northern plunge as expressed within the Mesaverde section. Faulting: No large-scale faulting observed.
Set A
Fracture Characteristics Type, Orientation: Set A: TNF. Set B: TNF. Set C; XF. Some fractures (not many and no XF’s) extend into the poorly cemented unit underlying this pavement.
Set B Set C N45W 75NE N65W 75NE N55W 75NE N60W 74NE N55W N55W 65NE N59W 75NE N53W 72NE N55W N58W 75NE N50W 73NE
N85W 73NE N75W N80W 87NE N80W N70W N78W N75W 75NE N85W 77NE
XF to Set A N40W 83NW N36W 86NW N50E 86NW N32E 88NW N52E 89NW N46E N42E XF to Set B N5E N4E 78SE N16E N10E N10E 83SE
Spacing: (cm) Set A Set B Set C ( XF to Set A) Set C (XF to Set B) 45 92 95 94 19 110
90 95 130 90 110 90
80 43 53 62 92 34
40 44 45 54 44

189
43 95
65 35 45 55
Separation: none observed Mineralization: none observed Surface characteristics: Set B generally terminates at contact with Set A. Relative ages: Set A oldest, Set B next oldest, Set C (XF’s) youngest Apertures: 0-10mm – apertures open at outcrop edge; 0 into outcrop, therefore apertures are interpreted to be recent. Deformation Bands (width): NA

190
Cha
rt 5
0: F
ract
ure
map
, fra
ctur
e se
ts A
and
B o
nly,
cro
ss fr
actu
res a
re e
xclu
ded
to m
ore
clea
rly il
lust
rate
the
abut
ting
rela
tions
hip
betw
een
Sets
A a
nd B
.

191
Sample number A B C D E F G
Quartz (monocrystaline) 110 89 108 129 128 122 106 Quartz (polycrystaline) 7 0 1 2 1 1 3 Chert 35 28 37 30 17 43 22 Feldspar 14 5 4 6 7 9 8 Muscovite 0 3 2 3 2 4 2 Cement (hematite) 81 23 56 20 130 20 127 Cement (calcite) 0 34 10 2 0 6 0 Cement (chert) 0 2 2 0 0 1 0 Macroporosity (intergranular) 34 99 69 92 8 82 22 Macroporosity (intragranular) 5 4 2 5 0 1 0 Microporosity (intragranular) 5 9 4 9 4 8 6 Microporosity (cement) 9 4 5 2 3 3 4 Number of point counts 300 300 300 300 300 300 300
Percent cement 27.0 19.7 22.7 7.3 43.3 9.0 42.3 Percent porosity 17.7 38.7 26.7 36.0 5.0 31.3 10.7
Cementation (microscopic observations)
mod-well
poor-mod
mod poor well poor well
Porosity (microscopic observations)
mod high mod high low mod low
Cementation (macroscopic field observations)
well poor mod poor well poor well
Table Chart 50: Thin section data from seven distinct beds at Chart 50 location.

192
Chart #: 51 Fault zone, plan and cross-sectional views. Measurements taken as a traverse (from west to east) along strike of the fault. Location: SE1/4 NE1/4 Sec 11 T38N R78W Lithology: The three units from which fracture measurements were obtained along this traverse are Unit 1, Unit 2, and Unit 3. Grain size, cementation: Grain size distribution within sandstones of Unit 1 is 20% 88-125µ and 80% 125-177µ. The sandstones of Unit 1 are poorly to moderately cemented. Bed thickness: Total thickness of measured Unit 1 sandstones and shales is 5m. Sandstones of Unit 1 have thicknesses up to 2m. Area where faulting and fracturing was measured within Unit 1 was 20m X 30m. Structure Strike and dip of bedding: N10E 12SE estimate (no reliable bedding surfaces) Structural curvature (estimated): NA Faulting: 5m wide fault zone. N65E 65NW, N58E 84SE. At Stop 1 normal separation along two fault planes 4m northern plane, 2m southern plane, 6m overall separation. Fault Characteristics Type, Orientation: Stop 1: This was the first stop along a fault parallel traverse. Measurements here are within sandstones and shales of Unit 1. Increased fault parallel fracture spacing with increased distance from the fault was noted at this stop. Stop 2: Following strike of the fault (150m east of stop 1) into center of a drainage, there is approx. 2m normal separation within sandstone beds of Unit 2 at this locality. Set 3: Continuation of the fault parallel traverse (50-70m east of stop 2). At this locality the fault is expressed as subparallel deformation bands within the poorly cemented white beach sandstones of Unit 3. One deformation band (striking N75 E 58SE) has slickenlines, with a 25o rake to west, recording sense of slip. Orientation of deformation bands: N56E 80SE, N58E 84NE, N60E 84SE, N58E 82SE, N55E 81SE, N55E 65SE, N65E 81SE, N80E 75SE, N88E 80SE Spacing: (cm) Separation: Varies along strike – 2m at Stop 2 and 6m at Stop 1. Amount of separation at Stop 3 is undetermined. Mineralization: none Surface characteristics: Vertical slickensides and incongruous fracture steps on fault surfaces within sandstones of Units 1 and 2 at stops 1 and 2. Relative ages: NA Apertures: NA Deformation Bands (width):

193
Chart #: 52 Plan view Location: SW1/4 NW1/4 Sec 12 T38N R78W Lithology: Unit 1: interbedded sandstone and shale – Unit 3 white beach sandstones are estimated to be ½ m stratigraphically above this location. Grain size, cementation: Grain size distribution within the measured sandstone pavement is 80% 88-125µ and 20% 125-177µ. Moderately cemented, dark reddish tan (Fe enriched), highly reactive with HCL. Bed thickness: 8-10cm thick, area – 10m X 20m Structure Strike and dip of bedding: N6W 11NE, N6W 11NE, N1W 10NE Structural curvature (estimated): NA Faulting: 50m north and east of the fault (Stop 3) described in chart 51. 200m south of a large-scale fault located behind the 3 black storage tanks of the Teapot Oil Co.
Set A
Fracture Characteristics Type, Orientation: Set A: TNF. Set B: TNF
Set B N64E 74NW N66E N63E 80SE N76E 84NW N72E 84NW N76E N73E 83SE N73E 85SE N76E 86SE N74E 84SE N74E N60E N70E 87SE N75E N72E 82NW N78E 85NW N74E 1mm wide aperture, calcite filled
N38W 86NE N39W 90 N34W 89SW N34W 89SW N42W N45W 87SW N43W N38W 88SW N39W 80NE N47W 84SW N41W 85SW N42W N31W N54W 1mm wide aperture, calcite filled N32W 1mm wide aperture, calcite filled N35W 81SW
Spacing: (cm) Set A Set B 60 50 48 34 33 75
15 * 10 * 15 * 10 * 15 * 100

194
85 38 40 73 28
35 25 75 55 56 68 75 38 102 68
* Fracture zone – fracture spacing decreases within this zone and increases away from this zone in both directions. Separation: NA Mineralization: 6 fractures with 1mm wide apertures within Sets A and B are filled with calcite. Surface characteristics: planar Relative ages: Set A older Apertures: Deformation Bands (width): NA

195
Chart #: 53 Plan view and outcrop edge exposures. Location: SE1/4 NE1/4 Sec 11 T38N R78W Lithology: Unit 1: Interbedded marine sandstones and shales (ripple Ss). Grain size, cementation: Grain size distribution within the measured sandstone bed is 60% 62-88µ and 40% 88-125µ. This tan sandstone is moderately cemented. Bed thickness: 25cm thick, area – 5m X 10m Structure Strike and dip of bedding: N4W 11 NE (overall estimate) poor surface Structural curvature (estimated): NA Faulting: A fault 150-200m to the northeast has approximately 45m of normal separation.
Set A
Fracture Characteristics Type, Orientation: Set A: TNF. Set B: TNF
Set B N74E 75NW N72E 77NW N71E 67NW N77E 67NW N76E 78NW N71E 68NW N68E 77NW N74E 74NW N65E 74NW N77E 78NW N74E N76E N80E N79E 88NW N72E 75NW
N46W 83SW N26W 86SW N42W 85SW N48W 78SW N25W 81SW N41W 82SW N26W 86SW N26W 88SW N58W N34W 84SW N36W N24W N27W 79SW N52W
Spacing: (cm) Set A Set B 45 11 33 25 5 3 17 17 13 19 22
55 45 42 15 50 27 37 25 26 57 90

196
20 5 30 36 15 17 30 18 37
23
Separation: none Mineralization: Up to 1mm of calcite on some Set A fracture surfaces. Mineralization of similar type also found on Set B fractures. Approx. 50% of fractures have mineralized surfaces (others may have eroded off or not deposited). Some fracture surfaces do exhibit evidence for erosion of calcite surface, such as thin (less than 1mm) patchy coatings of calcite. Surface characteristics: planar Relative ages: Set A older Apertures: Apertures to 2cm. These wider apertures are interpreted as recent. A calcite coating on some fracture surfaces indicates possible 2mm wide apertures at depth. Deformation Bands (width): NA
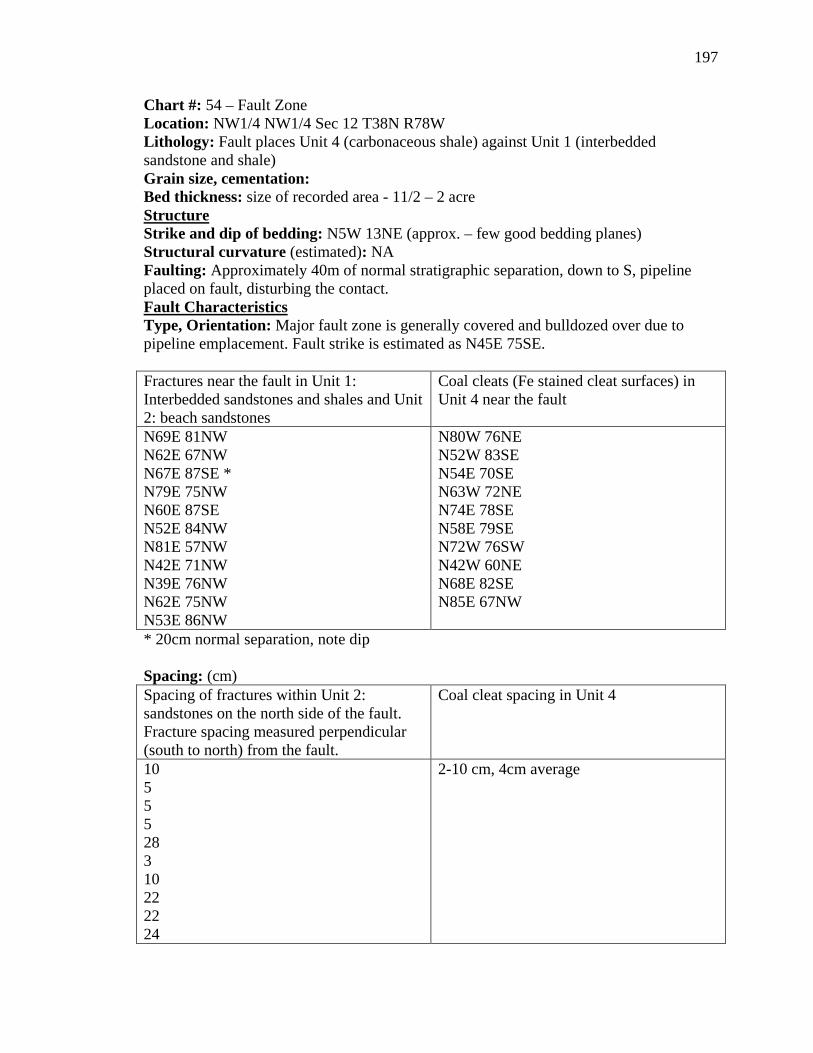
197
Chart #: 54 – Fault Zone Location: NW1/4 NW1/4 Sec 12 T38N R78W Lithology: Fault places Unit 4 (carbonaceous shale) against Unit 1 (interbedded sandstone and shale) Grain size, cementation: Bed thickness: size of recorded area - 11/2 – 2 acre Structure Strike and dip of bedding: N5W 13NE (approx. – few good bedding planes) Structural curvature (estimated): NA Faulting: Approximately 40m of normal stratigraphic separation, down to S, pipeline placed on fault, disturbing the contact.
Fractures near the fault in Unit 1: Interbedded sandstones and shales and Unit 2: beach sandstones
Fault Characteristics Type, Orientation: Major fault zone is generally covered and bulldozed over due to pipeline emplacement. Fault strike is estimated as N45E 75SE.
Coal cleats (Fe stained cleat surfaces) in Unit 4 near the fault
N69E 81NW N62E 67NW N67E 87SE * N79E 75NW N60E 87SE N52E 84NW N81E 57NW N42E 71NW N39E 76NW N62E 75NW N53E 86NW
N80W 76NE N52W 83SE N54E 70SE N63W 72NE N74E 78SE N58E 79SE N72W 76SW N42W 60NE N68E 82SE N85E 67NW
* 20cm normal separation, note dip Spacing: (cm) Spacing of fractures within Unit 2: sandstones on the north side of the fault. Fracture spacing measured perpendicular (south to north) from the fault.
Coal cleat spacing in Unit 4
10 5 5 5 28 3 10 22 22 24
2-10 cm, 4cm average

198
40 10 42 68 110 20 25 100 35 40 87 120 123 Separation: Mineralization: not observed Surface characteristics: Relative ages: Fracture formation penecontemporaneous with fault formation. Apertures: none Deformation Bands (width):
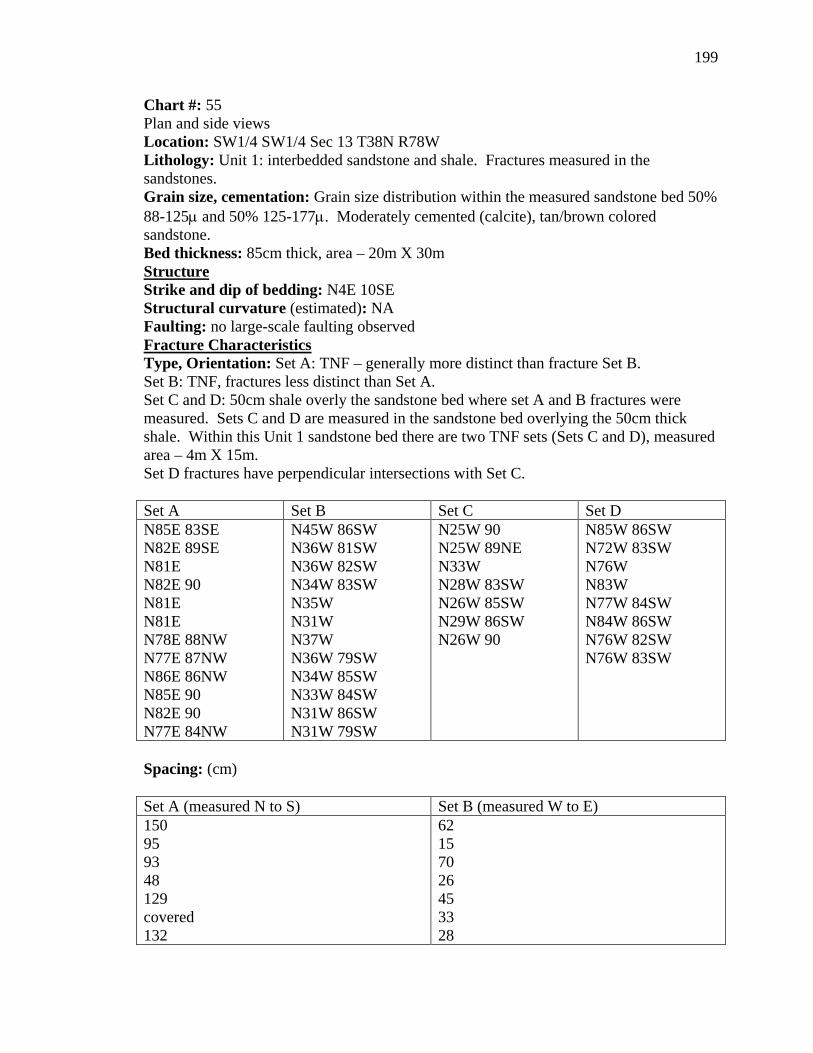
199
Chart #: 55 Plan and side views Location: SW1/4 SW1/4 Sec 13 T38N R78W Lithology: Unit 1: interbedded sandstone and shale. Fractures measured in the sandstones. Grain size, cementation: Grain size distribution within the measured sandstone bed 50% 88-125µ and 50% 125-177µ. Moderately cemented (calcite), tan/brown colored sandstone. Bed thickness: 85cm thick, area – 20m X 30m Structure Strike and dip of bedding: N4E 10SE Structural curvature (estimated): NA Faulting: no large-scale faulting observed
Set A
Fracture Characteristics Type, Orientation: Set A: TNF – generally more distinct than fracture Set B. Set B: TNF, fractures less distinct than Set A. Set C and D: 50cm shale overly the sandstone bed where set A and B fractures were measured. Sets C and D are measured in the sandstone bed overlying the 50cm thick shale. Within this Unit 1 sandstone bed there are two TNF sets (Sets C and D), measured area – 4m X 15m. Set D fractures have perpendicular intersections with Set C.
Set B Set C Set D N85E 83SE N82E 89SE N81E N82E 90 N81E N81E N78E 88NW N77E 87NW N86E 86NW N85E 90 N82E 90 N77E 84NW
N45W 86SW N36W 81SW N36W 82SW N34W 83SW N35W N31W N37W N36W 79SW N34W 85SW N33W 84SW N31W 86SW N31W 79SW
N25W 90 N25W 89NE N33W N28W 83SW N26W 85SW N29W 86SW N26W 90
N85W 86SW N72W 83SW N76W N83W N77W 84SW N84W 86SW N76W 82SW N76W 83SW
Spacing: (cm) Set A (measured N to S) Set B (measured W to E) 150 95 93 48 129 covered 132
62 15 70 26 45 33 28

200
58 72 91 94
88 38 97 26 116 18 77 85
Separation: none apparent Mineralization: 2/3 of Set B fractures are calcite filled – 1mm average up to 2mm. Set C fractures have 1-2mm calcite mineralization, filling original apertures. Surface characteristics: indistinct, planar Relative ages: Set A older than Set B. Some Set B fractures intersect Set A perpendicularly. In second area, Set C older, perhaps related to Set B trend from above. Apertures: Calcite mineralization suggests 1-2mm apertures originally in Set B and Set C fractures, alternatively these could be displacive cements. No mineralization on Set A and Set D fracture surfaces. Deformation Bands (width): NA Note: numerous oyster shells above 8cm thick sandstone interbedded in shales. Also thin lenses of coal 2m stratigraphically above 8cm thick sandstone, then into Unit 3: white beach sandstones. The coals are an anomaly in this part of the stratigraphic section and in this case are interpreted as part of a storm deposit (rip-up clasts).
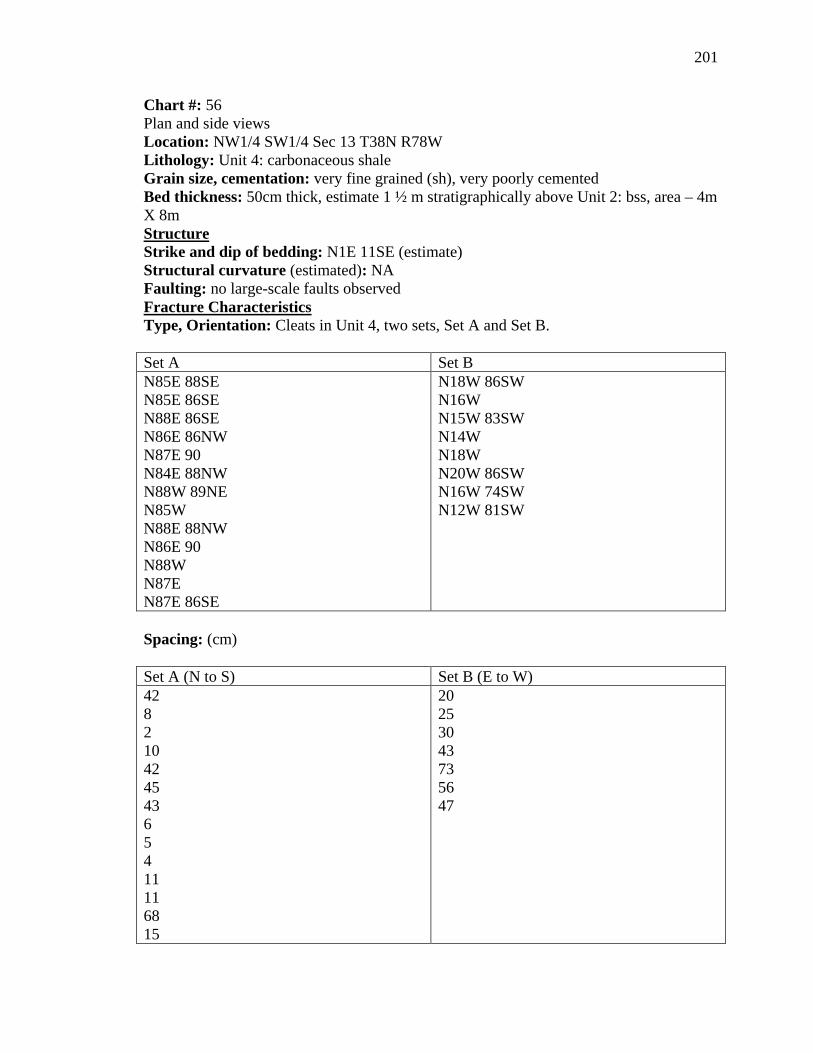
201
Chart #: 56 Plan and side views Location: NW1/4 SW1/4 Sec 13 T38N R78W Lithology: Unit 4: carbonaceous shale Grain size, cementation: very fine grained (sh), very poorly cemented Bed thickness: 50cm thick, estimate 1 ½ m stratigraphically above Unit 2: bss, area – 4m X 8m Structure Strike and dip of bedding: N1E 11SE (estimate) Structural curvature (estimated): NA Faulting: no large-scale faults observed
Set A
Fracture Characteristics Type, Orientation: Cleats in Unit 4, two sets, Set A and Set B.
Set B N85E 88SE N85E 86SE N88E 86SE N86E 86NW N87E 90 N84E 88NW N88W 89NE N85W N88E 88NW N86E 90 N88W N87E N87E 86SE
N18W 86SW N16W N15W 83SW N14W N18W N20W 86SW N16W 74SW N12W 81SW
Spacing: (cm) Set A (N to S) Set B (E to W) 42 8 2 10 42 45 43 6 5 4 11 11 68 15
20 25 30 43 73 56 47

202
Separation: none observed Mineralization: Cleat surfaces are Fe stained. Surface characteristics: planar Relative ages: There exist examples of Set A terminating at Set B and Set B terminating at Set A. Generally more Set B fractures terminate at Set A fractures. Apertures: (mm) few apertures; 1, 2, 2, 1, 4, 1, 5, 1, 2 Deformation Bands (width): NA
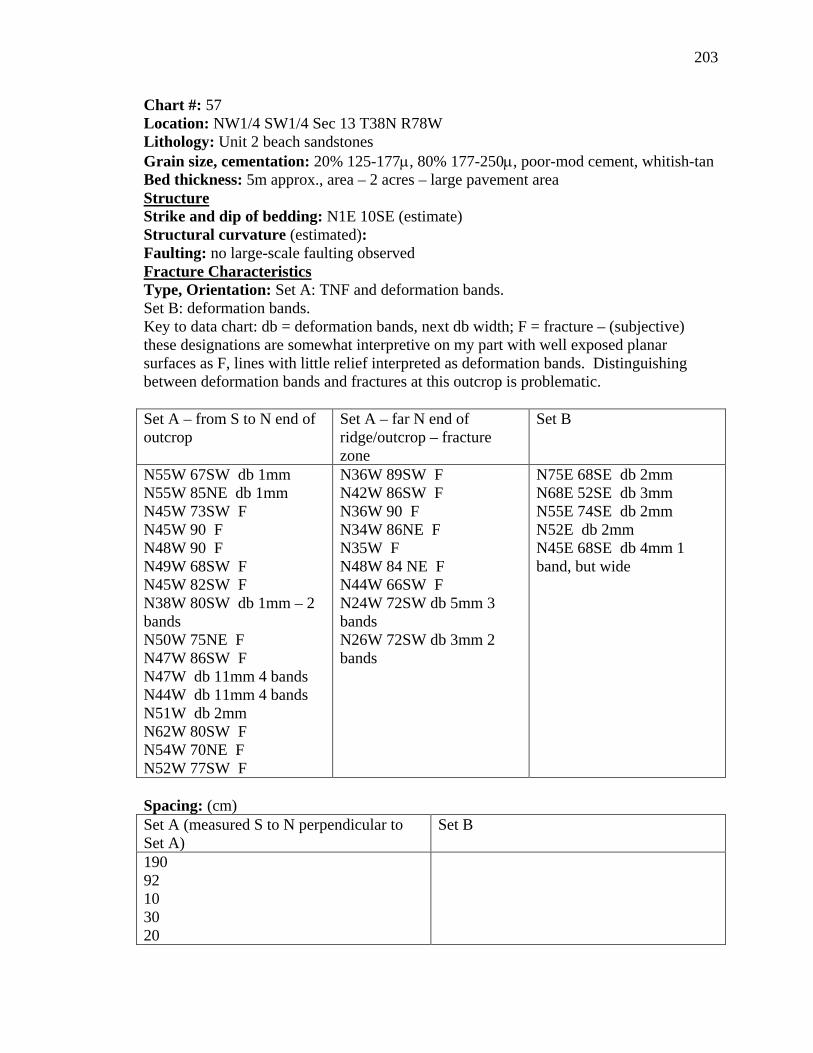
203
Chart #: 57 Location: NW1/4 SW1/4 Sec 13 T38N R78W Lithology: Unit 2 beach sandstones Grain size, cementation: 20% 125-177µ, 80% 177-250µ, poor-mod cement, whitish-tan Bed thickness: 5m approx., area – 2 acres – large pavement area Structure Strike and dip of bedding: N1E 10SE (estimate) Structural curvature (estimated): Faulting: no large-scale faulting observed
Set A – from S to N end of outcrop
Fracture Characteristics Type, Orientation: Set A: TNF and deformation bands. Set B: deformation bands. Key to data chart: db = deformation bands, next db width; F = fracture – (subjective) these designations are somewhat interpretive on my part with well exposed planar surfaces as F, lines with little relief interpreted as deformation bands. Distinguishing between deformation bands and fractures at this outcrop is problematic.
Set A – far N end of ridge/outcrop – fracture zone
Set B
N55W 67SW db 1mm N55W 85NE db 1mm N45W 73SW F N45W 90 F N48W 90 F N49W 68SW F N45W 82SW F N38W 80SW db 1mm – 2 bands N50W 75NE F N47W 86SW F N47W db 11mm 4 bands N44W db 11mm 4 bands N51W db 2mm N62W 80SW F N54W 70NE F N52W 77SW F
N36W 89SW F N42W 86SW F N36W 90 F N34W 86NE F N35W F N48W 84 NE F N44W 66SW F N24W 72SW db 5mm 3 bands N26W 72SW db 3mm 2 bands
N75E 68SE db 2mm N68E 52SE db 3mm N55E 74SE db 2mm N52E db 2mm N45E 68SE db 4mm 1 band, but wide
Spacing: (cm) Set A (measured S to N perpendicular to Set A)
Set B
190 92 10 30 20

204
20 70 3m 10 40 2 40 35 100 Separation: No separation observed on pavement, although large cliff face below should be examined. Thursday a.m., 8/7/97- Hiked to base of cliff to check for offset. Two distinct sections of different cementation within this bed – the upper section is better cemented than the lower section. Most fractures do not extend into the lower unit – estimate 1 out of 5 possibly less. In this cliff view some separation is observed. 2cm normal offset N42W 75NE 2cm normal offset N40W 86NE maximum of 1mm normal offset N40W 74NE – incongruous fracture steps. Mineralization: none Surface characteristics: generally planar Relative ages: relationships indeterminate, possible that Set A is older Apertures: none Deformation Bands (width): See type/strike chart above.

205
Chart #: 58 Plan and side views Location: SW1/4 NE1/4 Sec 13 T38N R78W Lithology: Unit 4: carbonaceous shale Grain size, cementation: very fine grained shale, very poorly cemented , lt. gray shale (bentonite rich) above and below measured unit Bed thickness: 1.3m, area – 3m X 10m Structure Strike and dip of bedding: N4W 10NE (estimate) Structural curvature (estimated): Faulting: no large-scale faulting observed
Set A
Fracture Characteristics Type, Orientation: cleats Set A: thoroughgoing cleats Set B: thoroughgoing cleats, Fe staining extends into shale average 3-5mm. Estimate 1 out of 4 cleats exhibit this trait.
Set B N85W 89NE N88W 84SW N86W 77NE N85W 90 N87W 84NE N83W 87NE N85W 85SW N82W 87NE N87W 88SW N90W 85SW N87W N89W 90 N86W N88W 90
N4E 73NW N6E 55NW N4E 74NW N6E 59NW N4E 72NW N1E 83NW N5E 68NW N1W 66SW N4W 65SW N11E 5SW N6E 54NW
Spacing: (cm) Set A (S to N) Set B (W to E) 20 18 13 17 2 17 15 3 6 8 10 10
18 10 8 22 8 24 24 18 12 6 9 30

206
19 13
9
Separation: none Mineralization: some Fe staining on surfaces Surface characteristics: planar Relative ages: Set A older Apertures: recent apertures near outcrop edge to 0.5cm Deformation Bands (width): NA

207
Chart #: 59 Mostly cliff exposure, upper surface is generally covered. Location: NW1/4 NW1/4 Sec 13 T38N R78W Lithology: Unit 5: fluvial sandstone Grain size, cementation: Grain size distribution within this sandstone is 10% 125-177µ, 80% 177-250µ and 10% 250-350µ. Poorly to moderately cemented sandstone. Bed thickness: 3½ m to 4m thick, measured area – 15m long X 3 ½ to 4m high Structure Strike and dip of bedding: N3W 11NE (estimate) Structural curvature (estimated): Faulting: no large-scale faulting observed
Set A - Strike
Fracture Characteristics Type, Orientation and Spacing (cm): Set A TNF (VE)
Set A – Spacing (measured W to E) N21W 61SW N19W 60SW N22W 61SW N24W 45SW N24W 54SW N21W 59SW N25W 55SW N19W 56SW N18W 51SW N11W 52SW N14W 58SW N16W 58SW
90 35 160 5 15 130 100 210 30 95 38
Separation: none observed Mineralization: One fracture has small vein of gypsum Surface characteristics: planar, some anastomosed surfaces, possible deformation bands in less well cemented areas. Relative ages: only one set observed. Apertures: none Deformation Bands (width): 3 bands (anastomosed) total 8mm

208
Chart #: 60 Location: NW1/4 NW1/4 Sec 13 T38N R78W Lithology: Unit 1: interbedded sandstone and shale (measured bed is sandstone) Grain size, cementation: Grain size distribution within the sandstone bed is 90% 88-125µ and 10% 125-177µ. Moderately cemented (calcite). Bed thickness: 70cm thick – Unit 3: white bss stratigraphically above the measured area. Unit 2 sandstones are absent to very thin (less than 1m) and there is a laterally extensive carbonaceous shale (20cm thick) at base of the Unit 3: white bss - observed while traversing from chart 59 to 60. Structure Strike and dip of bedding: N4W 12NE Structural curvature (estimated): Faulting: no large-scale faulting observed
Set A
Fracture Characteristics Type, Orientation: Set A: TNF. Set B: TNF.
Set B N62E 90 N68E 79SE N76E 90 N74E 82SE N74E 87SE N67E 84SE N68E 85SE N66E 84SE N68E 90 N59E 89NW N70E 86NW N71E 84SE N67E N66E
N32W 85SW N34W 89SW N31W 82SW N34W 87SW N28W 84SW N35W 84SW N44W 78SW N33W 86SW N33W 89NE N30W 84SW N35W 85SW N37W 80SW
Spacing: (cm) Set A (measured N to S) Set B (measured E to W) 134 79 50 50 60 35 45 90 42 92 65 37 26
95 95 64 45 53 103 85 84 69 150 58

209
Separation: none observed Mineralization: Some Set B fractures are observed to be filled with calcite, up to 2mm. Surface characteristics: Planar. Relative ages: 70% of Set B fractures terminate at intersection with Set A fractures. 30% of Set A fractures terminate at intersection with Set B fractures. Formation of the two fracture sets maybe broadly contemporaneous at this locality. Apertures: Up to 2mm (calcite filled) in Set B fractures Deformation Bands (width): NA

210
Chart #: 61 Pavement with partial side (cross-sectional) views. Location: SW1/4 SW1/4 Sec 12 T38N R78W Lithology: Unit 2: upper beach sandstone pavement underlying Unit 3: white bss. Note: the anomalous carbonaceous shale found below Unit 3 (white bss) at the Chart 60 location does not exist at this locality. Therefore, the carbonaceous shale pinches out between Chart 60 location and Chart 61 location. Grain size, cementation: Grain size distribution within this sandstone is 20% 125-177µ, 70% 177-250µ and 10% 250-350µ. Grains are well rounded. Moderately to well cemented, light tan sandstone pavement. Bed thickness: 25cm thick, measured area – 2m X 6m Structure Strike and dip of bedding: N5W 12NE Structural curvature (estimated): NA Faulting: no large-scale faulting observed
Set A
Fracture Characteristics Type, Orientation: Set A: TNF. Set B: TNF.
Set B N74E 79SE N78E 70SE N77E 82SE N68E N72E 86SE N72E 84SE N69E 87SE N71E 84SE N73E 85SE N73E 85NW N74E 88NW XF to A (not mineralized) N19W 81SW N19W 83SW N17W 84SW
N60W 82SW N64W 80SW N62W N63W 77SW N70W N58W N61W 78SW
Spacing: (cm) Set A (measured S to N) Set B (measured W to E) 26 12 24 25 12 13 12 20 15
42 68 74 20 18 13 47 25

211
13 14 17 12 15 7 11 Separation: none Mineralization: 1-2mm wide calcite mineralization within some fractures (in both sets) that fill the fracture apertures completely. Surface characteristics: none visible. Relative ages: Set A fractures older interpreted from abutting relationships. Apertures: 1-2mm. Pavement in road 10m to the NE has numerous mineralized (calcite) fractures; most apertures are1-2mm and calcite filled. One 10mm wide aperture has 3mm thick calcite on each opposing fracture face. Deformation Bands (width):
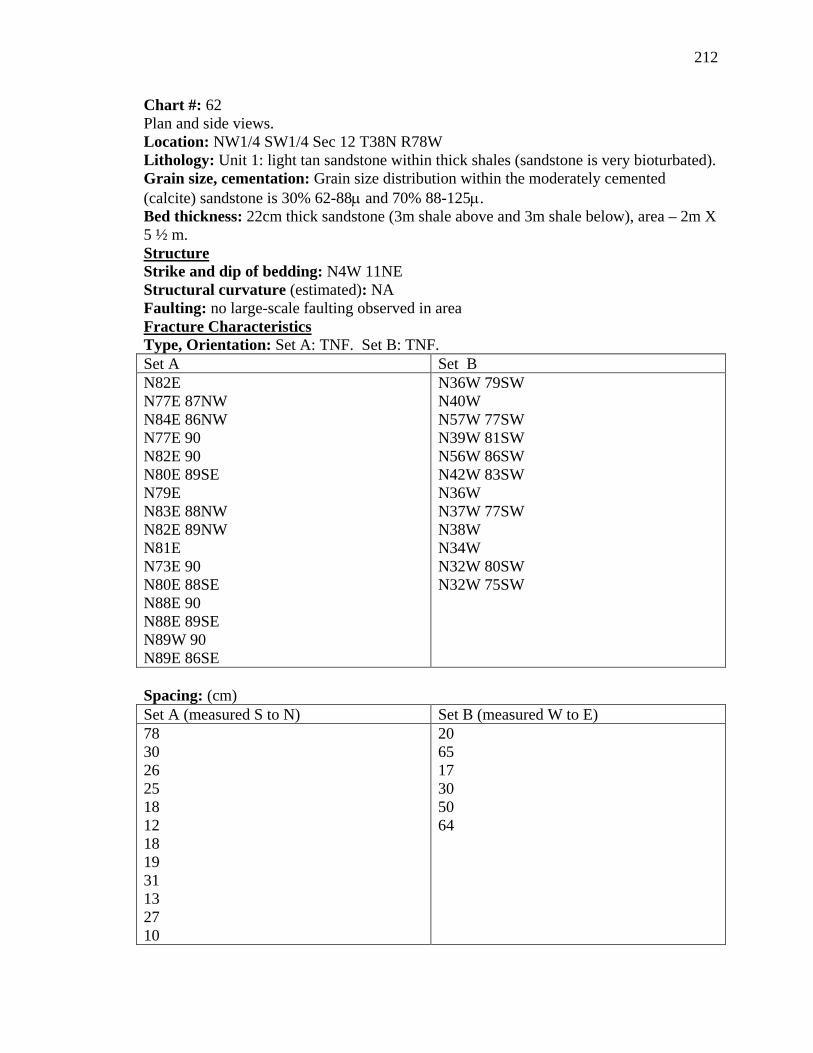
212
Chart #: 62 Plan and side views. Location: NW1/4 SW1/4 Sec 12 T38N R78W Lithology: Unit 1: light tan sandstone within thick shales (sandstone is very bioturbated). Grain size, cementation: Grain size distribution within the moderately cemented (calcite) sandstone is 30% 62-88µ and 70% 88-125µ. Bed thickness: 22cm thick sandstone (3m shale above and 3m shale below), area – 2m X 5 ½ m. Structure Strike and dip of bedding: N4W 11NE Structural curvature (estimated): NA Faulting: no large-scale faulting observed in area
Set A
Fracture Characteristics Type, Orientation: Set A: TNF. Set B: TNF.
Set B N82E N77E 87NW N84E 86NW N77E 90 N82E 90 N80E 89SE N79E N83E 88NW N82E 89NW N81E N73E 90 N80E 88SE N88E 90 N88E 89SE N89W 90 N89E 86SE
N36W 79SW N40W N57W 77SW N39W 81SW N56W 86SW N42W 83SW N36W N37W 77SW N38W N34W N32W 80SW N32W 75SW
Spacing: (cm) Set A (measured S to N) Set B (measured W to E) 78 30 26 25 18 12 18 19 31 13 27 10
20 65 17 30 50 64
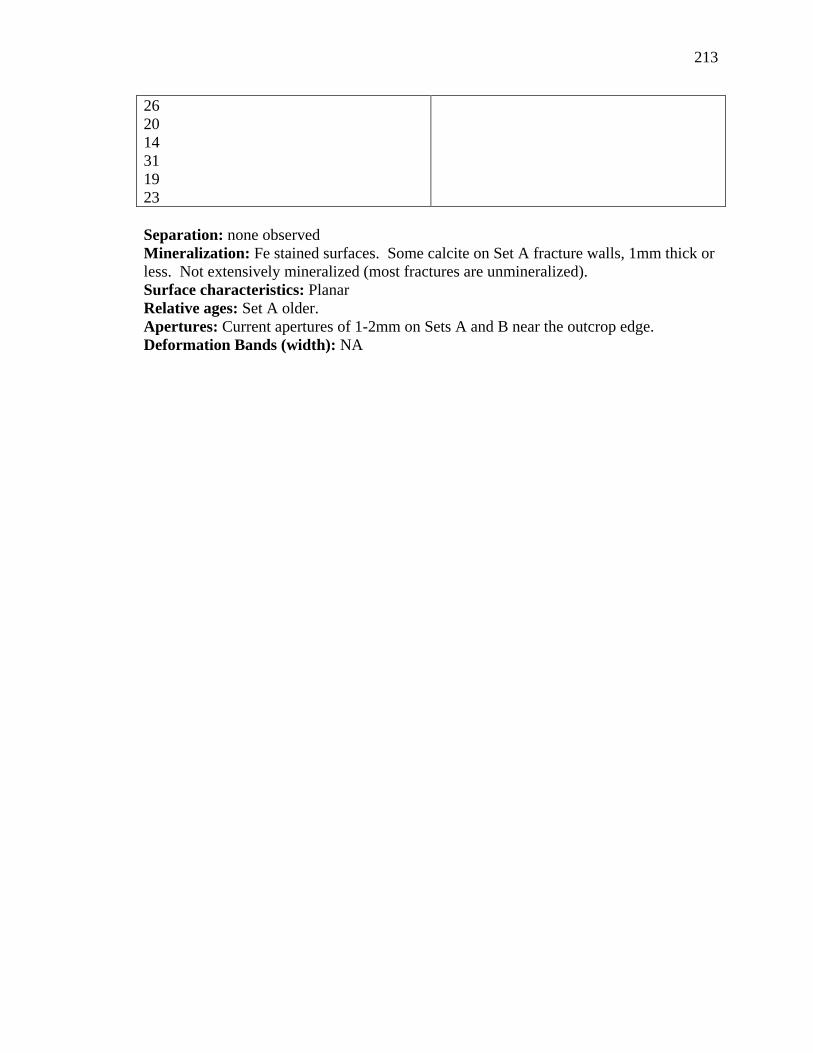
213
26 20 14 31 19 23 Separation: none observed Mineralization: Fe stained surfaces. Some calcite on Set A fracture walls, 1mm thick or less. Not extensively mineralized (most fractures are unmineralized). Surface characteristics: Planar Relative ages: Set A older. Apertures: Current apertures of 1-2mm on Sets A and B near the outcrop edge. Deformation Bands (width): NA
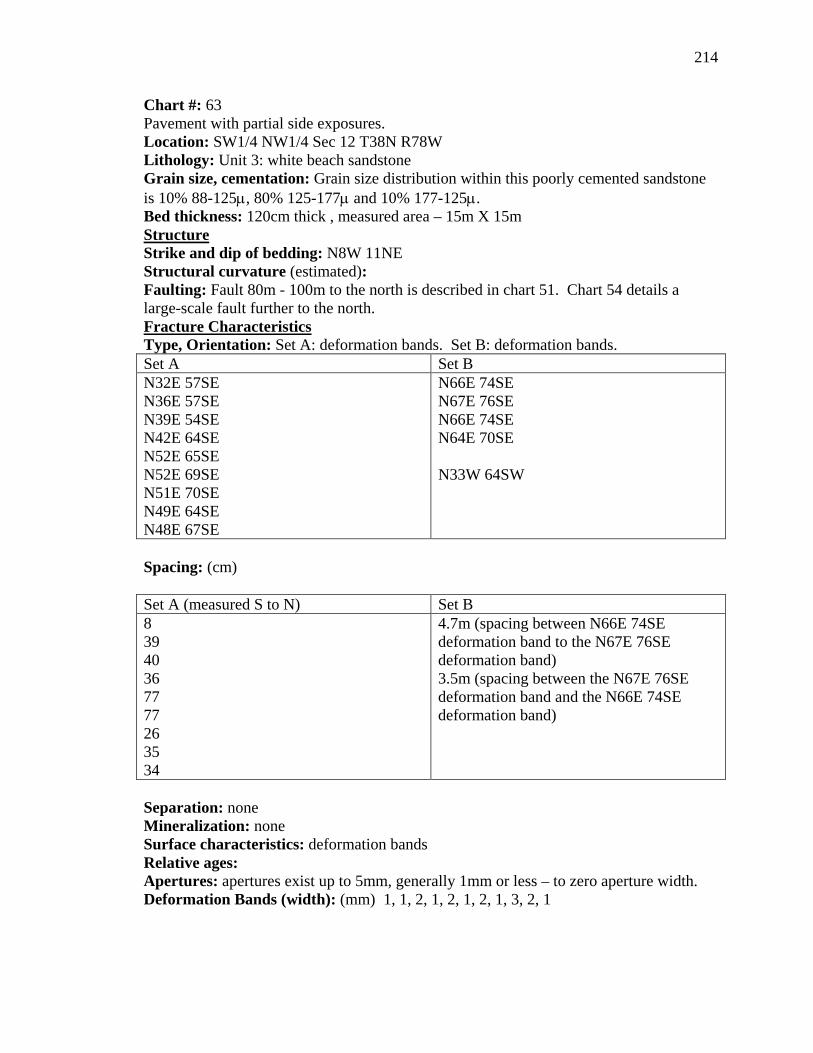
214
Chart #: 63 Pavement with partial side exposures. Location: SW1/4 NW1/4 Sec 12 T38N R78W Lithology: Unit 3: white beach sandstone Grain size, cementation: Grain size distribution within this poorly cemented sandstone is 10% 88-125µ, 80% 125-177µ and 10% 177-125µ. Bed thickness: 120cm thick , measured area – 15m X 15m Structure Strike and dip of bedding: N8W 11NE Structural curvature (estimated): Faulting: Fault 80m - 100m to the north is described in chart 51. Chart 54 details a large-scale fault further to the north.
Set A
Fracture Characteristics Type, Orientation: Set A: deformation bands. Set B: deformation bands.
Set B N32E 57SE N36E 57SE N39E 54SE N42E 64SE N52E 65SE N52E 69SE N51E 70SE N49E 64SE N48E 67SE
N66E 74SE N67E 76SE N66E 74SE N64E 70SE N33W 64SW
Spacing: (cm) Set A (measured S to N) Set B 8 39 40 36 77 77 26 35 34
4.7m (spacing between N66E 74SE deformation band to the N67E 76SE deformation band) 3.5m (spacing between the N67E 76SE deformation band and the N66E 74SE deformation band)
Separation: none Mineralization: none Surface characteristics: deformation bands Relative ages: Apertures: apertures exist up to 5mm, generally 1mm or less – to zero aperture width. Deformation Bands (width): (mm) 1, 1, 2, 1, 2, 1, 2, 1, 3, 2, 1

215
Other observations: This area was also charted to detail an observed hexagonal (elephant skin) weathering pattern (Howard and Kochel, 1988). Small hexagons penetrate the surface of this bed up to 30cm. These features are not all hexagons, pentagons and squares are also exist. These features are interpreted as recent and not included in the fracture study. These features are primarily found in Units 2 and 3 at a variety of locations around the rim of Teapot Dome. Larger, to 3m diameter, similar structures are found in other locations. This outcrop contains smaller hexagons within larger hexagonal structures. Fractures and deformation bands found in areas with these weathering features can be difficult to distinguish. Trends of hexagonal margins Trends of hexagonal margins N40E N63W N15W N83W N10W N64E N39W
N82W N29E N3E N15E N64W N36W N30E
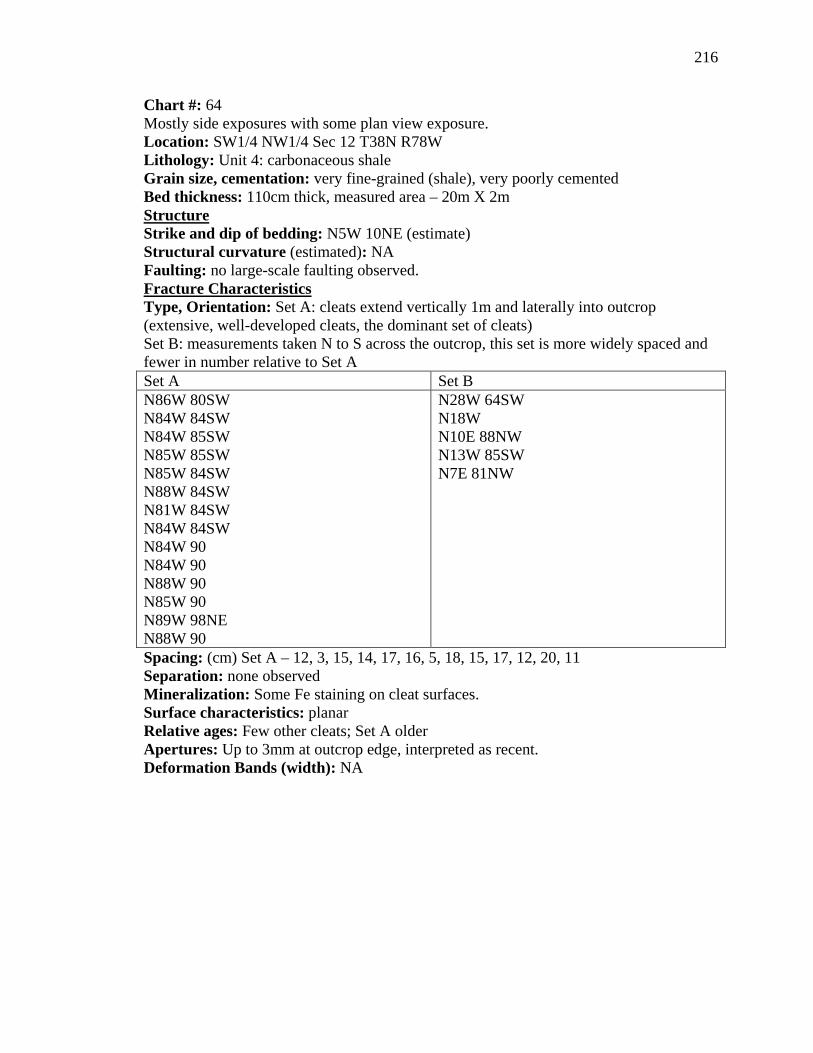
216
Chart #: 64 Mostly side exposures with some plan view exposure. Location: SW1/4 NW1/4 Sec 12 T38N R78W Lithology: Unit 4: carbonaceous shale Grain size, cementation: very fine-grained (shale), very poorly cemented Bed thickness: 110cm thick, measured area – 20m X 2m Structure Strike and dip of bedding: N5W 10NE (estimate) Structural curvature (estimated): NA Faulting: no large-scale faulting observed.
Set A
Fracture Characteristics Type, Orientation: Set A: cleats extend vertically 1m and laterally into outcrop (extensive, well-developed cleats, the dominant set of cleats) Set B: measurements taken N to S across the outcrop, this set is more widely spaced and fewer in number relative to Set A
Set B N86W 80SW N84W 84SW N84W 85SW N85W 85SW N85W 84SW N88W 84SW N81W 84SW N84W 84SW N84W 90 N84W 90 N88W 90 N85W 90 N89W 98NE N88W 90
N28W 64SW N18W N10E 88NW N13W 85SW N7E 81NW
Spacing: (cm) Set A – 12, 3, 15, 14, 17, 16, 5, 18, 15, 17, 12, 20, 11 Separation: none observed Mineralization: Some Fe staining on cleat surfaces. Surface characteristics: planar Relative ages: Few other cleats; Set A older Apertures: Up to 3mm at outcrop edge, interpreted as recent. Deformation Bands (width): NA

217
Chart #: 65 Plan view with side exposure Location: NW1/4 SW1/4 Sec 12 T38N R78W Lithology: Unit 5: fluvial sandstone (channel) Grain size, cementation: Grain size distribution within the measured sandstone is 5% 88-125µ, 10% 125-177µ, 80% 177-250µ and 5% 250-350µ. This is a moderately cemented, light tan sandstone with some Fe enrichment. Bed thickness: 2m thick, measured area – 5m X 15m Structure Strike and dip of bedding: N4W 11NE (estimate) Structural curvature (estimated): NA Faulting: no large-scale faulting observed
Set A
Fracture Characteristics Type, Orientation: Set A: TNF (possible VE). Fractures extend completely across the outcrop. Set B: XF (fewer in number relative to Set A)
Set B N36W 85SW N35W 89SW N32W 86SW N21W 90 N34W 82SW N27W 84SW N38W 85SW N38W 87SW N40W 90 N38W 87SW N38W 85SW N32W 87SW N35W 85SW N34W 83SW N35W 85SW
N53E 65NW N46E 73NW N55E 68NW N59E 68NW N57E 67NW
Spacing: (cm) Set A (measured E to W across outcrop) Set B 66 116 86 50 106 142 78 64 129 108 110 110
185cm spacing between the fracture striking N55E 68NW and the fracture striking N59E 68NW. Spacing between the other fractures was undetermined due to exposure. Spacing on these is inferred to be greater than 2m.

218
105 92 Separation: Possible 1cm offset (normal) on 2 Set A fractures. However, this is observed along a very rugged cliff exposure. Therefore these displacements maybe recent. Mineralization: none – looking at cliff exposure 1 fracture has splotchy (1mm wide) coating of calcite on the fracture wall. Calcite coatings on the other fracture surfaces may have eroded off or is not visible in plan view. Surface characteristics: Planar Relative ages: Set A older. Apertures: none Deformation Bands (width): NA

219
Chart #: 66 Graben Location: SE1/4 SE1/4 Sec 35 T38N R78W Lithology: Unit 4: Carbonaceous shale down dropped to stratigraphic level of Unit 1: interbedded Ss and shale. Both fractures and cleats of Units 1 and 4 respectively were measured at this location. Area: approximately ¼ section
Structure Strike and dip of bedding: Measured on a Unit 1 sandstone, N45W 14NE. Structural curvature (estimated): NA Faulting: Finger ridge on N end is composed of fault slivers of Unit 1: interbedded sandstone and shale. Fracture orientations along this ridge include N65E 88SE, N67E 85SE, N69E 86SE. Slickenlines with 200 rake to west are recorded on a fault plane striking N65E 88SE within this ridge. Some fracture patterns (see diagram below) and slickensides indicate right lateral shear. At the far northeastern corner of this ridge a major fault is observed with 40-45m stratigraphic separation. Orientation of this fault is N65E 85SE.
Set A - strike
Fracture Characteristics Type, Orientation: Set A: top of ridge NE corner, fractures measured S to N from the large-scale fault within a 160cm thick Unit 1 sandstone. The sandstone is moderately cemented with a grain size distribution of 90% 88-125µ and 10% 125-177µ.
Set A – spacing (cm) N62E N66E 74NW N65E 70SE N68E 75NW N67E 80NW N66E 62SE N65E 82NW N65E 73NW N63E 73NW N65E 79NW N66E 70SE N66E 84NW N69E 85SE N56E 77NW
20 46 65 72 96 125 345 365 1130 1258 1319 1637 1706

220
Set B: Same sandstone bed described above for Set A fractures, these TNF’s curve to have near perpendicular intersections with the large-scale fault, the actual area of fracture fault intersection is covered therefore the intersection angle is inferred. Curving begins 6-8m out from the fault. Fractures measured E to W across the outcrop. Set B - strike away from fault Set B – near fault N13W 74SW N14W 68SW N11W 87SW
N42W 75SW N33W 83SW N50W 84SW
Coal (carbonaceous shale cleats in fault block)
Continued
N56E 73SE N59E N58E 77SE N58E 86SE N72E90 N64E 68SE N76E 76SE
N26W 70NE N15W 84SW Note – carbonaceous shale bent upward at fault margin
Spacing: Set A fracture spacing measured in a second transect starting at the large-scale fault, 3, 1, 3, 20, 25, 20, 5, 22, 29, 28, 45, 52, 4, 800 (cm). Set B – 3.4m (N42W 75SW fracture to N33W 83SW fracture) 6.3m (N33W 83SW fracture to N50W 84SW fracture). Separation: 40-45m normal offset on graben. 5+m offset on some fault slivers Mineralization: Most fractures are not mineralized however some fracture surfaces coated with calcite (up to 2.5mm on a single fracture wall) and cubic pyrite. Surface characteristics: One area - slickensides on fault sliver. Relative ages: Set A older. Apertures: Generally none Deformation Bands (width): NA Other observations: Stratigraphic units appear to have same elevation on opposite sides of graben. South side of graben: - Good pavement for taking fracture measurements unavailable, unlike N side. - Coal beds bend upward at fault zone. - Ss and shale – possibly bend down into fault. - Ss and shale very broken, extensive calcite mineralization 1-3mm width average. - Fault orientation at ridge top is N65E 85NW (dip approx.). - Fault orientation to E, estimate at N55E 85NW.

221
Chart #: 67 Plan and side views Location: NW1/4 SE1/4 Sec 35 T38N R78W Lithology: Unit 1: sandstone interbedded in shale Grain size, cementation: Bed thickness: area – fault zone extends approx. ½ mile to E Structure Strike and dip of bedding: N40W 11NE Structural curvature (estimated): beginning N end curvature 1km? Faulting: This is a description of a large-scale fault. Fault zone approx. 10m wide. Fracture Characteristics Type, Strike: N65E 85SE Spacing: (cm) Separation: Normal displacement down approx. 20m to south as estimated from stratigraphic separation of Unit 3 white sandstones and Unit 1 sandstones and shales. Mineralization: calcite mineralization in some fractures Surface characteristics: Relative ages: Apertures: Deformation Bands (width): NA

222
Chart #: 68 Location: SE1/4 SE1/4 Sec 22 T38N R78W Lithology: Fractures on north side of fault are in light tan Unit 5 fluvial sandstone (channel), with moderate cement. Grain size, cementation: 10% 88-125µ, 80% 125-177µ, 10% 177-250µ, poor-mod cementation in bss Bed thickness: Area – 10-acre approx.
Set A
Structure Strike and dip of bedding: N35W 14SW Structural curvature (estimated): entering southern hinge, approx. 1km curvature. Faulting: Graben: 1m offset, 20-25 yards wide, N60E 86o dip. Fractures are TNF’s.
Set B N58W 73NE N60W 84NE N61W 85NE N57W 85NE N58W 81NE N56W 80NE N60W 81NE
N14W 84NE N13W 85NE N6W 88NE N11W 78NE N12W 87NE N14W 85NE N7W 84NE N9W 83NE N7W 86NE
Set A trend more abundant on W end of outcrop.
Set A
Fracture Characteristics Type, Orientation: Fracture orientation in * area of map – Unit 2 bss, 30cm average spacing in a 8m square area.
Set B N64W 86NE N74W 71NE N72W 85NE N68W 90 N68W 83NE N78W 78NE
N65E 65SE
Spacing: (cm) 30cm average
Set A- measurements S to N from fault zone that shows shear
Fracture Characteristics Type, Strike: Fault zone North end, orientation N45E 85NW, wide area 25-30m, two isolated blocks in zone each down to North. The following are orientations in Unit 2 bss.
Set B Set C – deformation bands in Unit 3 sandstone Same general orientation as Set A
Along cliff face Some surfaces show incongruous fracture steps
N45E 71NW N43E 78NW N43E 52NW
N15W 70NE N16W 68NE N13W 80NE
N47E N44E 50SE N50E 90
N46E 67SE N42E 74NW N41E 73SE
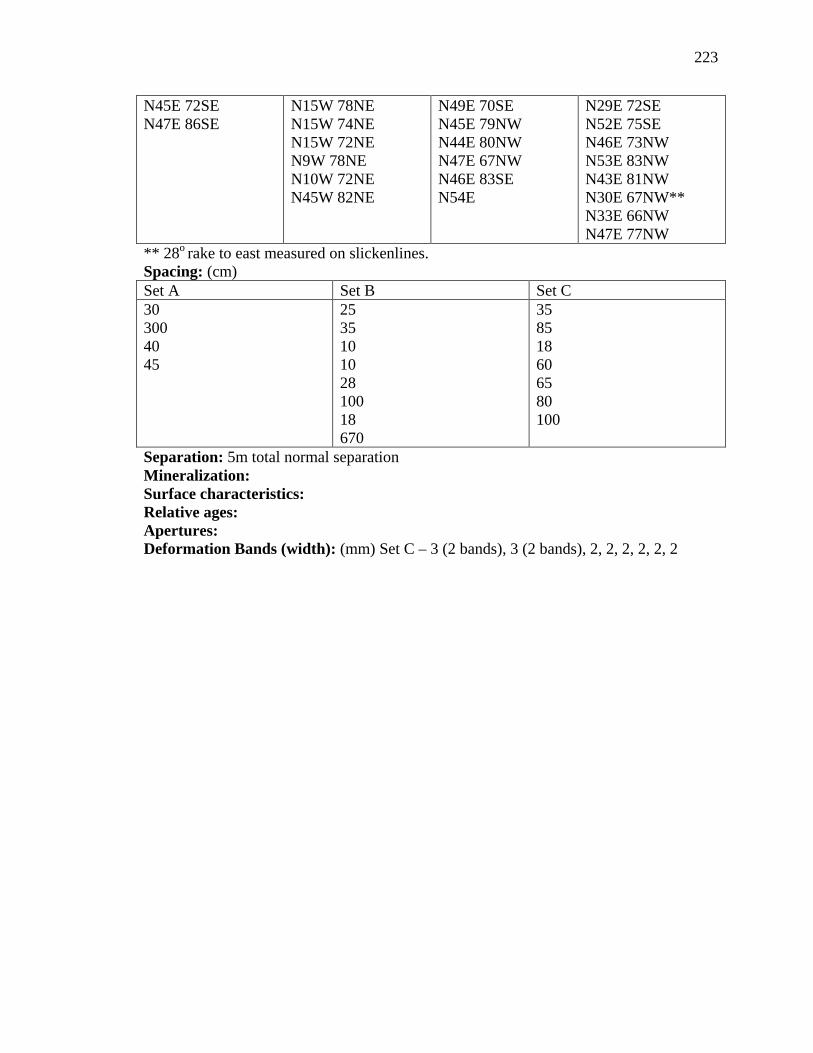
223
N45E 72SE N47E 86SE
N15W 78NE N15W 74NE N15W 72NE N9W 78NE N10W 72NE N45W 82NE
N49E 70SE N45E 79NW N44E 80NW N47E 67NW N46E 83SE N54E
N29E 72SE N52E 75SE N46E 73NW N53E 83NW N43E 81NW N30E 67NW** N33E 66NW N47E 77NW
** 28o rake to east measured on slickenlines. Spacing: (cm) Set A Set B Set C 30 300 40 45
25 35 10 10 28 100 18 670
35 85 18 60 65 80 100
Separation: 5m total normal separation Mineralization: Surface characteristics: Relative ages: Apertures: Deformation Bands (width): (mm) Set C – 3 (2 bands), 3 (2 bands), 2, 2, 2, 2, 2, 2

224
Chart 68: Field map
*

225
Chart #: 69 Plan and side views Location: NW1/4 NW1/4 Sec 12 T38N R78W Lithology: FGRSs within Unit 1: interbedded sandstones and shales. Grain size, cementation: Grain size distribution within the sandstone 85% 62-88µ, 10% 88-125µ and 5% 125-177µ. Moderate to well cemented (reddish color, Fe enriched). Bed thickness: 35cm thick; measured area – 10m X 10m Structure Strike and dip of bedding: N10W 10NE N9W 9NE Structural curvature (estimated): NA Faulting: 40m to E of charted area a fault places unit 4 carbonaceous shales against Unit 3 white sandstones, orientation N65E 54NW. Fracture orientations within Unit 1 sandstones near the fault are: N67E 55NW * N65E 57NW * N64E 57NW * * N end of fault zone; spacing 25cm average for these three fractures South side of main fault zone a subsidiary fault oriented N55W 69NE has 25cm normal stratigraphic separation within Unit 1 interbedded marine sandstones and shales.
Set A
Fracture Characteristics Type, Orientation: Set A: TNF, measured S to N across outcrop, perpendicular to fracture strike. Set B; XF, measured E to W, irregular strike, dips difficult to obtain due to irregular pavement surface.
Set B N52E 90 N54E 90 N57E 90 N58E N48E 89SE N83E 89NW N51E 90 N57E 90 N58E 88NW N60E 89NW N51E N62E N65E N64E 84SE N65E 90 N69E 90 N67E N64E 90
N37W 90 N52W N29W 84SW N24W N34W 88SW N2W 88SW N4W N22W N23W N29W 90 N11W 85SW N50W 85SW N22W 88NE N36W N31W N8W 78SW N12W 83SW

226
Spacing: (cm) Set A (measured S to N) Set B (measured E to W) 34 20 25 27 45 39 26 24 33 19 3 59 17 56 5 38
20 10 20 45 30 38 60 30 33 35 43 55
Separation: not observed in fractures – see fault description. Mineralization: near faulted area 1-2mm wide calcite on some surfaces, not extensive. No mineralization observed on fractures in FGRSs pavement. Surface characteristics: Difficult to observe fracture surfaces due to very poor (irregular) pavement surface. Set A much better developed and extensive relative to Set B. Relative ages: Set A older than Set B (cannot tell age relation between fault and Set A) Apertures: generally none up to 2mm near outcrop edge Deformation Bands (width): NA

227
Chart #: 70 Plan and side views Location: NW1/4 SW1/4 Sec1 T38N R78W Lithology: Unit 5: fluvial (channel) sandstone Grain size, cementation: Grain size distribution within the measured sandstone bed 90% 62-88µ and 10% 88-125µ. Red colored, moderately cemented sandstone. Bed thickness: Total thickness of fluvial unit is 3.5m. The upper 50cm of this unit is relatively better cemented compared to the underlying 3m of sandstone. Measured bed thickness for this site is 50cm. Structure Strike and dip of bedding: N14W 13NE Structural curvature (estimated): NA Faulting: no large-scale faulting observed
Set A
Fracture Characteristics Type, Orientation: Set A: TNF. Set B: TNF.
Set B N44W 76SW N40W 85NE N42W 83SW N46W 81SW N43W 80SW N48W 90 N26W 88NE N47W 84SW N51W 76SW N14W 86NE N41W 89NE N54W 88SW
N75E 86SE N76E 88SE N74E 84SE N83E 86SE N74E 86NW N74E 90 N72E 87SE N76E 89SE N73E 87SE
Spacing: (cm) measured perpendicular to strike of each set Set A Set B 85 48 102 104 57 70 40 35 72 50
30 35 29 55 38 20 52 20
Separation: none observed

228
Mineralization: none observed at measured area – to north in the same lithologic unit, some calcite on Set A fractures was observed. 1mm wide calcite filled aperture. Surface characteristics: no distinct surface characteristics Relative ages: Set A older Apertures: primarily recent openings at cliff edge Deformation Bands (width): NA
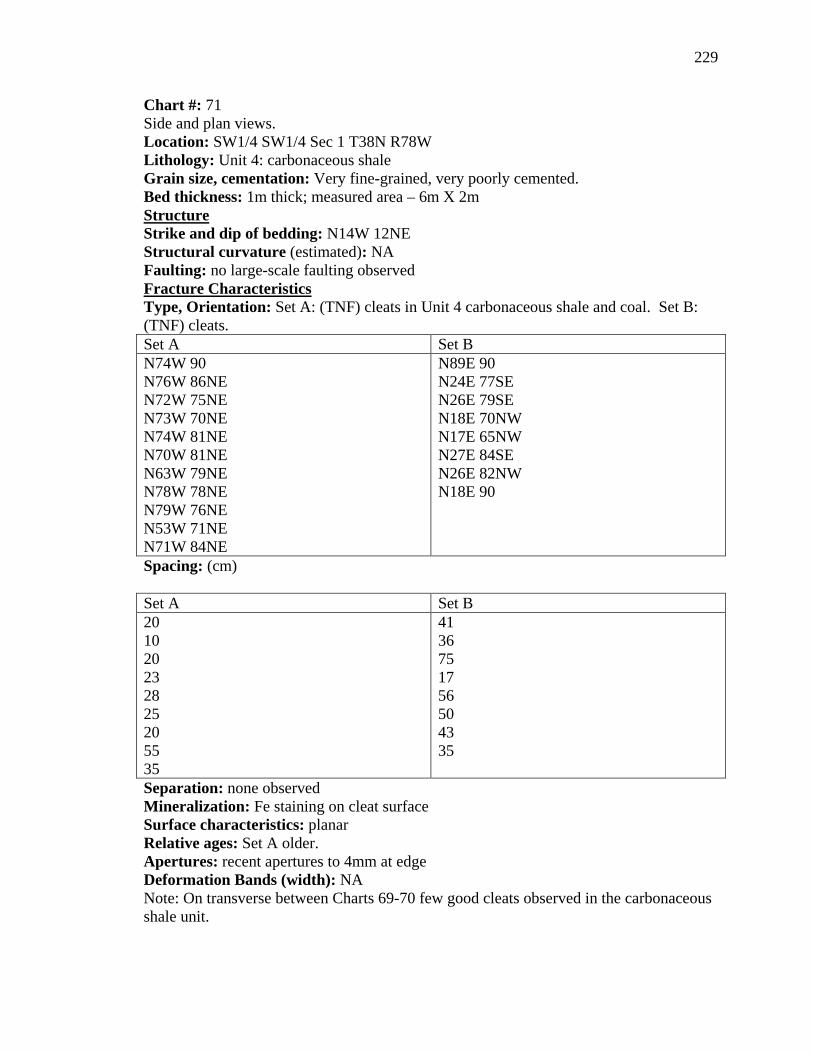
229
Chart #: 71 Side and plan views. Location: SW1/4 SW1/4 Sec 1 T38N R78W Lithology: Unit 4: carbonaceous shale Grain size, cementation: Very fine-grained, very poorly cemented. Bed thickness: 1m thick; measured area – 6m X 2m Structure Strike and dip of bedding: N14W 12NE Structural curvature (estimated): NA Faulting: no large-scale faulting observed
Set A
Fracture Characteristics Type, Orientation: Set A: (TNF) cleats in Unit 4 carbonaceous shale and coal. Set B: (TNF) cleats.
Set B N74W 90 N76W 86NE N72W 75NE N73W 70NE N74W 81NE N70W 81NE N63W 79NE N78W 78NE N79W 76NE N53W 71NE N71W 84NE
N89E 90 N24E 77SE N26E 79SE N18E 70NW N17E 65NW N27E 84SE N26E 82NW N18E 90
Spacing: (cm) Set A Set B 20 10 20 23 28 25 20 55 35
41 36 75 17 56 50 43 35
Separation: none observed Mineralization: Fe staining on cleat surface Surface characteristics: planar Relative ages: Set A older. Apertures: recent apertures to 4mm at edge Deformation Bands (width): NA Note: On transverse between Charts 69-70 few good cleats observed in the carbonaceous shale unit.

230
Chart #: 72 Plan and side views. Location: SW1/4 NW1/4 Sec 1 T38N R78W Lithology: Unit 3: white beach sandstone (snowy white) Grain size, cementation: Grain size distribution within the measured bed is 10% 125-177µ, 80% 177-250µ and 10% 250-350µ. Poorly cemented sandstone. Bed thickness: 5m thick; measured area – 15m X 5m Structure Strike and dip of bedding: N18W 13NE Structural curvature (estimated): NA Faulting: no large-scale faulting observed Fracture Characteristics Type, Strike: Set A: deformation bands. N38W 84NE, N35W 80SW, N32W 76NE, N39W 78SW, N34W 76NE Spacing: (cm) 40, 320, 135, 200 Separation: none observed Mineralization: no mineralization Surface characteristics: planar Relative ages: only one set of deformation bands Apertures: none Deformation Bands (width): 2, 2, 2, 2, 1mm Notes: Hexagonal (elephant skin) weathering pattern also observed (ignored during measurements of deformation bands).

231
Chart #: 73 Fault description. Location: SW1/4 SW1/4 Sec 1 T38N R78W Lithology: Unit 1 and Unit 2 sandstones Grain size, cementation: Bed thickness: Structure Strike and dip of bedding: N15W 14NE Structural curvature (estimated): NA Faulting: Fault zone is approximately 30m wide with one primary slip surface. 5m of normal stratigraphic separation, orientation of the primary slip surface is N65E 85NW. Fracture/Fault Characteristics Type, Orientation: Fracture orientations within Unit 2 sandstones. These measurements are within the damage zone south of the primary fault surface. N66E 65NW, N69E 73NW, N65E 70NW, N64W 81SW, N64W 78SW, N64W 78NW Spacing: (cm) Separation: 5m displacement Mineralization: calcite mineralization with associated fractures Surface characteristics: Relative ages: Apertures: NA Deformation Bands (width): NA
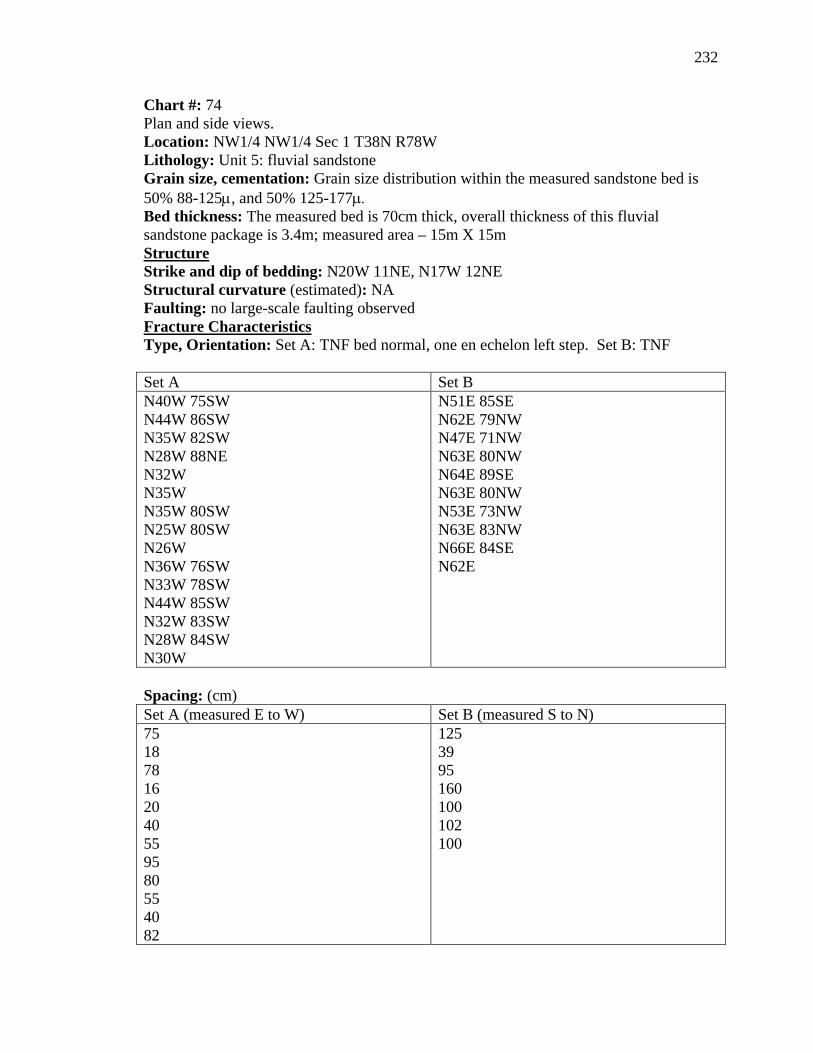
232
Chart #: 74 Plan and side views. Location: NW1/4 NW1/4 Sec 1 T38N R78W Lithology: Unit 5: fluvial sandstone Grain size, cementation: Grain size distribution within the measured sandstone bed is 50% 88-125µ, and 50% 125-177µ. Bed thickness: The measured bed is 70cm thick, overall thickness of this fluvial sandstone package is 3.4m; measured area – 15m X 15m Structure Strike and dip of bedding: N20W 11NE, N17W 12NE Structural curvature (estimated): NA Faulting: no large-scale faulting observed
Set A
Fracture Characteristics Type, Orientation: Set A: TNF bed normal, one en echelon left step. Set B: TNF
Set B N40W 75SW N44W 86SW N35W 82SW N28W 88NE N32W N35W N35W 80SW N25W 80SW N26W N36W 76SW N33W 78SW N44W 85SW N32W 83SW N28W 84SW N30W
N51E 85SE N62E 79NW N47E 71NW N63E 80NW N64E 89SE N63E 80NW N53E 73NW N63E 83NW N66E 84SE N62E
Spacing: (cm) Set A (measured E to W) Set B (measured S to N) 75 18 78 16 20 40 55 95 80 55 40 82
125 39 95 160 100 102 100

233
Separation: none observed Mineralization: no visible mineralization; however, fracture surfaces are raised (erosion resistant) Surface characteristics: none observed Relative ages: Set A older Apertures: recent apertures to 1mm Deformation Bands (width):

234
Chart #: 75 Pavement Location: NE1/4 NE1/4 Sec 2 T38N R78W Lithology: Unit 1: interbedded sandstone and shale. Measured bed is sandstone. Grain size, cementation: Grain size distribution within the measured sandstone bed is 20% 88-125µ, 40% 125-177µ and 40% 177-250µ. This light tan sandstone is moderately cemented, not as Fe stained as some pavements. Bed thickness: 90cm thick, approximately 3-4m stratigraphically below Unit 3: white beach sandstone. Structure Strike and dip of bedding: N25W 10NE, N18W 11NE, N20W 11NE These are possible cross beds overall orientation estimate N20W 10NE. Structural curvature (estimated): Nearing area of northern plunge. Faulting: No large-scale faulting observed between charts 74 and 75.
Set A (S to N)
Fracture Characteristics Type, Orientation: Set A: TNF. Set B: TNF. Set C: XF (possible TNF).
Set B (S to N) Set C (E to W) N25E 72NW N25E 82NW N29E 81NW N29E 76NW
N56E 90 N58E 85NW N55E 86NW N56E N60E 90 N52E N48E 88NW * N42E N55E 86NW N57E 88NW N53E 90 N54E
N32W 79SW N25W N30W 83SW N33W 83SW N32W N32W 82SW N32W N30W 81SW N28W 85SW
* curves to parallel Set A at intersection Spacing: (cm) Set A Set B Set C 107 125 125
20 3 3 33 18 28 22 100 80 24 14
152 25 118 80 22 14 30 70

235
Separation: none observed Mineralization: none Surface characteristics: Relative ages: Set A oldest. Set B next oldest. Set C is the youngest. Apertures: Decrease to zeros away from outcrop edge. Recent apertures at outcrop edge to 3mm, 1mm average Deformation Bands (width): NA

236
Chart #: 76 Plan view Location: SE1/4 SE1/4 Sec 35 T39N R78W Lithology: Unit 2: upper beach sandstone Grain size, cementation: Grain size distribution within the measured sandstone bed is 15% 125-177µ, 80% 177-250µ and 5% 250-350µ. This is a poorly to moderately cemented light gray sandstone. Bed thickness: 2.5m thick, measured area – 12m X 6m Structure Strike and dip of bedding: N30W 14NE Structural curvature (estimated): North end of anticline curvature undetermined. This is due to the lack of Mesaverde Formation exposures along the northern plunge of the anticline. Faulting: Graben described in Chart 66 is 300-400m to the south of this charted (chart 76) location.
Set A (W to E)
Fracture Characteristics Type, Orientation: Set A: TNF (VE). Set B: TNF (possible XF?)
Set B (S to N) N1W 73SW N0W 76W N1W 74SW N2W 70SW N1E 71NW N0 81E N4W 85SW N1W 74SW N0W
N84E N85E N84E 84SE N86E N87E 88SE N87E 87SE N86E 90 N87W 88SW
Spacing: (cm) Set A Set B 220 55 170 73 41 66 65 109
105 258 85 57 86 90
Separation: no visible offset Mineralization: none Surface characteristics: none distinguishable Relative ages: Set A older Apertures: none Deformation Bands (width): NA

237
Chart #: 77 Side view (cliff exposure) Location: SW1/4 SW1/4 Sec 35 T39N R78W Lithology: Sandstone within Unit 1: interbedded sandstones and shales. Grain size, cementation: Grain size distribution within the measured sandstone bed 80% 62-88µ and 20% 88-125µ. Moderately cemented sandstone. Bed thickness: 31cm thick; measured area – cliff exposure – 10m long X 6m high Structure Strike and dip of bedding: N28W 11NE Structural curvature (estimated): North end of anticline curvature undetermined. This is due to the lack of Mesaverde Formation exposures along the northern plunge of the anticline. Faulting: Uphill and 20m south of the charted outcrop a fault is expressed in a 2m wide break in the rock unit. The 2m wide fault zone is a total of 20cm down (normal) to the south. Strike N65E near vertical dip.
Set A
Fracture Characteristics Type, Orientation: Set A: TNF (VE). Set B: XF.
Set B N14W 53SW N7W 54SW N8W 56SW N10W 54SW N13W 55SW N8W 55SW N7W 59SW N9W 61SW N14W 56SW N9W 53SW
N86W 76NE (cliff breakage?) N83E 77NW N75W 86SW N86E 76SE N81E 67SE
Spacing: (cm) Set A Set B 47 57 47 53 26 50 17 18 20
5 5
Separation: no visible offset Mineralization: none visible Surface characteristics: no distinguishable characteristics Relative ages: Set A older Note: This is cliff exposure plan view, abutting relationships difficult

238
Apertures: (mm) 1, 1, 2, 3, 1, 1, 2 Deformation Bands (width): NA Note: observed a lack of fractures in shale and increased fracture spacing with increased bed thickness. Detailed spacing data of Set A fractures for several Unit 1 sandstone beds. Beds listed from top to bottom. A: shale 1cm thick (average) B: sandstone 8 cm thick (average) C: shale 4.5 cm thick (average) D: sandstone 33 cm thick (average) E: shale 1.5 cm thick (average) F: sandstone 5.5 cm thick (average) G: shale 1.5 cm thick (average) Bed B thickness (cm)
Bed B spacing (cm) Bed D thickness (cm)
Bed D spacing (cm)
3 1.5 1.3 2 4 1 5 5.5 7 12 11 15 15 16 20 19 15 25 15 12.5 19 11.5 10.5 5 12.5 11.5 2.5
8 8 8.5 8 8 8 7 6.5 7.5 8 8 8 8 10 15 16 16 15 12 10 9.5 7 7.5 6 5 5 4
32 30 15 18 19 36 26 56 49 36 44
31 32 33 34 33 33 32 36 33 34 32

239
6 5 3.5 3 5 13
5 5 5 5 5 5
Bed F thickness (cm) Bed F spacing (cm) 10 19 14 9 4 5 1 3 3 4.5 17.5 12 11 13 6 9 6 5 8 19 8 15 5 17 10 30 11 8 13 10 6 8 10 11 15
5 5.5 6 6 4 4.5 4 4 3.5 4 5 5 5.5 5.5 5 5.5 6 5 5 6 6 6 6 8 7 7.5 5.5 5 5 4.5 4.5 5 5 5 6

240
Chart #: 78 Location: NW1/4 SW1/4 Sec 3 T38N R78W Lithology: Steele Shale Grain size, cementation: very fine-grained, very poorly cemented Bed thickness: undetermined – at least 8m this location; area – 4 acres
Fracture Characteristics
Structure Strike and dip of bedding: Structural curvature (estimated): NA Faulting:
Type, Orientation: Mineralized veins within the fault zone. Mineralized veins have calcite crystals that are inferred to grow on opposite walls toward the center. This is evidenced by crystal shape with points of crystals at the center of the vein. Strike Number of mineralized
veins along a single fault plane.
Widths (mm)
1-N80W 81NE 2-N75W 70NE 3-N72W 68NE 4-N62W 70NE 5-N60W 70NE 5a-N60W 88NE
5 10 10 11 3 1
16, 8, 8, 10, 10 10 (max) 5, 2, 1, 2, 10, 1, 5 5, 1, 5, 6, 5, 2, 22, 5, 4 6, 15, 2, 1, 1, 4, 10, 12, 3, 2, 2 7, 1, 2 2
Data in the following chart are from and area 40m to SE of location from which the previous data was obtained – 1cm thick Ss (gray) in shale; poor to moderate cementation: grain size distribution 40% 88-125µ and 60% 125-177µ. Average fractures spacing ~5cm; Strike and dip of bedding N35W 15SW. Set A Set B – oblique younger set Set C? N64W 90 N60W 90 N60W 90 N58W 90 N54W 90 N58W 90 N56W 90 N58W 90 N61W 90 N65W 90 N62W 90
N14W 90 N15W 90 N20W 90 N16W 90 N8W 90 N18W 90 N13W 90 N16W 90 N14W 90 N15W 90
N30W 90 N31W 90
Spacing: (cm) Set A Set B 8 7
10 6

241
10 5 5 10 6 4 4 5 5 8 10 4
4 5 6 3 12 3
Separation: unknown Mineralization: calcite Surface characteristics: Relative ages: Set B is the younger set. Apertures: Deformation Bands (width): NA

242
Chart #: 79 Side view with limited plan view Location: SE1/4 SE1/4 Sec 10 T38N R78W Lithology: Steele Shale – sandstone in shale Grain size, cementation: Grain size distribution of the measured sandstone bed is 10% 62-88µ, 80% 88-125µ and 10% 125-177µ. Moderately cemented sandstone. Bed thickness: 40cm thick; measured area 20m X 2m Structure Strike and dip of bedding: N20W 8NE (estimate – rough and broken bedding surface) Structural curvature (estimated): NA Faulting: no large-scale faulting observed Fracture Characteristics Type, Orientation: Set A: bed normal VE (TNF). Set B: TNF. Set C: XF Set A Set B Set C Other N30W 82SW N37W 84SW N35W 87SW
N75W 85SW N78W 81SW N88W 83SW N87W 85SW N78W 80NE N77W 90 N62W 84NE
N38E 90 N38E 84NW
N1E 90 N58E 85SE N57E 88NW* N62E 85NE *4mm calcite on one surface
Spacing: (cm) Set A – approximately 100cm Set B - 100, 20, 70, 35 cm Set C – 100 cm Separation: none visible Mineralization: Up to 1mm calcite on Set A fracture surfaces. Surface characteristics: no distinguishing characteristics Relative ages: Set A oldest, Set B next oldest, Set C youngest Apertures: Deformation Bands (width): NA

243
Chart #: 80 Plan view with partial side view Location: NW1/4 SW1/4 Sec 15 T38N R78W Lithology: The measured bed is a light tan sandstone within Unit 1 interbedded sandstones and shales. Grain size, cementation: Grain size distribution within the measured bed is 10% 62-88µ, 85% 88-125µ and 5% 125-177µ. Poorly to moderately cemented. Bed thickness: 40cm thick, measured area – 20m X 10m Structure Strike and dip of bedding: N15W 20SW Structural curvature (estimated): NA Faulting: no faulting observed Fracture Characteristics Type, Orientation: Set A; TNF (VE). Set B: XF. Set A Set B N39W 70NE N36W 64NE N35W 73NE N39W 88NE N34W 89SW N43W 62NE N35W 86NE N29W 89NE N36W N39W
N48E 90 N37E 90 N45E N49E 90 N54E N48E 89SE N51E ~90 N47E ~90 N62E N53E 87SE
Spacing: (cm) Set A Set B 63 117 80 52 86 20 143 40
120 137 105 45 88 130 140 335 49 260 125 150 140
Separation: none Mineralization: none Surface characteristics: Planar, no other distinct characteristics Relative ages: Set A oldest Apertures: none Deformation Bands (width): none

244
Chart #: 81 Pavement view Location: NE1/4 SE1/4 Sec 35 T39N R78W Lithology: Unit 4: carbonaceous shale Grain size, cementation: very fine-grained (shale), very poorly cemented Bed thickness: ~1m thick; measured area – 10m X 5m, Structure Strike and dip of bedding: Structural curvature (estimated): North end of anticline and curvature is undetermined due to the lack of Mesaverde Formation exposures along the northern plunge of the anticline. Faulting: no large-scale faulting observed in this location Fracture Characteristics Type, Orientation: Set A: (TNF) cleats in carbonaceous shale. Set B: (XF) less numerous cleats Set A Set B N84E 67SE N86E 84SE N85E 86SE N79E 89SE N76E 85SE N72E 86SE N84E 83SE N75E 86SE N77E 86SE N71E 88SE N76E 88NW N75E 80SE N76E 88SE
N31E 67SE N62E 74SE N49E N45E N56E 89SE N59E 87SE N66E 86SE
Spacing: (cm) Set A Set B 40 35 17 5 10 10 15 10
30 15 10 8
Separation: none Mineralization: some Fe stain on cleat surface Surface characteristics: planar Relative ages: Set A older Apertures: (mm) Set A cleats – 10, 0, 1, 10, 1, 5, 1, 0. Apertures probably recent – in particular a 2.3cm aperture has a root growing within the cleat. Deformation Bands (width): NA

245
Chart #: 82 Plan view with partial side view Location: NE1/4 SE1/4 Sec 35 T39N R78W Lithology: Unit 5: fluvial sandstone Grain size, cementation: Grain size distribution for the measured sandstone bed is 10% 62-88µ, 85% 88-125µ and 5% 125-177µ. Poorly to moderately cemented sandstone. The west side of outcrop more is reddish in color (more Fe?) than eastern side. Eastern side less well cemented relative to western side of charted outcrop. Bed thickness: Measured area ~5m X 10m Structure Strike and dip of bedding: ~N38W 15NE Structural curvature (estimated): North end of anticline where curvature undetermined due to the lack of Mesaverde Formation exposures along the northern plunge of the anticline. Faulting: none at this location Fracture Characteristics Type, Orientation: Set A: TNF (VE), measured E to W, perpendicular to fracture strike. Set B: TNF, fewer measurements due to outcrop orientation relative to fracture strike. Set A Set B N15W 88SW N18W 88SW N26W 86SW N19W 86SW N34W 84SW N13W 87SW N18W 88SW N17W 86SW N10W 68SW* N17W 64SW* N12W 69SW*
N67E 83SE N69E 85SE N67E 85SE N69E 84SE
*Measurements within eastern portion of the outcrop. This area is less well cemented relative to the western portion of the outcrop. Note the change in fracture dip. Spacing: (cm) Set A Set B 45 61 143 17 32 29 67 5 95 87
58 17 70

246
Separation: none Mineralization: none Surface characteristics: no distinguishing characteristics Relative ages: Set A generally older; some abutting relationships indicate that Sets A and B maybe penecontemporaneous. Apertures: none Deformation Bands (width): NA

247
Chart #: 83 Plan and side views Location: NE1/4 NE1/4 Sec 5 T38N R78W (located between charts 48 and 50) Lithology: Unit 3: white beach sandstone Grain size, cementation: Grain size distribution of the measured sandstone bed is 10% 125-177µ, 80% 177-250µ and 10% 250-350µ. Poorly cemented sandstone. Bed thickness: 1.9m thick, measured area – 10m X 15m Structure Strike and dip of bedding: N49W 11SW Structural curvature (estimated): NW corner – possible structural influence from Salt Creek anticline. Faulting: none observed Fracture Characteristics Type, Orientation: Set A: Deformation bands, most extensive set, dip hard to find and quantify, qualitatively most deformation bands appear to dip to the NW with some dips to the SE. Set B: Deformation bands. Set A Set A - deformation
band width, mm Set B Set B – deformation
band width, mm N65E N65E N66E N85E N80E N84E N70E N65E N89E N72E (Fe stained) N67E N66E N71E N70E N68E N66E N70E N68E N85E
1 2 2 2 2 1 2 2 1 3 1 2 1 2 2 2 1 4 2
N5E N2W N1E N2E N70W
2 2 1 2 2
Spacing: (cm) Set A Set B 0.5 18 30 35 86 60
76

248
14 29 26 104 39 21 52 55 37 25 Separation: none Mineralization: none Surface characteristics: One Set A orientation measurement is composed of at least 3 inosculating bands. Relative ages: penecontemporaneous? Intersections between Sets A and B are generally simple crosses, therefore age determination is questionable. Apertures: NA Deformation Bands (width): see type and orientation data above.

249
Chart #: 84 Plan and side views Location: NE1/4 SE1/4 Sec 35 T39N R78W Lithology: Unit 3: white beach sandstone Grain size, cementation: Grain size distribution within the measured sandstone is 5% 125-177µ, 80% 177-250µ and 15% 250-350µ. Poorly cemented sandstone. Bed thickness: 5.46m thick; measured area – 10m X 20m Structure Strike and dip of bedding: N28W 9NE, N30W 9NE Structural curvature (estimated): NA Faulting: eastside graben described in chart 66 is approximately 150m to the southwest of this outcrop. Fracture Characteristics Type, Orientation: Set A: deformation bands several of which can be followed along strike for 20m. Set B: these are not as extensive relative to Set A, maximum of 4m in length, this set curves in outcrop and is not as well developed as Set A. Set A Set A – deformation
band or zone width, mm
Set B Set B – deformation band width, mm
N65E 70NW N68E 60SE N69E 74NW N66E 53SE N65E 78NW N65E 76NW N62E 64SE N55E 65SE N56E 69SE N62E 74NW N67E 85SE N69E 72NW N71E 78NW N71E 78NW N68E 60SE
1 1 1 3 (? bands) 2 3 (2 bands) 2 1 2 1 2 2 2 1 2
N35W N35W N33W N28W N39W
1 1 1 1
Spacing: (cm) Set A Set B 52 23 45 13 520 115 52 50
30 43 30

250
320 54 68 90 10 110 Separation: NA Mineralization: none observed Surface characteristics: none observed Relative ages: Set A older Apertures: NA Deformation Bands (width): See type and orientation data above. Other observations: Top of this outcrop has several octagonal “elephant skin” weathering features.

251
Chart #: 85 Plan and side views Location: SE1/4 NW1/4 Sec 9 T38N R78W Lithology: Sandstones within Unit 1: interbedded sandstones and shale. Grain size, cementation: Grain size distribution within the lower measured beds is 10% 125-177µ, 80% 177-250µ and 10% 250-350µ. These lower beds are poorly to moderately cemented. Grain size distribution within the upper measured bed is 10% 88-125µ, 80% 125-177µ and 10% 250-350µ. This sandstone is moderately to well cemented and provides a good pavement surface. Bed thickness: Lower bed thicknesses (from top to bottom): 20, 85, 20, 5, 10, 3, 45, 15cm, approximately 2m total thickness. Upper bed thickness is 25 cm. Total measured area – 5m wide X 5m long X 2.5m high Structure Strike and dip of bedding: N15W 23SW Structural curvature (estimated): West limb (no noticeable curvature). Faulting: N24W 86SW – 13cm normal stratigraphic separation. N33W 76NE – 2cm normal stratigraphic separation. These are hinge-parallel faults. Fracture Characteristics Type, Orientation: Set A: TNF in pavement surface. Pavement surface of upper bed shows none of the displacement observed with the small-scale faults in the lower bed. However, there is a fracture zone on the pavement surface with decreased fracture spacing that is spatially located between the two faults observed in the lower beds. Set B: TNF, generally terminates at intersection with set A, but is dominant for short distance in some areas of the outcrop Set A Set B N20W 71NE N24W 70NE N22W 73NE N25W 78NE N22W N21W 78NE N23W 68NE N18W N21W N20W 73NE N22W N25W N24W N25W N23W N12W N12W N23W N20W N18W
N78E N68E N69E N72E N72E N72E N66E

252
N15W N19W N20W N17W N18W N18W N16W N12W N16W N22W 70NE N21W Spacing: (cm) Set A Set B 37 23 40 1 10 6 1 2 2 31 14 16 27 8 6 4 4 4 1 3 1 3 5 2 6 10 4 7 15 11 21 9
58 19 5 50 28 38

253
15 46 Separation: none observed in fractured pavement above faults. Normal stratigraphic separation observed in cross sectional views along two distinct planes. 13cm displacement on one, 2cm displacement on the other. Mineralization: none Surface characteristics: Relative ages: Set A generally older. Apertures: none Deformation Bands (width): NA
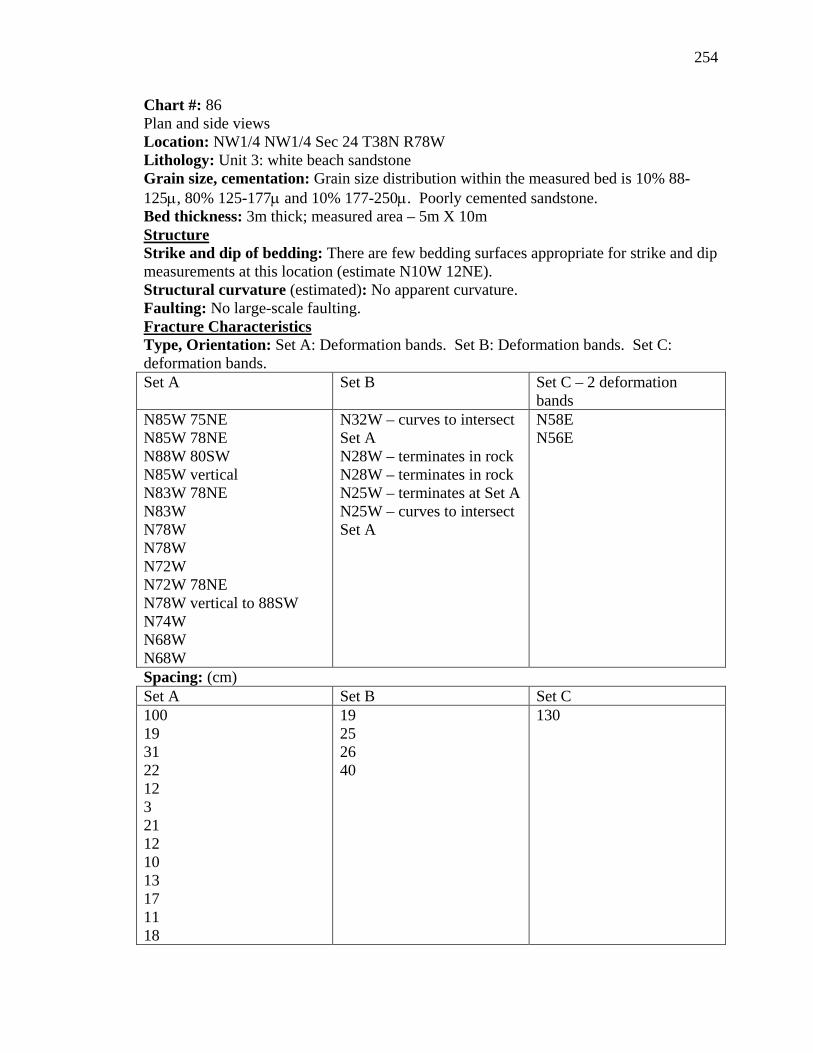
254
Chart #: 86 Plan and side views Location: NW1/4 NW1/4 Sec 24 T38N R78W Lithology: Unit 3: white beach sandstone Grain size, cementation: Grain size distribution within the measured bed is 10% 88-125µ, 80% 125-177µ and 10% 177-250µ. Poorly cemented sandstone. Bed thickness: 3m thick; measured area – 5m X 10m Structure Strike and dip of bedding: There are few bedding surfaces appropriate for strike and dip measurements at this location (estimate N10W 12NE). Structural curvature (estimated): No apparent curvature. Faulting: No large-scale faulting. Fracture Characteristics Type, Orientation: Set A: Deformation bands. Set B: Deformation bands. Set C: deformation bands. Set A Set B Set C – 2 deformation
bands N85W 75NE N85W 78NE N88W 80SW N85W vertical N83W 78NE N83W N78W N78W N72W N72W 78NE N78W vertical to 88SW N74W N68W N68W
N32W – curves to intersect Set A N28W – terminates in rock N28W – terminates in rock N25W – terminates at Set A N25W – curves to intersect Set A
N58E N56E
Spacing: (cm) Set A Set B Set C 100 19 31 22 12 3 21 12 10 13 17 11 18
19 25 26 40
130
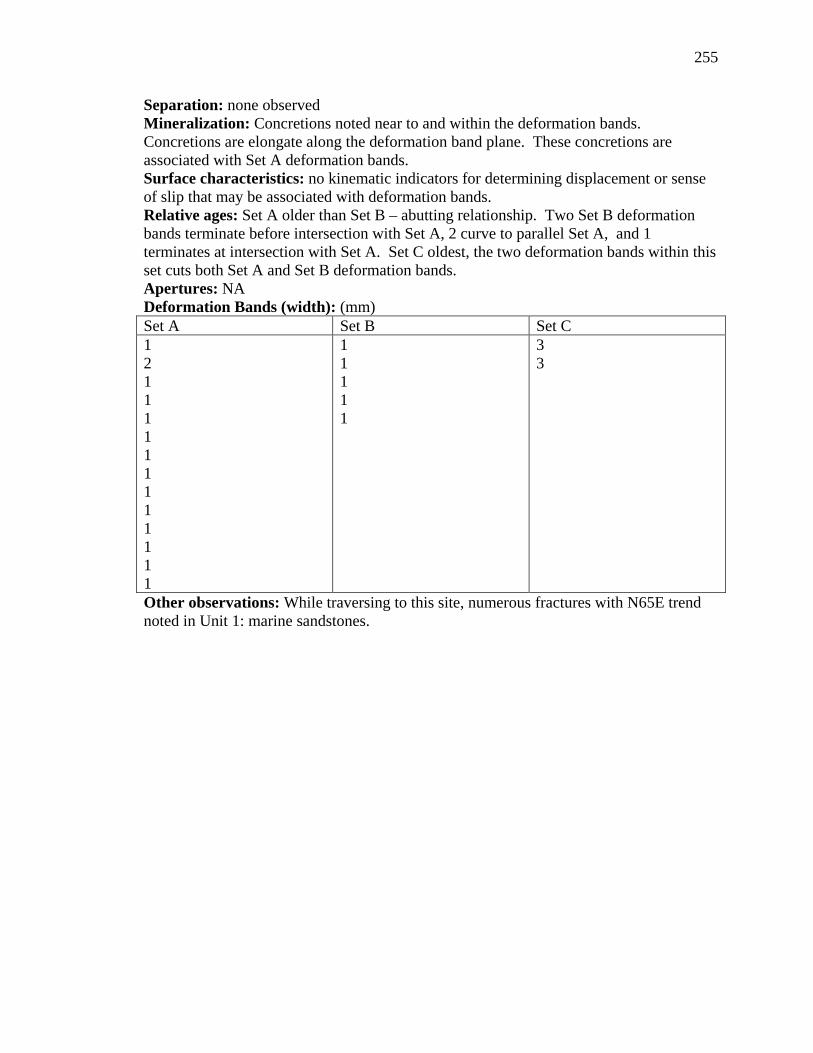
255
Separation: none observed Mineralization: Concretions noted near to and within the deformation bands. Concretions are elongate along the deformation band plane. These concretions are associated with Set A deformation bands. Surface characteristics: no kinematic indicators for determining displacement or sense of slip that may be associated with deformation bands. Relative ages: Set A older than Set B – abutting relationship. Two Set B deformation bands terminate before intersection with Set A, 2 curve to parallel Set A, and 1 terminates at intersection with Set A. Set C oldest, the two deformation bands within this set cuts both Set A and Set B deformation bands. Apertures: NA Deformation Bands (width): (mm) Set A Set B Set C 1 2 1 1 1 1 1 1 1 1 1 1 1 1
1 1 1 1 1
3 3
Other observations: While traversing to this site, numerous fractures with N65E trend noted in Unit 1: marine sandstones.

256
Chart #: 87 Plan and side views Location: NE1/4 NE1/4 Sec 21 T38N R78W Lithology: Kmv “Teapot Ss member” Grain size, cementation: Grain size distribution within this measured bed is 2% 88-125µ, 13% 125-177µ, 80% 177-250µ and 5% 250-350µ. Poorly cemented sandstone, yet forms a less extensive secondary ridge around Teapot Dome; very quartz rich, 95+%, rounded to subrounded grains. Bed thickness: Overall thickness 6m; individual beds 3cm – 1m. Cross-beds and current ripples noted. Structure Strike and dip of bedding: N25W 18SW (very irregular surface). Structural curvature (estimated): SW corner – 1.5km curvature Faulting: none Fracture Characteristics Type, Orientation: Set A: VCF. Set B: TNF Set A Set B N32W 82SW N20W 82NE N20W 76SW N18W 76NE N16W 75SW N42W N18W N33W 62NE N28W 58NE N10E vertical N25W 76NE N26W 70SW N32W 87NE N26W 88NE N32W 78NE N30W 78NE N28W 76SW N34W 62NE N28W 54NE N34W N20W
N80E 70NW N75W 88SW N88E vertical N55E 70SE N65E 72NW N25E
Spacing: (cm) Set A: 0.6, 1.1, 0.4, 0.6, 38, 41, 31, 50, 55cm Separation: none Mineralization: none Surface characteristics: irregular Relative ages: Abutting relationship unclear Apertures: none/only recent apertures Deformation Bands (width): NA

257
Chart #: 88 Plan and side views Location: NE1/4 NW1/4 Sec 22 T38N R78W Lithology: Unit 5: fluvial sandstone Grain size, cementation: fine grained, moderately cemented Bed thickness: 30cm to 1m thick; measured area – 1.5m X 50m. Detailed bed thickness measurements are proved with the fracture type and orientation chart. Structure Strike and dip of bedding: N23W 14SW Structural curvature (estimated): SW corner, 1-2km curvature Faulting: NA Fracture Characteristics Type, Strike: TNF measured across outcrop from starting point 0 to 58 meters. Measured in this fashion to describe orientation difference across the length of the outcrop. Distance (m) Strike Bed Thickness (m) 0 5 10 15 20 25 30 35 40 45 50 55 58
N62E N60E N50E N55E N58E N56E Covered N52E Irregular maximum N63E minimum N48E Poorly fractured N57E Irregular maximum N63E minimum N38E N48E N58E
1 1 0.7-0.8 0.7-0.8 0.7-0.8 0.7-0.8 0.7-0.8 0.7-0.8 Possible divide between two splays 0.2-0.3 0.2-0.3 0.5-0.6 0.5-0.6
Spacing: (cm) 10-30cm, average 20cm Separation: NA Mineralization: none Surface characteristics: none visible Relative ages: Only one set of fractures. Apertures: recent Deformation Bands (width): NA

258
Chart #: 89 Plan view and partial side view Location: NE1/4 SW1/4 Sec 16 T38N R78W Lithology: Unit 3: white beach sandstone. Grain size, cementation: Grain size distribution within the measured bed is 20% 88-125µ, 70% 125-177µ and 10% 177-250µ. Poorly cemented sandstone. Bed thickness: 3m total thickness, bed from which deformation band measurements were taken 1m; measured area – 10m X 5m Structure Strike and dip of bedding: N29W 22SW Structural curvature (estimated): NA Faulting: South of large valley with fault interpreted from seismic data. Fracture Characteristics Type, Orientation: Set A: deformation bands. Set B: Deformation bands Set A Set B N52W 62NE N50W 60NE N56W 60NE N62W 85SW N58W N58W N60W 60NE N66W 88SW N62W 74NE N60W N61W N64W N58W 80NE N60W 85NE N53W vertical
N52E – younger N51E – younger N43E – younger
Spacing: (cm) Set A – 12, 130, 45, 82, 9, 7, 27, 42, 3, 6, 103cm Separation: none Mineralization: none Surface characteristics: none visible Relative ages: Set B abuts Set A at near right angles. Neither Set terminates at intersection therefore age relationship is unclear. Apertures: NA Deformation Bands (width): All Set A and Set B deformation bands 1mm in width.

259
Chart #: 90 Plan and side views. Location: SE1/4 NE1/4 Sec 16 T38N R78W Lithology: Unit 4: carbonaceous shale Grain size, cementation: Carbonaceous shale very fine-grained, very poorly cemented. Bed thickness: 51cm thick; measured area – 2m X 15m Structure Strike and dip of bedding: A suitable bedding surface for strike and dip measurements unavailable. Data from Chart 89 indicates N29W 22SW for bedding strike and dip. Structural curvature (estimated): NA Faulting: Near valley with large-scale fault interpreted from seismic. It should be noted that large-scale movement/separation is not evident in outcrop. Fracture Characteristics Type, Orientation: Set A: coal cleats, measured N to S Coal cleats – measured N to S Coal cleats, continued N88W N86W N82W N78W 64NE N82W 70NE N77W 75NE N78W 62NE N82W 65NE N86W 73NE
N65W N82W 86NE N85W 67NE N88W 72NE N85W 87SW N80W 73NE N79W 69SW N89W 79NE
Spacing: (cm) 18, 38, 28, 53, 37, 58, 18, 23, 52, 45, 5, 78, 33, 46, 31, 82cm Separation: NA Mineralization: none Surface characteristics: none visible Relative ages: NA – only one cleat set Apertures: none Deformation Bands (width): NA

260
Chart #: 91 Plan view with partial side view Location: Road cut 1 mile west of Teapot Ranch on Hwy 259 Lithology: Kmv Teapot Sandstone member Grain size, cementation: Bed thickness: 3m in road cut; cliffs of S and N from Hwy approx. 9m Area – 100m X 20m Structure Strike and dip of bedding: Difficult to obtain due to poor bedding surface, estimate is N90E 3SE. Structural curvature (estimated): NA Faulting: no faulting observed Fracture Characteristics Type, Strike: Set A: VCF VCF VCF, continued N89W 87SW N89E 74SE N89W 80NE N87W 74SW N85W 76SW N88W 84NE N78W 74SW N68E 88NW N88W 64SW N88E 87SE N82W 76SW N84W 45SW
N82W 68SW N82W 82SW N86W 79SW N87W 78NE N76W 75SW N75W 86NE N72W 73SW N74W 74SW N85E 75SE N87E 78NW N82E 76NW N88E 75SE
Spacing: (cm) 41, 28, 68, 50, 61, 43, 22, 28, 81, 34, 102, 23, 51, 15, 15, covered 2m, 10, 12, 18, 56, 20, 50, 24cm Separation: none Mineralization: none Surface characteristics: no visible kinematic indicators Relative ages: One VCF set. Apertures: none Deformation Bands (width): NA

261
APPENDIX D
Fracture Spacing and Bed Thickness Data This is a compilation of data from Appendix D used to generate bed thickness vs.
fracture spacing charts. These data are from those locations where clear fracture age
relationships were available. In many cases the fracture spacing of fracture sets of
different ages is distinctly different. The spacing within the oldest fracture set at a given
location was used for this comparison to avoid averaging spacings measured from
different fracture sets.
Unit 5: Fluvial Sandstones Chart
number Bed
Thickness (m)
Set A: Mean Fracture spacing
(m)
Set A: n =
Set B: Mean Fracture spacing
(m)
Set B: n =
Oldest fracture
set 11 0.18 0.22 13 0.87 4 A 12 1 0.35 9 0.78 9 A 22 2.5 0.55 13 0.71 7 A 37 1.4 0.68 10 1.25 2 A 38 1.4 0.98 10 1.92 3 A 43 0.5 0.39 13 0.6 7 A 48 4 4.96 5 4.14 7 A 59 3.75 .73 11 A 65 2 0.97 14 1.85 1 A 70 0.5 .66 10 0.35 8 A 74 0.7 0.54 12 1.03 7 A
Unit 4: Carbonaceous Shales Chart
number Bed
Thickness (m)
Set A: Mean Fracture spacing
(m)
Set A: n =
Set B: Mean Fracture spacing
(m)
Set B: n =
Oldest fracture
set
35 1.8 0.11 17 A 41 1 0.31 8 0.15 9 A 46 1 0.17 19 A 49 0.2 0.28 18 0.46 9 A 56 0.5 0.22 14 0.42 7 A 58 1.3 0.12 14 0.15 13 A 64 1.1 0.14 13 A 71 1 0.26 9 0.44 8 A 81 1 0.18 8 0.16 4 A 90 0.51 0.4 16 A

262
Unit 2: Beach Sandstones
Chart number
Bed Thickness
(m)
Set A: Mean Fracture spacing
(m)
Set A: n =
Set B: Mean Fracture spacing
(m)
Set B: n =
Oldest fracture
set 8 2 0.37 9 0.22 9 A 14 0.1 0.67 3 0.28 8 A 15 0.1 0.36 10 0.43 11 A 32 0.6 0.4 17 A 33 1.5 0.26 14 A 39 0.6 0.28 15 A 40 0.3 0.24 13 1.06 6 A 45 0.2 0.3 17 1.73 14 A 50 0.18 0.74 8 1 6 A 61 0.25 0.16 16 0.38 8 A 76 2.5 1 8 1.13 6 A 80 0.4 0.75 8 1.4 13 A
Unit 1: Interbedded Shallow Marine Sandstones
Chart number
Bed Thickness
(m)
Set A: Mean Fracture spacing
(m)
Set A: n =
Set B: Mean Fracture spacing
(m)
Set B: n =
Oldest fracture
set 9 0.07 0.06 8 0.18 7 A 10 0.35 0.21 9 0.3 8 A 13 1.2 0.59 7 0.88 7 A 16 0.3 0.36 7 0.42 6 A 24 0.2 0.61 8 0.36 7 A 27 1 0.5 7 A 30 0.45 0.29 15 0.55 10 A 31 0.25 0.38 19 0.82 8 A 36 0.05 0.42 12 0.4 5 A 42 0.4 1.33 8 2.45 6 A 44 0.08 0.24 7 0.48 9 A 52 0.1 0.51 11 0.47 16 A 53 0.25 0.21 20 0.41 12 A 55 0.85 0.96 10 0.55 15 A 60 0.7 0.62 13 0.82 11 A 62 0.22 0.24 18 0.41 6 A 69 0.35 0.29 16 A 75 0.9 1.19 3 0.31 11 A 77 0.31 0.37 9 0.05 2 A 80 0.4 0.75 8 1.4 13 A
Total n = 594 360

263
APPENDIX E
Representative fracture orientation data Compilation of representative throughgoing fracture orientation data compiled
from Appendix C. Chart numbers correlate to Appendix C.
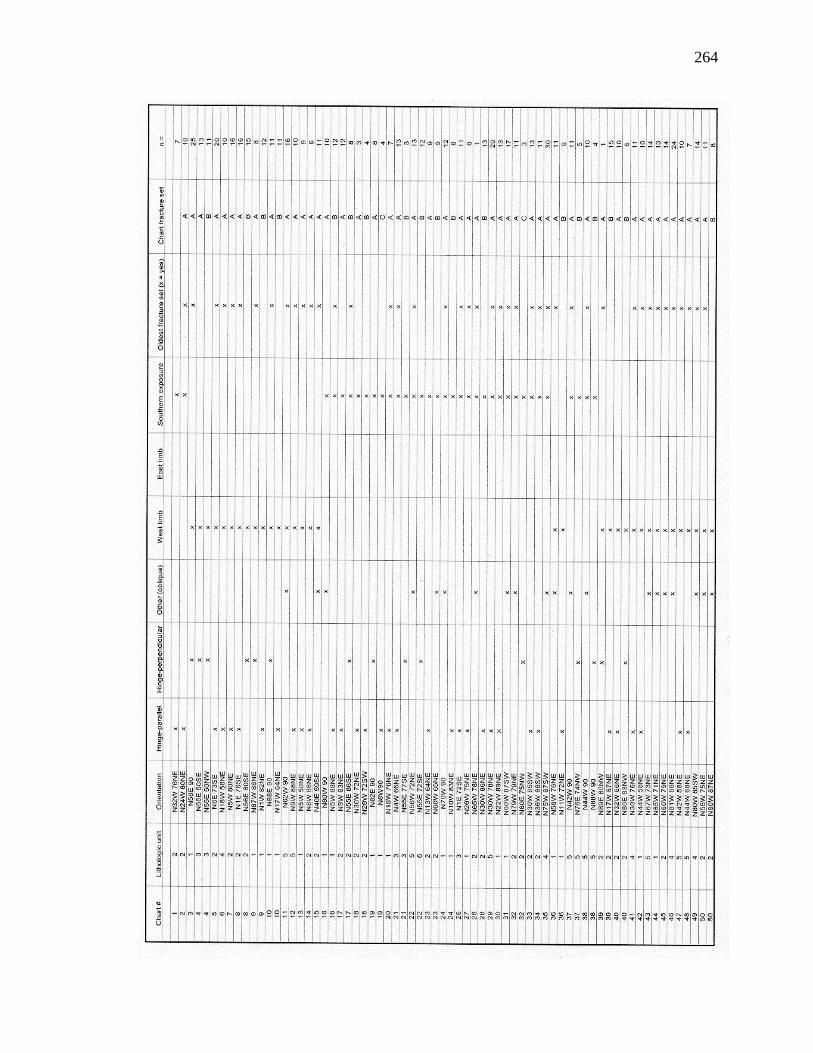
264

265

266
APPENDIX F
Representative fracture orientation data for locations away from Teapot Dome Compilation of representative throughgoing fracture orientation data from
locations at a distance from Teapot Dome. The data shown below were compiled from
field observations.
Location Description Orientation Type
Site A Salt creek anticline Shannon sandstone N85W 80NE TNF
N40W 90 TNF
Site B Hiway 387 @ milepost
109 Tertiary fluvial unit N25W 40 NE TNF
East of Midwest approx. 10m thick N15W 65NE TNF with 1/2 m thick N10W 57 NE TNF well cemented N8E 67NW TNF sandstone near top N85E 90 TNF N55W 90 TNF N57W 85NE TNF N55W 85NE TNF N85W 80 NE TNF N5E 83 NW TNF
Site C Hiway 387 @ milepost
103 Mesaverde Fm N35E bed
normal TNF
East of Midwest White sandstone N55W bed normal
TNF
3m thick underlain by carbonaceous shale
Site D 1.5 miles southwest of
NPR 3 Mesaverde Fm N72E 80SE TNF
NPR 3 entrance Fluvial Sandstone N40E 70SE TNF North side of Hiway 259 1.5m thick N65E 84 SE TNF
N75E 85SE TNF N35E 88SE TNF N50E 75SE TNF N5W 89SW TNF N5W 88SW TNF N72W 90 TNF

267
Site E West 1/2 mile on Ormsby
road Mesaverde Fm N80-90W VCF
off Interstate 25 White sandstone N65W TNF Teapot Sandstone member
Site F Road cut 1 mile west of Mesaverde Fm N89W 87SW VCF Teapot Ranch on Hiway
259 White sandstone N89E 74SE VCF
North side of road Teapot Sandstone member
N89W 80NE VCF
N87W 74SW VCF N85W 76SW VCF N88W 84NE VCF N78W 74SW VCF N68E 88NW VCF N88W 64SW VCF N88E 87SE VCF N82W 76SW VCF N84W 45SW VCF N82W 68SW VCF N82W 82SW VCF N86W79SW VCF N87W 78NE VCF N76W 75SW VCF N75W 86NE VCF N72W 73SW VCF N74W 74SW VCF N85E 75SE VCF N87E 78NW VCF N82E 76NW VCF N88E 75SE VCF

268
REFERENCES Agarwal, B., Allen, L.R., and Farrell, H.E., 1997, Ekofisk reservoir characterization:
Mapping permeability through facies and fractures intensity: Society of Petroleum Engineers Inc., Formation Evaluation, p. 227-233.
Antonellini, M., and Aydin, A., 1994, Effect of faulting on fluid flow in porous sandstones: Petrophysical properties: American Association of Petroleum Geologists Bulletin, v. 78, p. 355-377.
Antonellini, M., and Aydin, A., 1995, Effect of faulting on fluid flow in porous sandstones: Geometry and spatial distribution: American Association of Petroleum Geologists Bulletin, v. 79, p. 642-671.
Antonellini, M., Aydin, A., and Pollard, D.D., 1994, Microstructure of deformation bands in porous sandstones at Arches National Park, Utah: Journal of Structural Geology, v. 16, p. 941-959.
Aydin, A., 1978, Small faults formed as deformation bands in sandstone: Pure and Applied Geophysics, v. 116, p. 913-930.
Aydin, A., and Johnson, A.M., 1983, Analysis of faulting in porous sandstones: Journal of structural Geology, v. 5, p. 19-31.
Bai, T., and Pollard, D.D., 2000, Fracture spacing in layered rocks: a new explanation based on the stress transition: Journal of Structural Geology, v. 22, p. 43-57.
Berg, R.R., 1962, Mountain flank thrusting in Rocky Mountain Foreland, Wyoming and Colorado: American Association of Petroleum Geologists Bulletin, v. 46, p. 2019-2032.
Blackstone, D.L., Jr., 1940, Structure of the Pryor Mountains, Montana: Journal of Geology, v. 48, p. 590-618.
Blackstone, D.L., Jr., 1980, Foreland deformation: compression as a cause: University of Wyoming Contributions in Geology, v. 18, p. 83-101.
Bogdanov, A.A., 1947, The intensity of cleavage as related to the thickness of beds (in Russian): Soviet Geology.
Caine, J.S., Evans, J.P., and Forster, C.B., 1996, Fault zone architecture and permeability structure: Geology, v. 24, p. 1025-1028.
Cooper, M., 1992, The analysis of fracture systems in subsurface thrust structures from the Foothills of the Canadian Rockies, in McClay, K.R., ed., Thrust Tectonics, London, Chapman and Hall, p. 391-405.
Curry, W.H., 1977, Teapot Dome - past, present and future: American Association of Petroleum Geologists Bulletin, v. 61, p. 671-697.
DeSitter, L.U., 1956, Structural Geology: New York, McGraw-Hill, 552 p. DeSitter, L.U., 1964, Variation in tectonic style: Bulletin of Canadian Petroleum
Geology, v. 12, p. 263-278. Doelger, M.J., Mullen, D.M., and Barlow & Haun, I., 1993, Nearshore marine sandstone,
Atlas of Major Rocky Mountain Gas Reservoirs: Socorro, NM, New Mexico Bureau of Mines and Mineral Resources, p. 54-55.
Doll, T.E., Luers, D.K., Strong, G.R., Schult, R.K., Sarathi, P.S., Olsen, D.K., and Hendricks, M.L., 1995, An update of steam injection operations at Naval Petroleum Reserve No. 3, Teapot Dome Field, Wyoming: A shallow

269
heterogeneous light oil reservoir, SPE 30286, International Heavy Oil Symposium: Calgary, Alberta, Canada, Society of Petroleum Engineers, p. 1-20.
Dunn, D.D., LaFountain, L.J., and Jackson, R.E., 1973, Porosity dependence and mechanism of brittle fracture in sandstones: Journal of Geophysical Research, v. 78, p. 2403-2417.
Elkins, L.F., and Skov, A.M., 1960, Determination of fracture orientation from pressure interference: Petroleum Transactions, American Institute of Mining Engineers, v. 219, p. 301-304.
Engelder, T., 1974, Cataclasis and the generation of fault gouge: Geological Society of America Bulletin, v. 85, p. 1515-1522.
Engelder, T., Gross, M.R., and Pinkerton, 1997, An analysis of joint development in thick sandstone beds of the Elk Basin anticline, Montana-Wyoming, in Hoak, T.E., Klawitter, A.L., and Blomquist, P.K., eds., Fractured reservoirs: characterization and modeling: Rocky Mountain Association of Geologists Guidebook, p. 1-18.
Fassett, J.E., 1991, Oil and gas resources of the San Juan basin, New Mexico and Colorado, in Gluskoter, H.J., Rice, D.D., and Taylor, R.B., eds., Economic Geology, U.S., Volume P-2: The Geology of North America, Geological Society of America, p. 357-372.
Fausnaugh, J.M., and LeBeau, J., 1997, Characterization of shallow hydrocarbon reservoirs using surface geochemical methods: American Association of Petroleum Geologists Bulletin, v. 81, p. 1223.
Fisher, M.P., and Wilkerson, M.S., 2000, Predicting the orientation of joints from fold shape: Results of pseudo-three-dimensional modeling and curvature analysis: Geology, v. 28, p. 15-18.
Fjaer, E., Holt, R.M., Horsrud, P., Raaen, A.M., and Risnes, R., 1992, Petroleum related rock mechanics: New York, Elsevier Science Publishing Company Inc., 388 p.
Fox, J.E., Dolton, G.L., and Clayton, J.L., 1991, Powder River Basin, in Gluskoter, H.J., Rice, D.D., and Taylor, R.B., eds., Economic Geology, U.S.: Geological Society of America, The Geology of North America, P-2, p. 373-390.
Friedman, M., and Stearns, D.W., 1971, Relations between stresses inferred from calcite twin lamellae and macrofractures, Teton Anticline, Montana: Geological Society of America Bulletin, v. 82, p. 3151-3162.
Garrett, C.H., and Lorenz, J.C., 1990, Fracturing along the Grand Hogback, Garfield County, Colorado, in Bauer, P.W., Lucas, S.G., Mawer, C.K., and McIntosh, W.C., eds., New Mexico Geological Society Guidebook, 41st Field Conference, Southern Sangre de Cristo Mountains, New Mexico, p. 145-150.
Gay, S.P., Jr., 1999, An explanation for "4-way closure" of thrust-fold structures in the Rocky Mountains, and implications for similar structures elsewhere: The Mountain Geologist, v. 36, p. 235-244.
Gill, J.R., and Cobban, W.A., 1966, Regional unconformity in Late Cretaceous, Wyoming: United States Geological Survey Professional Paper 550-B, p. B20-B27.
Gribbin, D.J., 1952, Completion report exploratory well no. 1-G-10 at Naval Petroleum Reserve No. 3, Natrona County, Wyoming: Casper, p. 1-20.

270
Gries, R., 1983, Oil and gas prospecting beneath Precambrian of foreland thrust plates in Rocky Mountains: American Association of Petroleum Geologists Bulletin, v. 67, p. 1-28.
Gries, R.R., and Dyer, R.C., 1985, Seismic exploration of the Rocky Mountain foreland structures: Denver, Rocky Mountain Association of Geologists and the Denver Geophysical Society, p. 298.
Griffith, A.A., 1921, The Phenomena of rupture and flow in solids: Royal Society of London Transactions, v. 221, p. 163-198.
Gross, M.R., 1993, The origin and spacing of cross joints: examples from the Monterey Formation, Santa Barbara Coastline, California: Journal of Structural Geology, v. 15, p. 737-751.
Hallbauer, D.K., Wagner, H., and Cook, N.G.W., 1973, Some observations concerning the microscopic and mechanical behavior of quartzite specimens in stiff, triaxial compression tests: International Journal of Rock Mechanics and Mineral Science, v. 10, p. 713-726.
Haneberg, W.C., 1995, Steady state groundwater flow across idealized faults: Water Resources Research, v. 31, p. 1815-1820.
Harding, T.P., and Lowell, J.D., 1979, Structural styles, their plate-tectonic habitats, and hydrocarbon traps in petroleum provinces: American Association of Petroleum Geologists Bulletin, v. 63, p. 1016-1058.
Harris, J.F., Taylor, G.L., and Walper, J.L., 1960, Relation of deformation fractures in sedimentary rocks to regional and local structure: American Association of Petroleum Geologists Bulletin, v. 44, p. 1853-1873.
Hennings, P.H., Olson, J.E., and Thompson, L.B., 1998, Using outcrop data to calibrate 3-D geometric models for prediction of reservoir-scale deformation: An example from Wyoming, in Hoak, T.E., ed., Fractured reservoirs: practical exploration and development strategies, Symposium Proceedings, The Rocky Mountain Association of Geologists, p. 91-95.
Hobbs, D.W., 1967, The formation of tension joints in sedimentary rocks: an explanation: Geological Magazine, v. 104, p. 550-556.
Hoshino, K., 1974, Effect of porosity on the strength of clastic sedimentary rocks, Advances in Rock Mechanics, Proc. 3rd Int. Soc. Rock Mech., Volume 2: Denver, Colorado, p. 511-516.
Howard, A.D., and Kochel, R.C., 1988, Introduction to cuesta landforms and sapping processes on the Colorado Plateau, in Howard, A.D., Kochel, R.C., and Holt, H.E., eds., Sapping features of the Colorado Plateau - A comparative planetary geology field guide, National Aeronautics and Space Administration Special Publication 491, p. 6-56.
Huang, Q., and Angelier, J., 1989, Fracture spacing and its relation to bed thickness: Geological Magazine, v. 126, p. 355-362.
Hubbert, M.K., and Rubey, W.W., 1959, Role of fluid pressure in mechanics of overthrust faulting, I. Mechanics of fluid-filled porous solids and its application to overthrust faulting: Geological Society of America Bulletin, v. 70, p. 115-166.
Huntoon, P.A., and Lundy, D.A., 1979, Fracture-controlled ground-water circulation and well siting in the vicinity of Laramie, Wyoming: Ground Water, v. 17, p. 463-469.
271
Jaeger, J.C., and Cook, N.G.W., 1969, Fundamentals of Rock Mechanics: London, Methuen and Co., 513 p.
Jamison, W.R., and Stearns, D.W., 1982, Tectonic deformation of Wingate Sandstone, Colorado National Monument: American Association of Petroleum Geologists Bulletin, v. 66, p. 2584-2608.
Ji, S., and Saruwatari, K., 1998, A revised model for the relationship between joint spacing and layer thickness: Journal of Structural Geology, v. 20, p. 1495-1508.
Kuenen, P.H., 1958, Experiments in geology: Transactions Geological Society Glasgow, v. 23, p. 1-28.
Ladeira, F.L., and Price, N.J., 1981, Relationship between fracture spacing and bed thickness: Journal of Structural Geology, v. 3, p. 179-183.
Lawrence Allison, 1989, Structure Contour Map, Top of the Second Wall Creek Sand, Naval Petroleum Reserve No. 3, Natrona County, Wyoming: Casper, Wyoming, Rocky Mountain Oilfield Testing Center.
LeBeau, J., 1996, Preliminary geological characterization of the Dakota Formation, Naval Petroleum Reserve #3, Midwest, Wyoming, RMOTC/Halliburton multilateral test, October 1996: Rocky Mountain Oilfield Technology Center Internal Report, p. 25 p. plus appendices.
Long, J.C.S., Aydin, A., Brown, S.R., Einstein, H.H., Hestir, K., Hsieh, P.A., Myer, L.R., Nolte, K.G., Norton, D.L., Olsson, O.L., Paillet, F.L., Smith, J.L., and Thomsen, L., 1997, Rock Fracture and Fluid Flow: Washington, D.C., National Academy Press, p. 551.
Lorenz, J.C., 1997a, Heartburn in predicting natural fractures: The effects of differential fracture susceptibility in heterogeneous lithologies, in Hoak, T.E., Klawitter, A.L., and Blomquist, P.K., eds., Fractured reservoirs: Characterization and modeling: Rocky Mountain Association of Geologists Guidebook, p. 57-66.
Lorenz, J.C., 1997b, Natural fractures and in-situ stresses in the Teapot Dome: Proposal for development of an analog to Rocky Mountain anticlines, 48th Annual Field Conference Technical Abstracts: Casper, Wyoming, Wyoming Geological Association, p. 5-6.
Lorenz, J.C., and Finley, S.J., 1989, Differences in fracture characteristics and related production: Mesaverde Formation, Northwestern Colorado: Society of Petroleum Engineers Formation Evaluation, v. 4, p. 11-16.
Lorenz, J.C., and Hill, R.E., 1991, Subsurface fracture spacing: comparison of inferences from slant/horizontal core and vertical core in Mesaverde reservoirs: Society of Petroleum Engineers Paper 21877: Joint Rocky Mountain Section Meeting and Low-Permeability Reservoir Symposium, p. 705-716.
Lorenz, J.C., and Hill, R.E., 1992, Measurement and Analysis of fractures in core, in Schmoker, J.W., Coalson, E.B., and Brown, C.A., eds., Geological studies relevant to Horizontal drilling: Examples from Western North America, Rocky Mountain Association of Geologists, p. 47-59.
Lorenz, J.C., Teufel, L.W., and Warpinski, N.R., 1991, Regional fractures I: A mechanism for the formation of regional fractures at depth in flat-lying reservoirs: American Association of Petroleum Geologists Bulletin, v. 75, p. 1714-1737.
Lorenz, J.C., Warpinski, N.R., and Teufel, L.W., 1996, Natural fracture characteristics and effects: The Leading Edge, v. 15, p. 909-911.
272
Mair, K., Main, I., and Elphick, S., 2000, Sequential growth of deformation bands in the laboratory: Journal of Structural Geology, v. 22, p. 25-42.
Martinsen, O.J., Martinsen, R.S., and Steidtmann, J.R., 1993, Mesaverde Group (Upper Cretaceous), southeastern Wyoming: Allostratigraphy versus sequence stratigraphy in a tectonically active area: American Association of Petroleum Geologists Bulletin, v. 77, p. 1351-1373.
McQuillan, H., 1973, Small-scale fracture density in Asmari Formation of southwest Iran and its relation to bed thickness and structural setting: American Association of Petroleum Geologists Bulletin, v. 57, p. 2367-2385.
Merewether, E.A., 1990, Cretaceous formations in the southwestern part of the Powder River Basin, northeastern Wyoming: American Association of Petroleum Geologists Bulletin, v. 74, p. 1337.
Muhlhaus, H.B., and Vardoulakis, I., 1988, The thickness of shear bands in granular materials: Geotechnique, v. 38, p. 271-284.
Murray, F.N., 1967, Jointing in sedimentary rocks along the Grand Hogback Monocline, Colorado: Journal of Geology, v. 75, p. 340-350.
Murray, G.H., Jr., 1968, Quantitative fracture study - Sanish Pool, McKenzie County, North Dakota: American Association of Petroleum Geologists Bulletin, v. 52, p. 57-65.
Narr, W., and Suppe, J., 1991, Joint spacing in sedimentary rocks: Journal of Structural Geology, v. 13, p. 1037-1048.
Nelson, R.A., 1985, Geologic analysis of naturally fractured reservoirs: Houston, Gulf Publishing Company, 360 p.
Nicol, A., Watterson, J., Walsh, J.J., and Childs, C., 1996, The shapes, major axis orientations and displacement patterns of fault surfaces: Journal of Structural Geology, v. 18, p. 235-248.
Oldow, J.S., Bally, A.W., Ave' Lallemant, H.G., and Leeman, W.P., 1989, Phanerozoic evolution of the North American Cordillera; United States and Canada, in Bally, A.W., and Palmer, A.R., eds., The geology of North America; an overview, Volume A: Boulder, Geological Society of America, p. 139-232.
Olsen, D.K., Sarathi, P.S., and Hendricks, M.L., 1993, Case history of steam injection operations at Naval Petroleum Reserve No. 3, Teapot Dome Field, Wyoming: A shallow heterogeneous light-oil reservoir: SPE paper 25786, International Thermal Operations Symposium: Bakersfield, CA, Society of Petroleum Engineers, p. 93-110.
Peng, S., and Johnson, A.M., 1972, Crack growth and faulting in cylindrical specimens of Chelmsford granite: International Journal of Rock Mechanics and Mining Science, v. 9, p. 37-86.
Pollard, D.D., and Aydin, A., 1988, Progress in understanding jointing over the past century: Geological Society of America Bulletin, v. 100, p. 1181-1204.
Potter, P.E., and Pettijohn, F.J., 1977, Paleocurrents and Basin Analysis: New York, Springer-Verlag, 425 p.
Price, N.J., 1966, Fault and joint development: Oxford, Pergamon Press, 176 p. Prucha, J.J., Graham, J.A., and Nickelsen, R.P., 1965, Basement-controlled deformation
in Wyoming Province of Rocky Mountains foreland: American Association of Petroleum Geologists Bulletin, v. 49, p. 966-992.

273
Raghaven, R., Scorer, J.D.T., and Miller, F.G., 1972, An investigation by numerical methods of the effect of pressure-dependent rock and fluid properties on well flow tests: Society of Petroleum Engineers Journal, v. 12, p. 267-275.
Rice, D.D., 1983, Relation of natural gas composition to thermal maturity and source rock type in San Juan basin, northwestern New Mexico and southwestern Colorado: American Association of Petroleum Geologists Bulletin, v. 67, p. 1199-1218.
Roscoe, K.H., 1970, The influence of strains in soil mechanics: Geotechnique, v. 20, p. 129-170.
Rudnicki, J.W., and Rice, J.R., 1975, Conditions for the localization of deformation in pressure-sensitive dilatant materials: Journal Mech. Phys. Solids, v. 23, p. 371-394.
Secor, D.T., Jr., 1965, Role of fluid pressure in jointing: American Journal of Science, v. 263, p. 633-646.
Sigda, J.M., Goodwin, L.B., Mozley, P.S., and Wilson, J.L., 1999, Permeability alteration in small-displacement faults in poorly consolidated sediments: Rio Grande Rift, central New Mexico, in Haneberg, W.C., Mozley, P.S., Moore, J.C., and Goodwin, L.B., eds., Faults and Subsurface Fluid Flow in the Shallow Crust AGU Monograph 113, p. 51-68.
Sinclair, S.M., 1980, Analysis of Macroscopic Fractures on Teton Anticline, Northwestern Montana [M.S. thesis]: College Station, Texas A&M University.
Stearns, D.W., 1964, Macrofracture patterns on Teton anticline, northwest Montana: American Geophysical Union Transactions, v. 45, p. 107-108.
Stearns, D.W., 1967, Certain aspects of fracture in naturally deformed rocks, in Rieker, R.E., ed., NSF Advanced Science Seminar in Rock Mechanics: Bedford, Air Force Cambridge Research Laboratories, p. 97-118.
Stearns, D.W., 1971, Mechanisms of drape folding in the Wyoming Province, in Renfro, A.R., Madison, L.W., Jarre, G.A., and Bradley, W.A., eds., Symposium on Wyoming tectonics and their economic significance, Twenty-Third Annual Field Conference Guidebook, Wyoming Geological Association, p. 125-143.
Stearns, D.W., 1975, Laramide basement deformation in the Bighorn Basin - The controlling factor for structures in the layered rocks, in Exum, F.A., and George, G.R., eds., Geology and mineral resources of the Bighorn Basin, Twenty-Seventh Annual Field Conference Guidebook, Wyoming Geological Association, p. 149-158.
Stearns, D.W., 1978, Faulting and forced folding in the Rocky Mountains foreland, in Matthews, V., III,, ed., Laramide folding associated with basement block faulting in the western United States, Volume Memoir 151, Geological Society of America, p. 1-37.
Stearns, D.W., and Friedman, M., 1972, Reservoirs in fractured rock, in King, R.E., ed., Stratigraphic oil and gas fields - classification, exploration methods, and case histories, Volume Memoir 16, American Association of Petroleum Geologists, p. 82-106.
Teufel, L.W., and Farrell, H.E., 1992, Interrelationship between in situ stress, natural fractures, and reservoir permeability anisotropy: A case study of the Ekofisk Field, North Sea, Fractures and Jointed Rock Conference: Lake Tahoe, CA.

274
Thom, W.T., Jr., and Speiker, E.M., 1931, The significance of geologic conditions in Naval Petroleum Reserve No. 3, Wyoming, United States Geological Survey Professional Paper 163, p. 64.
Tillman, R.W., and Martinsen, R.S., 1984, The Shannon self-ridge sandstone complex, Salt Creek Anticline area, Powder River Basin, Wyoming, in Tillman, R.W., and Seimers, C.T., eds., Siliclastic shelf sediments: Society of Economic Paleontology and Mineralogy Special Publication, Volume 40, p. 85-142.
Trexel, C.A., 1930, Compilation of data on Naval Petroleum Reserve No. 3 (Teapot Dome), Natrona County, Wyoming, p. 248.
Unruh, J.R., and Twiss, R.J., 1998, Coseismic growth of basement-involved anticlines: The Northridge-Laramide connection: Geology, v. 26, p. 335-338.
Wegemann, C.H., 1918, The Salt Creek oil field, Wyoming, United States Geological Survey Bulletin 452, p. 37-83.
Weijermars, R., 1997, Principles of Rock Mechanics, Alboran Science Publishing, 360 p. Weimer, R.J., 1960, Upper Cretaceous stratigraphy, Rocky Mountain area: American
Association of Petroleum Geologists Bulletin, v. 44, p. 1-20. Weimer, R.J., 1984, Relation of unconformities, tectonics, and sea level changes,
Cretaceous of Western Interior, U.S.A., in Schlee, J.S., ed., Interregional unconformities and hydrocarbon accumulation, American Association of Petroleum Geologists Memoir 36, p. 7-35.
Willis, J.J., and Brown, W.G., 1993, Structural interpretations of the Rocky Mountain Foreland: Past, Present, and Future, in Strook, B., and Andrew, S., eds., Jubilee Anniversary Field Conference Guidebook: Casper, Wyoming Geological Society, p. 95-119.
Wong, T.-f., 1998, Dilatancy, compaction and failure mode in porous rocks, US Department of Energy Basic Sciences Geoscience Program, 1998 Research Symposium, Micromechanics and Flow: Santa Fe, NM, p. 14.
Wong, T.-f., David, C., and Zhu, W., 1997, The transition from brittle faulting to cataclastic flow in porous sandstones: Mechanical deformation: Journal of Geophysical Research, v. 102, p. 3009-3025.
Wong, T.-f., Szeto, H., and Zhang, J., 1992, Effect of loading path and porosity on the failure mode of porous rocks: Applied Mechanical Review, v. 45, p. 281-293.
Zapp, A.D., and Cobban, W.A., 1962, Some Late Cretaceous strand lines in southern Wyoming: United States Geological Survey Professional Paper 45-D, p. D52-D55.