teaching introduction to public policy & research methods rick mayes, assistant professor...
TRANSCRIPT

Teaching Introduction toPublic Policy & Research Methods
Rick Mayes, Assistant Professor
Department of Political Science

Background & ObjectivesPublic Policy 101: Incentives structure modern life as we know it.
e.g., IRS and tax audits, HOV lanes and toll roads, Dean’s List and
academic probation, parenting, teaching, dating, sales, Amway, etc.
Incentives come in 3 basic flavors or varieties (e.g., smoking):
(a.) moral: U.S. gov’t asserts that terrorists raise money from black-market sales of cigarettes
(b.) social: banning of cigarettes in restaurants and bars
(c.) economic: $3-per-pack “sin tax” (… but not in Virginia obviously)

Moral/Social Incentives and Modern Life
The Chicago Police Department in conjunction with the Mayor's office have now made prostitution solicitors' information available online. By using this website, you will be able to view public records on individuals who have been arrested for soliciting prostitutes or other related arrests. The following individuals were arrested and charged for either patronizing or soliciting for prostitution. It is not a comprehensive list of all individuals arrested by the Chicago Police Department for patronizing or soliciting for prostitution. The names, identities and citations appear here as they were provided to police officers in the field at the time of arrests.
DOE/SMITH, JOSE M/37 54XX S ROCKWELL ST CHICAGO 1102 N CICERO AVE 2005/10/02 720 ILCS 5.0/11-15-A-1
DOE/SMITH, CARLOS M/31 165XX BRENDEN LN. OAKPARK 1102 N CICERO AVE 2005/10/01 720 ILCS 5.0/11-15-A-1
DOE/SMITH, JOHN M/54 28XX W 38TH PL CHICAGO 2500 S CALIFORNIA BLVD 2005/09/06 720 ILCS 5.0/11-15-A-1
DOE/SMITH, ALEX M/28 22XX MAGNOLIA CT WEST BUFFALO GROVE 1102 N CICERO AVE 2005/10/02 720 ILCS 5.0/11-15-A-1

Economic Incentives and Modern Life- Australian prison ships in the early 1900s
- April 15, 1987 and the disappearance of
of 7 million American children
- frequent flyer miles (“loyalty programs”)

Incentives Driving Medicare’s “Pay for Performance”
(1) Institute of Medicine reports:
- To Err is Human (1999)
- Crossing the Quality Chasm (2001)
(2) John Wennberg & “Small-Area Large-Variation” studies:
- tonsillectomy rates (1977)
- cesarean section rates (1996)
- variation in Medicare spending/per beneficiary


Number of Acute Care Hospital Beds/per 1,000 Residents
Source: Dartmouth Atlas of Virginia

Number of Hospital Discharges for all Medical Conditions (DRGs)
Source: Dartmouth Atlas of Virginia

10.010.0
20.020.0
30.030.0
40.040.0
50.050.0
60.060.0
70.070.0
80.080.0NYU Medical Center 76.2
UCLA Medical Center 43.9NY Presbyterian Hospitals 40.3
Cedars-Sinai Medical Center 66.2
Mount Sinai Hospital 53.9
UCSF Medical Center 27.2Stanford University Hospital 22.6
Average number of physician visits per patient during last six months of life who received most of their care in one of 77 “best” US hospitals
Source: John Wennberg (2005)

Incentives Driving Medicare’s “Pay for Performance”
Researchers’ and Insurers’ Conclusions:
(1.) Physician practice styles vary considerably, especially regarding diagnoses for which treatment decisions are not driven by consensus on appropriate care and it is not possible to obtain evidence-based guidelines from reading journals or consulting textbooks.
e.g., back surgery rates (the #/per 1,000 Medicare beneficiaries):
- 7/per 1,000 in Naples, FL
- 2/per 1,000 in Hanover, NH
- 4.5/per 1,000 national average
(2.) In medicine, supply generally creates its own demand (e.g., # of hospital beds/per capita, technology available, # of specialists/per capita).

Rates of Surgery for Back Pain/per 1,000 Medicare Enrollees
Source: Dartmouth Atlas of Virginia

Rates of four orthopedic procedures among Medicare enrollees in 306 Hospital Referral Regions (2000-01)
0.2
1.0
4.0
HipHipFractureFracture
KneeKneeReplacementReplacement
HipHipReplacementReplacement
BackBackSurgerySurgery
Stan
dard
ized
rat
io (
log
scal
e)
Source: John Wennberg (2005)

R2 = 0.49Vis
its
to C
ard
iolo
gist
s p
er e
nro
llee
Vis
its
to C
ard
iolo
gist
s p
er e
nro
llee
0.00.0
0.50.5
1.01.0
1.51.5
2.02.0
2.52.5
0.00.0 2.52.5 5.05.0 7.57.5 10.010.0 12.512.5 15.015.0
Number of Cardiologists per 100,000 residentsNumber of Cardiologists per 100,000 residents
Association between cardiologists and visits per person to cardiologists among Medicare enrollees (1996): 306 HRRs
Source: John Wennberg (2005)

The Association between Hospital Beds and Hospitalization for Hip Fracture and Congestive Heart Failure
Source: Dartmouth Atlas of Virginia

Interview w/Tom Scully, former CMS Administrator (2002)Mayes: Others I’ve interviewed have said that hospitals will cry, cry, cry [about their
finances and level of Medicare reimbursement], but that sometimes you have take it with a grain of salt.
Scully: Oh, they’re doing great! I’ll tell you, go find me a hospital that hasn’t built a giant new bed-tower in the last few years. They’ve actually slowed down, because the government has phased out Medicare capital (reimbursement)… We used to pay for capital in Medicare; it was a DRG add-on for capital expenditures. Well, if you’re getting 40 percent of your revenues from Medicare and you want to build a new building and Medicare will pay for 40 percent of it, right? Then why not?
So what you were getting all through the 1980s was a massive building spree up into the early 1990s and even through the ‘90s, because it was a 10-year phase out [of the DRG add-on for capital]. If you wanted to build a new hospital wing in 1990—even if you didn’t have any patients for it—if you budgeted $100 million, Medicare would write you a check for $40 million! So what do you get? You got a hell of a lot of big new hospital wings, need them or not. This is one of the reasons we’ve had such massive over-capacity…
You’d have to be an idiot not to put up a new building every couple of years, because Medicare paid for such a big part of it. That is slowing down now and you’re starting to see the demand catch up on capacity in a lot of markets.
* Roemer’s Law: “A hospital bed built is a hospital bed filled.” (behavior is unconscious)
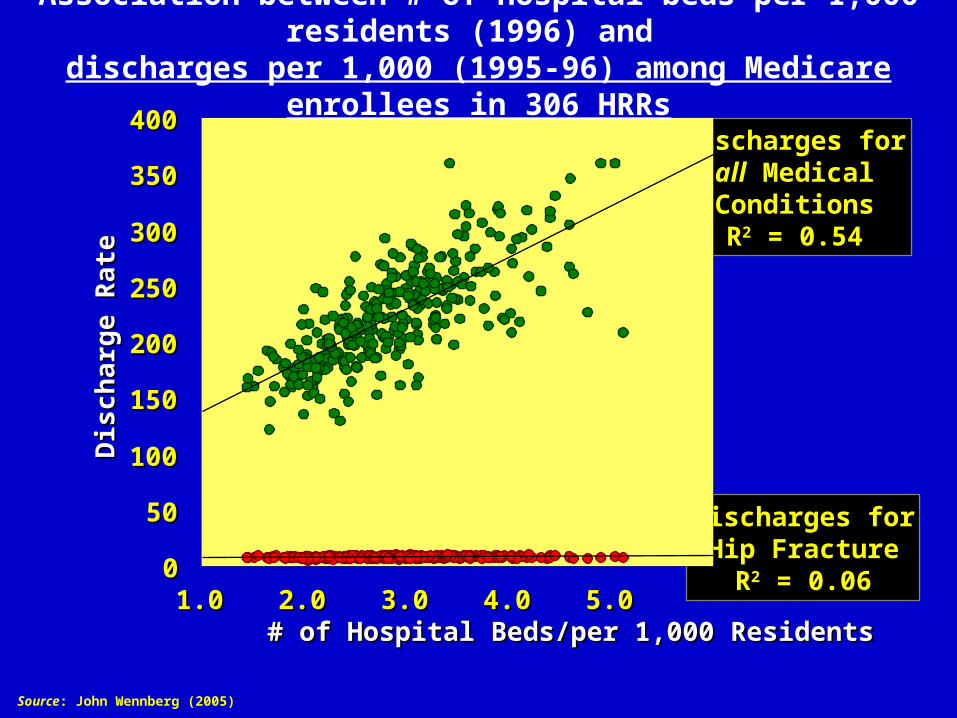
Discharges forHip Fracture
R2 = 0.06
Discharges forall MedicalConditionsR2 = 0.54
00
5050
100100
150150
200200
250250
300300
350350
400400
1.01.0 2.02.0 3.03.0 4.04.0 5.05.0# of Hospital Beds/per 1,000 Residents# of Hospital Beds/per 1,000 Residents
Dis
char
ge R
ate
Dis
char
ge R
ate
Association between # of hospital beds per 1,000 residents (1996) and discharges per 1,000 (1995-96) among Medicare enrollees in 306 HRRs
Source: John Wennberg (2005)


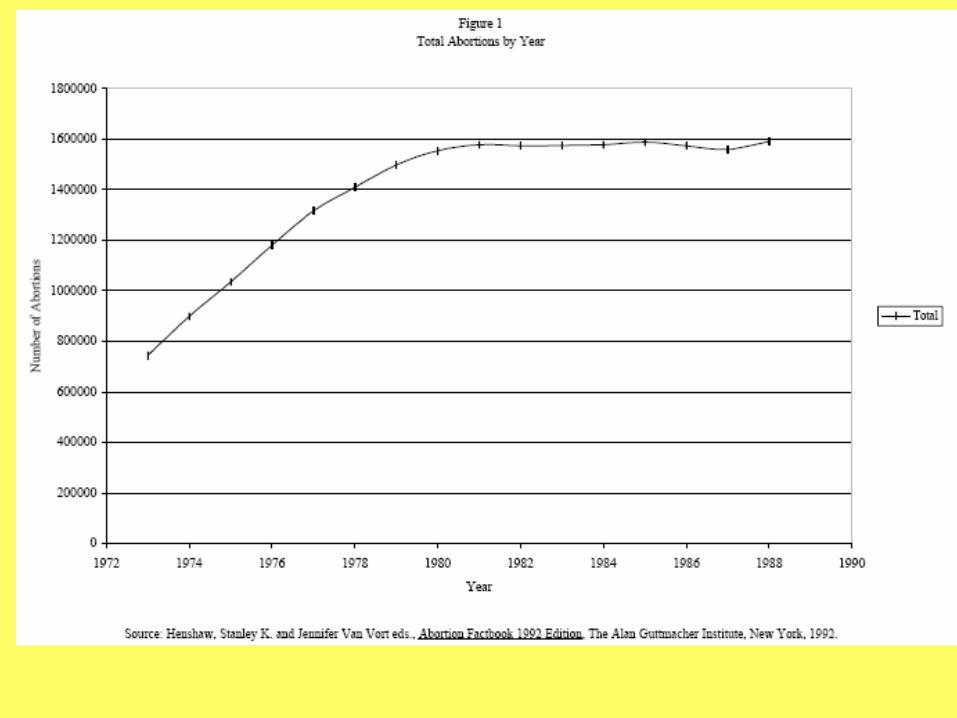
relationship between
Abortion & Crime


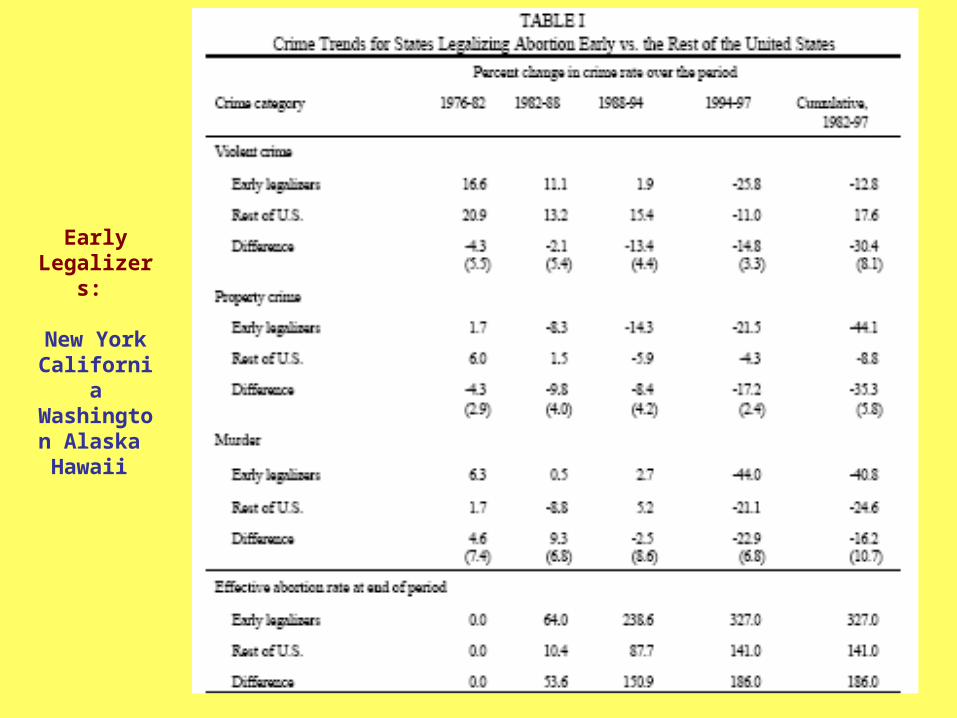
Early Legalizers:
New YorkCalifornia
Washington Alaska Hawaii


relationship between
Psychostimulant Use and
Educational, Socioeconomic, Demographic and
Health System Characteristics

Background & Significance
So what? What is the significance of ADHD and psychostimulants?
– ADHD is the most commonly diagnosed behavioral disorder in children, making up more than 50% of all child psychiatric diagnoses
– 75-85% of children diagnosed with ADHD are prescribed psychostimulant drugs (e.g., Ritalin, Adderall, Dexedrine, Concerta)
– the U.S. population consumes 90% of the world’s production of psychostimulants
– school-age children in the U.S. consume 4 times more psychiatric medication than children in the rest of the world combined

Background & SignificanceSo what? What is the significance of ADHD and psychostimulants? cont’d . . .
– an estimated 3-5% of school-age children have the disorder (NIH Consensus Statement, 1998); other estimates 4-12% (Vanderbilt, MUSC);
(1.5-to-6 million kids, 1-to-3 students in every classroom in the U.S.)
– ADHD prevalence estimates from actual community studies range from as low as 1.7% (Calif. Bay Area) to as high as 20% (military bases near Virginia Beach)
– rates of psychostimulant use vary as much as 3-fold between states and 10-fold within them (Rappley et al., 1995; Wennberg & Wennberg, 2000; Zito et al., 1997)
– At the peak age for psychostimulant use, 11, almost 1 in every 10 boys in the U.S. uses these drugs (Cox et al., Journal of Pediatrics, February 2003).
– big $$: approximately $1.2 billion spent in 2001 on ADHD related drugs (new potential growth markets: pre-schoolers and adults)

Diagnostic and Prescribing Trends• 400-500% increase in ADHD diagnoses since 1991
– 1991: 800,000 to 950,000 children diagnosed with ADHD
– 2001: 4 to 4.25 million children diagnosed with ADHD
• 800-900% increase in psychostimulant use since 1991
– 1991: 2 million psychostimulant prescriptions
– 2001: 21 million psychostimulant prescriptions

Diagnostic and Prescribing Trends: American Exceptionalism

Mayes, Bokhari, Scheffler (2005)
Conditional Probability of a Child Being Diagnosed with ADHD
0.0000
0.0500
0.1000
0.1500
0.2000
2 3 4 5 6 7 8
Family Size
White Male ChildMale Child w/o Bio MomMale Child w/o Dad in HouseWhite Male Child w/o Bio MomWhite Male Child w/o Bio Mom & w/o Dad In House

Primary Research Question
What explains the enormous variation
in psychostimulant consumption across the U.S.?

0 to 1,600 Low (4.6%)1,600 to 3,150 Below Average (25.5%)3,150 to 5,150 Average (43.5%)5,150 to 6,750 Above Average (19.6%)6,750 to 8,350 High (4.9%)
grams/per 100,000 Individuals
8,350 to 11,000 Extremely High (1.8%)
Methylphenidate and Amphetamine Distribution, 2000 (DEA data)
(average = 4,150 grams/100,000 individuals)

Characteristics of Counties with High and Low Use of Psychostimulants, DEA ARCOS data (2000)
* difference in means significant at the .10 level, ** at the .05 level, *** at the .01 level
Variable
Mean for all U.S. Counties (Standard Error)
Low Consumption
n=1,015 counties (Standard Error)
High Consumption n=1,015 counties
(Standard Error)
Distribution Rate (Grams of Psychostimulant/per 100K)***
3,359 grams (37.31)
1,796 grams (20.72)
4,923 grams (43.50)
Total Population***
89,327 (52.22)
65,680 (86.25)
114,000 (59.34)
Per Capita Income***
$21,397 (130.8)
$20,118 (159.2)
$22,760 (204.6)
Unemployment Rate***
4.9% (0.049)
5.4% (0.079)
4.4% (0.055)
% of Pop. With Some Form of Health Insurance***
82.9% (0.10)
82.1% (0.137)
83.7% (0.131)
White Population as Percentage of Total Population**
87.9% (0.290)
87.1% (0.455)
88.6% (0.362)
Black Population as Percentage of Total Population
9.7% (0.280)
10.2% (0.438)
9.4% (0.352)
Asian Population as Percentage of the Total Population
2.45% (0.280)
2.5% (0.441)
2.4% (0.358)
State has Schedule II Rx Monitoring Program***
30.7% (0.008)
34.3% (0.012)
27.0% (0.012)
Soci
o-d
emog
raph
ic a
nd E
cono
mic
C
hara
cter
istic
s
Children/Adolescents as a % of the Population***
29.0% (0.061)
29.2% (0.10)
28.8% (0.075)

Characteristics of Counties with High and Low Use of Psychostimulants, DEA ARCOS data (2000)
* difference in means significant at the .10 level, ** at the .05 level, *** at the .01 level
Variable
Mean for all U.S. Counties (Standard Error)
Low Consumption
n=1,015 counties (Standard Error)
High Consumption n=1,015 counties
(Standard Error)
Students--to--Teacher Ratio***
14.6 (0.048)
14.3 (0.070)
14.8 (0.066)
Private Students--to--Public Students Ratio***
.058 (0.001)
.043 (0.0018)
.069 (0.002)
Private Coed--to--Private Non-Coed Students***
58.0 (8.609)
38.0 (8.092)
68.3 (12.33)
Edu
cati
onal
C
har
acte
rist
ics
Private Sectarian--to--Private Non-Sectarian Students***
23.8 (2.755)
14.5 (2.072)
28.5 (3.990)
HMO Penetration (% of Individuals Enrolled in HMOs)***
12.1% (0.248)
10.2% (0.322)
14.1% (0.374)
Number of HMOs Operating in a County***
3.9 (0.069)
3.4 (0.092)
4.5 (0.101)
MDs/per 100,000 Individuals***
112 (2.690)
86 (3.50)
139 (4.00)
Child Psychiatrists as Percentage of Total MDs***
0.4% (0.026)
0.3% (0.038)
0.5% (0.036)
Psychiatrists as Percentage of Total MDs***
3.0% (0.099)
2.5% (0.149)
3.4% (0.119)
GPs, FPs as Percentage of Total MDs***
41.1% (0.515)
47.7% (0.757)
34.7% (0.662)
Pediatricians as Percentage of Total MDs***
5.5% (0.129)
4.9% (0.200)
6.1% (0.166)
Neurologists as Percentage of Total MDs***
0.9% (0.046)
0.7% (0.085)
1.1% (0.039)
Female MDs--to--Male MDs Ratio
.210 (0.004)
.210 (0.006)
.210 (0.004)
Hea
lth
Sys
tem
Ch
arac
teri
stic
s
Young MDs(<55)--to--Senior MDs(>55) Ratio***
1.8 (0.023)
1.6 (0.035)
1.9 (0.030)

Selected Regression Coefficients for Market Model * indicates that the coefficient is significant at the 10% level, ** at the 5% level, *** at the 1% level
Variable RITALIN ADDERALL
Coefficient Std. Error Coefficient Std. Error
Intercept -5.34*** 1.64 8.05*** 1.56
Price of Ritalin -3.76*** .654 .828*** .220
Price of Adderall .436 .477 -3.86*** .410
Price of Dexedrine 1.13*** .284 1.28*** .273
Price of Dextrostat .653* .337 1.53*** .388
Per Capita Income 1.54*** .189 .228 .183
Population (in 100s) .115 .287 1.91*** .280

Selected Regression Coefficients for Market Model * indicates that the coefficient is significant at the 10% level, ** at the 5% level, *** at the 1% level
Variable RITALIN ADDERALL
Coefficient Std. Error Coefficient Std. Error
# of kids (<19) .768*** .254 -.860*** .261
HMO penetration -.062** .026 -.083*** .026
Students-to-Teacher -.392** .175 -.359** .180
# of Private School Students .064*** .018 .024 .020
Accountability Index^ .055*** .018 .041** .108
# of MDs (Total Patient Care)
.260*** .059 .085 .062
Young-to-Old MDs .094** .039 .110*** .038
^ Accountability Index: Ranges from 0 to 5 0 = no teacher accountability and 5 = most stringent policies