teachers’ retirement system of oklahoma · pdf filemembers: james dickson, roger gaddis,...
TRANSCRIPT
TEACHERS’ RETIREMENT SYSTEM OF OKLAHOMA Regular Board Meeting
Wednesday, September 24, 2014 – 9:00 AM TRS Administration Board Room
2500 N. Lincoln Blvd., 5th Floor, Oklahoma City, OK
AGENDA
1. ROLL CALL FOR QUORUM
2. DISCUSSION AND POSSIBLE ACTION ON APPROVAL OF MINUTES: A. August 24, 2014 Special Meeting B. August 25, 2014 Special Meeting C. August 27, 2014 Regular Board Meeting
3. PRESENTATION BY INVESTMENT MANAGEMENT RFP FINALISTS: A. Antheus B. American Realty C. Dune D. GreenOak E. Landmark F. Starwood
4. DISCUSSION AND POSSIBLE ACTION ON REAL ESTATE VALUE-ADDED AND
OPPORTUNISTIC RFPs 5. DISCUSSION AND POSSIBLE ACTION ON INVESTMENT CONSULTANT MONTHLY
REPORT
6. DISCUSSION AND POSSIBLE ACTION ON MANAGER STATUS SUMMARY REPORT: The Board of Trustees may elect to make any changes to the status of any manager based on the information available at the Board meeting
7. DISCUSSION AND POSSIBLE ACTION ON INVESTMENT COMMITTEE REPORT: (see
attached agenda) 8. DISCUSSION AND POSSIBLE ACTION ON COMMITTEE REPORTS:
A. Governance B. Audit
9. DISCUSSION AND POSSIBLE ACTION ON OTRS STRATEGIC PLAN 10. DISCUSSION AND POSSIBLE ACTION TO APPROVE PROPOSED FISCAL YEAR 2016
BUDGET 11. DISCUSSION AND POSSIBLE ACTION TO APPROVE APPLICATION FOR OTRS
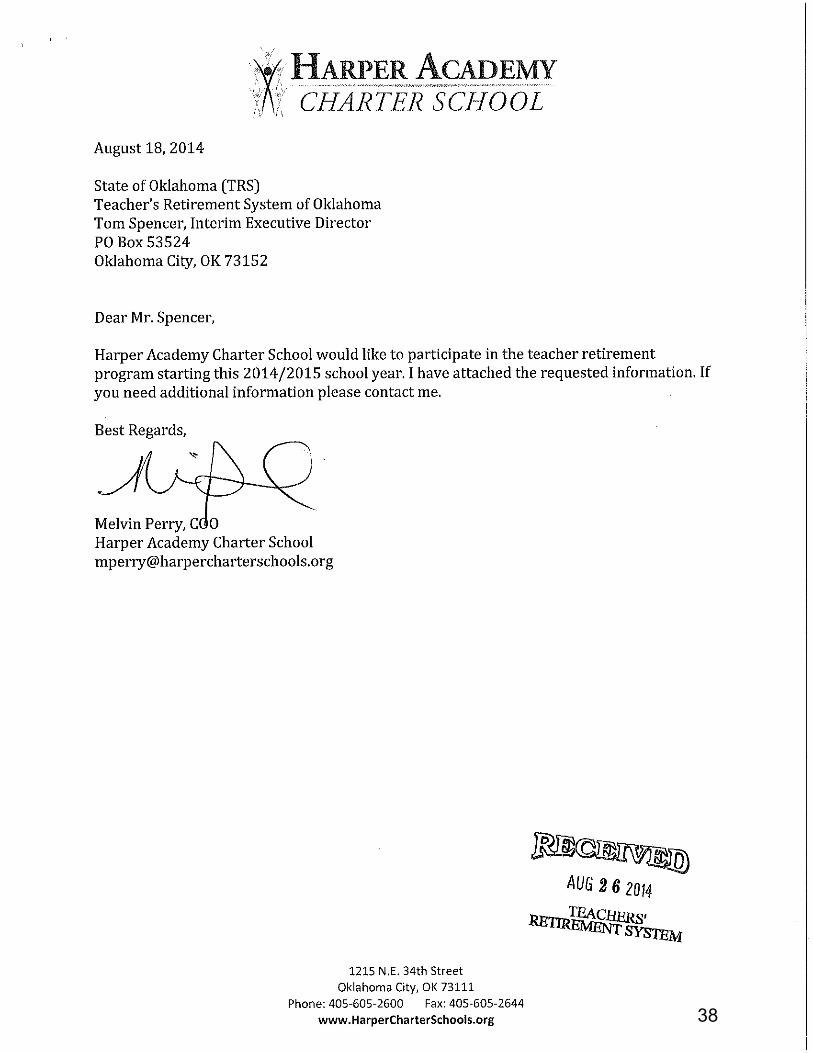
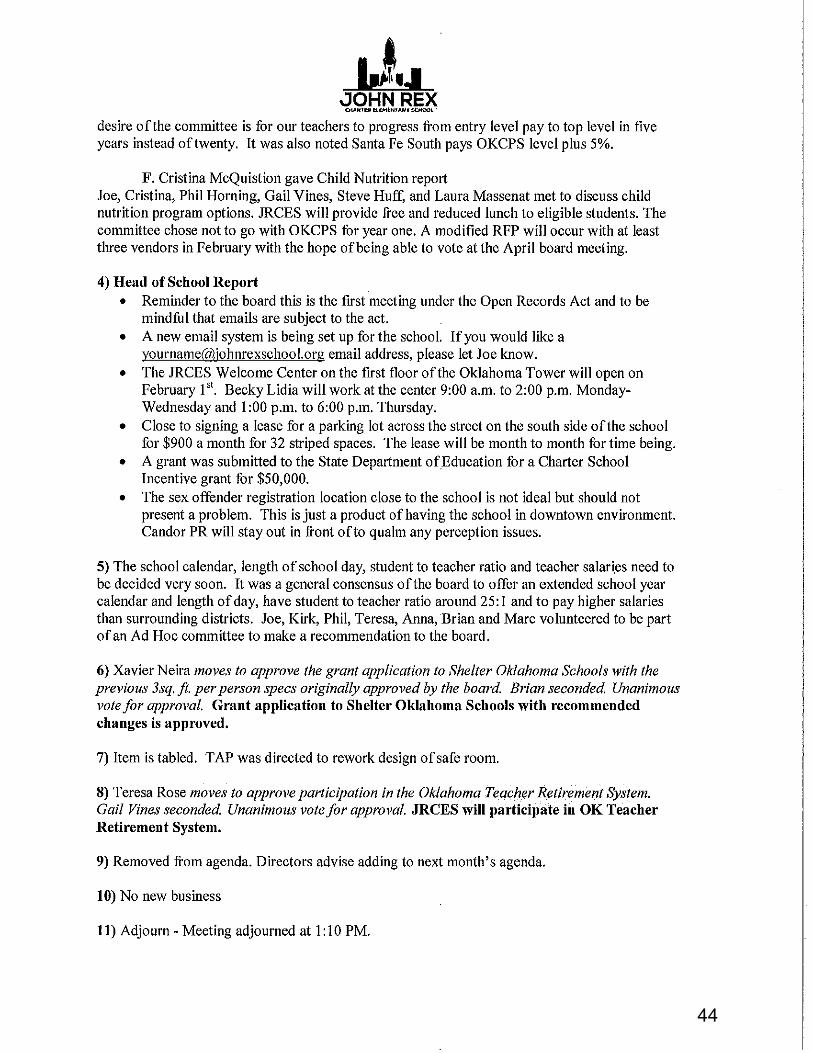
MEMBERSHIP: A. Harper Academy Charter School B. John Rex Elementary Charter School
1
TEACHERS’ RETIREMENT SYSTEM OF OKLAHOMA Regular Board Meeting
Wednesday, September 24, 2014 – 9:00 AM TRS Administration Board Room
2500 N. Lincoln Blvd., 5th Floor, Oklahoma City, OK
AGENDA (cont.) 12. DISCUSSION AND POSSIBLE ACTION TO APPROVE APPLICATIONS FOR RETIRED
EDUCATOR ASSOCIATIONS TO MAKE NON-VOTING TRUSTEE APPOINTMENT A. Oklahoma Retired Educators Association (OREA) B. Retired Professional Oklahoma Educators (RPOE)
13. DISCUSSION AND POSSIBLE ACTION TO EXTEND PERSONNEL INTERCHANGE
PROGRAM CONTRACT FOR SERVICES OF INTERIM EXECUTIVE DIRECTOR 14. DISCUSSION AND POSSIBLE ACTION TO APPROVE THE ANNUAL LEAVE
TRANSFER OF THE EXECUTIVE DIRECTOR EFFECTIVE NOVEMBER 1, 2014 15. DISCUSSION AND POSSIBLE ACTION TO AUTHORIZE OTRS STAFF TO NEGOTIATE
AMENDMENTS TO THE CONTRACT/STATEMENT OF WORK WITH MYCONSULTING GROUP APPROVED BY THE BOARD IN OCTOBER 2013
16. DISCUSSION AND POSSIBLE ACTION TO APPROVE AMENDMENT TO COLE & REED
P.C. EXTERNAL AUDITING CONTRACT 17. DISCUSSION AND POSSIBLE ACTION ON GASB 68 IMPLEMENTATION 18. DISCUSSION AND POSSIBLE ACTION ON AGENCY REPORTS:
A. Client Services (70 O.S. 17-105) B. Human Resources C. Finance D. General Counsel E. Interim Executive Director
19. QUESTIONS AND COMMENTS FROM TRUSTEES
20. NEW BUSINESS
21. ADJOURNMENT
Note: The Board of Trustees may discuss, vote to approve, vote to disapprove, or decide not to discuss any item on the agenda.
2

TEACHERS’ RETIREMENT SYSTEM OF OKLAHOMA Investment Committee Meeting
Tuesday, September 23, 2014 – 3:00 PM TRS Administration Board Room
2500 N. Lincoln Blvd., 5th Floor, Oklahoma City, OK
AGENDA
1. CALL TO ORDER
2. DISCUSSION AND POSSIBLE ACTION ON INVESTMENT CONSULTANT MONTHLY REPORT
3. PRESENTATION BY INVESTMENT MANAGERS:
A. AEW B. Heitman
4. DISCUSSION AND POSSIBLE ACTION ON QUARTERLY REAL ESTATE REPORT
5. DISCUSSION AND POSSIBLE ACTION ON REAL ESTATE SEARCH
6. DISCUSSION AND POSSIBLE ACTION ON LORD ABBETT INVESTMENT
MANAGEMENT AGREEMENT AMENDMENT REGARDING TREASURY FUTURES
7. DISCUSSION AND POSSIBLE ACTION REGARDING UPDATE ON TRANSITION
8. DISCUSSION AND POSSIBLE ACTION TO APPROVE TRANSITION MANAGEMENT RFP
9. QUESTIONS AND COMMENTS FROM TRUSTEES
10. ADJOURNMENT
ALL BOARD MEMBERS ARE ENCOURAGED TO ATTEND INVESTMENT COMMITTEE MEETINGS
INVESTMENT COMMITTEE:
Chair: Vernon Florence Members: James Dickson, Roger Gaddis, Jill Geiger, Gary Trennepohl
3
MEETING MINUTES AUGUST 24, 2014
BOARD OF TRUSTEES TEACHERS’ RETIREMENT SYSTEM OF OKLAHOMA
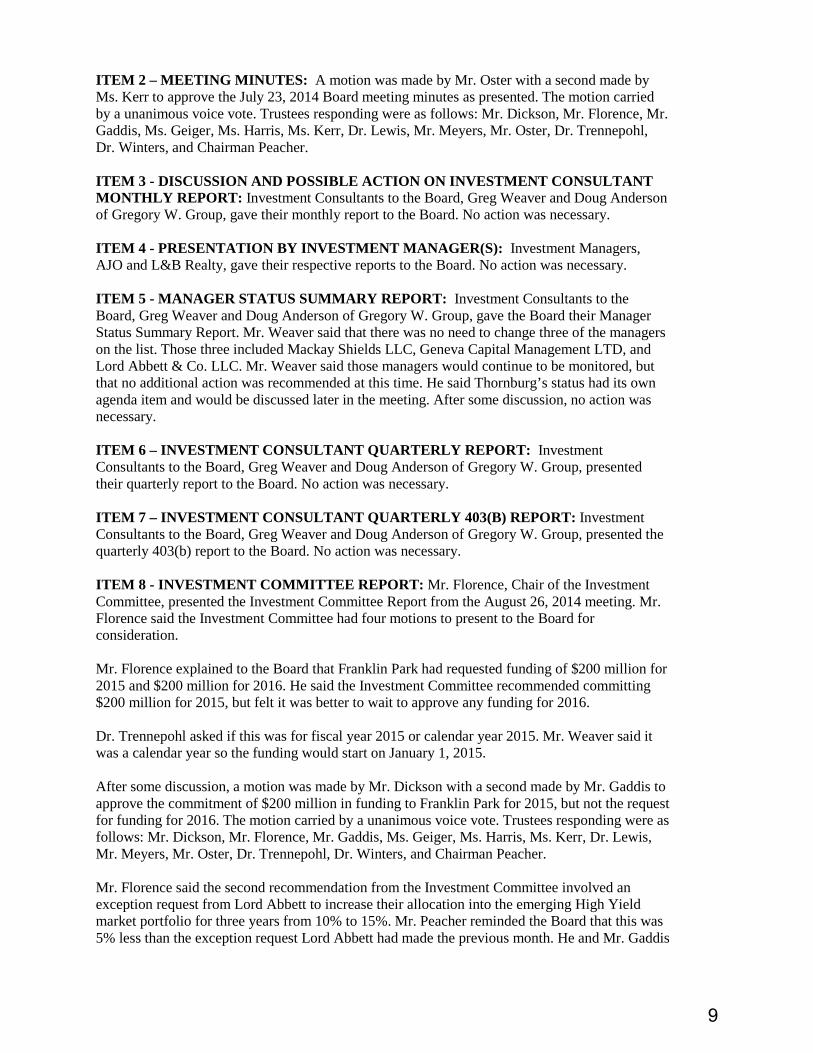
The special meeting of the Board of Trustees of the Teachers’ Retirement System of Oklahoma was called to order by Chairman Bill Peacher at 1:30 p.m. in the W.B. Skirvin Suite at the Skirvin Hotel, 1 Park Avenue, Oklahoma City, OK. The meeting notice and agenda were posted in accordance with 25 O.S. Section 311(A)(11). TRUSTEES PRESENT: Bill Peacher, Chairman Jill Geiger Vernon Florence, Vice-Chairman Judie Harris Beth Kerr, Secretary Stewart Meyers James Dickson Andrew Oster Gary Trennepohl TRUSTEES ABSENT: Roger Gaddis Philip Lewis Billie Stephenson Greg Winters TRS STAFF PRESENT: Julie Ezell, General Counsel OTHERS PRESENT: Gary Hudepohl, Hudepohl & Associates *Denotes late arrival or early departure ITEM 1 - ROLL CALL FOR QUORUM: Chairman Peacher called the Board meeting to order at 1:30 p.m. and asked for a poll to determine if a quorum was present. Trustees responding were as follows: Mr. Dickson, Mr. Florence, Ms. Geiger, Ms. Harris, Ms. Kerr, Mr. Meyers, Mr. Oster, Dr. Trennepohl, and Chairman Peacher. ITEM 2 – EXECUTIVE SESSION REGARDING THE INTERVIEWING, EMPLOYMENT, HIRING, OR APPOINTMENT OF CANDIDATE(S) FOR THE POSITION OF EXECUTIVE DIRECTOR OF THE TEACHERS’ RETIREMENT SYSTEM OF OKLAHOMA: A motion was made by Mr. Florence with a second made by Mr. Dickson to resolve into Executive Session at 1:35 p.m. The motion carried by a unanimous voice vote. Trustees responding were as follows: Mr. Dickson, Mr. Florence, Ms. Geiger, Ms. Harris, Ms. Kerr, Mr. Meyers, Mr. Oster, Dr. Trennepohl, and Chairman Peacher.
4

After a lengthy discussion, a motion was made by Mr. Oster with a second made by Ms. Kerr to return to open session at 4:30 p.m. The motion carried by a unanimous voice vote. Trustees responding were as follows: Mr. Dickson, Mr. Florence, Ms. Geiger, Ms. Harris, Ms. Kerr, Mr. Meyers, Mr. Oster, Dr. Trennepohl, and Chairman Peacher. ITEM 3 – ACTION ON ITEMS DISCUSSED IN EXECUTIVE SESSION: No action was taken. ITEM 4 – ADJOURNMENT The Chairman adjourned the meeting at 4:35 p.m. BOARD OF TRUSTEES, TEACHERS’ RETIREMENT SYSTEM OF OKLAHOMA
BY: Bill Peacher, Chairman ATTEST:
BY: Beth Kerr, Secretary
5

MEETING MINUTES AUGUST 25, 2014
BOARD OF TRUSTEES TEACHERS’ RETIREMENT SYSTEM OF OKLAHOMA
The special meeting of the Board of Trustees of the Teachers’ Retirement System of Oklahoma was called to order by Chairman Bill Peacher at 10:00 a.m. in the W.B. Skirvin Suite at the Skirvin Hotel, 1 Park Avenue, Oklahoma City, OK. The meeting notice and agenda were posted in accordance with 25 O.S. Section 311(A)(11). TRUSTEES PRESENT: Bill Peacher, Chairman Jill Geiger* Vernon Florence, Vice-Chairman Judie Harris Beth Kerr, Secretary Stewart Meyers James Dickson Andrew Oster Gary Trennepohl TRUSTEES ABSENT: Roger Gaddis Philip Lewis Billie Stephenson Greg Winters TRS STAFF PRESENT: Julie Ezell, General Counsel OTHERS PRESENT: Gary Hudepohl, Hudepohl & Associates *Denotes late arrival or early departure ITEM 1 - ROLL CALL FOR QUORUM: Chairman Peacher called the Board meeting to order at 10:01 a.m. and asked for a poll to determine if a quorum was present. Trustees responding were as follows: Mr. Dickson, Mr. Florence, Ms. Harris, Ms. Kerr, Mr. Meyers, Mr. Oster, Dr. Trennepohl, and Chairman Peacher. ITEM 2 – EXECUTIVE SESSION REGARDING THE INTERVIEWING, EMPLOYMENT, HIRING, OR APPOINTMENT OF CANDIDATE(S) FOR THE POSITION OF EXECUTIVE DIRECTOR OF THE TEACHERS’ RETIREMENT SYSTEM OF OKLAHOMA: A motion was made by Mr. Florence with a second made by Mr. Dickson to resolve into Executive Session at 10:05 a.m. The motion carried by a unanimous voice vote. Trustees responding were as follows: Mr. Dickson, Mr. Florence, Ms. Harris, Ms. Kerr, Mr. Meyers, Mr. Oster, Dr. Trennepohl, and Chairman Peacher.
6

Jill Geiger joined the meeting at 10:12 a.m.
After a lengthy discussion, a motion was made by Mr. Oster with a second made by Ms. Kerr to return to open session at 1:40 p.m. The motion carried by a unanimous voice vote. Trustees responding were as follows: Mr. Dickson, Mr. Florence, Ms. Geiger, Ms. Harris, Ms. Kerr, Mr. Meyers, Mr. Oster, Dr. Trennepohl, and Chairman Peacher. ITEM 3 – ACTION ON ITEMS DISCUSSED IN EXECUTIVE SESSION: No action was taken. ITEM 4 – ADJOURNMENT The Chairman adjourned the meeting at 1:45 p.m. BOARD OF TRUSTEES, TEACHERS’ RETIREMENT SYSTEM OF OKLAHOMA
BY: Bill Peacher, Chairman ATTEST:
BY: Beth Kerr, Secretary
7

MEETING MINUTES AUGUST 27, 2014
BOARD OF TRUSTEES TEACHERS’ RETIREMENT SYSTEM OF OKLAHOMA
The regularly scheduled meeting of the Board of Trustees of the Teachers’ Retirement System of Oklahoma was called to order by Bill Peacher, Chairman, at 9:02 a.m., in the Administration Board Room, 5th Floor, Oliver Hodge Education Building, 2500 N. Lincoln Blvd., OKC, OK. The meeting notice and agenda were posted in accordance with 25 O.S. Section 311(A)(11).
TRUSTEES PRESENT: Bill Peacher, Chair Judie Harris Vernon Florence, Vice Chair Philip Lewis Beth Kerr, Secretary Stewart Meyers James Dickson Andrew Oster Roger Gaddis Gary Trennepohl Jill Geiger Greg Winters TRUSTEES ABSENT: Billie Stephenson TRS STAFF PRESENT: Tom Spencer, Interim Executive Director Julie Ezell, General Counsel Dixie Moody, Director of Client Services Riley Shaull, Comptroller Kim Bold, Director of Human Resources Debra Plog, Manager of Employer Reporting Melissa Kempkes, Investment Analyst Susan Yingling, Executive Assistant OTHERS PRESENT: Danna Foreman, POE Norman Cooper, OREA Shawn Ashley, eCapitol Emily Summars, Journal Record Steve Massey, OREA Chancen Flick, OEA Jack Herron, POE Bill Bentley, POE *Denotes late arrival or early departure.
ITEM 1 - ROLL CALL FOR QUORUM: Chairman Peacher called the Board meeting to order at 9:02 a.m. and asked for a poll to determine if a quorum was present. Trustees responding were as follows: Mr. Dickson, Mr. Florence, Mr. Gaddis, Ms. Geiger, Ms. Harris, Ms. Kerr, Dr. Lewis, Mr. Meyers, Mr. Oster, Dr. Trennepohl, Dr. Winters, and Chairman Peacher.
8
ITEM 2 – MEETING MINUTES: A motion was made by Mr. Oster with a second made by Ms. Kerr to approve the July 23, 2014 Board meeting minutes as presented. The motion carried by a unanimous voice vote. Trustees responding were as follows: Mr. Dickson, Mr. Florence, Mr. Gaddis, Ms. Geiger, Ms. Harris, Ms. Kerr, Dr. Lewis, Mr. Meyers, Mr. Oster, Dr. Trennepohl, Dr. Winters, and Chairman Peacher. ITEM 3 - DISCUSSION AND POSSIBLE ACTION ON INVESTMENT CONSULTANT MONTHLY REPORT: Investment Consultants to the Board, Greg Weaver and Doug Anderson of Gregory W. Group, gave their monthly report to the Board. No action was necessary. ITEM 4 - PRESENTATION BY INVESTMENT MANAGER(S): Investment Managers, AJO and L&B Realty, gave their respective reports to the Board. No action was necessary.
ITEM 5 - MANAGER STATUS SUMMARY REPORT: Investment Consultants to the Board, Greg Weaver and Doug Anderson of Gregory W. Group, gave the Board their Manager Status Summary Report. Mr. Weaver said that there was no need to change three of the managers on the list. Those three included Mackay Shields LLC, Geneva Capital Management LTD, and Lord Abbett & Co. LLC. Mr. Weaver said those managers would continue to be monitored, but that no additional action was recommended at this time. He said Thornburg’s status had its own agenda item and would be discussed later in the meeting. After some discussion, no action was necessary. ITEM 6 – INVESTMENT CONSULTANT QUARTERLY REPORT: Investment Consultants to the Board, Greg Weaver and Doug Anderson of Gregory W. Group, presented their quarterly report to the Board. No action was necessary. ITEM 7 – INVESTMENT CONSULTANT QUARTERLY 403(B) REPORT: Investment Consultants to the Board, Greg Weaver and Doug Anderson of Gregory W. Group, presented the quarterly 403(b) report to the Board. No action was necessary. ITEM 8 - INVESTMENT COMMITTEE REPORT: Mr. Florence, Chair of the Investment Committee, presented the Investment Committee Report from the August 26, 2014 meeting. Mr. Florence said the Investment Committee had four motions to present to the Board for consideration. Mr. Florence explained to the Board that Franklin Park had requested funding of $200 million for 2015 and $200 million for 2016. He said the Investment Committee recommended committing $200 million for 2015, but felt it was better to wait to approve any funding for 2016. Dr. Trennepohl asked if this was for fiscal year 2015 or calendar year 2015. Mr. Weaver said it was a calendar year so the funding would start on January 1, 2015. After some discussion, a motion was made by Mr. Dickson with a second made by Mr. Gaddis to approve the commitment of $200 million in funding to Franklin Park for 2015, but not the request for funding for 2016. The motion carried by a unanimous voice vote. Trustees responding were as follows: Mr. Dickson, Mr. Florence, Mr. Gaddis, Ms. Geiger, Ms. Harris, Ms. Kerr, Dr. Lewis, Mr. Meyers, Mr. Oster, Dr. Trennepohl, Dr. Winters, and Chairman Peacher. Mr. Florence said the second recommendation from the Investment Committee involved an exception request from Lord Abbett to increase their allocation into the emerging High Yield market portfolio for three years from 10% to 15%. Mr. Peacher reminded the Board that this was 5% less than the exception request Lord Abbett had made the previous month. He and Mr. Gaddis
9

said they had met with Lord Abbett during a due diligence trip to New York and felt that the increase was something the Board should consider. Dr. Trennepohl said the OTRS Investment Policy was high on the list of items up for review by the Governance Committee. He expressed concerns for investing in emerging markets as well as granting so many exception requests. After a lengthy discussion, a motion was made by Mr. Gaddis with a second made by Ms. Geiger to approve Lord Abbett’s exception request to increase the allocation into their emerging market High Yield portfolio to 15% for three years. Those voting aye are as follows: Mr. Dickson, Mr. Florence, Mr. Gaddis, Ms. Geiger, Ms. Harris, Ms. Kerr, Dr. Lewis, Mr. Meyers, Mr. Oster, Dr. Winters, and Chairman Peacher. Those voting no are as follows: Dr. Trennepohl. The motion carried. Mr. Florence said the third item the Investment Committee was recommending to the Board was the approval of a second exception request from Lord Abbett that would allow them to hold on to bonds from Argentina that had been downgraded below “CCC” in hope of recovering some of the money. After a brief discussion, a motion was made by Mr. Gaddis with a second made by Ms. Geiger to approve Lord Abbett’s exception request to hold bonds from Argentina that had been downgraded below “CCC.” The motion carried by a unanimous voice vote. Trustees responding were as follows: Mr. Dickson, Mr. Florence, Mr. Gaddis, Ms. Geiger, Ms. Harris, Ms. Kerr, Dr. Lewis, Mr. Meyers, Mr. Oster, Dr. Trennepohl, Dr. Winters, and Chairman Peacher. Mr. Florence said the fourth and final item the Investment Committee had for the Board involved the manager status of Thornburg. Mr. Weaver said that a process needed to be followed in order to terminate a manager that involved finding and hiring a transition manager to manage the funds that would be pulled from the terminated manager. Mr. Florence said the motion from the Investment Committee needed to be amended because it had not taken into account the need to empower staff to make a decision before the next Board meeting. The initial motion made by Mr. Dickson and seconded by Mr. Gaddis was to terminate Thornburg and direct staff and consultants to create a transition plan. After some discussion, it was suggested that the motion be amended to allow staff and the investment consultants to develop a transition plan and select a transition manager and poll the Investment Committee members before the next Board meeting. Mr. Dickson made a motion to accept the amendment and restated his motion to terminate Thornburg and direct staff and the investment consultants to develop a transition plan, select a manager, and poll the Investment Committee members on the decision before the next Board meeting. The amendment and motion was seconded by Mr. Gaddis. The amended motion carried by a unanimous voice vote. Trustees responding were as follows: Mr. Dickson, Mr. Florence, Mr. Gaddis, Ms. Geiger, Ms. Harris, Ms. Kerr, Dr. Lewis, Mr. Meyers, Mr. Oster, Dr. Trennepohl, Dr. Winters, and Chairman Peacher.
A break was taken from 10:46 a.m. to 10:55 a.m.
ITEM 9 – BOARD COMMITTEE REPORTS: Dr. Gary Trennepohl, Chair of the Governance Committee, said there was no report from the committee. No action was necessary. Mr. Stewart Meyers, Chair of the Audit Committee, said that the internal auditors, Stinnett & Associates, were currently conducting interviews with the OTRS staff and that the process was continuing as planned. No action was necessary. Dr. Trennepohl, Chair of the Executive Director Search Committee, told the Board that the Executive Director Search Committee had conducted interviews with the candidates for the
10
position of OTRS Executive Director. He said the Committee was ready to make a recommendation to the Board. After some discussion, no action was necessary. Ms. Kerr suggested the Board move up the Executive Session to discuss the candidate and recommendation. The Board agreed with her suggestion. ITEM 12 – EXECUTIVE SESSION REGARDING THE INTERVIEWING, EMPLOYMENT, HIRING, OR APPOINTMENT OF CANDIDATE(S) FOR THE POSITION OF EXECUTIVE DIRECTOR OF THE TEACHERS’ RETIREMENT SYSTEM OF OKLAHOMA:
A) A motion was made by Ms. Kerr with a second made by Ms. Geiger to resolve into Executive Session at 11:34 a.m. The motion carried by a unanimous voice vote. Trustees responding were as follows: Mr. Dickson, Mr. Florence, Mr. Gaddis, Ms. Geiger, Ms. Harris, Ms. Kerr, Dr. Lewis, Mr. Meyers, Mr. Oster, Dr. Trennepohl, Dr. Winters, and Chairman Peacher.
B) A motion was made by Dr. Winters with a second made by Mr. Dickson to adjourn from
Executive Session and return to open session at 11:54 a.m. The motion carried by a unanimous voice vote. Trustees responding were as follows: Mr. Dickson, Mr. Florence, Mr. Gaddis, Ms. Geiger, Ms. Harris, Ms. Kerr, Dr. Lewis, Mr. Meyers, Mr. Oster, Dr. Trennepohl, Dr. Winters, and Chairman Peacher.
Open Session reconvened at 11:55 a.m. ITEM 13 – ACTION ON ITEMS DISCUSSED IN EXECUTIVE SESSION: A motion was made by Dr. Trennepohl with a second made by Ms. Kerr to offer the position of Executive Director of OTRS to the candidate discussed in Executive Session at a salary of $143,714.00. The motion carried by a unanimous voice vote. Trustees responding were as follows: Mr. Dickson, Mr. Florence, Mr. Gaddis, Ms. Geiger, Ms. Harris, Ms. Kerr, Dr. Lewis, Mr. Meyers, Mr. Oster, Dr. Trennepohl, Dr. Winters, and Chairman Peacher.
A lunch break was taken from 11:58 a.m. to 12:28 p.m.
ITEM 10 – DEVELOPMENT OF OTRS STRATEGIC PLAN: Interim Executive Director, Tom Spencer, told the Board that there were two versions of the OTRS Strategic Plan in the Board packet. He said he had included the red-lined version so the Board could see the original plan and the items he had changed. Mr. Spencer reviewed both versions and told the Board the final version would be available at the September Board meeting. After some discussion, no action was necessary. ITEM 11 – GASB 68 IMPLEMENTATION: Interim Executive Director, Tom Spencer, gave a brief presentation on the implementation of GASB 68 which was summarized in a memo in the board materials. The memo explained the opinion of the staff and the Board’s external auditor on a method to allocate “net pension debt” to OTRS participating employers. The staff and auditor are of the opinion that OTRS has to use a single methodology to allocate the debt. After some discussion, no action was necessary. ITEM 14 - DISCUSSION AND POSSIBLE ACTION TO EXTEND STATE PERSONNEL INTERCHANGE PROGRAM CONTRACT FOR SERVICES OF INTERIM EXECUTIVE DIRECTOR:
11
Mr. Tom Spencer said the OPERS Board had met and agreed to extend the State Personnel Interchange Program Contract for Services of Interim Executive Director for OTRS. The terms of the extension were for one month (the month of September 2014) with 40% of Mr. Spencer’s time spent at OTRS and 60% of his time spent at OPERS. A motion was made by Dr. Trennepohl with a second made by Dr. Winters to amend the terms of the Interchange Program Contract for the month of September for the services of the Interim Executive Director. The motion carried by a unanimous voice vote. Trustees responding were as follows: Mr. Dickson, Mr. Florence, Mr. Gaddis, Ms. Geiger, Ms. Harris, Ms. Kerr, Dr. Lewis, Mr. Meyers, Mr. Oster, Dr. Trennepohl, Dr. Winters, and Chairman Peacher. ITEM 13 - DISCUSSION AND POSSIBLE ACTION ON AGENCY REPORTS: Dixie Moody, Director of Client Services, gave a brief presentation to the Board. Mr. Peacher asked for a benchmark on the number of abandoned calls so it would be easier to gauge where OTRS stood in terms of other agencies. Ms. Moody said she would get that information. After some discussion, a motion was made by Mr. Dickson with a second made by Mr. Oster to approve the monthly retirement report. The motion carried by a unanimous voice vote. Trustees responding were as follows: Mr. Dickson, Mr. Florence, Mr. Gaddis, Ms. Geiger, Ms. Harris, Ms. Kerr, Dr. Lewis, Mr. Meyers, Mr. Oster, Dr. Trennepohl, Dr. Winters, and Chairman Peacher. Melissa Kempkes, Investment Analyst, gave a brief presentation regarding the trade cost analysis. After some discussion, no action was necessary. Kim Bold, Director of Human Resources, gave a brief presentation on the HR department. No action was necessary. Riley Shaull, Comptroller, presented the Finance Report to the Board. After a brief discussion, no action was necessary. Julie Ezell, General Counsel to the Board, gave a brief report regarding the administrative hearing findings status. After some discussion, no action was necessary. Tom Spencer, Interim Executive Director, presented his report to the Board. After a brief discussion, no action was necessary.
ITEM 16 - QUESTIONS AND COMMENTS FROM TRUSTEES: Chairman Peacher announced that Tom Spencer had accepted the offer as the new OTRS Executive Director. The rest of the Board congratulated Mr. Spencer.
ITEM 17 - NEW BUSINESS: There was no new business from the Board. ITEM 18 – ADJOURNMENT:
There being no further business, a motion was made by Ms. Geiger with a second made by Mr. Oster to adjourn the meeting. The motion carried by a unanimous voice vote. Trustees responding were as follows: Mr. Dickson, Mr. Florence, Mr. Gaddis, Ms. Geiger, Ms. Harris, Ms. Kerr, Dr. Lewis, Mr. Meyers, Mr. Oster, Dr. Trennepohl, Dr. Winters, and Chairman Peacher. The meeting was adjourned at 1:15 p.m.
12

BOARD OF TRUSTEES, TEACHERS’ RETIREMENT SYSTEM OF OKLAHOMA
BY: Bill Peacher, Chairman ATTEST:
BY: Beth Kerr, Secretary Certified correct minutes, subject to approval of the Board of Trustees of the Teachers’ Retirement System of Oklahoma, will be available at its next regularly scheduled meeting on September 24, 2014. BY: Susan Yingling, Executive Assistant to the Executive Director
13

Manager Profile - AEW Capital Management, L.P.
Notes:
Asset Class:
Status:
Portfolio Size:
Inception Date:
Actual Allocation:
Annual Management Fee:
Location:
Structure:
Portfolio Management Team:
Represented by: Founded: 1981
Return Profile Since Inception Last 10 Years Last 5 Years Last 3 Years Last Year Last Quarter
AEW* - - - 11.7 11.8 2.3
NCREIF - OEDCE* - - - 12.5 12.7 2.9
Risk Characteristics Number of Holdings Yield P/E Ratio P/B Ratio
AEW 45 5.3%
* Data as of 6/30/14. Performance displayed gross of fees.
Jon Martin
Jay Struzziery
Members of AEW Research analyze economic data available to develop a
comprehensive picture of the urban economy and its real estate markets. To
complement this top-down analysis, group members engage in active dialogue with
AEW management professionals to gain a bottom-up perspective on market trends. The
primary results of these efforts are semi-annual analyses that forecast market supply,
demand and returns for each of the major property types in each of the metropolitan
areas in the United States.
Core Real Estate
In Compliance
$211,466,008
5/1/2011
1.5%
0.83%
Boston, Massachusetts
Wholly-owned by Natixis Global Asset Management
Jon Martin
As of August 31, 2014 2
14

Manager Profile - Heitman LLC.
Notes:
Asset Class:
Status:
Portfolio Size:
Inception Date:
Actual Allocation:
Annual Management Fee:
Location:
Structure:
Portfolio Management Team:
Represented by: Founded: 1966
Return Profile Since Inception Last 10 Years Last 5 Years Last 3 Years Last Year Last Quarter
Heitman - - - 13.0 13.5 3.3
NCREIF - OEDCE* - - - 12.5 12.7 2.9
Risk Characteristics Number of Holdings Yield P/E Ratio P/B Ratio
Heitman 70 5.0%
* Data as of 6/30/14. Performance displayed gross of fees.
Blaise Keane
Shauna Dills
The Fund seeks to deliver its investors a combination of current income return and
moderate appreciation (approximately two-third income and one-third capital
appreciation). In acquiring assets for the fund, Heitman adheres to the following
principles: buy in major markets and build a portfolio that is diversified by property type,
economic exposure and geography. Buy assets with strong attributes such as proximity
to amenities, complementary land uses and transportation networks that are well
constructed to appeal to tenants over long periods of time.
Blaise Keane
Core Real Estate
In Compliance
$209,148,481
5/1/2011
1.5%
0.82%
Chicago, Illinois
50% employee-owned, 50% Old Mutual Owned
As of August 31, 2014 2
15

Monthly Asset Allocation Review
Asset Class Total Market Value Current Percentage New Target
Percentage
Difference Notes
All Cap/Large Cap 3,012,469,826 21.3% 17.0% 4.3%
Mid Cap 2,066,784,574 14.6% 13.0% 1.6%
Small Cap 1,442,624,830 10.2% 10.0% 0.2%
Total Domestic Equity 6,521,879,229 46.1% 40.0% 6.1%
Large Cap International Equity 1,468,377,187 10.4% 11.5% -1.1%
Small Cap International Equity 845,321,180 6.0% 6.0% 0.0%
Total International Equity 2,313,698,368 16.3% 17.5% -1.2%
Core Fixed Income 2,146,366,977 15.2% 17.5% -2.3%
High Yield Bonds 786,776,589 5.6% 6.0% -0.4%
MLPs 1,223,623,826 8.6% 7.0% 1.6%
Private Equity 413,420,876 2.9% 5.0% -2.1%
Real Estate 607,459,693 4.3% 7.0% -2.7% Two searches underway
Opportunistic Assets 141,151,734 1.0% 0.0% 1.0%
Total Non-Core Assets 3,172,432,718 22.4% 25.0% -2.6%
Cash 1,321,729 0.0% 0.0% 0.0%
Composite 14,155,763,803 100.0% 100.0% 0.0%
Excess allocation bound for Private Equity and
Real Estate
As of August 31, 2014 4
16

Total Fund + Class Composite SummaryAs of August 31, 2014
Market Value Inception Date Time Since Inception
(Years)
Since Inception 10 Years 5 Years 3 Years 1 Year Fiscal YTD Last Quarter Last Month
Total Fund (Gross of Fees) 14,155,763,803 12/1/1991 22.8 9.9 9.3 14.3 16.3 20.5 0.9 3.2 3.1
Total Fund (Net of Fees) 9.5 8.9 13.9 15.9 20.1 0.5 3.1 3.1
Allocation Index 9.6 8.1 12.6 13.9 17.6 1.1 3.3 2.9
Actuarial Assumption 8.0 8.0 8.0 8.0 8.0 6.6 1.9 0.6
Total Domestic Equity 6,521,879,229 4/1/1990 24.4 11.1 9.7 17.8 21.3 23.9 0.7 3.7 4.1
S&P 500 46.1% 9.8 8.4 16.9 20.6 25.2 2.6 4.7 4.0
Total All Cap Equity 948,314,025 9/1/2006 8.0 7.9 - 16.7 19.1 22.1 1.9 4.4 3.9
Russell 3000 6.7% 8.1 - 17.2 20.7 24.7 2.1 4.7 4.2
Total Large Cap Active Equity 1,137,443,673 1/1/1995 19.7 10.7 8.5 17.6 22.8 24.6 2.0 3.4 3.8
S&P 500 8.0% 9.8 8.4 16.9 20.6 25.2 2.6 4.7 4.0
Total Mid Cap Equity 2,066,784,574 11/1/1998 15.8 10.8 12.1 19.9 23.1 25.3 0.7 3.8 4.4
Russell Mid Cap 14.6% 10.1 11.1 19.3 21.0 25.3 1.7 5.1 4.8
Total Small Cap Equity 1,442,624,830 2/1/1998 16.6 9.7 10.2 16.7 19.4 21.9 -2.1 2.8 4.2
Russell 2000 10.2% 7.6 9.4 17.0 19.0 17.7 -1.4 3.9 5.0
Total International Equity 2,313,698,368 2/1/1998 16.6 9.2 7.9 9.2 12.2 14.3 -1.7 -0.7 0.8
MSCI ACWI ex-US 16.3% - 7.9 8.2 9.3 17.8 0.0 1.2 0.6
Core Fixed Income (ex- High Yield) 2,146,366,977 4/1/1990 24.4 7.4 6.7 7.5 6.3 10.1 1.6 2.0 1.8
Barclays Aggregate 15.2% - 4.7 4.5 2.9 5.7 0.9 0.9 1.1
Master Limited Partnerships 1,223,623,826 2/28/2011 3.5 25.1 - - 31.0 47.2 2.1 11.5 7.9
Alerian MLP Index 8.6% 17.7 - - 21.9 30.8 4.4 10.5 8.2
High Yield Bonds 786,776,589 2/1/2009 5.6 15.5 - 12.2 10.8 11.9 0.2 1.3 1.5
ML High Yield II 5.6% - - 12.2 10.4 10.6 0.2 1.0 1.5
Core Real Estate 607,459,693 4/1/2011 3.4 - - - - - - - -
NCREIF 4.3% - - - - - - - -
Cash 1,321,729 4/1/1990 24.4 - - - - - - - -91 Day T-bill 0.0% - 1.6 0.1 0.1 0.0 0.0 0.0 0.0
As of August 31, 2014 5
17

Equity Portfolios SummaryAs of August 31, 2014
Market Value Inception Date Time Since
Inception (Years)
Since Inception 10 Years 5 Years 3 Years 1 Year Fiscal YTD Last Quarter Last Month
All Cap / Large Cap Domestic
Hotchkis & Wiley Large Cap 597,695,398 4/1/1990 24.4 11.3 7.9 18.2 24.9 25.4 1.6 3.4 4.0
Russell 1000 Value 4.2% 10.4 8.2 16.6 21.6 24.4 1.9 4.6 3.7
Sawgrass 539,748,275 7/1/2006 8.2 9.1 - 17.6 20.9 23.8 2.5 3.4 3.5
Russell 1000 Growth 3.8% 9.5 - 17.8 19.9 26.3 3.0 5.0 4.6
ARI All Cap 467,663,526 9/1/2006 8.0 6.9 - 16.3 17.8 20.0 0.2 3.3 3.3
Russell 3000 3.3% 8.1 - 17.2 20.7 24.7 2.1 4.7 4.2
EPOCH All Cap 480,650,499 9/1/2006 8.0 8.7 - 17.1 20.3 24.2 3.7 5.6 4.4
Russell 3000 3.4% 8.1 - 17.2 20.7 24.7 2.1 4.7 4.2
Passive Domestic Equity
NT Cap Weighted Passive 459,962,305 4/1/2012 2.4 18.6 - - - 25.0 2.6 4.7 4.0
S&P 500 Cap Weighted 3.2% 18.2 8.4 16.9 20.6 25.3 2.6 4.7 4.0
SSGA Eq Weighted Passive 466,749,823 4/1/2012 2.4 21.3 - - - 26.2 1.9 4.8 4.2
S&P 500 Equal Weighted 3.3% - 10.8 19.4 22.0 26.5 1.9 4.8 4.3
Mid Cap Domestic Equity
Frontier Capital 523,516,945 6/1/2002 12.3 10.8 12.9 18.1 19.9 23.9 0.1 4.1 4.3
Russell Mid Cap Growth 3.7% 9.9 11.0 19.1 19.6 23.7 2.2 5.4 5.4
Wellington Management 464,834,530 9/1/1998 16.0 10.8 11.0 17.0 17.8 22.9 -0.8 1.9 3.7
Russell Mid Cap Growth 3.3% 9.3 11.0 19.1 19.6 23.7 2.2 5.4 5.4
AJO Partners 553,875,818 8/1/1998 16.1 11.7 11.9 21.2 23.7 30.6 3.6 6.3 6.0
Russell MidCap 3.9% 9.7 11.1 19.3 21.0 25.3 1.7 5.1 4.8
Hotchkis & Wiley Mid Cap 524,557,281 8/1/2002 12.1 15.0 12.3 23.0 30.7 23.6 -0.4 2.6 3.6
Russell MidCap Value 3.7% 12.2 10.9 19.4 22.3 27.2 1.2 4.7 4.2
Small Cap Domestic Equity
Shapiro Capital Management 690,867,587 2/1/1998 16.6 11.2 13.3 20.8 22.4 30.5 -2.7 2.2 4.9
Russell 2000 4.9% 7.6 9.4 17.0 19.0 17.7 -1.4 3.9 5.0
Geneva Capital 184,011,551 6/1/2013 1.2 11.5 - - - 8.6 -1.6 3.4 3.3
Russell 2000 Growth 1.3% 18.0 - - - 17.3 -0.1 5.3 5.6
Wasatch Advisors 182,178,511 6/1/2013 1.2 9.5 - - - 11.3 -1.3 2.3 3.0
Russell 2000 Growth 1.3% 18.0 - - - 17.3 -0.1 5.3 5.6
Cove Street Capital 108,727,063 6/1/2013 1.2 14.6 - - - 18.2 -1.5 5.5 3.9
Russell 2000 Value 0.8% 15.4 - - - 18.1 -2.0 2.4 4.4
Frontier Capital 162,186,652 6/1/2013 1.2 15.6 - - - 22.8 -2.4 2.6 4.5
Russell 2000 Value 1.1% 15.4 - - - 18.1 -2.0 2.4 4.4
Neumeier Poma 114,653,466 6/1/2013 1.2 18.8 - - - 18.1 -1.1 3.2 3.6
Russell 2000 Value 0.8% 15.4 - - - 18.1 -2.0 2.4 4.4
International Large Cap Equity
Causeway Capital 551,908,703 5/1/2003 11.3 10.9 8.2 10.8 13.1 16.4 -1.0 -0.9 1.1
MSCI ACWI Ex US 3.9% 9.8 7.9 8.2 9.3 17.8 0.0 1.2 0.6
Northern Trust Passive 437,984,825 9/1/2013 1.0 9.3 - - - 9.3 -2.1 -1.2 -0.2
MSCI EAFE 3.1% 16.4 7.0 8.2 11.4 16.4 -2.1 -1.2 -0.2
Thornburg 478,481,166 1/1/2006 8.7 6.7 - 8.1 7.6 8.2 -1.3 -0.4 1.0
MSCI ACWI Ex US 3.4% 5.5 7.9 8.2 9.3 17.8 0.0 1.2 0.6
International Small Cap Equity
ARI Small Cap International 221,941,278 12/1/2011 2.8 19.7 - - - 22.9 -1.5 1.7 1.0
MSCI EAFE Small Cap 1.6% 18.4 9.0 13.0 9.4 18.8 -2.4 0.5 -2.4
Epoch Small Cap International 209,217,443 12/1/2011 2.8 16.6 - - - 15.9 -3.7 -3.2 0.5
MSCI EAFE Small Cap 1.5% 18.4 9.0 13.0 9.4 18.8 -2.4 0.5 -2.4
Wasatch Small Cap International 201,409,954 12/1/2011 2.8 21.8 - - - 10.5 0.1 0.6 1.6
MSCI EAFE Small Cap 1.4% 18.4 9.0 13.0 9.4 18.8 -2.4 0.5 -2.4
Wellington Small Cap International 212,752,506 12/1/2011 2.8 22.2 - - - 17.7 -3.8 -1.6 -1.0
MSCI EAFE Small Cap 1.5% 18.4 9.0 13.0 9.4 18.8 -2.4 0.5 -2.4
As of August 31, 2014 6
18

Fixed Income Portfolios SummaryAs of August 31, 2014
Market Value Inception Date Time Since Inception
(Years)
Since Inception 10 Years 5 Years 3 Years 1 Year Fiscal YTD Last Quarter Last Month
Core Fixed Income
Loomis Sayles 622,176,337 8/1/1999 15.1 7.3 7.8 8.7 7.1 11.3 1.0 1.6 1.4
Barclays Aggregate 4.4% 5.7 4.7 4.5 2.9 5.7 0.9 0.9 1.1
Lord Abbett 609,097,872 11/1/2004 9.8 6.2 - 6.7 5.3 7.8 0.9 1.2 1.0
Barclays Aggregate 4.3% 4.7 - 4.5 2.9 5.7 0.9 0.9 1.1
Mackay Shields 613,485,077 11/1/2004 9.8 6.5 - 7.5 6.4 7.4 0.8 1.4 1.3
Barclays Aggregate 4.3% 4.7 - 4.5 2.9 5.7 0.9 0.9 1.1
Active Duration Fixed Income
Hoisington 301,607,690 11/1/2004 9.8 8.4 - 9.1 7.7 18.3 6.1 5.9 5.2
Barclays Aggregate 2.1% 4.7 - 4.5 2.9 5.7 0.9 0.9 1.1
High Yield Fixed Income
Loomis Sayles High Yield 262,565,199 2/1/2009 5.6 15.6 - 12.0 10.2 13.3 0.2 1.4 1.7
Merrill Lynch High Yield II 1.9% 16.7 - 12.2 10.4 10.6 0.2 1.0 1.5
Lord Abbett High Yield 263,448,653 2/1/2009 5.6 16.5 - 13.4 12.2 12.8 0.2 1.6 1.4
Merrill Lynch High Yield II 1.9% - - - 10.4 10.6 0.2 1.0 1.5
MacKay Shields High Yield 260,762,737 2/1/2009 5.6 14.4 - 11.2 10.0 9.8 0.1 1.0 1.2
Merrill Lynch High Yield II 1.8% - - - 10.4 10.6 0.2 1.0 1.5
As of August 31, 2014 7
19

Non-Traditional Portfolios SummaryAs of August 31, 2014
Market Value Inception Date Time Since
Inception (Years)
Since Inception 10 Years 5 Years 3 Years 1 Year Fiscal YTD Last Quarter Last Month
Master Limited Partnerships
Chickasaw Capital MLP 435,706,479 2/28/2011 3.5 33.0 - - 40.2 59.7 1.5 10.9 8.2
Alerian MLP Index 3.1% 15.5 - - 18.3 17.8 -3.5 5.6 -3.5
Cushing MLP Management 427,115,261 2/28/2011 3.5 26.4 - - 32.9 52.2 2.7 12.1 8.4
Alerian MLP Index 3.0% 15.5 - - 18.3 17.8 -3.5 5.6 -3.5
FAMCO MLP 360,802,087 2/28/2011 3.5 19.0 - - 24.0 34.4 1.9 11.3 7.0
Alerian MLP Index 2.5% 15.5 - - 18.3 17.8 -3.5 5.6 -3.5
Private Equity
Legacy Private Equity Portfolio 69,183,772 10/1/2008 5.9 - - - - - - - -
Franklin Park Private Equity 344,237,104 4/1/2010 4.4 - - - - - - - -
2.9% - - - - - - - -
Real Estate
AEW Real Estate 211,466,008 5/1/2011 3.3 - - - - - - - -
NCREIF - OEDCE 1.5% - - - - - - - -
Heitman Real Estate 209,148,481 5/1/2011 3.3 - - - - - - - -
NCREIF - OEDCE 1.5% - - - - - - - -
L&B Real Estate 186,245,204 4/1/2011 3.4 - - - - - - - -
NCREIF - OEDCE 1.3% - - - - - - - -
L&B Golden Driller 600,000 7/1/2014 0.2 - - - - - - - -
NCREIF - OEDCE 0.0% - - - - - - - -
Opportunistic Fixed Income
PIMCO BRAVO 102,989,366 3/31/2011 3.4 - - - - - - - -Barclays Aggregate 0.7% - - - - - - - -
PIMCO BRAVO II 38,162,369 3/31/2013 1.4 - - - - - - - -
Barclays Aggregate 0.3% - - - - - - - -
As of August 31, 2014 8
20

Three Year Risk/Return Review - Equity Portfolios
3/31/2014
Manager Market Value 3 Year Return 3 Year Standard Deviation Sharpe Ratio (0% Rf%)-
Hotchkis LCV 597,695,398 25 18.5 1.347114 21.63
Sawgrass LCG 539,748,275 21 12.8 1.639055 13.05
ARI AC 467,663,526 18 15.0 1.186914 16.49
EPOCH AC 480,650,499 20 17.3 1.173487 18.03
Wellington MCG 464,834,530 18 23.9 0.744468 26.66
Frontier MCG 523,516,945 20 17.4 1.144821 18.05
AJO MCV 553,875,818 24 18.4 1.28746 19.49
Hotchkis MCV 553,875,818 31 24.3 1.266035 27.84
Shapiro SC 690,867,587 22 19.5 1.148731 22.98
Geneva SCG 184,011,551 21 17.8 1.17284 26.53
Wasatch SCG 182,178,511 19 17.1 1.115654 25.72
Cove Street SCV 108,727,063 17 18.4 0.902174 20.68
Frontier SCV 162,186,652 20 20.2 0.973723 25.83
Neumeier Poma SCV 114,653,466 18.5 0 24.05
Causeway Intl Eq 551,908,703 13 21.4 0.61278 23.72
Thornburg Intl Eq 478,481,166 8 18.1 0.419966 20.05
ARI SCI 221,941,278 7 18.4
Epoch SCI 209,217,443 8 20.3
Northern Trust Passive 437,984,825 11 16.8
Wasatch SCI 201,409,954 19 19.7
Wellington SCI 212,752,506 7 18.9
1Actual OTRS results used when available, composite when necessary.
Hotchkis LCV
Sawgrass LCG
ARI ACEPOCH AC
Wellington MCG
Frontier MCG
AJO MCV
Hotchkis MCV
Shapiro SCGeneva SCG
Wasatch SCG
Cove Street SCV
Frontier SCV
Causeway Intl Eq
Northern Trust PassiveThornburg Intl EqARI SCI
Epoch SCI
Northern Trust Passive
Wasatch SCI
-5.0
0.0
5.0
10.0
15.0
20.0
25.0
30.0
35.0
40.0
0.0 5.0 10.0 15.0 20.0 25.0 30.0
3 Y
ea
r A
nn
ua
lize
d R
etu
rn
Annualized Standard Deviation of Returns
As of August 31, 2014 9
21

Three Year Risk/Return Review - Fixed Income Portfolios
2/29/2012
Manager Market Value 3 Year Return 3 Year Standard Deviation Sharpe Ratio (0% Rf%)-
Founded: 1938
Please Note - Preliminary report using unaudited data from JP Morgan.
Hoisington 301,607,690 8 16.6 0.4621697
Loomis Core 622,176,337 7 4.1 1.7569631
Lord Abbett 609,097,872 5 3.1 1.7427353
Mackay Core 613,485,077 8 2.5 3.01344
Loomis Sayles HY 262,565,199 10 8.2 1.2374333
Lord Abbett HY 263,448,653 12 6.6 1.8389774
Mackay HY 260,762,737 10 4.7 2.119866
1Actual OTRS results used when available, composite when necessary.
HoisingtonLoomis Core
Lord Abbett
Mackay Core
Loomis Sayles HY
Lord Abbett HY
Mackay HY
-5.0
0.0
5.0
10.0
15.0
20.0
25.0
30.0
35.0
40.0
0.0 5.0 10.0 15.0 20.0 25.0 30.0
3 Y
ea
r A
nn
ua
lize
d R
etu
rn
Annualized Standard Deviation of Returns
As of August 31, 2014 10
22

September Manager Status Report
Manager Mandate Strategy AUM% of
PortfolioCurrent Status
Reason for Status
Change
Status Change
Effective DateDate of Last Review
Date of Next
ReviewExpectations
Thornburg Investment
Management
International
EquityAll Cap 478,481,117 3.39% Terminated Performance Issues August 2014
MacKay Shields LLC Fixed Income High Yield 260,712,113 1.85% On Alert Personnel Change June 2014 June 2014 December 2014Maintain continuity of management
practices and results
Geneva Capital
Management, LTD
Domestic
EquitySmall Cap 184,011,541 1.30% On Alert Acquisition July 2014 July 2014 December 2014
Maintain continuity of management
practices and results
Lord Abbett & Co. LLC Fixed Income Core Plus 609,041,805 4.32% On Alert Personnel Change July 2014 July 2014 December 2014Maintain continuity of management
practices and results
All other managers currently rated In Compliance
23
FY 2016 - 2020 Strategic Plan
For
Teachers Retirement System
as of:
August 30, 2014
24
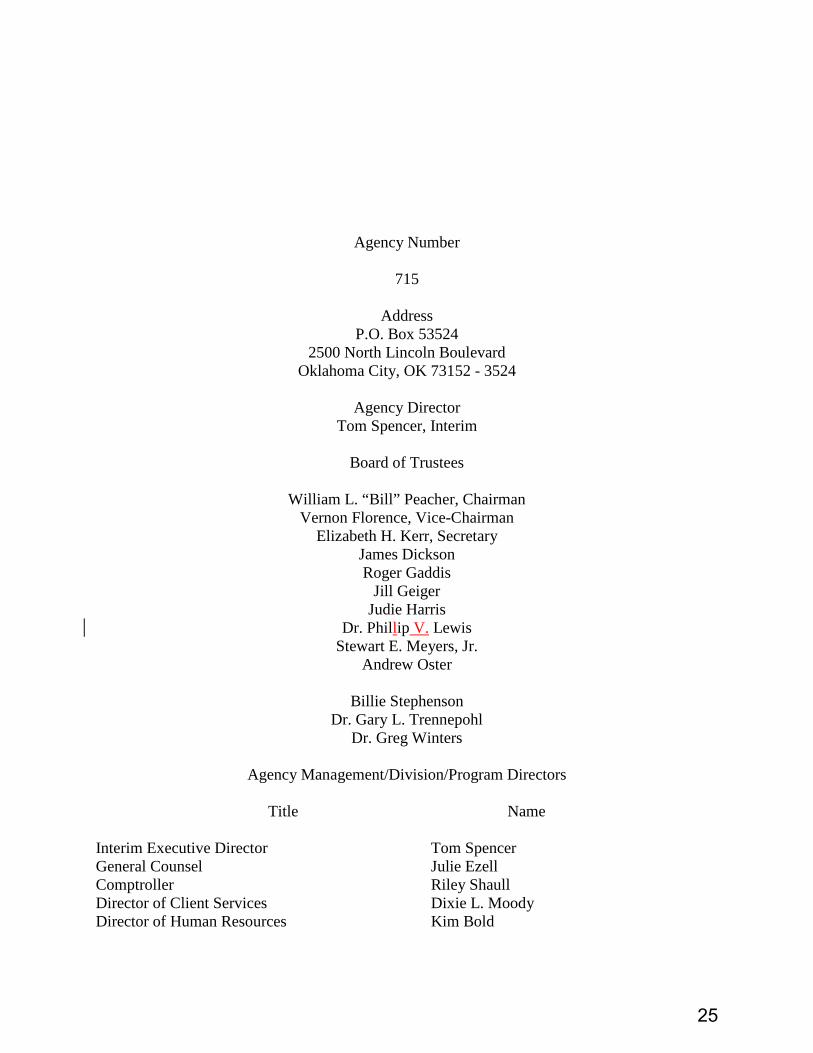
Agency Number
715
Address P.O. Box 53524
2500 North Lincoln Boulevard Oklahoma City, OK 73152 - 3524
Agency Director
Tom Spencer, Interim
Board of Trustees
William L. “Bill” Peacher, Chairman Vernon Florence, Vice-Chairman
Elizabeth H. Kerr, Secretary James Dickson Roger Gaddis
Jill Geiger Judie Harris
Dr. Phillip V. Lewis Stewart E. Meyers, Jr.
Andrew Oster
Billie Stephenson Dr. Gary L. Trennepohl
Dr. Greg Winters
Agency Management/Division/Program Directors
Title Name
Interim Executive Director Tom Spencer General Counsel Julie Ezell Comptroller Riley Shaull Director of Client Services Dixie L. Moody Director of Human Resources Kim Bold
25

Describe the strategic planning process followed by the agency. Senior management staff directly participated in the planning process with a series of meetings from July 2014 through August 2014. The agency's strategic planning committee has reviewed and updated the original plan and subsequent plans to arrive at the FY 2016-2020 plan. Meetings were conducted with individual section leaders and senior management. Goals, performance measurements, and action plans were evaluated and modified to produce the current plan. Statistical information was developed to illustrate the growth of membership population (active and retired members) and services provided to various groups of the System's membership. The Board of Trustees reviewed a draft at the August meeting and adopted the final Plan at its September board meeting. EXECUTIVE SUMMARY Summary of environmental assessment. A. Economy: We must be aware of the condition of the national and state economies, which have a direct impact on the Teachers' Retirement System. Return on investments and revenue collections are two of the main sources of income to the System. While there were downturns in the national and global markets five and six years ago, investment returns have rebounded nicely in recent years. With interest rates at historic lows, it will be difficult to achieve good returns in many fixed income investments over the near term. TRS has added alternative investments such as real estate, private equity and master limited partnership interests, to complement its equity holdings. The portfolio is well-diversified. The Board of Trustees monitors and adjusts the System's investment policies and strategies as needed to maximize returns while protecting the asset base. State revenues, member and local school district contributions have increased during the past several years and modest growth in these revenue sources is expected to continue for the next several years. Senate Bill 1376, enacted in 2002, provides that the agency receives 5% of state sales, use and income tax collections. Senate Bill 357, enacted in 2007, increased contributions from local school districts by 1.5% of employees' pay over a three-year period. These revenue increases are intended to reduce the Retirement System's unfunded liabilities. B. Social/Demographic: Our aging membership parallels societal trends, which create additional requirements on pension plans. The "baby-boomers" are at retirement age and require more timely information on benefits than past generations of retirees. We are working to improve our delivery of benefits and information by better use of the Internet, as well as written and oral communications. C. Government and Regulatory: In 2006, HB 1179XX included a significant change in the retirement benefit formula affecting 30,000 active members. The agency had to implement major changes to address this legislation. Further reform took place in recent years that delays the retirement age for new members. New pension legislation at both state and federal levels must be anticipated and accommodated to ensure member entitlements are accurate and timely. New accounting standards like GASB 67 & 68 are increasing staff time and time spent by our retained service providers on actuarial and auditing work. There may be efforts to consolidate the
26

administration of the state pension plans. There also may be those who favor closing the TRS defined benefit plan and moving to a defined contribution plan or cash balance plan. D. Competition: While TRS is not in direct competition with private sector providers, members’ expectations from their dealings with private financial institutions require TRS to improve delivery of financial services and benefit information. TRS provides a defined benefit plan to 146,036 members and an optional defined contribution plan to approximately 3,783 participants. E. Technology: The TRS membership uses the Internet and smart phones more and more to conduct personal financial business. In response to technological advancements, TRS has enhanced its website to include the addition of an Employer Portal in 2013 that provides a more efficient method for remitting agencies reporting monthly contributions. A retirement benefit estimator was updated in FY-2006. The website will continue to be upgraded and used to increase member awareness of available benefits and services. Our document imaging system has enabled staff to improve response time to member inquiries. TRS is nearing completion on a custom-built pension administration system called “Alice.” The basic system has active and retired client data including a fully integrated image viewing system. TRS recently retained an outside project manager to evaluate the project to date, and bring the basic development to a conclusion. The basic system is already in place with some fixes in process. The TRS and developer are currently working on data migration and data cleanup projects. Two eEnhancements to Alice were authorized in the fall of 2013 including an accounting piece (general ledger) and include athe client portal. F. Market/Customers: During the past ten years, the number of active members has increased 6.2%, while the number of retirees has increased 38.3%. Annual benefit payments have increased from $701 million to $1.077 billion. Current members are more knowledgeable and desire a higher level of information for long-term financial planning. G. Industry Trends and Best Practices: TRS participates in several national or regional organizations that promote innovative practices to improve delivery of retirement benefits. Benefit design, investment opportunities, technology, accounting and internal auditing are areas that have benefited from participation in national or state meetings of peer groups. The Board of Trustees has shown its commitment to best practices in several areas. It has adopted a strong Governance Policy as well as a Fraud Reporting Policy. It also implemented a fraud and abuse reporting system using an independent, external provider. In addition the Board continues its thorough internal audit program using an external firm specializing in auditing financial systems and other processes. H. Factors of Production and Internal Environment: TRS operates at a relatively low level of administrative expense compared to other state-run pension plans. A global benchmarking firm has documented that TRS administrative cost per member and ratio of staff per member is well below national averages. Implementation of our strategic plan will enable us to continue to provide quality service at minimum cost per member. The reduction in cost will be balanced by a need to deliver quality services to client. I. The Role of a Retirement Plan in Recruitment and Retention: A well-funded retirement plan for teachers and educators is necessary if the state is to attract and retain professionals who can
27

improve the education being received by our students. This is important if the stated educational goals are to be achieved. A better-funded System may also allow cost-of-living adjustments to improve the economic condition of our retired members and raise the average income of Oklahoma. J. Staff Development: The TRS Strategic Plan also includes plans to educate and train our staff in the use of the most up-to-date technology. This will be necessary if the System is to improve services to our members while maintaining our relatively low number of staff providing these services. Other staff training and education will also improve the delivery of quality customer service. K. The Financial Condition of TRS Affects the State’s Fiscal Condition: The underfunded condition of the Teachers' Retirement System has affected the overall bond rating of the state, which can increase the cost of all state borrowing. As funding levels improve, financial resources used to pay down pension debt may be available for other state needs. Assumptions: Conditions/issues that will exist in the short and long term future. The following highlight conditions/issues that will exist during the period covered by this strategic plan: The condition of the national economy may require further adjustments in investment strategy. The State economy and State tax policy may impact TRS funding levels. The agency relies on income from investments to finance benefit payments. The impact of past negative market conditions have re-enforced the necessity of a better-funded status of the Retirement System. Past legislative actions have both increased and decreased the actuarial funded status of the Teachers' Retirement System. Passage of Senate Bills 1376 (2002) and 357 (2007) have benefited the System but benefit increases to participants have also increased liabilities. The State’s budget and revenue needs might impact the System’s ability to amortize existing liabilities over the current funding period of 17 years. As more active teachers approach retirement age, the need for improved communications and retirement benefit projections will increase. During the last ten years the increase in the number of retired members has averaged 3.6%per year. The average increase in active members has been 0.95%per year for the last ten years. Active membership decreased 0.3%during FY-2012, increased 1.8% in FY-2013 and 0.2% for FY-2014. Questions concerning Social Security may also increase awareness and concerns for better retirement planning and communication. Pension benefit design change is a national issue and will undoubtedly receive serious study in future legislative sessions. Compliance with state and federal laws, as well as changes in professional standards, may require modifications to existing programs and work processes.
28

Retired and active clients will expect TRS to keep up with the latest technology in their interaction with the System. Improvements to the TRS pension administration system including a full-featured client portal will enable us to continue to increase productivity and client services. Summary of agency - wide action plans to address the needs. The agency-wide action plans address how we can: -Improve and Enhance Client Services including Better Communications -Achieve Superior Risk-Adjusted Returns -and Secure Adequate Revenue to Improve the Fundeding Status of the Plan -Develop an Efficient, Knowledgeable Professional Team -Enhance IT Capabilities and Services The System includes fourfive general goals, ninefive performance measures, and twentyeight action plan items. A team of staff members has been assigned to see that each goal, corresponding performance measures and action items are accomplished within the established time lines. Summary of financial needs to address issues. The Teachers' Retirement System is a state-run trust that provides retirement benefits to education employees. The main sources of revenue are member contributions, employer contributions from local school districts, dedicated revenue from the state of Oklahoma and investment income. The System is seriously underfunded with total assets representing approximately 60% of future liabilities. Although investment returns have consistently been above the median for public pension plans, an influx of new monies would improve the chances that current members and retirees will receive what they have earned and been promised. Annual benefit payments to retired members now exceed $1.077 billion. Cost-of-living adjustments for retirees are necessary on a regular basis to prevent purchasing power erosion, but these increases and other benefit improvements add to overall liabilities of the System. In 2011 the Legislature enacted HB 2132 which makes it significantly harder to pass COLA legislation. Future COLA legislation for all state pension plans must have sufficient funding to pay the cost. Since 2002, the state legislature has addressed the funding level of the System by increasing state revenues directed to the Retirement System and increasing the contribution rate paid by local school districts. It is imperative these increased revenue sources be maintained. The Teachers' Retirement System is a non-appropriated agency. Administrative expenses are paid from investment income. Like other state agencies, an annual budget is submitted to the Office of Management and Enterprise Services. Implementation of most of the action plans can be accomplished without any significant increase in current budget levels. Agency Mission We collect, protect and grow assets to provide a secure retirement income for public education employees.
29

Agency Vision The vision of OTRS is to: Provide quality service to our clients in an efficient, economical manner, Provide our clients on-demand and accurate access to their personal financial information, Educate our clients about their retirement benefits, and Inform our clients about the financial status of OTRS so they will be confident in our ability to provide their benefits.
Values and Behaviors Customer Service: We are dedicated to professional, accurate, timely and cost-effective delivery of services and benefits to clients and retirees. Teamwork: We value a cooperative work environment in which each employee is motivated to achieve the goals of the agency. Reputation: We take pride that TRS is known for the quality of its work as well as the services it provides to its clients, and we strive to continuously improve our work product. Adequate Funding: We recognize the importance of a properly funded pension plan and the role we play in the lives of our constituents. Competency: We believe that training and constructive supervision are keys to a professional staff. Ethical Behavior:
We are open, responsive, and ethical in the conduct of business with clients, annuitants, government officials and the public.
30

TRS GOALS
SUMMARY OF GOALS
Our long-term goals are to improve the funded status of the pension plan by maximizing return on investment and securing adequate funding from the state. We will improve customer service by building and maintaining a professional staff and through the utilization of the Internet and other technology.
Goal #1: Improve and Enhance Client Services including Better Communications Goal #2: Achieve Superior Risk-adjusted Returns and Secure Adequate Funding Goal # 3: Secure Adequate Revenue to Improve the Funded Status of the Plan Goal #43: Develop an Efficient, Knowledgeable Professional Team Goal #54: Enhance IT Capabilities and Services
AGENCY ACTION PLANS AND KEY PERFORMANCE MEASURES TO REACH TRS GOALS GOAL #1: Improve and Enhance Client Services including Better Communications Action Plan #1: Establish comprehensive and periodic customer satisfaction survey program. KPM: Completion time for implementing the project.
Actual Budgeted Estimated FY-20014 0% FY-2015 0% FY-2016 50%
FY-2017 75100% FY-2018 100%
Introduction: TRS will create a program to survey our various business processes, including new retirements, walk-in visits, withdrawal of contributions, phone service, counseling, and others as identified.
• Identify high-volume business processes to survey (March 2015). • Benchmark what other retirement systems across the country are surveying and their
methodology (July 2015). • Establish a timeline and communications plan for the rollout of each survey (November
2015). • Calculate the number of completed responses to obtain statistically valid response data
(March 2016).
31

• Review the business case for outsourcing vs. internal management in the development of various surveys and the compilation of results, considering the costs and benefits associated with paper, online or phone surveying (Dec. 2016).
• Initiate process of survey development (July 2017).
Implementation Team: Leader: Dixie Moody Team Members: Lisa Giles, Susan Yingling, Donna Spurrier. Action Plan #2: Issuance of Annual Statements. Description: Annual statement to members age 50+ or those with 20+ years of service to show estimated monthly benefits at retirement age. Most statements will be provided online to clients through the Client Portal. Implementation Team: Leader: Lisa Giles Team Members: Dixie Moody, Debra Plog, Kaleb Jones and Susan Yingling Action Plan #3: Create/distribute an annual financial report in non-technical language for TRS clients and stakeholders Description: Develop and distribute a Popular Annual Financial Statement (“PAFR”) that will provide important information from the Consolidated Annual Financial Report (“CAFR”). The goal of the PAFR will be to provide important financial and funding information to TRS clients and school officials. Target date is January 2016. Implementation Team: Leader: Lisa Giles Team Members: Riley Shaull, and Susan Yingling g GOAL #2: Achieve Superior Returns and Secure Adequate Funding Action Plan #4: Maintain investment policies to maximize investment performance. Description: The TRS Board of Trustees working with the investment consultant will continue to review current investment strategies and employ policies to achieve a 5-year annualized return on investments of at least the actuarial assumed return of 8%. Our goal is to remain in the top quartile when measured against investment returns of public pension plans of similar size. Persons Responsible Date Board of Trustees Continual Executive Director Chief Investment Officer TRS Investment Consultant GOAL # 3: Secure Adequate Revenue to Improve the Funded Status of the Plan Action Plan #5: Protect Funding Sources and Increase Funded Ratio Description: TRS needs to continuously protect its funding sources during each session of the Legislature. The improvement in TRS’ funded ratio has come in large part fromto the increase in funding sources enacted by past legislatures. In an environment where the State’s revenue may
32

be declining, every source of revenue will be scrutinized. Only through continued communication with state leaders about the importance of staying on track with TRS funding progress. Below are goals for increased funded ratios. Key Performance Measures (funded ratio) Actual Budgeted Estimated FY-2014 57% FY-2015 62% FY-2016 64% FY-2017 66% FY-2018 68% FY-2019 70% FY-2020 72% Implementation Team: Leader: Executive Director Team Members: Julie Ezell, General Counsel; Susan Yingling Action Plan #5: Maintain investment policies to maximize return on investments. Description: The TRS Board of Trustees working with the investment consultant will continue to review current investment strategies and employ policies to achieve a 5-year annualized return on investments of 9%. Our goal is to remain in the top quartile when measured against investment returns of public pension plans of similar size. Persons Responsible Date Board of Trustees Continual Executive Director Chief Investment Officer TRS Investment Consultant GOAL #43: Develop an Efficient, Knowledgeable Professional Team Action Plan #6: Staff development program Description: Staff training program based on needs assessment, which will be reviewed annually. Due consideration will be given to private sector training. This will be measured by the percentage of employees completing the prescribed training program. Key Performance Measures (% emp’ees trained) Actual Budgeted Estimated FY-2014 75% FY-2015 80% FY-2016 85% FY-2017 90% FY-2018 95% FY-2019 100% Implementation Team: Leader: Kim Bold Team Members: Dixie Moody, Riley Shaull, and Chief Investment Officer
33

GOAL #54: Enhance IT Capabilities and Services Action Plan #7: Disaster Recovery Plan. Acquire or contract for a hot site or cold site. Develop capability to continue operations at an offsite location in the event of disaster. KPM: Completion time for developing and implementing a disaster recovery plan.
Actual Budgeted Estimated FY-2014 0% FY-2015 20% FY-2016 60%
FY-2017 80% FY-2018 90% FY-2019 100%
Action Plan: Introduction: It is important to recognize that technology is just a single component of an overall disaster recovery plan. It is the business processes by which an organization operates that determines the overall strategy. Action Items:
• Identify business processes (January 2015). • Prioritize business processes, determine which processes, if lost, create a high, medium or
low impact on the business (July 2015). • Identify all inputs and outputs to business processes. Inputs include but are not limited to
the following: all online screens, online data, imaged data, spreadsheet data, form input, agency phone/address/email information, client address information. Outputs include but are not limited to retiree payments, retiree notices, retiree and client newsletters, agency phone/address/email information, client address information (December 2015).
• Determine what infrastructure is necessary to support the business process. Create an inventory list of all items needed at the disaster site. Examples would be phone system, copiers, fax machines, local area servers and printers, PC workstations, PC printers, internet connectivity, Alice database, paper supplies, paper check supplies, special form supplies, documentation of business procedures (June 2016).
• Determine space requirements for all staff functions (August 2016). • Write cold site and hot site requirements for items 4 and 5 above. Also include travel
distance for staff, power, heat and air, lighting, handicap concerns, bathroom, and parking requirements, etc. (January 2017).
• Acquire hot site or cold site (September 2017). Implementation Team: Leader: Donna Spurrier. Team Members: Dixie Moody, Lisa Giles, Riley Shaull, Julie Ezell, OMES staffer and Susan Yingling.
34

Action Plan #8: Produce information in the form of industry standard media files online to complement existing pre-retirement seminar videos and other information for clients and education payroll officers. KPM: Percentage of project completion for full implementation.
Actual Budgeted Estimated FY-2014 0% FY-2015 10% FY-2016 100%
Action Plan:
• Research capability of providing online training videos (January 2015 – July 2015). • Identify software application (January 2016). • Modify content to suit the chosen medium (by July 2016). • Produce and/or purchase products (by January 2017). • Complete implementation of retirement training program and upload videos for client
use. (July 2017). • Staff edits procedure manual text for conversion to video script. (July 2011 through
November 1, 2011). • Create training files and test (November 2011 through March 2012). • Provide training files on agency Intranet (April 2012).
Implementation Team: Leader: Lisa Giles Team Members: Dixie Moody, Susan Yingling, Frances Rogers.
35
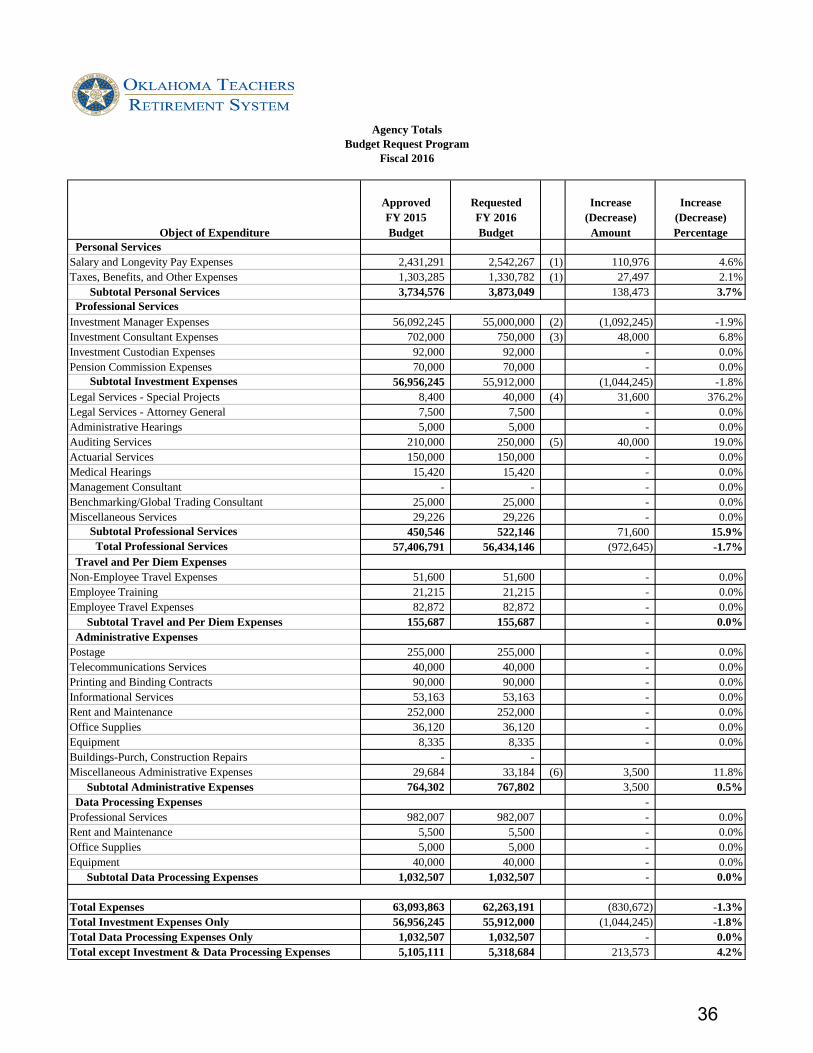
Approved Requested Increase Increase
FY 2015 FY 2016 (Decrease) (Decrease)Object of Expenditure Budget Budget Amount Percentage
Personal ServicesSalary and Longevity Pay Expenses 2,431,291 2,542,267 (1) 110,976 4.6%Taxes, Benefits, and Other Expenses 1,303,285 1,330,782 (1) 27,497 2.1% Subtotal Personal Services 3,734,576 3,873,049 138,473 3.7% Professional ServicesInvestment Manager Expenses 56,092,245 55,000,000 (2) (1,092,245) -1.9%Investment Consultant Expenses 702,000 750,000 (3) 48,000 6.8%Investment Custodian Expenses 92,000 92,000 - 0.0%Pension Commission Expenses 70,000 70,000 - 0.0% Subtotal Investment Expenses 56,956,245 55,912,000 (1,044,245) -1.8%Legal Services - Special Projects 8,400 40,000 (4) 31,600 376.2%Legal Services - Attorney General 7,500 7,500 - 0.0%Administrative Hearings 5,000 5,000 - 0.0%Auditing Services 210,000 250,000 (5) 40,000 19.0%Actuarial Services 150,000 150,000 - 0.0%Medical Hearings 15,420 15,420 - 0.0%Management Consultant - - - 0.0%Benchmarking/Global Trading Consultant 25,000 25,000 - 0.0%Miscellaneous Services 29,226 29,226 - 0.0% Subtotal Professional Services 450,546 522,146 71,600 15.9% Total Professional Services 57,406,791 56,434,146 (972,645) -1.7% Travel and Per Diem ExpensesNon-Employee Travel Expenses 51,600 51,600 - 0.0%Employee Training 21,215 21,215 - 0.0%Employee Travel Expenses 82,872 82,872 - 0.0% Subtotal Travel and Per Diem Expenses 155,687 155,687 - 0.0% Administrative ExpensesPostage 255,000 255,000 - 0.0%Telecommunications Services 40,000 40,000 - 0.0%Printing and Binding Contracts 90,000 90,000 - 0.0%Informational Services 53,163 53,163 - 0.0%Rent and Maintenance 252,000 252,000 - 0.0%Office Supplies 36,120 36,120 - 0.0%Equipment 8,335 8,335 - 0.0%Buildings-Purch, Construction Repairs - - Miscellaneous Administrative Expenses 29,684 33,184 (6) 3,500 11.8% Subtotal Administrative Expenses 764,302 767,802 3,500 0.5% Data Processing Expenses - Professional Services 982,007 982,007 - 0.0%Rent and Maintenance 5,500 5,500 - 0.0%Office Supplies 5,000 5,000 - 0.0%Equipment 40,000 40,000 - 0.0% Subtotal Data Processing Expenses 1,032,507 1,032,507 - 0.0%
Total Expenses 63,093,863 62,263,191 (830,672) -1.3%Total Investment Expenses Only 56,956,245 55,912,000 (1,044,245) -1.8%Total Data Processing Expenses Only 1,032,507 1,032,507 - 0.0%Total except Investment & Data Processing Expenses 5,105,111 5,318,684 213,573 4.2%
Agency TotalsBudget Request Program
Fiscal 2016
36
EXPLANATORY NOTES TO BUDGET REQUEST
(1) Possible salary adjustments for employees
(2) Reduction of Investment Manager fees per market conditions
(3) Rebidding Investment Consultant contract could end up with higher fees
(4) Increase for Ice-Miller legal work for future legal opinions
(5) Additional field audit work for GASB 67 & 68 audit
(6) Membership dues in the National Association of State Retirement Administrators (NASRA)
37
38

39

40

41

42

43
44

45

46

47

48

49

50

51
52

53

54

55

56

57

58

59
60

61

62

63

64
65
66

67

M E M O R A N D U M TO: OTRS Board of Trustees FROM: Tom Spencer, TRS Interim Executive Director DATE: September 19, 2014 RE: Computing pension liability for OU & OSU under GASB 67 & 68 - UPDATE ------------------------------------------------------------------------------------------------------------ Much of this memo is what was in the Board materials last month. However, I wanted to update this based on conversations since that meeting. “GASB” is the Governmental Accounting Standards Board. Even though the GASB isn’t a government agency and has no enforcement authority, the accounting standards it adopts become gospel. In the past, GASB standards dealt with both accounting and actuarial issues as they applied to public pension plans. The standards actually included direction on appropriate ways to fund public pension plans. Actuaries have always conducted their work in a manner consistent with these accounting standards. After years of debate, the GASB adopted standards 67 & 68. The GASB itself stated that these standards were resulting in a “divorce” between accounting standards and actuarial funding. These standards establish new rules for how public pension plan financial statements are prepared, and what information related to pension liability must appear in the financial statements of government agencies that participate in public pension plans. Most of us who have dealt with pension plans for the last several years are familiar with the term “unfunded liability” which is shorthand for “unfunded actuarial accrued liability.” The basic concept is simple. The obligation to pay pensions is a liability of the retirement plan. Each plan has assets set aside and pledged to pay these pensions. If the assets are lower than the liabilities, the plan has an “unfunded liability”. The jargon has changed. With the adoption of GASB 67 & 68, public plans and their participating employers must calculate the “net pension liability” of the Plan. There is not much difference in how this number is determined compared to the calculation of “unfunded liability.” What was groundbreaking (and troubling to many) was the GASB 68 requirement that all participating government employers in a plan would have to report their share of this “net pension liability” in their own financial statements. This was particularly troubling to participating governments in Oklahoma as the Oklahoma Supreme Court has held several times that the State of Oklahoma is responsible for all pension liability. At the end of FY 2013, the unfunded liability of OTRS was a little more than $8 billion. Under GASB 67 & 68, OTRS has to adopt a method of allocating the pension liability for FY 2014 to all of its participating employers. Then to the extent the employer prepares a financial statement under Generally Accepted Accounting Principles (GAAP) the employer will have to reflect that allocation as a liability in that statement. Before I started as the Interim Director on April 1, OU and OSU had contacted OTRS about the impact of GASB 67 & 68 on those universities. As will be discussed in a little more detail later
68

in this memo, they were concerned about how their portion of the net pension debt of OTRS would be allocated to them under these new accounting standards. They are asking that the OTRS Board adopt an allocation process using, in part, a calculation that is mandated under state law for the OU/OSU alternative Retirement Plan. This statute dictates how much the universities must continue to pay OTRS to pay their own share of OTRS unfunded liability. In the implementation guidance from the GASB, there are a few acceptable methods for public plans to adopt. Both the OTRS staff and the OPERS staff are recommending that the allocations be based on the amount of employer contributions to the plan. Both plans’ actuaries and external auditors are recommending this method. On page 92 of the GASB 68 Implementation Guide, is the guidance to plans picking that method of allocation. It states, “[a] liability should be recognized for the employer’s proportionate share of the collective net pension liability.” This seems to say that there is a single “collective” liability shared by a group of participating employers. Paragraph 48(a) makes clear that it is measured by one employer’s proportionate share of those contributions compared to the entire group of contributing employers. Using one methodology for one or two employers, and using a different methodology of allocation for the other employers, appears to be inconsistent with this guidance in the opinion of OTRS staff. What is the basis of OU’s and OSU’s belief that a different method should be used for those institutions? It is based on the legislation that permits OU and OSU to set up alternative retirement plans found in 70 O.S. Section 17-201 et seq. These statutes were enacted in 2004. The clear purpose of these statutes is to grant permission to certain institutions of higher education to set up their own plans even though they had been participating in the Oklahoma Teachers’ Retirement System since its inception in 1943. OU and OSU are the only institutions of higher education that currently qualify under the legislation. The secondary reason behind the statutes was to ensure that these two institutions continue to financially support OTRS since many retired members worked at OU and OSU. A substantial amount of unfunded liability has built up over time and some of this debt is directly attributable to paying retirees of these two institutions. These statutes, which pre-date GASB 67 & 68, provide a statutory mechanism to track these institutions’ fair share of the unfunded liability. A surcharge of 2.5% of compensation is collected from the institutions based on the compensation of current active employees who opt out of OTRS. The legislation also has a method by which OU & OSU could be liable for an additional surcharge should the financial condition of OTRS deteriorate enough to trigger the extra charge. The purpose of the statutory scheme is (a) permission to create new plans outside of OTRS, and (b) a method by which OU and OSU will continue to fund the legacy unfunded debt of OTRS. In the opinion of OTRS staff, its main purpose concerns adequately funding OTRS and has nothing to do with financial reporting. OU and OSU are suggesting that the proportionate amount of their liability under GASB 68 be determined by this statutory methodology established in 2004 rather than the proportionate share of contributions methodology set out in the implementation guide. They suggest that their state statutory calculation be used to reduce the entire Plan’s net pension liability and then the remainder be allocated to other participating employers using whatever method OTRS chooses.
69
The most significant thing in GASB 67 & 68 is the express “divorce” of funding from financial reporting. Previous GASB statements (e.g. 25 & 27) kept these two things in lock step. In the opinion of OTRS staff, OU and OSU’s share of the net pension liability under GASB 67 & 68 must be calculated in the same manner as every other participating employer in OTRS. It will be determined by the employer contribution amounts into OTRS. The OTRS staff view of allocation was shared in writing with OU and OSU on September 11 although we believe our position was communicated to them several weeks before that. OTRS has not yet received a response from the universities. Cole & Reed is the external auditor for OTRS and is currently auditing the OTRS FY 2014 financial statements. They have sent a “technical inquiry” to the GASB asking for specific guidance to see if there is any basis to use the state law calculation to separately allocate OU’s and OSU’s share of the OTRS net pension liability. There is some concern whether this question will be answered before a decision needs to be made on how this is to be allocated. The staff will continue to monitor this.
70
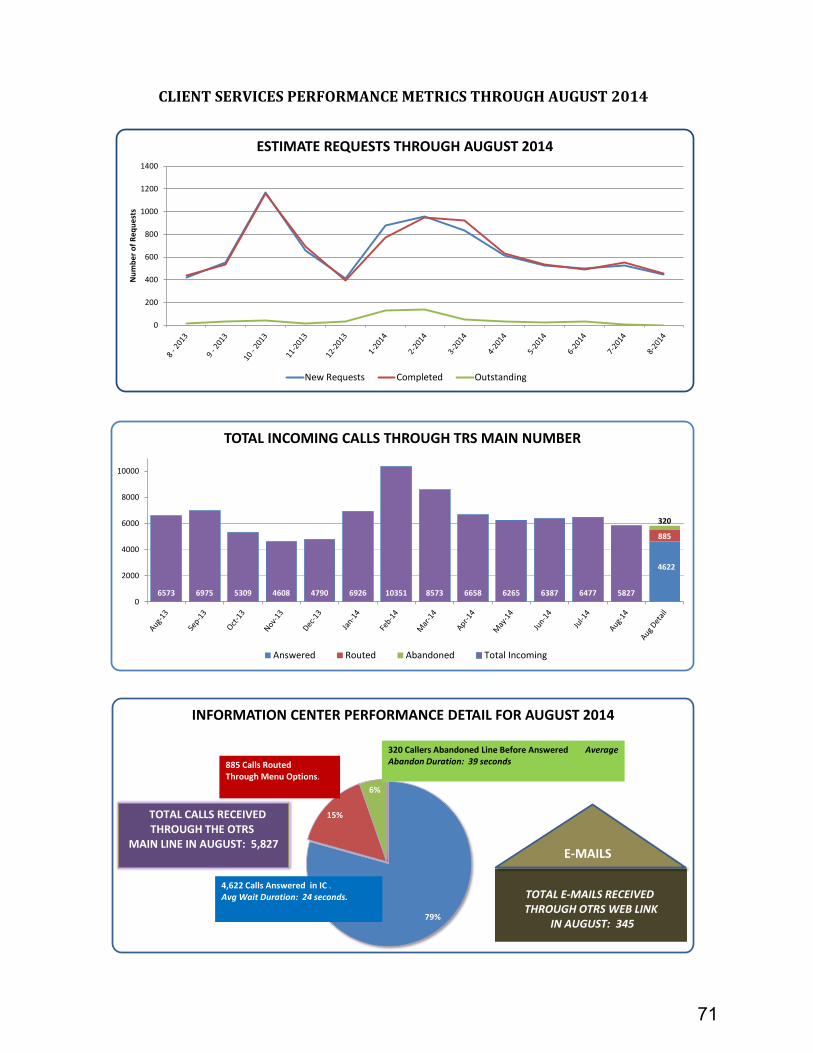
CLIENT SERVICES PERFORMANCE METRICS THROUGH AUGUST 2014
4622
885
320
6573 6975 5309 4608 4790 6926 10351 8573 6658 6265 6387 6477 5827 0
2000
4000
6000
8000
10000
TOTAL INCOMING CALLS THROUGH TRS MAIN NUMBER
Answered Routed Abandoned Total Incoming
0
200
400
600
800
1000
1200
1400
Num
ber o
f Req
uest
s
ESTIMATE REQUESTS THROUGH AUGUST 2014
New Requests Completed Outstanding
79%
15%
6%
INFORMATION CENTER PERFORMANCE DETAIL FOR AUGUST 2014
885 Calls Routed Through Menu Options.
4,622 Calls Answered in IC . Avg Wait Duration: 24 seconds.
320 Callers Abandoned Line Before Answered Average Abandon Duration: 39 seconds
TOTAL CALLS RECEIVED THROUGH THE OTRS
MAIN LINE IN AUGUST: 5,827
TOTAL E-MAILS RECEIVED THROUGH OTRS WEB LINK
IN AUGUST: 345
E-MAILS
71

Count Benefit TotalAverage Benefit
Average Years of Service
Average Age
Disability 5 $4,824.94 $964.99 18.05 53.8Normal 204 $371,789.63 $1,822.50 23.22 62Total 209 $376,614.57 $2,787.49 23.10 61.81
98 ($110,564.99) $1,128.21 22.29 81.33
Monthly Retirement Status ReportSeptember 1, 2014
New Retirements
Terminated Annuities
72
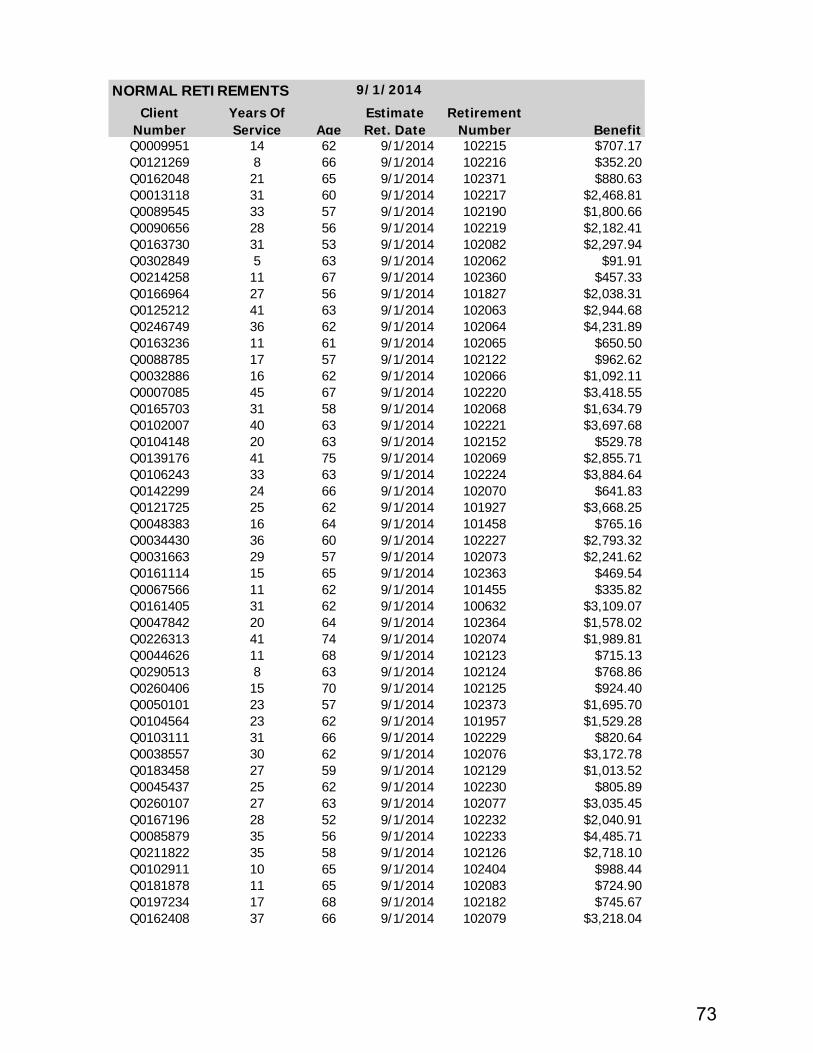
Client Number
Years Of Service Age
Estimate Ret. Date
Retirement Number Benefit
Q0009951 14 62 9/1/2014 102215 $707.17Q0121269 8 66 9/1/2014 102216 $352.20Q0162048 21 65 9/1/2014 102371 $880.63Q0013118 31 60 9/1/2014 102217 $2,468.81Q0089545 33 57 9/1/2014 102190 $1,800.66Q0090656 28 56 9/1/2014 102219 $2,182.41Q0163730 31 53 9/1/2014 102082 $2,297.94Q0302849 5 63 9/1/2014 102062 $91.91Q0214258 11 67 9/1/2014 102360 $457.33Q0166964 27 56 9/1/2014 101827 $2,038.31Q0125212 41 63 9/1/2014 102063 $2,944.68Q0246749 36 62 9/1/2014 102064 $4,231.89Q0163236 11 61 9/1/2014 102065 $650.50Q0088785 17 57 9/1/2014 102122 $962.62Q0032886 16 62 9/1/2014 102066 $1,092.11Q0007085 45 67 9/1/2014 102220 $3,418.55Q0165703 31 58 9/1/2014 102068 $1,634.79Q0102007 40 63 9/1/2014 102221 $3,697.68Q0104148 20 63 9/1/2014 102152 $529.78Q0139176 41 75 9/1/2014 102069 $2,855.71Q0106243 33 63 9/1/2014 102224 $3,884.64Q0142299 24 66 9/1/2014 102070 $641.83Q0121725 25 62 9/1/2014 101927 $3,668.25Q0048383 16 64 9/1/2014 101458 $765.16Q0034430 36 60 9/1/2014 102227 $2,793.32Q0031663 29 57 9/1/2014 102073 $2,241.62Q0161114 15 65 9/1/2014 102363 $469.54Q0067566 11 62 9/1/2014 101455 $335.82Q0161405 31 62 9/1/2014 100632 $3,109.07Q0047842 20 64 9/1/2014 102364 $1,578.02Q0226313 41 74 9/1/2014 102074 $1,989.81Q0044626 11 68 9/1/2014 102123 $715.13Q0290513 8 63 9/1/2014 102124 $768.86Q0260406 15 70 9/1/2014 102125 $924.40Q0050101 23 57 9/1/2014 102373 $1,695.70Q0104564 23 62 9/1/2014 101957 $1,529.28Q0103111 31 66 9/1/2014 102229 $820.64Q0038557 30 62 9/1/2014 102076 $3,172.78Q0183458 27 59 9/1/2014 102129 $1,013.52Q0045437 25 62 9/1/2014 102230 $805.89Q0260107 27 63 9/1/2014 102077 $3,035.45Q0167196 28 52 9/1/2014 102232 $2,040.91Q0085879 35 56 9/1/2014 102233 $4,485.71Q0211822 35 58 9/1/2014 102126 $2,718.10Q0102911 10 65 9/1/2014 102404 $988.44Q0181878 11 65 9/1/2014 102083 $724.90Q0197234 17 68 9/1/2014 102182 $745.67Q0162408 37 66 9/1/2014 102079 $3,218.04
NORMAL RETIREMENTS 9/1/2014
73

Client Number
Years Of Service Age
Estimate Ret. Date
Retirement Number Benefit
NORMAL RETIREMENTS 9/1/2014
Q0302721 6 66 9/1/2014 102380 $137.41Q0104884 10 62 9/1/2014 102381 $397.11Q0121001 25 69 9/1/2014 102383 $1,668.92Q0250777 19 62 9/1/2014 102234 $1,543.73Q0149643 13 61 9/1/2014 102384 $677.03Q0101927 12 68 9/1/2014 102385 $968.65Q0028706 26 62 9/1/2014 102390 $3,539.40Q0201080 21 63 9/1/2014 102391 $1,429.25Q0139296 24 70 9/1/2014 102392 $3,457.93Q0233748 20 62 9/1/2014 102393 $1,371.86Q0257308 30 68 9/1/2014 102153 $2,618.11Q0165631 28 52 9/1/2014 101586 $2,206.20Q0200860 28 64 9/1/2014 102394 $1,695.79Q0201925 12 61 9/1/2014 102395 $515.21Q0286716 7 56 9/1/2014 102370 $139.14Q0024072 19 66 9/1/2014 102396 $824.87Q0070012 19 55 9/1/2014 102130 $535.34Q0200879 36 58 9/1/2014 102235 $2,637.90Q0305514 5 63 9/1/2014 101833 $349.23Q0062879 17 70 9/1/2014 102397 $1,766.41Q0083543 37 66 9/1/2014 102236 $1,496.11Q0090858 28 53 9/1/2014 102409 $2,000.62Q0280365 9 65 9/1/2014 102490 $343.94Q0217714 26 55 9/1/2014 101502 $1,799.11Q0033124 26 54 9/1/2014 102237 $2,478.77Q0047637 22 63 9/1/2014 102405 $1,784.79Q0046620 41 62 9/1/2014 102238 $2,194.35Q0165864 24 56 9/1/2014 099830 $1,655.34Q0203210 12 61 9/1/2014 102402 $220.86Q0047312 14 62 9/1/2014 101976 $1,153.84Q0186215 26 56 9/1/2014 101931 $2,204.84Q0215931 15 65 9/1/2014 102239 $462.62Q0019062 16 69 9/1/2014 102401 $5,912.79Q0015934 17 62 9/1/2014 102240 $1,171.79Q0202288 8 62 9/1/2014 102491 $320.30Q0292143 7 62 9/1/2014 102502 $149.18Q0143301 26 63 9/1/2014 102128 $1,960.83Q0083494 45 66 9/1/2014 102242 $4,642.14Q0088722 35 56 9/1/2014 102014 $2,864.71Q0243674 26 61 9/1/2014 102501 $943.15Q0007198 35 63 9/1/2014 102080 $2,652.70Q0139999 35 69 9/1/2014 102154 $5,357.48Q0049370 14 62 9/1/2014 102493 $1,188.62Q0127840 31 58 9/1/2014 102399 $2,064.24Q0047567 16 64 9/1/2014 102438 $1,249.31Q0050088 33 55 9/1/2014 101597 $3,642.42Q0202839 27 62 9/1/2014 102243 $1,711.49Q0085171 34 67 9/1/2014 102012 $1,392.35
74

Client Number
Years Of Service Age
Estimate Ret. Date
Retirement Number Benefit
NORMAL RETIREMENTS 9/1/2014
Q0038483 14 72 9/1/2014 102258 $620.83Q0109938 29 55 9/1/2014 102081 $2,301.03Q0187132 30 54 9/1/2014 102084 $844.68Q0206797 29 51 9/1/2014 102085 $2,413.13Q0034679 19 55 9/1/2014 102257 $849.04Q0122457 26 65 9/1/2014 102256 $824.39Q0200077 10 69 9/1/2014 102400 $295.43Q0083254 14 67 9/1/2014 102131 $1,107.46Q0145875 16 60 9/1/2014 102495 $644.49Q0125779 26 58 9/1/2014 102133 $2,812.82Q0183224 40 62 9/1/2014 102134 $3,978.76Q0203686 13 61 9/1/2014 102398 $713.35Q0049269 23 60 9/1/2014 102365 $1,883.66Q0130020 28 52 9/1/2014 102136 $2,122.69Q0228534 33 65 9/1/2014 102137 $2,698.38Q0006242 27 67 9/1/2014 102138 $2,839.10Q0023043 27 68 9/1/2014 102139 $2,951.00Q0166012 25 56 9/1/2014 102255 $2,331.74Q0183537 26 60 9/1/2014 102254 $2,286.33Q0162957 13 65 9/1/2014 102140 $583.97Q0122477 39 62 9/1/2014 102377 $5,054.19Q0126572 17 58 9/1/2014 102141 $328.58Q0254622 45 77 9/1/2014 102503 $3,804.22Q0244828 30 62 9/1/2014 102552 $2,113.91Q0202030 12 61 9/1/2014 102498 $268.30Q0068659 25 58 9/1/2014 102142 $2,466.47Q0109517 11 56 9/1/2014 102143 $163.60Q0145329 36 60 9/1/2014 102505 $3,315.48Q0022424 40 69 9/1/2014 102519 $3,931.16Q0014779 12 62 9/1/2014 102042 $908.40Q0181888 29 60 9/1/2014 102253 $2,711.98Q0046295 19 66 9/1/2014 102500 $638.08Q0203241 36 60 9/1/2014 102506 $4,342.95Q0162815 27 62 9/1/2014 102368 $2,141.21Q0018794 19 67 9/1/2014 102252 $1,322.96Q0289189 8 73 9/1/2014 102144 $301.45Q0240228 33 57 9/1/2014 102145 $2,897.82Q0235087 18 58 9/1/2014 102251 $852.96Q0178107 29 71 9/1/2014 102250 $2,731.91Q0081715 8 69 9/1/2014 102146 $495.21Q0202177 36 62 9/1/2014 102147 $3,260.40Q0034441 34 57 9/1/2014 102249 $2,899.01Q0181232 12 61 9/1/2014 102148 $661.64Q0259784 14 58 9/1/2014 102248 $342.66Q0253879 7 62 9/1/2014 101932 $445.58Q0003972 25 60 9/1/2014 102494 $4,429.27Q0222640 21 58 9/1/2014 102156 $667.84Q0051305 31 54 9/1/2014 102247 $4,867.22
75
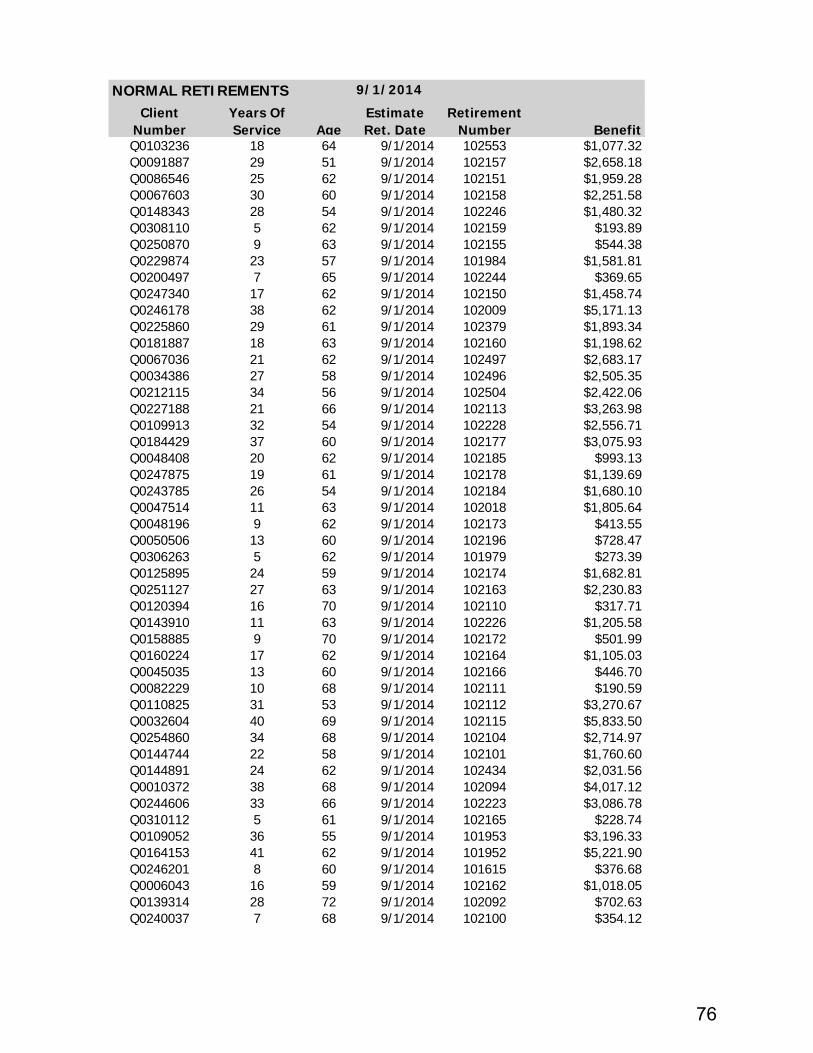
Client Number
Years Of Service Age
Estimate Ret. Date
Retirement Number Benefit
NORMAL RETIREMENTS 9/1/2014
Q0103236 18 64 9/1/2014 102553 $1,077.32Q0091887 29 51 9/1/2014 102157 $2,658.18Q0086546 25 62 9/1/2014 102151 $1,959.28Q0067603 30 60 9/1/2014 102158 $2,251.58Q0148343 28 54 9/1/2014 102246 $1,480.32Q0308110 5 62 9/1/2014 102159 $193.89Q0250870 9 63 9/1/2014 102155 $544.38Q0229874 23 57 9/1/2014 101984 $1,581.81Q0200497 7 65 9/1/2014 102244 $369.65Q0247340 17 62 9/1/2014 102150 $1,458.74Q0246178 38 62 9/1/2014 102009 $5,171.13Q0225860 29 61 9/1/2014 102379 $1,893.34Q0181887 18 63 9/1/2014 102160 $1,198.62Q0067036 21 62 9/1/2014 102497 $2,683.17Q0034386 27 58 9/1/2014 102496 $2,505.35Q0212115 34 56 9/1/2014 102504 $2,422.06Q0227188 21 66 9/1/2014 102113 $3,263.98Q0109913 32 54 9/1/2014 102228 $2,556.71Q0184429 37 60 9/1/2014 102177 $3,075.93Q0048408 20 62 9/1/2014 102185 $993.13Q0247875 19 61 9/1/2014 102178 $1,139.69Q0243785 26 54 9/1/2014 102184 $1,680.10Q0047514 11 63 9/1/2014 102018 $1,805.64Q0048196 9 62 9/1/2014 102173 $413.55Q0050506 13 60 9/1/2014 102196 $728.47Q0306263 5 62 9/1/2014 101979 $273.39Q0125895 24 59 9/1/2014 102174 $1,682.81Q0251127 27 63 9/1/2014 102163 $2,230.83Q0120394 16 70 9/1/2014 102110 $317.71Q0143910 11 63 9/1/2014 102226 $1,205.58Q0158885 9 70 9/1/2014 102172 $501.99Q0160224 17 62 9/1/2014 102164 $1,105.03Q0045035 13 60 9/1/2014 102166 $446.70Q0082229 10 68 9/1/2014 102111 $190.59Q0110825 31 53 9/1/2014 102112 $3,270.67Q0032604 40 69 9/1/2014 102115 $5,833.50Q0254860 34 68 9/1/2014 102104 $2,714.97Q0144744 22 58 9/1/2014 102101 $1,760.60Q0144891 24 62 9/1/2014 102434 $2,031.56Q0010372 38 68 9/1/2014 102094 $4,017.12Q0244606 33 66 9/1/2014 102223 $3,086.78Q0310112 5 61 9/1/2014 102165 $228.74Q0109052 36 55 9/1/2014 101953 $3,196.33Q0164153 41 62 9/1/2014 101952 $5,221.90Q0246201 8 60 9/1/2014 101615 $376.68Q0006043 16 59 9/1/2014 102162 $1,018.05Q0139314 28 72 9/1/2014 102092 $702.63Q0240037 7 68 9/1/2014 102100 $354.12
76
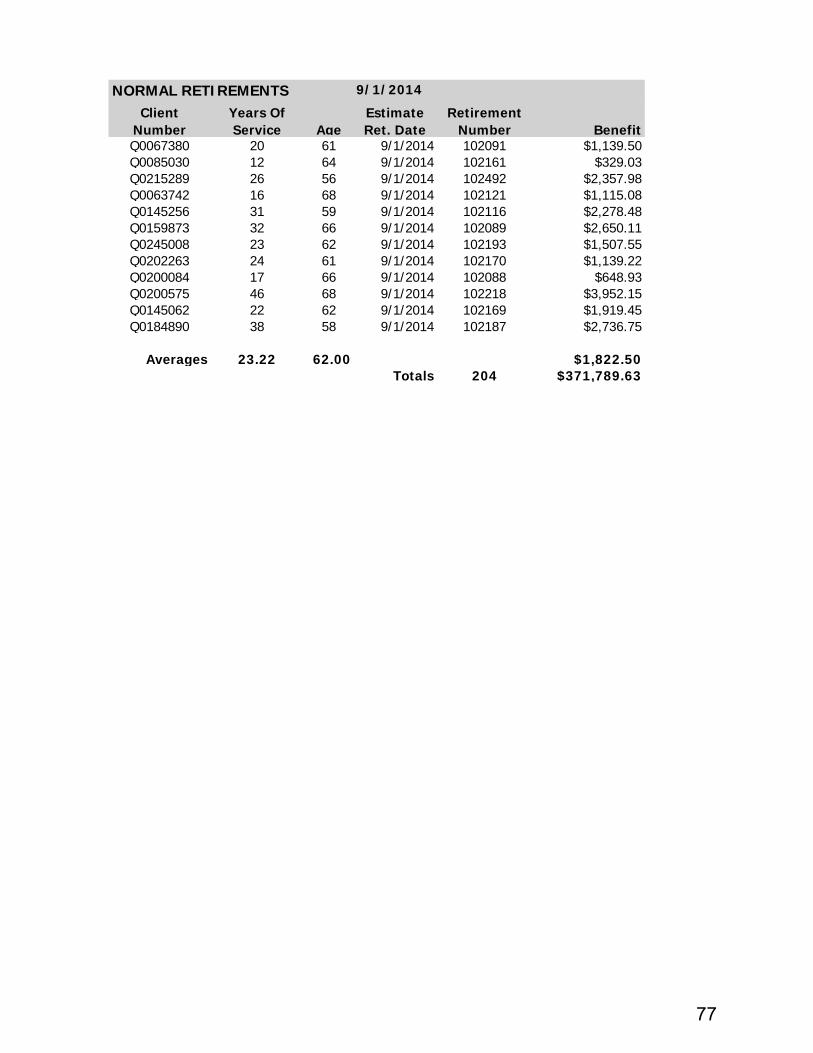
Client Number
Years Of Service Age
Estimate Ret. Date
Retirement Number Benefit
NORMAL RETIREMENTS 9/1/2014
Q0067380 20 61 9/1/2014 102091 $1,139.50Q0085030 12 64 9/1/2014 102161 $329.03Q0215289 26 56 9/1/2014 102492 $2,357.98Q0063742 16 68 9/1/2014 102121 $1,115.08Q0145256 31 59 9/1/2014 102116 $2,278.48Q0159873 32 66 9/1/2014 102089 $2,650.11Q0245008 23 62 9/1/2014 102193 $1,507.55Q0202263 24 61 9/1/2014 102170 $1,139.22Q0200084 17 66 9/1/2014 102088 $648.93Q0200575 46 68 9/1/2014 102218 $3,952.15Q0145062 22 62 9/1/2014 102169 $1,919.45Q0184890 38 58 9/1/2014 102187 $2,736.75
Averages 23.22 62.00 $1,822.50Totals 204 $371,789.63
77
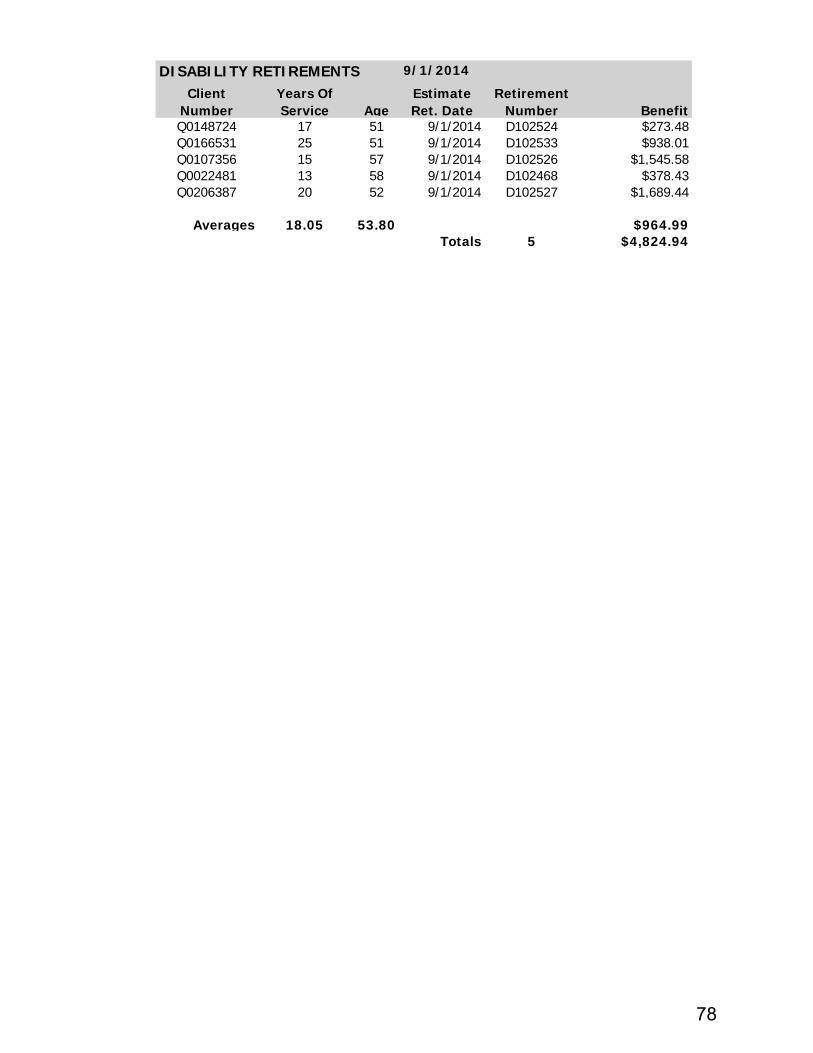
Client Number
Years Of Service Age
Estimate Ret. Date
Retirement Number Benefit
Q0148724 17 51 9/1/2014 D102524 $273.48Q0166531 25 51 9/1/2014 D102533 $938.01Q0107356 15 57 9/1/2014 D102526 $1,545.58Q0022481 13 58 9/1/2014 D102468 $378.43Q0206387 20 52 9/1/2014 D102527 $1,689.44
Averages 18.05 53.80 $964.99Totals 5 $4,824.94
DISABILITY RETIREMENTS 9/1/2014
78
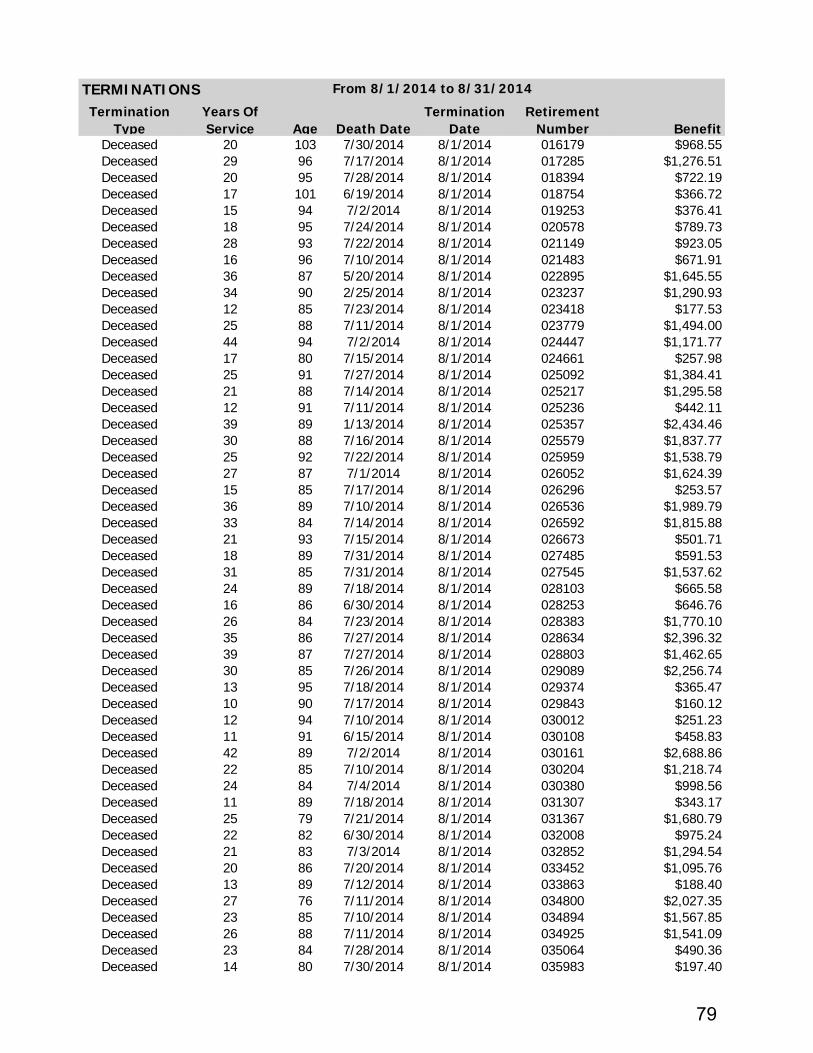
Termination Type
Years Of Service Age Death Date
Termination Date
Retirement Number Benefit
Deceased 20 103 7/30/2014 8/1/2014 016179 $968.55Deceased 29 96 7/17/2014 8/1/2014 017285 $1,276.51Deceased 20 95 7/28/2014 8/1/2014 018394 $722.19Deceased 17 101 6/19/2014 8/1/2014 018754 $366.72Deceased 15 94 7/2/2014 8/1/2014 019253 $376.41Deceased 18 95 7/24/2014 8/1/2014 020578 $789.73Deceased 28 93 7/22/2014 8/1/2014 021149 $923.05Deceased 16 96 7/10/2014 8/1/2014 021483 $671.91Deceased 36 87 5/20/2014 8/1/2014 022895 $1,645.55Deceased 34 90 2/25/2014 8/1/2014 023237 $1,290.93Deceased 12 85 7/23/2014 8/1/2014 023418 $177.53Deceased 25 88 7/11/2014 8/1/2014 023779 $1,494.00Deceased 44 94 7/2/2014 8/1/2014 024447 $1,171.77Deceased 17 80 7/15/2014 8/1/2014 024661 $257.98Deceased 25 91 7/27/2014 8/1/2014 025092 $1,384.41Deceased 21 88 7/14/2014 8/1/2014 025217 $1,295.58Deceased 12 91 7/11/2014 8/1/2014 025236 $442.11Deceased 39 89 1/13/2014 8/1/2014 025357 $2,434.46Deceased 30 88 7/16/2014 8/1/2014 025579 $1,837.77Deceased 25 92 7/22/2014 8/1/2014 025959 $1,538.79Deceased 27 87 7/1/2014 8/1/2014 026052 $1,624.39Deceased 15 85 7/17/2014 8/1/2014 026296 $253.57Deceased 36 89 7/10/2014 8/1/2014 026536 $1,989.79Deceased 33 84 7/14/2014 8/1/2014 026592 $1,815.88Deceased 21 93 7/15/2014 8/1/2014 026673 $501.71Deceased 18 89 7/31/2014 8/1/2014 027485 $591.53Deceased 31 85 7/31/2014 8/1/2014 027545 $1,537.62Deceased 24 89 7/18/2014 8/1/2014 028103 $665.58Deceased 16 86 6/30/2014 8/1/2014 028253 $646.76Deceased 26 84 7/23/2014 8/1/2014 028383 $1,770.10Deceased 35 86 7/27/2014 8/1/2014 028634 $2,396.32Deceased 39 87 7/27/2014 8/1/2014 028803 $1,462.65Deceased 30 85 7/26/2014 8/1/2014 029089 $2,256.74Deceased 13 95 7/18/2014 8/1/2014 029374 $365.47Deceased 10 90 7/17/2014 8/1/2014 029843 $160.12Deceased 12 94 7/10/2014 8/1/2014 030012 $251.23Deceased 11 91 6/15/2014 8/1/2014 030108 $458.83Deceased 42 89 7/2/2014 8/1/2014 030161 $2,688.86Deceased 22 85 7/10/2014 8/1/2014 030204 $1,218.74Deceased 24 84 7/4/2014 8/1/2014 030380 $998.56Deceased 11 89 7/18/2014 8/1/2014 031307 $343.17Deceased 25 79 7/21/2014 8/1/2014 031367 $1,680.79Deceased 22 82 6/30/2014 8/1/2014 032008 $975.24Deceased 21 83 7/3/2014 8/1/2014 032852 $1,294.54Deceased 20 86 7/20/2014 8/1/2014 033452 $1,095.76Deceased 13 89 7/12/2014 8/1/2014 033863 $188.40Deceased 27 76 7/11/2014 8/1/2014 034800 $2,027.35Deceased 23 85 7/10/2014 8/1/2014 034894 $1,567.85Deceased 26 88 7/11/2014 8/1/2014 034925 $1,541.09Deceased 23 84 7/28/2014 8/1/2014 035064 $490.36Deceased 14 80 7/30/2014 8/1/2014 035983 $197.40
TERMINATIONS From 8/1/2014 to 8/31/2014
79

Termination Type
Years Of Service Age Death Date
Termination Date
Retirement Number Benefit
TERMINATIONS From 8/1/2014 to 8/31/2014
Deceased 28 86 7/24/2014 8/1/2014 036051 $1,005.47Deceased 38 82 7/31/2014 8/1/2014 036544 $2,839.03Deceased 23 80 7/23/2014 8/1/2014 036560 $1,432.98Deceased 27 75 7/3/2014 8/1/2014 036612 $1,547.11Deceased 26 74 7/22/2014 8/1/2014 040035 $722.65Deceased 23 77 7/6/2014 8/1/2014 040634 $1,146.64Deceased 26 80 7/4/2014 8/1/2014 041011 $1,179.04Deceased 25 74 7/12/2014 8/1/2014 041203 $1,336.39Deceased 13 79 4/28/2014 8/1/2014 041388 $863.02Deceased 22 80 7/28/2014 8/1/2014 041699 $1,434.92Deceased 22 92 7/25/2014 8/1/2014 041884 $451.96Deceased 19 84 7/15/2014 8/1/2014 042568 $329.47Deceased 11 81 7/11/2014 8/1/2014 043048 $368.88Deceased 33 76 7/20/2014 8/1/2014 043167 $2,616.40Deceased 26 79 7/25/2014 8/1/2014 048628 $1,634.65Deceased 20 88 7/7/2014 8/1/2014 049306 $1,026.51Deceased 18 86 7/24/2014 8/1/2014 051057 $476.03Deceased 17 75 7/29/2014 8/1/2014 051423 $278.70Deceased 34 69 7/27/2014 8/1/2014 052211 $2,439.82Deceased 24 70 7/12/2014 8/1/2014 053564 $788.03Deceased 23 93 7/19/2014 8/1/2014 054532 $809.50Deceased 16 74 7/29/2014 8/1/2014 055472 $1,180.42Deceased 26 67 7/30/2014 8/1/2014 057498 $1,359.02Deceased 19 65 6/19/2014 8/1/2014 058393 $230.93Deceased 5 74 7/29/2014 8/1/2014 060264 $185.88Deceased 13 74 7/10/2014 8/1/2014 060795 $421.32Deceased 25 79 7/10/2014 8/1/2014 061843 $1,552.31Deceased 11 70 7/17/2014 8/1/2014 072204 $754.89Deceased 27 76 7/16/2014 8/1/2014 072498 $1,282.51Deceased 19 67 7/22/2014 8/1/2014 072634 $888.19Deceased 22 71 7/23/2014 8/1/2014 074646 $3,205.40Deceased 23 62 4/23/2014 8/1/2014 075509 $1,742.26Deceased 20 64 7/3/2014 8/1/2014 075684 $845.83Deceased 12 65 5/31/2014 8/1/2014 075827 $652.67Deceased 34 61 6/19/2014 8/1/2014 076702 $2,745.39Deceased 25 66 7/8/2014 8/1/2014 077407 $738.17Deceased 37 65 7/9/2014 8/1/2014 077501 $3,147.21Deceased 22 61 7/18/2014 8/1/2014 078668 $1,225.16Deceased 24 67 5/11/2014 8/1/2014 097792 $2,206.51Deceased 10 90 7/7/2014 8/1/2014 098622 $254.62Deceased 21 63 7/19/2014 8/1/2014 099176 $1,419.37Deceased 14 62 7/17/2014 8/1/2014 100058 $360.98Deceased 6 65 1/14/2014 8/1/2014 101614 $363.22Deceased 14 60 4/12/2014 8/1/2014 102117 $623.36Deceased 15 78 7/29/2014 8/1/2014 D01021 $865.74Deceased 19 68 7/9/2014 8/1/2014 D01354 $1,007.77Deceased 14 62 7/15/2014 8/1/2014 D03079 $456.31
Averages 22.29 81.33 $1,128.21Totals 98 $110,564.99
80

HR STATUS REPORT
09/24/2014
HR STATUS REPORT
• New Hires (August 2014):
Employee: 291235 Title: Retirement Planning Consultant (information center) Salary: $36,276 Effective: 08/04/2014
• Resignations/Terminations/Retirements (August 2014):
n/a
• Promotion (August 2014):
Employee: 284348 Title From: Retirement Planning Consultant (information center) Title To: Business Analyst (employer reporting / finance & accounting) Salary From: $36,276 Salary To: $39,102 Effective: 08/18/2014
MISCELLANEOUS PAYMENTS
• Educational Loan Reimbursement Program as provided by 74 O.S. 1731-1734.
Employee: 172671 Loan Reimbursement: $3,579.41 Processed: 09/03/2014
Employee: 215671 Loan Reimbursement: $5,000.00 Processed: 09/03/2014
HB 1114 was enacted in 2007 to provide financial assistance for repayment of educational loans and TRS has participated in this program since 2010. Stipulations of the policy are:
1) The education loan must have been incurred (a) prior to employment with TRS or (b) after employment with TRS so long as it is directly related to employment and repayment is legally required over a period of more than one year.
2) Full time employees with at least one year of service with the agency are eligible to participate.
3) Payments will be made directly to the lending institution; no payments are made to the employee.
4) The agency will make direct payment not to exceed $5,000 in any 12-month period and the cumulative total reimbursement cannot exceed $15,000 for any single employee.
5) Loan reimbursement is subject to state and federal income taxes.
6) Applications may be approved or denied contingent upon available funding.
NEW HIRES, RESIGNATIONS OR RETIREMENTS PENDING
• Retirement Planning Consultant (audit) – internal applicant – eff. 09/29/2014 (Oct 2014 report)
81

Employer Reporting
Analysis of Employee and Employer Contributions Received
Comparison of Contributions Received
For One Month Ended July 31, 2013 and July 31, 2014
14
0 0 0 0 0 0 0 0 0 0 0
14
0
2
4
6
8
10
12
14
16
July
2014
Aug
2014
Sept
2014
Oct
2014
Nov
2014
Dec
2014
Jan
2015
Feb
2015
Mar
2015
Apr
2015
May
2015
June
2015
Grand
Total
Estimated Number of Delinquent Reports FY15
$994,271.63
$0.00
$0.00
$0.00
$0.00
$0.00
$0.00
$0.00
$0.00
$0.00
$0.00
$0.00
$994,271.63
$0
$200,000
$400,000
$600,000
$800,000
$1,000,000
$1,200,000
July
2014
Aug
2014
Sept
2014
Oct
2014
Nov
2014
Dec
2014
Jan
2015
Feb
2015
Mar
2015
Apr
2015
May
2015
June
2015
Grand
Total
Estimated Delinquent Funds FY15
$51,343,451.57
$0.00
$0.00
$0.00
$0.00
$0.00
$0.00
$0.00
$0.00
$0.00
$0.00
$0.00
$51,343,451.57
$56,227,948.66
$56,227,948.66
$0
$10,000,000
$20,000,000
$30,000,000
$40,000,000
$50,000,000
$60,000,000
July
2014
Aug
2014
Sept
2014
Oct
2014
Nov
2014
Dec
2014
Jan
2015
Feb
2015
Mar
2015
Apr
2015
May
2015
June
2015
Grand
Total
FY2014 FY2015
82

CURRENT ASSETS:Cash Not Available For Investment $12,191,071.54Equities (At Market Value) 10,969,600,768.85Fixed Income (At Market Value) 2,881,709,887.21Short-Term Investment Account 373,926,416.38Due From/(To) Broker (119,639,220.06)Accounts Receivable Installment Payments 1,237,028.93Prepaid Retirement Benefits 76,681,138.43Accrued Income 50,165,950.63
Total Current Assets 14,245,873,041.91
CAPITAL ASSETS:
Office Furniture and Equipment 3,098,149.51Accumulated Depreciation (249,578.54)
TOTAL ASSETS $14,248,721,612.88
CURRENT LIABILITIES:Teachers' Savings Fund $4,332,708,520.07Retirement Benefit Fund 9,678,670,662.58Interest Fund 122,199,314.66Expense Fund 75,590,338.81Suspense Fund 36,244,929.53
Total Current Liabilities 14,245,413,765.65
TRS Capital Investment 3,307,847.23
TOTAL LIABILITIES AND CAPITAL INVESTMENT $14,248,721,612.88
BALANCE SHEET AUGUST 31, 2014
83

Year to Date Year to Date % Change
(FY 2015) (FY 2014)Balance of Cash and Investments
Net Position, Beginning of Year $14,201,669,559.43 $11,817,761,245.40
RECEIPTS:Members' Deposits 37,845,749.48 32,824,463.11 15.30%Employer Contributions 55,432,823.49 47,761,333.97 16.06%State Credits 5,878,053.00 5,885,230.00 -0.12%Reimbursed Administrative 210.00 81,503.71 -99.74%Matching Funds from Schools 3,359,008.29 3,305,492.89 1.62%Lottery Revenue 630,865.00 718,703.00 -12.22%Cigarette Sales Tax Revenue 272,417.03 277,557.68 -1.85%Dedicated Revenue 55,205,385.23 50,569,677.53 9.17%
Total Retirement Receipts 158,624,511.52 141,423,961.89 12.16%
Interest Income (Fixed Income and Short-Term) 21,172,726.59 20,898,611.01 1.31%Dividend Income 40,336,231.41 35,327,628.38 14.18%Net Realized Gain/(Loss) 139,324,963.50 140,589,802.57 -0.90%Net Unrealized Gain/(Loss) (80,106,772.16) 93,223,895.71 -185.93%Investment Operations Income:
Class Action Lawsuit Proceeds 0.00 0.00 0.00%Other Income 43,505.25 17,684.00 146.01%Securities Lending Income 1,428,660.07 1,432,274.60 -0.25%
Total Investment Income 122,199,314.66 291,489,896.27 -58.08%
TOTAL RECEIPTS 280,823,826.18 432,913,858.16 -35.13%
DISBURSEMENTS:Retirement Benefits 201,835,075.04 195,213,857.50 3.39%Insurance Premiums Paid for Retirees 5,013,141.00 4,947,262.00 1.33%Death Benefits 3,948,103.48 3,068,985.25 28.65%Withdrawals of Accounts 4,838,426.99 4,802,368.83 0.75%
Total Benefit Payments 215,634,746.51 208,032,473.58 3.65%
Administrative Expense:General Operations 861,377.43 862,612.47 -0.14%Investment Expense 13,182,963.30 9,375,540.49 40.61%
Total Administrative Expenses 14,044,340.73 10,238,152.96 37.18%
TOTAL DISBURSEMENTS 229,679,087.24 218,270,626.54 5.23%
NET INCREASE/(NET DECREASE) 51,144,738.94 214,643,231.62 -76.17%
Balance of Cash and Investments, August 31 $14,252,814,298.37 $12,032,404,477.02
STATEMENT OF REVENUES, EXPENDITURES AND CHANGESFOR THE TWO MONTHS ENDED AUGUST 31
84

FY-2014 YTD FY-2015 YTD Actual Actual Increase Increase
Expenditures Expenditures (Decrease) (Decrease)Object of Expenditure 8/31/2014 8/31/2015 Amount Percentage
Personal ServicesSalary and Longevity Pay Expenses 337,721 269,095 (68,626) -20.3%Taxes, Benefits, and Other Expenses 147,596 137,787 (9,808) -6.6%
Subtotal Personal Services 485,316 406,882 (78,434) -16.2%Professional Services
Investment Manager Expenses 150,189 0 (150,189) -100.0%Investment Consultant Expenses 117,000 58,500 (58,500) -50.0%Investment Custodian Expenses 0 0 0 0.0%Pension Commission Expenses 0 0 0 0.0%
Subtotal Investment Expenses 267,189 58,500 (208,689) -78.1%Legal Services - Special Projects 0 0 0 0.0%Legal Services - Attorney General 10,164 0 (10,164) -100.0%Administrative Hearings 0 0 0 0.0%Auditing Services 5,592 1,404 (4,188) -74.9%Actuarial Services 0 0 0 0.0%Medical Hearings 1,200 1,500 300 25.0%Management Consultant 5,333 0 (5,333) -100.0%Marketing Consultant 3,694 0 (3,694) -100.0%Miscellaneous Services 584 532 (52) -8.9%
Subtotal Professional Services 26,568 3,436 (23,132) -87.1%Total Professional Services 293,757 61,936 (231,821) -78.9%
Travel and Per Diem ExpensesNon-Employee Travel Expenses 5,093 6,279 1,186 23.3%Employee Training 350 1,410 1,060 302.9%Employee Travel Expenses 2,276 81 (2,195) -96.5%
Subtotal Travel and Per Diem Expenses 7,719 7,770 51 0.7%Administrative Expenses
Postage 3,827 78,750 74,923 1957.9%Telecommunications Services 1,292 433 (859) -66.5%Printing and Binding Contracts 199 127 (72) -36.1%Informational Services 6,281 6,264 (17) -0.3%Rent and Maintenance 33,129 26,391 (6,739) -20.3%Office Supplies 3,036 1,354 (1,682) -55.4%Buildings and Other Structures Construction and Renovation 0 0 0 0.0%Miscellaneous Administrative Expenses 3,043 1,318 (1,725) -56.7%
Subtotal Administrative Expenses 50,807 114,636 63,830 125.6%Data Processing Expenses
Professional Services 96,788 66,900 (29,888) -30.9%Rent and Maintenance 0 0 0 0.0%Office Supplies 0 0 0 0.0%Equipment -Telecommunications 0 0 0 0.0%
Subtotal Data Processing Expenses 96,788 66,900 (29,888) 0.0%
Total Expenses 934,387 658,124 (276,263) -29.6%Total Investment Expenses Only 267,189 58,500 (208,689) -78.1%Total Data Processing Expenses Only 96,788 66,900 (29,888) 0.0%Total except Investment & Data Processing Expenses 570,409 532,724 (37,686) -6.6%
Wednesday, September 24, 2014
SCHEDULE IComparison of Actual Expenditures Fiscal Year 2014 and Fiscal Year 2015
2 Month Year to Date Comparison
85

2 Month 2 Month Over Over
FY-2015 YTD FY-2015 YTD (Under) (Under)Object of Expenditure Budget Actual Amount Percentage
Personal ServicesSalary and Longevity Pay Expenses 404,312 269,095 (135,217) -33.4%Taxes, Benefits, and Other Expenses 215,694 137,787 (77,907) -36.1%
Subtotal Personal Services 620,006 406,882 (213,124) -34.4%Professional Services
Investment Manager Expenses 0 0 0 0.0%Investment Consultant Expenses 117,000 58,500 (58,500) -50.0%Investment Custodian Expenses 0 0 0 0.0%Pension Commission Expenses 0 0 0 0.0%
Subtotal Investment Expenses 117,000 58,500 (58,500) -50.0%Legal Services - Special Projects 1,400 0 (1,400) -100.0%Legal Services - Attorney General 1,250 0 (1,250) -100.0%Administrative Hearings 830 0 (830) -100.0%Auditing Services 43,000 1,404 (41,596) -96.7%Actuarial Services 0 0 0 0.0%Medical Hearings 2,570 1,500 (1,070) -41.6%Management Consultant 0 0 0 0.0%Marketing Consultant 0 0 0 0.0%Miscellaneous Services 9,816 532 (9,284) -94.6%
Subtotal Professional Services 58,866 3,436 (55,430) -94.2%Total Professional Services 175,866 61,936 (113,930) -64.8%
Travel and Per Diem ExpensesNon-Employee Travel Expenses 8,600 6,279 (2,321) -27.0%Employee Training 4,330 1,410 (2,920) -67.4%Employee Travel Expenses 13,146 81 (13,065) -99.4%
Subtotal Travel and Per Diem Expenses 26,076 7,770 (18,306) -70.2%Administrative Expenses
Postage 42,500 78,750 36,250 85.3%Telecommunications Services 6,666 433 (6,233) -93.5%Printing and Binding Contracts 21,958 127 (21,831) -99.4%Informational Services 6,213 6,264 51 0.8%Rent and Maintenance 38,562 26,391 (12,171) -31.6%Office Supplies 7,749 1,354 (6,395) -82.5%Equipment 5,585 0 (5,585) -100.0%Buildings-Purch, Construction Repairs 0 0 0 0.0%Miscellaneous Administrative Expenses 8,939 1,318 (7,621) -85.3%
Subtotal Administrative Expenses 138,172 114,637 (23,535) -17.0%Data Processing Expenses
Professional Services 163,410 66,900 (96,510) -59.1%Travel and Per Diem Expenses 0 0 0 0.0%Rent and Maintenance 750 0 (750) -100.0%Office Supplies 416 0 (416) -100.0%Equipment - Telecommunications 3,000 0 (3,000) -100.0%Miscellaneous Administrative Expenses 0 0 0 0.0%
Subtotal Data Processing Expenses 167,576 66,900 (100,676) -60.1%
Total Expenses 1,127,696 658,125 (469,571) -41.6%Total Investment Expenses Only 117,000 58,500 (58,500) -50.0%Total Data Processing Expenses Only 167,576 66,900 (100,676) -60.1%Total except Investment and Data Processing Expenses 843,120 532,725 (310,395) -36.8%
Wednesday, September 24, 2014
SCHEDULE IIComparison of FY2015 Budget to Actual Expenses
2 Months ended August 31, 2014 Year to Date Comparison
86
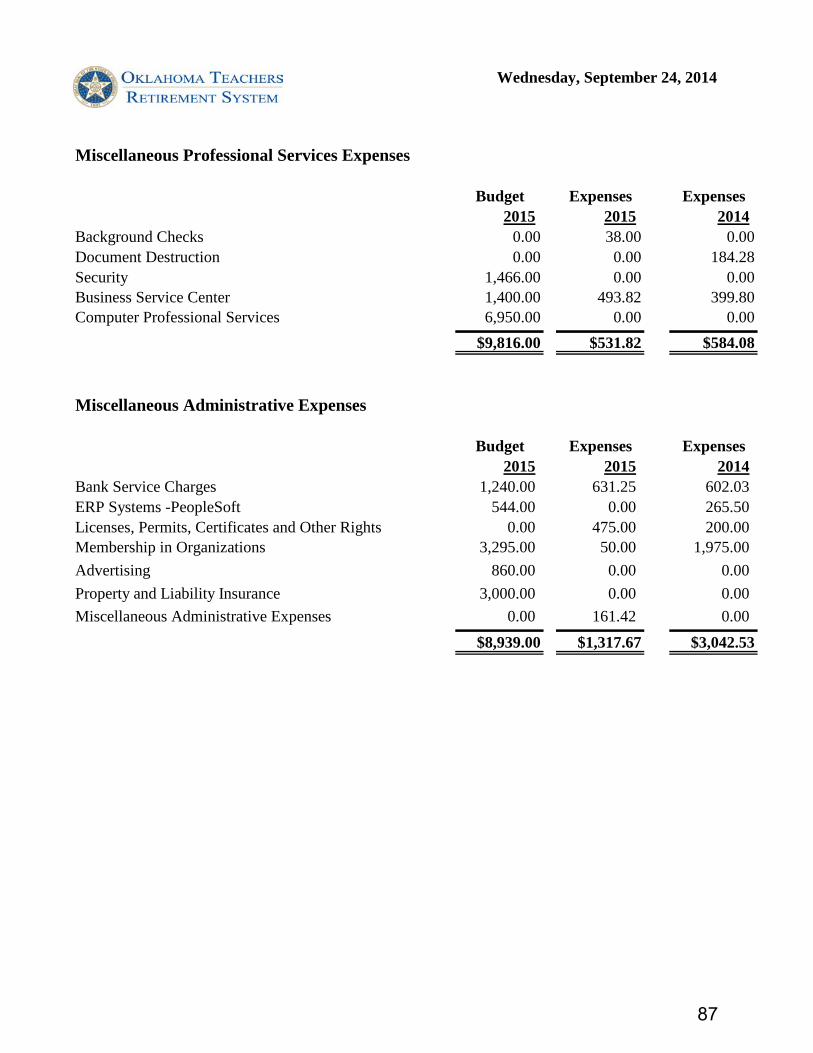
Miscellaneous Professional Services Expenses
Budget Expenses Expenses2015 2015 2014
Background Checks 0.00 38.00 0.00Document Destruction 0.00 0.00 184.28Security 1,466.00 0.00 0.00Business Service Center 1,400.00 493.82 399.80Computer Professional Services 6,950.00 0.00 0.00
$9,816.00 $531.82 $584.08
Miscellaneous Administrative Expenses
Budget Expenses Expenses2015 2015 2014
Bank Service Charges 1,240.00 631.25 602.03ERP Systems -PeopleSoft 544.00 0.00 265.50Licenses, Permits, Certificates and Other Rights 0.00 475.00 200.00Membership in Organizations 3,295.00 50.00 1,975.00Advertising 860.00 0.00 0.00Property and Liability Insurance 3,000.00 0.00 0.00Miscellaneous Administrative Expenses 0.00 161.42 0.00
$8,939.00 $1,317.67 $3,042.53
Wednesday, September 24, 2014
87

Expenses of Board
Trustee NY due diligence, travel and meal 1,124.70$ Trustee NY due diligence, travel and meal 1,124.70 Trustee NY due diligence, travel and meal 1,124.70 Trustee NY due diligence, travel and meal 1,124.70 Trustee NCTR conference 1,000.00
5,498.80$
Travel of Employees
Comptroller Public Pension Financial Forum 475.00$ Director of Client Services Seminar site visit 80.64
555.64$
Communications
Ala Carte Courier Services Courier service 101.70$ AT&T Wireless, OneNet charges 433.08 Cox Communications Cable charges 43.40 FedEx Freight 8.83 JP Morgan Chase Bank, NA Account analysis - July 631.25 Office of Management and Enterprise Services Telecommunications, transaction fees 265.50 Oakstone Publishing Subscription 220.32 Thomson West TCD Informational service 39.00
1,743.08$
RECEIPTS AND CLAIMS FOR AUTHORIZED EXPENDITURESAUGUST 31, 2014
88
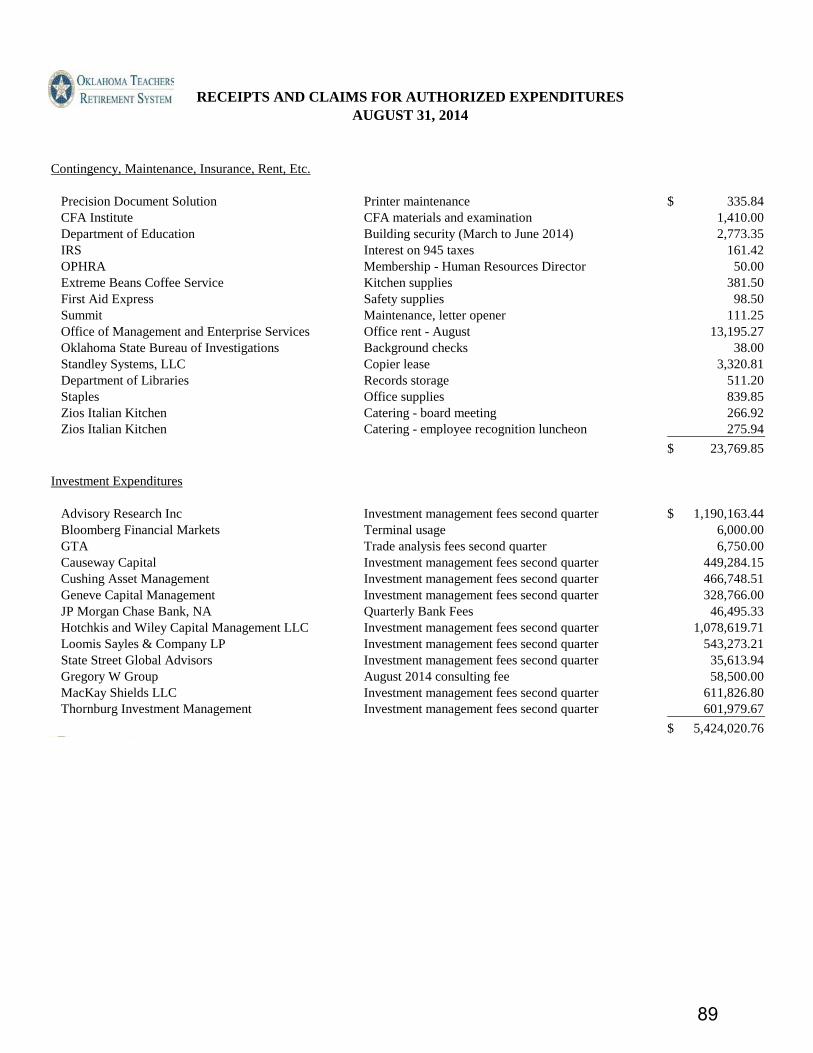
Contingency, Maintenance, Insurance, Rent, Etc.
Precision Document Solution Printer maintenance 335.84$ CFA Institute CFA materials and examination 1,410.00 Department of Education Building security (March to June 2014) 2,773.35 IRS Interest on 945 taxes 161.42 OPHRA Membership - Human Resources Director 50.00 Extreme Beans Coffee Service Kitchen supplies 381.50 First Aid Express Safety supplies 98.50 Summit Maintenance, letter opener 111.25 Office of Management and Enterprise Services Office rent - August 13,195.27 Oklahoma State Bureau of Investigations Background checks 38.00
Standley Systems, LLC Copier lease 3,320.81 Department of Libraries Records storage 511.20 Staples Office supplies 839.85 Zios Italian Kitchen Catering - board meeting 266.92 Zios Italian Kitchen Catering - employee recognition luncheon 275.94
23,769.85$
Investment Expenditures
Advisory Research Inc Investment management fees second quarter 1,190,163.44$ Bloomberg Financial Markets Terminal usage 6,000.00 GTA Trade analysis fees second quarter 6,750.00 Causeway Capital Investment management fees second quarter 449,284.15 Cushing Asset Management Investment management fees second quarter 466,748.51 Geneve Capital Management Investment management fees second quarter 328,766.00 JP Morgan Chase Bank, NA Quarterly Bank Fees 46,495.33 Hotchkis and Wiley Capital Management LLC Investment management fees second quarter 1,078,619.71 Loomis Sayles & Company LP Investment management fees second quarter 543,273.21 State Street Global Advisors Investment management fees second quarter 35,613.94 Gregory W Group August 2014 consulting fee 58,500.00 MacKay Shields LLC Investment management fees second quarter 611,826.80 Thornburg Investment Management Investment management fees second quarter 601,979.67
5,424,020.76$
RECEIPTS AND CLAIMS FOR AUTHORIZED EXPENDITURESAUGUST 31, 2014
89

Professional Services, Workers Comp Insurance
State Auditor and Inspector Pension Commission support 20,108.75$ Payton Osborne MD August 2014 medical board 300.00 George R Jay MD August 2014 medical board 300.00 MY Consulting Inc ALICE development 66,900.00 Office of Management and Enterprise Services Interagency mail/postage 4,269.36 Office of Management and Enterprise Services Server support, disk storage & network support 4,822.88 Stinnett & Associates LLC Audit Fees - July 1,404.00 United States Postal Service Deposit bulk mail 75,000.00 The Meadows Document destruction 180.00
173,284.99$
Salaries and Fringe Benefits
Salaries Administrative department 16,666.67$ Salaries Finance/Accounting department 28,911.01 Salaries Client Services department 76,366.67 Salaries Investment department 4,666.67 Termination Payroll Client Services department 706.86 Longevity Payroll 3,300.00 Excess Benefit Allowance 3,555.85 FICA/MQFE Social Security and Medicare 10,229.85 Oklahoma State Deferred Savings Incentive Plan Savings incentive plan and administrative fee 796.50 Oklahoma Group Insurance Employee health, dental life 28,401.14 Teachers' Retirement System of Oklahoma Employees retirement contributions 28,851.77 Unemployment compensation Unemployment for Agency payroll 167.88
202,620.87$
Grand Total 5,831,493.99$
RECEIPTS AND CLAIMS FOR AUTHORIZED EXPENDITURESAUGUST 31, 2014
90