teachers in england’s - gov.uk · teachers and percentage of teachers reporting induction in...
TRANSCRIPT

Teachers in England’s Secondary Schools: Evidence from TALIS 2013 Research report
June 2014
J. Micklewright, J. Jerrim, A. Vignoles,
A. Jenkins, R. Allen, S. Ilie, E. Bellarbre,
F. Barrera & C. Hein - Institute of Education,
University of London

2
Contents
Contents 2
List of figures 5
List of tables 11
Acknowledgements 14
Executive summary 15
Chapter 1 Introduction 21
1.1 What is the policy background for TALIS in England? 22
1.2 What is the existing evidence for England? 23
1.3 What data were collected for England by TALIS in 2013? 25
1.4 What can TALIS tell us – and what can it not tell us? 28
1.5 Which countries should we compare England with? 29
1.6 What does the report cover? 31
Chapter 2 Lower secondary teachers and their schools 35
2.1 Who are the teachers and headteachers in TALIS schools? 36
2.2 How great is school autonomy? 40
2.3 How well are schools staffed? 42
2.4 What are teachers’ hours of work? 47
2.5 Summary 51
Chapter 3 School leadership and headteachers’ management styles 53
3.1 What are the qualifications of headteachers? 55
3.2 What are the leadership styles of headteachers? 58
3.3 How do school heads spend their working time? 66
3.4 What issues do heads view as barriers to their effectiveness? 68
3.5 How satisfied are headteachers with their jobs? 70

3
3.6 Summary 74
Chapter 4 Professional development 76
4.1 Are induction and mentoring programmes universal? 77
4.2 How much (and what) CPD is undertaken by teachers? 81
4.3 Is the CPD undertaken seen by teachers as effective? 82
4.4 Do teachers perceive much need for more CPD? 86
4.5 What are seen as the barriers to more training? 88
4.6 Summary 91
Chapter 5 Appraisal and feedback 92
5.1 Who provides feedback to teachers and on what basis? 94
5.2 What positive impacts come from feedback? 96
5.3 How often does formal appraisal take place? 100
5.4 What outcomes do headteachers see from appraisal? 102
5.5 What are teachers’ views of appraisal and feedback? 105
5.6 Summary 109
Chapter 6 Teachers’ views of their jobs 111
6.1 Do teachers believe that their pay is fair? 112
6.2 Are teachers satisfied with their working conditions? 118
6.3 Do teachers believe their profession is valued in society? 123
6.4 Are teachers happy in their jobs? 129
6.5 Summary 135
Chapter 7 Teaching practices 136
7.1 How much class time do teachers spend teaching? 138
7.2 Is thinking seen as more important than the curriculum? 143
7.3 How common are small group work and ‘differentiation’? 147
7.4 What methods do teachers use to assess learning? 151
4
7.5 Summary 154
Chapter 8 School and classroom disciplinary environment 155
8.1 Is there a favourable disciplinary climate in schools? 156
8.2 Is there much noise and disruption in classrooms? 162
8.3 Do school-level factors explain the variation in classroom climate? 166
8.4 What is the relationship between classroom climate and the type of class? 168
8.5 Are characteristics of the teacher associated with classroom climate? 170
8.6 Summary 171
Chapter 9 Teachers’ self-efficacy 173
9.1 How confident are teachers about their abilities? 175
9.2 Is self-efficacy related to experience and other teacher characteristics? 179
9.3 Can school-level factors account for variations in self-efficacy? 181
9.4 Is self-efficacy affected by the feedback teachers receive? 182
9.5 How do working relationships with colleagues affect self-efficacy? 185
9.6 Is self-efficacy correlated with the quality of teacher-student relations? 186
9.7 Summary 190
References 191
Appendix A TALIS 2013 in England: administration, sampling and response 196
Appendix B Allowing for sampling error in TALIS 202
Appendix C High and low performing countries 204
5
List of figures
Figure 2.1 Percentage of teachers and headteachers who are women: international
comparison 37
Figure 2.2 Average number of teachers and average number of pupils per school:
international comparison 43
Figure 2.3 Ratio of average number of (i) teachers to teaching assistants and (ii) teachers
to administrative and management staff: international comparison 45
Figure 2.4 Percentage of lower secondary teachers working in schools where the
headteacher considers that quality of instruction is hindered by (i) shortages of teachers
and (ii) shortages of support personnel: international comparison 46
Figure 2.5 Average percentage of pupils achieving 5+ GCSEs A*-C (incl. English and
maths), by headteacher’s view of whether shortages of teachers hinder quality of
instruction 47
Figure 2.6 Teachers’ average total weekly hours of work and total teaching hours:
international comparison 49
Figure 2.7 Average total weekly hours of work for men and women, by children in the
home 51
Figure 3.1 Index of distributed leadership, by school type (average values) 60
Figure 3.2 Index of distributed leadership, by gender (average values) 61
Figure 3.3 Percentage of headteachers agreeing or strongly agreeing that they make
important decisions on their own: international comparison 62
Figure 3.4 Index of instructional leadership, by school type (average values) 65
Figure 3.5 Percentage of headteachers’ time spent on (i) curriculum and teaching-related
tasks and (ii) administrative and leadership tasks: international comparison 67
Figure 3.6 Percentage of headteachers reporting (i) government regulation and policy
and (ii) an inadequate school budget and resources are barriers to their effectiveness ‘to
some extent’ or ‘a lot’: international comparison 69
Figure 3.7 Percentage of headteachers agreeing or strongly agreeing that (i) ‘the
teaching profession is valued in society’ and (ii) ‘I am satisfied with my job’: international
comparison 71
Figure 3.8 Index of headteachers’ job satisfaction, by Key Stage 4 quartile of school
(average values) 72

6
Figure 3.9 Index of headteachers’ job satisfaction, by Ofsted rating of school (average
values) 73
Figure 4.1 Percentage of teachers in schools with induction programmes for new
teachers and percentage of teachers reporting induction in first teaching job: international
comparison 78
Figure 4.2 Percentage of teachers reporting induction in first job, by age and type of
school 79
Figure 4.3 Percentage of teachers who have mentors and who act as mentors, by age 80
Figure 4.4 Percentage of teachers who had CPD in any area reporting ‘effective training’
in (i) knowledge of subject field(s) and (ii) ICT skills for teaching: international comparison
84
Figure 4.5 Percentage of teachers reporting moderate or high levels of need for CPD in
different areas: international comparison 87
Figure 4.6 Percentage of teachers who report a moderate or high level of need for CPD
in (i) ICT skills for teaching, (ii) new technologies in the workplace, and (iii) teaching
students with special needs, by age 88
Figure 4.7 Percentage of teachers who agree or strongly agree that they lack time for
CPD due to their family responsibilities, by gender and presence of children in the home
90
Figure 4.8 Percentage of teachers who agree or strongly agree that there is a lack of
employer support for CPD, by school type and Ofsted rating 90
Figure 5.1 Percentage of teachers who report having received feedback from (i) SMT and
(ii) external sources, by school characteristics 95
Figure 5.2 Percentage of teachers reporting a moderate or large positive change in their
(i) confidence and (ii) knowledge/understanding of their main subject field(s) as a result of
feedback: international comparison 98
Figure 5.3 Percentage of teachers reporting a moderate or large positive change in their
(i) teaching practices, (ii) classroom management practices, and (iii)
knowledge/understanding of their main subject field(s) as a result of feedback, by school
type 99
Figure 5.4 Average number of areas or work or career in which teachers report a
‘moderate’ or ‘large’ positive change as a result of feedback, by years of teaching
experience 100

7
Figure 5.5 Percentage of teachers in schools where the head reports that teachers are
formally appraised at least once a year and percentage of teachers reporting feedback:
international comparison 101
Figure 5.6 Percentage of teachers working in schools where the head reports that (i) the
development of a training plan and (ii) the appointment of a mentor follow appraisal most
of the time or always: international comparison 104
Figure 5.7 Percentage of headteachers in maintained schools and academies who report
‘material sanctions’ as following appraisal ‘most of the time’ or ‘always’, by age of the
headteacher 105
Figure 5.8 Percentage of teachers who agree or strongly agree that (i) feedback is based
on a thorough assessment of teaching and (ii) appraisal and feedback are largely done to
fulfil administrative requirements: international comparison 107
Figure 5.9 Percentage of teachers who agree or strongly agree that poorly performing
teachers face ‘material sanctions’, by headteacher reports of the frequency of this
outcome 108
Figure 5.10 Percentage of teachers who agree or strongly agree that appraisal and
feedback have little impact on teaching practices in their school, by school type and
teacher gender 109
Figure 6.1 Ratio of average pay of lower secondary teachers to other graduates in 2011:
international comparison 113
Figure 6.2 Percentage of teachers agreeing or strongly agreeing that (i) teachers are
underpaid and (ii) their own pay is fair given their performance, by hours worked 115
Figure 6.3 The association of long working hours with the percentage probability that a
teacher disagrees with the statement that their own pay is fair 117
Figure 6.4 Percentage of teachers agreeing or strongly agreeing that (i) they have scope
to progress into a leadership team role and (ii) their workload is unmanageable, by hours
of work 121
Figure 6.5 Percentage of teachers agreeing or strongly agreeing with statements on (i)
autonomy, (ii) workload, (iii) parent support and (iv) progression, by Ofsted rating of
school 122
Figure 6.6 Percentage of teachers agreeing or strongly agreeing with statements on (i)
autonomy, (ii) workload, (iii) parent support and (iv) progression, by Key Stage 4 test
quartile of school 123
Figure 6.7 Percentage of teachers who agree or strongly agree that the teaching
profession is valued in society: international comparison 124

8
Figure 6.8 Percentage of teachers who agree or strongly agree that the teaching
profession is valued in society, by age 126
Figure 6.9 The relationship between agreement that the teaching profession is valued in
society and teacher age: international comparison 127
Figure 6.10 Percentage of (i) headteachers and (ii) teachers who agree or strongly agree
that the teaching profession is valued in society: international comparison 128
Figure 6.11 Percentage of teachers who agree or strongly agree (i) they are satisfied with
their job and (ii) that they regret their career choice: international comparison 131
Figure 6.12 Percentage of teachers who agree or strongly agree that they would choose
to become a teacher again, by age 132
Figure 6.13 The relationship between agreement that ‘I would choose again to work as a
teacher’ and teacher age: international comparison 133
Figure 6.14 Percentage of teachers who agree or strongly agree with statements about
their careers, by school type 134
Figure 7.1 Average class size in the ‘target class’: international comparison 138
Figure 7.2 Percentage of class time that teachers spend on (i) keeping order and (ii)
administrative tasks: international comparison 140
Figure 7.3 Average percentage of class time spent on teaching, by school characteristics
142
Figure 7.4 Percentage of teachers who agree or strongly agree that (i) thinking and
reasoning processes are more important than curriculum content and (ii) students learn
best by finding solutions on their own: international comparison 145
Figure 7.5 Percentage of teachers who agree or strongly agree that thinking and
reasoning processes are more important than curriculum content, by teacher
characteristics 146
Figure 7.6 Percentage of teachers who frequently or in all or nearly all lessons (i) get
students to work in small groups and (ii) give different work to students of different
abilities: international comparison 149
Figure 7.7 Percentage of teachers who get students to work in small groups frequently or
in nearly all lessons, by teacher age and gender 150
Figure 7.8 Percentage of teachers who give different work to students of different
abilities, by school characteristics 151

9
Figure 7.9 Percentage of teachers who (i) provide written feedback on student work and
(ii) get students to answer questions in front of class: international comparison 153
Figure 7.10 Percentage of teachers giving written feedback frequently or in all or nearly
all lessons, by teacher gender and by subject of the target class 154
Figure 8.1 Percentage of teachers in schools where the headteacher reports pupils (i)
arrive late and (ii) are absent on a daily or weekly basis: international comparison 157
Figure 8.2 Percentage of teachers in schools where the headteacher reports intimidation
or verbal abuse on a daily or weekly basis (i) among pupils (ii) by pupils of staff:
international comparison 159
Figure 8.3 Percentage of teachers in schools where the headteacher reports that on a
daily or weekly basis teachers (i) arrive late and (ii) are absent: international comparison
160
Figure 8.4 Percentage of teachers reporting that they agree or strongly agree that on a
daily or weekly basis (i) there is a lot of disruptive noise in the classroom and (ii) quite a
lot of time is lost through interruptions to the lesson: international comparison 164
Figure 8.5 Percentage of teachers reporting that they agree or strongly agree that on a
daily or weekly basis (i) there is a lot of disruptive noise in the classroom and (ii) they wait
quite a long time for students to quieten down: international comparison 165
Figure 8.6 Average percentage of class time spent on teaching, by quartile of classroom
climate score 166
Figure 8.7 Average classroom climate score, by characteristics of the school 167
Figure 8.8 Average classroom climate score, by percentage of academically-gifted pupils
in the class (as estimated by the teacher) 169
Figure 8.9 Average classroom climate score, by percentage of pupils in the class eligible
for free school meals (as estimated by the teacher) 170
Figure 8.10 Average classroom climate score, by characteristics of the teacher 171
Figure 9.1 Percentage of teachers responding ‘a lot’ on their ability to (i) calm disruptive
students and (ii) get students to follow rules: international comparison 177
Figure 9.2 Percentage of teachers responding ‘a lot’ on their ability to (i) use a variety of
assessment strategies and (ii) craft good questions: international comparison 178
Figure 9.3 Percentage of teachers responding ‘a lot’ on their ability to (i) motivate
students and (ii) help students value learning: international comparison 179
Figure 9.4 Average teacher self-efficacy scores, by teacher characteristics 180

10
Figure 9.5 Average teacher self-efficacy scores, by school characteristics 182
Figure 9.6 Average teacher self-efficacy scores, by whether feedback at the school led to
positive change in (i) career advancement and (ii) job responsibilities 183
Figure 9.7 Average teacher self-efficacy scores, by whether feedback at the school led to
positive change in (i) confidence as a teacher and (ii) motivation 184
Figure 9.8 Average teacher self-efficacy scores, by whether feedback at the school led to
positive change in (i) amount of professional development (ii) type of professional
development 184
Figure 9.9 Average teacher self-efficacy scores by quartiles of teacher exchange,
collaboration and cooperation indices 186
11
List of tables
Table 1.1 The TALIS sample for England 26
Table 1.2 Countries in TALIS 2013 – and performance of secondary school pupils 31
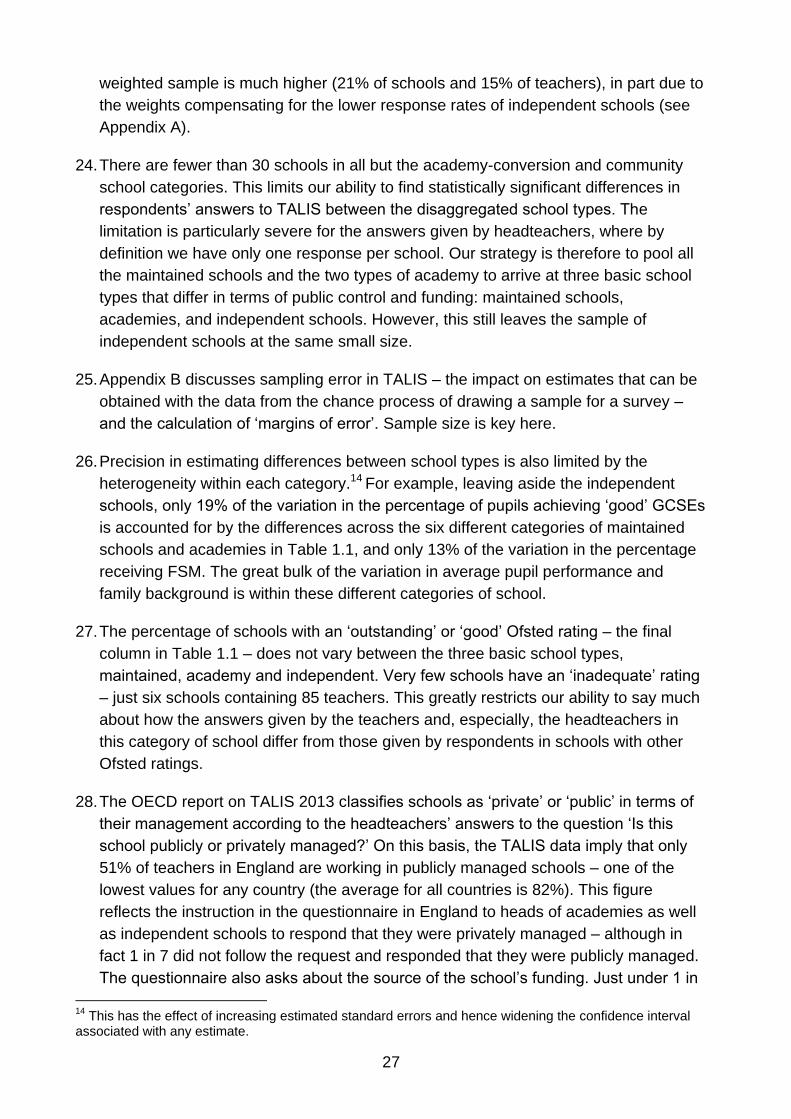
Table 2.1 Age and years of experience of teachers and headteachers: international
comparison 38
Table 2.2 Family circumstances of teachers, by age 38
Table 2.3 Percentage of teachers who teach different subjects to lower secondary pupils:
international comparison 39
Table 2.4 Percentage of teachers working in schools where the head reports that (i) the
school (ii) a local or national authority has ‘significant responsibility’ for the task
concerned: international comparison 41
Table 2.5 Teachers’ total weekly hours of work 51
Table 3.1 Headteacher education by school type (percentage) 56
Table 3.2 Percentage of headteachers who report a shared responsibility for different
tasks: international comparison 59
Table 3.3 Percentage of headteachers who report engaging in different activities ‘often’
or ‘very often’: international comparison 64
Table 3.4 Headteachers’ allocation of working time (percentage of total), by school type
66
Table 3.5 Percentage of headteachers who agree or strongly agree with different
statements about their jobs 74
Table 4.1 Percentage of teachers in schools with induction programmes for new teachers
and percentage of teachers reporting induction in first teaching job: international
comparison 78
Table 4.2 Percentage of teachers (i) in schools with mentoring systems, (ii) who have
mentors, and (iii) who act as mentors: international comparison 80
Table 4.3 Percentage of teachers reporting participation in CPD during the last 12
months and percentage who paid for the CPD undertaken: international comparison 81
Table 4.4 Percentage of teachers reporting participation in different types of CPD and
average total time spent in each activity: international comparison 82

12
Table 4.5 Percentage of teachers who undertook any CPD in the last 12 months who
report a moderate or large impact on their teaching, by topic covered: international
comparison 83
Table 4.6 Percentage of teachers reporting that CPD undertaken in last 12 months had
certain features in most or in all activities undertaken: international comparison 85
Table 4.7 Percentage of teachers agreeing or strongly agreeing with statements about
barriers to their participation in professional development: international comparison 89
Table 5.1 Percentage of teachers who report having received feedback from different
sources: international comparison 94
Table 5.2 Percentage of teachers receiving feedback on different bases: international
comparison 96
Table 5.3 Percentage of teachers reporting a moderate or large positive change as the
result of receiving feedback, by area of work or career: international comparison 97
Table 5.4 Percentage of teachers in schools where the head reports that teachers have
formal appraisal from one or more sources at least once a year: international comparison
101
Table 5.5 Percentage of teachers in schools where heads report outcomes occur most of
the time or always after formal appraisal: international comparison 103
Table 5.6 Percentage of teachers agreeing or strongly agreeing with statements about
the aims and outcomes of formal appraisal and feedback in their school: international
comparison 106
Table 6.1 Teacher views on whether teachers are underpaid compared to other
professions, by teacher and school characteristics (percentages) 114
Table 6.2 Teacher views on whether own pay is fair given performance, by teacher and
school characteristics (percentages) 115
Table 6.3 Teacher views on whether they have the autonomy needed to do a good job as
a teacher, by teacher and school characteristics (percentages) 119
Table 6.4 Teacher views on whether their workload is unmanageable, by teacher and
school characteristics (percentages) 120
Table 6.5 Teacher views on whether parents are supportive, by teacher and school
characteristics (percentages) 120
Table 6.6 Teacher views on whether they have scope to progress into a leadership team
role, by teacher and school characteristics (percentages) 121
13
Table 6.7 Teachers’ views on statements about their job and career (percentages) 130
Table 7.1 Average percentage of time in the target class spent on administration, keeping
order, and teaching, by teacher characteristics and subject taught 141
Table 7.2 Percentage of teachers agreeing or strongly agreeing with different statements
about teaching and learning: international comparison 144
Table 7.3 Percentage of teachers using particular teaching techniques frequently or in all
or nearly all lessons: international comparison 148
Table 7.4 Percentage of teachers using particular assessment methods frequently or in
all or nearly all lessons: international comparison 152
Table 8.1 Headteacher responses on the frequency of different types of pupil behaviour
(percentages) 157
Table 8.2 Headteacher responses on the frequency of different types of teacher
behaviour (percentages) 159
Table 8.3 Headteachers’ views on whether insufficient powers to deal with poor student
behaviour limit the head’s effectiveness in his or her school (percentages) 161
Table 8.4 Teachers’ views on the statement ‘The students I teach are generally well
behaved’ (percentages) 161
Table 8.5 Teacher responses to statements on classroom climate (percentages) 163
Table 9.1 Teacher views on the extent to which they can do certain things in their
teaching (percentages) 176
Table 9.2 Multiple regression models of teacher self-efficacy score 188

14
Acknowledgements
The report was produced by a team at the Department of Quantitative Social Science at
the Institute of Education (IOE) comprised of: Rebecca Allen, Fabian Barrera, Elodie
Bellarbre, Christopher Hein, Sonia Ilie, Andrew Jenkins, John Jerrim, John Micklewright,
and Anna Vignoles. Sonia Ilie and Anna Vignoles are in the Faculty of Education,
University of Cambridge. The team was led by John Micklewright.
We are very grateful to colleagues at RM Education (RM), our partner in the National
Study Centre for TALIS 2013 in England, who implemented the survey and successfuly
collected the data: the successive National Project Managers – Kathy Brooks, Helen
Robinson, and Dawn Pollard – and Laura James, who played a particularly important role
in RM’s achievement of a satisfactory response rate for the survey. Dave Thomson was
responsible for the sample design and Mark Johannesen was the Data Manager for the
main survey. Our RM colleagues would like in turn to thank other staff at RM for their
contributions: John Dallimore, Patrick Davey and the RM school support team.
We and RM thank staff at the Department for Education (DfE) who worked with us on
TALIS for their help throughout the project: Jude Belsham, Lorna Betrand, Natasha
Calvert, Sam Forster, Caroline Halls, Teresa Harper, Emily Knowles, Tanya McCormack,
Michele Weatherburn and members of the project Steering Group.
We, RM and DfE thank members of an Advisory Group drawn from external bodies
representing schools, teachers, and governors in both the independent and state-funded
sectors. The group played an important role advising on the implementation of TALIS in
England and ensuring awareness of the survey and endorsing participation in it, thereby
encouraging response.
We are grateful to the TALIS International Consortium for its leadership of the survey and
for providing clean and documented data for us to use. We are also grateful for early
access to draft material from the OECD’s international report for the survey (OECD,
2014).
Helpful comments on parts or all of drafts of the report were made by staff at DfE, in
particular Natasha Calvert and Emily Knowles, and by David Budge and Robin Griffiths.
At IOE, we also thank Dick Wiggins for advice on sample design, Alexandria Horton and
Pamela Gilmore for assistance with the final layout of the report, Helen Casey and
colleagues for help setting up the project, and Peter Earley for carrying out the focus
group research which formed the pilot study for the survey.
Last but not least, we thank the respondents to TALIS – the headteachers and teachers –
for taking part in the survey, whether the main survey in 2013, the field trial in 2012, or
the pilot study in 2011, and for thereby providing the data that has made this report
possible.

15
Executive summary
Introduction
The Teaching and Learning International Survey (TALIS), led by the Organisation for
Economic Co-operation and Development (OECD), provides new information on the
views and practices of lower secondary teachers and their headteachers and on how
these vary across countries. England participated in TALIS for the first time in 2013 – the
only part of the UK to do so. The survey included over 30 other countries or parts of
countries.
This national report for England is published simultaneously with the OECD’s first
international report on TALIS 2013. It complements the OECD’s report by (i) providing a
more focused comparison of England with other countries and (ii) analysing differences
within England across school and teacher characteristics.
International comparisons of England made in the national report include contrasts with a
group of nine countries or parts of countries with high performing educational systems:
Japan, Korea, Singapore, Finland, Estonia, The Netherlands, Flanders (Belgium), Alberta
(Canada) and Australia. The report reveals that teacher views and practices often vary
widely among these high performers.
Analysis of differences within England is enhanced by using the answers to additional
TALIS questions not asked in other countries and by linking the survey data to contextual
information for each school such as its Ofsted rating and the percentage of pupils
receiving free school meals.
TALIS 2013 in England had response rates of 75% for schools and 83% for teachers,
leading to samples of 154 headteachers and 2,496 teachers. These are good response
rates by the standards of previous school and teacher surveys in England. The survey
includes roughly equal numbers of local authority maintained schools and academies and
a small number of independent schools. The modest sized sample of schools means that
some findings (especially those concerning headteachers) that relate to the variation
between schools need to be treated with caution.
The results refer to the Spring of 2013 and should not be taken as necessarily giving a
good indication of the situation in the Summer of 2014 when this report is published.
The analysis in each chapter uncovers correlations but it does not establish causal
relationships.
Lower secondary teachers and their schools
Chapter 2 documents the profile of lower secondary (Key Stage 3) teachers in England
and the schools in which they work. Compared to the average for other countries,

16
England has younger teachers and headteachers, fewer modern language teachers,
more autonomous schools, significantly greater numbers of teaching assistants and
administrative and managerial staff in schools, and teachers reporting longer total
working hours on average but not face-to-face teaching hours.
Differences within England include higher teacher age and experience in independent
schools and poorer pupil achievement where headteachers report that shortages of
teaching staff restrict the quality of instruction.
25% of teachers in state-funded schools in the lowest average ability quarter of pupil
intake teach three or more subjects at Key Stage 3 compared to only 13% of teachers
in schools in the top ability quarter.
Almost all headteachers in England report that responsibility for determining teacher
pay (both starting salary and pay increases) is at least shared at the school level but,
on average, only 32% do so in high performing countries.
Teachers in England report, on average, working 46 hours a week on all tasks (48
hours for full-time teachers), one of the highest figures in TALIS and 9 hours more
than the median for all countries. But average face-to-face teaching time in England
(20 hours) is close to the international average.
School leadership and headteachers’ management styles
Chapter 3 focuses on the leadership of schools. Headship is increasingly a postgraduate-
level job in England, with a very high proportion of school heads with higher degrees
and/or the National Professional Qualification for Headship (NPQH). A high proportion of
headteachers in England share important decision-making with others. In general, this
‘distributed’ leadership is less common in high performing TALIS countries.
Headteachers in more deprived schools in England have higher levels of distributed
leadership and are less likely to find a lack of resources to be a barrier to their
effectiveness. Both findings may reflect the large investment during recent decades in the
more deprived urban schools in England.
86% of school heads in England disagreed that they make the important decisions in
their schools on their own, compared to medians of 65% for all countries in TALIS and
66% for the nine high performing countries.
The top three issues cited by headteachers in England as creating barriers to their
effectiveness are: (i) government regulation and policy (79% of heads), (ii) inadequate
school budget and resources (78%), and (iii) high workload and level of
responsibilities in their job (68%). The averages for all TALIS countries are 69%, 80%
and 72%.
17
In all countries, including England (94%), a very large majority of headteachers report
being satisfied with their jobs. Within England, headteachers in schools rated by
Ofsted as ‘outstanding’ or ‘good’ are more satisfied on average than heads of schools
rated as ‘satisfactory’ or ‘inadequate’.
Professional development
Chapter 4 looks at the continuing professional development (CPD) of teachers. The
quantity of CPD undertaken by teachers in England is relatively high by international
standards, when measured by the existence and use of induction programmes, by
mentoring, and by participation in some (but not all) forms of training.
But time spent in training is lower on average in England. And the extent of ‘effective’
training – CPD felt to have a significant impact on teaching – is lower for a number of
important areas of activity. Teachers in England also feel less need for CPD across a
range of different areas than teachers elsewhere.
92% of teachers in England report having undertaken some CPD in the last 12
months. Finland and Japan have the lowest figures among high performing countries
(79% and 83%).
50% of teachers in England report ‘effective’ training over the previous year in their
subject fields compared to an average of 71% for high performing countries.
About two thirds of teachers in England with children aged 0-4 report lack of time due
to family responsibilities as a barrier to CPD. Induction, participation in CPD, and
‘effective’ training is lower for teachers in independent schools. Among teachers in the
state-funded sector, ‘effective’ training is higher, on average, in schools with lower
ability intakes and higher percentages of pupils receiving Free School Meals.
Appraisal and feedback
Chapter 5 considers the feedback that teachers receive about their work, both through
formal appraisal and informal channels. England has near universal systems of teacher
appraisal, reported by headteachers, and the great majority of teachers report receiving
feedback: England is a high appraisal/feedback country compared both to the average
TALIS country and to some, but not all, of the high performers. The high performing
countries display considerable variation.
But teachers in England tend to be rather less positive about the effect of feedback on
their teaching than teachers in many other countries. There are various competing
explanations for this.
99% of teachers in England report receiving feedback from one or more sources in
their current school, compared to an average of 88% for all countries in TALIS and
89% for high performing countries. But about a half of teachers in England – the same
18
as on average in other countries – believe that appraisal and feedback are largely
done to fulfil administrative requirements.
A half of teachers in England say that feedback had a moderate or large positive
impact on their confidence, on their teaching practices, and on their job satisfaction.
The average number of different sources of feedback reported by teachers and the
average number of moderate/large positive changes as a result of feedback are lower
in independent schools but there is no statistically significant variation in either
measure by Ofsted rating.
Teachers’ views of their jobs
Chapter 6 explores teachers’ views of their pay and working conditions and their beliefs
on how society sees their profession. Half of the chapter analyses answers to questions
posed only to teachers in England.
The views expressed are mixed and need careful interpretation. For example, fewer
teachers in England express overall satisfaction with their jobs than in any other country
in TALIS. This may be seen as disappointing if a crude ‘league table’ view is taken. But
the large majority of teachers in England – four fifths – do say that they are satisfied with
their jobs.
Most teachers in England (73%) feel that teachers are underpaid compared to other
similarly qualified professionals. But half (53%) agree that their own pay is fair given
their level of performance. Teachers who work long hours are less satisfied with their
pay.
1 in 3 teachers in England (35%) believe that their profession is valued by society.
The majority of countries in TALIS record even lower figures. But teachers in most
high performing countries are more positive, including in Singapore and Korea where
two thirds hold this view, although they are not in Japan.
There is a strong negative association in England between teacher age and whether
the teacher believes that the teaching profession is valued in society – younger
teachers hold more positive views. England is one of the few countries where this is
the case.
Teaching practices
Chapter 7 investigates teachers’ beliefs about teaching and their practices in and out of
the classroom. Part of the analysis relates to a particular class that each teacher takes.
Its average size is 24 students in England but the average varies widely across other
countries in TALIS – including among the high performing countries e.g. 18 students in
Finland and 36 in Singapore.

19
There are clear differences between England and other countries in some views held by
teachers and in several practices.
Teachers in England report, on average, spending 7% of their time in the classroom
on administrative duties, 11% on maintaining discipline, and 82% on teaching. This
situation is near the median for the high performing countries.
74% of teachers in England agree that ‘Thinking and reasoning processes are more
important than specific curriculum content’, fewer than in most other TALIS countries
(the average is 84%). The percentage in England does not vary significantly with
measured characteristics of schools such as school type or Key Stage 4 test scores.
58% of teachers in England report often getting students to work in small groups,
compared to only 40%, on average, in high performing countries. Again, there is no
significant variation within England with measured school characteristics, but women
and younger teachers use this technique more. Teachers in England are also much
more likely than teachers in most countries to give different work to students with
different abilities (‘differentiation’). 63% report doing so often compared to 32%, on
average, in high performing countries.
School and classroom disciplinary environment
Chapter 8 examines school and classroom climate including pupil behaviour, as
perceived by teachers and school heads. On school climate, the evidence from TALIS
suggests that serious disciplinary problems in England are unusual. For example, in all
schools, headteachers report use or possession of drugs or alcohol as rare or absent.
On classroom climate, the situation in England again does not stand out as bad by
international standards. On the evidence of teachers’ reports, it is at the average for
countries in TALIS or, in some respects, better.
Late arrival of students and absences are reported by headteachers to occur on a
weekly or daily basis in England in 56% and 41% respectively of schools – close to
the medians for all countries and below the levels of several high performing
countries. But headteachers report unjustified absenteeism by teachers as occurring
at least weekly in 11% of schools, more than in many other countries.
21% of teachers in England agree that they have to wait quite a long time at the start
of their class for students to quieten down – but this figure is less than the median for
all countries (27%) and less than in most high performing countries.
Classroom climate is notably better, on average, in independent schools than in state-
funded schools and, among the latter, where Key Stage 2 intake scores are higher.
But less than a fifth of the variation in classroom climate is accounted for at the school
level: typically, schools do not have uniformly good or bad classroom climate.

20
Teachers’ self-efficacy
Chapter 9 analyses the ‘self-efficacy’ of teachers – the beliefs they hold about their
capability to influence learning. International comparison of self-efficacy must be treated
with some caution as cultural differences may influence the way in which questions are
answered. But the results from TALIS suggest that teachers in England are confident in
their abilities – their self-efficacy is quite high compared to teachers in other countries.
Self-efficacy tends to be higher when teachers report good relations with others in the
school. The direction of causality is unclear. Teachers with high self-efficacy may build
good relations. Or by working in schools with good relations, teachers may become more
confident.
56% of teachers in England believe that they are very capable of calming a disruptive
student, 49% that they can craft good questions for their students, and 29% that they
can motivate students who show low interest – compared to median values for high
performing countries of 30%, 31% and 21% respectively.
Only a tenth of the variation in teachers’ self-efficacy in England occurs at the school
level. The bulk of the variation is within schools rather than between schools. There is
no evidence that self-efficacy is higher in independent schools than in state-funded
schools, nor, among the latter, that it varies according to the proportion of pupils from
poor backgrounds in the school or between maintained schools and academies.
Less experienced teachers in England – those with five years or less in the profession
– tend to have lower self-efficacy. But beyond five years of experience there is no
significant variation in self-efficacy levels.

21
Chapter 1 Introduction
1. Good teaching matters a great deal for pupil learning. The importance of good
teaching makes it vital to find out more about teachers’ attitudes, their teaching
practices, and their professional development.1
2. Part of what teachers do both in and out of the classroom is determined by the
organisation and leadership of the schools in which they work. Moreover, these
aspects of schools have a direct impact on pupil learning too, beyond that coming
through teachers. So we also need to know more about headteachers’ views on a
range of critical issues.
3. The OECD Teaching and Learning International Survey (TALIS), in which England
participated for the first time in 2013, provides new information on these matters for
England and other countries.2 TALIS focuses on teachers and headteachers of lower
secondary pupils. The survey covers all types of secondary school in England with
pupils in Key Stage 3, except those devoted solely to children with special needs,
including independent (private) schools.
4. TALIS 2013 collected information on a range of topics in over 30 countries, including:
school staffing;
school leadership;
teacher training, especially professional development;
appraisal of teachers’ work and the feedback they receive;
teachers’ pedagogical beliefs, attitudes to teaching and teaching practices;
job satisfaction of both teachers and headteachers;
teaching staff’s views of school and classroom climate;
teachers’ self-confidence in their abilities to teach.
These topics all relate to key issues today in teaching and learning in England’s
secondary schools.
5. This chapter introduces TALIS and our analysis of the data for England by addressing
six questions:
1 One recent study for England found that being taught by a high quality teacher adds about a half of a
GCSE point per subject compared to being taught by a low quality one. This estimate comes from Slater et al. (2011) who allow for many of the methodological problems confronting research in this area. The estimate is a little higher than implied by evidence from leading US studies. See also the review for the Sutton Trust by Murphy and Machin (2011). 2 The OECD is the Organisation for Economic Co-operation and Development. England did not participate
in an earlier round of TALIS conducted in 2008 (OECD 2009). Wales, Scotland and Northern Ireland have not yet taken part in the survey.

22
What is the policy background for TALIS in England?
What is the existing evidence for England?
What data were collected for England by TALIS in 2013?
What can TALIS tell us – and what can it not tell us?
Which countries should we compare England with?
What does the report cover?
1.1 What is the policy background for TALIS in England?
6. The last 25 years have seen the creation of a ‘quasi-market’ in education in England.
This contrasts with many of the other countries included in TALIS 2013. Parents have
been given much more opportunity than before to choose schools for their children
within the state system. At the same time, schools have been given more autonomy,
particularly in recent years. Notably, large numbers of schools have converted to
academies, removed from local authority control but still publicly funded. By January
2013, almost half of all state funded secondary schools were academies and their
number has continued to rise.3
7. The quasi-market in English secondary schooling is an important part of the
background when comparing teacher and headteacher views in England with those in
other countries. But we are also interested in the situation in England per se. How do
teaching staff in our secondary schools view their jobs and their careers following the
major changes that have taken place already and other important changes now in
train? (We comment below on the precise timing of TALIS 2013 in relation to recent
policy initiatives.)
8. Many of the changes currently taking place are intended to raise the quality of
teaching. There are new or much expanded policies enabling schools to train
teachers themselves (e.g. School Direct) and to encourage people into teaching (e.g.
Teach First). These changes have been introduced to incentivise people from
different backgrounds and with different talents and career plans to enter the
profession. There has been a more concerted effort in England to ensure that schools
hold teachers accountable for the quality of their practice, as measured in a variety of
ways. The view that teaching quality can be raised also sees teachers needing
continued professional training during their careers. High teacher turnover is cited as
evidence of the need for better preparation – over 1 in 10 secondary school teachers
changes jobs or leaves the profession each year.4 The recent introduction of
3 Department for Education (2013) and Ofsted (2013: 6).
4 Passy and Golden (2010).
23
performance related pay in England’s schools is another change aimed at raising
teaching quality, in this case through financial rewards to encourage retention of the
best teachers. The jury is still out on the impact but it can be expected to be one more
development that has affected how teachers and headteachers view their careers.5
9. All these changes underline why we want to look at how teachers and headteachers
feel about their jobs and what their views may reveal about their job satisfaction and
the barriers to their effectiveness. We elaborate more on some of the policy
background when introducing each part of the report in the final section of this
chapter.
10. We are not just interested in the average views of teaching staff in England’s schools
on the topics surveyed by TALIS. We also want to know how these views vary across
the individual characteristics of the teachers and headteachers, such as their gender,
age and experience. And we want to uncover the variation across the characteristics
of the schools in which they teach: the type of school (maintained school, academy,
independent school), the family backgrounds of the pupils, pupil performance in
national tests and public exams, and the most recent Ofsted rating. Is there
widespread agreement on the different issues covered by TALIS or do teacher and
headteacher views vary substantially across these and other dimensions?
1.2 What is the existing evidence for England?
11. For several of the subjects it covers, TALIS 2013 does not provide the first
quantitative evidence for lower secondary school teaching in England. We need to
recognise the existing sources of information.
12. At the national level, the new School Workforce Census documents the organisation
of schools e.g. their numbers of different types of staff – teachers, teaching
assistants, administrative and other staff. The Department for Education (DfE)
Teachers’ Workload Diary Surveys, the most recent held in 2013, contain information
on the hours worked by a sample of teachers and how that time is spent during the
day.6 The Teacher Resignation and Recruitment Surveys, conducted annually by the
National Foundation for Educational Research, reveal the characteristics of teachers
leaving schools.7
13. Besides these regular data sources, there have also been important one-off
collections of quantitative data. These include the VITAE (Variations in Teachers'
Work, Lives and their Effects on Pupils) research commissioned by the Department
5 See Atkinson et al. (2009) on the impact of early moves towards performance-related pay for teachers in
England and for a review of literature on the impact elsewhere. 6 TNS BMRB (2014); the previous report in the series is Deakin et al. (2010).
7 Passy and Golden (2010).
24
for Education and Skills (DfES) and conducted during 2001-5.8 Among topics
addressed by VITAE were school leadership, teacher practice, and continuing
professional development, all of which were considered by TALIS in 2013. VITAE also
valuably combined quantitative with qualitative data collection, using a mixed-
methods approach.
14. At the international level, there are existing sources of data that allow comparison of
secondary schools and their teachers in England or the UK as a whole with those in
other countries. These include the OECD’s annual publication Education at a Glance,
its triennial Programme of International Student Assessment (PISA), which focuses
on 15 year olds, and the IEA’s Trends in International Mathematics and Science
Study (TIMSS), which measures achievement of 13-14 year olds.9 PISA includes a
questionnaire to schools, typically answered by the headteacher, and TIMSS includes
one for class teachers. The Varkey GEMS Foundation has recently sponsored the
creation of a Global Teacher Status Index for 21 countries, including the UK.10
15. But none of these existing sources is a substitute for the new, cross-national data on
teachers and headteachers provided by TALIS. The existing sources do not cover
many subjects that TALIS allows insight into. The school and teacher questionnaires
in PISA and TIMSS are designed to add context to explanations of pupil outcomes.
But TALIS is designed primarily to provide a set of comparative indicators on
teachers, their working conditions and their teaching. The Global Teacher Status
Index is based on surveys of the general public’s view of teachers rather than
teachers’ own views of their profession. Inevitably, the national sources provide
information that is often hard to compare with that from other countries.
16. Several of the national sources are small in size or suffered from low response rates.
Just 25 secondary schools and 150 secondary teachers took part in VITAE. The 2013
Teachers’ Workload Diary Survey had a response rate among secondary teachers of
only 17% and did not include teachers in independent schools. As we make clear
below, the TALIS 2013 sample sizes in England, especially of headteachers, are not
huge – about 150 heads and 2,500 teachers. But they should be considered
reasonable (heads) or quite good (teachers) by existing standards. And when judged
by the yardstick of many efforts to survey schools and teachers in England in recent
years, the response rates of around 75-80% (more details are given in the next
section) must be seen as very good.11 TALIS’s coverage of all teachers in all school
types, independent schools included, is also very welcome.
8 Sammons et al. (2007).
9 The IEA is the International Association for the Evaluation of Educational Achievement.
10 Dolton and Marcenaro-Gutierrez (2013).
11 Following the exclusion of the UK from the OECD’s reports on the PISA 2003 round due to the level of
response in England, Sturgis et al. (2006) considered evidence on the difficulties in surveying English schools. The authors reviewed response rates in 73 school surveys in England over 1995-2004. The median school response rate in 2004 was about 40%.

25
1.3 What data were collected for England by TALIS in 2013?
17. TALIS was conducted in England in the Spring of 2013. The survey collected
information from 154 schools and 2,496 lower secondary teachers, an average of just
over 16 teachers for each school in the sample. These numbers of schools and
teachers who agreed to take part in the survey reflect official response rates of 75%
for schools and 83% for teachers (20 teachers per school were invited to participate).
As noted above, these response rates are very good by the standards of many
existing surveys of schools and their teachers in the UK. Weights provided by the
OECD adjust for the level and pattern of school response and for the level of teacher
response within each school. Unless otherwise indicated, we apply these weights.
Further details of the sample design and of the response to the survey are given in
Appendix A to this report.
18. The data come from answers to the questions on the standard international
questionnaires for the school heads and their teachers, augmented in two ways.12
First, several questions for the survey in England had additional elements to capture
more information in the area concerned. And a small number of questions were
added at the end of the questionnaires to collect more information on job satisfaction,
co-operation between schools, and, in the case of teachers, on their family
circumstances (to provide information on the context within which teacher attitudes
and behaviour are formed). The resulting data are analysed in Chapters 2, 3, 6 and 8
for example.
19. Second, we linked the data files with selected information on schools taken from the
School Performance Tables (for 2012) and from Ofsted records: the type of school
(e.g. community school, academy, independent school), the percentage of pupils
eligible for Free School Meals, the average Key Stage 2 points score of the school’s
pupil intake, the percentage of pupils obtaining 5 or more GCSEs at grades A*-C (or
equivalents) including English and maths, and the most recent Ofsted rating of the
school at the time of the survey (or very soon afterwards). The inclusion of this
information allows for a substantially richer analysis of differences in teacher attitudes
and practices across English schools than would be possible using the TALIS data
alone.
20. Table 1.1 draws on the linked School Performance Tables data to show the numbers
of each type of secondary school that took part in TALIS and the number of teachers
in the sample in each of these school types. Summary statistics for the percentage of
pupils in each school with Free School Meals (FSM), the percentage achieving good
GCSE results, and the percentage of schools with a ‘outstanding’ or ‘good’ Ofsted
report are also given. The table illustrates the variety of types of school now present
12
The international questionnaires were also very lightly adapted in places within OECD guidelines in order to improve the fit with the institutions of the English school system.
26
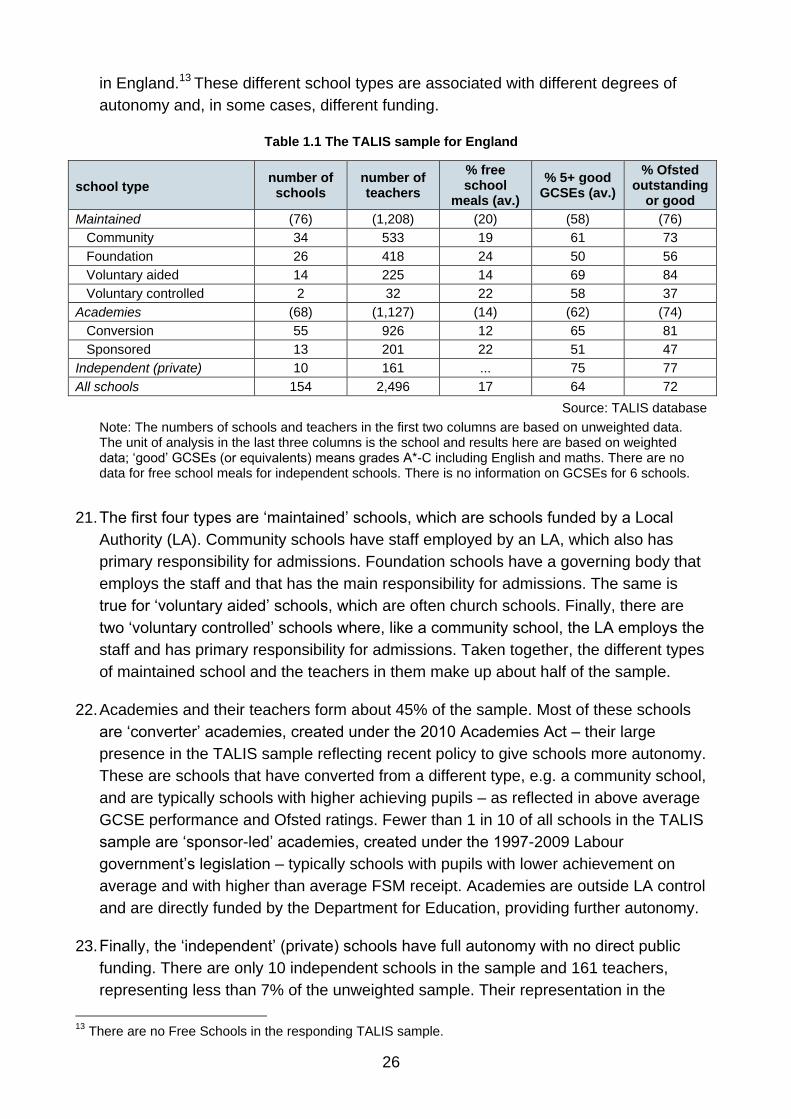
in England.13 These different school types are associated with different degrees of
autonomy and, in some cases, different funding.
Table 1.1 The TALIS sample for England
school type number of
schools number of teachers
% free school
meals (av.)
% 5+ good GCSEs (av.)
% Ofsted outstanding
or good
Maintained (76) (1,208) (20) (58) (76)
Community 34 533 19 61 73
Foundation 26 418 24 50 56
Voluntary aided 14 225 14 69 84
Voluntary controlled 2 32 22 58 37
Academies (68) (1,127) (14) (62) (74)
Conversion 55 926 12 65 81
Sponsored 13 201 22 51 47
Independent (private) 10 161 ... 75 77
All schools 154 2,496 17 64 72
Source: TALIS database
Note: The numbers of schools and teachers in the first two columns are based on unweighted data. The unit of analysis in the last three columns is the school and results here are based on weighted data; ‘good’ GCSEs (or equivalents) means grades A*-C including English and maths. There are no data for free school meals for independent schools. There is no information on GCSEs for 6 schools.
21. The first four types are ‘maintained’ schools, which are schools funded by a Local
Authority (LA). Community schools have staff employed by an LA, which also has
primary responsibility for admissions. Foundation schools have a governing body that
employs the staff and that has the main responsibility for admissions. The same is
true for ‘voluntary aided’ schools, which are often church schools. Finally, there are
two ‘voluntary controlled’ schools where, like a community school, the LA employs the
staff and has primary responsibility for admissions. Taken together, the different types
of maintained school and the teachers in them make up about half of the sample.
22. Academies and their teachers form about 45% of the sample. Most of these schools
are ‘converter’ academies, created under the 2010 Academies Act – their large
presence in the TALIS sample reflecting recent policy to give schools more autonomy.
These are schools that have converted from a different type, e.g. a community school,
and are typically schools with higher achieving pupils – as reflected in above average
GCSE performance and Ofsted ratings. Fewer than 1 in 10 of all schools in the TALIS
sample are ‘sponsor-led’ academies, created under the 1997-2009 Labour
government’s legislation – typically schools with pupils with lower achievement on
average and with higher than average FSM receipt. Academies are outside LA control
and are directly funded by the Department for Education, providing further autonomy.
23. Finally, the ‘independent’ (private) schools have full autonomy with no direct public
funding. There are only 10 independent schools in the sample and 161 teachers,
representing less than 7% of the unweighted sample. Their representation in the
13
There are no Free Schools in the responding TALIS sample.
27
weighted sample is much higher (21% of schools and 15% of teachers), in part due to
the weights compensating for the lower response rates of independent schools (see
Appendix A).
24. There are fewer than 30 schools in all but the academy-conversion and community
school categories. This limits our ability to find statistically significant differences in
respondents’ answers to TALIS between the disaggregated school types. The
limitation is particularly severe for the answers given by headteachers, where by
definition we have only one response per school. Our strategy is therefore to pool all
the maintained schools and the two types of academy to arrive at three basic school
types that differ in terms of public control and funding: maintained schools,
academies, and independent schools. However, this still leaves the sample of
independent schools at the same small size.
25. Appendix B discusses sampling error in TALIS – the impact on estimates that can be
obtained with the data from the chance process of drawing a sample for a survey –
and the calculation of ‘margins of error’. Sample size is key here.
26. Precision in estimating differences between school types is also limited by the
heterogeneity within each category.14 For example, leaving aside the independent
schools, only 19% of the variation in the percentage of pupils achieving ‘good’ GCSEs
is accounted for by the differences across the six different categories of maintained
schools and academies in Table 1.1, and only 13% of the variation in the percentage
receiving FSM. The great bulk of the variation in average pupil performance and
family background is within these different categories of school.
27. The percentage of schools with an ‘outstanding’ or ‘good’ Ofsted rating – the final
column in Table 1.1 – does not vary between the three basic school types,
maintained, academy and independent. Very few schools have an ‘inadequate’ rating
– just six schools containing 85 teachers. This greatly restricts our ability to say much
about how the answers given by the teachers and, especially, the headteachers in
this category of school differ from those given by respondents in schools with other
Ofsted ratings.
28. The OECD report on TALIS 2013 classifies schools as ‘private’ or ‘public’ in terms of
their management according to the headteachers’ answers to the question ‘Is this
school publicly or privately managed?’ On this basis, the TALIS data imply that only
51% of teachers in England are working in publicly managed schools – one of the
lowest values for any country (the average for all countries is 82%). This figure
reflects the instruction in the questionnaire in England to heads of academies as well
as independent schools to respond that they were privately managed – although in
fact 1 in 7 did not follow the request and responded that they were publicly managed.
The questionnaire also asks about the source of the school’s funding. Just under 1 in
14
This has the effect of increasing estimated standard errors and hence widening the confidence interval associated with any estimate.

28
5 heads of both academies and maintained schools reported that teaching staff are
not funded by central or local government, despite the opposite clearly being the
case. These responses may reflect the state of flux in secondary school organisation
in England and the different views that heads have of the state’s role – and the
difficulty in capturing this complexity with a standard international survey instrument.
1.4 What can TALIS tell us – and what can it not tell us?
29. TALIS can show how teacher and headteacher attitudes and beliefs in England in
2013 vary across observed school and individual characteristics and how they
compare with those in other countries. However, we need to underline the limits to
what can be said.15
30. TALIS is an ‘observational study’, providing a cross-section of information at a single
point in time. It cannot reveal causal relationships with any certainty. Imagine we find
that teachers in schools with high performing pupils, as measured by results in GCSE
exams, tend to have particular views on classroom discipline. We cannot say whether
(i) the teachers’ views help cause high performance in their schools, or (ii) this high
performance helps form the teachers’ views about discipline, or (iii) some third factor
is responsible for both teacher views and pupil performance, or (iv) the observed
pattern is due to a combination of all three possible explanations. As ever, correlation
does not imply causation.
31. Even more specifically, we cannot link teacher attitudes to the performance of the
pupils that they themselves actually teach. Even in the few countries participating in
the optional TALIS-PISA link study, where this link can be made, the same problem
identified in the paragraph above remains. As the OECD puts it ‘the intention of TALIS
is not to measure the effects of teaching on student outcomes’.16
32. Care is needed when interpreting patterns of association between average teacher
views in each country, e.g. classroom discipline again, and some other average
characteristic of teachers, such as their age. The over-interpretation of the patterns of
the national averages is an example of the so-called ‘ecological fallacy’.17 The
correlation of aggregate quantities at the national level is not the same as the
correlation of individual quantities within a country, which is typically the subject of
real interest. That is, the relationship between teacher views and age within any one
country, e.g. England, may differ from the pattern of the country averages.
15
See also the clear warnings on some of the same issues made in the OECD’s own analysis of TALIS 2013 in the first chapter of the international report (OECD, 2014). 16
OECD (2014), chapter 1 para 23. 17
For further discussion in the context of cross-national surveys of education, see May et al. (2003).

29
33. The information collected by TALIS is self-reports from the teachers and
headteachers. In this sense it is ‘subjective’ information. It is not objectively observed
information on what the respondents actually do or how they behave in practice. That
behaviour could be at variance with the pattern implied by the self-reported
information collected in the survey.
34. In any cross-national survey, there is always the concern that questions cannot be
framed and interpreted in the same way in every country, given problems of language
(including but not only translation) and culture. The international organisers of TALIS
put a great deal of effort into resolving such concerns. And we ourselves worked with
the Department for Education and our partners at RM Education, who collected the
survey data, in refining the questionnaires for England within the limits allowed by the
OECD. Nevertheless, it would be naive to assume that all problems were either
identified or resolved if found.
35. Finally, it needs to be emphasised that the TALIS data for England were collected in
the Spring of 2013. The information obtained may or may not be a good guide to
teacher and headteacher attitudes and beliefs at the time that this report is published
in the Summer of 2014. For example, a further year of pay restraint since the time that
the survey was conducted may have altered teachers’ views of their pay (analysed in
Chapter 6). The same may be true of the revised teachers’ pay and conditions that
came into force from September 2013 (actual performance related pay decisions for
teachers do not take place until September 2014). Other important changes include
the reformed national curriculum published in September 2013 which applies from
September 2014.
1.5 Which countries should we compare England with?
36. Part of this report considers differences in teacher and headteacher views within
England – we look at the variation in the reported information across individual and
school characteristics. But we also want to compare results in England with those for
other countries in TALIS. This complements the analysis made by the OECD in their
international report for the survey as a whole. In doing so we can place England in
clearer context than is possible in a report that has no focus on any one country. The
issue arises of which countries to use in the comparison. Possibilities include:
All countries or ‘sub-national entities’ that took part in TALIS 2013. England is
classified as a sub-national entity, like the province of Alberta or the region of
Flanders, which are the parts of Canada and Belgium respectively that took part in
the survey. If one is looking for general patterns across countries against which to
place England then arguably the more countries the better.

30
Just the OECD or European Union (EU) members that took part in the survey.
(Germany is the one large EU country that is conspicuous by its absence from
TALIS.) These have the advantage of being familiar geo-political and economic
groupings. But they have the disadvantage of excluding countries that we might
like to see retained in the comparison, as well as reducing the pool of countries on
which general patterns can be based.
All countries, but with subsets of them defined as ‘low performers’ and ‘high
performers’ on the basis of the achievement of their secondary school children
recorded in other international surveys. The high performers are of obvious
interest. But so too are the low performers. If teacher attitudes or school
organisation in England are similar to that in a group of low performers then this
seems worth knowing (even if those low performers are, typically, at lower levels
of national income). It is also useful to know if low performers and high performers
differ notably from each other.
37. We adopt the third of these possibilities. Table 1.2 classifies the 33 countries (we
include sub-national entities in this term from now on) in TALIS 2013 into three
groups.18 There are nine ‘high performers’ and eight ‘low performers’, leaving 16 other
countries in a group that includes England. Appendix C describes in detail how we
define the high and low performing countries. The essentials are that (i) we use
results from PISA, augmented by information from TIMSS and PIAAC (Programme for
the International Assessment of Adult Competencies); (ii) the high performers are
defined as those with average scores that are higher than in England and where the
size of the margin is statistically significant; (iii) the low performers are the countries
with average scores in PISA below a given threshold in all subjects covered by the
survey (reading, maths, and science). This threshold is far below the average scores
achieved in England.
38. The low performing group contains two of the three poorest OECD countries, Chile
and Mexico, and the two poorest EU countries, Bulgaria and Romania.
39. The high performing group has a considerable geographical and cultural mix: there
are three East Asian countries, four European countries (of which two are Baltic), and
two English-speaking countries. The group also includes a mix of large and small
countries, with all the differences in terms of organisation of schools and social
cohesion that this may imply. The reasons for their success have been the subject of
much discussion.19 The relative contributions of schools and families are debated for
the East Asian members – Japan, Korea, and Singapore – including the roles of
18
We do not include Cyprus in our analysis. In addition to the 33 countries and sub-national entities participating in TALIS 2013 through the OECD, Cyprus conducted the survey directly through a contract with the international contractor, the IEA. However, the figure for Cyprus does enter any average for all countries in TALIS that we take from OECD summary tables in OECD (2014). (This average, on the other hand, excludes the figure for the USA.) 19
See, for example, the various chapters in Meyer and Benavot (2013) and the series of videos produced by the Pearson Foundation and the OECD http://www.pearsonfoundation.org/oecd/.

31
school discipline, on the one hand, and of extensive use of private tutoring outside
schools on the other.20 Finland is cited by some commentators as an example of a
country that has bucked an international trend in terms of school inspections and pupil
testing with comparatively little of either. The variation in the explanations for success
that are offered across this diverse group of countries means that it will not be a
surprise to see the teacher views and behaviour recorded in TALIS differing
substantially among them.
Table 1.2 Countries in TALIS 2013 – and performance of secondary school pupils
Performance Countries
High Performers Japan, Korea, Singapore
Estonia, Finland,
Flanders (Belgium), The Netherlands,
Alberta (Canada), Australia
Low Performers Abu Dhabi (UAE), Brazil, Bulgaria, Chile, Malaysia,
Mexico, Romania, Serbia
Other countries Croatia, Czech Republic, Denmark, England (UK),
France, Iceland, Israel, Italy, Latvia, Norway, Poland,
Portugal, Slovak Republic, Spain, Sweden, USA
Notes: See Appendix C for definitions of high and low performance.
40. In some tables in the report we give averages to compare with England for the high
performing and low performing countries under the headings ‘H9’ and ‘L8’, together
with examples of the individual figures for a few of the high performers. In graphs with
scatterplots that compare England with other countries, we plot the nine high
performing and eight low performing countries with different symbols. An Excel
workbook with a spreadsheet providing the data for each graph is available on the
Department for Education research publication website. All countries are separately
identified in these spreadsheets.
1.6 What does the report cover?
41. In terms of the chapter order and broad content, much of the structure of this report is
similar to the OECD’s international report on the first results of TALIS 2013 as a
whole.21 We add two further chapters to those included by the OECD (our Chapters 6-
9 cover ground dealt with in two chapters in the international report). However, our
approach to the issues and the detailed content of each chapter are typically quite
different. Each chapter, like this introductory one, is organised around a series of
questions. These questions are listed at the start of the chapter and then form the
20
For example, on Japan, see Watanabe (2013), summarised briefly at http://schoolsimprovement.net/guest-post-the-real-reason-behind-asian-education-success-a-perspective-from-japan/ and OECD (2012). TALIS does not include China-Shanghai, an East Asian ‘sub-national entity’ that has recently attracted a lot of attention for its PISA results. 21
OECD (2014).

32
headings for each section. Each of Chapters 2-9 finishes with a brief section of
summary that brings together the analysis. A box at the start of each chapter gives
some key findings.
42. Chapter 2 considers the profile of lower secondary teachers in England and the
schools in which they work. We begin by showing who are the teachers and
headteachers who took part in TALIS. We look at the gender balance of teachers and
heads, their ages and their years of experience. The chapter then addresses three
issues of topical interest by way of further introducing the TALIS data. The first is
school autonomy, argued by the OECD as being a key to high performance and a
subject emphasised in policy initiatives from successive UK governments. The
second is school staffing, where our analysis includes discussion of the use of
teaching assistants, a subject that has been hotly debated.22 The third is teachers’
weekly hours of work. We distinguish total time both inside and outside school on all
tasks and time spent in face-to-face teaching. How do the results from TALIS
compare with those from the 2013 Teachers’ Workload Diary Survey with its low
response rate? And how do the number of hours worked by teachers in England
compare with those in other countries? We also show how teachers’ hours of work
vary with their family circumstances.
43. Chapter 3 focuses on the leadership of schools. This is a factor that is often argued to
be a key to pupil achievement, including in the 2010 Schools White Paper.23 We start
by considering the formal qualifications of headteachers in what we demonstrate is
increasingly becoming a postgraduate-level segment of the teaching profession. We
then show what TALIS uncovers about the leadership styles of heads. We analyse
headteachers’ reports on how they divide their working year between different tasks.
The chapter then turns to document the issues that school heads view as barriers to
their effectiveness, before finishing by asking how satisfied they are with their jobs.
44. Chapter 4 analyses the continuing professional development (CPD) of teachers. CPD
is an important issue in any school system and government policy continues to try to
encourage worthwhile activity. The National College for Teaching and Leadership,
formed in 2013 from the National College for School Leadership and the Teaching
Agency, is one plank in a policy aimed at improving the quality of the teacher
workforce, including through better CPD. The chapter starts by documenting the
prevalence of induction and mentoring schemes in secondary schools. We then
analyse how much CPD is undertaken by teachers and of what types – before
addressing the question as to whether this CPD is seen by teachers as effective. The
last two sections of the chapter investigate whether teachers see much need for more
CPD and the barriers they perceive to undertaking more training.
22
See, for example, Blatchford et al. (2012) and Russell et al. (2013) and http://www.teachingassistantresearch.co.uk/. 23
Department for Education (2010).

33
45. Chapter 5 considers the feedback that teachers receive about their work, both
through formal appraisal and more informal channels. Who provides feedback to
teachers and on what basis? And what do teachers think about the feedback they
receive – do they perceive it as useful? After addressing these questions we focus on
systems of formal appraisal as reported by headteachers, together with the different
outcomes that school heads report as resulting from these systems. Finally, we report
on teachers’ views of appraisal and feedback. What are their views of the outcomes,
as opposed to the heads’ views? Do they see formal appraisal and informal feedback
as a well-grounded system that serves an important purpose or do they see it largely
as merely ticking an administrative box?
46. Chapter 6 focuses on teachers’ views of their jobs and their profession. The status of
teaching and the satisfaction of teachers are vital to attracting and retaining high
quality teachers and to sustaining teacher self-confidence. Teaching has often been
seen as a high status profession in the UK and one providing a high degree of job
satisfaction in comparison with many other occupations.24 The chapter addresses four
questions relevant to the current status of the profession and efforts to recruit and
retain staff. First, do teachers believe that their pay is fair? Second, are they satisfied
with their working conditions and scope for progression? Third, do they believe that
their profession is valued in society? Fourth, are teachers happy in their careers,
believing that they made the right choice? The first two questions can only be
addressed for England as the data necessary were not collected in the other
countries participating in TALIS. But in answering the third and fourth questions, we
can show not only the variation in opinions within England but – as in other chapters –
how teachers’ views in England compare with those in other countries.
47. Chapter 7 deals with several important issues concerning teachers’ practices in the
classroom and their beliefs. First, we document teachers’ reports on how much time
they actually spend teaching in the classroom, rather than dealing with administrative
issues or keeping control. Second, we investigate whether teachers see thinking and
reasoning processes as more important than specific curriculum content. Curriculum
issues are much debated in England. The national curriculum has been in force since
1988 but it does not apply to independent schools and academies may deviate from it
to a substantial degree. Third, we analyse how widespread are the practices of
organising pupils into small groups to work together on a problem – another issue of
topical debate25 – and of giving different work to students of different abilities
(‘differentiation’). Finally, we analyse the methods that teachers report using to assess
pupil learning – including tests, getting pupils to answer questions in front of class,
and providing written comment on work.
48. Chapters 8 and 9 address two issues critical to teacher success. Chapter 8 considers
school and classroom climate including pupil behaviour, as perceived by teachers and
24
See, for example, the analysis of the 2004 Workplace Employment Relations Survey in Rose (2007). 25
For example, the 2015 PISA survey will include an investigation of ‘collaborative problem solving’.

34
school heads. This issue is of much current interest. It was highlighted by the head of
Ofsted, Sir Michael Wilshaw, in his presentation of the agency’s annual report on
schools in December 2013.26 The 2010 White Paper on schools also gives it
emphasis. How much student – and teacher – absenteeism is there in English
schools and how does this compare with the situation in other countries? Is there
much noise and disruption in classrooms in England?
49. Chapter 9 then considers the ‘self-efficacy’ of teachers – the beliefs that teachers hold
about their capability to influence student learning. Good teachers believe in their
abilities. The chapter tackles six questions. First, just how confident are teachers in
England? Second, how is self-efficacy related to years of experience and other
teacher characteristics? Third, do school-level factors account for much variation in
self-efficacy? Fourth, is the feedback that teachers receive associated with their self-
efficacy? Fifth, how do working relationships with colleagues affect teachers’ self-
efficacy? And, finally, does self-efficacy vary with the strength of teacher-student
relations?
50. The tables and graphs in the report all refer to England only unless otherwise
indicated by the inclusion of ‘international comparison’ at the end of the title. (See
paragraph 40 for information on where to find the exact values of data shown in
graphs.) Where the source is given as ‘TALIS database’, the results are based on our
own analysis of the survey data.27 Many of our tables and graphs comparing England
with other countries draw on the OECD’s analysis of the data in the first international
report on TALIS 2013, published simultaneously with this national report for England.
Here the source is given as ‘OECD (2014)’ with the appropriate table number.
26
Wilshaw (2013). 27
We did not have access to data from the USA and we excluded Cyprus from our analysis – see footnote 18.

35
Chapter 2 Lower secondary teachers and their schools
Fewer lower secondary teachers in England are women than the
international average in TALIS, 63% compared to 68%. Given the
relationship between the female shares of teachers and headteachers
across all countries, one would expect the percentage of school heads who
are women in England, 38%, to be about 5 points higher.
Teachers in England are on average 4 years younger than the average
across all countries in TALIS and headteachers 2 years younger.
Only 9% of lower secondary teachers in England teach modern foreign
languages, compared to an average of 19% for all countries in TALIS.
25% of teachers in state-funded schools in the lowest quarter of average
ability of pupil intake teach three or more subjects at Key Stage 3 compared
to only 13% of teachers in schools in the top quarter.
Schools in England are very autonomous by international standards –
including Local Authority maintained schools. Almost all headteachers in
England report that responsibility for determining teacher pay (both starting
salary and pay increases) is at least shared at the school level but, on
average, only 32% of heads do so in other countries.
Given the average number of pupils in secondary schools in England, the
average number of teachers is what one would expect given the relationship
between the two variables across all countries. But schools in England have
unusually high numbers of staff who are not teachers – the average ratios of
the number of teachers to the number of teaching assistants and to the
number of administrative/management staff (4.1 and 3.3 respectively) are
among the lowest in TALIS.
Lower secondary teachers in England report working 46 hours a week on all
tasks, on average, one of the highest figures in TALIS and 9 hours more
than the median for all countries. But average face-to-face teaching time in
England (20 hours) is close to the international average.

36
1. We begin in this chapter by using the TALIS data to investigate some of the
characteristics of lower secondary teachers and headteachers in England. We look in
turn at gender, age and experience, home circumstances, and the subjects taught by
teachers.
2. We then underline the degree of autonomy now held by secondary schools in
England, as summarised by information reported by headteachers. We go on to
consider the size and staffing of schools, including teaching assistants and
administrative/managerial staff as well as teachers. Finally, we investigate hours
worked by teachers, a key aspect of staff resources from the point of view of the
school and a major feature of working life from a teacher’s perspective. We deal with
all these issues by addressing four questions:
Who are the teachers and headteachers in TALIS schools?
How autonomous are schools in England?
How well are schools staffed?
What are teachers’ hours of work?
2.1 Who are the teachers and headteachers in TALIS schools?
3. Figure 2.1 plots the percentage of lower secondary teachers in each country who are
women on the horizontal axis and the percentage of headteachers who are women on
the vertical axis. Graphs of this type in the rest of the report use the same design:
high performing countries identified in Chapter 1 are indicated with a solid diamond,
low performing countries with an open triangle, and other countries – including
England – with an open circle.28
4. Secondary school teaching in England, as in almost all other countries in TALIS, is a
profession with more women than men. But the female share of teachers in England,
63%, is a bit lower than the international average of 68% (measured here by the
median). In only one country, Japan, are there more men than women – this is the
country at the bottom left of the graph where 39% of teachers and just 6% of
headteachers are female. Korea is the other high performing outlier with a low
percentage of female headteachers, 13%, whereas 68% of Korean teachers are
women.
5. England reflects the general pattern of women being under-represented among
headteachers in the sense that the percentage of school heads who are female, 38%,
is below the female share of all lower secondary teachers. This underrepresentation
28
On the identification of individual countries, see paragraph 40 in Chapter 1.

37
holds in almost every country. The regression line in the graph shows the average
relationship between the female share of headteachers and the female share of
teachers. England sits below this line: given the percentage of lower secondary
teachers in England who are women, one would expect the percentage of heads who
are women to be about 5 points higher. It is striking that all but one of the low
performing countries comes above the regression line, with a higher share of school
heads who are female than one would expect given the pattern across all countries. In
6 of the 8 low performers, the majority of headteachers are women, compared to only
2 out of 9 high performers.
Figure 2.1 Percentage of teachers and headteachers who are women: international comparison
Source: OECD (2014) Tables 2.1 and 3.8
Note: The line fitted to the data is from the OLS regression of the percentage of heads who are women on the percentage of teachers who are women. The nine high performing countries and eight low performing countries (see Table 1.2) are indicated by solid diamonds and open triangles respectively.
6. The female shares of the total numbers of teachers and headteachers do not vary
significantly in England with school type (maintained, academy or independent), pupil
background in terms of percentage Free School Meals receipt, or average pupil
GCSE performance.
7. 11% of the headteachers in England report that they have an executive headteacher
over them while 15% report that they themselves are the headteacher of two or more
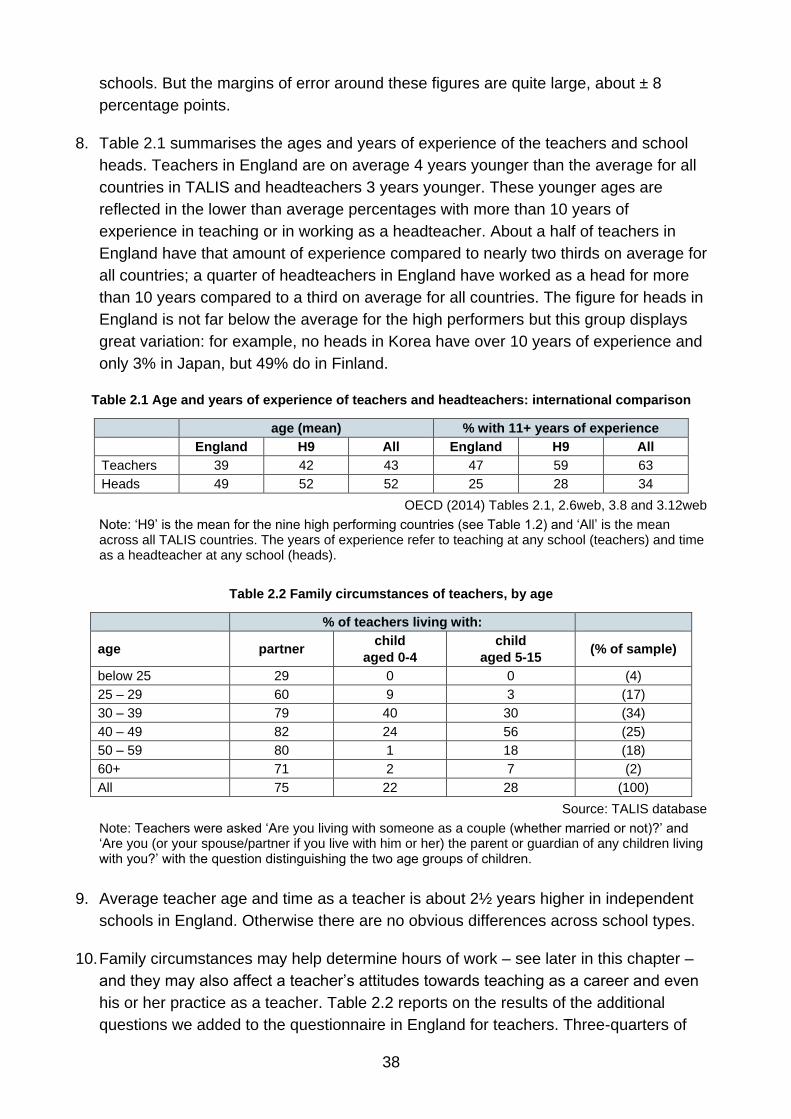
38
schools. But the margins of error around these figures are quite large, about ± 8
percentage points.
8. Table 2.1 summarises the ages and years of experience of the teachers and school
heads. Teachers in England are on average 4 years younger than the average for all
countries in TALIS and headteachers 3 years younger. These younger ages are
reflected in the lower than average percentages with more than 10 years of
experience in teaching or in working as a headteacher. About a half of teachers in
England have that amount of experience compared to nearly two thirds on average for
all countries; a quarter of headteachers in England have worked as a head for more
than 10 years compared to a third on average for all countries. The figure for heads in
England is not far below the average for the high performers but this group displays
great variation: for example, no heads in Korea have over 10 years of experience and
only 3% in Japan, but 49% do in Finland.
Table 2.1 Age and years of experience of teachers and headteachers: international comparison
age (mean) % with 11+ years of experience
England H9 All England H9 All
Teachers 39 42 43 47 59 63
Heads 49 52 52 25 28 34
OECD (2014) Tables 2.1, 2.6web, 3.8 and 3.12web
Note: ‘H9’ is the mean for the nine high performing countries (see Table 1.2) and ‘All’ is the mean across all TALIS countries. The years of experience refer to teaching at any school (teachers) and time as a headteacher at any school (heads).
Table 2.2 Family circumstances of teachers, by age
% of teachers living with:
age partner child
aged 0-4
child
aged 5-15 (% of sample)
below 25 29 0 0 (4)
25 – 29 60 9 3 (17)
30 – 39 79 40 30 (34)
40 – 49 82 24 56 (25)
50 – 59 80 1 18 (18)
60+ 71 2 7 (2)
All 75 22 28 (100)
Source: TALIS database
Note: Teachers were asked ‘Are you living with someone as a couple (whether married or not)?’ and ‘Are you (or your spouse/partner if you live with him or her) the parent or guardian of any children living with you?’ with the question distinguishing the two age groups of children.
9. Average teacher age and time as a teacher is about 2½ years higher in independent
schools in England. Otherwise there are no obvious differences across school types.
10. Family circumstances may help determine hours of work – see later in this chapter –
and they may also affect a teacher’s attitudes towards teaching as a career and even
his or her practice as a teacher. Table 2.2 reports on the results of the additional
questions we added to the questionnaire in England for teachers. Three-quarters of
39
teachers are living with a partner. (In 85% of cases this partner is employed – not
shown in the table.) Just over 20% have a child of pre-school age and just under 30%
a child of compulsory school age (36% have one and/or the other – not shown).
11. Finally in this section we report on the subjects that teachers say they teach at the
lower secondary level. Table 2.3 shows the percentage of teachers teaching in each
of 12 broad categories of subject (the figures sum to more than 100% as many
teachers teach more than one subject). The design of the table is repeated in
subsequent chapters: the figures given are those for England, the averages for the
nine high performing (‘H9’) and eight low performing countries (‘L8’) identified in
Chapter 1, the (unweighted) average across all countries in TALIS (‘All’), and figures
for four examples of the high performers: Finland, Flanders, Japan and Singapore.
Table 2.3 Percentage of teachers who teach different subjects to lower secondary pupils:
international comparison
Subject Eng H9 Fin Fla Jpn Sng L8 All
Reading, writing, literature 28 29 23 25 17 43 30 29
Science 16 21 29 16 16 18 20 21
Mathematics 19 22 29 17 22 20 19 21
Humanities/social studies 20 20 23 18 15 10 19 20
Modern foreign languages 9 16 28 18 19 1 15 19
Arts 14 15 17 11 11 9 15 15
Other 15 18 12 13 35 18 12 15
Physical education 13 14 13 8 14 9 13 14
Religion and/or ethics 11 15 13 11 58 8 14 13
Technology 13 15 8 14 7 15 15 13
Practical/vocational skills 13 13 13 15 7 12 11 11
Classical Greek/Latin 1 1 0 4 n.a. 0 2 1
Source: TALIS database
Note: The figures for ‘H9’ and ‘L8’ are averages for the nine high performing and eight low performing countries (see Table 1.2) and ‘All’ is the average across all TALIS countries. Eng = England, Fin = Finland, Fla = Flanders, Jpn = Japan, Sng = Singapore. There is no information for Japan on Classical Greek and/or Latin and the H9 average here has been calculated across the other eight countries.
12. In most cases, the figures for England are reasonably similar to those elsewhere. For
example, 28% of teachers in England teach reading, writing, and literature compared
to 29%, on average, in the high performing countries and also in all TALIS countries.
The exception is modern foreign languages where the figure of only 9% in England
contrasts with that of 16% for the high performers, on average, and 19% for all
countries.
13. Within England, there are some differences between publicly-funded schools
(maintained schools and academies) and independent schools. Only 20% of teachers
in independent schools teach reading, writing and literature while 12% teach foreign
languages and 19% say they teach physical education (which might include coaching
sports teams). Among the publicly-funded schools there are also marked differences

40
by average pupil ability as measured by Key Stage 2 scores of the school’s intake.
More teachers report teaching reading, writing and literature and teaching maths in
schools with lower average KS2 scores. The figures are 36% for reading, writing and
literature for teachers in schools in the lowest quarter of KS2 intake, falling to 24% for
teachers in the top quarter, and 24% and 15% respectively for maths. Associated with
this, while 25% of teachers in schools in the bottom KS2 quartile report teaching three
or more subjects, this is true for only 13% of teachers in schools in the top quartile.
Where average ability of a school’s intake is lower, teachers teach more subjects.
2.2 How great is school autonomy?
14. The 2010 Schools White Paper was unequivocal on the advantages of greater school
autonomy: ‘across the world, the case for the benefits of school autonomy has been
established beyond doubt’.29 The belief in the importance of school autonomy in
England is the key driver behind the mass conversion of maintained schools to
academies. The OECD’s report on TALIS 2013 is more guarded, noting that research
evidence indicates the impact of autonomy on student achievement to vary across
countries. While concluding that the evidence is in favour of greater autonomy, the
OECD observes that the kind of decision devolved to the school level also makes a
difference.30
15. Just how autonomous are England’s secondary schools by international standards?
TALIS questioned school heads about 11 areas of activity, asking in each case that
the headteacher indicate who has a ‘significant responsibility’ for the area concerned.
The responsibility could be shared and heads were asked to tick as many of the
following options as appropriate:
- the headteacher
- other members of the school management team
- teachers in the school
- the school governing board
- a local or national authority
16. For five of the 11 areas of activity, the top half of Table 2.4 shows the percentage of
teachers working in schools with heads who indicated that responsibility was held at
the school level, meaning at least one of the first four options listed above was
selected. The bottom half of the table shows the percentage of teachers in schools
where the head says that a local or national authority has ‘significant responsibility’,
possibly shared (as with the school level ownership in the top half of the table).
29
Department for Education (2010, para 5.1). 30
OECD (2014), chapter 2.

41
17. The five activities are chosen to represent key aspects in a school’s organisation and
conduct: hiring teachers, establishing their starting salaries, determining their pay
increases, allocating the school’s budget, and deciding the content of courses taught
in the school. (The others, not shown in the table, are firing/suspending teachers,
establishing student disciplinary policies and procedures, determining student
assessment policies, approving students for admission, choosing which materials are
used, and deciding which courses are offered.)
Table 2.4 Percentage of teachers working in schools where the head reports that (i) the school (ii) a
local or national authority has ‘significant responsibility’ for the task concerned: international
comparison
Eng H9 Fin Fla Jpn Sng L8 All
School level
Hiring teachers 100 74 80 100 18 40 59 75
Starting pay for teachers 94 32 24 6 7 10 33 36
Pay increases for teachers 97 32 29 4 16 18 35 37
Allocating the budget 100 92 96 95 60 97 64 83
Course content 97 71 76 34 53 86 48 65
Local or national level
Hiring teachers 1 38 49 0 86 91 51 36
Starting pay for teachers 16 72 81 94 90 92 71 70
Pay increases for teachers 8 77 86 96 88 92 68 70
Allocating the budget 3 19 16 7 45 13 50 32
Course content 8 57 62 86 65 60 71 59
Source: OECD (2014) Tables 2.24 and 2.24.Web
Note: The figures for ‘H9’ and ‘L8’ are averages for the nine high performing and eight low performing countries (see Table 1.2) and ‘All’ is the average across all TALIS countries; Eng = England, Fin = Finland, Fla = Flanders, Jpn = Japan, Sng = Singapore. Authority at the school level includes either the school head, other members of the school management team, teachers, or the school governing board. Authority at the local or national level includes local, municipality/regional, state, or national/federal authority. The five tasks are a subset of the 11 covered by TALIS; ‘hiring teachers’ refers to appointing or hiring teachers, ‘teacher pay’ refers to establishing teachers’ starting salaries, including setting pay scales, ‘allocating the budget’ refers to deciding on budget allocations within the school, and ‘course content’ refers to determining course content, including national/regional curricula.
18. The table presents a graphic picture of a high degree of school autonomy in England,
both in absolute terms and relative to many other countries, including those with high
performing pupils. The figures for school level responsibility for England in the top half
of the table are all at or near 100%. This means that the great majority of or, in some
cases, all heads of local authority maintained schools, as well as heads of academies
and independent schools, are answering that the school at least shares responsibility
for the activity concerned. And the figures in the bottom half of the table show that the
great majority of heads in England do not report that a local or national authority has
‘significant responsibility’ in any of the five areas.
19. Some of the figures for England might be debated – the existence of a national
curriculum that maintained schools must follow suggests that the figure of 8% for local
or national authority responsibility for ‘course content’ is questionably low (nearly half
of the teachers in the TALIS sample work in maintained schools). Similarly, the

42
existence of a national pay scale for teachers in maintained schools would lead one to
expect a higher figure for ‘starting pay for teachers’ than 16%.31
20. Notwithstanding these caveats, the position of England is striking. For example, on
average only a third of teachers in high performing countries are in schools where the
head reports significant school level responsibility for determining teacher starting pay
or for deciding on pay increases. Schools have almost no involvement in teacher
salaries in Flanders (and, not shown, Alberta) and only about a quarter of teachers in
Finland work in schools where significant school level responsibility is reported. Japan
and Singapore (and, not shown, Korea) also exhibit very low school involvement in
pay setting. And while heads in several high performing countries report universal or
near universal involvement of the school in hiring teachers, as heads in England do,
this is not true of Finland and is not even the norm in Japan or Singapore (or, not
shown, Korea). The bottom half of Table 2.4 shows local or national authorities often
bearing significant responsibility for most of the five areas. Only for allocation of the
school budget is the involvement of local or national authorities at a low level among
most of the high performers (Japan is an exception).
21. In most cases, the low performers average a lower level of school involvement than
the high performers (equal for teacher pay) and a higher level of local or national
authority involvement.
22. Schools in England are clearly very autonomous by international standards, or at least
are viewed as such by their headteachers. The levels of school responsibility that are
reported are so high and the levels of local and national authority responsibility so low
that there is little room for much analysis of differences among English schools.
Unsurprisingly, the reporting of local or national authority involvement is strongly
concentrated among the maintained schools, although we have already noted that it
is not nearly as high as might be expected. Within the group of maintained schools,
we can find no clear significant differences in level of average GCSE performance,
the distribution of Ofsted ratings, or average Free School Meals receipt between
schools with heads reporting significant local or national authority involvement in any
of the 5 areas of activity considered in Table 2.4 and those with heads who did not.
2.3 How well are schools staffed?
23. Figure 2.2 plots the average number of teachers in TALIS schools for each country
(irrespective of the grades or ages they teach) against the average number of pupils.
Average school size in England, whether measured by the number of pupils or the
number of teachers, is high by international standards. The figures for England of 890
pupils and 67 teachers compare with the averages for all countries of 546 and 45
31
Department for Education (2013a) describes arrangements for pay in maintained schools and the changes in the period covered by TALIS 2013.
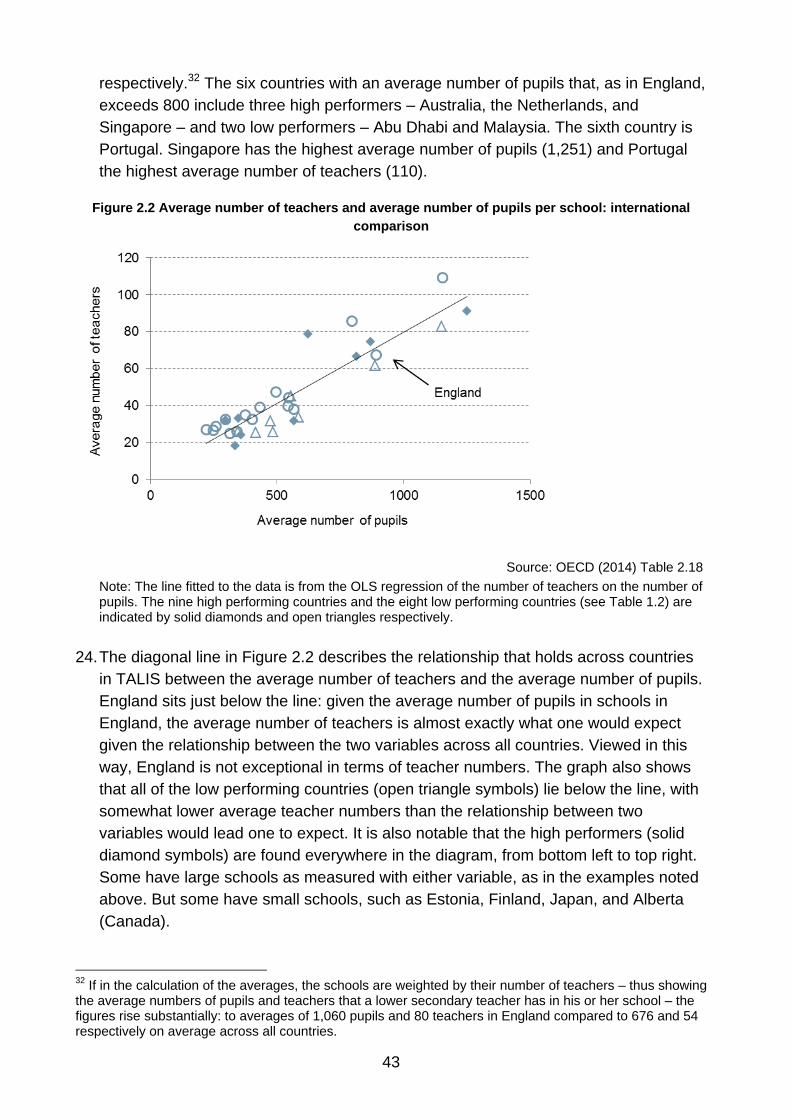
43
respectively.32 The six countries with an average number of pupils that, as in England,
exceeds 800 include three high performers – Australia, the Netherlands, and
Singapore – and two low performers – Abu Dhabi and Malaysia. The sixth country is
Portugal. Singapore has the highest average number of pupils (1,251) and Portugal
the highest average number of teachers (110).
Figure 2.2 Average number of teachers and average number of pupils per school: international
comparison
Source: OECD (2014) Table 2.18
Note: The line fitted to the data is from the OLS regression of the number of teachers on the number of pupils. The nine high performing countries and the eight low performing countries (see Table 1.2) are indicated by solid diamonds and open triangles respectively.
24. The diagonal line in Figure 2.2 describes the relationship that holds across countries
in TALIS between the average number of teachers and the average number of pupils.
England sits just below the line: given the average number of pupils in schools in
England, the average number of teachers is almost exactly what one would expect
given the relationship between the two variables across all countries. Viewed in this
way, England is not exceptional in terms of teacher numbers. The graph also shows
that all of the low performing countries (open triangle symbols) lie below the line, with
somewhat lower average teacher numbers than the relationship between two
variables would lead one to expect. It is also notable that the high performers (solid
diamond symbols) are found everywhere in the diagram, from bottom left to top right.
Some have large schools as measured with either variable, as in the examples noted
above. But some have small schools, such as Estonia, Finland, Japan, and Alberta
(Canada).
32
If in the calculation of the averages, the schools are weighted by their number of teachers – thus showing the average numbers of pupils and teachers that a lower secondary teacher has in his or her school – the figures rise substantially: to averages of 1,060 pupils and 80 teachers in England compared to 676 and 54 respectively on average across all countries.

44
25. The TALIS schools in England vary modestly in average size across the different
school types. The only marked difference is for the independent schools, which are
notably smaller in terms of pupil numbers (537 on average compared to 988 for
academies and maintained schools taken together) but not significantly smaller in
terms of teacher numbers (64 compared to 68).33
26. A school’s teaching resources include teaching assistants as well as teachers. There
has been a large rise in the use by schools of teaching assistants in England in the
last 10-15 years. School Workforce Census (SWC) figures show a near three-fold
increase in their full-time equivalent (FTE) number between 2002 and 2012 in
publicly-funded secondary schools (maintained schools and academies) while the
number of teachers rose by less than 5%.34 The result is that the ratio of teachers to
teaching assistants has fallen from 10.7 in 2002 to 4.0 in 2012. How does the current
situation compare with that in other countries?
27. Figure 2.3 shows that England does indeed appear to be exceptional in the use of
teaching assistants. (As in Figure 2.2, the unit of analysis is the school.) The average
ratio of assistants to teachers is plotted on the horizontal axis. The definitions of staff
categories differ somewhat between TALIS and the SWC but not enough to invalidate
the comparison. The ratio of the number of teachers to the number of ‘personnel for
pedagogical support’ – teaching assistants and any other ‘non-teaching professionals
who provide instruction or support teachers in providing instruction’ – averages 4.1 in
England, measured in TALIS. Only two other countries have a value under 5.0
(Alberta and Iceland) and the median across all countries is 9.8. The box in the graph
shows that the median for the high performers is only a little below that for all
countries. But it is notable that the nine high performers include countries towards
both extremes: Flanders (Belgium) at 31.3 and, as already noted, Alberta (Canada) at
3.8.
28. Compared to other countries, on average schools in England have unusually large
numbers of teaching assistants and other teaching support staff. There are several
caveats to this conclusion. The TALIS figures refer to head counts and not FTEs. The
full-time/part-time ratio of all types of staff may vary across countries. (TALIS shows
86% of lower secondary teachers in England to be full-time, slightly more than the
average for all countries, but there is no breakdown for other types of staff.) The
functions of teaching assistants and other support staff may vary across countries.
Their high numbers in England could mask the fact that they are performing a role
that a teacher would carry out in some other countries (although we have noted that
the average number of teachers in England is in line with average number of pupils.)
Systems in which pupils with severe special needs are included into mainstream
33
There is substantial variation around the average for both the pupil and teacher numbers in England. The 10
th and 90
th percentiles are 340 and 1,410 for the number of pupils and 32 and 105 for the number of
teachers. Excluding the independent schools the figures are 522 and 1,462 and 33 and 105 respectively. 34
Department for Education (2013b, Table 2).

45
schools, as is often the case in England, will also have larger numbers of teaching
support staff.
Figure 2.3 Ratio of average number of (i) teachers to teaching assistants and (ii) teachers to
administrative and management staff: international comparison
Source: OECD (2014) Table 2.18
Note: ‘H9’ and ‘L8’ refer to the nine high performing countries (closed diamonds) and eight low performing countries (open triangles) – see Table 1.2.
29. Figure 2.3 also shows the average ratio of teachers to school administrative or
management staff – the figures on the vertical axis. The value of 3.3 in England is
again unusually low. The median for high performing countries, 6.0, is much higher,
although there is again considerable variation among them, with Singapore below
England at 2.7 and Flanders and Finland in double figures (10.0 and 12.4
respectively). Note that the different categories of staff are not intended to be mutually
exclusive in TALIS – in particular, teachers may also be counted as managers if their
main activity is management (in the SWC they are counted as teachers). The ratio of
total FTE teachers to ‘administrative staff’ in the SWC (a category which includes
managers who are not teachers) in publicly-funded secondary schools in 2012 was
5.6. This represents a substantial fall from the level in 2002 of 8.9, the number of
administrative staff having risen by two-thirds over this period.35
30. The ratios in England of teachers to teaching support staff and teachers to
administrative and managerial staff display some variation around the average levels
just cited – schools do differ in the combinations of staff they employ. But the values
35
Department for Education (2013, Table 2).
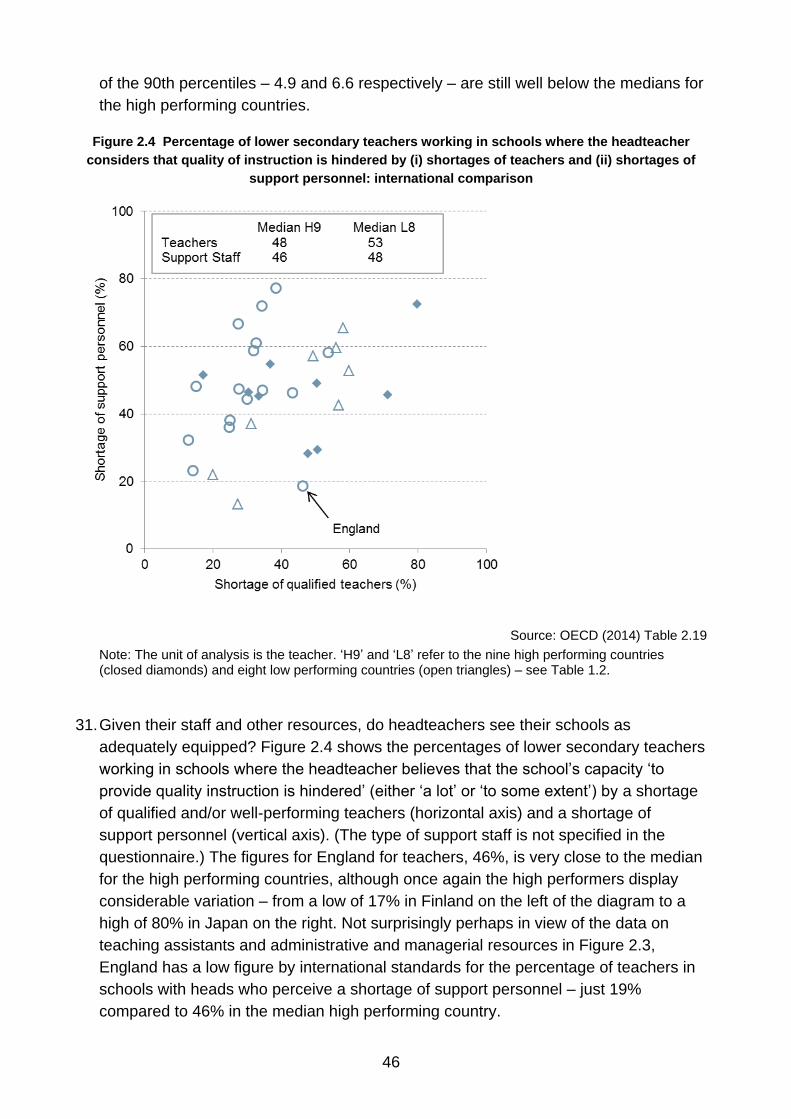
46
of the 90th percentiles – 4.9 and 6.6 respectively – are still well below the medians for
the high performing countries.
Figure 2.4 Percentage of lower secondary teachers working in schools where the headteacher
considers that quality of instruction is hindered by (i) shortages of teachers and (ii) shortages of
support personnel: international comparison
Source: OECD (2014) Table 2.19
Note: The unit of analysis is the teacher. ‘H9’ and ‘L8’ refer to the nine high performing countries (closed diamonds) and eight low performing countries (open triangles) – see Table 1.2.
31. Given their staff and other resources, do headteachers see their schools as
adequately equipped? Figure 2.4 shows the percentages of lower secondary teachers
working in schools where the headteacher believes that the school’s capacity ‘to
provide quality instruction is hindered’ (either ‘a lot’ or ‘to some extent’) by a shortage
of qualified and/or well-performing teachers (horizontal axis) and a shortage of
support personnel (vertical axis). (The type of support staff is not specified in the
questionnaire.) The figures for England for teachers, 46%, is very close to the median
for the high performing countries, although once again the high performers display
considerable variation – from a low of 17% in Finland on the left of the diagram to a
high of 80% in Japan on the right. Not surprisingly perhaps in view of the data on
teaching assistants and administrative and managerial resources in Figure 2.3,
England has a low figure by international standards for the percentage of teachers in
schools with heads who perceive a shortage of support personnel – just 19%
compared to 46% in the median high performing country.

47
32. Headteachers are also asked about a range of other resources e.g. special needs
teachers, IT hardware and software for instruction, textbooks, and library materials. In
almost all cases, fewer headteachers in England reported shortages hindering
instruction than the average value (measured by the median) among the high
performers. Viewed in this way, headteachers in England tend to see their schools as
well resourced by the standards of heads’ views in other countries.
33. How do heads’ views vary across schools in England about the core resource,
‘qualified and/or well-performing teachers’? Figure 2.5 shows that a greater
perception of shortage is associated with lower pupil performance in GCSEs. In
schools where headteachers think that shortages do not hinder instruction ‘at all’, on
average 73% of pupils achieve 5 or more good GCSEs, compared to only 52% where
headteachers think shortages affect the quality of instruction ‘a lot’. (There is no such
association with headteachers’ views of shortages of support personnel.)
Figure 2.5 Average percentage of pupils achieving 5+ GCSEs A*-C (incl. English and maths), by
headteacher’s view of whether shortages of teachers hinder quality of instruction
Source: TALIS database
Note: The (unweighted) number of headteachers (and the average % 5+ GCSEs) in each category are: 24 ‘not at all’ (73%), 53 ‘very little’ (65%), 60 ‘to some extent’ (61%), 13 ‘a lot’ (52%). The black lines in the centre of the bars represent 95% confidence intervals.
2.4 What are teachers’ hours of work?
34. Besides numbers of teaching staff, we need also to consider the hours that teachers
work – an important aspect of school resources. (We consider hours of work from the
perspective of the teachers later in this section.) TALIS collects information on hours
of work in the most recent complete calendar week in two ways. The first is to ask
teachers a single question about their total hours of work on all activity ‘related to your
job at this school’: teaching, planning, marking, staff meetings etc – whether inside or
outside the school, including time at evenings and weekends. The second is to ask

48
about time spent on each of ten tasks (including a residual ‘other’), starting with face-
to-face teaching.
35. The average working week reported by teachers in response to the single question
about total hours is 46 hours, and 48 hours for full-time teachers. Adding up the time
reported on each of the ten separate tasks results in higher figures, 49 hours for all
teachers and 52 for full-timers.36
36. How do these figures compare with those from the 2013 Teachers’ Workload Diary
Survey, funded by the Department for Education? We noted in Chapter 1 that this
important survey had a response rate of only 17% among secondary school teachers.
That level of response is far lower than in TALIS, leading one to doubt the
representativeness of the survey sample.37 The achieved TALIS sample of secondary
school teachers is also about four times larger. On the other hand, teachers in the
Workload Diary Survey were asked to fill in a time use diary over two days, which is
likely to be a more accurate method of data collection than the questions in TALIS
asking respondents to recall figures about the entire previous week.
37. The Teachers’ Workload Diary figures refer only to full-time teachers and exclude
independent schools. The definition of total hours on all activities seems very similar
to that in TALIS. The Workload Diary figure for average hours is 55 hours.38 This
compares with figures for full-time teachers in TALIS when excluding the independent
schools of 48 hours on the basis of the single question on total hours and 51 hours
using the measure based on summing up time spent on different activities. There are
several possible explanations for the differences. It may be that teachers who work
longer hours are more willing to respond to the Workload Diary Survey to record that
fact. Or it may be that the simple questions in TALIS involving recall over the previous
week result in under-reporting. Or the focus of TALIS on lower secondary teachers
rather than all secondary teachers might be a contributory factor. However, despite
the apparent discrepancy in results, it is clear that both surveys show that secondary
school teachers in England work long hours on average.
38. Figure 2.6 shows how these average hours recorded in TALIS compare with those in
other countries. At the same time it gives information on average total hours spent in
face-to-face teaching. Face-to-face hours are shown on the vertical axis with average
total hours on all tasks shown on the horizontal axis. The figures refer to all teachers,
both full-time and part-time. The measure of total hours is the response given to the
36
When summing hours on all ten tasks, we treat missing values as zeros unless figures for all ten tasks are missing, in which case the resulting variable is set to missing. Restricting analysis to teachers with non-missing figures (including zeros) for all ten tasks results in average hours of 50 for all teachers and 53 for full-time teachers. 37
The survey organisers attempted to compensate for the observed pattern of response by re-weighting the data for known characteristics recorded on the sampling frame, which was the School Workforce Census. 38
See TNS BMRB (2014), Figure 6.
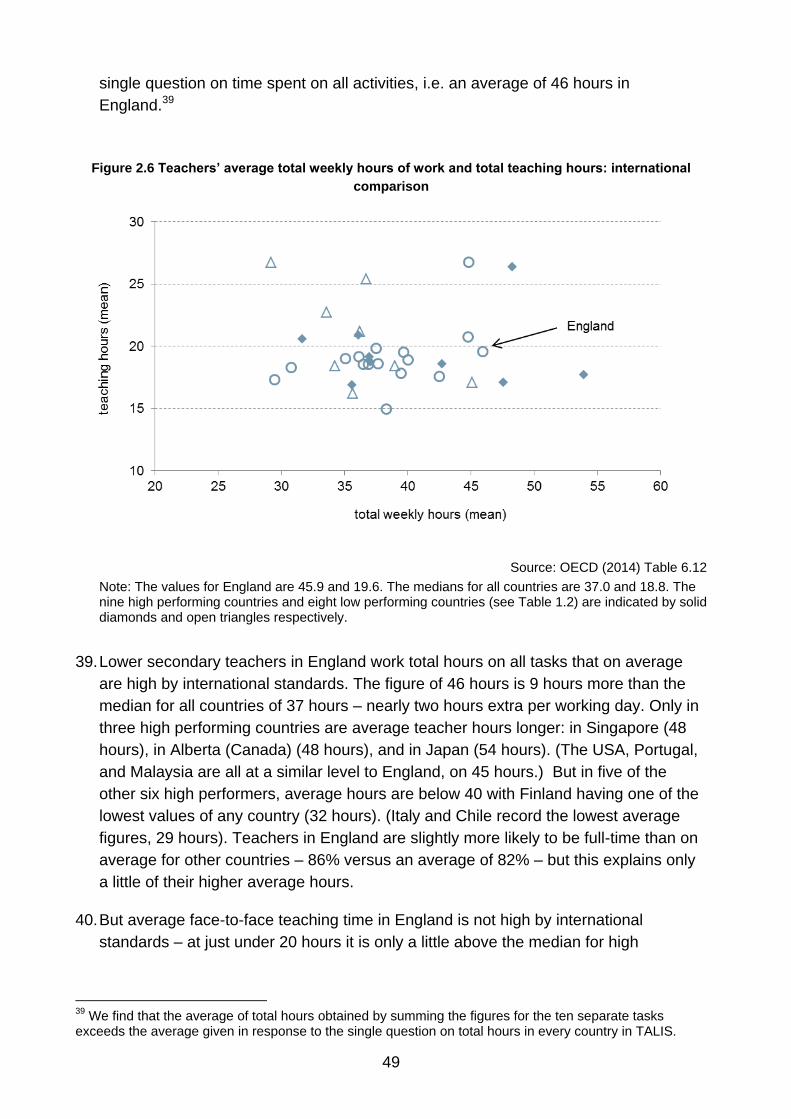
49
single question on time spent on all activities, i.e. an average of 46 hours in
England.39
Figure 2.6 Teachers’ average total weekly hours of work and total teaching hours: international
comparison
Source: OECD (2014) Table 6.12
Note: The values for England are 45.9 and 19.6. The medians for all countries are 37.0 and 18.8. The nine high performing countries and eight low performing countries (see Table 1.2) are indicated by solid diamonds and open triangles respectively.
39. Lower secondary teachers in England work total hours on all tasks that on average
are high by international standards. The figure of 46 hours is 9 hours more than the
median for all countries of 37 hours – nearly two hours extra per working day. Only in
three high performing countries are average teacher hours longer: in Singapore (48
hours), in Alberta (Canada) (48 hours), and in Japan (54 hours). (The USA, Portugal,
and Malaysia are all at a similar level to England, on 45 hours.) But in five of the
other six high performers, average hours are below 40 with Finland having one of the
lowest values of any country (32 hours). (Italy and Chile record the lowest average
figures, 29 hours). Teachers in England are slightly more likely to be full-time than on
average for other countries – 86% versus an average of 82% – but this explains only
a little of their higher average hours.
40. But average face-to-face teaching time in England is not high by international
standards – at just under 20 hours it is only a little above the median for high
39
We find that the average of total hours obtained by summing the figures for the ten separate tasks exceeds the average given in response to the single question on total hours in every country in TALIS.

50
performers of 19 hours.40 Finland actually has slightly higher average time spent on
face-to-face teaching, nearly 21 hours, despite much lower average total hours.
(Alberta is the outlier among the high performers with an average of 26 face-to-face
hours.) It is notable that the variation across countries for face-to-face teaching hours
is much less than for total hours. The ranges are 12 hours and 25 hours respectively.
41. Teachers in England, on average, spend more time per week on things other than
face-to-face teaching than the average teacher in many other countries. There is no
one area that accounts for the difference, but on each of the three most time-
consuming activities, teachers in England are spending more time on average
preparing lessons (7.8 hours compared to a median of 7.1 hours for the high
performers), marking and correcting students’ work (6.1 hours compared to 4.5
hours), and general administrative work (4.0 hours compared to 3.2 hours).
42. Average total hours vary little across teachers in England working in different types of
schools. The average is 2 hours lower in community schools – a subset of maintained
schools – than in other school types taken together, but the difference is only just
statistically significant. The difference appears to lie in the hours other than those
spent on face-to-face teaching. (It is not the case that a greater percentage of
teachers in community schools work part-time.)
43. We now consider the hours worked from the perspective of the teachers. Table 2.5
summarises the distribution of hours spent on all activities by teachers in England,
both in and out of school (we again use the answers to the question on total hours
rather than the total obtained from summing hours across different activities). Half of
full-time teachers work more than 50 hours and 1 in 10 more than 65 hours. Even
among the minority of teachers who work part-time (1 in 7), a quarter work more than
38 hours. Men average two hours more than women. This is because one in five
women work part-time while virtually all men work full-time.
44. The small percentage of the sample aged under 25 work an average of 51 hours and
the even smaller percentage aged 60 or over average 38 hours. Otherwise there is
not much variation in average hours by age – all other age groups shown earlier in
Table 2.2 average between 45 and 47 hours. (The differences between the figures for
the youngest and oldest age groups and between these and the average for the rest
of the sample are statistically significant – they are very unlikely to be due to chance.)
40
The figure for average face-to-face hours for full-time secondary teachers in state-funded schools in the Teachers’ Workload Diary survey for 2013 was 20 hours (TNS BMRB, 2014, Figure 10), exactly the same as for full-timers in state-funded schools in TALIS. This indicates that the discrepancy in average total hours between the two sources lies in the other activities that teachers spend their time on.
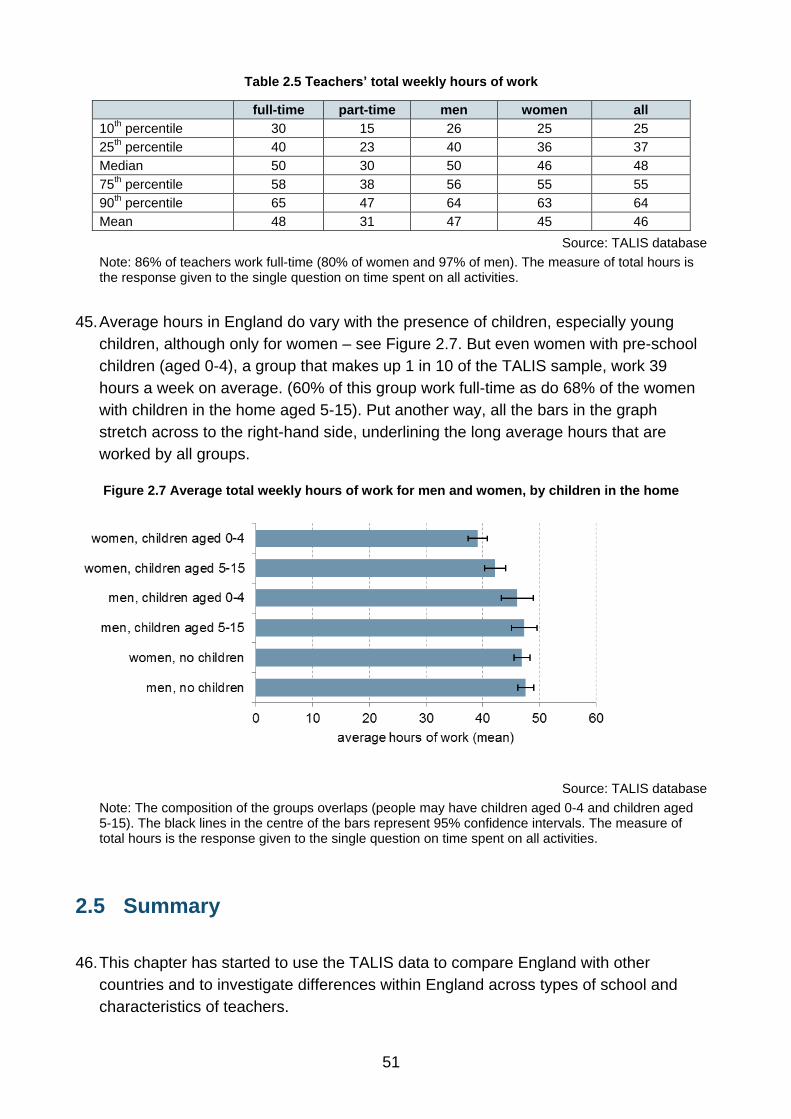
51
Table 2.5 Teachers’ total weekly hours of work
full-time part-time men women all
10th percentile 30 15 26 25 25
25th percentile 40 23 40 36 37
Median 50 30 50 46 48
75th percentile 58 38 56 55 55
90th percentile 65 47 64 63 64
Mean 48 31 47 45 46
Source: TALIS database
Note: 86% of teachers work full-time (80% of women and 97% of men). The measure of total hours is the response given to the single question on time spent on all activities.
45. Average hours in England do vary with the presence of children, especially young
children, although only for women – see Figure 2.7. But even women with pre-school
children (aged 0-4), a group that makes up 1 in 10 of the TALIS sample, work 39
hours a week on average. (60% of this group work full-time as do 68% of the women
with children in the home aged 5-15). Put another way, all the bars in the graph
stretch across to the right-hand side, underlining the long average hours that are
worked by all groups.
Figure 2.7 Average total weekly hours of work for men and women, by children in the home
Source: TALIS database
Note: The composition of the groups overlaps (people may have children aged 0-4 and children aged 5-15). The black lines in the centre of the bars represent 95% confidence intervals. The measure of total hours is the response given to the single question on time spent on all activities.
2.5 Summary
46. This chapter has started to use the TALIS data to compare England with other
countries and to investigate differences within England across types of school and
characteristics of teachers.
52
47. Compared to the average for other countries, England has younger teachers and
headteachers, fewer modern language teachers, more autonomous schools, greater
numbers of teaching assistants and of administrative and managerial staff, and
teachers with longer average total working hours but not face-to-face teaching hours.
48. Our comparisons with other countries include a focus on nine high performing
countries. There is considerable diversity within this group, a finding that will be
repeated in later chapters.
49. Differences within England include higher teacher age and experience in independent
schools and poorer pupil achievement where headteachers report that shortages of
teaching staff restrict the quality of instruction. Average total working hours vary only
modestly with the presence of young children in the household.
53
Chapter 3 School leadership and headteachers’ management styles
Headship is increasingly a postgraduate-level job in England, with a very
high proportion of school heads with higher degrees, the National
Professional Qualification for Headship (NPQH), postgraduate qualifications
in educational leadership and undertaking leadership training as part of their
qualifications.
86% of school heads in England disagreed or strongly disagreed that they
make the important decisions in their schools on their own, compared to the
median for all countries of 65% – heads in England are above the
international average in terms of their shared decision-making. The link
between this style of leadership and country performance is not clear.
Headteachers of more deprived state-funded schools in England scored
higher on average on an index of distributed leadership than heads of less
deprived schools. Heads of schools rated as ‘outstanding’ by Ofsted also
exhibited the highest degree of distributed leadership.
Headteachers’ working patterns in England – the division of their time – are
similar to the average for all countries in TALIS. In England, heads’ working
patterns are not related to the pupil intake of the school as measured by Key
Stage 2 results, nor to the performance of the school in terms of Key Stage 4
outcomes.
There are several aspects of the school environment and features of the job
which headteachers in England highlight as creating barriers to their
effectiveness. The top three issues are: (i) government regulation and policy
(79% of heads), (ii) inadequate school budget and resources (78%), (iii) high
workload and level of responsibilities in their job (68%). The averages for all
TALIS countries are 69%, 80% and 72%.
In all countries in TALIS, including England (94%), a very large majority of
headteachers report being satisfied with their jobs. Heads in England take a
more positive view of society’s valuation of the teaching profession than the
average for all countries.
Average values of a headteacher job satisfaction index unsurprisingly varies
by the Ofsted rating of the school. While heads in ‘outstanding’ and ‘good’
schools tend to be similarly satisfied with their job, those in ‘satisfactory’ or
‘inadequate’ schools are significantly less satisfied on average.

54
1. There is widespread agreement that effective leadership is essential for school
effectiveness, and research has shown that better leadership is associated with better
pupil achievement. As a consequence there has been increasing academic and policy
focus on the development of effective leaders for schools, and interest in the most
effective styles of leadership.41
2. Alongside this recognition of the importance of headteachers, there have been well-
documented difficulties in England in recruiting school heads, particularly to primary
schools. More recently, however, recruitment difficulties have been easing, with fewer
advertised positions remaining unfilled.42 Problems in the recruitment of school
leaders generally, and headteachers specifically, have also occurred in a number of
other OECD countries, including Australia and the USA, to name but two.43 Such
problems appear to be less acute in many Asian countries.
3. Reasons that have been given for the difficulty in recruiting headteachers in England
include the burden of bureaucracy and high workload.44 Further, there is a higher
level of accountability for school heads, accountability that may not be mirrored
further down the school amongst middle leaders and teachers themselves, providing
a particularly challenging management environment. Certainly, some evidence has
indicated that headteachers of poorly performing schools have a higher probability of
being replaced.45
4. More positively, and partly in response to these problems, there has been a trend
towards the professionalisation of headteachers in England, with new professional
qualifications being developed specifically for school heads, new standards
articulated and the establishment of professional bodies such as the National College
for School Leadership (now the National College for Teaching and Leadership).
5. Headteachers in England have had an increase in responsibility, particularly as many
schools have become more autonomous and now carry out a range of tasks that were
previously undertaken by local authorities (see Chapters 1 and 2). At the same time,
headteacher pay has increased. Research evidence also indicates that headteacher
pay is linked to the performance of their school and there is increasing variability in
their pay.46
6. Against this policy background and the significant challenges facing school leaders,
we analyse TALIS 2013 with the aim of identifying the characteristics of current
headteachers in England, their leadership styles, the barriers they face to their
41
Crowther et al. (2002) Day et al. (2011), Sammons et al. (2011), Barber et al. (2010), Brundrett and Crawford (2008), Muijs and Harris (2003). 42
Sprigade and Johnson (2012). On earlier recruiting difficulties, see National College for School Leadership (2008). 43
Gronn and Rawlings-Sanaei (2003), Thomson et al. (2003). 44
Hargreaves and Goodson (2006). 45
Besley and Machin (2008). 46
Besley and Machin (2008).

55
effectiveness and how these vary across the different types of schools found in
England and described in Chapter 1. We also consider the extent of the professional
development that headteachers are provided with to help them overcome the
challenges they face. We largely focus on differences within England across different
school types, though in places we also make international comparisons to provide
context to the situation we are describing in England.
7. Our main questions are:
What are the qualifications of headteachers?
What are the leadership styles of headteachers?
How do school heads spend their working time?
What issues do heads view as barriers to their effectiveness?
How satisfied are headteachers with their jobs?
8. As noted already in Chapter 1, the sample size of 154 English schools and the
corresponding number of headteachers is a modest one and caution is needed when
investigating headteachers’ responses to the survey. Specifically, trying to compare
heads’ responses across different school types within England is problematic due to
small sample sizes. Despite this, we present data by school type, focusing on the
distinction between maintained schools which report to the local authority, academies
that are more autonomous and that are accountable directly to the Department for
Education, and independent (private) schools. The latter are very few in number (just
10) in the TALIS sample and so particular caution is required when interpreting any
analysis using this category.
3.1 What are the qualifications of headteachers?
9. The demographic characteristics of headteachers are discussed in more detail in
Chapter 2. In summary, heads are more likely in England to be male (62% are men),
and on average are slightly younger and have fewer years of experience than
headteachers in other TALIS countries.
10. We also noted that that 11% of heads in the sample report having an executive
headteacher above them and that 15% of heads say they lead two or more schools.
11. Headteachers in England are highly educated and headship is increasingly becoming
a postgraduate profession. A very large majority of school heads in England (99%)
have completed at least a Bachelor’s degree, 48% have also achieved a qualification
at Master’s level and a further 2% have a PhD at the time of the survey – see Table
3.1. Given the small number of headteachers with qualifications at either of the

56
extremes of the education spectrum, for our analysis heads are grouped into two
categories: those with a Bachelor’s degree or below, and those with a higher degree
(either a Master’s degree or a PhD).
Table 3.1 Headteacher education by school type (percentage)
school type highest level of formal education completed
no degree Bachelor’s Master’s PhD
Maintained 0 55 45 1
Academy 2 49 44 5
Independent 0 38 62 0
All 1 49 48 2
Source: TALIS database
Note: figures do not always sum to 100 due to rounding.
12. There is no association between school type and headteachers’ prior educational
qualifications. The age of the head is also not associated with the level of educational
qualifications that they have.
13. A lower proportion of headteachers in independent schools have completed teacher
training qualifications (there is no legal requirement for them to do so). Consequently
there is a modest association between completing teacher training prior to headship
and school type. Only 60% of the heads of independent schools have qualified
teacher status, compared to over 95% of heads of both academies and the
maintained schools. The sample of independent schools is too small, however, to
make any strong claims about heads’ teacher training status.
14. A very high proportion (91%) of heads completed their initial teacher training before
they became headteachers, with a further 5% completing it after they had started in
their position or taking up their post while they were completing their teacher training.
15. A very high proportion of headteachers have postgraduate qualifications, obtaining
higher degrees, the National Professional Qualification for Headship (NPQH),
postgraduate qualifications in educational leadership and undertaking leadership
training as part of their official qualifications.
16. The NPQH is a work-based qualification available for persons wishing to become
school heads, although it is not a prerequisite for obtaining such a post. It can vary in
duration from between 6 and 18 months, it comprises several mandatory and elective
modules and always includes placements in schools. The mandatory modules include
‘Leading and improving teaching’, ‘Leading an effective school’, and ‘Succeeding in
headship’, while the elective modules are chosen from a set of nine, all covering
issues of strategic leadership, educational excellence and operational management.
Completion of a Master’s degree in educational leadership would exempt participants
from certain non-mandatory aspects of the qualification.

57
17. 76% of all headteachers in the TALIS sample have achieved the NPQH, 87% of
whom acquired it prior to beginning their current headship position, 10% acquired it
after commencing their headship role and 3% started their current job while they were
completing the NPQH.
18. There is an association between the type of school that headteachers are leading and
their NPQH status, with significantly fewer independent school heads having achieved
the qualification. Less than half (43%) of independent school headteachers in the
sample have the NPQH, compared to 75% of academy heads and 93% of maintained
school heads. This is not surprising given the fact that the NPQH used to be a
mandatory prerequisite for accessing a headship position in maintained schools,
which is no longer the case. Again we need to be cautious about low sample sizes
when considering independent schools. Male and female heads are equally likely to
have completed the NPQH. The likelihood of having the NPQH qualification also does
not vary by the age of the headteacher.
19. A large proportion of headteachers have also completed either postgraduate degrees
in education leadership or management, or leadership training programmes as part of
their formal education. Close to half (46%) of heads have a postgraduate degree in
education leadership or management. Two-thirds (66%) have undertaken instructional
leadership or management training. These figures do not vary significantly across the
three school types of maintained school, academy, and independent school.
20. Almost all heads (97%) report having participated in some form of professional
development in the 12 months prior to the survey. Approximately 94% participated in
professional development activities that consisted of courses, conferences or
observational visits, while 79% also took part in programmes that were associated
with a professional network, with mentoring or research activities. For the
headteachers who had participated, the mean reported duration of training course
and observation-based professional development activities is around 5 days; the
mean duration for activities associated with network or research activities is 6½ days.
21. 26% of headteachers report engaging in other types of professional development
activities, with a mean duration of 4 days.
22. Participation in continuing professional development (CPD) does not vary by school
type or by the level of deprivation of the school. However, there are some differences
in the extent of professional development of headteachers with respect to the schools’
performance at Key Stage 4. Schools in the second quartile of GCSE attainment have
heads that take part in fewer professional development programmes as compared to
any other quartile. However, generally there is no clear relationship between
participating in CPD and higher pupil achievement.
23. Across all schools, heads report a conflict between finding time for CPD and normal
work commitments. Headteachers who feel more strongly that there is little incentive

58
to participate in professional development activities tend to dedicate less time to
them, perhaps unsurprisingly.
24. School heads in England appear to engage in CPD to a much larger extent than
those in many other countries. Across all the TALIS countries, 84% of heads had
participated in a course or conference (a minimum of 54% in France and maximum of
99% in Singapore), which compares with 94% in England. And only 52% had
engaged in professional network-based activities (ranging from 11% in Portugal to
90% in Singapore), England again comparing favourably at 79%.
3.2 What are the leadership styles of headteachers?
25. TALIS collected data on headteachers’ leadership styles, an issue which we have
noted earlier is of interest to academics and policymakers alike.47 In particular, heads
were asked about the extent to which responsibility in their school for specific named
issues is shared among different individuals or bodies. Robust empirical evidence
suggests that the impact of distributed leadership on schools’ capacity to improve, as
well as on student learning, is positive. More generally, however, the evidence on the
effectiveness of leadership for improving students’ academic outcomes is less
definitive and would suggest relatively small, indirect effects.48 In this section we
analyse heads’ responses to the questions concerned (the same information forms
the basis for our analysis of school autonomy in Chapter 2).
26. Distributed leadership is a set of leadership practices that centre on interactions with
other leaders, teachers, parents and students in the school. These practices are
characterised by collaborative decision making patterns, an emphasis on school
governance that empowers staff and students and a notion of shared accountability.49
Headteachers in TALIS were asked to respond to questions regarding the manner in
which responsibilities for a variety of issues (from teacher hiring to determining course
content) were allocated within their school. They were also asked about the
composition of their senior management team. We analyse these data to determine
the extent of distributed leadership in the school.
27. We consider responses of heads in England to the individual items asked in relation
to distributed leadership, as compared to high and low performing countries defined in
Chapter 1 – see Table 3.2. It is striking that a much higher proportion of school
leaders in England claim a shared responsibility for establishing teachers’ salaries,
51%, compared to the averages for high performer and low performer countries (11
and 12% respectively), and none in Flanders and only 1% in Korea and Alberta (not
shown in the table). A very similar situation is found in relation to sharing the
47
See also Gronn (2000), Woods et al. (2004). 48
Heck and Hallinger (2010), Day and Sammons (2013). 49
OECD (2013).
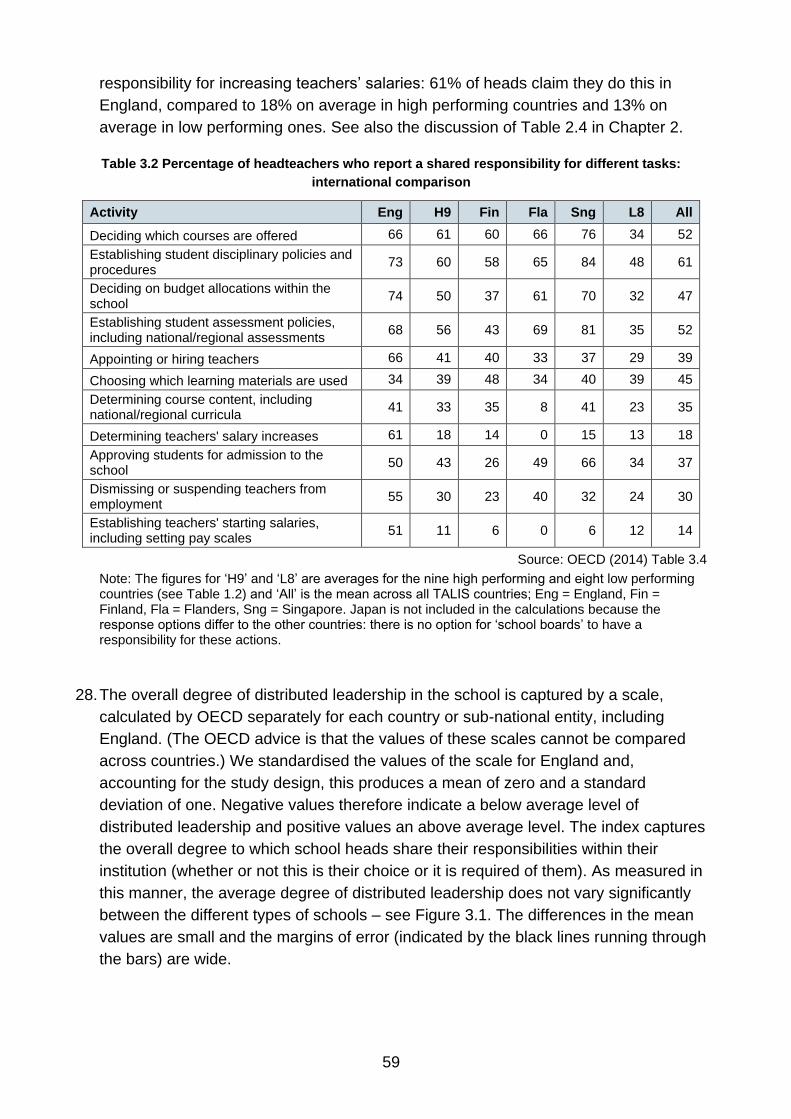
59
responsibility for increasing teachers’ salaries: 61% of heads claim they do this in
England, compared to 18% on average in high performing countries and 13% on
average in low performing ones. See also the discussion of Table 2.4 in Chapter 2.
Table 3.2 Percentage of headteachers who report a shared responsibility for different tasks:
international comparison
Activity Eng H9 Fin Fla Sng L8 All
Deciding which courses are offered 66 61 60 66 76 34 52
Establishing student disciplinary policies and procedures
73 60 58 65 84 48 61
Deciding on budget allocations within the school
74 50 37 61 70 32 47
Establishing student assessment policies, including national/regional assessments
68 56 43 69 81 35 52
Appointing or hiring teachers 66 41 40 33 37 29 39
Choosing which learning materials are used 34 39 48 34 40 39 45
Determining course content, including national/regional curricula
41 33 35 8 41 23 35
Determining teachers' salary increases 61 18 14 0 15 13 18
Approving students for admission to the school
50 43 26 49 66 34 37
Dismissing or suspending teachers from employment
55 30 23 40 32 24 30
Establishing teachers' starting salaries, including setting pay scales
51 11 6 0 6 12 14
Source: OECD (2014) Table 3.4
Note: The figures for ‘H9’ and ‘L8’ are averages for the nine high performing and eight low performing countries (see Table 1.2) and ‘All’ is the mean across all TALIS countries; Eng = England, Fin = Finland, Fla = Flanders, Sng = Singapore. Japan is not included in the calculations because the response options differ to the other countries: there is no option for ‘school boards’ to have a responsibility for these actions.
28. The overall degree of distributed leadership in the school is captured by a scale,
calculated by OECD separately for each country or sub-national entity, including
England. (The OECD advice is that the values of these scales cannot be compared
across countries.) We standardised the values of the scale for England and,
accounting for the study design, this produces a mean of zero and a standard
deviation of one. Negative values therefore indicate a below average level of
distributed leadership and positive values an above average level. The index captures
the overall degree to which school heads share their responsibilities within their
institution (whether or not this is their choice or it is required of them). As measured in
this manner, the average degree of distributed leadership does not vary significantly
between the different types of schools – see Figure 3.1. The differences in the mean
values are small and the margins of error (indicated by the black lines running through
the bars) are wide.
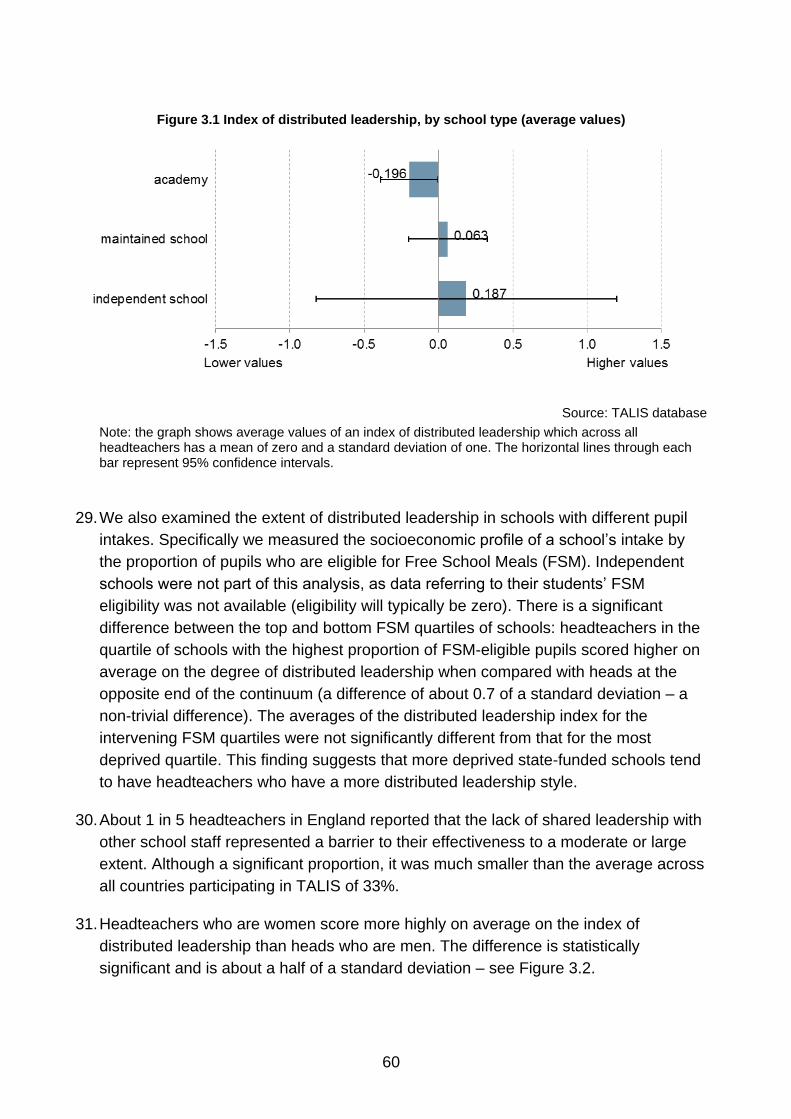
60
Figure 3.1 Index of distributed leadership, by school type (average values)
Source: TALIS database
Note: the graph shows average values of an index of distributed leadership which across all headteachers has a mean of zero and a standard deviation of one. The horizontal lines through each bar represent 95% confidence intervals.
29. We also examined the extent of distributed leadership in schools with different pupil
intakes. Specifically we measured the socioeconomic profile of a school’s intake by
the proportion of pupils who are eligible for Free School Meals (FSM). Independent
schools were not part of this analysis, as data referring to their students’ FSM
eligibility was not available (eligibility will typically be zero). There is a significant
difference between the top and bottom FSM quartiles of schools: headteachers in the
quartile of schools with the highest proportion of FSM-eligible pupils scored higher on
average on the degree of distributed leadership when compared with heads at the
opposite end of the continuum (a difference of about 0.7 of a standard deviation – a
non-trivial difference). The averages of the distributed leadership index for the
intervening FSM quartiles were not significantly different from that for the most
deprived quartile. This finding suggests that more deprived state-funded schools tend
to have headteachers who have a more distributed leadership style.
30. About 1 in 5 headteachers in England reported that the lack of shared leadership with
other school staff represented a barrier to their effectiveness to a moderate or large
extent. Although a significant proportion, it was much smaller than the average across
all countries participating in TALIS of 33%.
31. Headteachers who are women score more highly on average on the index of
distributed leadership than heads who are men. The difference is statistically
significant and is about a half of a standard deviation – see Figure 3.2.

61
Figure 3.2 Index of distributed leadership, by gender (average values)
Source: TALIS database
Note: the graph shows average values of an index of distributed leadership which across all headteachers has a mean of zero and a standard deviation of one. The horizontal lines through each bar represent 95% confidence intervals.
32. There is also an interesting pattern of distributed leadership in relation to the make-up
of the senior management team (SMT), whereby schools that have teachers on the
SMT have significantly higher levels of distributed leadership than those which do not
(with a difference of about 0.7 of a standard deviation). This is perhaps unsurprising
given that the principle of distributed leadership is that responsibility and leadership is
shared amongst staff. But it does provide corroborating evidence that when school
heads claim to be exercising distributed leadership this does translate into greater
teacher representation in management.
33. When asked about their SMTs, a very large proportion of headteachers in all types of
schools in England agree or strongly agree that they are being supported by an
effective SMT: 95% do so in maintained schools, 94% in academies and 85% in
independent schools, with no statistically significant differences.
34. The quality of schools, as determined by Ofsted, is another factor associated with the
level of distributed leadership in schools. There are significant differences across all
Ofsted rankings of schools in the degree of distributed leadership. ‘Outstanding’
schools have the highest level of distributed leadership, followed by schools judged
as ‘good’ or ‘satisfactory’ (each at a difference of 0.65 of a standard deviation from
outstanding schools), and ‘inadequate’ schools significantly lower than all other types
(at a difference of almost 1.5 standard deviations to outstanding schools – we note
again the small number of inadequate schools in the sample). This might of course be
tautological if Ofsted look for evidence of distributed leadership as one criterion
contributing to a better quality grade. The current Ofsted inspection framework does
not explicitly mention distributed leadership as a criterion for judgement, focusing

62
instead on leadership that aims to improve teaching, of all those in positions of
leadership in the school.50
Figure 3.3 Percentage of headteachers agreeing or strongly agreeing that they make important
decisions on their own: international comparison
Source: TALIS database
Note: The horizontal lines through each bar represent 95% confidence intervals.
35. At the opposite end of the spectrum to distributed leadership, TALIS asked
headteachers whether they agreed with the following statement:
‘I make the important decisions on my own’
Overall, 28% of heads in England ‘strongly disagreed’ that they did and a further 58%
‘disagreed’ – leaving only 1 in 7 (14%) agreeing or strongly agreeing with the
statement. When looking across school types, 12% of heads of academies and
50
Ofsted (2014).

63
maintained schools agreed or strongly agreed, compared to 22% in independent
schools. However, this difference between state-funded and independent schools is
not statistically significant, meaning it may be due to chance in the sampling process
for the survey. Nor are the differences in replies statistically significant across heads
classified by the level of schools’ Free School Meal eligibility or pupil outcomes at
either Key Stage 2 or Key Stage 4. We would therefore conclude that there are
insignificant differences across school types.
36. Across countries, headteachers’ responses to this question varied a great deal – see
Figure 3.3. At one extreme, only 5% of heads in Romania, 7% in Brazil, and 8% in
Portugal agreed or strongly agreed that they make the important decisions on their
own. At the other extreme, 79% in the Netherlands, 84% in Malaysia, and 95% in
Japan did so. The median value for the nine high performing countries is 34% (in
Korea), which is very close to the mean for all countries (35%) and well above the
figure of 14% in England noted above. Judged on responses to this one question
alone, England would seem to have a reasonably high degree of distributed
leadership by international standards: that is, a relatively low proportion of heads
saying they take the major decisions alone.51 At first sight, this might appear to
contrast with the evidence given in Chapter 2 that school autonomy in England is very
high by international standards. But the two findings are not necessarily incompatible:
heads who share their decision making may do so with structures and people within
the schools, for instance with their senior management teams or with teachers.
37. TALIS also collected information on the extent of instructional leadership by the
headteacher. This was measured by the frequency with which heads engaged in
activities geared towards the promotion of student learning by means of focusing on
quality teaching, developing school-wide cultures of learning for both students and
teachers (via professional development) and providing instructional feedback to
teachers. Heads were asked a series of questions relating to such activities. Table 3.3
compares answers given in England with those in other countries, showing the
percentage of heads who say they ‘often’ or ‘very often’ engage in different activities.
38. A large proportion of English heads engage in classroom observation: close to 80%.
This is well above the average for high performing countries (43%), although there is
great variation within the group as illustrated by the values for the four individual
countries in the table. The figure for England is also well above the average for all
countries in TALIS (49%), but is almost the same as the average for the low
performers. At the other extreme, only 18% of heads in England report often or very
often dealing with timetabling issues, higher than only Japan (at 9%) and much lower
than average both for all countries (46%) and the high performers (34%). Among the
latter, Finland is an outlier at 76%. The variation among the high performers illustrates
that heads in different countries choose to allocate their time in different ways. Heads
51
It is impossible to know whether cultural differences may affect responses, independently of the true situation.

64
in England, as in Japan, appear typically to leave solving problems with the timetable
to colleagues and spend their time on other matters.
Table 3.3 Percentage of headteachers who report engaging in different activities ‘often’ or ‘very
often’: international comparison
Activity Eng H9 Fin Fla Jpn Sng L8 All
Take action to ensure that teachers feel responsible for students' learning outcomes
83 68 44 57 33 91 91 76
Observe instruction in the classroom 78 43 11 21 67 59 77 49
Take action to ensure that teachers take responsibility for improving their teaching skills
75 62 40 42 39 84 85 69
Provide parents or guardians with information on the school and student performance
71 59 25 43 51 68 87 66
Take action to support co-operation among teachers to develop new teaching practices
61 54 57 37 34 66 82 64
Collaborate with headteachers from other schools
58 65 82 64 55 36 66 62
Check for mistakes and errors in school administrative procedures and reports
41 49 46 34 37 69 87 61
Collaborate with teachers to solve classroom discipline problems
40 54 70 54 33 64 83 68
Resolve problems with the lesson timetable in the school
18 34 76 34 9 33 71 47
Source: OECD (2014) Table 3.2
The figures for ‘H9’ and ‘L8’ are averages for the nine high performing and eight low performing countries (see Table 1.2) and ‘All’ is the mean across all TALIS countries. Eng = England, Fin = Finland, Fla = Flanders, Jpn = Japan, Sng = Singapore.
39. In addition to within-school collaboration and the distribution of leadership, in England
TALIS also asked headteachers to report on the extent to which they were involved in
school-level partnerships and collaboration. There are interesting differences as well
as similarities between the three types of schools present in the sample. Overall, 98%
of academy heads and 94% of maintained school heads reported working in
partnership with another school (by answering with ‘agree’ or ‘strongly agree’ to the
relevant questionnaire item); 78% of independent school heads provided the same
answers, a lower, but not statistically significantly different proportion. Mirroring this
were answers concerning whether school partnerships were a waste of time: none of
the questioned headteachers strongly agreed, but while only 2% of academy and 3%
of maintained school heads thought so, 15% of independent school headteachers
agreed that they were a waste of time.
40. When asked about whether partnerships are an important driver of their school’s
success, academy and maintained school headteachers agreed or strongly agreed in
69% and 75% of cases respectively, with only 51% of independent school heads
doing the same. Of the total, about a fifth of both academy and maintained school
heads strongly agreed.
41. Lastly on this issue, headteachers were asked whether schools which were failing
should be required to join an academy chain. Interestingly, the highest proportion of

65
headteachers who agreed came from independent schools (38%, though none
strongly agreed), while 24% of academies and 6% of maintained school headteachers
agreed or strongly agreed to the conversion to academy status (all differences
statistically significant).
42. On the whole, the results indicate a more negative perspective on school partnerships
by independent school headteachers and more positive views from academy and
maintained school heads, although the small sample of independent heads should
again be noted.
43. Similarly to distributed leadership, a scale was also constructed for instructional
leadership, based on items in Table 3.3. We again standardised this for England to
give a mean of zero and a standard deviation of one. (And again, the values of this
scale cannot be compared across countries.)
Figure 3.4 Index of instructional leadership, by school type (average values)
Source: TALIS database
Note: the graph shows average values of an index of instructional leadership which across all headteachers has a mean of zero and a standard deviation of one. The horizontal lines through each bar represent 95% confidence intervals.
44. The average level of instructional leadership by headteachers, as measured by the
standardised scale, does not vary significantly across different types of schools, nor
between schools with different proportions of students eligible for Free School Meals,
nor between schools with different Ofsted ratings – see Figure 3.4. Nor were there
differences in headteachers’ instructional leadership score if they had completed an
instructional leadership training programme as part of their formal education, nor if
they had achieved a postgraduate qualification in educational leadership or
management.

66
3.3 How do school heads spend their working time?
45. Workload is another key issue with respect to headteachers. TALIS collected data on
how headteachers divide their time (in their role as a headteacher) over the school
year, but not on the number of hours worked.52 (On the latter, see the results of the
Teachers’ Workload Diary survey for 2013 referred to in Chapter 2, which included a
sample of secondary school headteachers – heads reported an average of over 60
hours a week.)
46. On average, headteachers in England say they spend 43% of their time engaged in
administrative and leadership tasks and meetings, with little variation by the type of
school they are leading – see Table 3.4. This includes meetings on a series of issues,
ranging from human resourcing to budgeting, timetable preparation, as well as other
leadership and management activities.
Table 3.4 Headteachers’ allocation of working time (percentage of total), by school type
Activity academy maintained independent all
Administration/leadership 42 45 39 43
Teaching/curriculum 24 22 15 21
Student interactions 15 14 20 16
Parent interactions 9 9 13 10
Community interactions 6 7 5 6
Other 4 3 7 4
Total 100 100 100 100
Source: TALIS database
Note. figures may not sum to 100 due to rounding.
47. On average, a further 21% of heads’ time is reported as spent in meetings and
activities that relate to teaching and the curriculum, including the professional
development of teachers, observing classrooms or undertaking student evaluations.
Independent school heads dedicate significantly less time to such activities – about
15% of their time.
48. Headteachers also devote, on average, 16% of their time to student interactions and
a further 10% to interactions with parents and guardians. Heads of publicly-funded
schools are similar with regards to these activities, but headteachers of independent
schools report spending larger proportions of their time interacting with students
(20%) and parents and guardians (13%) – a third of their time throughout the year,
taking the two together, compared to about a quarter for heads of academies and
maintained schools.
52
The data are of unknown quality and the questionnaire notes that ‘rough estimates are sufficient’.

67
49. Interacting with the local and regional community, businesses and industry takes up a
further 6% of heads’ time, on average. Headteachers in schools with a high proportion
of children eligible for Free School Meals spend the most time in this type of activity
(up to 8% of their time).
50. Importantly, the pupil intake of the school, as measured by Key Stage 2 test scores,
and the performance of the school, as measured by Key Stage 4 scores, does not
vary systematically with how headteachers spend their time – there is no simple
association between either pupil intake or school performance and the heads’ work
patterns.
Figure 3.5 Percentage of headteachers’ time spent on (i) curriculum and teaching-related tasks and
(ii) administrative and leadership tasks: international comparison
Source: OECD (2014) Table 3.1
Note: The nine high performing countries and the eight low performing countries (see Table 1.2) are indicated by solid diamonds and open triangles respectively.
51. The average division of working time in England closely matches the average across
all TALIS countries, as well as that in specific countries (such as Singapore, France,
and Norway). Figure 3.5 plots the average percentages of time that heads report
spending on the two most time-consuming activities: ‘curriculum and teaching-related
tasks and meetings’ (on the vertical axis) and ‘administrative and leadership tasks
and meetings’ (on the horizontal axis). For the former, the figures for the nine high-
performing countries range from 35% in Japan and 36% in Korea to 54% in the
Netherlands. The relationship between the two sets of figures slopes downwards –
more time spent on one tends to mean less on the other.

68
3.4 What issues do heads view as barriers to their effectiveness?
52. There are several aspects of the school environment and features of the job which
headteachers report constituting barriers to their effectiveness ‘to some extent’ or ‘a
lot’:
- 79% cite government regulation and policy as a barrier;
- 78% highlight inadequate school budget and resources;
- 68% indicate that their high workload and level of responsibilities is a problem.
- 49% view teachers’ absences as a barrier to their effectiveness.
Figure 3.6 shows how heads’ views in England compare with those in other countries
on the first two of these issues: government regulation and policy (on the vertical axis)
and an inadequate school budget and resources (on the horizontal axis). The figures
refer again to the percentages giving the answer ‘to some extent’ or ‘a lot’.
53. Concern about government regulation as a barrier to effectiveness is higher among
headteachers in England than among heads in a substantial number of other
countries. On average, 69% of headteachers in TALIS countries report that
government regulations represent an important limitation to their effectiveness: 10
percentage points less than in England.53 Countries with higher percentages than
England include four of the group of nine high performing countries – Estonia,
Flanders, Korea and the Netherlands – but the general pattern is that high performers
are found everywhere in the diagram (solid diamond symbols). By contrast, the figure
in England for concern about the school budget and resources is very close to the
average for all countries (80%). The two high performers at the bottom of the graph
with relatively low levels of concern about government action are Singapore on the
left, where there is also much less concern about resources, and Finland on the right.
54. 68% of headteachers in England report that the high workload their job entails,
together with its responsibilities, represents a moderate or strong barrier to their
effectiveness. This mirrors international evidence: on average, across all TALIS
countries, 72% of heads noted this same issue.
55. There is no difference in England between headteachers of maintained schools,
academies, and independent schools with regards to how strongly they feel their
workload and level of responsibilities impact on their effectiveness. But while only
39% of heads of independent schools feel that government regulations and policy are
a barrier (either ‘to some extent’ or ‘a lot’), 85% of academy heads and 95% of
maintained school heads report this.
53
The difference between the figure for England and those for countries with lower values is statistically significant at the 5% level in 10 cases.
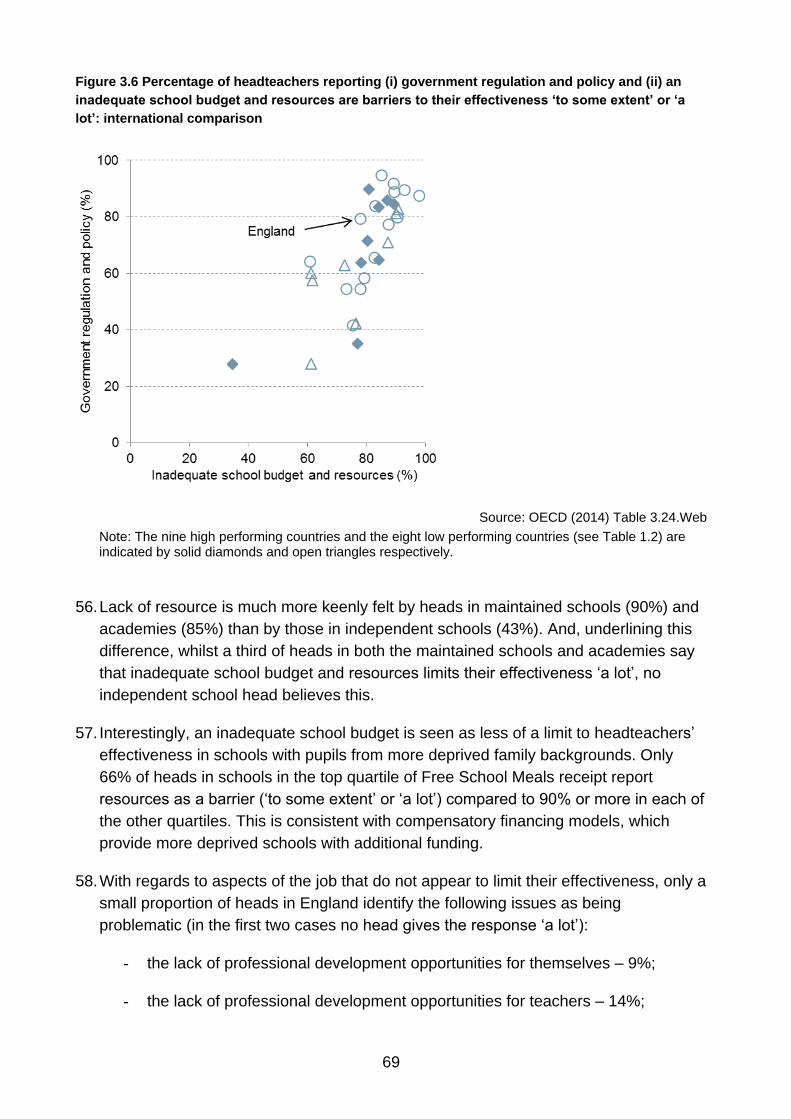
69
Figure 3.6 Percentage of headteachers reporting (i) government regulation and policy and (ii) an
inadequate school budget and resources are barriers to their effectiveness ‘to some extent’ or ‘a
lot’: international comparison
Source: OECD (2014) Table 3.24.Web
Note: The nine high performing countries and the eight low performing countries (see Table 1.2) are indicated by solid diamonds and open triangles respectively.
56. Lack of resource is much more keenly felt by heads in maintained schools (90%) and
academies (85%) than by those in independent schools (43%). And, underlining this
difference, whilst a third of heads in both the maintained schools and academies say
that inadequate school budget and resources limits their effectiveness ‘a lot’, no
independent school head believes this.
57. Interestingly, an inadequate school budget is seen as less of a limit to headteachers’
effectiveness in schools with pupils from more deprived family backgrounds. Only
66% of heads in schools in the top quartile of Free School Meals receipt report
resources as a barrier (‘to some extent’ or ‘a lot’) compared to 90% or more in each of
the other quartiles. This is consistent with compensatory financing models, which
provide more deprived schools with additional funding.
58. With regards to aspects of the job that do not appear to limit their effectiveness, only a
small proportion of heads in England identify the following issues as being
problematic (in the first two cases no head gives the response ‘a lot’):
- the lack of professional development opportunities for themselves – 9%;
- the lack of professional development opportunities for teachers – 14%;

70
- the lack of shared leadership with other school staff members – 18%.
59. Professional development opportunities appear to have been addressed in England to
a much greater extent than in other countries participating in TALIS. With respect to
headteachers’ own professional development, on average 30% of heads in all TALIS
countries report the lack of such opportunities as problematic, far more than the 9% in
England. Similarly, heads’ responses also highlight that teachers’ professional
development is a significantly less acute issue in England than elsewhere, with 42%
of heads on average seeing it as a barrier to their effectiveness, compared to the 14%
in England. Chapter 4 considers the information on professional development
reported by teachers in TALIS and gives a consistent picture.
60. Focusing on heads’ views in England about limitations to their school’s capacity to
provide quality instruction, they report the following issues as being particularly
problematic (see also the discussion of staff resources in Chapter 2):
- 43% report that the shortage of qualified staff or high performing teachers
affects their school to some extent or a lot;
- 26% report that the shortage of teachers with competence in teaching students
with special needs has this effect.
61. There are potential barriers to their effectiveness that headteachers view as important
in England but that are not seen as important by heads in other TALIS countries, and
vice versa.
- Teacher absences are seen as a barrier by 49% of heads in England but on
average by only 37% of headteachers in all TALIS countries;
- The lack of parent or guardian involvement and support is reported as
problematic by 38% of heads in England but on average across all countries by
50% of heads.
3.5 How satisfied are headteachers with their jobs?
62. Headteachers were asked their opinions on nine statements aimed at soliciting their
views on how they felt about their jobs. Figure 3.7 compares responses for two of
them across all countries in TALIS, plotting the percentages strongly agreeing with
the statements ‘All in all, I am satisfied with my job’ (on the horizontal axis) and ‘I think
the teaching profession is valued in society’ (on the vertical axis). (Exceptionally, we
scale the axes differently, the horizontal axis running from 50-100% and the vertical
axis from 0-100%.)

71
Figure 3.7 Percentage of headteachers agreeing or strongly agreeing that (i) ‘the teaching
profession is valued in society’ and (ii) ‘I am satisfied with my job’: international comparison
Source: OECD (2014) Table 3.26.Web
Note: The nine high performing countries and the eight low performing countries (see Table 1.2) are indicated by solid diamonds and open triangles respectively.
63. Almost all headteachers in England (94%) agreed or strongly agreed that they were
satisfied with their job. The figure for England is very close to the average for all
countries (95%). In fact there is little variation – the lowest figure is as high as 89%
(for Italy).
64. There is a lot more variation between countries in the percentage of headteachers
believing that society values the teaching profession as measured by agreement or
strong agreement with the statement given above. The average across all countries is
44%, with 60% of heads in England responding in that manner.54 The highest figure
reported is for Singapore (95%). At the other end of the spectrum, only 2% of
headteachers in the Slovak Republic agreed or strongly agreed that society values
the teaching profession (the high performer at the bottom of the graph, on 12%, is
Estonia). In Chapter 6 we compare the responses given by teachers to the same
54
In no country did the majority of heads strongly agree that the teaching profession is valued, although 49% of heads in Korea and 39% in Singapore did so. The figure for England is 7%.
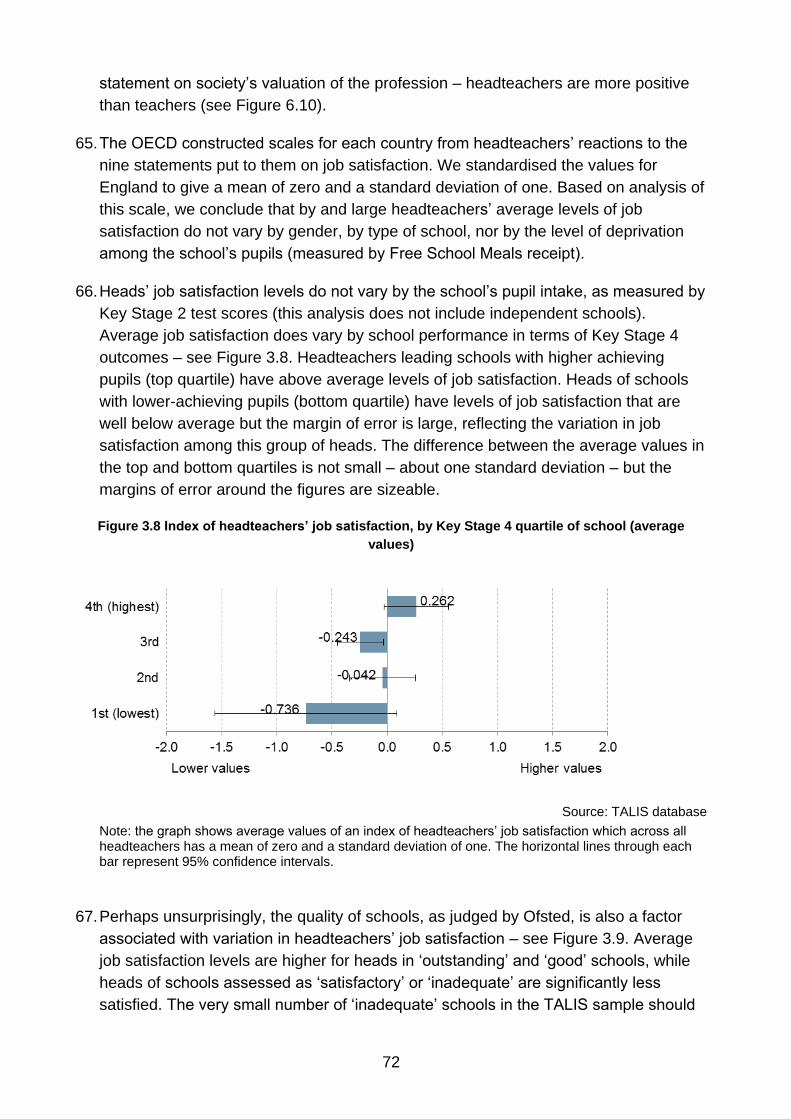
72
statement on society’s valuation of the profession – headteachers are more positive
than teachers (see Figure 6.10).
65. The OECD constructed scales for each country from headteachers’ reactions to the
nine statements put to them on job satisfaction. We standardised the values for
England to give a mean of zero and a standard deviation of one. Based on analysis of
this scale, we conclude that by and large headteachers’ average levels of job
satisfaction do not vary by gender, by type of school, nor by the level of deprivation
among the school’s pupils (measured by Free School Meals receipt).
66. Heads’ job satisfaction levels do not vary by the school’s pupil intake, as measured by
Key Stage 2 test scores (this analysis does not include independent schools).
Average job satisfaction does vary by school performance in terms of Key Stage 4
outcomes – see Figure 3.8. Headteachers leading schools with higher achieving
pupils (top quartile) have above average levels of job satisfaction. Heads of schools
with lower-achieving pupils (bottom quartile) have levels of job satisfaction that are
well below average but the margin of error is large, reflecting the variation in job
satisfaction among this group of heads. The difference between the average values in
the top and bottom quartiles is not small – about one standard deviation – but the
margins of error around the figures are sizeable.
Figure 3.8 Index of headteachers’ job satisfaction, by Key Stage 4 quartile of school (average
values)
Source: TALIS database
Note: the graph shows average values of an index of headteachers’ job satisfaction which across all headteachers has a mean of zero and a standard deviation of one. The horizontal lines through each bar represent 95% confidence intervals.
67. Perhaps unsurprisingly, the quality of schools, as judged by Ofsted, is also a factor
associated with variation in headteachers’ job satisfaction – see Figure 3.9. Average
job satisfaction levels are higher for heads in ‘outstanding’ and ‘good’ schools, while
heads of schools assessed as ‘satisfactory’ or ‘inadequate’ are significantly less
satisfied. The very small number of ‘inadequate’ schools in the TALIS sample should

73
however be noted and the margins of error for the average satisfaction levels are
large for both these and the ‘satisfactory’ schools.
Figure 3.9 Index of headteachers’ job satisfaction, by Ofsted rating of school (average values)
Source: TALIS database
Note: the graph shows average values of an index of headteachers’ job satisfaction which across all headteachers has a mean of zero and a standard deviation of one. The horizontal lines through each bar represent 95% confidence intervals.
68. In England (only), headteachers were also asked to report on a series of issues that
may have an impact on how they feel about their profession. Table 3.5 shows the
percentage of heads who responded with ‘agree’ or ‘strongly agree’ to each of 18
statements put to them. In terms of issues which are potentially problematic, the
heads’ views on teacher turnover are the most striking: only 6% of headteachers
agree or strongly agree that it is very high in their school. Concerns about lack of
autonomy are expressed by only about a fifth of heads, consistent with the picture of
high school autonomy that emerges in Chapter 2.
69. A half of heads think that headteachers are underpaid compared to leaders in other
professions, but 70% think their own pay is fair given their performance. Chapter 6
reports on teacher responses in England to analogous statements – a notably higher
percentage of teachers think that teachers are underpaid as a profession and a
notably lower percentage of them think their own pay is fair given their performance.
70. Almost all heads state that parents are supportive of their leadership and staff and all
of them report that teachers are supportive of their leadership. Alongside the fact that
heads say they are supported by an effective school management team (96%), these
results appear to be suggestive of a very supportive working environment for
headteachers.
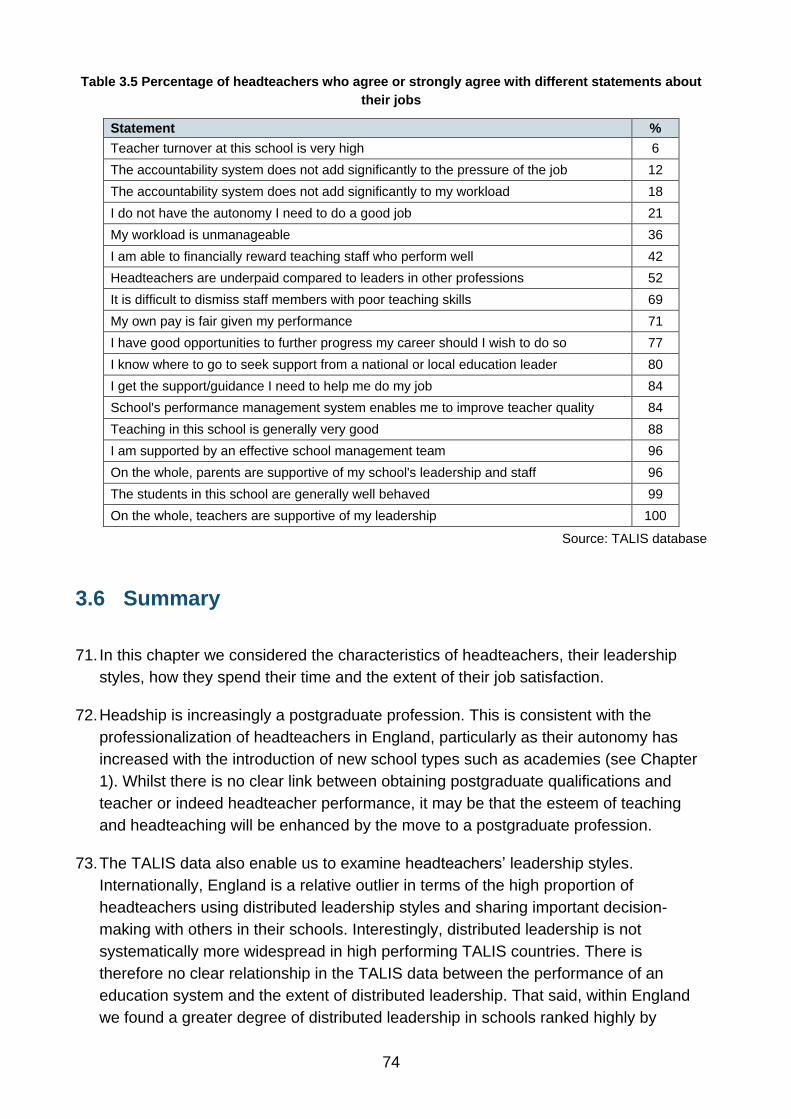
74
Table 3.5 Percentage of headteachers who agree or strongly agree with different statements about
their jobs
Statement %
Teacher turnover at this school is very high 6
The accountability system does not add significantly to the pressure of the job 12
The accountability system does not add significantly to my workload 18
I do not have the autonomy I need to do a good job 21
My workload is unmanageable 36
I am able to financially reward teaching staff who perform well 42
Headteachers are underpaid compared to leaders in other professions 52
It is difficult to dismiss staff members with poor teaching skills 69
My own pay is fair given my performance 71
I have good opportunities to further progress my career should I wish to do so 77
I know where to go to seek support from a national or local education leader 80
I get the support/guidance I need to help me do my job 84
School's performance management system enables me to improve teacher quality 84
Teaching in this school is generally very good 88
I am supported by an effective school management team 96
On the whole, parents are supportive of my school's leadership and staff 96
The students in this school are generally well behaved 99
On the whole, teachers are supportive of my leadership 100
Source: TALIS database
3.6 Summary
71. In this chapter we considered the characteristics of headteachers, their leadership
styles, how they spend their time and the extent of their job satisfaction.
72. Headship is increasingly a postgraduate profession. This is consistent with the
professionalization of headteachers in England, particularly as their autonomy has
increased with the introduction of new school types such as academies (see Chapter
1). Whilst there is no clear link between obtaining postgraduate qualifications and
teacher or indeed headteacher performance, it may be that the esteem of teaching
and headteaching will be enhanced by the move to a postgraduate profession.
73. The TALIS data also enable us to examine headteachers’ leadership styles.
Internationally, England is a relative outlier in terms of the high proportion of
headteachers using distributed leadership styles and sharing important decision-
making with others in their schools. Interestingly, distributed leadership is not
systematically more widespread in high performing TALIS countries. There is
therefore no clear relationship in the TALIS data between the performance of an
education system and the extent of distributed leadership. That said, within England
we found a greater degree of distributed leadership in schools ranked highly by

75
Ofsted. This may of course be because Ofsted are looking for evidence of distributed
leadership and rank schools that exhibit it more highly.
74. We also found that headteachers in more deprived schools have higher levels of
distributed leadership and, perhaps surprisingly, are less likely to find a lack of
resources to be a barrier to their effectiveness. Both these findings may reflect the
large investment that has been made during recent decades in the more deprived
urban schools in England. This investment may have resulted not only in fewer
resource constraints for deprived schools but also making such schools attractive to
effective headteachers who are more likely to have a distributed leadership style.
75. In terms of what headteachers actually do, average working patterns in England as
regards division of time across different activities are very similar to the average for all
TALIS countries. And there is little variation in average patterns across types of
school within England. England stands out, however, in terms of the barriers to
effectiveness which headteachers identify, with government regulation emerging as
an important one, significantly more so than in a range of other countries. This finding
may appear contradictory. English headteachers clearly have more autonomy than
heads in many other countries and yet they also are more likely to identify excessive
government regulation as a barrier. This may be because England has adopted a
quasi-market approach with increased autonomy and competition between schools
alongside a relatively high degree of regulation (for example from Ofsted) to temper
any negative impacts from the market. The effect may produce the results we see in
the data.
76. Lastly, headteachers’ job satisfaction levels in England are related to school
performance, although the relationship is not that strong.
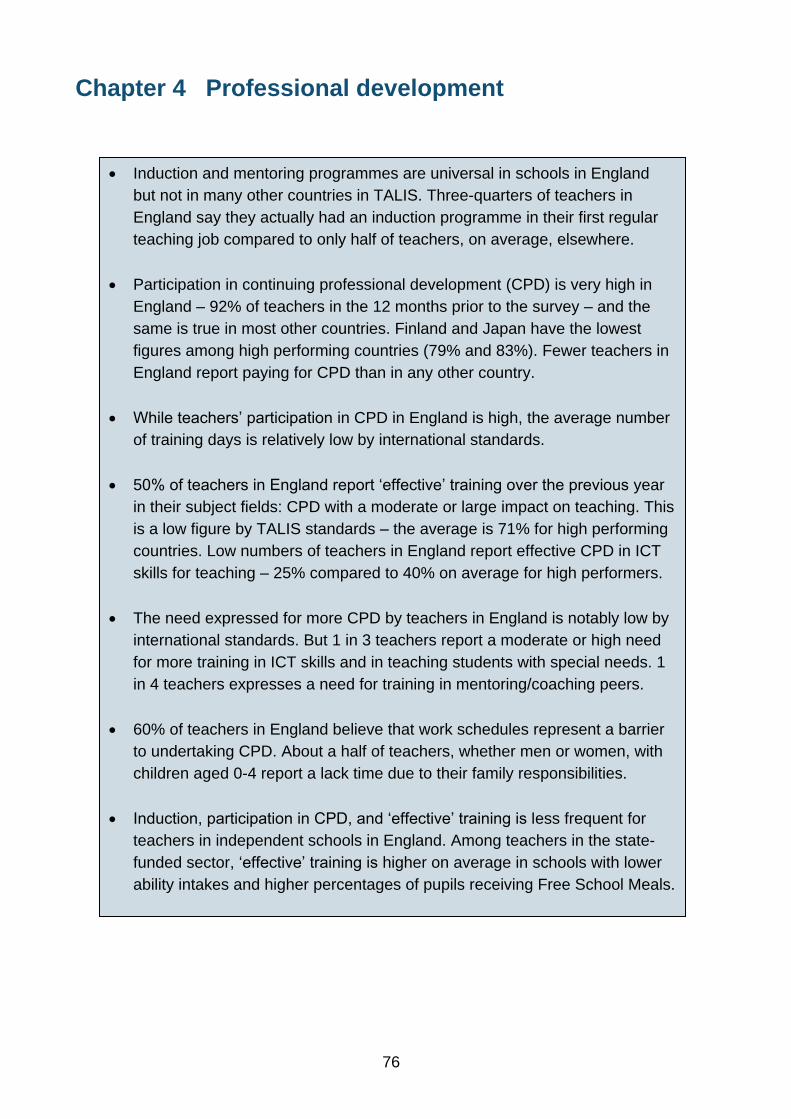
76
Chapter 4 Professional development
Induction and mentoring programmes are universal in schools in England
but not in many other countries in TALIS. Three-quarters of teachers in
England say they actually had an induction programme in their first regular
teaching job compared to only half of teachers, on average, elsewhere.
Participation in continuing professional development (CPD) is very high in
England – 92% of teachers in the 12 months prior to the survey – and the
same is true in most other countries. Finland and Japan have the lowest
figures among high performing countries (79% and 83%). Fewer teachers in
England report paying for CPD than in any other country.
While teachers’ participation in CPD in England is high, the average number
of training days is relatively low by international standards.
50% of teachers in England report ‘effective’ training over the previous year
in their subject fields: CPD with a moderate or large impact on teaching. This
is a low figure by TALIS standards – the average is 71% for high performing
countries. Low numbers of teachers in England report effective CPD in ICT
skills for teaching – 25% compared to 40% on average for high performers.
The need expressed for more CPD by teachers in England is notably low by
international standards. But 1 in 3 teachers report a moderate or high need
for more training in ICT skills and in teaching students with special needs. 1
in 4 teachers expresses a need for training in mentoring/coaching peers.
60% of teachers in England believe that work schedules represent a barrier
to undertaking CPD. About a half of teachers, whether men or women, with
children aged 0-4 report a lack time due to their family responsibilities.
Induction, participation in CPD, and ‘effective’ training is less frequent for
teachers in independent schools in England. Among teachers in the state-
funded sector, ‘effective’ training is higher on average in schools with lower
ability intakes and higher percentages of pupils receiving Free School Meals.
77
1. This chapter investigates the continuing professional development (CPD) undertaken
by teachers and some of the support that is offered by schools to help teachers
further their skills. These matters have received considerable attention in England
from both policy makers and researchers in the last 10-15 years and there is a range
of existing survey evidence on teachers’ professional development.55 TALIS provides
the international dimension, allowing the situation to be compared with that in other
countries. The content of the TALIS questionnaire also means that the survey
provides new evidence on several issues for England.
2. We address five questions:
Are induction and mentoring programmes universal?
How much (and what) CPD is undertaken by teachers?
Is the CPD undertaken seen by teachers as effective?
Do teachers perceive much need for more CPD?
What are seen as the barriers to more training?
The chapter does not consider the CPD of headteachers, which was covered briefly in
Chapter 3.
4.1 Are induction and mentoring programmes universal?
3. For induction, the answer to this question for England is a clear ‘yes’: Table 4.1 shows
that 99% of teachers work in schools where the head reports that there is an induction
programme, either for all new teachers to the school (which is almost always the case
in England) or just for teachers who are new to teaching. In part, this situation reflects
the legal requirement that ‘statutory induction’ for teachers takes place in Local
Authority maintained schools. By contrast, near universal provision is far from being
the case in many other countries. On average across all countries in TALIS, 1 in 3
teachers is not in a school where there is an induction programme.
4. Induction is the initial step in developing staff when they join a school, especially
newly trained staff. The universal provision in England reported by heads does not
mean that all teachers in TALIS report actually having taken part in an induction
programme. The second row in Table 4.1 shows that three-quarters of teachers in
England say they had an induction programme in their first regular employment as a
teacher, compared to about a half on average in other countries.
55
For example, see the sample surveys of primary and secondary school teachers and leaders reported on in Opfer et al. (2008), Opfer and Pedder (2011), Pedder et al. (2010) and various NFER Teacher Voice Omnibus survey reports (including those for June 2009 and February 2011).
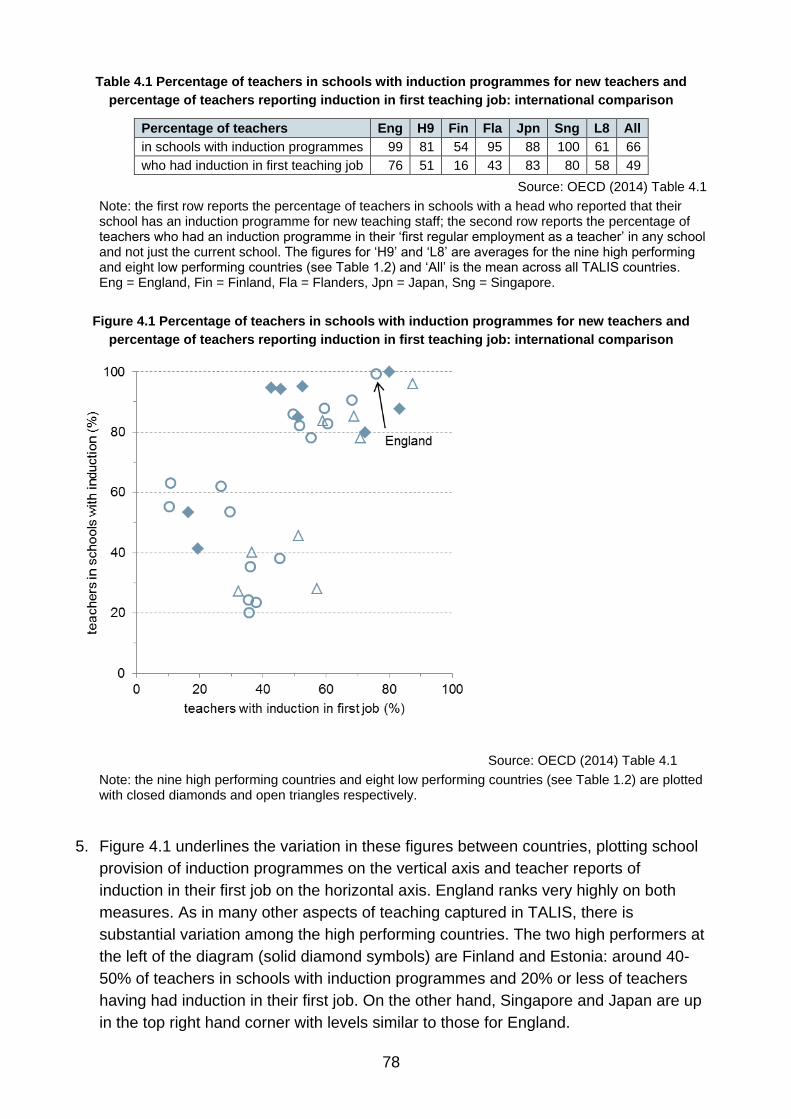
78
Table 4.1 Percentage of teachers in schools with induction programmes for new teachers and
percentage of teachers reporting induction in first teaching job: international comparison
Percentage of teachers Eng H9 Fin Fla Jpn Sng L8 All
in schools with induction programmes 99 81 54 95 88 100 61 66
who had induction in first teaching job 76 51 16 43 83 80 58 49
Source: OECD (2014) Table 4.1
Note: the first row reports the percentage of teachers in schools with a head who reported that their school has an induction programme for new teaching staff; the second row reports the percentage of teachers who had an induction programme in their ‘first regular employment as a teacher’ in any school and not just the current school. The figures for ‘H9’ and ‘L8’ are averages for the nine high performing and eight low performing countries (see Table 1.2) and ‘All’ is the mean across all TALIS countries. Eng = England, Fin = Finland, Fla = Flanders, Jpn = Japan, Sng = Singapore.
Figure 4.1 Percentage of teachers in schools with induction programmes for new teachers and
percentage of teachers reporting induction in first teaching job: international comparison
Source: OECD (2014) Table 4.1
Note: the nine high performing countries and eight low performing countries (see Table 1.2) are plotted with closed diamonds and open triangles respectively.
5. Figure 4.1 underlines the variation in these figures between countries, plotting school
provision of induction programmes on the vertical axis and teacher reports of
induction in their first job on the horizontal axis. England ranks very highly on both
measures. As in many other aspects of teaching captured in TALIS, there is
substantial variation among the high performing countries. The two high performers at
the left of the diagram (solid diamond symbols) are Finland and Estonia: around 40-
50% of teachers in schools with induction programmes and 20% or less of teachers
having had induction in their first job. On the other hand, Singapore and Japan are up
in the top right hand corner with levels similar to those for England.
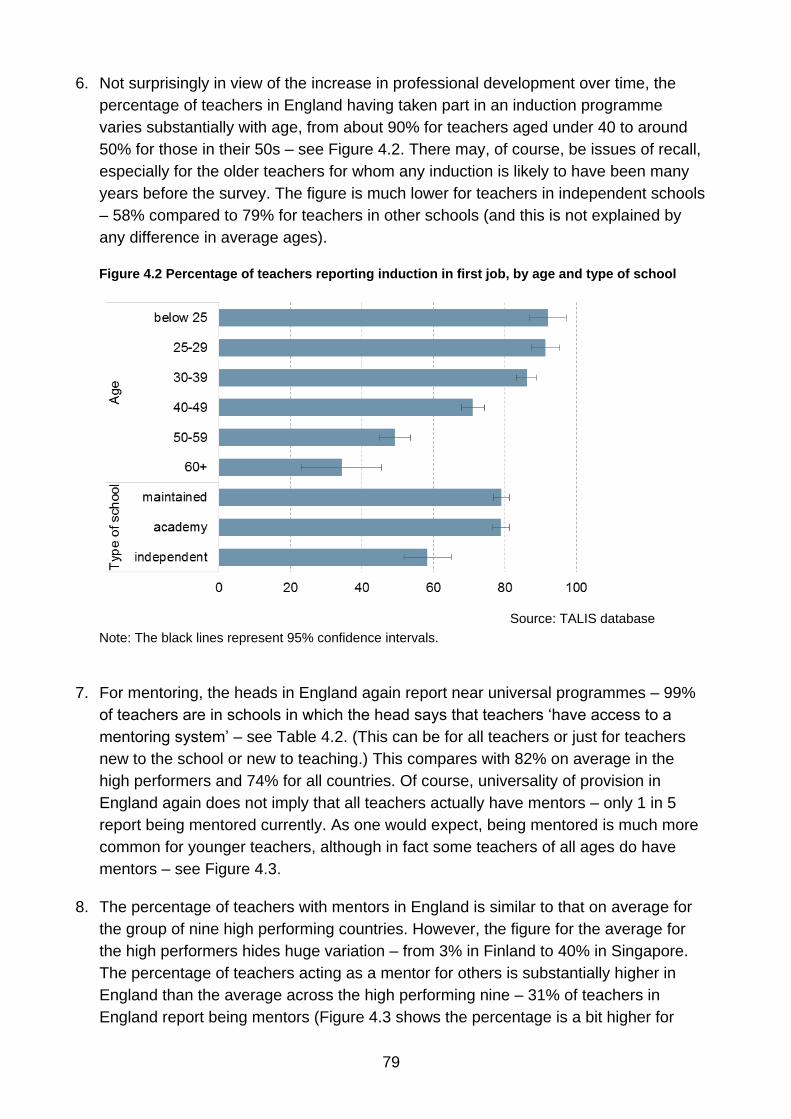
79
6. Not surprisingly in view of the increase in professional development over time, the
percentage of teachers in England having taken part in an induction programme
varies substantially with age, from about 90% for teachers aged under 40 to around
50% for those in their 50s – see Figure 4.2. There may, of course, be issues of recall,
especially for the older teachers for whom any induction is likely to have been many
years before the survey. The figure is much lower for teachers in independent schools
– 58% compared to 79% for teachers in other schools (and this is not explained by
any difference in average ages).
Figure 4.2 Percentage of teachers reporting induction in first job, by age and type of school
Source: TALIS database
Note: The black lines represent 95% confidence intervals.
7. For mentoring, the heads in England again report near universal programmes – 99%
of teachers are in schools in which the head says that teachers ‘have access to a
mentoring system’ – see Table 4.2. (This can be for all teachers or just for teachers
new to the school or new to teaching.) This compares with 82% on average in the
high performers and 74% for all countries. Of course, universality of provision in
England again does not imply that all teachers actually have mentors – only 1 in 5
report being mentored currently. As one would expect, being mentored is much more
common for younger teachers, although in fact some teachers of all ages do have
mentors – see Figure 4.3.
8. The percentage of teachers with mentors in England is similar to that on average for
the group of nine high performing countries. However, the figure for the average for
the high performers hides huge variation – from 3% in Finland to 40% in Singapore.
The percentage of teachers acting as a mentor for others is substantially higher in
England than the average across the high performing nine – 31% of teachers in
England report being mentors (Figure 4.3 shows the percentage is a bit higher for
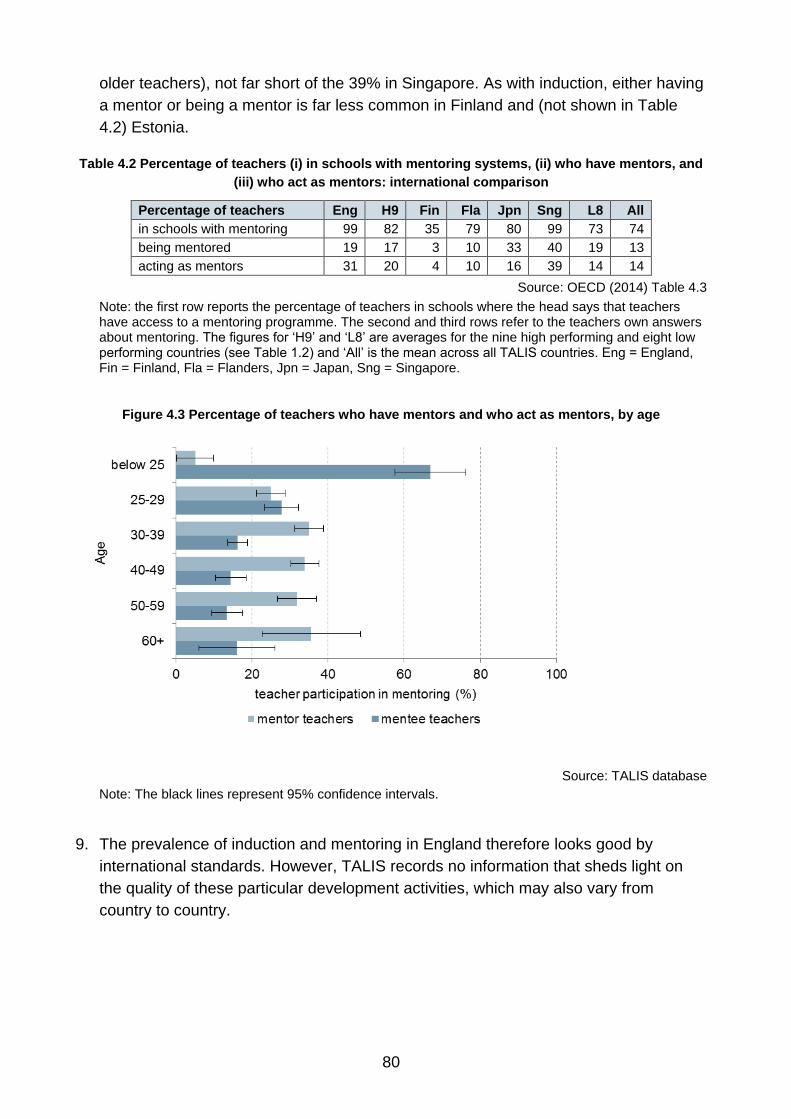
80
older teachers), not far short of the 39% in Singapore. As with induction, either having
a mentor or being a mentor is far less common in Finland and (not shown in Table
4.2) Estonia.
Table 4.2 Percentage of teachers (i) in schools with mentoring systems, (ii) who have mentors, and
(iii) who act as mentors: international comparison
Percentage of teachers Eng H9 Fin Fla Jpn Sng L8 All
in schools with mentoring 99 82 35 79 80 99 73 74
being mentored 19 17 3 10 33 40 19 13
acting as mentors 31 20 4 10 16 39 14 14
Source: OECD (2014) Table 4.3
Note: the first row reports the percentage of teachers in schools where the head says that teachers have access to a mentoring programme. The second and third rows refer to the teachers own answers about mentoring. The figures for ‘H9’ and ‘L8’ are averages for the nine high performing and eight low performing countries (see Table 1.2) and ‘All’ is the mean across all TALIS countries. Eng = England, Fin = Finland, Fla = Flanders, Jpn = Japan, Sng = Singapore.
Figure 4.3 Percentage of teachers who have mentors and who act as mentors, by age
Source: TALIS database
Note: The black lines represent 95% confidence intervals.
9. The prevalence of induction and mentoring in England therefore looks good by
international standards. However, TALIS records no information that sheds light on
the quality of these particular development activities, which may also vary from
country to country.
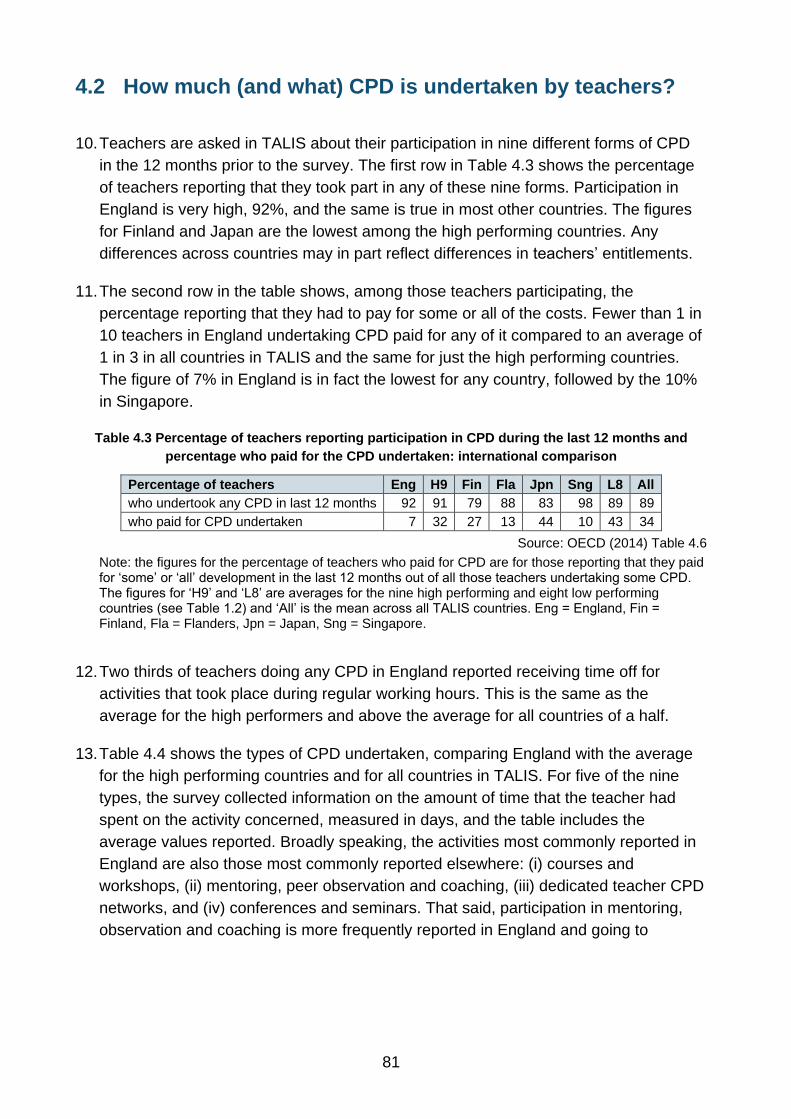
81
4.2 How much (and what) CPD is undertaken by teachers?
10. Teachers are asked in TALIS about their participation in nine different forms of CPD
in the 12 months prior to the survey. The first row in Table 4.3 shows the percentage
of teachers reporting that they took part in any of these nine forms. Participation in
England is very high, 92%, and the same is true in most other countries. The figures
for Finland and Japan are the lowest among the high performing countries. Any
differences across countries may in part reflect differences in teachers’ entitlements.
11. The second row in the table shows, among those teachers participating, the
percentage reporting that they had to pay for some or all of the costs. Fewer than 1 in
10 teachers in England undertaking CPD paid for any of it compared to an average of
1 in 3 in all countries in TALIS and the same for just the high performing countries.
The figure of 7% in England is in fact the lowest for any country, followed by the 10%
in Singapore.
Table 4.3 Percentage of teachers reporting participation in CPD during the last 12 months and
percentage who paid for the CPD undertaken: international comparison
Percentage of teachers Eng H9 Fin Fla Jpn Sng L8 All
who undertook any CPD in last 12 months 92 91 79 88 83 98 89 89
who paid for CPD undertaken 7 32 27 13 44 10 43 34
Source: OECD (2014) Table 4.6
Note: the figures for the percentage of teachers who paid for CPD are for those reporting that they paid for ‘some’ or ‘all’ development in the last 12 months out of all those teachers undertaking some CPD. The figures for ‘H9’ and ‘L8’ are averages for the nine high performing and eight low performing countries (see Table 1.2) and ‘All’ is the mean across all TALIS countries. Eng = England, Fin = Finland, Fla = Flanders, Jpn = Japan, Sng = Singapore.
12. Two thirds of teachers doing any CPD in England reported receiving time off for
activities that took place during regular working hours. This is the same as the
average for the high performers and above the average for all countries of a half.
13. Table 4.4 shows the types of CPD undertaken, comparing England with the average
for the high performing countries and for all countries in TALIS. For five of the nine
types, the survey collected information on the amount of time that the teacher had
spent on the activity concerned, measured in days, and the table includes the
average values reported. Broadly speaking, the activities most commonly reported in
England are also those most commonly reported elsewhere: (i) courses and
workshops, (ii) mentoring, peer observation and coaching, (iii) dedicated teacher CPD
networks, and (iv) conferences and seminars. That said, participation in mentoring,
observation and coaching is more frequently reported in England and going to

82
conferences and seminars reported less frequently.56 The average time spent in most
of the five activities for which the information was collected is lower in England.
14. The probability of doing any CPD in the previous 12 months is slightly lower for
teachers in independent schools in England – 88% compared to 93% for teachers in
other schools. (There are no differences by Ofsted rating.) The differences by type of
school are most notable for taking part in dedicated teacher CPD networks (23% in
independent schools, 35% in other schools) and mentoring, observation and coaching
(48% compared to 59%).
Table 4.4 Percentage of teachers reporting participation in different types of CPD and average total
time spent in each activity: international comparison
Type of CPD % participation average days
Eng H9 All Eng H9 All
Courses/workshops 75 78 71 3.0 6.5 8.5
Mentoring and/or peer observation and coaching 57 33 29
Teacher networks 33 41 37
Conferences/seminars 29 50 44 2.0 3.1 3.7
Individual or collaborative research 27 33 31
In-service training courses in other organisations 22 16 14 3.1 4.6 7.0
Observation visits to other schools 20 24 19 2.3 2.2 3.0
Qualification programme (e.g. a degree) 10 14 18
Observation visits to other organisations 7 13 13 1.8 2.3 3.1
Source: OECD (2014) Table 4.9.Web
Note: courses/workshops are ‘e.g. on subject matter or methods’; ‘conferences/seminars’ are ‘where teachers and/or researchers present their research results and discuss educational issues’; teacher networks are specifically for the purpose of CPD; observation visits to other organisations are to businesses, public organisations or NGOs. The figures for ‘H9’ are averages for the nine high performing countries (see Table 1.2) and ‘All’ is the mean across all TALIS countries.
15. We can summarise crudely the amount of CPD undertaken by each teacher in
England by counting the number of different types of activity reported from the list of
nine types in Table 4.4. Not surprisingly, given the differences in particular activities
we have just noted, the average is lower for teachers in independent schools than in
state-funded schools: 2.4 compared to 2.9. The average also falls with age. Teachers
under the age of 25 report an average of 3.2 types and those aged 25-29 report 3.0.
The figure drops to just under 2.5 for those aged 50-59.
4.3 Is the CPD undertaken seen by teachers as effective?
16. The next question is whether the CPD that teachers do undertake is seen by them as
having a positive impact on their teaching. For those teachers who report having had
56
The question on mentoring, peer observation or coaching is ambiguous as to whether e.g. the mentoring is only of others or whether being mentored should also be included. The lack of much variation with age in the percentage of teachers reporting this form of CPD suggests that both are reported.

83
any CPD in the 12 months before the survey – the great majority in England – Table
4.5 shows the percentage who indicate that the training or other activity had a
moderate or large impact. The table distinguishes 14 different topics. When a teacher
indicated that a topic was covered and that it had a moderate or large impact on their
teaching, we refer to this as ‘effective’ training in the topic concerned.
17. Half of teachers in England report effective training in their subject field(s) and in
student evaluation or assessment – the two areas at the top of the table. The figure
falls to less than 10% for the activities in the last three rows. The percentage of
teachers reporting effective training in the other nine areas ranges between 20% and
45%.
Table 4.5 Percentage of teachers who undertook any CPD in the last 12 months who report a
moderate or large impact on their teaching, by topic covered: international comparison
Topic covered Eng H9 Fin Fla Jpn Sng L8 All
1. Knowledge/understanding of subject field(s) 50 71 64 67 79 79 73 66
2. Student evaluation/assessment 50 42 18 32 45 59 63 47
3. Pedagogical competencies in teaching subject field
45 59 42 52 77 74 69 59
4. Knowledge of the curriculum 42 49 18 49 35 69 59 47
5. Approaches to individual learning 37 33 27 17 40 29 44 33
6. Teaching cross-curricular skills 26 29 16 21 44 27 46 31
7. Teaching students with special needs 26 28 23 20 37 16 23 25
8. ICT skills for teaching 25 40 32 30 25 49 52 44
9. Student behaviour/classroom management 24 34 21 24 36 36 52 35
10. New technologies in the workplace 20 27 27 11 10 27 40 31
11. School management and administration 20 14 6 7 17 24 25 14
12. Teaching in multicultural/lingual settings 8 12 9 7 7 15 18 13
13. Developing cross-occupational competencies
7 14 7 5 12 12 31 16
14. Student career guidance/counselling 6 21 4 6 33 20 32 19
Source: OECD (2014) Table 4.10
Note: The figures for ‘H9’ and ‘L8’ are averages for the nine high performing and eight low performing countries (see Table 1.2) and ‘All’ is the mean across all TALIS countries. Eng = England, Fin = Finland, Fla = Flanders, Jpn = Japan, Sng = Singapore.
18. For one or two areas, the figures for England are a little higher than the average for
the high performing countries and/or the average for all countries in TALIS: student
evaluation or assessment (row 2), approaches to individual assessment (row 5), and
school management and administration (row 11). But most are lower, sometimes by a
substantial margin. Figure 4.4 plots the figures for all countries for two areas where
the reporting of effective training in England is particularly low, judged by the levels in
other countries. These are knowledge of subject field(s) (row 1), notwithstanding this
being the area most frequently reported in England – on the vertical axis – and ICT
skills for teaching (row 8) – on the horizontal axis.

84
Figure 4.4 Percentage of teachers who had CPD in any area reporting ‘effective training’ in (i)
knowledge of subject field(s) and (ii) ICT skills for teaching: international comparison
Source: OECD (2014) Table 4.10
Note: the nine high performing countries and eight low performing countries (see Table 1.2) are plotted with closed diamonds and open triangles respectively.
19. Effective training in one area tends to go hand in hand with effective training in the
other: there is an upward sloping pattern to the data in the graph. However, there are
two exceptions – Japan at the top left with a high level of effective training in the
subject field(s) and a low level for ICT skills and Sweden at the bottom right with the
opposite. Australia, Estonia and Korea are the three high performing countries
towards the top right of the graph with high levels of both. The position of England at
the bottom left with low levels of effective training in both areas is clear.
20. In order to analyse differences within England in the extent of ‘effective training’, we
created a summary variable equal to the number of areas from the 14 listed in Table
4.5 in which a teacher reported having had training with a moderate or large impact
on their teaching. The mean values for teachers in independent schools and publicly-
funded schools (academies and maintained schools) are 3.0 and 4.0 respectively, the
difference reflecting in part the lower amount of CPD undertaken by teachers in
independent schools that we have already noted.
21. Restricting attention to just teachers in publicly-funded schools, we find the average
value of our index of effective training is significantly higher for teachers in schools

85
with higher percentages of children receiving Free School Meals (FSM). For example,
teachers in schools in the top quartile of FSM receipt – children from the poorest
family backgrounds – score 4.4 on average, compared to teachers in the bottom
quartile who score 3.7. Effective training is also more prevalent among teachers in
schools with less able pupil intakes, as measured by Key Stage 2 scores.
22. To complement this analysis of effective training, we also analyse respondents’
answers to four questions put to teachers that are in line with the research literature
on the quality of CPD.57 Higher quality CPD is often considered to have certain
features: to involve colleagues, to have active learning (rather than just listening to a
lecturer), to require collaboration with others, and to take place over an extended
period rather than at one-off events. Table 4.6 shows the percentage of teachers who
say that the CPD they took part in the 12 months prior to interview included these four
features in ‘most’ or ‘all’ activities. (The figures are restricted to those teachers who
undertook some CPD.) We compare the figures for England with those for other
countries.
Table 4.6 Percentage of teachers reporting that CPD undertaken in last 12 months had certain
features in most or in all activities undertaken: international comparison
Percentage of teachers reporting that CPD involves: Eng H9 Fin Fla Jpn Sng L8 All
A group of colleagues from my school or subject group 45 36 42 35 30 36 44 39
Opportunities for active learning methods 36 31 32 29 31 33 39 33
Collaborative learning activities or research with other teachers 29 26 22 21 26 28 32 28
An extended time period (taking place on several occasions) 19 16 13 11 8 16 23 21
Source: OECD (2014) Table 4.18.Web
Note: ‘an extended period’ is defined in the questionnaire as ‘several occasions spread out over several weeks or months’. The figures for ‘H9’ and ‘L8’ are averages for the nine high performing and eight low performing countries (see Table 1.2) and ‘All’ is the mean across all TALIS countries. Eng = England, Fin = Finland, Fla = Flanders, Jpn = Japan, Sng = Singapore.
23. The percentages for England vary between 19% for CPD over an extended time
period up to 45% for activities undertaken with colleagues. There is clearly room for
improvement in the organisation of CPD in England (to the extent that the aspects
concerned are indeed hallmarks of ‘good’ professional development). But it is notable
that all the averages for the high performing countries are a little lower than those for
England. The figures for England are typically close to the average for all countries in
TALIS.
24. Finally in this section, we constructed a summary index from the responses to the four
statements analysed in Table 4.6. On each statement we scored the response ‘in
some activities’ as 1, ‘in most activities’ as 2, and ‘in all activities’ as 3 (and ‘not in any
activities’ as zero). The index therefore has a maximum value of 12. Teachers in
state-funded schools have significantly higher average values than teachers in
independent schools (4.8 compared to 3.8), as do teachers in schools with lower
57
For example, see Desimore (2009).

86
ability pupil intakes (measured by Key Stage 2 scores) and higher levels of receipt of
Free school Meals.58
4.4 Do teachers perceive much need for more CPD?
25. Given the activities that they already undertake – both the amount and its perceived
impact – do teachers in England believe they currently need CPD? Figure 4.5 shows
the percentages reporting a ‘moderate’ or ‘high’ level of need for each of the 14
different areas considered earlier in Table 4.5 alongside the averages for the nine
high performing countries. In every case the figures for England are well below the
average for the high performers, which in turn are typically below the levels of the
eight low performing countries and the average for all countries (not shown in the
graph). Indeed, in 10 of the 14 areas, the figure for England is one of the three lowest
among all countries in TALIS: the need expressed by teachers in England for more
CPD is low by international standards.
26. But there are three areas listed at the bottom of the graph where at least 1 in 3
teachers in England feels a moderate or high need for more CPD: two relating to
aspects of ICT (the distinction between the two areas is not very clear in the
questionnaire) and one to students with special needs.
27. Teachers in England, but not other countries, were also asked about one further area
of possible need – mentoring/coaching peers. 1 in 4 report a moderate or high level of
need, making this one of the more commonly reported areas in England. The figure is
quite similar for those currently acting as mentors and those not doing so – 21% and
27% respectively. That is, about 1 in 5 teachers currently acting as mentors feel the
need for more CPD in this area.
28. However, it is probably encouraging that only about 1 in 7 teachers in England feel
significantly in need of CPD in their knowledge of their subject fields and the
curriculum, their pedagogical skills, and their management of student behaviour –
shown at the top of Figure 4.5.59 The differences between the figures for England and
the average for the high performers are particularly large for these four areas. Among
the high performing countries, the figures in these areas vary from about 1 in 5 in
Belgium (Flanders) and Australia up to around 75% in Korea and 80-95% in Japan.
58
Not all of these results are in line with those reported by Opfer and Pedder (2011) based on survey data from a national study of professional development of teachers in England. 59
The uncertainty arises as teachers could be mistaken in their assessments of their need.

87
Figure 4.5 Percentage of teachers reporting moderate or high levels of need for CPD in different
areas: international comparison
Source: OECD (2014) Table 4.12.Web
Note: the nine high performing countries are defined in Table 1.2. The percentages graphed are the average values across the nine.
29. We now consider the differences in need within England. We focus on areas where at
least a third of teachers indicate a moderate or strong need. Which teachers want
help with new technologies in the workplace, ICT skills for teaching, and – a rather
different skill – teaching students with special needs?
30. Figure 4.6 shows how teachers’ beliefs of their need for CPD in these three areas
vary with age. Unsurprisingly, need for professional development with new
technologies and ICT skills used in teaching is felt less by younger teachers – around
25% or less for those in their 20s rising to 45-50% for those aged 50 or over. On the
other hand, it is younger teachers who feel more need for professional development
in teaching students with special needs, where experience may well tell – 40% of
those in their 20s compared to 30-35% of those aged 40-59, although as this
indicates the age gradient is not as large as for computer skills.

88
Figure 4.6 Percentage of teachers who report a moderate or high level of need for CPD in (i) ICT
skills for teaching, (ii) new technologies in the workplace, and (iii) teaching students with special
needs, by age
Source: TALIS database
Note: The black lines represent 95% confidence intervals.
31. One of the questions put to teachers about the ‘target class’ (a particular Key Stage 3
class that they take – see Chapter 7) was to ask them to estimate the percentage of
students in the class with special needs. Interestingly, the reported need for CPD in
teaching students with special needs varies only little with these estimates. On the
one hand, this is encouraging – the teachers with larger numbers of students of this
type (at least in the ‘target class’) do not feel a particular need for help in how to cater
for them. On the other hand, it is still the case that at least a third feel that need.
4.5 What are seen as the barriers to more training?
32. The last issue we consider in this chapter is the obstacles that teachers see to
participation in CPD. Table 4.7 shows the percentages of teachers who agree or
strongly agree with a series of statements about the barriers to CPD. The
interpretation of these figures is not altogether straightforward. Disagreement with any
statement may either be taken at face value – indicating that the issue concerned is
really not viewed as a barrier – or could simply reflect low demand for further CPD
from a teacher feeling little additional need.

89
33. Notwithstanding the relatively low levels of need reported in England, judged by the
standards of other countries, significant numbers of teachers in schools in England do
agree that there are barriers to undertaking CPD. As many as 60% believe that their
existing work schedule represents a barrier. There is no definition of ‘work schedule’
in the TALIS questionnaire but it seems likely that most teachers interpret the
statement as referring to all of their work, whether carried out at the school or at
home. Chapter 2 showed that average total hours of work of teachers in England are
higher than those in most other countries. Nevertheless, the percentage of teachers in
England reporting ‘work schedule’ as a barrier to CPD is essentially the same as the
average for the high performing countries, although it is above the figure for the low
performers or for all countries taken together. Within England, average total hours per
week for those strongly agreeing with the statement about work schedule are around
4.5 hours higher than for other teachers.
Table 4.7 Percentage of teachers agreeing or strongly agreeing with statements about barriers to
their participation in professional development: international comparison
Barrier to participation Eng H9 Fin Fla Jpn Sng L8 All
CPD conflicts with my work schedule 60 58 52 42 86 62 49 51
CPD is too expensive/unaffordable 43 35 23 17 62 20 51 43
There are no incentives for participating 38 38 43 25 38 37 58 48
There is a lack of employer support 27 31 23 15 60 21 38 31
Lack of time due to family responsibilities 27 38 37 34 52 45 30 36
There is no relevant CPD offered 25 33 40 29 37 22 42 39
Do not have the pre-requisites 10 13 7 9 27 16 13 11
Source: OECD (2014) Table 4.14
Note. The figures for ‘H9’ and ‘L8’ are averages for the nine high performing and eight low performing countries (see Table 1.2) and ‘All’ is the mean across all TALIS countries. Eng = England, Fin = Finland, Fla = Flanders, Jpn = Japan, Sng = Singapore.
34. By contrast, only a quarter of teachers in England believe that no relevant CPD is on
offer, compared to averages of a third in high performing countries and two-fifths in
low performing countries. About 40% of teachers in England see CPD as too
expensive – more than in several H9 countries. A similar figure see the lack of
incentives as a barrier – the same as the H9 average and well below that for the L8
countries (58%), where lack of incentives is on average the most commonly cited
barrier.
35. About a quarter of all teachers in England say that they lack time for CPD due to their
family responsibilities. Unsurprisingly, this figure varies sharply with the presence of
children in the home, especially young children – see Figure 4.7. About a half of
teachers, whether men or women, with children aged 0-4 report this as a barrier.
36. About a quarter of teachers also perceive a lack of employer support for CPD. Figure
4.8 shows how this figure varies across school type and Ofsted rating. Teachers in
independent schools are slightly less likely than teachers in other schools to perceive
this as a barrier, despite their participation in CPD being lower and the CPD
undertaken being less effective – see earlier sections of this chapter. There is a

90
marked gradient across Ofsted rating, with the employer being seen as a barrier by
only 1 in 5 teachers in ‘outstanding’ schools but by 1 in 2 in the small number of
schools rated as ‘inadequate’ at their last inspection. (There are no differences within
the state sector across schools classified by the Key Stage 2 results of their pupil
intake or levels of Free School Meals receipt.)
Figure 4.7 Percentage of teachers who agree or strongly agree that they lack time for CPD due to
their family responsibilities, by gender and presence of children in the home
Source: TALIS database Note: The black lines represent 95% confidence intervals.
Figure 4.8 Percentage of teachers who agree or strongly agree that there is a lack of employer
support for CPD, by school type and Ofsted rating
Source: TALIS database Note: The black lines represent 95% confidence intervals.

91
4.6 Summary
37. The quantity of CPD for lower secondary teachers in England is reasonably high by
international standards, when measured by the existence and use of induction
programmes, by mentoring, and by participation in some (but not all) forms of training.
38. However, the quantity does not compare so well when measured by the average
number of days spent in training. And the extent of ‘effective’ training – the training felt
to have a moderate or large impact on teaching – is lower in England for a number of
important areas than in many other countries, including high performing countries.
Teachers in England also tend to feel much less need for CPD across a whole range
of different areas of activity than teachers elsewhere.
39. In some cases there are clear and striking comparisons to be made between figures
for England and the average for high performing countries in TALIS. But as is the
case for other topics considered in this report, it is important to note that there is often
considerable variation among the nine high performing countries that we identified in
Chapter 1.
40. We have noted several examples of variation in CPD provided or undertaken within
England – variation with school and/or teacher characteristics – but also examples of
where there is little apparent variation. Independent schools and their teachers
appear to have rather less CPD when measured in various ways, including
participation in some forms of training and teacher reports of ‘effective’ training.
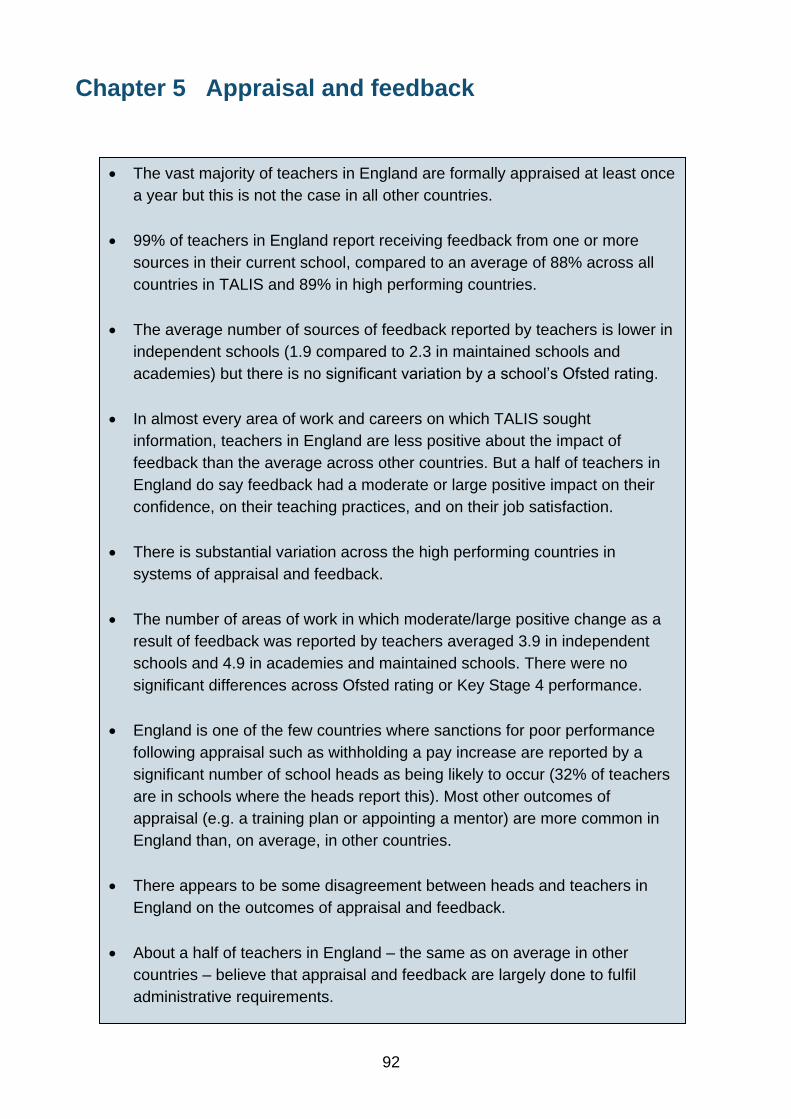
92
Chapter 5 Appraisal and feedback
The vast majority of teachers in England are formally appraised at least once
a year but this is not the case in all other countries.
99% of teachers in England report receiving feedback from one or more
sources in their current school, compared to an average of 88% across all
countries in TALIS and 89% in high performing countries.
The average number of sources of feedback reported by teachers is lower in
independent schools (1.9 compared to 2.3 in maintained schools and
academies) but there is no significant variation by a school’s Ofsted rating.
In almost every area of work and careers on which TALIS sought
information, teachers in England are less positive about the impact of
feedback than the average across other countries. But a half of teachers in
England do say feedback had a moderate or large positive impact on their
confidence, on their teaching practices, and on their job satisfaction.
There is substantial variation across the high performing countries in
systems of appraisal and feedback.
The number of areas of work in which moderate/large positive change as a
result of feedback was reported by teachers averaged 3.9 in independent
schools and 4.9 in academies and maintained schools. There were no
significant differences across Ofsted rating or Key Stage 4 performance.
England is one of the few countries where sanctions for poor performance
following appraisal such as withholding a pay increase are reported by a
significant number of school heads as being likely to occur (32% of teachers
are in schools where the heads report this). Most other outcomes of
appraisal (e.g. a training plan or appointing a mentor) are more common in
England than, on average, in other countries.
There appears to be some disagreement between heads and teachers in
England on the outcomes of appraisal and feedback.
About a half of teachers in England – the same as on average in other
countries – believe that appraisal and feedback are largely done to fulfil
administrative requirements.

93
1. This chapter considers how schools appraise teachers’ classroom and broader
working practices and how these appraisals translate into feedback to the teacher
and, ultimately, into consequences for their careers. At its best, the cycle of appraisal,
feedback and systematic improvement in response to feedback should be a central
determinant of the effectiveness of schools.
2. We make use of data both on headteachers’ reports for their school and the individual
teachers’ reports of their own experiences. School heads were asked in TALIS only
about systems of ‘formal appraisal’, for example as part of a performance
management system. Teachers, on the other hand, were asked about feedback
‘defined broadly as any communication you receive about your teaching... through
informal discussions or as part of a more formal arrangement’. The information sought
from teachers therefore refers to wider feedback than that provided through formal
appraisal. Moreover, while the questions to headteachers refer to current practice,
those to individual teachers relate rather ambiguously to the past as well as the
present.60
3. One route through which teachers may get feedback is through comments from
mentors. Where appropriate we refer back to our analysis of mentoring included in
Chapter 4.
4. The chapter addresses five questions:
Who provides feedback to teachers and on what basis?
What positive impacts come from feedback?
How often does formal appraisal of teachers take place?
What outcomes do headteachers see from appraisal?
What are teachers’ views of appraisal and feedback?
5. In addressing these questions, we aim to consider how systems of feedback and
appraisal vary according to type of school and the Ofsted inspection rating. School
type determines in part the level of school autonomy – see Chapter 1 – and so is
likely to alter systems of external oversight of the school with respect to its formal
appraisal processes, although the very recent conversion from maintained schools of
some academies in the sample will weaken any relationship in the data. By contrast,
other school contextual factors such as levels of pupil deprivation are likely to be less
important.
60
Teachers are asked in the present tense whether they receive feedback from different sources (they are not, for example, asked about the last 12 months) or whether they agree with a statement that they have ‘never received’ the feedback from the source concerned in their current school. The implication seems to be that feedback reported could refer to any time since the teacher’s appointment. However, there is no significant impact of tenure in the school in a regression of the average number of sources of feedback reported by teachers in England.

94
6. Any relationship we might observe between Ofsted school inspection ratings and
appraisal and feedback systems may occur for one of two reasons. First, if particular
types of system are more effective at improving practice than others then we should
observe that schools judged by Ofsted at their most recent inspection to be ‘good’ or
‘outstanding’ do indeed have systematically different procedures in place for the
management of teachers. Second, schools that have been judged to be ‘inadequate’
by Ofsted are subject to frequent external monitoring and may have put in place
stronger internal systems of accountability to prepare for subsequent inspection visits.
But, as in the rest of the report, we are very limited in our ability to say anything about
the relationship between appraisal and feedback and the lowest rating of ‘inadequate’
due to the small number of schools and teachers in the TALIS sample with this rating
(six schools and 85 teachers).
5.1 Who provides feedback to teachers and on what basis?
7. Almost all teachers (99%) in England report that they have received feedback from
one or more sources in their current school – see Table 5.1. By contrast, feedback is
not universal in other countries: the average is 88% across all countries in TALIS and
89% for the nine high performing countries. The outlier for the high performers, pulling
down the average, is Finland where over a third of teachers report never having
received feedback.
Table 5.1 Percentage of teachers who report having received feedback from different sources:
international comparison
Source Eng H9 Fin Fla Jpn Sng L8 All
SMT 85 51 7 20 65 83 58 49
Other teachers 51 47 43 20 47 43 34 42
Headteacher 42 51 42 70 75 50 65 54
External sources 29 22 18 34 31 11 37 29
Assigned mentor 29 18 1 18 39 38 29 19
Any of above sources 99 89 63 86 94 99 94 88
Source: OECD (2014) Table 5.4
Note: ‘External sources’ are ‘external individuals or bodies’. ‘SMT’ is school management team. ‘Other teachers’ excludes the SMT. The figures for ‘H9’ and ‘L8’ are averages for the nine high performing and eight low performing countries (see Table 1.2) and ‘All’ is the mean across all TALIS countries. Eng = England, Fin = Finland, Fla = Flanders, Jpn = Japan, Sng = Singapore.
8. The higher than average figures for England are driven by the differences for most
sources: compared with the average for the high performers, more teachers receive
feedback in England from the school management team, other teachers, sources
external to the school, and mentors. However, feedback from the headteacher is less
common. It is notable that 29% of teachers in England say they have had feedback
from mentors whereas Chapter 4 showed that only 19% report currently having a
mentor. This could reflect that the feedback reported in Table 5.1 may be sometime in
the past.
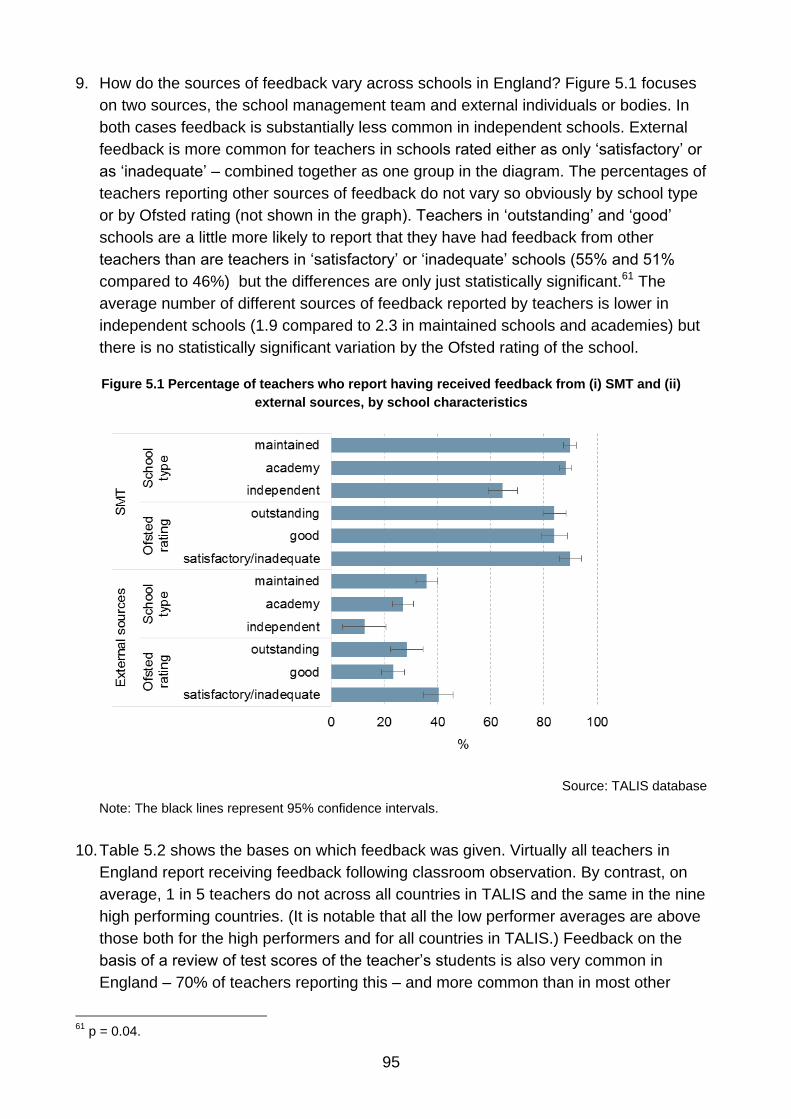
95
9. How do the sources of feedback vary across schools in England? Figure 5.1 focuses
on two sources, the school management team and external individuals or bodies. In
both cases feedback is substantially less common in independent schools. External
feedback is more common for teachers in schools rated either as only ‘satisfactory’ or
as ‘inadequate’ – combined together as one group in the diagram. The percentages of
teachers reporting other sources of feedback do not vary so obviously by school type
or by Ofsted rating (not shown in the graph). Teachers in ‘outstanding’ and ‘good’
schools are a little more likely to report that they have had feedback from other
teachers than are teachers in ‘satisfactory’ or ‘inadequate’ schools (55% and 51%
compared to 46%) but the differences are only just statistically significant.61 The
average number of different sources of feedback reported by teachers is lower in
independent schools (1.9 compared to 2.3 in maintained schools and academies) but
there is no statistically significant variation by the Ofsted rating of the school.
Figure 5.1 Percentage of teachers who report having received feedback from (i) SMT and (ii)
external sources, by school characteristics
Source: TALIS database
Note: The black lines represent 95% confidence intervals.
10. Table 5.2 shows the bases on which feedback was given. Virtually all teachers in
England report receiving feedback following classroom observation. By contrast, on
average, 1 in 5 teachers do not across all countries in TALIS and the same in the nine
high performing countries. (It is notable that all the low performer averages are above
those both for the high performers and for all countries in TALIS.) Feedback on the
basis of a review of test scores of the teacher’s students is also very common in
England – 70% of teachers reporting this – and more common than in most other
61
p = 0.04.

96
countries. (Singapore is a counter-example.) For the other four bases, the figures for
England are a bit lower than the averages for the high performers.
Table 5.2 Percentage of teachers receiving feedback on different bases: international comparison
Basis Eng H9 Fin Fla Jpn Sng L8 All
Classroom observation 99 81 46 81 87 97 88 79
Student test scores 70 60 28 42 63 81 79 64
Self-assessment of own work 46 56 21 35 78 87 67 53
Student surveys of own teaching 42 54 26 35 66 62 65 53
Parent surveys or discussion 41 50 37 34 65 52 67 53
Assessment of subject knowledge 39 53 26 43 67 70 73 55
Source: OECD (2014) Table 5.5
Note: The figures for ‘H9’ and ‘L8’ are averages for the nine high performing and eight low performing countries (see Table 1.2) and ‘All’ is the mean across all TALIS countries. Eng = England, Fin = Finland, Fla = Flanders, Jpn = Japan, Sng = Singapore.
11. Within England, feedback following student surveys is more commonly reported by
teachers in schools rated as ‘outstanding’ by Ofsted, than by teachers in schools with
lower ratings – 49% compared to 39%. The same is true for feedback following
surveys of, or discussion with, parents – 46% compared to 38%. Feedback following
student surveys is less commonly reported by teachers in independent schools: 30%
do so.
5.2 What positive impacts come from feedback?
12. Given the feedback they receive, do teachers think that it does any good? For a range
of different areas of work and careers, Table 5.3 shows the percentage of teachers
who report that feedback at their current school resulted in a moderate or large
positive change for them. (The calculations exclude those teachers who report never
receiving feedback.) We comment first on the nine high performing countries: it is
striking that teachers in these countries are much less positive about the outcomes of
feedback than are teachers in the eight low performing countries. The differences
between the averages for the two groups of countries range between 15 and 30
percentage points, although it should also be noted that the examples in the table
illustrate again the extent of the variation among the high performers.
13. Then, in almost every case, teachers in England are even less positive than the
average for the high performing countries. In four cases, the figure for England is the
lowest recorded for any country in TALIS. Figure 5.2 illustrates this for two of them:
the percentage of teachers reporting a moderate or large positive change in their
confidence is shown on the horizontal axis and the percentage reporting such a
change in their ‘knowledge and understanding of main subject field(s)’ is shown on
the vertical axis. (The other areas for which the England figure is the minimum is

97
‘motivation’ and ‘job satisfaction’.) England is a clear outlier in the bottom left-hand
corner. It is notable that the low performing countries (open triangles) are grouped in
the top-right hand corner, with the highest percentages of teachers reporting positive
impact. With one exception (Japan, up among the low performers towards the top-
right of the graph), the high performing countries (solid diamonds) come in between
the low performing group and England, illustrating the point made above about the
pattern of the results in Table 5.3.
Table 5.3 Percentage of teachers reporting a moderate or large positive change as the result of
receiving feedback, by area of work or career: international comparison
Area of work/career Eng H9 Fin Fla Jpn Sng L8 All
Confidence as a teacher 53 65 63 63 85 69 86 71
Use of student assessments 49 49 32 40 75 63 80 59
Teaching practices 48 55 38 44 89 69 81 62
Classroom management practices 42 47 33 38 71 62 79 56
Public recognition from head or colleagues
41 55 56 52 83 49 75 61
Motivation 41 59 61 56 82 63 80 65
Job satisfaction 39 56 60 52 77 61 80 63
Role in school development initiatives 36 45 33 35 63 49 67 51
Job responsibilities at the school 35 50 34 43 71 58 79 55
Likelihood of career advancement 33 30 15 18 34 44 53 36
Methods for teaching SEN pupils 30 40 30 33 63 40 55 45
Amount of professional development 28 40 27 34 42 47 66 46
Knowledge/understanding of main subject field(s)
27 47 33 33 86 62 77 53
Salary and/or financial bonus 18 22 13 7 28 38 39 25
Source: OECD (2014) Table 5.7
Note: The figures for ‘H9’ and ‘L8’ are averages for the nine high performing and eight low performing countries (see Table 1.2) and ‘All’ is the mean across all TALIS countries. Eng = England, Fin = Finland, Fla = Flanders, Jpn = Japan, Sng = Singapore.
14. There are several possible explanations for the lower figures for England. The quality
of feedback might be lower on average and hence have less effect. Teachers in
England could be less easy to change in their attitudes or behaviour. Or their need for
change may be less e.g. they might have teaching practices that are less in need of
improvement. (These explanations might also account for the differences on average
between the high and low performers.) But there may, of course, be other
explanations for the differences. It also needs to be remembered that the figures for
England refer to all teachers – given that feedback is universal – while those for other
countries often do not (see Table 5.1).
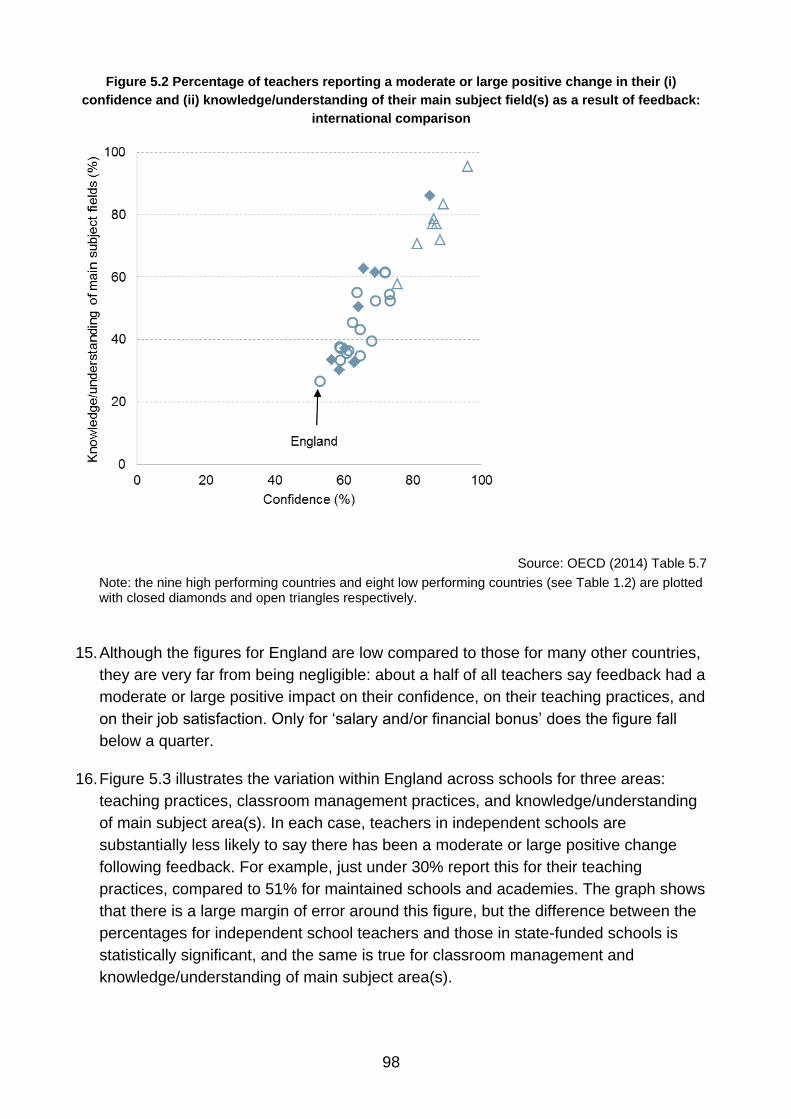
98
Figure 5.2 Percentage of teachers reporting a moderate or large positive change in their (i)
confidence and (ii) knowledge/understanding of their main subject field(s) as a result of feedback:
international comparison
Source: OECD (2014) Table 5.7
Note: the nine high performing countries and eight low performing countries (see Table 1.2) are plotted with closed diamonds and open triangles respectively.
15. Although the figures for England are low compared to those for many other countries,
they are very far from being negligible: about a half of all teachers say feedback had a
moderate or large positive impact on their confidence, on their teaching practices, and
on their job satisfaction. Only for ‘salary and/or financial bonus’ does the figure fall
below a quarter.
16. Figure 5.3 illustrates the variation within England across schools for three areas:
teaching practices, classroom management practices, and knowledge/understanding
of main subject area(s). In each case, teachers in independent schools are
substantially less likely to say there has been a moderate or large positive change
following feedback. For example, just under 30% report this for their teaching
practices, compared to 51% for maintained schools and academies. The graph shows
that there is a large margin of error around this figure, but the difference between the
percentages for independent school teachers and those in state-funded schools is
statistically significant, and the same is true for classroom management and
knowledge/understanding of main subject area(s).
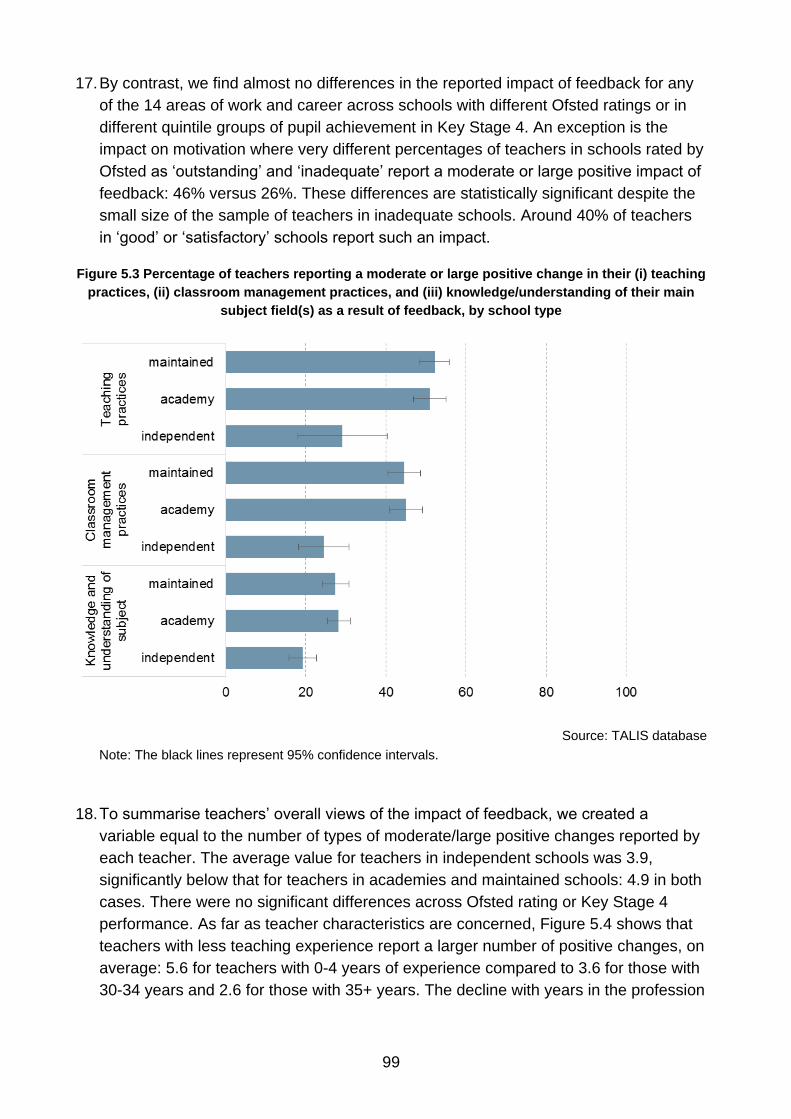
99
17. By contrast, we find almost no differences in the reported impact of feedback for any
of the 14 areas of work and career across schools with different Ofsted ratings or in
different quintile groups of pupil achievement in Key Stage 4. An exception is the
impact on motivation where very different percentages of teachers in schools rated by
Ofsted as ‘outstanding’ and ‘inadequate’ report a moderate or large positive impact of
feedback: 46% versus 26%. These differences are statistically significant despite the
small size of the sample of teachers in inadequate schools. Around 40% of teachers
in ‘good’ or ‘satisfactory’ schools report such an impact.
Figure 5.3 Percentage of teachers reporting a moderate or large positive change in their (i) teaching
practices, (ii) classroom management practices, and (iii) knowledge/understanding of their main
subject field(s) as a result of feedback, by school type
Source: TALIS database
Note: The black lines represent 95% confidence intervals.
18. To summarise teachers’ overall views of the impact of feedback, we created a
variable equal to the number of types of moderate/large positive changes reported by
each teacher. The average value for teachers in independent schools was 3.9,
significantly below that for teachers in academies and maintained schools: 4.9 in both
cases. There were no significant differences across Ofsted rating or Key Stage 4
performance. As far as teacher characteristics are concerned, Figure 5.4 shows that
teachers with less teaching experience report a larger number of positive changes, on
average: 5.6 for teachers with 0-4 years of experience compared to 3.6 for those with
30-34 years and 2.6 for those with 35+ years. The decline with years in the profession

100
is consistent with greater experience resulting in less need for change.62 There is no
difference in the average between men and women.
Figure 5.4 Average number of areas or work or career in which teachers report a ‘moderate’ or
‘large’ positive change as a result of feedback, by years of teaching experience
Source: TALIS database
Note. The dashed lines represent the upper and lower bounds of the 95% confidence level.
5.3 How often does formal appraisal take place?
19. We now turn to the headteachers’ reports on formal appraisal in their schools. Table
5.4 shows the percentage of teachers in schools where the head reports that formal
appraisal of every teacher takes place at least once a year, distinguishing various
sources of appraisal. Most of the figures for England are well above the averages for
the high performers. (The low performers are again substantially above the high
performers on average.) However, there is huge variation across the high performing
countries. This is illustrated by the contrast between Finland and Flanders, on the one
hand, and Japan and Singapore on the other. In all cases, the England figures also
equal or exceed the averages across all countries in TALIS. The picture from the
table is one of the vast majority of teachers in England being formally appraised at
least once a year by one or more people or bodies.
20. Figure 5.5 compares the figures reported by headteachers for at least annual formal
appraisal from any source (horizontal axis) with those for the percentages of teachers
reporting that they received feedback from any source which were analysed earlier in
62
The ambiguity in when the feedback was received should again be noted – see the footnote at the start of the chapter.

101
Table 5.1 (vertical axis). (As with Table 5.4, the figures for the heads’ reports refer to
the percentages of teachers and not schools.) Recall that the questions to teachers
about feedback cover more than formal appraisal and refer implicitly to the period
since arrival at the school. England is one of the countries up in the top right corner of
the graph, with very high figures both for feedback and appraisal. The four high
performing countries also found in this corner are the three Asian countries, Japan,
Korea and Singapore, and Estonia.
Table 5.4 Percentage of teachers in schools where the head reports that teachers have formal
appraisal from one or more sources at least once a year: international comparison
Source of appraisal Eng H9 Fin Fla Jpn Sng L8 All
SMT 90 54 6 12 72 98 78 57
Other teachers 86 31 3 5 59 24 50 32
Assigned mentor 67 34 2 20 56 50 52 34
Headteacher 65 57 51 15 93 90 86 66
External individuals or bodies 24 20 4 3 67 36 52 25
Any of above 93 72 54 31 97 100 93 78
Source: OECD (2014) Table 5.1.Web and TALIS database
Note: The figures for ‘H9’ and ‘L8’ are averages for the nine high performing and eight low performing countries (see Table 1.2) and ‘All’ is the mean across all TALIS countries. Eng = England, Fin = Finland, Fla = Flanders, Jpn = Japan, Sng = Singapore.
Figure 5.5 Percentage of teachers in schools where the head reports that teachers are formally
appraised at least once a year and percentage of teachers reporting feedback: international
comparison
Source: OECD (2014) Table 5.4 and TALIS database
Note: the nine high performing countries and eight low performing countries (see Table 1.2) are plotted with closed diamonds and open triangles respectively.

102
21. Looking more closely at the entries for England in Table 5.4, some are much higher
than one would expect from our earlier analysis of feedback received by teachers in
Table 5.1. We saw from Table 5.1 that only 42% of teachers in England reported ever
receiving feedback from the headteacher, whether through formal or informal
channels. Yet Table 5.4 shows 65% of teachers being in schools where the head
says that he or she formally appraises every teacher each year. (An assumption that
appraisal should lead to some feedback seems reasonable.) There is a similar
contrast in the figures for feedback from other teachers compared to formal appraisal
by other teachers each year – 51% in Table 5.1 versus 86% in Table 5.4. Whatever
the reasons for the differences between the teacher and headteacher reports, which
may include reporting error of various types, a clear picture remains in terms of the
international comparison: there is more reporting in England than in many other
countries both by teachers of feedback and by headteachers of annual appraisal (by
someone, not necessarily the head).
22. Significant variation within England in systems of formal appraisal is hard to detect
due to the small sample size of schools. (There is one report per school by the
headteacher, whereas for feedback we analyse reports by every teacher in the
sample so the sample size is much larger.) Independent school headteachers report
no annual formal appraisal of teachers by external bodies, which is not surprising.
Excluding this source, the average number of individuals or bodies giving formal
appraisal for each teacher reported by independent school heads is 2.2, compared to
3.0 in other schools, but the difference is only of marginal statistical significance and
the small number of independent schools in the sample (just 10) needs to be noted
again. We find no significant variation in the frequency of heads’ reports of each
source of appraisal, or in the average number, by Ofsted rating or by average Key
Stage 4 achievement of the school’s pupils.
5.4 What outcomes do headteachers see from appraisal?
23. What do the headteachers say are the outcomes of appraisal? Table 5.5 shows the
percentage of teachers in schools in which the head reports that a particular outcome
follows teacher appraisal ‘most of the time’ or ‘always’. (The calculations are restricted
to schools where formal appraisal occurs.) Some outcomes concern teacher
development. These are the ones most commonly reported and come towards the top
of the table. Other outcomes are potentially more punitive (a ‘change in
salary/financial bonus’ could be either positive or negative) and are less commonly
reported and come lower down in the list.
24. The figures for England for the first four outcomes in the table are high or very high by
international standards, whether judged by the average for the high performers or that

103
for all countries in TALIS.63 As is often the case, the figures for the high performing
countries vary substantially. Of the four example countries in the table, Finland,
Flanders and Japan all have figures that are typically well below those for England,
while those in Singapore are all higher.
Table 5.5 Percentage of teachers in schools where heads report outcomes occur most of the time
or always after formal appraisal: international comparison
Outcome Eng H9 Fin Fla Jpn Sng L8 All
Remedies for any weaknesses in teaching discussed with teacher
80 62 42 72 20 92 84 69
Development or training plan 76 45 23 21 13 79 57 44
Appoint mentor to help improve teaching
68 34 4 43 6 79 33 26
Material sanctions, if teacher is found to be a poor performer
32 6 0 0 2 50 6 7
Change in career prospects 16 10 3 4 1 28 14 11
Change in work responsibilities 14 12 3 5 4 35 17 12
Change in salary or payment of a financial bonus
6 9 2 1 1 49 10 9
Dismissal or non-renewal of contract 5 3 1 7 1 4 7 5
Source: OECD (2014) Table 5.3.Web
Note: ‘material sanctions’ include withholding annual increases in pay. The figures for ‘H9’ and ‘L8’ are averages for the nine high performing and eight low performing countries (see Table 1.2) and ‘All’ is the mean across all TALIS countries. Eng = England, Fin = Finland, Fla = Flanders, Jpn = Japan, Sng = Singapore.
25. Figure 5.6 plots the percentages for each country for the second and third outcomes,
a development or training plan is prepared for the teacher and the appointment of a
mentor (‘to help the teacher improve his/her teaching’). England’s outlying position
towards the top right corner, second only to Singapore, is in striking contrast to the
cluster of seven countries at the bottom left corner where either outcome happens
infrequently or even rarely: Finland, France, Iceland, Japan, Norway, Portugal, and
Spain.
26. The outcome in the fourth row in Table 5.5, ‘material sanctions’, refers to the
statement:
‘If a teacher is found to be a poor performer, material sanctions such as withheld
annual increases in pay are imposed on the teacher’
Besides Singapore (50%), England (32%), and Sweden (31%), only three other
countries even reach double figures (Chile, the Czech Republic, and Romania).
63
It seems surprising that the first outcome of appraisal, ‘measures to remedy weaknesses are discussed with the teacher’, is not almost universal in every country. One might think that such discussions are an integral part of the appraisal process. If the response ‘sometimes’ is included in the figures, the percentage is indeed 100% in most countries, including England.
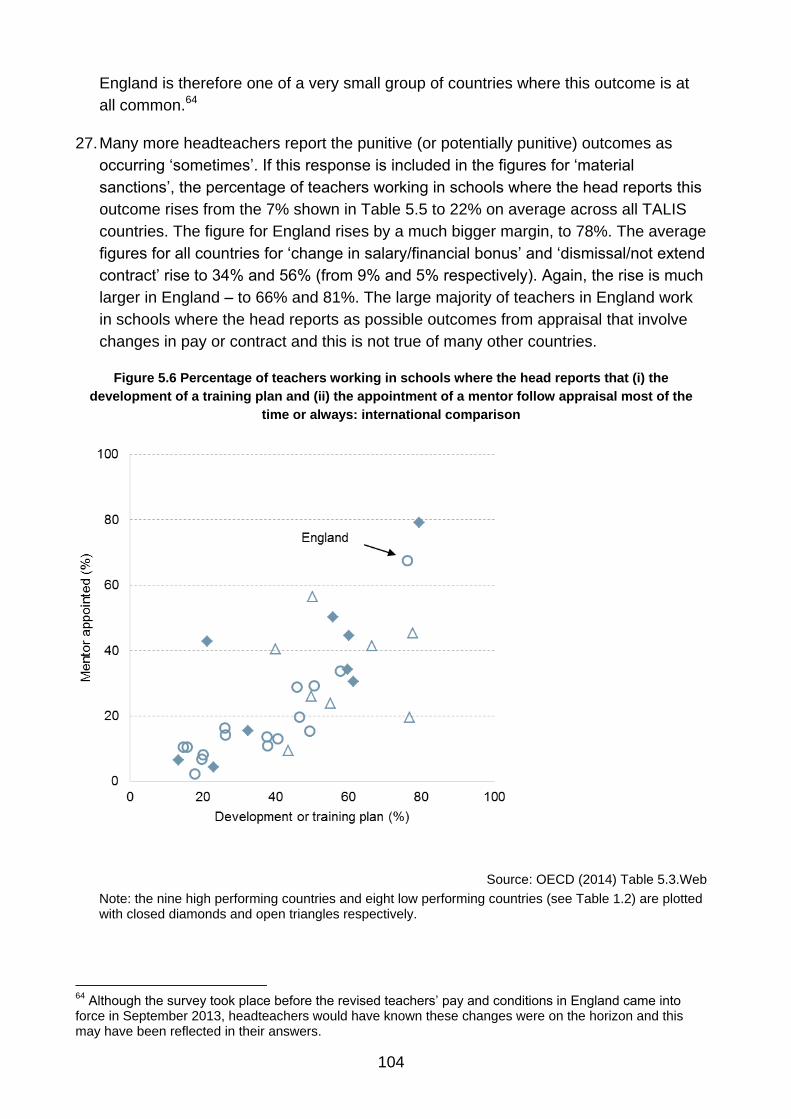
104
England is therefore one of a very small group of countries where this outcome is at
all common.64
27. Many more headteachers report the punitive (or potentially punitive) outcomes as
occurring ‘sometimes’. If this response is included in the figures for ‘material
sanctions’, the percentage of teachers working in schools where the head reports this
outcome rises from the 7% shown in Table 5.5 to 22% on average across all TALIS
countries. The figure for England rises by a much bigger margin, to 78%. The average
figures for all countries for ‘change in salary/financial bonus’ and ‘dismissal/not extend
contract’ rise to 34% and 56% (from 9% and 5% respectively). Again, the rise is much
larger in England – to 66% and 81%. The large majority of teachers in England work
in schools where the head reports as possible outcomes from appraisal that involve
changes in pay or contract and this is not true of many other countries.
Figure 5.6 Percentage of teachers working in schools where the head reports that (i) the
development of a training plan and (ii) the appointment of a mentor follow appraisal most of the
time or always: international comparison
Source: OECD (2014) Table 5.3.Web
Note: the nine high performing countries and eight low performing countries (see Table 1.2) are plotted with closed diamonds and open triangles respectively.
64
Although the survey took place before the revised teachers’ pay and conditions in England came into force in September 2013, headteachers would have known these changes were on the horizon and this may have been reflected in their answers.

105
28. Which are the schools in England where the head reports ‘material sanctions’ for poor
performance as being likely to occur? (We restrict attention to the responses ‘most of
the time’ and ‘always’, as in Table 5.5.) First, there are no independent school heads
in the sample who report this outcome (the same is also true for a change in career
prospects, a change in salary, or dismissal/non-extension of contract). Second,
among the heads in maintained schools and academies, younger heads appear more
likely to report material sanctions – see Figure 5.7. Despite the large margins of error
around the figures, the hypothesis of no difference across the three age groups can
be rejected. (We find no significant differences by gender of the head.)
Figure 5.7 Percentage of headteachers in maintained schools and academies who report ‘material
sanctions’ as following appraisal ‘most of the time’ or ‘always’, by age of the headteacher
Source: TALIS database
Note: The black lines represent 95% confidence intervals.
5.5 What are teachers’ views of appraisal and feedback?
29. Finally, we turn to the teachers’ views of how appraisal and feedback operate in
general in the school, as distinct from the impacts on their own teaching or careers.
The question concerned makes clear to teachers that their opinions are being sought
of the whole system of both formal appraisal and informal feedback. Table 5.6 shows
the percentage of teachers agreeing or strongly agreeing with nine different
statements about the aims and outcomes of appraisal and feedback in their school.
30. Several of the statements are very similar to those put to the headteachers about
formal appraisal that were analysed in the previous section. These include the
statements in the first three rows in the table. Most teachers in England agree that the
developmental outcomes concerned do occur in their school, in line with the views of
heads about these outcomes following formal appraisal shown in Table 5.5. And as is
the pattern with the headteacher reports, the percentages in the first three rows are
higher for England than the averages across all TALIS countries.
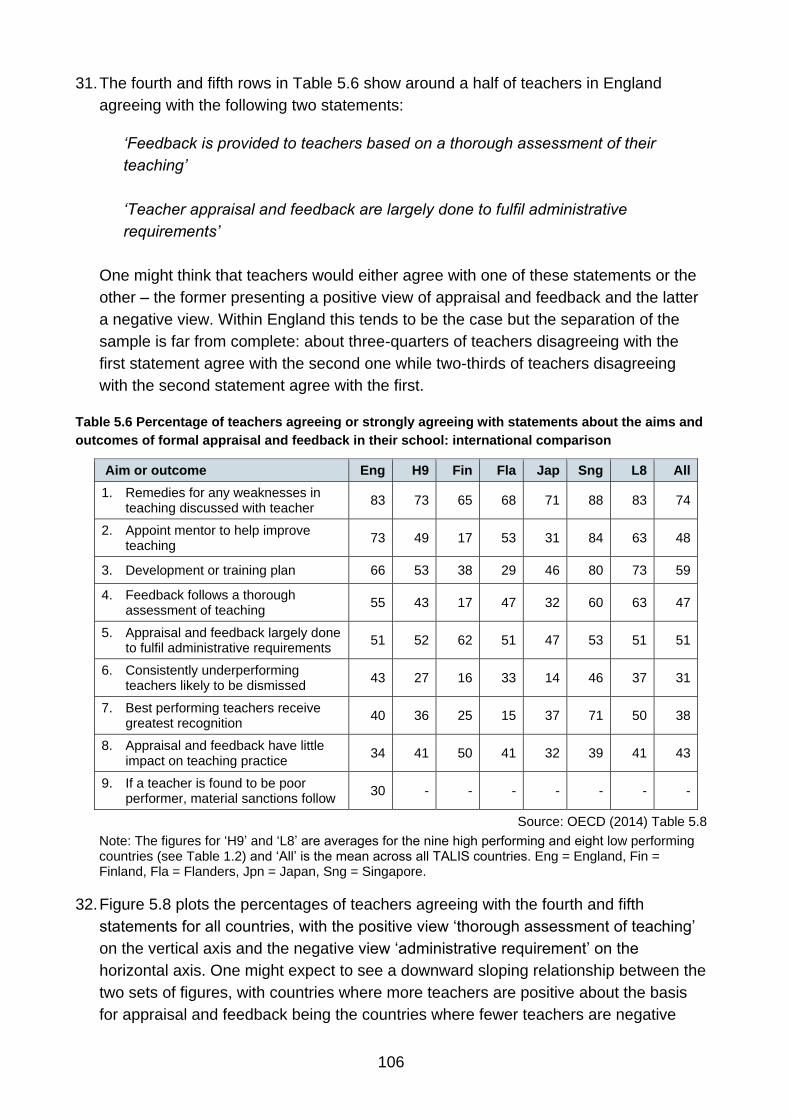
106
31. The fourth and fifth rows in Table 5.6 show around a half of teachers in England
agreeing with the following two statements:
‘Feedback is provided to teachers based on a thorough assessment of their
teaching’
‘Teacher appraisal and feedback are largely done to fulfil administrative
requirements’
One might think that teachers would either agree with one of these statements or the
other – the former presenting a positive view of appraisal and feedback and the latter
a negative view. Within England this tends to be the case but the separation of the
sample is far from complete: about three-quarters of teachers disagreeing with the
first statement agree with the second one while two-thirds of teachers disagreeing
with the second statement agree with the first.
Table 5.6 Percentage of teachers agreeing or strongly agreeing with statements about the aims and
outcomes of formal appraisal and feedback in their school: international comparison
Aim or outcome Eng H9 Fin Fla Jap Sng L8 All
1. Remedies for any weaknesses in teaching discussed with teacher
83 73 65 68 71 88 83 74
2. Appoint mentor to help improve teaching
73 49 17 53 31 84 63 48
3. Development or training plan 66 53 38 29 46 80 73 59
4. Feedback follows a thorough assessment of teaching
55 43 17 47 32 60 63 47
5. Appraisal and feedback largely done to fulfil administrative requirements
51 52 62 51 47 53 51 51
6. Consistently underperforming teachers likely to be dismissed
43 27 16 33 14 46 37 31
7. Best performing teachers receive greatest recognition
40 36 25 15 37 71 50 38
8. Appraisal and feedback have little impact on teaching practice
34 41 50 41 32 39 41 43
9. If a teacher is found to be poor performer, material sanctions follow
30 - - - - - - -
Source: OECD (2014) Table 5.8
Note: The figures for ‘H9’ and ‘L8’ are averages for the nine high performing and eight low performing countries (see Table 1.2) and ‘All’ is the mean across all TALIS countries. Eng = England, Fin = Finland, Fla = Flanders, Jpn = Japan, Sng = Singapore.
32. Figure 5.8 plots the percentages of teachers agreeing with the fourth and fifth
statements for all countries, with the positive view ‘thorough assessment of teaching’
on the vertical axis and the negative view ‘administrative requirement’ on the
horizontal axis. One might expect to see a downward sloping relationship between the
two sets of figures, with countries where more teachers are positive about the basis
for appraisal and feedback being the countries where fewer teachers are negative

107
about the purpose of the system. But this is not the case. England is a country where
teachers are a bit more positive than average about the basis for feedback (Finland,
Japan and Australia are the three high performing countries towards the bottom of the
graph with figures at or below 30%) and right at the average in terms of negative
views about the purpose of appraisal and feedback.
33. The penultimate row in Table 5.6 shows the percentage of teachers agreeing with
another negative view – that appraisal and feedback have little impact on teaching
practices in their school. The figure for England of 34% is a bit lower than in many
other countries, including all but one high performer (Japan), implying a less negative
view on average. This contrasts with the pattern shown earlier in Table 5.3 detailing
teachers’ reports of impacts of feedback received on their own individual teaching
practices: teachers in England were less positive than in other countries with only
about half saying there had been a moderate or large impact.
Figure 5.8 Percentage of teachers who agree or strongly agree that (i) feedback is based on a
thorough assessment of teaching and (ii) appraisal and feedback are largely done to fulfil
administrative requirements: international comparison
Source: OECD (2014) Table 5.8
Note: the nine high performing countries and eight low performing countries (see Table 1.2) are plotted with closed diamonds and open triangles respectively.
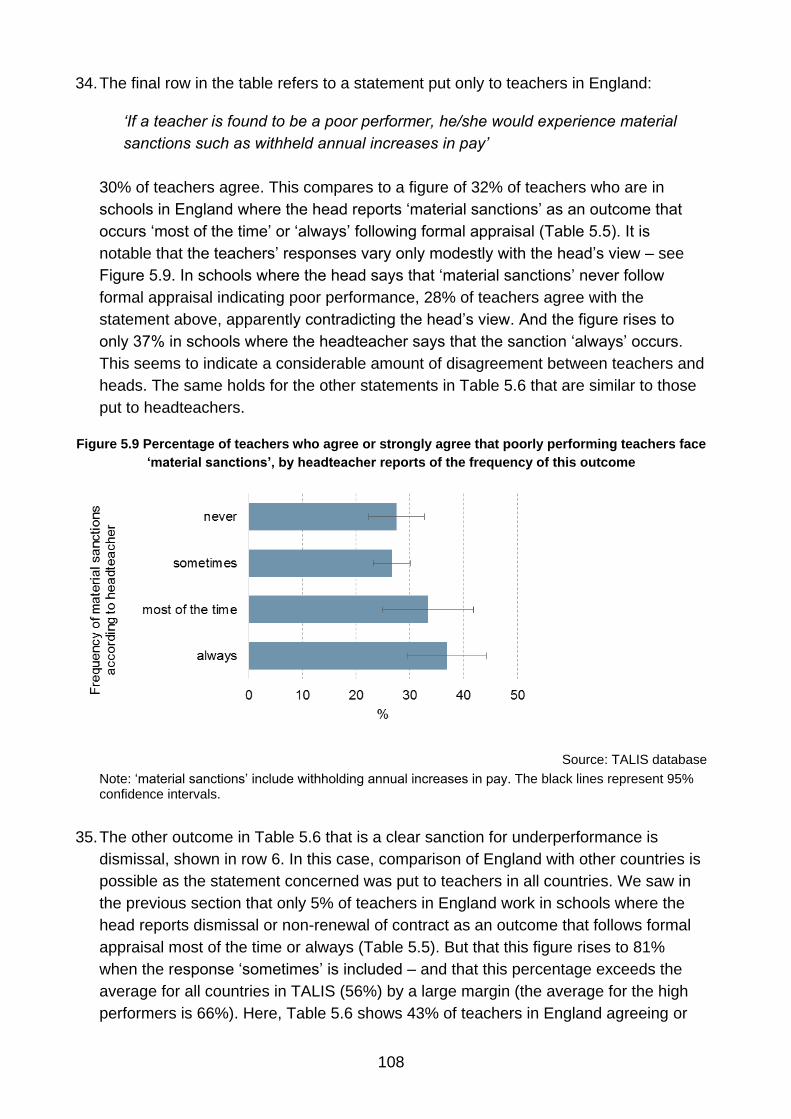
108
34. The final row in the table refers to a statement put only to teachers in England:
‘If a teacher is found to be a poor performer, he/she would experience material
sanctions such as withheld annual increases in pay’
30% of teachers agree. This compares to a figure of 32% of teachers who are in
schools in England where the head reports ‘material sanctions’ as an outcome that
occurs ‘most of the time’ or ‘always’ following formal appraisal (Table 5.5). It is
notable that the teachers’ responses vary only modestly with the head’s view – see
Figure 5.9. In schools where the head says that ‘material sanctions’ never follow
formal appraisal indicating poor performance, 28% of teachers agree with the
statement above, apparently contradicting the head’s view. And the figure rises to
only 37% in schools where the headteacher says that the sanction ‘always’ occurs.
This seems to indicate a considerable amount of disagreement between teachers and
heads. The same holds for the other statements in Table 5.6 that are similar to those
put to headteachers.
Figure 5.9 Percentage of teachers who agree or strongly agree that poorly performing teachers face
‘material sanctions’, by headteacher reports of the frequency of this outcome
Source: TALIS database
Note: ‘material sanctions’ include withholding annual increases in pay. The black lines represent 95% confidence intervals.
35. The other outcome in Table 5.6 that is a clear sanction for underperformance is
dismissal, shown in row 6. In this case, comparison of England with other countries is
possible as the statement concerned was put to teachers in all countries. We saw in
the previous section that only 5% of teachers in England work in schools where the
head reports dismissal or non-renewal of contract as an outcome that follows formal
appraisal most of the time or always (Table 5.5). But that this figure rises to 81%
when the response ‘sometimes’ is included – and that this percentage exceeds the
average for all countries in TALIS (56%) by a large margin (the average for the high
performers is 66%). Here, Table 5.6 shows 43% of teachers in England agreeing or

109
strongly agreeing that consistently underperforming teachers are likely to be
dismissed, compared to an average for high performing countries of 27% and an
average for all countries of 31%. As with the headteachers, teachers in England
report dismissal as a possible sanction more often than is the case in many other
countries.
36. We find few statistically significant differences across either school or teacher
characteristics in the percentage of teachers in England agreeing or strongly agreeing
that appraisal or feedback have little impact on teaching practice (‘little impact upon
the way teachers teach in the classroom’). Figure 5.10 shows two of them. Teachers
in independent schools are substantially more likely to hold this view than teachers in
state-funded schools (49% compared to 31%) and there is also a small difference
between men and women (37% compared to 32%).65
Figure 5.10 Percentage of teachers who agree or strongly agree that appraisal and feedback have
little impact on teaching practices in their school, by school type and teacher gender
Source: TALIS database
Note: The black lines represent 95% confidence intervals.
5.6 Summary
37. This chapter has shown that England has near universal systems of appraisal of
teachers, reported by school heads, and that the great majority of teachers in England
report receiving feedback, whether through formal appraisal or more informal avenues
of comment. England is a high appraisal/feedback country compared with the average
65
Independent school teachers are also more likely than teachers in maintained schools and academies to agree or strongly agree that appraisal and feedback are largely done to fulfil administrative requirements: 65% compared to 48%, a difference which is again statistically significant. But in this case there is no difference by gender.
110
TALIS country and with some but not all of the high performers. The latter, as in the
analyses of other chapters in this report, display considerable variation.
38. But we have also seen that teachers in England tend to be rather less positive about
the effect of feedback than teachers in many other countries. We noted various
possible explanations for this but it is impossible to choose between them.
39. Within England, there is some indication of less feedback in independent schools, and
feedback that is seen as less effective on the teacher’s own job and career or
teaching practices in the school in general.
40. There is also some evidence (but not a lot) of variation across schools with different
Ofsted ratings, with teachers in ‘outstanding’ schools reporting more feedback from
some sources. However, we found no significant differences across Ofsted ratings in
simple summary measures of the number of different sources of feedback or the
number of positive changes in teaching that occurred as the result of feedback.
41. We have only scraped the surface of the data as far as the comparisons that can be
made of each headteacher’s views of appraisal and feedback and the teachers’ views
within the same school, but enough to show that teachers and heads in England do
not always agree.
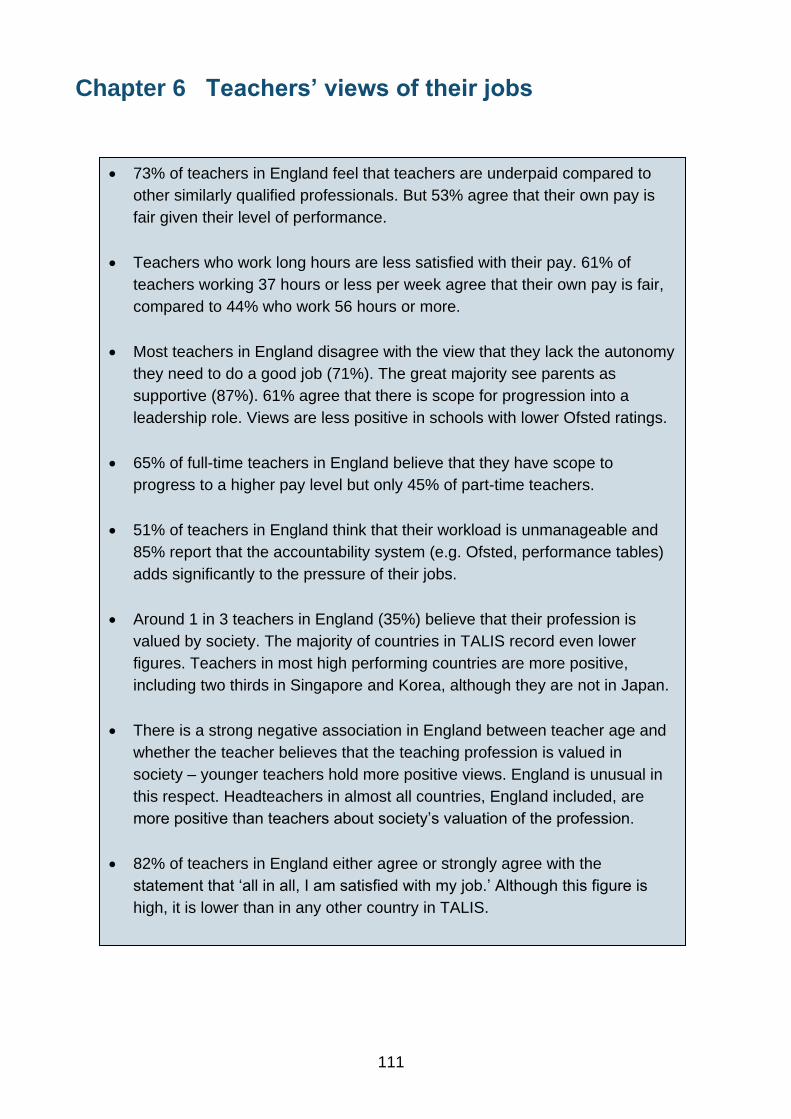
111
Chapter 6 Teachers’ views of their jobs
73% of teachers in England feel that teachers are underpaid compared to
other similarly qualified professionals. But 53% agree that their own pay is
fair given their level of performance.
Teachers who work long hours are less satisfied with their pay. 61% of
teachers working 37 hours or less per week agree that their own pay is fair,
compared to 44% who work 56 hours or more.
Most teachers in England disagree with the view that they lack the autonomy
they need to do a good job (71%). The great majority see parents as
supportive (87%). 61% agree that there is scope for progression into a
leadership role. Views are less positive in schools with lower Ofsted ratings.
65% of full-time teachers in England believe that they have scope to
progress to a higher pay level but only 45% of part-time teachers.
51% of teachers in England think that their workload is unmanageable and
85% report that the accountability system (e.g. Ofsted, performance tables)
adds significantly to the pressure of their jobs.
Around 1 in 3 teachers in England (35%) believe that their profession is
valued by society. The majority of countries in TALIS record even lower
figures. Teachers in most high performing countries are more positive,
including two thirds in Singapore and Korea, although they are not in Japan.
There is a strong negative association in England between teacher age and
whether the teacher believes that the teaching profession is valued in
society – younger teachers hold more positive views. England is unusual in
this respect. Headteachers in almost all countries, England included, are
more positive than teachers about society’s valuation of the profession.
82% of teachers in England either agree or strongly agree with the
statement that ‘all in all, I am satisfied with my job.’ Although this figure is
high, it is lower than in any other country in TALIS.

112
1. This chapter focuses on teachers’ attitudes and beliefs surrounding the teaching
profession, and their reflections on their own careers. It attempts to answer the
following four questions:
Do teachers believe that their pay is fair?
Are teachers satisfied with their working conditions?
Do teachers believe their profession is valued in society?
Are teachers happy in their jobs?
2. Given the data collected in TALIS, the first two questions can be addressed only for
England. But comparisons with other countries can be made when dealing with the
third and fourth questions.
6.1 Do teachers believe that their pay is fair?
3. As part of the TALIS questionnaire in England, teachers were asked whether they
strongly agree, agree, disagree or strongly disagree with the following two statements
about their pay:
‘Teachers are underpaid compared to other qualified professionals with similar
levels of responsibility’
‘My own pay is fair given my performance’
4. This part of the chapter explores teachers’ reactions to these statements, providing
insight into how teachers view their level of pay.
5. Teachers in England clearly feel that they are underpaid compared to other similarly
qualified professionals. Just 27% of respondents disagreed or strongly disagreed that
teachers are underpaid compared to other professionals. In contrast, 47% agreed that
they were underpaid and 27% strongly agreed.66
6. However, teachers’ views on their own pay, given their own level of performance, are
much more evenly split. The majority of teachers (53%) either agreed or strongly
agreed that their pay is fair given their level of performance. Only a small minority of
respondents (8%) expressed strong dissatisfaction with their pay.
66
The figures do not sum to 100 due to rounding. As we noted in Chapter 1, it is important to bear in mind that teachers’ views of pay that are recorded in TALIS refer to the Spring of 2013. These views may have changed subsequently.
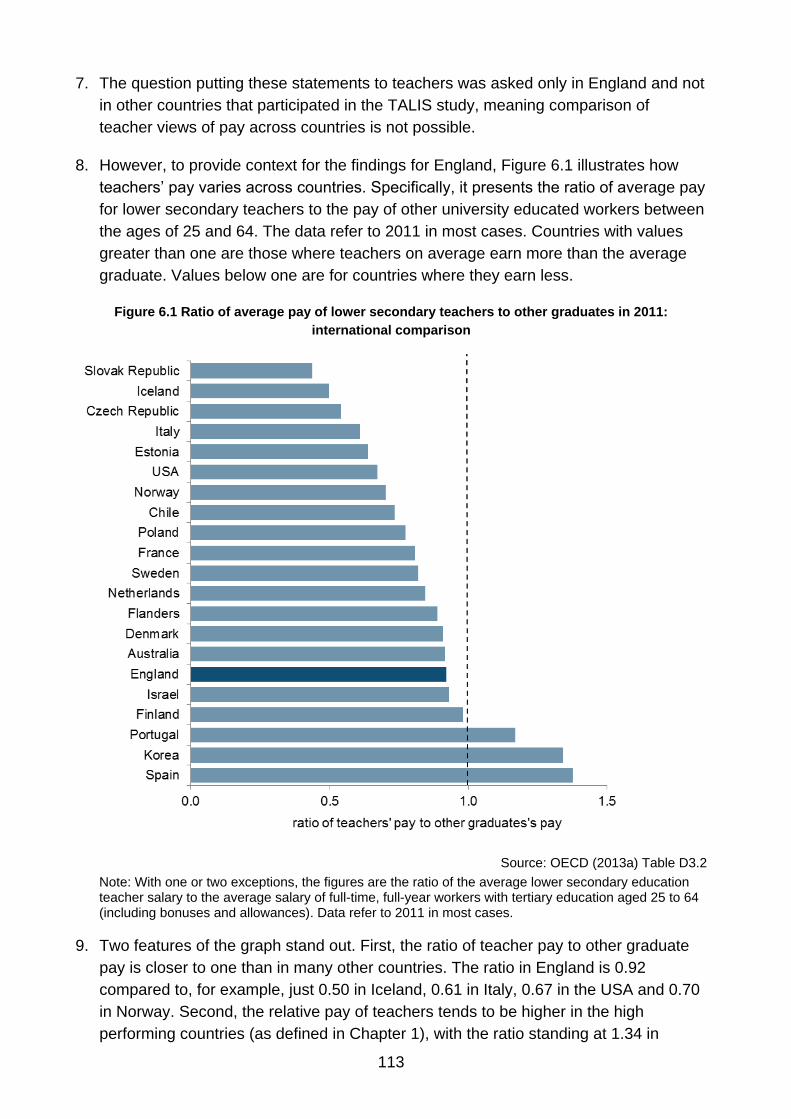
113
7. The question putting these statements to teachers was asked only in England and not
in other countries that participated in the TALIS study, meaning comparison of
teacher views of pay across countries is not possible.
8. However, to provide context for the findings for England, Figure 6.1 illustrates how
teachers’ pay varies across countries. Specifically, it presents the ratio of average pay
for lower secondary teachers to the pay of other university educated workers between
the ages of 25 and 64. The data refer to 2011 in most cases. Countries with values
greater than one are those where teachers on average earn more than the average
graduate. Values below one are for countries where they earn less.
Figure 6.1 Ratio of average pay of lower secondary teachers to other graduates in 2011:
international comparison
Source: OECD (2013a) Table D3.2
Note: With one or two exceptions, the figures are the ratio of the average lower secondary education teacher salary to the average salary of full-time, full-year workers with tertiary education aged 25 to 64 (including bonuses and allowances). Data refer to 2011 in most cases.
9. Two features of the graph stand out. First, the ratio of teacher pay to other graduate
pay is closer to one than in many other countries. The ratio in England is 0.92
compared to, for example, just 0.50 in Iceland, 0.61 in Italy, 0.67 in the USA and 0.70
in Norway. Second, the relative pay of teachers tends to be higher in the high
performing countries (as defined in Chapter 1), with the ratio standing at 1.34 in

114
Korea, 0.98 in Finland and 0.84 in the Netherlands. It is also interesting to note that
the relative pay of teachers to other graduates in England is exceeded in only two of
the six high performing countries present in the graph.
10. Tables 6.1 (pay relative to other professions) and 6.2 (own pay) investigate how
teachers’ views on pay differ with personal and job characteristics and with school
type. The teachers’ views do not seem to vary systematically with gender, age or
whether the teacher works full or part time. Nor are the differences by type of school
statistically significant. The somewhat negative views of pay in England hold across a
broad spectrum of teachers – it is not confined to just certain groups.
Table 6.1 Teacher views on whether teachers are underpaid compared to other professions, by
teacher and school characteristics (percentages)
strongly disagree
disagree agree strongly
agree
Gender
Female 2 25 48 25
Male 3 23 44 30
FT or PT teacher?
Full-time 3 23 47 27
Part-time 2 28 44 26
Age
below 25 2 20 54 23
25-29 1 20 48 31
30-39 3 28 43 27
40-49 3 26 46 24
50-59 3 20 53 25
60+ 4 19 38 39
School Type
Maintained 2 26 45 26
Academy 3 24 47 26
Independent 2 18 52 28
All 3 24 47 27
Source: TALIS database
Note: figures may not sum to 100 due to rounding.
11. However, teachers who work longer hours tend to hold more negative views
surrounding teacher pay – see Figure 6.2. Recall from Chapter 2 that teachers in
England reported some of the longest working hours of any country that took part in
TALIS. About 55% of teachers who work between 35 and 45 hours per week believe
their own pay is fair and 70% believe teachers are generally underpaid relative to
other comparable professions. In contrast, less than 40% of teachers who work more
than 65 hours per week see their own pay as fair. (Note that only one in ten teachers
report working such long working hours – see Table 2.5.) We find this relationship
between hours worked and satisfaction with pay to be statistically significant at
conventional thresholds.
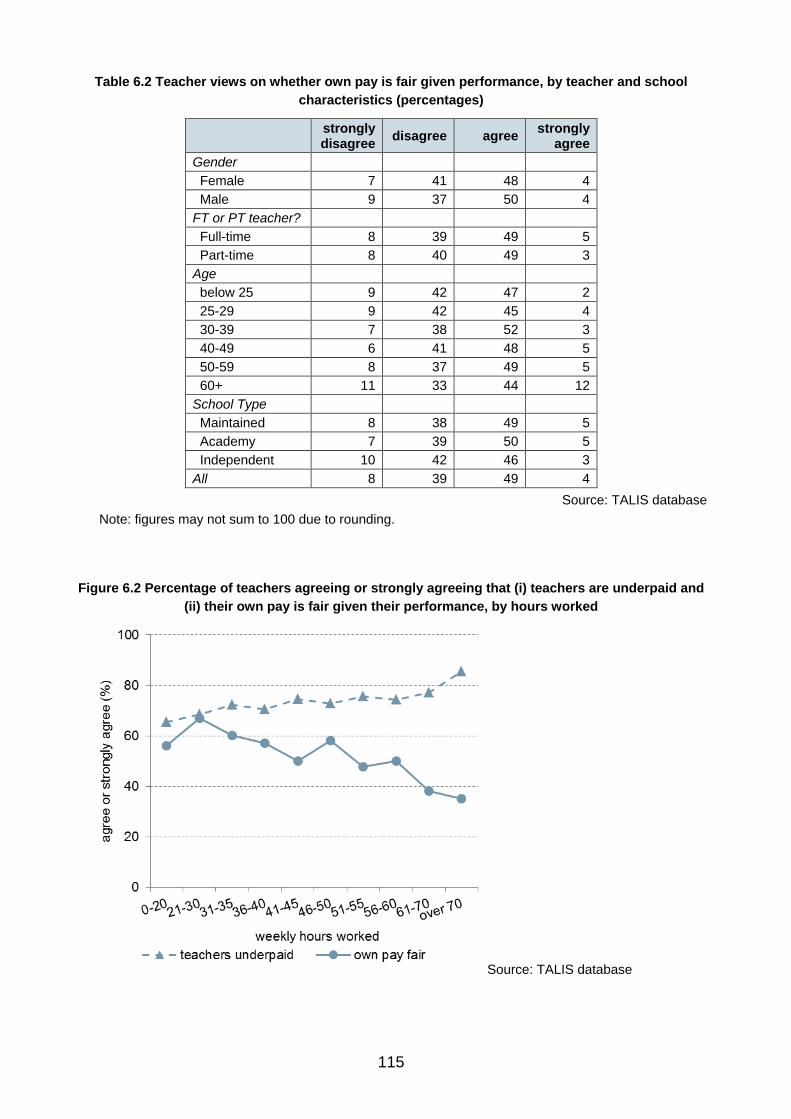
115
Table 6.2 Teacher views on whether own pay is fair given performance, by teacher and school
characteristics (percentages)
strongly disagree
disagree agree strongly
agree
Gender
Female 7 41 48 4
Male 9 37 50 4
FT or PT teacher?
Full-time 8 39 49 5
Part-time 8 40 49 3
Age
below 25 9 42 47 2
25-29 9 42 45 4
30-39 7 38 52 3
40-49 6 41 48 5
50-59 8 37 49 5
60+ 11 33 44 12
School Type
Maintained 8 38 49 5
Academy 7 39 50 5
Independent 10 42 46 3
All 8 39 49 4
Source: TALIS database
Note: figures may not sum to 100 due to rounding.
Figure 6.2 Percentage of teachers agreeing or strongly agreeing that (i) teachers are underpaid and
(ii) their own pay is fair given their performance, by hours worked
Source: TALIS database

116
12. Is it long working hours that is causing these teachers to be dissatisfied with their
pay? It is impossible to provide a definitive answer to this question, but we can
provide some insight by examining whether the link between long working hours and
dissatisfaction with pay can be explained by observable teacher characteristics. In
other words, is it the long hours in themselves which is responsible for the feeling of
unfair pay? Or is this finding simply a reflection of certain types of teachers choosing
or being obliged (‘selecting’) to work long hours?
13. To answer this question, we estimate a simple linear probability model, with the
dependent variable taking a value of 1 if a teacher views their pay as fair (strongly
agree or agree with the statement that their own pay is fair) and 0 otherwise.67 The
covariate of interest, working hours, is divided into four equal groups (quartiles) as
follows:68
Bottom Quartile (low working hours) = 0 – 37 hours per week
Second Quartile = 38 – 48 hours per week
Third Quartile = 49 – 55 hours per week
Top Quartile (high working hours) = 56 – 90 hours per week
14. To begin, the working hours quartile dummy variables are the only explanatory
variables included in the model (the bottom quartile is set to the reference group). We
refer to this as Model 1. Other explanatory variables are then added to the model, in
an attempt to explain why teachers who work longer hours are less satisfied with their
pay. These control variables are added sequentially in blocks. In Model 2 we include
basic demographic variables (gender, age, educational attainment, whether the
teacher works part time and their subject specialism). Model 3 additionally controls for
the home circumstances of teachers (if they are married or cohabiting, and whether
they have children). Model 4 then adds explanatory variables reflecting teachers’
views of their school, such as whether the school has effective management, and
whether they feel they have enough autonomy in their role. Finally, Model 5 then
additionally controls for characteristics of a typical class that they teach (e.g.
percentage of disadvantaged children, percentage SEN, percentage low achievers, all
as perceived by the teacher).
15. The results are illustrated in Figure 6.3. The length of each bar shows the estimated
difference in the percentage probability of a teacher disagreeing with the statement
that their own pay is fair, comparing those in the top and bottom quartiles of working
hours.
67
That is, an OLS regression with a 0/1 dependent variable. 68
Approximately 70% of teachers who report they are working part-time are within the bottom working hours quartile, with a further 20% in the second quartile.
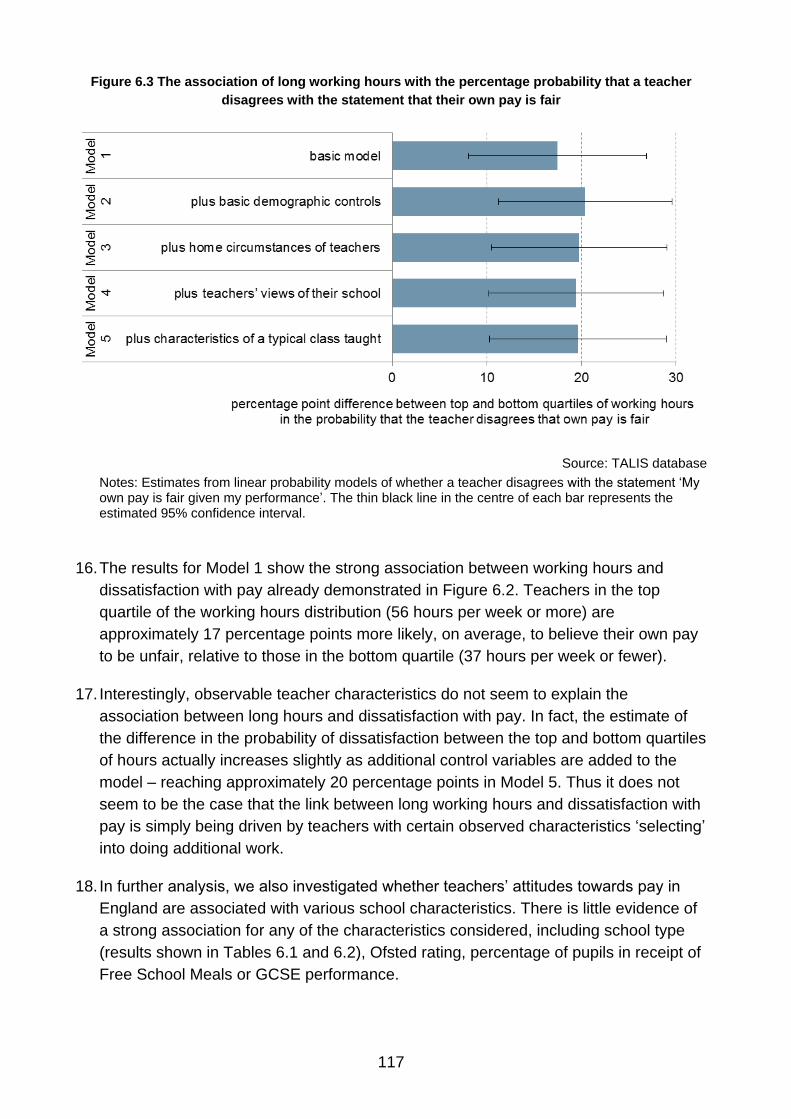
117
Figure 6.3 The association of long working hours with the percentage probability that a teacher
disagrees with the statement that their own pay is fair
Source: TALIS database
Notes: Estimates from linear probability models of whether a teacher disagrees with the statement ‘My own pay is fair given my performance’. The thin black line in the centre of each bar represents the estimated 95% confidence interval.
16. The results for Model 1 show the strong association between working hours and
dissatisfaction with pay already demonstrated in Figure 6.2. Teachers in the top
quartile of the working hours distribution (56 hours per week or more) are
approximately 17 percentage points more likely, on average, to believe their own pay
to be unfair, relative to those in the bottom quartile (37 hours per week or fewer).
17. Interestingly, observable teacher characteristics do not seem to explain the
association between long hours and dissatisfaction with pay. In fact, the estimate of
the difference in the probability of dissatisfaction between the top and bottom quartiles
of hours actually increases slightly as additional control variables are added to the
model – reaching approximately 20 percentage points in Model 5. Thus it does not
seem to be the case that the link between long working hours and dissatisfaction with
pay is simply being driven by teachers with certain observed characteristics ‘selecting’
into doing additional work.
18. In further analysis, we also investigated whether teachers’ attitudes towards pay in
England are associated with various school characteristics. There is little evidence of
a strong association for any of the characteristics considered, including school type
(results shown in Tables 6.1 and 6.2), Ofsted rating, percentage of pupils in receipt of
Free School Meals or GCSE performance.

118
19. Teachers in England were also asked whether they believe they have scope to
progress to a higher pay level. 38% of teachers either disagreed or strongly disagreed
while 53% agreed and 9% strongly agreed. There is also some variation in teacher
responses by their gender or subject area. Only 45% of teachers working part-time
either agreed or strongly agreed that they had scope for pay progression, compared
to 65% of teachers working full-time. As one might expect, younger teachers were
much more optimistic about opportunities for pay progression than older teachers.
6.2 Are teachers satisfied with their working conditions?
20. Teachers in England (but not other countries) were asked a lengthy additional
question related to their working lives. This section focuses on their responses to four
statements concerning working conditions and the ability to operate effectively as a
teacher. The statements relate to (i) autonomy, (ii) workload, (iii) the support of
parents and (iv) scope for progression into leadership.
21. Specifically, teachers were asked to respond to the following four statements, using a
four point scale from ‘strongly disagree’ to ‘strongly agree’:
‘I do not have the autonomy I need to do a good job as a teacher’
‘My workload is unmanageable’
‘Parents are supportive of my role as their children’s teacher’
‘I have scope to progress into a leadership team role’
22. Most teachers in England either disagree (56%) or strongly disagree (15%) with the
statement that they lack the autonomy they need to do a good job as a teacher.
Similarly, the vast majority of teachers see parents as being supportive of their role
(76% agree with the statement above and a further 11% strongly agree). The majority
of teachers also see opportunities for progression into leadership roles, with more
than 60% agreeing or strongly agreeing that there is scope for progression.
23. However, many teachers view their workload as unmanageable. 38% of those
surveyed agreed with this statement with a further 13% strongly agreeing – about a
half in total.
24. Most teachers believe that the accountability system adds significant pressure and
workload to their job. 85% of teachers in England reported that factors such as Ofsted
inspection and school league tables added significant pressure. Similarly, 77% of
teachers saw the accountability system as adding significantly to their workload – with
more than a quarter of teachers (27%) expressing a strong view. There was relatively
little variation in these views by teacher gender, part-time/full-time working status,
subject specialism and working hours. However, only 64% of independent school
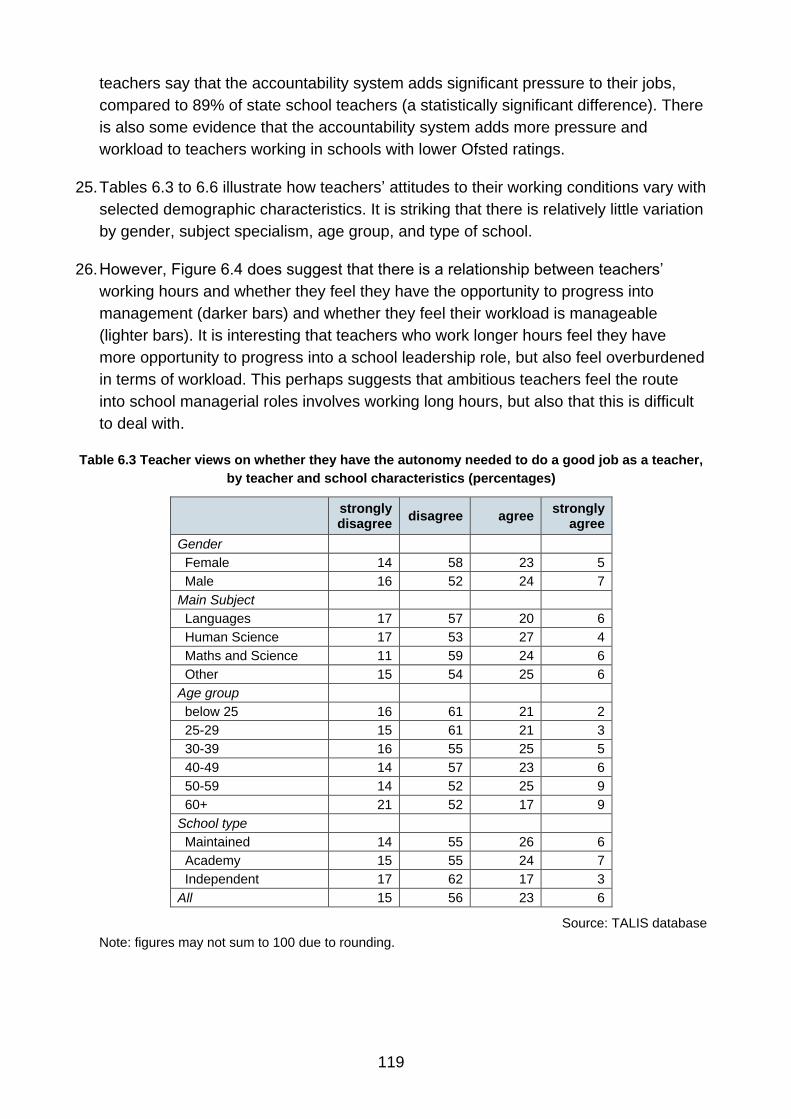
119
teachers say that the accountability system adds significant pressure to their jobs,
compared to 89% of state school teachers (a statistically significant difference). There
is also some evidence that the accountability system adds more pressure and
workload to teachers working in schools with lower Ofsted ratings.
25. Tables 6.3 to 6.6 illustrate how teachers’ attitudes to their working conditions vary with
selected demographic characteristics. It is striking that there is relatively little variation
by gender, subject specialism, age group, and type of school.
26. However, Figure 6.4 does suggest that there is a relationship between teachers’
working hours and whether they feel they have the opportunity to progress into
management (darker bars) and whether they feel their workload is manageable
(lighter bars). It is interesting that teachers who work longer hours feel they have
more opportunity to progress into a school leadership role, but also feel overburdened
in terms of workload. This perhaps suggests that ambitious teachers feel the route
into school managerial roles involves working long hours, but also that this is difficult
to deal with.
Table 6.3 Teacher views on whether they have the autonomy needed to do a good job as a teacher,
by teacher and school characteristics (percentages)
strongly disagree
disagree agree strongly
agree
Gender
Female 14 58 23 5
Male 16 52 24 7
Main Subject
Languages 17 57 20 6
Human Science 17 53 27 4
Maths and Science 11 59 24 6
Other 15 54 25 6
Age group
below 25 16 61 21 2
25-29 15 61 21 3
30-39 16 55 25 5
40-49 14 57 23 6
50-59 14 52 25 9
60+ 21 52 17 9
School type
Maintained 14 55 26 6
Academy 15 55 24 7
Independent 17 62 17 3
All 15 56 23 6
Source: TALIS database
Note: figures may not sum to 100 due to rounding.

120
Table 6.4 Teacher views on whether their workload is unmanageable, by teacher and school
characteristics (percentages)
Source: TALIS database
Note: figures may not sum to 100 due to rounding.
Table 6.5 Teacher views on whether parents are supportive, by teacher and school characteristics
(percentages)
Source: TALIS database
Note: figures may not sum to 100 due to rounding.
strongly disagree
disagree agree strongly
agree
Gender
Female 3 43 41 13
Male 4 49 35 12
Main Subject
Languages 2 43 41 14
Human Science 4 42 38 16
Maths and Science 3 48 37 12
Other 4 47 38 11
Age group
below 25 4 39 51 7
25-29 2 48 37 13
30-39 3 44 39 14
40-49 4 48 36 12
50-59 4 45 39 12
60+ 11 38 39 12
School type
Maintained 3 43 41 13
Academy 3 45 38 14
Independent 4 53 33 10
All 3 45 38 13
strongly disagree
disagree agree strongly
agree
Gender
Female 2 12 76 10
Male 2 11 75 12
Main Subject
Languages 2 12 77 10
Human Science 2 9 81 8
Maths and Science 3 10 76 12
Other 1 13 74 12
Age group
below 25 3 9 76 12
25-29 2 14 76 8
30-39 2 11 78 9
40-49 2 11 75 12
50-59 2 10 75 13
60+ 2 6 69 24
School type
Maintained 2 14 75 9
Academy 2 11 77 11
Independent 1 7 77 16
All 2 11 76 11

121
Table 6.6 Teacher views on whether they have scope to progress into a leadership team role, by
teacher and school characteristics (percentages)
Source: TALIS database
Note: figures may not sum to 100 due to rounding.
Figure 6.4 Percentage of teachers agreeing or strongly agreeing that (i) they have scope to
progress into a leadership team role and (ii) their workload is unmanageable, by hours of work
Source: TALIS database
Notes: The thin black line in the centre of each bar represents the estimated 95% confidence interval.
strongly disagree
disagree agree strongly
agree
Gender
Female 7 33 52 8
Male 9 28 50 12
Main Subject
Languages 7 30 53 10
Human Science 7 31 48 14
Maths and Science 7 30 54 8
Other 10 32 49 9
Age group
below 25 2 26 61 10
25-29 5 23 59 13
30-39 6 30 53 11
40-49 9 30 51 9
50-59 12 42 40 5
60+ 20 30 40 9
School type
Maintained 9 29 51 11
Academy 8 32 50 10
Independent 5 35 56 4
All 8 31 51 10

122
27. How do teachers’ attitudes to their working conditions vary with the characteristics of
the schools that they work in? Figure 6.5 illustrates the association between the
Ofsted rating of the school and the percentage of teachers either agreeing or strongly
agreeing with the four statements provided at the start of this section.
28. Teachers working in schools with lower Ofsted ratings are less favourable about their
working conditions.69 Whereas only 20% of teachers in ‘outstanding’ schools report a
lack of autonomy, this increases to almost 40% in ‘inadequate’ schools. Similarly,
whereas approximately 50% of teachers in outstanding schools report their workload
is unmanageable, this increases to 60% for schools that were rated as inadequate.
Figure 6.5 Percentage of teachers agreeing or strongly agreeing with statements on (i) autonomy,
(ii) workload, (iii) parent support and (iv) progression, by Ofsted rating of school
Source: TALIS database
29. Figure 6.6 provides a similar breakdown, but now based upon quartiles of Key Stage
4 test scores. Teachers working in schools with lower average test scores are more
likely to agree that they lack autonomy and have an unmanageable workload. They
are also more likely to disagree (or strongly disagree) that parents are supportive of
their role and that they have opportunities for progression into leadership roles. It is
important to remember that these estimates refer to simple associations – they do not
reveal whether working in a poor performing school leads to these negative attitudes,
69
To test whether the differences by Ofsted rating plotted in Figure 6.5 are statistically significant, a variable with values 1 (‘outstanding’) to 4 (‘inadequate’) was entered as a covariate into linear probability regression models for agreement with each statement (agree or strongly agree coded as 1 and other responses as 0). The estimated coefficient was statistically significant at the 5% level in each case.

123
or whether these negative attitudes leads to a lower performing school. The same
holds true for the link found with Ofsted rating discussed in the paragraph above.
Figure 6.6 Percentage of teachers agreeing or strongly agreeing with statements on (i) autonomy,
(ii) workload, (iii) parent support and (iv) progression, by Key Stage 4 test quartile of school
Source: TALIS database
Notes: The thin black line in the centre of each bar represents the estimated 95% confidence interval.
30. In additional analysis, we also explored the association between teacher attitudes and
school type. Differences between academies and maintained schools are small. But
there is some suggestion that teachers at independent schools are somewhat more
positive. For example, only 43% of teachers within independent schools agreed or
strongly agreed that their workload is unmanageable, compared to 52% of teachers in
academies and 54% of those in maintained schools. However, caution is needed
when interpreting this finding due to the small sample size within the independent
group.70
6.3 Do teachers believe their profession is valued in society?
31. In the rest of this chapter we analyse answers to questions asked in all countries in
TALIS. This means we can compare the views of teachers in England with those of
teachers in other countries, as well as seeing how teachers’ views vary within
England.
70
A formal test failed to reject the null hypothesis of no association between school type and the questions on autonomy, workload and progression.

124
32. Teachers were asked to what extent they agree with the following statement:
‘I think that the teaching profession is valued in society’
33. The majority of teachers in England did not agree. One in five (21%) strongly
disagreed, while a further 44% disagreed. About one in three teachers in England
agreed (30%) or strongly agreed (5%) that teaching is a valued profession in society.
34. Interestingly, there is a strong and statistically significant association between the
Ofsted rating of the school that the teacher works in and whether they believe that the
teaching profession is valued by society. In schools rated ‘outstanding’ or ‘good’,
approximately 37% of teachers agreed with the statement presented above. This
compares to approximately 30% of teachers in ‘satisfactory’ schools and just 20% of
those in ‘inadequate’ schools.
Figure 6.7 Percentage of teachers who agree or strongly agree that the teaching profession is
valued in society: international comparison
Source: OECD (2014) Table 7.2
Notes: The thin black line in the centre of each bar represents the estimated 95% confidence interval.

125
35. Figure 6.7 compares across the TALIS countries the percentage of respondents who
agree or strongly agree that the teaching profession is valued. There is clearly a huge
amount of variation in teachers’ views. England sits in the top half of the distribution of
the 33 countries, a little way above the median value of 28% (Japan).
36. Whereas 35% of teachers in England agreed or strongly agreed that teaching is a
valued profession, less than 10% did so in some other European countries – including
Sweden, Spain and France.
37. Most high performers are towards the top of the graph, occupying seven of the ten
places above England. (The average for the high performers is 45%.) These countries
include Singapore and Korea, where approximately two thirds of teachers believe that
the teaching profession is valued by society. But there are also exceptions: Japan,
where as already noted only 28% of teachers agree or strongly agree that society
values the teaching profession, and Estonia, where the figure is even lower – 14%.
Notwithstanding these counterexamples, the graph in general shows that more
teachers believe that their profession is valued by society where educational systems
perform well (in the sense defined in Chapter 1). However, the direction of causation
here is not clear. Does the high value that society places on the teaching profession
lead to higher performance on international tests? Or do the high educational
standards in these countries lead society to value teachers more, or at least lead
teachers to believe so? Or does another factor drive both performance and society’s
valuation? Further work is needed to untangle this issue.
38. Figure 6.8 shows for England the relationship between age (horizontal axis) and
whether teachers believe society values their profession (vertical axis). There is
clearly a negative relationship, with older teachers seeing the profession as less
valued by society than younger teachers. Around 40% of teachers between the ages
of 20 and 30 agreed or strongly agreed that teaching is a profession that is valued by
society. This compares to about 25-30% of 55 to 65 year olds.
39. Does this negative association between teacher age and agreement with the
statement ‘I think that the teaching profession is valued in society’ hold across other
countries? In other words, does the pattern observed in Figure 6.8 hold elsewhere in
the world? To test this hypothesis, we estimate a linear probability model, with the
response variable coded as 1 if the teacher agrees or strongly agrees with the
statement given above, and zero otherwise.71 The age of the teacher is entered as
the sole covariate (and as a continuous variable). This model is estimated separately
for each country in TALIS.
40. Figure 6.9 shows the results in the form of the predicted change in the percentage
probability of agreeing that the teaching profession is valued for a ten year increase in
71
As with the models behind the results in Figure 6.3, this linear probability model is an OLS regression with a 0/1 dependent variable.

126
teacher age. For example, the value for England (-4.9) indicates that a ten year
increase in teacher age is associated with a 4.9 percentage point decline in
agreement (or strong agreement) that the teaching profession is valued by society.
This reflects the pattern for England that has just been shown in more detail in Figure
6.8.
Figure 6.8 Percentage of teachers who agree or strongly agree that the teaching profession is
valued in society, by age
Source: TALIS database
Notes: The thin black line in the centre of each bar represents the estimated 95% confidence interval.
41. England is down the bottom of the graph – it is one of the countries where the decline
in agreement with age is strongest. The thin black lines running through the bars
show the ‘margins of error’ around the estimates (the 95% confidence intervals) and
many of these include the value zero. In only eight countries, of which England is one,
can we be confident that there is a decline in agreement with age. Amongst these
eight countries, Australia is the only high performer. But there are a number of high
performing countries where the opposite pattern holds. In Flanders, Alberta, Japan
and Singapore, which occupy four of the top six positions in the graph, older teachers
are significantly more likely to agree that the teaching profession is valued by society.
This link is particularly strong in Singapore – a ten year increase in teacher age is
associated with a 5.6 percent point increase in agreement that society values
teachers.72
42. Figure 6.9 provides strong evidence that the pattern observed in Figure 6.8 for
England, of younger teachers having a more positive view, is not one that is common
72
The difference between England and 24 of the other 30 countries included in the analysis is significant at either the 5% or 1% threshold of statistical significance (along with a further three countries at the 10% threshold).

127
across all countries – England is in a minority in this respect. The position of the four
high performing countries just identified, where younger teachers are less positive
than older teachers, does not seem a cause for envy (although one should not lose
sight of the overall levels in each country shown in Figure 6.7, especially for
Singapore). Moreover, it is worth recalling that teachers in England are younger on
average than in many other countries (see Table 2.1). Hence, although older teachers
in England seem to hold more negative views of their profession, they account for a
lower proportion of the total teacher ‘stock’ than in other countries.
Figure 6.9 The relationship between agreement that the teaching profession is valued in society
and teacher age: international comparison
Source: TALIS datatabase
Notes: The regression model behind the results in this graph is explained in the text. The thin black line in the centre of each bar represents the estimated 95% confidence interval.
43. As part of the TALIS survey, headteachers were asked an identical question about
whether teaching is a valued profession in society and we have already analysed their
answers in Chapter 3. Headteachers in England were much more positive than

128
teachers. Figure 3.7 showed that 60% agreed or strongly with the statement offered
to them.
44. Do headteachers provide more positive responses than their teachers to this question
in all countries? Or is England exceptional in this respect? The answers are shown in
Figure 6.10. The percentage of teachers who agreed or strongly agreed with the
statement that the teaching profession is valued in society is plotted along the
horizontal axis. The figures for the headteachers’ responses are plotted on the vertical
axis. A 45 degree line has been superimposed on the graph. Countries that sit above
this line are where headteachers are more positive about the status of teaching in
society than the individual teachers themselves.
Figure 6.10 Percentage of (i) headteachers and (ii) teachers who agree or strongly agree that the
teaching profession is valued in society: international comparison
Source: OECD (2014) Table 3.26.Web and 7.2
Note: the nine high performing countries and eight low performing countries (see Table 1.2) are plotted with closed diamonds and open triangles respectively.
45. Of the 33 countries included in the analysis, just four sit below the 45 degree line
(Italy, Estonia, Serbia, and the Slovak Republic). In the vast majority of countries,
headteachers are more likely to agree or strongly agree that their profession is valued
by society than the teachers within their schools. England is therefore not unusual in
this respect.
46. Two other features of Figure 6.10 stand out. First, there is a very strong cross-
national correlation between teacher and headteacher reports (the correlation

129
coefficient for the two sets of percentages is 0.95). In other words, teachers are more
likely to provide positive responses in countries where headteachers also provide
positive responses.73 Second, the high performing countries (solid diamond symbols)
tend to be towards the top and right of the graph. This reinforces the earlier message
of Figure 6.7; in high performing countries, both teachers and headteachers are more
likely to agree or strongly agree that the teaching profession is valued within society.
6.4 Are teachers happy in their jobs?
47. The previous sections of this chapter have indicated that a non-trivial percentage of
teachers are not particularly satisfied with certain aspects of their career. A significant
proportion of teachers in England believe that their profession is underpaid, and that
the workload is unmanageable. But, overall, are teachers happy in their jobs? And, in
hindsight, do they believe they made the right decision to become a school teacher?
48. As part of TALIS, teachers were asked for their opinions on the following statements:
‘I regret that I decided to become a teacher’
‘I wonder whether it would have been better to choose another profession’
‘If I could decide again, I would still choose to work as a teacher’
‘All in all, I am satisfied with my job’
49. Using the teachers’ reactions to these statements, this section addresses the broad
issue of whether teachers in England are happy with their jobs and choice of career.
50. Table 6.7 shows that despite some dissatisfaction with pay and working conditions,
the vast majority of teachers in England indicate that they are satisfied with their job
(82% either agree or strongly agree), and if they were to make the decision again,
they would still choose teaching (80%). Approximately one in twelve teachers (8%)
expressed some degree of regret in becoming a teacher. A much higher fraction –
more than one in three teachers (35%) – did wonder whether it would have been
better for them to have chosen another profession and it is possible that these are the
teachers who are most at risk of dropping out of the profession.
51. The figures reported in Table 6.7 should be viewed in the light of the proportion of
teachers who leave the profession. Cross-national data on teacher attrition appear not
to be readily available, but ‘wastage’ rates are published for England based on the
School Workforce Census. Around one in ten teachers in publicly-funded schools in
73
Note that we cannot conclude from this that there tends to strong agreement between heads and the teachers within their own schools – that would be an example of the ‘ecological fallacy’ that we mentioned in Chapter 1.

130
England leaves the profession every year (a ‘wastage rate’ of around 10 percent).74 It
is of course likely that those teachers who choose to leave the profession are the
ones who really were the least satisfied in their jobs. Consequently, ‘self-selection’ will
have an influence upon reported levels of teacher satisfaction; individuals who trained
as teachers but who were not satisfied in their job are likely to have left the profession
– and in this case their views will not be captured in TALIS.
Table 6.7 Teachers’ views on statements about their job and career (percentages)
strongly disagree
disagree agree strongly
agree total
I regret that I decided to become a teacher
52 40 6 2 100
I wonder whether it would have been better to choose another profession
29 36 29 5 100
If I could decide again, I would still choose to work as a teacher
5 16 48 32 100
All in all, I am satisfied with my job 3 16 61 21 100
Source: TALIS database
Note: figures may not sum to 100 due to rounding.
52. How do these figures compare to those in other countries? Figure 6.11 shows the
percentage of respondents who agree with the statements that they regret becoming
a teacher (horizontal axis) and whether they are satisfied in their job (vertical axis).
Note that we have deliberately chosen to plot the data on axes that run from 0 to
100%, a point we return to below.
53. Starting with regret over choice of career, England is placed in the middle of the
distribution of countries. Note also that the high performing countries are found
everywhere, although that is hard to see given the bunching in the data. For example,
20% of teachers in Korea express some regret with choosing the teaching profession,
whereas the figure is only 5% in Finland, Flanders and the Netherlands. Hence, that
8% of England’s lower secondary teachers regret their choice of profession is not a
substantially different situation to that in most other countries, including most of the
high performing countries.
54. However, the same is not true of teachers’ overall level of satisfaction in their job. Of
the 33 countries included in graph, England has the lowest figure for the percentage
of teachers who agree or strongly agree that they are satisfied. This finding is not just
due to the chance variation that comes when drawing a survey sample – the
difference between England and every other country is statistically significant at the
conventional threshold typically used for such comparisons.75 In most countries, more
74
See https://www.gov.uk/government/publications/school-workforce-in-england-november-2012, Additional Table C2. 75
The 5% significance level.

131
than 90% of teachers express satisfaction. The two high performers that are closest
to England are Japan (85%) and Korea (87%).
55. But, to put this into perspective, it is important to emphasise the absolute level of
satisfaction in England rather than just focusing on the position relative to other
countries: 82% of teachers agree or strongly agree with the statement ‘All in all, I am
satisfied with my job.’ The high levels of satisfaction with jobs and the low levels of
regret about career choice – in almost all countries – are emphasised by our choice of
scale for the axes of the graph: the full range from 0 to 100%.
Figure 6.11 Percentage of teachers who agree or strongly agree (i) they are satisfied with their job
and (ii) that they regret their career choice: international comparison
Source: OECD (2014) Table 7.2
Note: the nine high performing countries and eight low performing countries (see Table 1.2) are plotted with closed diamonds and open triangles respectively.
56. There is little evidence that regret at choosing teaching as a career varies with
teacher characteristics in England, including gender, subject specialism and whether
the teacher works part or full time. The same holds true for teachers’ views on
whether they would choose the teaching profession again.
57. However, there is a clear relationship between teacher age and whether the teacher
agrees that, with the benefit of hindsight, they would still choose to become a teacher
again – see Figure 6.12. Nearly 95% of the (small number) of teachers under the age
of 25 agree or strongly agree that they would become a teacher again, if they were
given the choice. However, this falls to approximately 77% for those in their 40s and
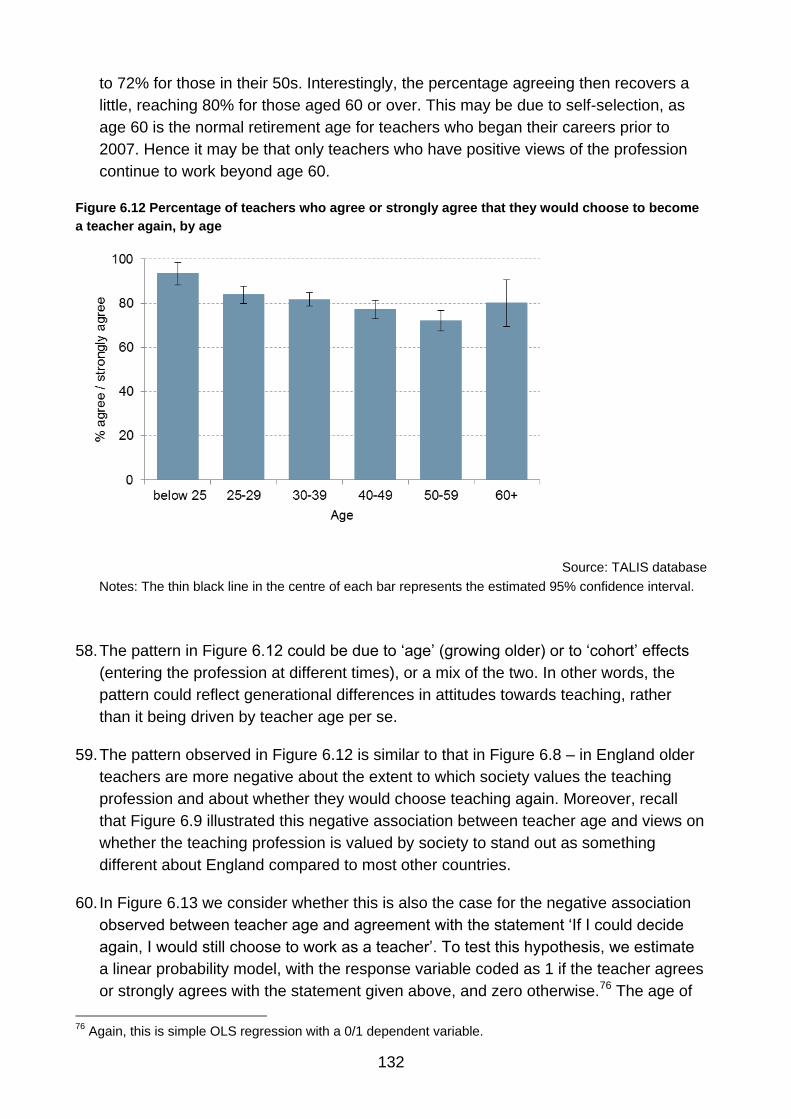
132
to 72% for those in their 50s. Interestingly, the percentage agreeing then recovers a
little, reaching 80% for those aged 60 or over. This may be due to self-selection, as
age 60 is the normal retirement age for teachers who began their careers prior to
2007. Hence it may be that only teachers who have positive views of the profession
continue to work beyond age 60.
Figure 6.12 Percentage of teachers who agree or strongly agree that they would choose to become
a teacher again, by age
Source: TALIS database
Notes: The thin black line in the centre of each bar represents the estimated 95% confidence interval.
58. The pattern in Figure 6.12 could be due to ‘age’ (growing older) or to ‘cohort’ effects
(entering the profession at different times), or a mix of the two. In other words, the
pattern could reflect generational differences in attitudes towards teaching, rather
than it being driven by teacher age per se.
59. The pattern observed in Figure 6.12 is similar to that in Figure 6.8 – in England older
teachers are more negative about the extent to which society values the teaching
profession and about whether they would choose teaching again. Moreover, recall
that Figure 6.9 illustrated this negative association between teacher age and views on
whether the teaching profession is valued by society to stand out as something
different about England compared to most other countries.
60. In Figure 6.13 we consider whether this is also the case for the negative association
observed between teacher age and agreement with the statement ‘If I could decide
again, I would still choose to work as a teacher’. To test this hypothesis, we estimate
a linear probability model, with the response variable coded as 1 if the teacher agrees
or strongly agrees with the statement given above, and zero otherwise.76 The age of
76
Again, this is simple OLS regression with a 0/1 dependent variable.
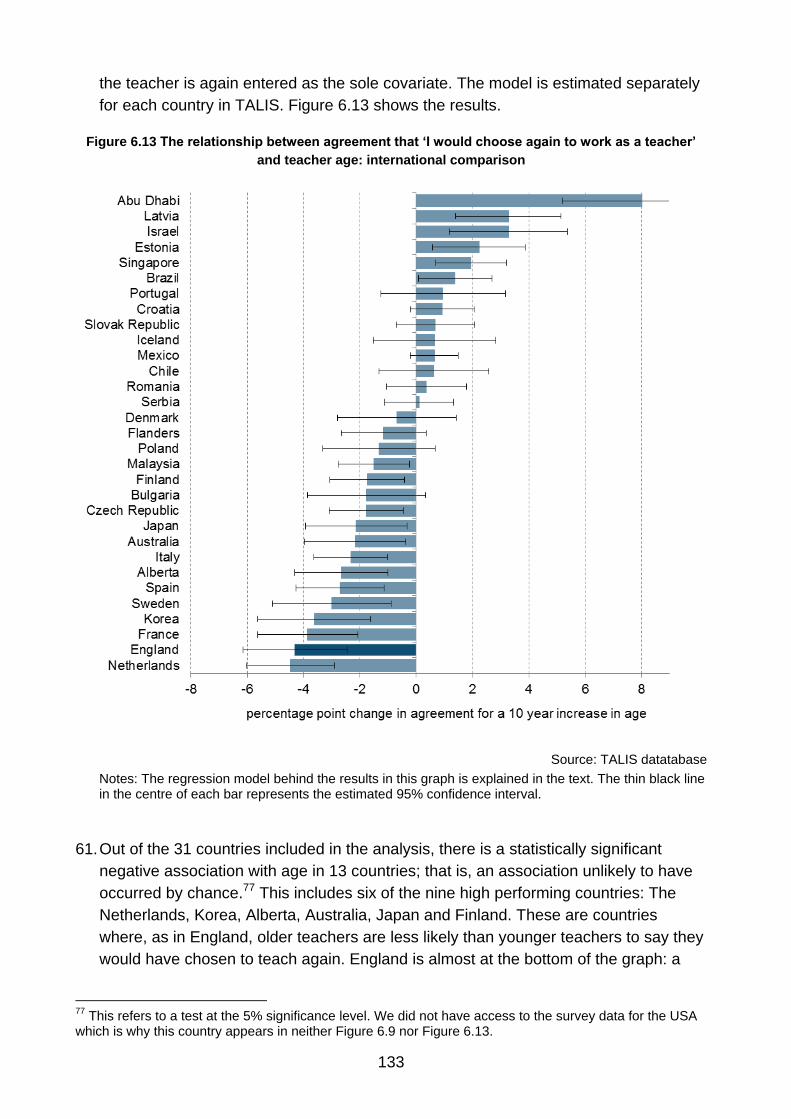
133
the teacher is again entered as the sole covariate. The model is estimated separately
for each country in TALIS. Figure 6.13 shows the results.
Figure 6.13 The relationship between agreement that ‘I would choose again to work as a teacher’
and teacher age: international comparison
Source: TALIS datatabase
Notes: The regression model behind the results in this graph is explained in the text. The thin black line in the centre of each bar represents the estimated 95% confidence interval.
61. Out of the 31 countries included in the analysis, there is a statistically significant
negative association with age in 13 countries; that is, an association unlikely to have
occurred by chance.77 This includes six of the nine high performing countries: The
Netherlands, Korea, Alberta, Australia, Japan and Finland. These are countries
where, as in England, older teachers are less likely than younger teachers to say they
would have chosen to teach again. England is almost at the bottom of the graph: a
77
This refers to a test at the 5% significance level. We did not have access to the survey data for the USA which is why this country appears in neither Figure 6.9 nor Figure 6.13.
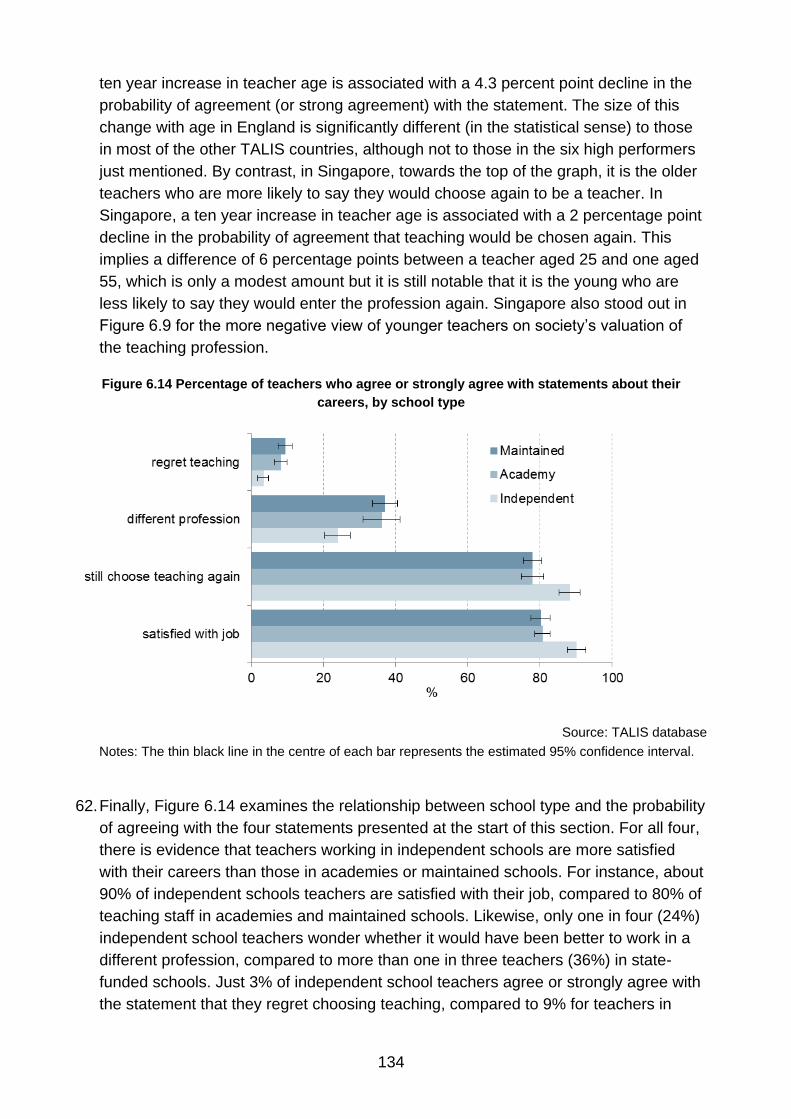
134
ten year increase in teacher age is associated with a 4.3 percent point decline in the
probability of agreement (or strong agreement) with the statement. The size of this
change with age in England is significantly different (in the statistical sense) to those
in most of the other TALIS countries, although not to those in the six high performers
just mentioned. By contrast, in Singapore, towards the top of the graph, it is the older
teachers who are more likely to say they would choose again to be a teacher. In
Singapore, a ten year increase in teacher age is associated with a 2 percentage point
decline in the probability of agreement that teaching would be chosen again. This
implies a difference of 6 percentage points between a teacher aged 25 and one aged
55, which is only a modest amount but it is still notable that it is the young who are
less likely to say they would enter the profession again. Singapore also stood out in
Figure 6.9 for the more negative view of younger teachers on society’s valuation of
the teaching profession.
Figure 6.14 Percentage of teachers who agree or strongly agree with statements about their
careers, by school type
Source: TALIS database
Notes: The thin black line in the centre of each bar represents the estimated 95% confidence interval.
62. Finally, Figure 6.14 examines the relationship between school type and the probability
of agreeing with the four statements presented at the start of this section. For all four,
there is evidence that teachers working in independent schools are more satisfied
with their careers than those in academies or maintained schools. For instance, about
90% of independent schools teachers are satisfied with their job, compared to 80% of
teaching staff in academies and maintained schools. Likewise, only one in four (24%)
independent school teachers wonder whether it would have been better to work in a
different profession, compared to more than one in three teachers (36%) in state-
funded schools. Just 3% of independent school teachers agree or strongly agree with
the statement that they regret choosing teaching, compared to 9% for teachers in

135
state-funded schools, highlighting the high satisfaction levels amongst this particular
group.78
6.5 Summary
63. This chapter has investigated how teachers in England feel about various aspects of
their jobs and careers. Part of the analysis was based on questions that were asked
of teachers in England but not in other countries.
64. Views are mixed and need careful interpretation. Some of our results could either be
presented as ‘good’ or as ‘bad’, depending on the perspective taken. For example,
fewer teachers in England express overall satisfaction with their jobs than in any other
country in TALIS, which may be seen as disappointing if a crude ‘league table’ view is
taken. But 82% of teachers do in fact agree or strongly agree that they are satisfied –
on this view satisfaction seems high in absolute terms.
65. One notable finding is that younger teachers in England are more positive in their
views about society’s valuation of teaching and on whether they would choose
teaching again than older teachers. In many countries, including some high
performing countries, the opposite is true.
78
All differences between teachers in independent schools and academics or maintained schools presented in Figure 6.14 are statistically significant at the 5% level.

136
Chapter 7 Teaching practices
Teachers in England report, on average, spending 7% of their time in the
classroom on administrative duties, 11% on maintaining discipline, and 82%
actually teaching. The situation in England compares quite favourably to that
in other countries – England is near the median for the high performing
countries.
Less time is spent on administration and on keeping order by teachers in
schools with an ‘outstanding’ or ‘good’ Ofsted rating, in schools with high
Key Stage 4 test scores, and in independent schools.
74% of teachers in England agree with the statement that ‘Thinking and
reasoning processes are more important than specific curriculum content.’
This is less than in most other TALIS countries (the average is 84%). The
figure in England does not vary significantly with observed characteristics of
schools. Women are slightly less likely to hold this view.
58% of teachers in England say that they frequently or nearly always get
students to work in small groups to come up with joint solutions to a problem
compared to 40% on average in high performing countries. There is no
significant variation across types of schools in England but women and
younger teachers are more likely to use this technique.
Teachers in England are also much more likely than teachers in most
countries to give different work in the classroom to students of different
abilities. 63% do so at frequently or nearly always compared to 32% on
average in high performing countries.
Teachers in England report more use of several different methods to assess
student learning than teachers in many other countries. The percentage of
teachers reporting that they provide written feedback frequently or nearly
always is among the highest for any country: 82%, compared to an average
for high performing countries of only 47% (and 55% for all countries in
TALIS).
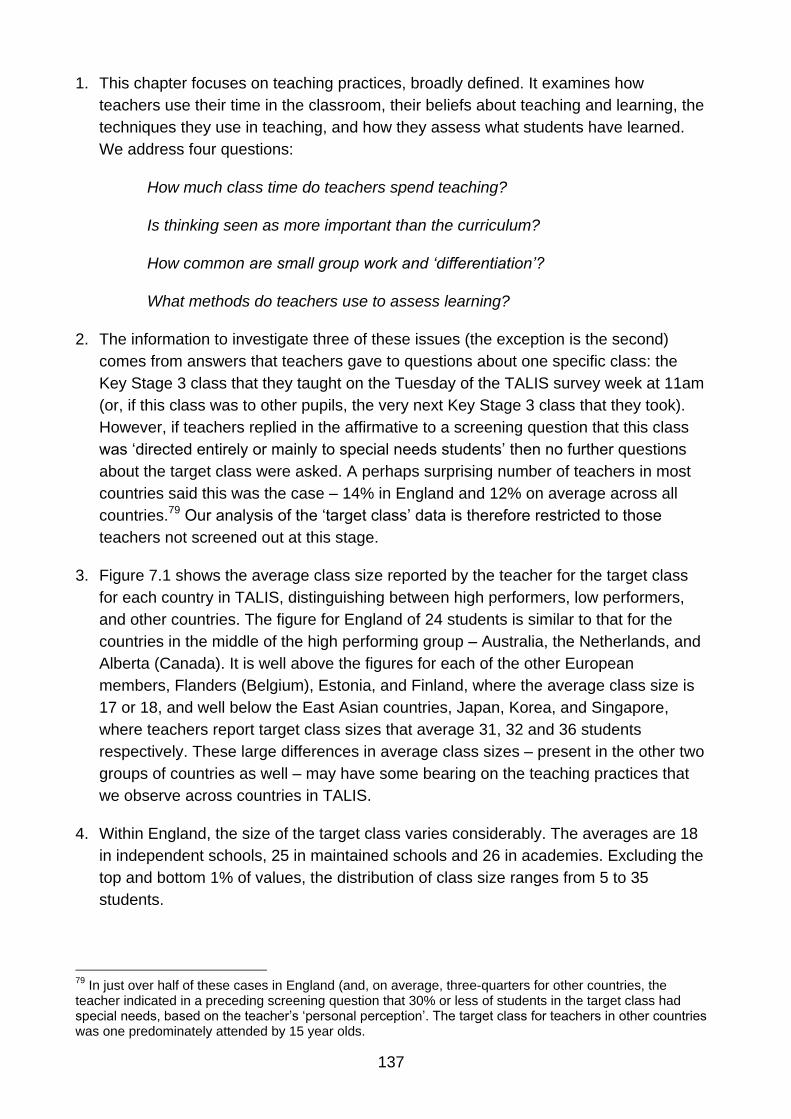
137
1. This chapter focuses on teaching practices, broadly defined. It examines how
teachers use their time in the classroom, their beliefs about teaching and learning, the
techniques they use in teaching, and how they assess what students have learned.
We address four questions:
How much class time do teachers spend teaching?
Is thinking seen as more important than the curriculum?
How common are small group work and ‘differentiation’?
What methods do teachers use to assess learning?
2. The information to investigate three of these issues (the exception is the second)
comes from answers that teachers gave to questions about one specific class: the
Key Stage 3 class that they taught on the Tuesday of the TALIS survey week at 11am
(or, if this class was to other pupils, the very next Key Stage 3 class that they took).
However, if teachers replied in the affirmative to a screening question that this class
was ‘directed entirely or mainly to special needs students’ then no further questions
about the target class were asked. A perhaps surprising number of teachers in most
countries said this was the case – 14% in England and 12% on average across all
countries.79 Our analysis of the ‘target class’ data is therefore restricted to those
teachers not screened out at this stage.
3. Figure 7.1 shows the average class size reported by the teacher for the target class
for each country in TALIS, distinguishing between high performers, low performers,
and other countries. The figure for England of 24 students is similar to that for the
countries in the middle of the high performing group – Australia, the Netherlands, and
Alberta (Canada). It is well above the figures for each of the other European
members, Flanders (Belgium), Estonia, and Finland, where the average class size is
17 or 18, and well below the East Asian countries, Japan, Korea, and Singapore,
where teachers report target class sizes that average 31, 32 and 36 students
respectively. These large differences in average class sizes – present in the other two
groups of countries as well – may have some bearing on the teaching practices that
we observe across countries in TALIS.
4. Within England, the size of the target class varies considerably. The averages are 18
in independent schools, 25 in maintained schools and 26 in academies. Excluding the
top and bottom 1% of values, the distribution of class size ranges from 5 to 35
students.
79
In just over half of these cases in England (and, on average, three-quarters for other countries, the teacher indicated in a preceding screening question that 30% or less of students in the target class had special needs, based on the teacher’s ‘personal perception’. The target class for teachers in other countries was one predominately attended by 15 year olds.

138
Figure 7.1 Average class size in the ‘target class’: international comparison
Source: OECD (2014) Table 2.18
Notes: The thin black line in the centre of each bar represents the estimated 95% confidence interval.
7.1 How much class time do teachers spend teaching?
5. Chapter 2 has already analysed teachers’ total hours of work and how they spend the
working week. The questions about the target class included one on time use:
teachers were asked what percentage of class time is typically spent on each of the
following activities:
Administrative tasks (e.g. recording attendance, handing out school information
and forms)
Keeping order in the classroom (maintaining discipline)

139
Actual teaching and learning
6. The results presented below are restricted to only those teachers who provided
complete and valid information to this question (including the total percentage across
all three options summing to 100). In England, this meant a quarter of teachers were
excluded from this part of the analysis, with the main reason being that the target
class was reported to be largely directed to pupils with special needs – see above.80
7. On average, most class time in England is spent on actual teaching and learning:
82%. Only 11% is used on maintaining discipline and 7% on administrative tasks.
Teachers in England lose, on average, a fifth of their class time to these two non-
teaching tasks.
8. Figure 7.2 examines how this compares to other countries. The horizontal axis
measures the percentage of class-time that the teacher reports spending on
administrative tasks. The vertical axis refers to the percentage spent on keeping order
in the class. Countries towards the top right hand corner of the diagram are in the
least favourable situation – where on average a greater proportion of a teacher’s time
is taken up by administration and controlling the class. Countries towards the bottom
left hard corner are in the most favourable situation, where teachers spend more time
on actual teaching. There is a reasonably strong cross-country correlation (r = 0.67)
between the two measures: countries where teachers report spending more time on
administration are also the countries where teachers report spending more time
maintaining discipline.81
9. The situation in England compares quite favourably to that in other countries –
England is one of the countries towards the bottom left hand corner of the graph. In
other words, although a non-trivial amount of class time is on average dedicated to
non-teaching related activities in England, the same is true in other countries and if
anything the loss is somewhat larger in most of them. The figures in England are at
about the level of the medians for the high performing countries.
10. There is some suggestion that low performing countries may be more towards the
top-right corner of the graph (high administration burden – high classroom order
burden). But there is little to suggest that the opposite holds true in the high
performing countries. And in fact the mean values of the percentage of time spent on
actual teaching for the two groups differ very little (77% and 78% respectively).
Singapore is the high performer towards the top-right corner with larger than average
amounts of time lost on maintaining discipline and administrative tasks, with the result
that 71% of time on average is reported as being used for teaching, compared to the
80
Inevitably there is a question mark over the quality of the data, which is not based on classroom observation. Unsurprisingly, there is considerable heaping in the data at values like 5% and 10%. 81
It is unclear whether there is any causal relationship between the two or whether both are indicative of something else.
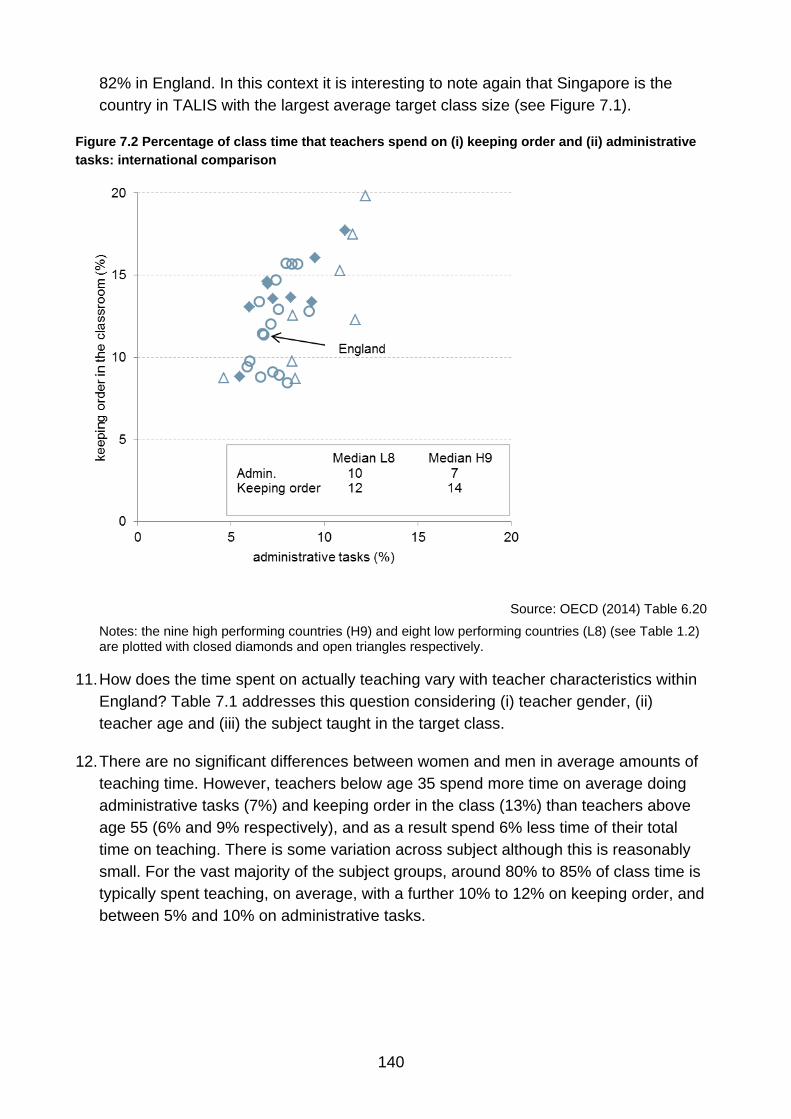
140
82% in England. In this context it is interesting to note again that Singapore is the
country in TALIS with the largest average target class size (see Figure 7.1).
Figure 7.2 Percentage of class time that teachers spend on (i) keeping order and (ii) administrative
tasks: international comparison
Source: OECD (2014) Table 6.20
Notes: the nine high performing countries (H9) and eight low performing countries (L8) (see Table 1.2) are plotted with closed diamonds and open triangles respectively.
11. How does the time spent on actually teaching vary with teacher characteristics within
England? Table 7.1 addresses this question considering (i) teacher gender, (ii)
teacher age and (iii) the subject taught in the target class.
12. There are no significant differences between women and men in average amounts of
teaching time. However, teachers below age 35 spend more time on average doing
administrative tasks (7%) and keeping order in the class (13%) than teachers above
age 55 (6% and 9% respectively), and as a result spend 6% less time of their total
time on teaching. There is some variation across subject although this is reasonably
small. For the vast majority of the subject groups, around 80% to 85% of class time is
typically spent teaching, on average, with a further 10% to 12% on keeping order, and
between 5% and 10% on administrative tasks.

141
Table 7.1 Average percentage of time in the target class spent on administration, keeping order,
and teaching, by teacher characteristics and subject taught
administrative tasks
keeping
order
actual teaching
Gender
Female 7 12 81
Male 7 11 82
Age
35 and below 7 13 79
36 - 55 6 10 83
56 and above 6 9 85
Subject
Social studies 6 11 83
Arts 7 10 83
Modern foreign languages 6 11 82
Mathematics 6 12 82
Reading, writing, literature 7 11 82
Religion / ethics 6 12 81
Science 7 11 81
Technology 7 11 81
Physical education 10 12 79
Practical and vocational skills 9 13 78
Other 10 19 70
Source: TALIS database
Note: figures for Classical Greek and Latin, the subject of the target class in six cases, are not included in the table. Figures do not necessarily sum to 100 due to rounding.
13. Figure 7.3 examines how the average proportion of class time teachers actually
spend teaching varies with characteristics of the school. The first set of bars gives
results for school type. There is essentially no difference between academies and
maintained schools – teachers report that approximately 80% of their time is taught in
teaching (and 20% on administration and keeping order). In contrast, a significantly
higher percentage of class time, 89%, is reported as actually spent on teaching in
independent schools. This difference is driven almost entirely by a lower percentage
of time being spent on maintaining order – just 5% on average.
14. The middle set of bars provides results by the school Ofsted rating. There is clear
evidence that schools with lower Ofsted ratings are the ones where teachers spend
less of their class time actually teaching, although the differences are not really large.
On average, 75% of class time in ‘inadequate’ schools is spent on teaching, with only
slightly more in ‘satisfactory’ schools: 77%. In contrast, 84% of class time is spent
teaching in ‘outstanding’ schools and 82% in ‘good’ schools. The differences between
the inadequate and satisfactory schools on the one hand and the good and
outstanding schools on the other are well-determined. But the data do not permit any
clear conclusions about the differences within these two groupings, as shown by the
sizes of the margins of error included in the graph. As is the case with the
independent schools just described, the differences are driven mainly by the greater
142
amount of time spent in maintaining order in the inadequate/satisfactory schools.
Nevertheless, the average total time spent actually teaching in these schools is still
above that implied for teachers in Singapore by Figure 7.2.
Figure 7.3 Average percentage of class time spent on teaching, by school characteristics
Source: TALIS database
Notes: The thin black line in the centre of each bar represents the estimated 95% confidence interval.
15. The final set of bars illustrates the association with Key Stage 4 quartile. There is a
clear relationship, with a greater proportion of class time spent actually teaching in
schools that achieve higher GCSE results. For instance, 77% of class time is spent on
average in teaching in schools with the lowest performing pupils, compared to 86% in
those with the highest. When interpreting this result, one should bear in mind that
these are simply associations and do not necessarily reflect a causal relationship: we
are unable to say that less class time spent on teaching is responsible for the lower
performance. Moreover, we find the same relationship with pupil performance if Key
Stage 2 results are used, measuring the average ability of the pupil intake of each
school: in schools where the intake is on average of lower ability, less class time is
spent on teaching. This suggests that poorer learning will take place in schools where
pupils start from a lower ability base, which is a concern.
16. It is clear that the average percentage of their time that teachers actually spend
teaching in the target class does differ across some school characteristics. But it is
worth emphasising that the great majority of the recorded variation in this teaching
time is within schools and not between them: more than 80%. That is, the large bulk
of the variation in time spent teaching is due to teachers in each school reporting
different amounts and is not due to the variation in the average values for each
school.

143
7.2 Is thinking seen as more important than the curriculum?
17. TALIS asked teachers about their personal beliefs about teaching and learning.
Teachers were asked how strongly they agreed or disagreed with the following six
statements.
‘My role as a teacher is to facilitate students’ own inquiry’
‘Students should be allowed to think of solutions to practical problems themselves
before the teacher shows them how they are solved’
‘Students learn best by finding solutions to problems on their own’
‘Thinking and reasoning processes are more important than specific curriculum
content’
‘My role includes having a secure knowledge of my subject and curriculum areas
and imparting this knowledge to pupils effectively’
‘My role includes keeping up to date with developments in my subject or
specialism’
18. The final two statements were included only in England. Teachers gave almost
universal support: 98% agreed or strongly agreed with both statements.82
19. Table 7.2 shows the proportion of teachers that agreed or strongly agreed with each
of the first four statements, comparing England with other countries. Teachers in
England overwhelmingly believe that pupils learn best by working out problems
themselves: 96% think that their role as a teacher is to facilitate independent inquiry
among their pupils. The same percentage agree that students should think of
solutions themselves before being shown how to solve problems. Moreover, there is
little evidence of variation in these figures across the other countries in TALIS –
teachers everywhere overwhelmingly agree with the first two statements. And the
large majority also agree with the third (the somewhat lower figures here perhaps
reflect a view that the student’s struggle for a solution should not continue
indefinitely).
20. However, there is evidence of more variation across countries in the agreement with
the fourth statement that ‘thinking and reasoning processes are more important than
specific curriculum content’. In England, about a quarter of teachers either disagreed
or strongly disagreed with this. In other words, this group of teachers believe that
82
These two statements are very similar to wording in the official guidance on teaching standards in England (Department for Education, 2013c), of which many teachers in TALIS will have been aware.

144
teaching pupils the specifics of what is in the curriculum is at least as important as
developing their ability to think and reason independently.83
Table 7.2 Percentage of teachers agreeing or strongly agreeing with different statements about
teaching and learning: international comparison
Statement Eng H9 Fin Fla Jpn Sng L8 All
My role is to facilitate students’ own inquiry
96 96 97 99 94 95 94 94
Students should be allowed to think first of solutions themselves
96 94 94 93 93 97 93 92
Students learn best by finding solutions on their own
86 84 82 84 94 89 85 83
Thinking and reasoning are more important than curriculum content
74 81 91 71 70 95 83 84
Source: OECD (2014) Table 6.13
Notes: The figures for ‘H9’ and ‘L8’ are averages for the nine high performing and eight low performing countries (see Table 1.2) and ‘All’ is the mean across all TALIS countries. Eng = England, Fin = Finland, Fla = Flanders, Jpn = Japan, Sng = Singapore.
21. Figure 7.4 shows for all countries the percentages of teachers agreeing or strongly
agreeing (i) that thinking and reasoning processes are more important than specific
curriculum content, on the vertical axis, and, on the horizontal axis, (ii) that students
learn best by finding solutions on their own. This provides for a fuller picture than in
the summary in Table 7.2. Of the more than 30 other countries in TALIS, only five
record percentages that are significantly lower than that in England for the importance
of thinking and reasoning and that hence come lower down in the graph.84 In other
countries, more teachers than in England report that thinking and reasoning
processes are more important than the curriculum content.
22. There is considerable variation across the high performing countries on the figures for
thinking and reasoning vs. curriculum content. Some are reasonably similar to
England, with just 71% of teachers in Flanders and 70% in Japan agreeing or strongly
agreeing with the statement – the Netherlands is the country with the lowest value,
64%. However, other high performers have substantially higher figures: 91% of
teachers agree that thinking and reasoning are more important than the curriculum in
Finland and 95% in Singapore. These examples also illustrate the extent of variation
even within the group of three high performing East Asian countries. (Korea comes
between Japan and Singapore with a figure of 86%.)
23. The three countries more towards the left hand side of the graph are outliers on the
percentage of teachers who agree or strongly agree that students learn best by
finding solutions on their own. These countries are Italy (59%), Norway (53%) and
Sweden (45%). England at 86% is in the middle of the pack.
83
It is a matter for debate as to whether thinking processes and curriculum content can always be seen as competing, so the statement put to teachers may be more ambiguous than it might appear. 84
The difference between England and Mexico is not statistically significant (the symbols for the two countries overlap in the graph).

145
Figure 7.4 Percentage of teachers who agree or strongly agree that (i) thinking and reasoning
processes are more important than curriculum content and (ii) students learn best by finding
solutions on their own: international comparison
Source: OECD (2014) Table 6.13
Notes: the nine high performing countries and eight low performing countries (see Table 1.2) are plotted with closed diamonds and open triangles respectively.
24. Within England, we examined the association between various school level
characteristics and the percentage of teachers who agreed or strongly agreed that
thinking and reasoning processes are more important than curriculum content. There
is little evidence of any link with the school type (maintained, academy, independent),
Ofsted rating, or Key Stage 4 test scores.85
25. However, Figure 7.5 shows that there is variation across some teacher
characteristics. The top set of bars examines the link with the teacher’s views and the
subject taught in the ‘target class’ analysed earlier in this chapter, taken as a proxy for
the teacher’s main subject specialism. Just 62% of PE teachers, 65% of modern
language teachers, and 67% of science teachers believe that thinking and reasoning
processes are more important than learning the specifics of the curriculum. This
compares to 81% of arts subject teachers and 82% of maths teachers. The margins of
error are quite large around the figures for several subjects but the differences
85
One exception was that 81% of teachers in schools graded as ‘inadequate’ as Ofsted either agreed or strongly agreed with the statement, compared to 74% of those working in ‘satisfactory’, ‘good’ and ‘outstanding’ schools, a difference that is statistically significant (t=3.3) despite the sample size of teachers in the ‘inadequate’ schools – see Chapter 1.

146
between teachers in these two groups – PE/modern languages/science vs. arts/maths
– are statistically significant at conventional levels.
Figure 7.5 Percentage of teachers who agree or strongly agree that thinking and reasoning
processes are more important than curriculum content, by teacher characteristics
Source: TALIS database
Notes: The thin black line in the centre of each bar represents the estimated 95% confidence interval.
26. The middle sets of bars show the association with teacher age. Perhaps surprisingly,
there is very little variation across the great majority of teachers, those aged 25 to 59.
The small number of teachers in the youngest and the oldest age groups (about 6% in
total) are more likely to agree that thinking and reasoning are more important: about
another 1 in 10 agree with the statement. The final set of bars give a tentative sign of
a small gender difference – 72% of women agree or strongly agree with that thinking
and reasoning processes are more important, compared to 76% of men.86
86
This difference is statistically significant, but only at the 10% level (p = 0.08).

147
27. Finally in this section, we analyse briefly the index of ‘constructivist beliefs’ created by
the OECD for the TALIS data, drawing on teachers’ responses to the four statements
analysed in Table 7.2. A ‘constructivist’ view of teaching:
‘focuses on students not as passive recipients but as active participants in the
process of acquiring knowledge. Teachers holding this view emphasise facilitating
student inquiry, prefer to give students the chance to develop solutions to
problems on their own, and allow students to play active role in instructional
activities. Here, the development of thinking and reasoning processes is stressed
more than the acquisition of specific knowledge’ OECD (2009: 92)
28. Higher values of the index indicate that teachers have a stronger constructivist view of
teaching.87
29. Very little of the variation in the values of this index for teachers in England is between
schools: just 8%. That is, the great bulk of the variation between teachers in their
reported beliefs, as summarised by the index of constructivist beliefs, is not
associated with the schools that the teachers are in. All schools tend to have a mix of
teachers in terms of their views of teaching. This is consistent with the lack of
variation across school characteristics that we noted earlier in teachers’ agreement
with the statement on thinking and reasoning processes.
7.3 How common are small group work and ‘differentiation’?
30. Teachers in TALIS were questioned about the teaching techniques they use in the
target Key Stage 3 class. They were asked how often each of the following eight
things happen:
‘I check my students’ exercise books or homework’
‘I present a summary of recently learned content’
‘I give different work to the students who have difficulties learning and/or to those
who can advance faster’
‘I refer to a problem from everyday life or work to demonstrate why new
knowledge is useful’
‘I let students practise similar tasks until I know that every student has understood
the subject matter’
87
The index has a correlation of 0.98 in England with one derived from a simple ‘sum score’: scoring each variable as ‘1’ for ‘strongly disagree’ up to ‘4’ for ‘strongly agree’ and then summing the values across the four variables.
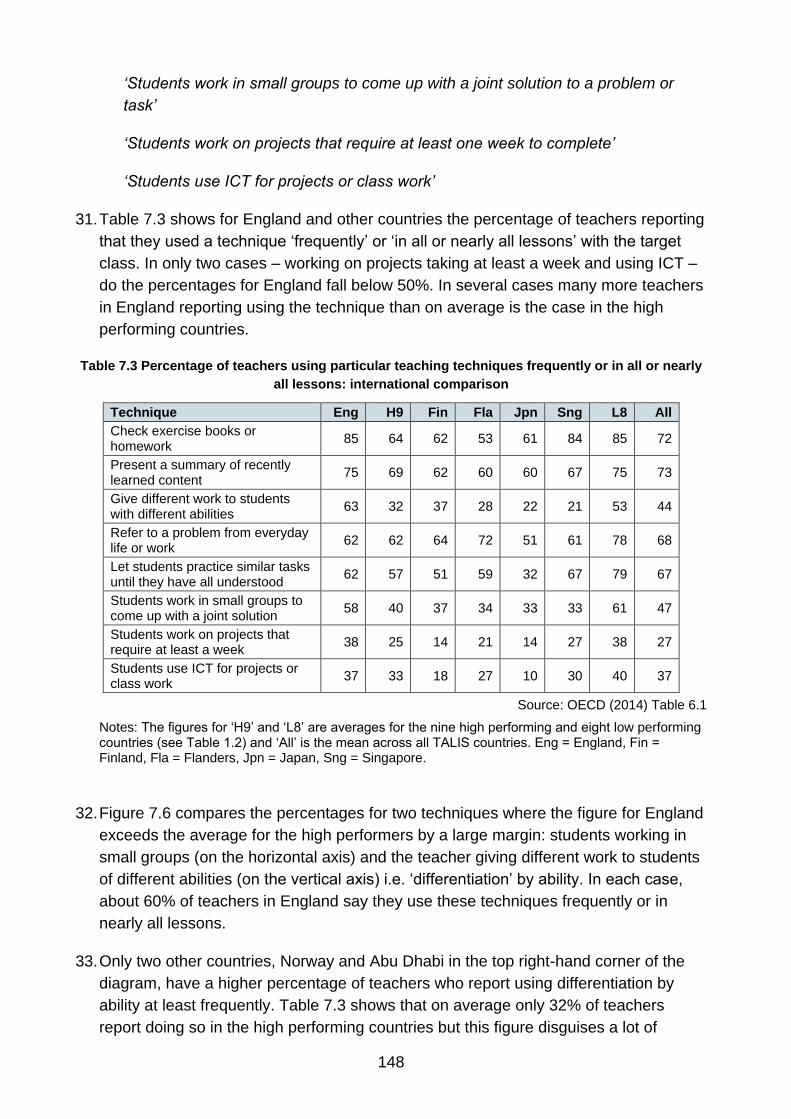
148
‘Students work in small groups to come up with a joint solution to a problem or
task’
‘Students work on projects that require at least one week to complete’
‘Students use ICT for projects or class work’
31. Table 7.3 shows for England and other countries the percentage of teachers reporting
that they used a technique ‘frequently’ or ‘in all or nearly all lessons’ with the target
class. In only two cases – working on projects taking at least a week and using ICT –
do the percentages for England fall below 50%. In several cases many more teachers
in England reporting using the technique than on average is the case in the high
performing countries.
Table 7.3 Percentage of teachers using particular teaching techniques frequently or in all or nearly
all lessons: international comparison
Technique Eng H9 Fin Fla Jpn Sng L8 All
Check exercise books or homework
85 64 62 53 61 84 85 72
Present a summary of recently learned content
75 69 62 60 60 67 75 73
Give different work to students with different abilities
63 32 37 28 22 21 53 44
Refer to a problem from everyday life or work
62 62 64 72 51 61 78 68
Let students practice similar tasks until they have all understood
62 57 51 59 32 67 79 67
Students work in small groups to come up with a joint solution
58 40 37 34 33 33 61 47
Students work on projects that require at least a week
38 25 14 21 14 27 38 27
Students use ICT for projects or class work
37 33 18 27 10 30 40 37
Source: OECD (2014) Table 6.1
Notes: The figures for ‘H9’ and ‘L8’ are averages for the nine high performing and eight low performing countries (see Table 1.2) and ‘All’ is the mean across all TALIS countries. Eng = England, Fin = Finland, Fla = Flanders, Jpn = Japan, Sng = Singapore.
32. Figure 7.6 compares the percentages for two techniques where the figure for England
exceeds the average for the high performers by a large margin: students working in
small groups (on the horizontal axis) and the teacher giving different work to students
of different abilities (on the vertical axis) i.e. ‘differentiation’ by ability. In each case,
about 60% of teachers in England say they use these techniques frequently or in
nearly all lessons.
33. Only two other countries, Norway and Abu Dhabi in the top right-hand corner of the
diagram, have a higher percentage of teachers who report using differentiation by
ability at least frequently. Table 7.3 shows that on average only 32% of teachers
report doing so in the high performing countries but this figure disguises a lot of

149
variation. Four of the group – Japan, Korea, Singapore, and the Netherlands – have
levels at around 20% while three are at about 45-50% – Australia, Alberta (Canada),
and Estonia. The three high performers (closed diamond symbols) close together in
the bottom left corner of the graph are the three East Asian countries. These countries
also have only about a third of teachers who report setting students to work together
in small groups, although in this they are less distinctive as another six or seven
countries have a similar figure.
Figure 7.6 Percentage of teachers who frequently or in all or nearly all lessons (i) get students to
work in small groups and (ii) give different work to students of different abilities: international
comparison
Source: OECD (2014) Table 6.1
Notes: the nine high performing countries and eight low performing countries (see Table 1.2) are plotted with closed diamonds and open triangles respectively.
34. Within England, we found no significant variation in the use of small groups across
different types of schools. On average, teachers are equally likely to report setting
students to work together in small groups in independent schools and state-funded
schools, across schools with different Ofsted ratings, and across schools with different
average Key Stage 2 score intakes or Key Stage 4 scores. However, there are
differences by teacher characteristics as shown in Figure 7.7. 64% of teachers aged
under 35 report using small groups, compared to 48% of teachers aged over 55.
While 61% of women use this teaching technique often, rather less men do so,
54%.The probability that small group teaching is used also varies with the subject

150
taught in the target class (not shown in the graph). This does not explain the gender
or age differences just noted. Maths, modern foreign languages, and technology
stand out as subjects with less use.
Figure 7.7 Percentage of teachers who get students to work in small groups frequently or in nearly
all lessons, by teacher age and gender
Source: TALIS database
Notes: The thin black line in the centre of each bar represents the estimated 95% confidence interval.
35. By contrast, the systematic (and statistically significant) variation that we can detect
within England in use of the other technique highlighted in Figure 7.6, differentiation
by ability, is across school characteristics and not teacher characteristics – see Figure
7.8. This practice is reported by a somewhat lower percentage of teachers in
independent schools, 54% compared to 62% of teachers in maintained schools and
67% of academy teachers. Within state-funded schools, it is more common in schools
with lower average Key Stage 2 scores of their student intake – 72% of teachers in
schools in the bottom quartile of average scores compared to 58% of teachers in
schools in the top quartile. And it is more common in schools with lower Ofsted
ratings.
36. The differences that we observe in the use of differentiation by ability between
countries or across different schools in England may in part be driven by differences
in the extent to which pupils in the same class (and school) vary in their abilities.
Differentiation is likely to happen more where there is a wider range of ability, or at
least teachers may perceive that they differentiate more in this situation. In countries
with school systems that tend to separate pupils by ability (whether or not
deliberately), either between schools or between classes, teachers should have less
need to differentiate within the classroom. Further analysis of the TALIS data is
needed to shed more light on this.

151
Figure 7.8 Percentage of teachers who give different work to students of different abilities, by
school characteristics
Source: TALIS database
Notes: The thin black line in the centre of each bar represents the estimated 95% confidence interval.
7.4 What methods do teachers use to assess learning?
37. The final subject we consider in this chapter is how teachers assess student learning.
Again for the target class, teachers were asked in TALIS how often the following
applied:
‘I observe students when working on particular tasks and provide immediate
feedback’
‘I provide written feedback on student work in addition to a mark or grade’
‘I develop and administer my own assessment’
‘I have individual students answer questions in front of the class’
‘I let students evaluate their own progress’
‘I administer a standardised test’

152
38. Table 7.4 shows the percentage of teachers reporting that they used an assessment
method ‘frequently’ or ‘in all or nearly all’ lessons with the target class, comparing
England with other countries. For all methods, the percentage for England exceeds
both the average for the high performers and the (higher) average for all countries in
TALIS, often by a large margin. (The international averages are pulled up by the
averages for the low performers, which exceed those for the high performing
countries in every case.) Viewed in this way, a lot of classroom assessment is taking
place in England by international standards.
39. The methods where England stands out least are ‘develop and administer own
assessment’ and ‘administer a standardised test’. While teachers in England clearly
do a lot of both – 71% and 40% respectively – these are not apparently methods that
are being used much more widely in England than, on average, elsewhere.
Table 7.4 Percentage of teachers using particular assessment methods frequently or in all or nearly
all lessons: international comparison
Method Eng H9 Fin Fla Jpn Sng L8 All
Observe students working and provide immediate feedback
89 73 76 77 43 78 87 80
Provide written feedback on student work
82 47 25 61 23 72 59 55
Develop and administer own assessment
71 63 66 89 29 65 78 68
Individual students answer questions in front of class
69 35 11 40 53 64 61 49
Let students evaluate own progress
69 28 27 30 27 32 51 38
Administer a standardised test 40 36 28 14 33 71 50 38
Source: OECD (2014) Table 6.11
Notes: The figures for ‘H9’ and ‘L8’ are averages for the nine high performing and eight low performing countries (see Table 1.2) and ‘All’ is the mean across all TALIS countries. Eng = England, Fin = Finland, Fla = Flanders, Jpn = Japan, Sng = Singapore.
40. In Figure 7.9 we focus on two assessment methods where the figures for England are
among the highest for any country: one oral method – listening to the answers pupils
give to questions in front of the class (on the horizontal axis); and one written –
providing written feedback beyond a mark or a grade (on the vertical axis).88 The
variation in the prevalence of both methods across the high performing countries
(closed diamond symbols) is clear. A minority of teachers report use of them in the
Netherlands, Estonia, Finland, Korea, and (written feedback only) Japan, while
Australia and Singapore are the two high performers with higher levels of use close to
those in England.89
88
In both cases teachers’ interpretation of the statements they are presented with may be quite broad. For example, a short phrase of encouragement alongside a mark or grade such as ‘well done, good work’ could be construed as written feedback. 89
Abu Dhabi is the other country alongside England with over 80% of teachers reporting written feedback.

153
41. It is tempting to view the high level of written feedback in England as an entirely
positive finding. But the opportunity cost needs to be considered. Teachers in
England work long hours by international standards (see Chapter 2). If the cost of
providing frequent written feedback were be to spend less time on lesson preparation
then the high level of this form of assessment could be seen in a different light.
Figure 7.9 Percentage of teachers who (i) provide written feedback on student work and (ii) get
students to answer questions in front of class: international comparison
Source: OECD (2014) Table 6.11
Notes: the nine high performing countries and eight low performing countries (see Table 1.2) are
plotted with closed diamonds and open triangles respectively.
42. Figure 7.10 illustrates the variation within England in the provision of written feedback.
Not surprisingly perhaps, written feedback is less common in some subjects, notably
physical education (PE). But over 90% of teachers report giving written feedback in
five of the 11 subjects. There is also a clear difference between male and female
teachers: 76% of men report giving written feedback compared to 85% of women.
Further investigation showed that only a small part of this difference (two percentage
points) is explained by the subject being taught in the target class (e.g. women are
less likely to be PE teachers). We found no clear systematic variation with the
teacher’s age, type of school, or the school Ofsted rating.

154
Figure 7.10 Percentage of teachers giving written feedback frequently or in all or nearly all lessons,
by teacher gender and by subject of the target class
Source: TALIS database
Notes: The thin black line in the centre of each bar represents the estimated 95% confidence interval.
7.5 Summary
43. This chapter has investigated four issues concerning teachers’ beliefs about teaching
and their practices in and out of the classroom. Three were related to a particular
class and we began by showing the wide variation across countries – including
among the high performing countries – in the average size of this ‘target class’. Class
size can be expected to be one factor affecting what goes on in the classroom.
44. The most striking findings are probably the differences between England and other
countries in the use of several teaching and assessment practices – although we also
drew attention to differences within England, across different types of schools and
different characteristics of teachers.
45. In particular, getting students to work together in small groups and giving different
work to students with different abilities (‘differentiation’) are reported to be used
frequently or nearly always in England by the majority of teachers but, in almost every
case, by the minority in high performing countries. Providing written feedback on
student work is also more common in England than in all the high performers. By
contrast, broadly speaking, testing students does not seem that much more common
in England.

155
Chapter 8 School and classroom disciplinary environment
Serious disciplinary problems in schools in England are not frequently
reported by headteachers. In all schools, use or possession of drugs or
alcohol is said to occur never or rarely. Intimidation or verbal abuse of staff is
also very unusual but is reported as occurring on a weekly basis by 6% of
headteachers.
Less serious disciplinary issues such as students arriving late at school and
absenteeism occur on a weekly or daily basis in England in 56% and 41%
respectively of schools – figures close to the middle of the range of values
for all TALIS countries and below those of several high performing countries.
Headteachers report unjustified absenteeism by teachers as occurring on at
least a weekly basis in 11% of schools, notably more than in many other
countries.
21% of teachers in England agree or strongly agree that they have to wait
quite a long time at the start of their class for students to quieten down – less
than the median for all countries of 27% and below all of the high performing
countries except Japan. England is typically very close to the international
average on other measures of classroom disciplinary environment.
Classroom climate is notably better on average in independent schools than
in state-funded schools and, among the latter, where Key Stage 2 intake
scores are higher. But less than a fifth of the variation in classroom climate is
accounted for at the school level: typically, schools do not have uniformly
good or bad classroom climate.
There is no evidence of any relationship between classroom climate and the
ratio of teachers to teaching assistants in the school.
Teachers perceive that classroom climate is better on average when there
are high proportions of academically-gifted pupils in a class. Classroom
climate tends to vary with teacher experience: 38% of teachers with five or
less years of teaching experience agree or strongly agree that they lose
quite a lot of time in the lesson due to interruptions by students but only 22%
of teachers with 16 or more years of experience.
156
1. Schools and classrooms with more disciplinary problems are likely to be less
favourable for learning, not least because school heads and teachers have to expend
more time and effort in simply creating an orderly environment. As noted in Chapter 1,
in England the central importance of behaviour in the classroom has been
emphasised in the most recent Ofsted Annual Report and in the commentary on it by
the Chief Inspector of Schools. This chapter presents evidence from TALIS on the
learning climate of English schools and classrooms.
2. Headteachers in TALIS 2013 were asked a series of questions about the frequency of
problematic student behaviour in their schools from lateness and absenteeism
through to intimidation, abuse and the use of drugs and alcohol. And teachers were
asked some questions about their perceptions of the disciplinary climate of a specific
class which they taught, such as whether it took a long time for students to quieten
down at the start of the lesson and whether much time was lost during the lesson due
to student interruptions.
3. The chapter draws on the TALIS data to throw light on the factors associated with
good school and classroom disciplinary climate and to place English experience in
international context. Note that the terms ‘classroom environment’, ‘classroom
disciplinary environment’ and ‘classroom climate’ will be used interchangeably
throughout the chapter.
4. The questions to be addressed are:
Is there a favourable disciplinary climate in schools?
Is there much noise and disruption in classrooms?
Do school-level factors explain the variation in classroom climate?
What is the relationship between classroom climate and the type of class?
Are characteristics of the teacher associated with classroom climate?
8.1 Is there a favourable disciplinary climate in schools?
5. To establish the nature of school climate, headteachers were asked questions about
the frequency of various problems of behaviour by pupils in their school. The data for
England for their responses are summarised in Table 8.1.
6. The sample size, of around 150 schools, is small and so we need to exercise some
caution in interpreting the data but the patterns are of considerable interest
nonetheless. For either the overwhelming majority or else in all schools, certain types
of behaviour, such as vandalism or theft and use of drugs or alcohol, were reported by
school heads only rarely or never. But lesser disciplinary issues, such as pupils

157
arriving late at school, occurred on a weekly or more frequent basis in over half of
schools, while pupil absenteeism occurred weekly or daily in over 40% of the schools
in the England sample. (All reference to absenteeism in this chapter, whether of
teachers or pupils, is to ‘unjustified’ absences.)
Table 8.1 Headteacher responses on the frequency of different types of pupil behaviour
(percentages)
never rarely monthly weekly daily total
Arriving late at school 0 39 5 15 41 100
Absenteeism (unjustified) 2 49 8 16 25 100
Cheating 23 75 2 0 0 100
Vandalism and theft 8 87 3 2 0 100
Intimidation or verbal abuse among students
10 63 12 13 1 100
Physical injury caused by violence among students
24 71 5 1 0 100
Intimidation or verbal abuse of teachers or staff
31 56 8 6 0 100
Use/possession of drugs and/or alcohol in school
34 66 0 0 0 100
Source: TALIS database
Note. Headteachers were asked ‘How often do the following occur?’ Figures may not sum to 100 due to rounding.
Figure 8.1 Percentage of teachers in schools where the headteacher reports pupils (i) arrive late
and (ii) are absent on a daily or weekly basis: international comparison
Source: OECD (2014) Table 2.20
Note: the nine high performing countries and eight low performing countries (see Table 1.2) are plotted with closed diamonds and open triangles respectively.

158
7. Figure 8.1 places these percentages for late arrival of pupils and absenteeism in
international perspective – the former on the vertical axis and the latter on the
horizontal axis. The unit of analysis in the graph is now the teacher, rather than the
school as in Table 8.1, so that the figures shown are the percentages of teachers in
schools where the head reports the student behaviour concerned. The percentages
shown for England are therefore slightly different from those in Table 8.1 which refer
to the percentages of schools.
8. It can be seen that England is close to the middle of the distribution in terms of both
absenteeism and late arrival. The four high performing countries (solid diamond
symbols) with higher values on both measures are Australia, the Netherlands, Alberta
and Finland (with absenteeism of 64% and late arrival of 87%). The one high
performer in the bottom left of the diagram is Korea (20% for absenteeism and 26%
for late arrival). As in the analyses of other chapters in this report, the high performers
display substantial variation.
9. Table 8.1 shows that in 14% of schools in England headteachers stated that there
was intimidation or verbal abuse among pupils on at least a weekly or daily basis. In
6% of schools there was reported to be intimidation or verbal abuse of staff by pupils
with this regularity (although never daily).
10. In many countries in TALIS, the figure for weekly or daily occurrence of intimidation or
verbal abuse of staff was 5% or less, and in 13 of them the difference from the figure
for England is statistically significant, although it is important to emphasise that these
differences are small – see Figure 8.2 where the figures for abuse among students
(vertical axis) and staff (horizontal axis) are plotted. (As with Figure 8.1, the unit of
analysis in this graph is now the teacher rather than the school so that the figures for
England again do not correspond exactly with those in Table 8.1.) In only one country,
Brazil, is the percentage significantly above that in England (the three high
performing countries to the right of England are Australia, Estonia and Flanders).
Focusing now on the vertical axis, it is noticeable here that six of the high performing
countries have higher values for verbal abuse or intimidation among students than
England. The three high performers with values below those in England are the three
East Asian countries of Japan, Korea, and Singapore.
11. As part of the questions on school climate, headteachers were also asked about the
behaviour of teachers in their school. The data for England are summarised in Table
8.2. Discrimination (e.g. based on gender or ethnicity) was reported to occur either
only rarely or never in all the surveyed schools in England. Unjustified absenteeism by
teachers was reported on at least a weekly basis in 9% of the schools and on at least
a monthly basis in a fifth of them.
12. These figures for teacher absenteeism put England very much at the high end of the
distribution for TALIS countries, as shown in Figure 8.3. Again, as with Figures 8.1
and 8.2, the unit of analysis in the graph is the teacher, while it is the school in Table

159
8.1, and this explains the slightly higher figure for England in the graph for
absenteeism, 11% (compared to 9% in Table 8.2), and the lower figure for arriving
late, 5% (compared to 7% in the table).
Figure 8.2 Percentage of teachers in schools where the headteacher reports intimidation or verbal
abuse on a daily or weekly basis (i) among pupils (ii) by pupils of staff: international comparison
Source: OECD (2014) Table 2.20
Note: the nine high performing countries and eight low performing countries (see Table 1.2) are plotted with closed diamonds and open triangles respectively.
Table 8.2 Headteacher responses on the frequency of different types of teacher behaviour
(percentages)
never rarely monthly weekly daily total
Arriving late at school 15 76 2 7 0 100
Absenteeism (unjustified) 21 59 11 7 2 100
Discrimination 82 18 0 0 0 100
Source: TALIS database
Note. Headteachers were asked ‘How often do the following occur?’ Examples offered to them of discrimination were on the basis of ‘gender, ethnicity, religion or disability etc’.
13. Only one of the high performing countries has a higher percentage of teacher
absenteeism than England – Australia, where the figure is 16%. England does
comparatively much better on teachers arriving late. Here the figure for England is
5%, lower than the median for all countries of 9%. Schools in five of the high
performing countries – Australia, Finland, Flanders, the Netherlands, and Singapore –
have higher proportions of late arriving teachers than England. In Flanders, as much
as a quarter of teachers are in schools where heads report late arrivals on a weekly or

160
daily basis. Figure 8.3 also shows that a trio of the low performing countries – Brazil,
Chile and Mexico – do particularly badly on both measures, with the figures for late
arrivals and absenteeism each above 25%.
Figure 8.3 Percentage of teachers in schools where the headteacher reports that on a daily or
weekly basis teachers (i) arrive late and (ii) are absent: international comparison
Source: OECD (2014) Table 2.21
Note: the nine high performing countries and eight low performing countries (see Table 1.2) are plotted with closed diamonds and open triangles respectively.
14. To conclude this section, we analyse the responses to two questions that were asked
only in England, one to heads and one to teachers.
15. Table 8.3 shows headteachers’ views on whether they have insufficient power to deal
with poor student behaviour. There is almost no concern expressed by heads of
independent schools. But 29% of heads of both maintained schools and academies
report that they feel they lack power in this area ‘to some extent’ or (very rarely) ‘a lot’.

161
Table 8.3 Headteachers’ views on whether insufficient powers to deal with poor student behaviour
limit the head’s effectiveness in his or her school (percentages)
not at all very little
to some extent
a lot total
Maintained schools 45 26 27 2 100
Academies 47 24 26 3 100
Independent schools 85 15 0 0 100
All schools 54 23 21 2 100
Source: TALIS database
Note: headteachers were asked about their ‘effectiveness as a headteacher’.
16. Table 8.4 summarises teachers’ views on student behaviour, showing their reactions
to the statement ‘The students I teach are generally well behaved’. (The question
concerned is not restricted to the ‘target class’ that is the focus of the next section.)
There is again a marked contrast between independent schools and state-funded
schools. A half of teachers in independent schools strongly agree with the statement
put to them and almost all of the rest at least ‘agree’. But only a fifth of teachers in
maintained schools and academies strongly agree that their students are well
behaved and around 1 in 6 or 1 in 7 (depending on the school type) disagree or (very
rarely) strongly disagree.
Table 8.4 Teachers’ views on the statement ‘The students I teach are generally well behaved’
(percentages)
strongly disagree
disagree agree strongly
agree total
School type
Maintained schools 1 16 64 19 100
Academies 1 12 67 20 100
Independent schools 1 1 47 51 100
All schools 1 12 62 25 100
Key Stage 2 quartile
1st (lowest) 2 25 62 11 100
2nd
2 15 69 14 100
3rd
1 9 70 20 100
4th (highest) 1 6 61 32 100
All state-funded schools 1 14 66 20 100
Note: results by Key Stage 2 quartile refer only to maintained schools and academies. Figures may not sum to 100 due to rounding.
17. The bottom half of Table 8.4 shows results by the average Key Stage 2 scores of the
pupil intakes of the state-funded schools. Teachers in schools with higher ability
intakes tend to have more positive views of pupil behaviour. 93% of teachers in
schools in the top quarter of average Key Stage 2 scores agree or strongly agree that
their students are generally well behaved, compared to only 73% of teachers in the
bottom quartile.
18. The patterns in both Tables 8.3 and 8.4 seem clear. But it is important to bear in mind
that the results are based on subjective views rather than objective measures. The
162
point of reference for these views may depend on the context in which they are given.
It is possible, for example, that what is seen as ‘good behaviour’ in an independent
school differs from in a state-funded school, although it seems unlikely that this would
explain all of the marked differences that we see.
8.2 Is there much noise and disruption in classrooms?
19. We now switch from the level of the school to that of the classroom. Classroom
disciplinary environment was the focus of a specific question in TALIS. Teachers were
asked to what extent they agreed with a set of statements about a particular Key
Stage 3 class which the teacher takes, referred to as the ‘target class’ – see the start
of Chapter 7 for the exact definition and for discussion of the wide variation in average
target class size across countries in TALIS, which may influence classroom
behaviour. The statements put to teachers were:
‘When the lesson begins I have to wait quite a long time for students to quieten
down’.
‘Students in this class take care to create a pleasant learning atmosphere’.
‘I lose quite a lot of time because of students interrupting the lesson’.
‘There is a lot of disruptive noise in this classroom’.
20. The teachers responded to each of the questions on a four-point scale, from strongly
disagree to strongly agree. The responses showed that:
Nearly four-fifths (79%) of teachers either disagreed or strongly disagreed that
it took quite a long time for students to quieten down at the start of the lesson.
74% agreed or strongly agreed that students in the lesson took care to create a
pleasant learning environment.
73% either disagreed or strongly disagreed that they lost quite a lot of time due
to students interrupting the lesson
As for disruptive noise, 21% agreed or strongly agreed that there was a lot of
noise in the classroom.
21. The detailed figures on the responses to the four questions are in Table 8.5. We might
consider a class as having constituted a favourable environment for learning when
teachers either disagreed or strongly disagreed with the first, third, and fourth
statements and agreed or strongly agreed with the second one. On that definition
some 61% of the classes surveyed in England could be regarded as a favourable
environment for learning. These results suggest that in the majority of cases surveyed

163
there was a good disciplinary environment but that for a substantial minority of
classes one or more of the following created a less than favourable environment:
waiting for students to quieten down, lack of attention to a pleasant learning
environment by the students, interruptions or disruptive noise.90
Table 8.5 Teacher responses to statements on classroom climate (percentages)
strongly agree
agree disagree strongly disagree
total
When the lesson begins I have to wait quite a long time for students to quieten down
4 17 48 31 100
Students in this class take care to create a pleasant learning atmosphere
19 55 21 5 100
I lose quite a lot of time because of students interrupting the lesson
6 22 44 29 100
There is a lot of disruptive noise in this classroom
4 17 46 32 100
Source: TALIS database
Note: Figures may not sum to 100 due to rounding.
22. How does England compare with other countries on classroom climate? Figure 8.4
shows on the horizontal axis the percentage of teachers who agreed or strongly
agreed with ‘I lose quite a lot of time because of students interrupting the lesson’ and
the percentage who agreed or strongly agreed with ‘There is a lot of disruptive noise
in the classroom’ on the vertical axis.
23. The responses from teachers in England placed them close to the middle of the
distribution in both cases. For disruptive noise, teachers in England are at 22% and
the median for all countries is 24%, while 28% of teachers in England report losing a
lot of time from interruptions, compared to the median for all countries of 29%.91 We
might infer from this that classroom disciplinary climate in England, being marginally
below the median on both variables, is reasonably good when compared to a range of
other countries. It is notable, too, that seven out of the nine high performing countries
are in worse position than England with higher percentages of teachers with lesson
interruptions and disruptive noise. (The high performer in the bottom left hand corner
with markedly lower percentages in both cases is Japan.)
24. In Figure 8.5 the vertical axis again shows the percentage of teachers who agreed or
strongly agreed that ‘There is a lot of disruptive noise in the classroom’ but the
horizontal axis now shows the percentage who agreed or strongly agreed with the
statement ‘When the lesson begins I have to wait quite a long time for students to
quieten down’. Teachers in England are located in a low position for waiting quite a
long time at 21% compared to the median for all countries of 27%, and the high
90
Teachers were also asked how representative the target class was of all the classes which they taught. It made little difference to the results if the analysis was confined only to those classes which the teacher stated were representative of all the classes which they taught. 91
The figure for disruptive noise in England is slightly different from that in Table 8.5 where the sample is restricted to teachers responding to all four statements.
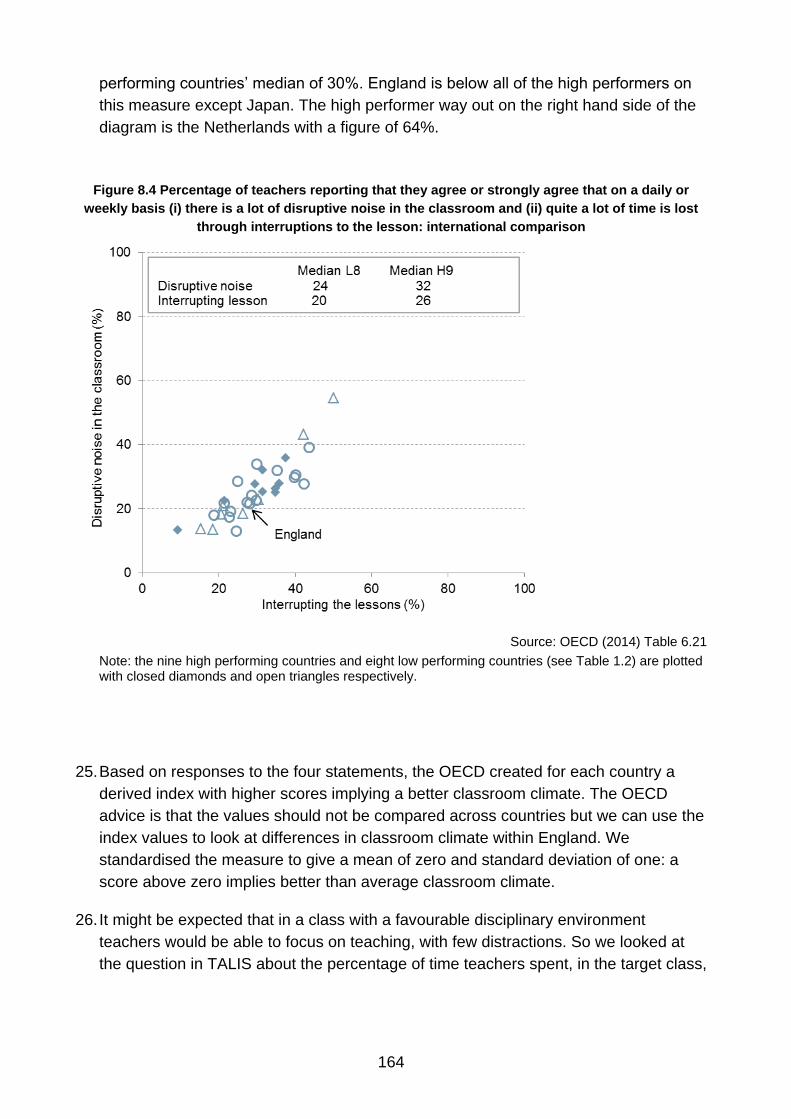
164
performing countries’ median of 30%. England is below all of the high performers on
this measure except Japan. The high performer way out on the right hand side of the
diagram is the Netherlands with a figure of 64%.
Figure 8.4 Percentage of teachers reporting that they agree or strongly agree that on a daily or
weekly basis (i) there is a lot of disruptive noise in the classroom and (ii) quite a lot of time is lost
through interruptions to the lesson: international comparison
Source: OECD (2014) Table 6.21
Note: the nine high performing countries and eight low performing countries (see Table 1.2) are plotted with closed diamonds and open triangles respectively.
25. Based on responses to the four statements, the OECD created for each country a
derived index with higher scores implying a better classroom climate. The OECD
advice is that the values should not be compared across countries but we can use the
index values to look at differences in classroom climate within England. We
standardised the measure to give a mean of zero and standard deviation of one: a
score above zero implies better than average classroom climate.
26. It might be expected that in a class with a favourable disciplinary environment
teachers would be able to focus on teaching, with few distractions. So we looked at
the question in TALIS about the percentage of time teachers spent, in the target class,

165
on actual teaching.92 The relationship for England between classroom climate and this
percentage is shown in Figure 8.6, which shows the average percentage of time spent
teaching for the four quartile groups of the classroom climate index. This confirms the
expected pattern, showing that in the top quarter of classroom climate an average of
90% of the time is spent on teaching compared to only 68% in classes which are in
the bottom quarter for the classroom climate score.
Figure 8.5 Percentage of teachers reporting that they agree or strongly agree that on a daily or
weekly basis (i) there is a lot of disruptive noise in the classroom and (ii) they wait quite a long time
for students to quieten down: international comparison
Source: OECD (2014) Table 6.21
Note: the nine high performing countries and eight low performing countries (see Table 1.2) are plotted with closed diamonds and open triangles respectively.
92
As opposed to keeping order and administration. See Chapter 7 for more information on responses to this question.

166
Figure 8.6 Average percentage of class time spent on teaching, by quartile of classroom climate
score
Source: TALIS database
Note: The thin black line in the centre of each bar represents the estimated 95% confidence interval.
8.3 Do school-level factors explain the variation in classroom climate?
27. How far can school-level factors explain the differences in classroom climate? A
breakdown of the classroom climate score reveals that a relatively small proportion of
the variation, about 18% of the total, is accounted for at the school level. Most of the
variation in classroom climate is therefore associated with differences within schools
in the characteristics of the pupils in the class or of the teacher. We turn to these
factors below but we first investigate which observed school characteristics do help
explain the variation that is accounted for at the level of the schools.
28. Distinguishing the three broad types of school – maintained, academy, and
independent – there is evidence that classroom climate is significantly higher, on
average, in the independent sector, consistent with our earlier results using the
England-only questions. Figure 8.7 shows that the difference in average climate index
scores between maintained schools and independent schools is some 0.4 of a
standard deviation. This is a substantial difference and, although the number of
teachers in independent schools in the TALIS sample for England is modest, the
difference is clearly statistically significant. The mean classroom climate score is also
slightly higher in academies than in maintained schools but this difference is small
and in this case is not statistically significant.

167
Figure 8.7 Average classroom climate score, by characteristics of the school
Source: TALIS database
Note: The thin black line in the centre of each bar represents the estimated 95% confidence interval. Scores greater than zero indicate better than average classroom climate, scores less than zero indicate worse than average classroom climate.
29. Compared to schools which had Ofsted ratings of ‘good’, teachers in schools which
were deemed by Ofsted to be ‘satisfactory’ or ‘inadequate’ tended to report
significantly worse classroom climate, as measured by the summary climate score:
mean scores are over a fifth of a standard deviation lower. As for the schools with an
Ofsted rating of ‘outstanding’, these had a better mean classroom climate score than
the ‘good’ schools, by about 0.12 of a standard deviation, but the difference here is
not statistically significant.
30. The schools in the England sample in TALIS can be divided into quartiles according to
the percentage of the pupils eligible for Free School Meals (FSM). Differences in
mean classroom climate score between the top and bottom quartiles of FSM are
statistically significant and the gap between them is 0.19 of a standard deviation of the
classroom climate score – see Figure 8.7. Note that this analysis excludes the
independent schools. Figure 8.7 also shows that there are significant differences by
the pupil intake of the school in terms of mean Key Stage 2 score – again these
figures exclude independent schools. Relative to the top quartile, classes in schools in
the bottom quartile were 0.32 of a standard deviation lower on the classroom climate
score. Viewed in this way, schools with lower ability children have classroom climates
that on average are less favourable to learning.
31. Chapter 2 drew attention to the unusually high use of teaching assistants in schools in
England by international standards. Some schools in England had more teaching

168
assistants per teacher than others and this might be thought to contribute to improving
the disciplinary climate in the classroom. So we investigated the hypothesis that
classroom climate is more favourable in schools with a high ratio of teaching
assistants per teacher. But no evidence was found to support this hypothesis. The
correlation between the ratio of teachers to teaching assistants and disciplinary
climate score was only 0.03 and it was not statistically significant.
8.4 What is the relationship between classroom climate and the type of class?
32. We now turn to the variation in classroom climate with the characteristics of the class.
There is some evidence that classroom disciplinary environment in England is better
in smaller classes. In the smallest classes, with 20 or fewer pupils, disciplinary
environment is about 0.08 of a standard deviation above the overall mean of zero.
However, this is no longer the case once we control for type of school (independent
schools have smaller average class sizes).
33. Classroom climate tends to be more favourable when there are higher proportions of
academically-gifted pupils, as reported by the teacher. This is consistent with the
school-level findings on Key Stage 2 intake reported earlier in the chapter. When the
teacher states that there are no academically gifted pupils in the target class, the
classroom climate score is almost 0.3 of a standard deviation below the overall mean
while classes with high proportions of academically gifted pupils tend to be well above
the mean – see Figure 8.8.

169
Figure 8.8 Average classroom climate score, by percentage of academically-gifted pupils in the
class (as estimated by the teacher)
Source: TALIS database
Note: The thin black line in the centre of each bar represents the estimated 95% confidence interval. Scores greater than zero indicate better than average classroom climate, scores less than zero indicate worse than average classroom climate.
34. Conversely, classroom climate tends to be less favourable when there are higher
proportions of low academic achievers. If the teacher states that more than 60% of a
class consisted of low academic achievers then the classroom climate score is almost
0.7 of a standard deviation below the overall mean (not shown in Figure 8.8).
35. There is also variation in the classroom climate score by the proportion of pupils from
socio-economically disadvantaged backgrounds, as measured by FSM eligibility.
Taking classes with 1-10% of pupils estimated by the teacher as eligible as the
reference group, in classes where 11-30% were estimated eligible for FSM the
classroom climate score is about a fifth of a standard deviation lower on average,
while in classes with 31-60% of pupils thought eligible for FSM the classroom climate
score is one third of a standard deviation lower on average. This is summarised in
Figure 8.9. Again, this pattern of results is consistent with the school-level findings on
FSM reported in the previous section (where the percentage of pupils receiving FSM
in the school is taken from administrative records rather than estimated by the
teacher, as here in this section for the classroom).
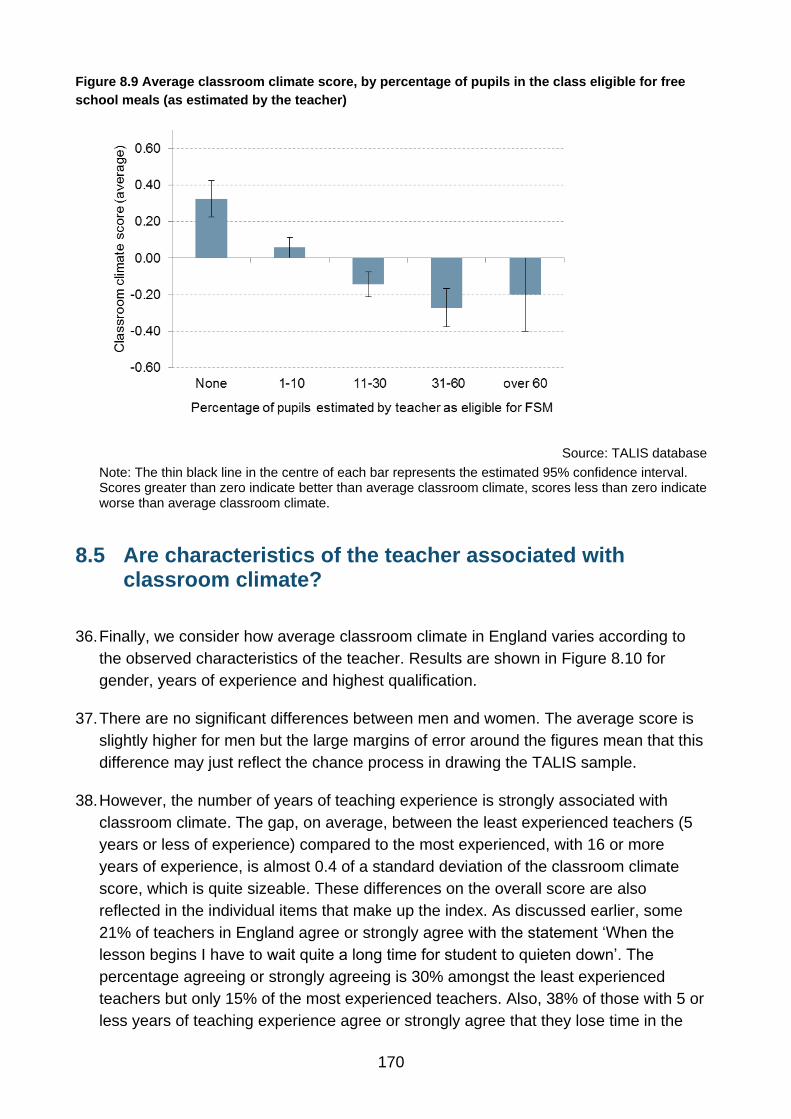
170
Figure 8.9 Average classroom climate score, by percentage of pupils in the class eligible for free
school meals (as estimated by the teacher)
Source: TALIS database
Note: The thin black line in the centre of each bar represents the estimated 95% confidence interval. Scores greater than zero indicate better than average classroom climate, scores less than zero indicate worse than average classroom climate.
8.5 Are characteristics of the teacher associated with classroom climate?
36. Finally, we consider how average classroom climate in England varies according to
the observed characteristics of the teacher. Results are shown in Figure 8.10 for
gender, years of experience and highest qualification.
37. There are no significant differences between men and women. The average score is
slightly higher for men but the large margins of error around the figures mean that this
difference may just reflect the chance process in drawing the TALIS sample.
38. However, the number of years of teaching experience is strongly associated with
classroom climate. The gap, on average, between the least experienced teachers (5
years or less of experience) compared to the most experienced, with 16 or more
years of experience, is almost 0.4 of a standard deviation of the classroom climate
score, which is quite sizeable. These differences on the overall score are also
reflected in the individual items that make up the index. As discussed earlier, some
21% of teachers in England agree or strongly agree with the statement ‘When the
lesson begins I have to wait quite a long time for student to quieten down’. The
percentage agreeing or strongly agreeing is 30% amongst the least experienced
teachers but only 15% of the most experienced teachers. Also, 38% of those with 5 or
less years of teaching experience agree or strongly agree that they lose time in the

171
lesson due to interruptions by students compared to just 22% of those with 16 or more
years of teaching experience (the figure for the sample overall is 28%).
39. The bottom of the graph show the relationship between a teacher’s qualification level
and classroom climate. Nearly all (over 95%) of the teachers in the TALIS sample for
England are qualified to either Bachelor’s or Master’s level. Those with Master’s
degrees reported slightly higher levels of classroom disciplinary climate, on average,
compared to those with a Bachelor’s degree but, as in the case of gender, this
difference is not statistically significant.
Figure 8.10 Average classroom climate score, by characteristics of the teacher
Source: TALIS database
Note: The thin black line in the centre of each bar represents the estimated 95% confidence interval. Scores greater than zero indicate better than average classroom climate, scores less than zero indicate worse than average classroom climate.
8.6 Summary
40. A favourable disciplinary climate, both at the school level and within the classroom, is
important because it provides a framework in which learning can take place. On
school climate, the evidence from TALIS suggests that serious disciplinary problems
in schools in England are rare. For example, in all schools, headteachers report that
problems such as the use or possession of drugs or alcohol occurred either rarely or
never.
41. The intimidation or verbal abuse of staff or teachers is also very unusual.
Nonetheless, a small minority of headteachers in England, some 6%, report it to occur
on a weekly basis and this figure is higher than in many other countries in the survey.
One other area of concern is unjustified absenteeism by teachers which is also high in
172
England by international standards, occurring on at least a weekly basis in 9% of
surveyed schools.
42. In order to assess classroom disciplinary climate, teachers were asked about matters
such as having to wait quite a long time at the start of their class for students to
quieten down, and interruptions during the lesson. For the most part, the responses
from teachers on these measures tend to put England close to, and sometimes
slightly better than, the international average. However, with over a fifth of teachers
agreeing or strongly agreeing that there was a lot of disruptive noise in the lesson,
and 28% that they lose much time due to student interruptions, it is clear that
classroom climate was far from ideal in a substantial minority of the lessons surveyed.
43. The data for England were used to throw some light on the factors associated with
better classroom disciplinary climate. Only a small part of the variation lies at the
school level – about a fifth. Classroom climate is notably better in independent
schools than in state schools. Among state schools it is better on average where Key
Stage 2 intake scores are higher. But the great bulk of the reported variation in
classroom climate lies within schools and not between schools – it is associated with
differences between characteristics of classes and teachers rather than of schools.
44. Among the more striking results is the strong association of classroom climate with
the level of experience of the teacher. The percentage of teachers agreeing or
strongly agreeing that they had to wait quite a long time for students to quieten down
was 30% amongst the least experienced teachers but only 15% for the most
experienced teachers. The composition of the class in terms of the teacher’s
assessment of ability and socioeconomic disadvantage was also associated with
classroom climate. These results suggest fruitful avenues for further investigation with
the data.
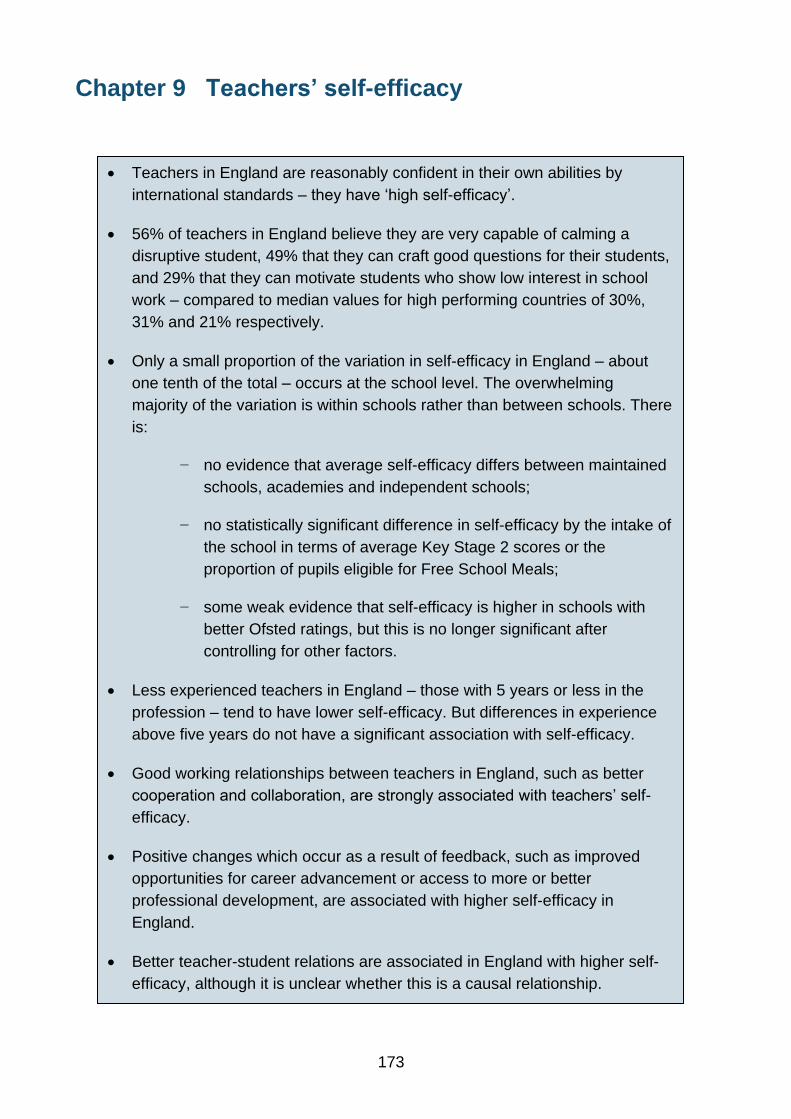
173
Chapter 9 Teachers’ self-efficacy
Teachers in England are reasonably confident in their own abilities by
international standards – they have ‘high self-efficacy’.
56% of teachers in England believe they are very capable of calming a
disruptive student, 49% that they can craft good questions for their students,
and 29% that they can motivate students who show low interest in school
work – compared to median values for high performing countries of 30%,
31% and 21% respectively.
Only a small proportion of the variation in self-efficacy in England – about
one tenth of the total – occurs at the school level. The overwhelming
majority of the variation is within schools rather than between schools. There
is:
− no evidence that average self-efficacy differs between maintained
schools, academies and independent schools;
− no statistically significant difference in self-efficacy by the intake of
the school in terms of average Key Stage 2 scores or the
proportion of pupils eligible for Free School Meals;
− some weak evidence that self-efficacy is higher in schools with
better Ofsted ratings, but this is no longer significant after
controlling for other factors.
Less experienced teachers in England – those with 5 years or less in the
profession – tend to have lower self-efficacy. But differences in experience
above five years do not have a significant association with self-efficacy.
Good working relationships between teachers in England, such as better
cooperation and collaboration, are strongly associated with teachers’ self-
efficacy.
Positive changes which occur as a result of feedback, such as improved
opportunities for career advancement or access to more or better
professional development, are associated with higher self-efficacy in
England.
Better teacher-student relations are associated in England with higher self-
efficacy, although it is unclear whether this is a causal relationship.

174
1. Self-efficacy is defined as an individual’s belief that they are capable of performing a
particular task successfully.93 In an educational context, self-efficacy refers to the
beliefs which teachers hold about their capability to influence student learning. There
is a substantial body of literature on the associations between teachers’ self-efficacy
and a range of outcomes. For example, there is evidence that the self-efficacy of
teachers is positively related to their job satisfaction. Conversely, teachers with low
self-efficacy may have higher levels of work-related stress and an increased likelihood
of quitting the teaching profession.94
2. The determinants of teachers’ self-efficacy have received less attention. Nonetheless,
research has indicated that certain characteristics of the teacher are related to self-
efficacy. Notably, years of experience as a teacher are likely to be important, with
several studies finding that inexperienced teachers tend to have lower self-efficacy.
Some have further maintained that the relationship between experience and self-
efficacy may be non-linear, increasing across the early and middle years of teaching
before declining later on.95
3. The role of school-level factors in influencing teachers’ self-efficacy is not well-
established in the international literature as there has been little research on the
topic.96 There has been some work on differences in self-efficacy between middle
and high school teachers, for example, but rather little on other school-level factors.
4. Since teachers operate as part of a team within the school, the working environment
of the school and the sense of community among staff could influence the self-
efficacy of individual teachers.97 Teachers may enhance their own self-efficacy
through learning or by being supported by their colleagues and associates. In the
previous round of TALIS, in which England did not take part, it was shown that
measures of cooperation with other teachers were strongly related to a measure of
teachers’ self-efficacy.98 Furthermore, feedback, particularly feedback which led to
positive change for the teacher, was found to be related to teachers’ self-efficacy in
some countries.
5. In this chapter we contribute new evidence on the factors associated with teachers’
self-efficacy. The questions to be addressed are:
How confident are teachers about their abilities?
Is self-efficacy related to experience and other teacher characteristics?
Can school-level factors account for variations in self-efficacy? 93
Bandura (1997). 94
Klassen et al. (2011), Caprara et al. (2003), Skaalvik and Skaalvik (2007), Klassen and Chiu (2011). 95
Wolters and Daugherty (2007), Klassen and Chiu (2010). 96
Klassen and Chiu (2010). 97
Friedman and Kass (2002), Skaalvik and Skaalvik (2007), Kelm and McIntosh (2012). 98
OECD (2009).

175
Is self-efficacy affected by the feedback teachers receive?
How do working relationships with colleagues affect self-efficacy?
Is self-efficacy correlated with the quality of teacher-student relations?
9.1 How confident are teachers about their abilities?
6. Teachers in TALIS were asked a set of 12 questions about their self-perceptions of
their effectiveness at teaching. Questions asked, for instance, whether the
respondent could help students to value learning, whether he or she could get
students to follow classroom rules, and whether the teacher was able to use a variety
of assessment strategies. The responses to each question were on a four-point scale
from ‘not at all’ to ‘a lot’.
7. The responses among teachers in England to these 12 questions are summarised in
Table 9.1. It is apparent that on each item the overwhelming majority of respondents
gave answers towards the higher end of the scale. Over three-quarters of the
responses on any item were either ‘quite a bit’ or ‘a lot’, varying from 76% who gave
one or other of these responses for the item ‘motivate students who show low
interest in school work’ (final row), to 97% for the item ‘provide an alternative
explanation, for example when students are confused’ (second row). On each of the
12 items, 1% or less of the responses were ‘not at all’.
8. Some 11% of the teachers in the English sample responded ‘a lot’ to all 12 of the
questions about their effectiveness, i.e. they gave the highest possible response on
every question. A slightly lower proportion, 10%, gave zero ‘a lot’ responses, so did
not choose the highest response on any question. The median number of responses
of ‘a lot’ was six.
9. A tiny proportion, less than a fifth of one per cent, of the sample of teachers in
England gave the lowest possible response of ‘not at all’ to all 12 of the questions,
while 98% of the sample did not choose this lowest category in responding to any of
the questions.
10. Teachers’ self-efficacy is considered to be multi-dimensional in nature. In the
educational psychology literature it is common to consider it as comprising three
different domains: managing students (ensuring that they follow rules, are not
disruptive etc), instructing students, and motivating students to learn.99 International
comparisons based on the new TALIS data show that teachers in England scored
themselves relatively highly on specific questionnaire items for each of these three
components of self-efficacy.
99
Skaalvik and Skaalvik (2007); Tschannen-Moran and Woolfolk-Hoy (2001).

176
Table 9.1 Teacher views on the extent to which they can do certain things in their teaching
(percentages)
not at all
to some extent
quite a bit
a lot total
Make my expectations about student behaviour clear
0 4 27 69 100
Provide an alternative explanation
0 3 33 64 100
Get students to believe they can do well in school work
0 7 36 57 100
Get students to follow classroom rules
0 6 37 56 100
Control disruptive behaviour in the classroom
1 11 38 51 100
Craft good questions for my students
0 10 41 49 100
Help my students value learning
0 13 40 47 100
Use a variety of assessment strategies
1 9 46 45 100
Calm a student who is disruptive or noisy
1 13 43 43 100
Implement alternative instructional strategies in my classroom
1 15 46 38 100
Help students think critically
0 18 49 32 100
Motivate students who show low interest in school work
1 24 47 29 100
Source: TALIS database
Note: teachers were asked ‘In your teaching, to what extent can you do the following?’ Figures may not
sum to 100 due to rounding.
11. Figure 9.1 focuses on the management of students. It shows the percentage of
teachers in each country who gave the response ‘a lot’ when asked to what extent
they could calm a disruptive student (vertical axis), and the percentage who
responded ‘a lot’ on the extent to which they were able to get students to follow
classroom rules (horizontal axis). The figures for England are 56% on following
classroom rules and 43% on calming disruptive or noisy students, each well above
the median for all countries of 45% and 38% respectively and above the figures for
almost all the high performing countries.
12. It is also apparent from the graph that high performing countries (solid diamond
symbols) are not more likely than low performing countries (open triangles) to have a
high proportion of teachers who responded ‘a lot’ on these questions. In fact the
opposite is true. On getting students to follow classroom rules, the median percentage
responding ‘a lot’ among the high performers is only 35%, compared to 53% among
the low performers. Similarly, larger proportions of teachers in low performing
countries responded ‘a lot’ on the question about calming a disruptive or noisy
student. Here the median among the low performing countries is 42% but only 30%

177
for the high performing countries. (The outlier in the bottom left-hand corner of the
graph is Japan.)
Figure 9.1 Percentage of teachers responding ‘a lot’ on their ability to (i) calm disruptive students
and (ii) get students to follow rules: international comparison
Source: OECD (2014) Table 7.1.Web
Note: the nine high performing countries (‘H9’) and eight low performing countries (‘L8’) (see Table 1.2) are plotted with closed diamonds and open triangles respectively.
13. As for the instructional aspect of teachers’ self-efficacy, this is illustrated in Figure 9.2.
In the case of England some 49% of teachers who responded to the questions in
TALIS declared that the extent to which they were able to craft good questions for
students was ‘a lot’, while 45% gave that response on the use of a variety of
assessment strategies. The percentage of teachers responding ‘a lot’ was lower in all
of the high performers than in England for both of these questions. Among this group
the figure for using a variety of assessment strategies ranges from 3% in Japan to
40% in Alberta.
14. Figure 9.3 considers the student engagement aspect of teachers’ self-efficacy,
showing the percentages of teachers in each country who responded ‘a lot’ on
questions concerning the extent to which they could motivate students who showed
low interest in school work and on helping students value learning. There is a high
correlation between these two measures (0.9). The figures for England are high on
each of these questions with 47% of teachers stating that they could help students to
value their learning ‘a lot’ – compared to the median for all countries of 37%. And
while 29% of teachers in England claim that they can motivate students who show low
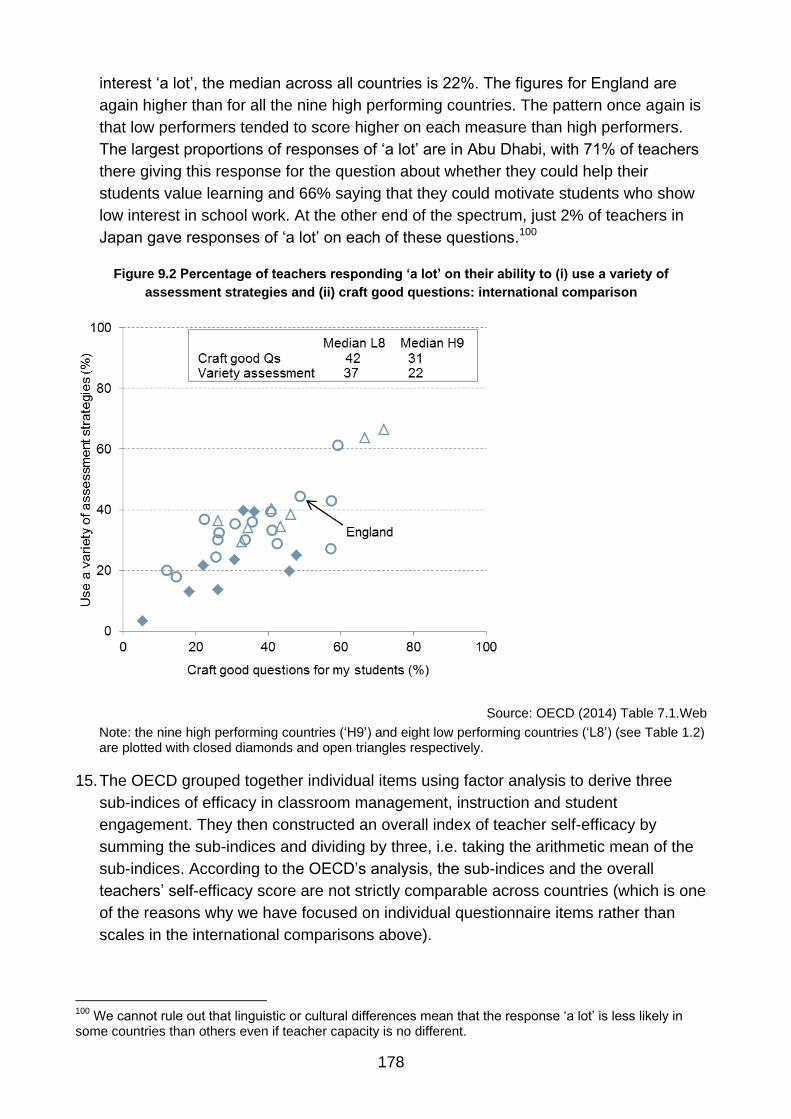
178
interest ‘a lot’, the median across all countries is 22%. The figures for England are
again higher than for all the nine high performing countries. The pattern once again is
that low performers tended to score higher on each measure than high performers.
The largest proportions of responses of ‘a lot’ are in Abu Dhabi, with 71% of teachers
there giving this response for the question about whether they could help their
students value learning and 66% saying that they could motivate students who show
low interest in school work. At the other end of the spectrum, just 2% of teachers in
Japan gave responses of ‘a lot’ on each of these questions.100
Figure 9.2 Percentage of teachers responding ‘a lot’ on their ability to (i) use a variety of
assessment strategies and (ii) craft good questions: international comparison
Source: OECD (2014) Table 7.1.Web
Note: the nine high performing countries (‘H9’) and eight low performing countries (‘L8’) (see Table 1.2) are plotted with closed diamonds and open triangles respectively.
15. The OECD grouped together individual items using factor analysis to derive three
sub-indices of efficacy in classroom management, instruction and student
engagement. They then constructed an overall index of teacher self-efficacy by
summing the sub-indices and dividing by three, i.e. taking the arithmetic mean of the
sub-indices. According to the OECD’s analysis, the sub-indices and the overall
teachers’ self-efficacy score are not strictly comparable across countries (which is one
of the reasons why we have focused on individual questionnaire items rather than
scales in the international comparisons above).
100
We cannot rule out that linguistic or cultural differences mean that the response ‘a lot’ is less likely in some countries than others even if teacher capacity is no different.

179
Figure 9.3 Percentage of teachers responding ‘a lot’ on their ability to (i) motivate students and (ii)
help students value learning: international comparison
Source: OECD (2014) Table 7.1.Web
Note: the nine high performing countries (‘H9’) and eight low performing countries (‘L8’) (see Table 1.2) are plotted with closed diamonds and open triangles respectively.
16. But we can use the scales, including the overall self-efficacy score, in analysing the
correlates of self-efficacy for teachers in England and this is the focus of the rest of
the chapter. We standardise the overall score so that it has a mean of zero and a
standard deviation of one. So, if a teacher has a positive self-efficacy score that
implies that they are above the mean level of self-efficacy in the English sample and
we can easily interpret how far someone is above or below the mean. For example,
someone with a score of +0.2 would be a fifth of a standard deviation above the
mean, while someone with a score of -0.5 would be half a standard deviation below
the mean.
9.2 Is self-efficacy related to experience and other teacher characteristics?
17. Figure 9.4 shows average values of this overall measure of self-efficacy,
distinguishing between different groups of teachers. Women have marginally higher
scores on average (and also for each of the three sub-indices which comprised the
overall self-efficacy measure) but the differences by gender are small and are not
statistically significant.

180
Figure 9.4 Average teacher self-efficacy scores, by teacher characteristics
Source: TALIS database
Note: The thin black line in the centre of each bar represents the estimated 95% confidence interval. Scores greater than zero indicate better than average self-efficacy, scores less than zero indicate worse than average self-efficacy.
18. Some 78% of teachers in the English sample were qualified to Bachelor degree level,
while 19% had Master’s degrees. There are therefore only very small numbers
without these qualifications and in Figure 9.4 we exclude them from the analysis.
Teachers with a Master’s degree report slightly higher levels of self-efficacy, on
average, with the magnitude of the difference being about 0.09 of a standard
deviation of the self-efficacy score and the difference is statistically significant.101
19. Teachers with five years or less experience tend to have lower self-efficacy scores
than more experienced teachers. But differences in experience above five years are
not found to have a significant association with self-efficacy.
20. We also explored whether there is a link between the type of contract on which the
teacher was employed and self-efficacy. 86% of teachers in England are on full-time
contracts and 14% are part-time. The mean level of self efficacy is some 0.19 of a
standard deviation lower for those on part-time contracts compared to those on full-
time contracts (and the difference is statistically significant).
101
p = 0.017.

181
21. Nearly 94% of teachers in the English sample are on permanent contracts while just
6% are on fixed-term contracts. Nevertheless, there is a statistically significant
difference between the groups, with those on fixed term contracts having mean self-
efficacy about 0.24 of a standard deviation lower, on average, than those on
permanent contracts.
9.3 Can school-level factors account for variations in self-efficacy?
22. We began by decomposing the variation in teachers’ self-efficacy score in England
between the part that varies between schools and part that varies between teachers
within schools. Only a small proportion of the variation, approximately 10% of the
total, occurs at the school level. This is broadly consistent with international evidence
from the previous TALIS round in 2008 (which did not include England). The analysis
that produced this evidence used a somewhat different measure of teachers’ self-
efficacy but it also found that most of the variation occurred between teachers within
the same schools rather than between schools.
23. For the most part, in England specific school characteristics that are present in the
dataset do not appear to have any association with the level of self-efficacy reported
by teachers in the school – see Figure 9.5.
24. Notably, there is no evidence that average teacher self-efficacy differs between
maintained schools, academies, and independent schools. There is some weak to
moderate evidence that teachers who regard themselves as more effective are
teaching in schools which had been given higher ratings by Ofsted. A formal test
comparing teachers in the two groups of ‘good’ or ‘outstanding’ schools and those in
‘satisfactory’ or ‘inadequate’ schools showed a mean difference of 0.1 of a standard
deviation in the self-efficacy score, which was statistically significant.102 However,
Ofsted rating is not statistically significant in multiple regression models of teachers’
self-efficacy – see section 9.6.
25. The final two characteristics in Figure 9.5 are available for state-funded schools only,
maintained schools and academies. We find no statistically significant differences win
average teacher self-efficacy by quartiles of Key Stage 2 scores of the pupil intake.
Nor does teacher self-efficacy vary by the extent to which the pupils in the school are
from deprived backgrounds, measured by the proportion eligible for Free School
Meals.
102
p = 0.038.

182
Figure 9.5 Average teacher self-efficacy scores, by school characteristics
Source: TALIS database
Note: The thin black line in the centre of each bar represents the estimated 95% confidence interval. Scores greater than zero indicate better than average self-efficacy, scores less than zero indicate worse than average self-efficacy.
9.4 Is self-efficacy affected by the feedback teachers receive?
26. In this section we report on some analyses of the TALIS data for England on the
feedback received by teachers and whether this was related to their self-efficacy. As
described in Chapter 5, which focuses on appraisal and feedback, teachers were
asked a series of questions on whether positive change in different areas of their
work, and what degree of positive change, had occurred as a result of feedback .
Responses on each item were on a four point scale from ‘no positive change’ through
to ‘large change’.
27. For example, teachers were asked whether feedback had had any positive impact on
their career advancement or job responsibilities. The relationship between each of
these and our overall summary score of teachers’ self-efficacy is shown in Figure 9.6.
Those teachers who report that the feedback which they received had led to a large
change in career advancement or job responsibilities also tend to have higher self-
efficacy scores. Compared to teachers who state that feedback had not led to any
positive changes on that item, self-efficacy scores are, on average, 0.46 and 0.41 of a

183
standard deviation higher for job responsibility and career advancement respectively.
Moderate or only small positive changes reported in career advancement or job
responsibilities as a result of feedback are associated with much smaller increases in
levels of self-efficacy.
Figure 9.6 Average teacher self-efficacy scores, by whether feedback at the school led to positive
change in (i) career advancement and (ii) job responsibilities
Source: TALIS database
Note: The thin black line in the centre of each bar represents the estimated 95% confidence interval. Scores greater than zero indicate better than average self-efficacy, scores less than zero indicate worse than average self-efficacy.
28. The pattern for other changes which occurred as a result of feedback is rather similar.
Large changes have a substantial association with higher self-efficacy while any
impact of moderate or small changes appears limited. This can be seen in Figure 9.7,
which considers whether feedback has effects on confidence as a teacher, or
motivation. For example, the self-efficacy score is 0.4 of a standard deviation greater,
on average, amongst those who said feedback had had a large impact on their
motivation compared to those who reported no change in their motivation as a result
of feedback.
29. Figure 9.8 shows that teachers reporting a large effect of feedback on the amount of
professional development they undertook had an average self-efficacy score which is
some 0.6 of a standard deviation higher than those who reported no change on this
item. Similarly, teachers who felt that feedback had led to a large change in the type
of professional development had a self-efficacy score which is some 0.5 of a standard
deviation higher than those who reported no change.

184
Figure 9.7 Average teacher self-efficacy scores, by whether feedback at the school led to positive
change in (i) confidence as a teacher and (ii) motivation
Source: TALIS database
Note: The thin black line in the centre of each bar represents the estimated 95% confidence interval. Scores greater than zero indicate better than average self-efficacy, scores less than zero indicate worse than average self-efficacy.
Figure 9.8 Average teacher self-efficacy scores, by whether feedback at the school led to positive
change in (i) amount of professional development (ii) type of professional development
Source: TALIS database
Note: The thin black line in the centre of each bar represents the estimated 95% confidence interval. Scores greater than zero indicate better than average self-efficacy, scores less than zero indicate worse than average self-efficacy.
30. Since there were a lot of these questionnaire items on the effects of feedback, it is
useful to combine them into an overall measure. We created an overall score from the

185
six feedback variables shown in Figures 9.6 to 9.8. Each of the six variables was
coded from 0 for ‘no change’ to 3 for ‘large change’ and the six were then added
together. On this measure about 11% of teachers have a score of 0, implying no
change on any of the six items, while 3% had the maximum score of 18, meaning that
they report large changes as a result of feedback for all six items. The median on this
feedback score is 6, which might be obtained, for example, by moderate change as a
result of feedback on three of the six items, or large change on two out of the six.
31. We standardised the feedback summary score so that it has a mean of zero and a
standard deviation of one for the sample in England. This summary variable is
significantly related to teachers’ self-efficacy. A one standard deviation shift in the
feedback score is associated with an increase of a quarter of a standard deviation in
teachers’ self-efficacy score. We use this feedback summary score again in the
multiple regression models later in the chapter.
9.5 How do working relationships with colleagues affect self-efficacy?
32. TALIS included questions asking whether teachers had been involved in exchange,
collaboration, and also about the extent of cooperation with other teachers. These
were used by OECD to derive three indices – named as exchange/coordination for
teaching, professional collaboration, and teacher cooperation. In this section we
investigate whether these exchange, collaboration and cooperation indices are
related to the self-efficacy of teachers. The relationship in England between each of
these measures and teacher self-efficacy is summarised in Figure 9.9 which shows
how the mean self-efficacy score varies across quartiles of the exchange, cooperation
and collaboration variables.
33. There is clearly an association between exchange/coordination and teacher self-
efficacy. Teachers who were more engaged in exchange/coordination also reported
significantly higher levels of self-efficacy.
34. Similarly, there is also a positive, and statistically significant, association between the
professional collaboration index and teacher self-efficacy. A one standard deviation
increase in professional collaboration is associated with an increase of about 0.3 of a
standard deviation in teacher self-efficacy. Teacher self-efficacy is positively
associated with the measure of cooperation too. This association is statistically
significant and very similar in magnitude to that for professional collaboration and
teacher self-efficacy.

186
Figure 9.9 Average teacher self-efficacy scores by quartiles of teacher exchange, collaboration and
cooperation indices
Source: TALIS database
Note: The thin black line in the centre of each bar represents the estimated 95% confidence interval. Scores greater than zero indicate better than average self-efficacy, scores less than zero indicate worse than average self-efficacy.
35. Each of the three indices, then, shows a strong statistical relationship with teacher
self-efficacy. However, it should be noted that the indices of exchange/coordination
for teaching, professional collaboration, and teacher cooperation are very strongly
correlated with each other. While an association with teacher self-efficacy has been
established in each case, it may not be the case that each of the three indices is
having an independent effect on self-efficacy. This is explored further in the next
section.
9.6 Is self-efficacy correlated with the quality of teacher-student relations?
36. To assess teacher-student relations, teachers in TALIS were given a series of four
statements concerning the quality of interaction at their schools and were asked to
what extent they agreed with them. The statements were: ‘in this school, teachers and
students usually get on well with each other’; ‘most teachers in this school believe that
students’ well-being is important’; ‘most teachers in this school are interested in what
students have to say’; and ‘if a student from this school needs extra assistance, the
school provides it’.

187
37. Based on the answers given to these questions, the OECD derived a scale for each
country measuring the quality of teacher-student relations (the scales are not
comparable between countries). As with other scales we use in this chapter, we
standardised the scale for England to give a mean of zero and standard deviation of
one. We then investigated its correlation with teacher self-efficacy.
38. We find a significant relationship between teacher self-efficacy and quality of teacher-
student relations.103 A one standard deviation improvement in the quality of teacher-
student relations is found be associated, on average, with 0.29 of a standard
deviation increase in teacher self-efficacy – a sizeable difference.
39. So a correlation between teacher-student relations and teachers’ self-efficacy has
been established. This could arise because these two variables are really related to
each other. But it might be that they both just happen to be associated with some third
variable and this is why the correlation occurs. More generally, all the analysis in this
chapter so far has looked at correlations between a single variable and self-efficacy.
Are the relationships which have emerged here still statistically significant once other
factors are allowed for? To address questions such as this, multiple regression
analysis can be used. The rationale for using this technique is that it enables us to
control for other factors when analysing the relationship between each explanatory
variable and teachers’ self-efficacy.
40. We therefore estimated multiple regression models with the standardised teacher
self-efficacy score as the outcome variable. Results from three models are reported in
Table 9.2. Model 1 includes various teacher characteristics and nothing else. Model 2
adds some characteristics of the school including school type, school intake in terms
of prior attainment measured by Key Stage 2 scores, the proportion of pupils on Free
School Meals, and the Ofsted rating of the school. Models 2 and 3 are restricted to
teachers in maintained schools and academies. Model 3 introduces some further
variables which our analysis earlier in the chapter has suggested might well be
important correlates of teachers’ self-efficacy including measures of relations among
teachers and an overall measure of feedback received by the teacher – as well as our
summary score for the teacher-student relations in the school that we are particularly
interested in.
41. Among the characteristics of teachers in Model 1, gender, years of teaching
experience, being qualified to Master’s level, and being on a part-time contract are
statistically significant determinants of teachers’ self-efficacy score. The least
experienced teachers, those with five years or less in the profession, have lower self-
efficacy and this is still the case even after controlling for many other factors in
Models 2 and 3. No statistically significant differences in teachers’ self-efficacy are
found among those with more than five years of teaching experience. This could
mean that teachers’ self-efficacy improves as they gain experience up to a threshold
103
p < 0.001.

188
of about five years. But other explanations are possible. For instance, inexperienced
teachers with low self-efficacy might choose to leave the teaching profession. This
selection effect could also account for differences in self-efficacy between relatively
inexperienced and more experienced teachers. The lower self-efficacy of part-time
teachers is also statistically significant even when further controls are added – as can
be seen in the results for Models 2 and 3. However, gender differences in self-efficacy
are no longer significant in these more elaborate models.
Table 9.2 Multiple regression models of teacher self-efficacy score
Model 1 Model 2 Model 3
Coeff. p-value Coeff. p-value Coeff. p-value
Gender (ref: male)
Female 0.124 0.002 0.049 0.228 0.027 0.515
Teaching experience (re.: 6 to 10 years)
5 years or less -0.157 0.011 -0.188 0.001 -0.206 0.000
11-15 years 0.105 0.083 0.048 0.403 0.028 0.604
16+ years 0.036 0.464 0.052 0.266 0.040 0.414
Highest qualification (ref: Bachelor’s degree or less)
Master’s degree 0.090 0.019 0.116 0.007 0.079 0.071
PhD -0.223 0.454 -0.605 0.062 -0.474 0.040
Part-time contract -0.257 0.000 -0.239 0.000 -0.149 0.006
Fixed-term contract -0.144 0.089 -0.147 0.097 -0.165 0.048
School type (ref: maintained)
School type: academy 0.048 0.296 0.028 0.514
KS2 quartile (ref: lowest quartile)
quartile 2 0.042 0.519 0.077 0.169
quartile 3 -0.107 0.145 -0.084 0.195
quartile 4 (high KS2) -0.095 0.177 -0.044 0.490
FSM quartile (ref: high)
quartile 1 (low FSM) -0.021 0.792 0.002 0.980
quartile 2 0.008 0.909 0.018 0.811
quartile 3 -0.030 0.630 0.023 0.706
Ofsted rating (ref: good)
Outstanding 0.090 0.103 0.030 0.608
Satisfactory -0.107 0.088 -0.090 0.115
Inadequate -0.201 0.098 -0.035 0.709
Summary indices
Teacher co-operation 0.206 0.000
Feedback score 0.155 0.000
Teacher-student relations 0.207 0.000
Constant term -0.038 0.463 0.063 0.417 0.056 0.413
Observations 2,278 2,074 1,978
R2 0.032 0.050 0.156
Source: TALIS database
Notes: the table reports estimates from multiple regression models with the standardized self-efficacy score (mean equal to zero, standard deviation equal to one) as the dependent variable. All variables are dummy variables (with the reference category indicated) other than the summary indices entered in Model 3. Models 2 and 3 are restricted to teachers in maintained schools and academies.

189
42. None of the school-level variables added in Model 2 is a statistically significant
determinant of teachers’ self-efficacy. This confirms the finding earlier in the chapter
of the low importance of variables at the school level as determinants of self-efficacy.
Even after incorporating a full set of individual-level and school-level variables into the
analysis, the model still accounts for only about 5% of the variation in self-efficacy.
43. The inclusion of further variables in Model 3 improves the fit of the model
considerably and it then accounts for nearly 16% of the variation in self-efficacy. The
definitions of some of the variables in Model 3 need to be clarified. Attempts to
include all three of the OECD’s derived indices of exchange/coordination for teaching,
professional collaboration, and teacher cooperation foundered due to the high
correlations between these variables. So the professional collaboration measure was
dropped and a simple average of the exchange/coordination and teacher cooperation
variables was constructed and entered into the model (labelled as ‘Teacher co-
operation’ in Table 9.2). This can be regarded as a broad representation of teacher
cooperation and collaboration. In Model 3 a one standard deviation increase in this
measure of cooperation among teachers at work is associated with about one fifth of
a standard deviation gain in self-efficacy. It seems, then, that cooperative
relationships between teachers are strongly related to teachers’ self-efficacy although
it is not feasible to determine exactly which aspects of these relationships at work are
particularly important.
44. The standardised feedback score defined earlier is also included in Model 3. In this
regression model it can be seen that the feedback score is significantly and positively
associated with teachers’ self-efficacy. A one standard deviation shift in the feedback
score is associated with a change of some 0.16 of a standard deviation in teachers’
self-efficacy.
45. What of the teacher-student relations score? It also continues to be strongly and
positively associated with teachers’ self-efficacy in Model 3. Each standard deviation
increase in the measure of teacher-student relations is associated with an increase of
just over 0.2 of a standard deviation gain in teachers’ self-efficacy. This is somewhat
reduced in comparison to the simple association – where it was 0.29 of a standard
deviation – but it is still substantial. Controlling for a range of teacher and school
characteristics has only reduced the ‘effect’ of teacher-student relations by a third.
46. This ‘effect’ may or may not be causal. Despite controlling for a substantial number of
teacher and school characteristics, it may be the case that good teacher-student
relations (or, to be precise, the teacher’s perception that they are good) may proxy
some unmeasured teacher quality that we do not observe in the data. For example,
teachers with more positive attitudes to life in general may give more positive answers
to both the questions underlying the self-efficacy score and the questions on student-
teacher relations. Or the direction of causality may run from self-efficacy to student-
teacher relations.

190
9.7 Summary
47. The TALIS data can tell us about how the self-efficacy of teachers in England – their
confidence in their own abilities as teachers – compares with that of teachers in other
countries. It can also provide insights into the factors which are related to teachers’
self-efficacy.
48. International comparisons of self-efficacy have to be treated with some caution as
there may be cultural differences influencing the way in which questions are
answered. But, on the face of it, the results from TALIS suggest that teachers in
England are confident in their abilities – their self-efficacy is quite high compared to
that of teachers in other countries in the survey.
49. As for the correlates of teachers’ self-efficacy, the TALIS results for England are
consistent with previous research. For example, those on full-time and permanent
contracts tend to have higher self-efficacy than those who are working part-time or on
fixed-terms contracts. Teachers with less experience tend to have lower self-efficacy.
50. Two further themes have been highlighted in this chapter. One is that there are few
indications of the type of school having a significant relationship with the self-efficacy
of teachers. For example, there is no evidence that self-efficacy is higher, on average,
in independent schools than in maintained schools, nor, among state-funded schools,
that it varies according to the proportion of pupils from poor backgrounds in the
school.
51. The second theme is that self-efficacy tends to be higher when teachers report good
relations with others in the school. This includes cooperation and collaboration with
colleagues, supportive feedback which is associated with positive changes in
behaviour – such as the amount or type of CPD – and also good relations with
students in the school. However, with cross-sectional survey data we cannot be sure
about the direction of causality here. Perhaps teachers with high self-efficacy are
more able to build good relations with students. But it could equally be, for instance,
that by working in schools with good teacher/student relations, teachers become more
confident in their abilities.
52. This last point is an appropriate one on which to conclude the report. It is a reminder
of a warning that we made in Chapter 1: as a cross-section survey, there are clear
limitations to what TALIS can tell us. Correlation does not imply causation.
Nevertheless, as with other parts of the report, the findings in this final chapter
provide more insight into under-researched areas and, where we have been able to
make international comparisons, they show the situation for England in comparative
context.
191
References
Andrews, P. (2013) ‘What does PISA performance tell us about mathematics teaching
quality? Case studies from Finland and Flanders’ in Meyer and Benavot (2013).
Atkinson, A., Burgess, S., Croxson, B., Gregg, P., Propper, C., Slater, H., and Wilson, D.
(2009) ‘Evaluating the impact of performance-related pay for teachers in England’.
Labour Economics, 16 (3): 251-61.
Bandura, A. (1997) Self-efficacy: the exercise of control. New York: Freeman.
Barber, M., Whelan, F. and Clark, M. (2010) Capturing the leadership premium: how the
world’s top school systems are building leadership capacity for the future. London:
McKinsey & Company.
Blatchford, P., Russell, A., and Webster, R. (2012) Reassessing the impact of teaching
assistants: how research challenges practice and policy. Abingdon, Oxon, UK:
Routledge.
Besley, T. and Machin, S. (2008) ‘Are public sector CEOs different? Leadership wages
and performance in schools’. Mimeo. LSE.
Brundrett, M. and Crawford, M. (Eds.) (2008) Developing school leaders: An international
perspective. Abingdon: Routledge.
Caprara, G. V., Barbaranelli, C., Borgogni, L., and Steca, P. (2003) ‘Efficacy beliefs as
determinants of teachers' job satisfaction’. Journal of Educational Psychology, 95, 821-
832.
Crowther, F., Kaagan, S., Ferguson, M. and Hann, L. (2002) Developing teacher leaders:
How teacher leadership enhances school success. Thousand Oaks, CA: Corwin Press.
Day, C., Sammons, P., Hopkins, D., Harris, A., Leithwood, K., Gu, Q., Brown, E.,
Ahtaridou, E. and Kington, A. (2009) The impact of school leadership on pupil outcomes:
final report. DCSF Research Report RR108.
Day, C., Sammons, P., Leithwood, K., Hopkins, D., Gu, Q., Brown, E., and Ahtaridou, E.
(2011) Successful school leadership: Linking with learning and achievement.
Maidenhead: Open University Press.
Day, C. and Sammons, P. (2013) Successful leadership: a review of the international
literature. Reading: CfBT Education Trust.
Deakin, G., James, N., Tickner, M. and Tidswell, H. (2010) Teachers’ workload diary
survey 2010. Department for Education Research Report 57.
192
Department for Education (2010) The importance of teaching. The schools White Paper
2010. Cm 7980.
Department for Education (2013) Schools, pupils and their characteristics: statistical first
release. January.
Department for Education (2013a) School teachers’ pay and conditions 2013 and
guidance on school teachers’ pay and conditions. September.
Department for Education (2013b) Statistical first release. School workforce in England:
November 2012. SFR 15/2013.
Department for Education (2013c) Teachers’ standards. Guidance for school leaders,
school staff and governing bodies, July 2011 (introduction updated June 2013).
Desimore, L. M. (2009) ‘Improving impact studies of teachers’ professional development:
toward better conceptualisations and measures’. Educational Researcher, 38 (3), 181-
199.
Dolton, P. and Marcenaro-Gutierrez, O. (2013) Global teacher status index 2013.
London: The Varkey GEMS Foundation.
Friedman, I. A., and Kass, E. (2002) ‘Teacher self-efficacy: a classroom-organization
conceptualization’. Teaching and Teacher Education, 18, 675-686.
Gronn, P. (2000) ‘Distributed properties: A new architecture for leadership’. Educational
Management and Administration, 28(3), 338–371.
Gronn, P., and Rawlings-Sanaei, F. (2003) ‘Principal recruitment in a climate of
leadership disengagement’. Australian Journal of Education, 47(2), 172-184.
Hargreaves, A., and Goodson, I. (2006) ‘Educational change over time? The
sustainability and nonsustainability of three decades of secondary school change and
continuity’. Educational Administration Quarterly, 42(1), 3-41.
Heck, R. H. and Hallinger, P. (2010) ‘Testing a longitudinal model of distributed
leadership effects on school improvement’. The Leadership Quarterly, 21(5), 867-885.
Kelm, J. L., and McIntosh, K. (2012) ‘Effects of school-wide positive behavior support on
teacher self-efficacy’. Psychology in the Schools, 49(2), 137-147.
Klassen, R. M., and Chiu, M. M. (2010) ‘Effects on teachers' self-efficacy and job
satisfaction: teacher gender, years of experience, and job stress’. Journal of Educational
Psychology, 103(3), 741-756.
Klassen, R. M., and Chiu, M. M. (2011) ‘The occupational commitment and intention to
quit of practicing and pre-service teachers: Influence of self-efficacy, job stress, and
teaching context’. Contemporary Educational Psychology, 36, 114-129.
193
Klassen, R. M., Tze, V. M. C., Betts, S. M., and Gordon, K. A. (2011) ‘Teacher efficacy
research 1998–2009: Signs of progress or unfulfilled promise?’. Educational Psychology
Review, 23(1), 21-43.
Kreuter, F. and Valliant, R. (2007) ‘A survey on survey statistics: What is done and can
be done in Stata’. The Stata Journal, 7 (1) 1-21.
May, H., Boe, E., and Boruch, R. (2003) ‘The ecological fallacy in comparative and
international education research: Discovering more from TIMSS through multilevel
modeling’. Research Report 2003-TIMSS1, Graduate School of Education, University of
Pennsylvania.
Meyer, H-D. and Benavot, A. (2013) PISA, power, and policy: the emergence of global
educational governance. Oxford: Symposium Books.
Muijs, D., and Harris, A. (2003) ‘Teacher leadership – improvement through
empowerment?’. Educational Management and Administration, 31(4), 437-449.
Murphy, R. and Machin, S. (2011) Improving the impact of teachers on pupil achievement
in the UK – interim findings. The Sutton Trust.
National College for School Leadership (2008) What are we learning about…recruiting
primary school teachers? Evidence into Practice Guide. Nottingham: National College for
School Leadership.
OECD (2009) Creating effective teaching and learning environments. First results from
TALIS. Paris: OECD.
OECD (2012) Strong performers and successful reformers in education: lessons from
PISA for Japan. Paris: OECD,.
OECD (2013) The TALIS Conceptual Framework.
http://www.oecd.org/edu/school/TALIS%20Conceptual%20Framework_FINAL.pdf
OECD (2013a) Education at a glance. Paris: OECD.
OECD (2014) TALIS 2013 results: an international perspective on teaching and learning.
Paris: OECD.
Ofsted (2013) The report of Her Majesty’s Chief Inspector of Education, Children’s
Services and Skills: Schools. (Annual Report 2012/13). Manchester: Ofsted.
Ofsted (2014) The framework for school inspection (No. 120100). Manchester: Ofsted.
Opfer, V. D., and Pedder, D. G. (2011) ‘The lost promise of teacher professional
development in England’. European Journal of Teacher Education, 34 (1), 3-24.

194
Opfer, V. D., Pedder, D. G. and Lavicza, Z. (2008) Schools and continuing professional
development in England – state of the nation research study (T34718): survey report.
London: Training and Development Agency for Schools.
Passy, R. and Golden, S. (2010) Teacher resignation and recruitment survey: report no.
41 (LGA Research Report). Slough: NFER.
Pedder, D., Opfer, V. D., McCormick, R. and Storey, A. (2010) ‘Schools and continuing
professional development in England – state of the nation research study: policy context,
aims and design’. The Curriculum Journal, 21 (4), 365-394.
Rose, M. (2007) ‘Why so fed up and footloose in IT? Spelling out the associations
between occupation and overall job satisfaction shown by WERS 2004’. Industrial
Relations Journal, 38:4, 356-384.
Russell, A., Webster, R. and Blatchford, P. (2013) Maximising the impact of teaching
assistants: guidance for school leaders and teachers. Abingdon, Oxon, UK: Routledge.
Sammons, P., Day, C., Kington, A., Gua, Q., Stobart, G., and Smees R. (2007) ‘Exploring
variations in teachers' work, lives and their effects on pupils: key findings and implications
from a longitudinal mixed-method study’. British Educational Research Journal 33(5):
681-701.
Sammons, P., Gu, Q., Day, C. and Ko, J. (2011) ‘Exploring the impact of school
leadership on student outcomes: results from a study of academically improved and
effective schools in England’. International Journal of Educational Management, 25(1),
83-101.
Skaalvik, E. M., and Skaalvik, S. (2007) ‘Dimensions of teacher self-efficacy and relations
with strain factors, perceived collective teacher efficacy, and teacher burnout’. Journal of
Educational Psychology, 99(3), 611-625.
Slater, H., Davies, N., Burgess, S. (2011) ‘Do teachers matter? Measuring the variation in
teacher effectiveness in England’. Oxford Bulletin of Economics and Statistics, 74(5):
629-645.
Sprigade, A., and Howson, J. (2012) The state of the labour market for senior staff in
schools in England and Wales 2011-12. 18th annual report, Education Data Surveys.
Sturgis, P., Smith, P. and Hughes, G. (2006) A study of suitable methods for raising
response rates in school surveys. DfES Research Report 721.
Thomson, P., Blackmore, J., Sachs, J., and Tregenza, K. (2003) ‘High stakes
principalship – sleepless nights, heart attacks and sudden death accountabilities: reading
media representations of the United States principal shortage’. Australian Journal of
Education, 47(2), 118-132.

195
TNS BMRB (2014) Teachers’ workload diary survey 2013. Department for Education
Research Report 316.
Tschannen-Moran, M., and Woolfolk-Hoy, A. (2001) ‘Teacher efficacy: capturing an
elusive construct’. Teaching and Teacher Education, 23, 944-956.
Watanabe, M. (2013) Juku: the stealth force of education and the deterioration of schools
in Japan. CreateSpace Independent Publishing Platform.
Wolters, C. A., and Daugherty, S. G. (2007) ‘Goal structures and teachers' sense of
efficacy: their relation to teaching experience and academic level’. Journal of Educational
Psychology, 99, 181-193.
Woods, P.A., Bennett, N., Harvey, J.A., and Wise, C. (2004) ‘Variabilities and dualities in
distributed leadership: findings from a systematic literature review’. Educational
Management, Administration and Leadership, 32(4), 439-457.
Wilshaw, M (2013) ‘The Unlucky Child’. Speech by Her Majesty’s Chief Inspector of
Education, Children's Services and Skills, Manchester: Ofsted.

196
Appendix A TALIS 2013 in England: administration, sampling and response
1. The objective of TALIS 2013 was to obtain a representative sample of ISCED level 2
teachers and their headteachers.104 ISCED 2 translates to Key Stage 3 (age 11-14) in
England.
2. The administration of TALIS 2013 was carried out internationally on behalf of OECD
by a consortium formed by the International Association for the Evaluation of
Educational Achievement (IEA) and Statistics Canada. The consortium worked with
the TALIS National Centre within each country, through the National Project Manager
(NPM). For England, RM Education and the Institute of Education (IOE), London,
were the TALIS National Centre. The project was led by the NPM at RM Education
(RM). RM conducted the survey.
3. National Centres were responsible for making local adaptations to instruments and
manuals. RM, in consultation with IOE and the Department for Education, made
appropriate adaptations to the TALIS teacher and headteacher questionnaires.
4. National Centres were also responsible for supplying the information necessary for
sampling to be carried out. The sample of schools was selected by the TALIS
consortium using a sampling frame supplied by RM, while teacher samples within
schools were selected by RM using software supplied by the consortium and lists of
teachers supplied by schools.
5. Following field trials in the Spring of 2012, countries were required to carry out the
survey during late 2012 (southern hemisphere) or early 2013 (northern hemisphere).
In England, TALIS was conducted during March-May 2013.
6. TALIS in England, as in other countries, had a two-stage design. At the first stage,
schools were selected with probability proportional to size with a target sample of 200
schools (size was measured by the number of Key Stage 3 teachers in the school
indicated in the School Workforce Census and, for independent schools, the School
Level Annual School Census). At the second stage, a random sample of 20 teachers
of Key Stage 3 pupils were selected in each school. Schools or teachers selected
could be judged ‘out of scope’. In practice, no schools were judged to be in this
category, given the sampling frame of schools that was constructed (schools catering
only to pupils with special needs were not part of the target population and were
excluded from the sampled population). Teachers teaching only to special needs
students or who were not in fact teaching Key Stage 3 pupils were out of scope –
other categories are detailed in the OECD international report on TALIS 2013 (OECD,
104
ISCED is the International Standard Classification of Education. Some participating countries in addition collected information on teachers of ISCED level 1 (primary) and 3 (upper secondary) pupils.

197
2014). There was no minimum cut-off for the amount of Key Stage 3 teaching that
teachers needed to be engaged in, provided they were doing some.
7. The school sample was stratified by four categorical variables: type of school (state –
local authority maintained or academy – and independent), size (whether or not the
school had only one Key Stage 3 year group), region (North, Midlands, Greater
London, and South), and average Key Stage 2 results of pupil intake (low, middle,
high). 15 strata were formed from combinations of these four variables. Schools were
sorted by size (measured by the number of teachers) within each stratum. Following
the sample design laid down for all countries in TALIS, a sample of schools was
drawn, together with a ‘1st replacement’ and ‘2nd replacement’ school as back-ups for
each school originally sampled – the school immediately before and after the
originally sampled school in each stratum.
8. The teacher sample was drawn by randomly sampling teachers in each school from
lists provided by schools. There was no explicit stratification. 20 Key Stage 3 teachers
were sampled by default. If a school had 30 teachers or less, all were sampled for
convenience.
9. Headteachers of the sampled schools were sent a letter informing them that their
school had been randomly selected to take part in TALIS 2013. Headteachers were
asked to confirm their school’s participation in TALIS and to nominate a school
coordinator who would act as the main contact between the National Centre (RM) and
the school. School coordinators were asked to carry out a number of tasks, the first
being to complete a list of Key Stage 3 teachers in their school. From this, teachers
were sampled at random (see above) and then requested to complete a teacher
questionnaire. The school headteacher was also asked to complete a headteacher
questionnaire. The National Centre provided weekly updates to the school coordinator
on which teachers had completed the questionnaires and to ask the coordinator to
encourage completion by those yet to do so. Emails were sent from the National
Centre direct to the sampled teachers with a link to the questionnaire and with unique
login details.
10. Headteachers and teachers had the option of either filling in a paper questionnaire or
responding on-line. 91% of both responding headteachers and responding teachers
chose the on-line option.
11. We now turn to the issue of response.105 Table A.1 shows school response by
stratum. In total, 154 schools responded to TALIS and there are therefore 154
responding headteachers in the sample. This represents an unweighted school
response rate of 75.1%.Two points need to be made about the definition of response
105
We focus on unit response. There is also the issue of item non-response, whether among teachers or headteachers. As in most surveys, there is an element of this. For example, while all teachers responding to the survey in England responded to the first question on gender, about 7% failed to respond to much of one of the last questions on job satisfaction. Item non-response is treated by assigning a missing value for the variable concerned and the cases affected are excluded from any analysis.

198
underlying this calculation. First, if a school agreed to take part in the survey but less
than 50% of the teachers within the school responded, TALIS rules require that this
school is treated as not participating. These schools, of which there were 18 in total,
are included among the non-respondents in Table A.1.106 Second, the calculations
ignore schools that did not respond which were replaced by a 1st or 2nd replacement
school. The figure of 205 in the denominator of the calculation of the overall response
rate – the ‘total’ figure at the foot of the first column – is therefore made up partly of
‘original’ schools (schools originally sampled), partly of 1st replacements and partly of
2nd replacements. Likewise, schools in the numerator of the response rate (shown in
columns 2-4) included all three types of school.107
12. A school response rate of 75% after use of replacements is the minimum required of
a country in TALIS 2013 for its data to be included in the OECD’s international
analyses without any need for an investigation of the pattern of response and
resulting biases. England therefore just met this threshold.
13. The figures in the final column of Table A.1 show clearly that school response varied
by stratum. For example, in none of the three strata of state schools in London did
response reach 60%. Response was also lower among schools in the last two strata
– independent schools. Non-response adjustment weights attached to the data by the
international TALIS consortium adjust for the differences in the pattern of response
across the strata that may induce biases. These weights are simply the reciprocal of
the proportion of schools responding within each stratum.
14. The teacher response rate in TALIS is defined as the percentage of all teachers in
responding schools – that is, excluding the schools where teacher response fell below
50% – who respond to the survey.108 There were 2,992 teachers in responding
schools in England who were not out of scope. Of these, 2,496 responded to the
survey, resulting in an unweighted teacher response rate of 83.4%. The minimum
teacher response rate required for a country to be automatically included by the
OECD in its analyses of the data is 75%. The rate in England therefore easily cleared
this threshold.
106
Were these schools to be have been included in the calculation of school response, the response rate would have risen to 83.9%. The teacher response rate in these schools varied from zero to 45%, with an average of 19%. 107
Excluding the replacements, the unweighted response rate among the originally sampled schools was 56.1%. Including the 1
st replacements only, it was 69.3%.
108 In effect, it is therefore the teacher response rate conditional on overall teacher response in each
individual’s school exceeding 50%.

199
Table A.1 School sample and response
Stratum all
sampled schools
original schools
1st repl.
2nd repl.
non- responding
schools
response rate
(%)
1. State, small, all regions, all bands
4 1 1 0 2 50.0
2. State, not small, North, high
14 9 1 1 3 78.6
3. State, not small, North, middle
23 16 3 0 4 82.6
4. State, not small, North, low
16 9 1 1 5 68.8
5. State, not small, Midlands, high
9 6 1 0 2 77.8
6. State, not small, Midlands, middle
17 11 0 4 2 88.2
7. State, not small, Midlands, low
11 6 4 0 1 90.9
8. State, not small, London, high
7 2 2 0 3 57.1
9. State, not small, London, middle
11 6 0 0 5 54.5
10. State, not small, London, low
8 3 1 0 4 50.0
11. State, not small, South, high
19 10 2 2 5 73.7
12. State, not small, South, middle
31 21 3 2 5 83.9
13. State, not small, South, low
18 7 7 1 3 83.3
14. Private, small
4 2 0 0 2 50.0
15. Private, not small
13 6 1 1 5 61.5
Total 205 115 27 12 51 75.1
Source: TALIS international consortium weighting report for England
Note: ‘State’ includes Local Authority maintained schools and academies, ‘private’ schools are independent schools. ‘Original’ schools are the responding schools that were first sampled and ‘1
st
repl.’ and ‘2nd
repl.’ are their first and second replacements (see text for explanation) and are also responding schools. Non-responding schools include those where the school did in fact respond but where the within-school teacher response rate fell below 50%.
15. Table A.2 provides an analysis of the pattern of response among the 2,992 teachers.
We report results of a linear probability model: OLS regression of a 0/1 variable
indicating non-response/response. We use unweighted data and allow for the
clustering of teachers within schools when estimating standard errors.109 We observe
only three individual characteristics for both respondents and non-respondents, all
taken from administrative records: gender, age, and main subject taught
109
A logistic or probit regression would in principle be a better model for the data, restricting predicted values within the unit interval and avoiding the heteroskedasticity of the error term of the linear probability model. But the linear probability model is sufficient for our purpose here, which is to illustrate simply how average response varies with observed characteristics.

200
(distinguishing four groups of subjects). We also include in the model the latest Ofsted
rating of the teacher’s school.110
16. The model explains very little of the non-response, as indicated by the low r-squared
value. However, holding other observed factors constant, reponse is on average
about 3 percentage points lower for men, about 2 points lower for every increase in
age of 10 years, and about 5 points higher for maths and science teachers compared
to English or foreign language teachers (these differences are all statistically
significant at the 5% level or less). Average response is notably lower for teachers in
the small number of schools with an ‘inadequate’ Ofsted rating, by some 15
percentage points.
Table A.2 Linear probability model of teacher response
Coefficient t-statistic
Demographic characteristics
Male (base = female) -0.032 -2.4
Age (÷10) -0.019 -2.9
Subject (base = English or foreign language)
Human Sciences (e.g. History, Geography) +0.016 +0.6
Maths and Science +0.048 +2.2
Other (e.g. Music, Art, Physical Education) +0.034 +1.9
Ofsted rating (base = outstanding)
Good -0.028 -0.9
Satisfactory -0.058 -1.7
Inadequate -0.149 -2.9
Constant +0.927 29.7
Adjusted r-squared 0.014
Source: TALIS international consortium weighting report for England
Note: sample size = 2,992 (2,496 respondents, 496 non-respondents), unweighted data.
17. However, given the high level of response to the survey, these differences are
insufficient to cause more than very minor biases in the composition of the responding
sample. The following figures refer to the composition of the responding sample of
2,496 teachers and, in brackets, to the composition of the 2,992 teachers in
responding schools. (All figures are based on unweighted data.) In each case the
differences are very slight.
Female: 63.2% (62.5%)
Average age: 39.8 (40.0)
English or modern language teacher: 26.5% (27.2%)
Maths or science teacher: 25.7% (25.0%)
110
Age is proxied by 2013 minus year of birth, with six missing values set to the mean, 40. Nine missing values for subject are set to the modal group, ‘Other’.

201
‘Outstanding’ Ofsted rating: 28.5% (27.5%)
‘Inadequate’ Ofsted rating: 3.4% (4.0%)
18. The international TALIS consortium’s adjustment factor for teacher non-response
(part of the final weights supplied with the data) is the reciprocal of the proportion of
teachers responding in each school. It therefore allows just for the level of non-
response within each school but not the pattern. However, in doing so it may help
adjust for any teacher response patterns associated with school characteristics.
19. The combination of (i) high levels of response at both school (allowing for
replacement) and teacher levels, (ii) school non-response adjustment factors that vary
by stratum (with stratification variables that include Key Stage 2 results), and (iii) the
evidence of only slight biases induced by the response pattern for teachers, implies
that the achieved TALIS sample represents a reasonable basis for analysis.
202
Appendix B Allowing for sampling error in TALIS
1. As a sample survey, the estimates that can be obtained with TALIS are subject to
sampling error due to the chance process in drawing a probability sample.111 The
standard textbook formula for the ‘margin of error’ – the confidence interval around an
estimate – or for the test statistic or p-value in a hypothesis test assumes that a
sample is drawn randomly, the simplest form of probability sampling.
2. The sample design of TALIS, described in Appendix A, is not one of simple random
sampling. A stratified two-stage cluster design was used. The sampling of schools
took place within strata at a first stage and the teachers, sampled at the second
stage, must be seen as clustered within these first stage units. On the one hand,
stratification improves the precision of estimates obtained with the data. On the other,
clustering typically reduces it (and, in general, the clustering can be expected to
dominate, resulting in a net reduction in precision). Estimates of standard errors and
hence confidence intervals, test statistics, and p-values need to allow for these and
other features of the survey’s complex design.
3. The method used by the OECD to do so creates a set of ‘balanced repeated
replication’ (BRR) weights and is a replication method for estimation of standard
errors. The gist of the method is as follows (we simplify from the procedure actually
used). First, responding schools in each country are paired within the explicit strata.
The statistic of interest (a mean, a proportion, a regression coefficient) is then
calculated repeatedly, each time dropping one school in each pair (and reweighting
the one that remains). The square root of the variance of these estimates can then be
taken as the estimate of the standard error. The method for carrying out this
procedure is the application of a set of weights, the BRR weights, supplied with the
data. The method has the advantage of including all information on the complex
sample design (notably the stratification and clustering) as well as the design and
non-response adjustment weights.
4. Our analysis of the TALIS database for the report uses the Stata software, which is
able to apply these BRR weights appropriately. All our estimates of sample statistics
and standard errors use the BRR weights and we have checked that in doing so we
can exactly replicate the OECD’s estimates of the same statistics and standard
errors.112
111
Sampling error is the difference between a sample statistic and the population parameter of which the statistic is an estimate. 112
Other Stata users analysing the TALIS data may do the same by using the svyset command as
follows in conjunction with the appropriate svy command for the procedure concerned, where TCHWGT is
the final teacher weight and TRWGT1 to TWRGT100 are the BBR teacher weights (the command is for analysis of the teacher file and an analogous command applies for the headteacher file):
svyset [iweight= TCHWGT], brrweight(TRWGT1 - TRWGT100) vce(brr) fay(.5) mse
(The mse option, for example, means that it is the deviations of each sub-sample estimate from the full
sample estimate that enter the calculation.) For more discussion, see e.g. Kreuter and Valliant (2007).

203
5. All bar charts in the report based on TALIS data include estimates of 95% confidence
intervals that are based on standard errors calculated using the BRR weights. We
sometimes refer to these as showing the ‘margin of error’ around an estimate. When
we describe differences in means or proportions as being ‘statistically significant’, this
refers to the appropriate statistical test with a 5% significance level, unless otherwise
stated, computed with the use of the BRR weights.
204
Appendix C High and low performing countries
1. We identify ‘high’ and ‘low’ performing countries in TALIS on the basis of average
(mean) scores for their 15 year olds in PISA (Programme of International Student
Assessment). As a check, in the case of our identification of high performing
countries, we also look at results for 13-14 year olds in TIMSS (Trends in International
Mathematics and Science Study) and for 16-24 year olds in PIAAC (Programme for
the International Assessment of Adult Competencies). We refer to the scores for
relevant ‘sub-national entities’ – parts of countries – where appropriate in all surveys
and include these sub-national entities below in our reference to ‘countries’.
2. Besides the choice of survey (PISA, TIMSS or PIAAC), there are also the choices of
subject (maths, science, reading), and date (for example 2012 for PISA, 2011 for
TIMSS, and earlier sweeps of either). Ideally, we want to identify countries that are
consistent across the different dimensions, thus avoiding an identification of high or
low performance on the basis of what might be abnormal average scores in one or
more of them. We might also be concerned with trend: for example when defining
high performers we might prefer countries moving up over time to those moving
down, but we do not take any account of this.
Low performers
3. These are the eight countries with mean scores in PISA 2012 below 450 in all three
subjects (maths, science and reading): Abu Dhabi, Brazil, Bulgaria, Chile, Malaysia,
Mexico, Romania, and Serbia. 450 is a low PISA score: as much as half of an
international standard deviation (100) below the mean for all OECD countries
(500).113 Some countries are well below this level. 450 is also far below the lowest
mean score in England in 2012 (495 in maths, standard error 3.9). Of the eight
countries, the six that were also present in PISA 2009 were all in the same position:
scoring below 450 on all subjects and far adrift of England. The low performers are
therefore defined on an absolute basis – a low average score in all subjects in
PISA.114
High performers
4. We define high performance in relative terms from the perspective of England: high
performers are countries with higher mean scores than England with the difference
being statistically significant at the 5% level or less. There are nine countries that
outperform England on this basis in at least two subjects in PISA in both 2012 and
2009: Japan, Korea, Singapore, Finland, Estonia, The Netherlands, Flanders
113
The means and standard deviations for each subject are set at 500 and 100 among OECD countries the first time that subject is the focus of a PISA round, e.g. 2003 in the case of maths. 114
We exclude Cyprus from our analysis in this report – see footnote 18 in Chapter 1. Were we to have included Cyprus, this country would also have been classified as a low performer.

205
(Belgium), Alberta (Canada) and Australia. Of these nine, five have significantly
higher scores in both years on all three subjects. In 2012, England’s mean differed
from that of the median country in this group by 28 points (maths), 23 points
(science), and 24 points (reading) i.e. by about a quarter of an international standard
deviation.
5. TIMSS scores for 2011 and 2007 for both maths and science give strong support for
classifying Japan, Korea, and Singapore as high performers (as defined here).
Support is reasonable for Finland and Alberta (Canada): mean scores significantly
above England in one subject in 2011(neither country was present in 2007). The
support for Australia is weak – significantly below England in three of the four cases
across the two years (but sometimes only just). Nevertheless we retain Australia in
our high performing group. Netherlands and Flanders (Belgium) were not present in
TIMSS in either year.
6. All nine high performers took part in PIAAC in 2011-12, except Singapore. All had
significantly higher mean scores for 16-24 year olds in both literacy and numeracy
than England. This was not hard as England’s mean performance was particularly
weak in PIAAC, but most of these eight countries are also above the OECD average.
7. Our definitions of high and low performance are limited in at least two ways. First,
they focus only on average scores. We take no account of the degree of inequality in
scores, in particular the length of the lower tail of the distribution. Second, in focusing
only on scores in achievement tests the definitions take no account of other aspects
of the performance of an educational system in developing a country’s young people.

206
© Institute of Education, University of London 2014
Reference: DFE-RR302
ISBN: 978-1-78105-367-6
The views expressed in this report are the authors’ and do not necessarily reflect those of
the Department for Education.
Any enquiries regarding this publication should be sent to us at:
[email protected] or www.education.gov.uk/contactus
This document is available for download at www.gov.uk/government/publications