teachers’ workload - assets.publishing.service.gov.uk · on average, all school teachers report...
TRANSCRIPT

Teachers’ workload diary survey 2013 Research report
February 2014
TNS BMRB
2
Contents
Table of figures 3
Executive summary 5
Acknowledgements 7
Introduction 8
Background 8
Differences in survey methodology between 2010 and 2013 8
Response rate 10
Teacher workload 11
Total hours worked 11
Teaching hours 12
Before school day, evening and weekend working 13
Survey findings 14
Analysis of hours spent in total and on each activity 14
Attitude to job and workload 17
References 23
Annex A: Tables 24
Annex B: Technical report and sample 40
3
Table of figures
Figure 1 Response rate by type of school and teacher 10
Figure 2 Average hours worked by full-time teachers 11
Figure 3 Average total teaching hours worked by full-time teachers 12
Figure 4 Percentage of teaching hours as a proportion of total working hours for full-time teachers
12
Figure 5 Percentage of hours worked in the evening, before the school day and on weekends as
percentage of total hours worked per week, full-time teachers only 13
Figure 6 Total hours worked by type of school and role (a) 14
Figure 7 Total amount of time spent on tasks considered to be unnecessary or bureaucratic 14
Figure 8 Change in amount of time spent on tasks considered to be unnecessary or bureaucratic
19
Figure 9 What would improve the quality of teaching and pupil learning? 21
Figure 10 Average hours worked by full-time teachers, on grouped activities and in total 25
Figure 11 Average hours worked by full-time classroom teachers 27
Figure 12 Average total hours worked by full-time classroom teachers by demographics 28
Figure 13 Average hours spent on individual activities by full-time teachers 29
Figure 14 Percentage of total hours worked by full-time teachers at weekends, before school or
after 6pm on weekdays 29
Figure 15 Composition of hours worked at weekends, before school and after 6pm for full-time
teachers 30
Figure 16 Examples of paper work that can be unnecessary and bureaucratic 31
Figure 17 Examples of marking or recording pupil progress that can be unnecessary and
bureaucratic 32
Figure 18 Examples of data (analysing/reporting/evidence gathering) that can be unnecessary and
bureaucratic 35
Figure 19 Examples that the level of detail and format of planning and preparation in schools that
can be unnecessary and bureaucratic 36
Figure 20 Examples of activities relating to SATS and exams that can be unnecessary and
bureaucratic 37

4
Figure 21 Examples of other activities that can be unnecessary and bureaucratic 38
Figure 22 Reason for increase in time spent on unnecessary and unnecessarily bureaucratic tasks
39
Figure 23 One requirement they would ask Department for Education to remove 40
Figure 24 Other tasks that would improve the quality of teaching and pupil learning if able to spend
more time on them 39
Figure 25 Sample of teachers drawn by strata 41
Figure 26 Response rate by school type 42
Figure 27 Confidence intervals by teach type 47

5
Executive summary
The 2013 Teachers’ Workload Diary Survey provides independently collected data on hours
and working patterns of teachers in maintained primary and secondary schools, special
schools and academy schools in England. This is the twelfth survey; previous surveys were
carried out in 1994, 1996, 2000 and then annually between 2003 and 2010. The 2013
survey was commissioned by the Department for Education (DfE).
A sample of 1,004 teachers was achieved - lower than in previous surveys.
As explained fully in the introduction, there were significant differences between the method
used in the 2013 survey and the method used in previous surveys, specifically relating to
sampling, data collection and the survey format. As a result, this data is not comparable
with that from surveys in previous years and this report focuses on findings from 2013.
On average, all school teachers report working over 50 hours per week, with primary and
secondary school headteachers reporting more than 60 hours.
Classroom teachers in most school types report teaching 19 to 20 hours a week. The
exception to this was teachers in special schools who reported teaching 16.8 hours.
Teachers of all types work around 12 hours a week outside what might be regarded as their
normal working week. Heads spent around half of this time on school and staff
management while classroom teachers spent at least three quarters of it on planning,
preparation and assessment (PPA). Time spent on PPA was as common for classroom
teachers in primary, secondary and academy schools as teaching at around a third of their
total workload.
Certain types of activities dominated workload for different types of teacher. The majority of
a secondary school headteacher workload is made up of activities that relate to school and
staff management (61%).
Other activities were performed to a lesser extent. Non-teaching pupil or parent contact
made up 10% - 14% of a classroom teacher’s workload and slightly more than that for
headteachers in secondary schools (16%). On average less than 10% of workload was
spent on general administrative duties. Headteachers in secondary school spent 11% of
their time on individual or professional development, while it was a much smaller proportion
of classroom teacher working time (5% or less).
More than eight in ten teachers felt that only ‘a little’ or ‘some’ of their time was spent on
these types of tasks. A small proportion of teachers overall (6% deputy heads and
classroom teachers, 3% heads) felt that ‘all’ or ‘most’ of their time was spent on
unnecessary or bureaucratic tasks.
The most common reasons given to explain the increase in unnecessary and bureaucratic
tasks were preparation for an Ofsted inspection (16% of deputy heads and classroom
teachers, and 17% heads) and an increase in forms and paperwork (15% of deputy heads
and classroom teachers).
Teachers were asked to give examples of what they thought were unnecessary and
bureaucratic tasks in a number of different areas. Across all areas two common themes

6
emerged, which were duplication and the level of detail required in certain circumstances.
In particular duplication was referred to in terms of paper work, marking and recording pupil
progress and data analysis, reporting and evidence gathering. The level of detail was
considered by teachers to be unnecessary with regard to planning and preparation and
marking and progress recording.
Three in ten deputy head and classroom teachers (30%) felt that spending more time
discussing work with individual pupils would be one of the three things that would improve
the quality of teaching and pupil learning. Just over a quarter selected one to one and small
group teaching (28%), while a quarter each chose collaborative planning with colleagues
(26%) and exploring and selecting resources (25%).
Observational learning was favoured by headteachers. Slightly more than a third of heads
(36%) said observing colleagues teaching would be one of the three things that would
improve the quality of teaching and pupil learning, and a similar proportion said observing
good practice in other schools (32%).
7
Acknowledgements
TNS BMRB wishes to thank the stakeholders who supported the design and delivery of the 2013
survey, and the teachers who spent time completing the diary.

8
Introduction
The 2013 Teachers’ Workload Diary Survey provides independently collected data on hours and
working patterns of teachers in maintained primary and secondary schools, special schools and
academy schools in England. This is the twelfth survey; previous surveys were carried out in 1994,
1996, 2000 and then annually between 2003 and 2010. The 2013 survey was commissioned by
the Department for Education (DfE).
As explained below, there were significant differences between the method used in the 2013
survey and that used in previous surveys. The data is therefore not comparable with that from
previous years: this report focuses on findings for 2013 only.
Background
The Department for Education is committed to ensuring that teachers’ time and energies are
focused on the key tasks that require their particular professional skills, expertise and judgement,
and thus to reduce the overall workload by redistributing or eliminating other tasks.
Differences in survey methodology between 2010 and 2013
A series of changes to the survey methodology mean that figures from the 2013 survey cannot be
directly compared to figures from previous surveys.
The 2013 survey differed from previous surveys in a number of respects: sampling methodology,
data collection, survey format and the activity codes used in completing the survey. Changes in
each of these areas are detailed below.
Sampling
In previous surveys selected schools were recruited by interviewers via the headteacher and up to
14 staff were selected at random and invited to participate in the survey. This approach meant that
the sample comprised a relatively high proportion of teachers in a relatively small number of
schools.
The approach to sampling changed significantly in 2013. Instead of recruiting teachers through
their school and headteacher, a random probability sample of all qualified teachers in England was
selected from the school workforce census1. This meant that the 2013 sample comprised a much
lower proportion of teachers across a much larger number of schools.
For example, in 2010, 662 maintained schools were randomly selected, with 164 schools (25%)
returning at least one completed diary survey. Across these 164 schools, 2,179 teachers were
sample, with 1,244 teachers (57%) completing a useable diary survey. In the 2013 survey, a larger
number of teachers were sampled across the workforce (6,753), with 1,004 (15%) completing the
diary survey.
1 The School Workforce Census is a statutory collection of individual level data on teachers and support staff from
local authorities, local authority maintained schools and academies.
9
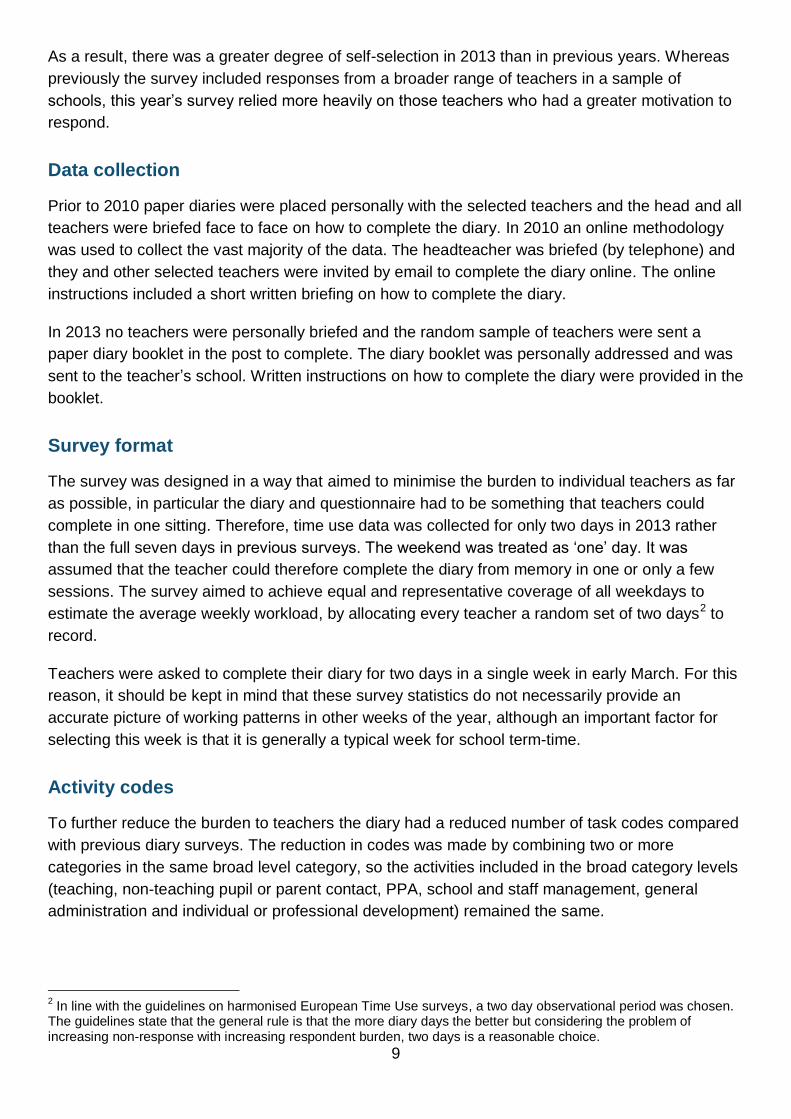
As a result, there was a greater degree of self-selection in 2013 than in previous years. Whereas
previously the survey included responses from a broader range of teachers in a sample of
schools, this year’s survey relied more heavily on those teachers who had a greater motivation to
respond.
Data collection
Prior to 2010 paper diaries were placed personally with the selected teachers and the head and all
teachers were briefed face to face on how to complete the diary. In 2010 an online methodology
was used to collect the vast majority of the data. The headteacher was briefed (by telephone) and
they and other selected teachers were invited by email to complete the diary online. The online
instructions included a short written briefing on how to complete the diary.
In 2013 no teachers were personally briefed and the random sample of teachers were sent a
paper diary booklet in the post to complete. The diary booklet was personally addressed and was
sent to the teacher’s school. Written instructions on how to complete the diary were provided in the
booklet.
Survey format
The survey was designed in a way that aimed to minimise the burden to individual teachers as far
as possible, in particular the diary and questionnaire had to be something that teachers could
complete in one sitting. Therefore, time use data was collected for only two days in 2013 rather
than the full seven days in previous surveys. The weekend was treated as ‘one’ day. It was
assumed that the teacher could therefore complete the diary from memory in one or only a few
sessions. The survey aimed to achieve equal and representative coverage of all weekdays to
estimate the average weekly workload, by allocating every teacher a random set of two days2 to
record.
Teachers were asked to complete their diary for two days in a single week in early March. For this
reason, it should be kept in mind that these survey statistics do not necessarily provide an
accurate picture of working patterns in other weeks of the year, although an important factor for
selecting this week is that it is generally a typical week for school term-time.
Activity codes
To further reduce the burden to teachers the diary had a reduced number of task codes compared
with previous diary surveys. The reduction in codes was made by combining two or more
categories in the same broad level category, so the activities included in the broad category levels
(teaching, non-teaching pupil or parent contact, PPA, school and staff management, general
administration and individual or professional development) remained the same.
2 In line with the guidelines on harmonised European Time Use surveys, a two day observational period was chosen.
The guidelines state that the general rule is that the more diary days the better but considering the problem of increasing non-response with increasing respondent burden, two days is a reasonable choice.

10
The intention was to simplify completion, collect streamlined information about how teachers
spend their time and gather their views on matters that are pertinent to government policies.
Response rate
Across the workforce, 6,753 teachers were sampled, and of these, 1,004 completed a usable diary
survey (15%). The response varied by both school and teacher type as shown in Figure 1. A
detailed description of the methodology can be found in the technical report (Annex B).
Figure 1 Response rate by type of school and teacher
School/teacher type Diaries sent Returned diaries Response rate
Academy: headteachers 278 24 9%
Academy: all other teachers 1,250 137 11%
Academy: total 1,528 161 11%
Primary: headteachers 250 36 14%
Primary: all other teachers 1,325 204 15%
Primary: total 1,575 240 15%
Secondary: headteachers 500 79 16%
Secondary: all other teachers 2,650 441 17%
Secondary: total 3,150 520 17%
Special: headteachers 25 4 16%
Special: all other teachers 475 79 17%
Special: total 500 83 17%
All teachers total 6,753 1,004 15%
The survey achieved its minimum response target of 15%, which is comparable to self-completed
surveys in general.
It is worth noting that, in general, the completion rate of non-compulsory research in maintained
schools has fallen over time3.
3 Sturgis, Smith and Hughes (2006) A study of suitable methods for raising response rates in schools surveys. DfES
11
Teacher workload
Note, due to significant changes in the survey methodology in 2013, data from this year is not
comparable with that from previous years’ surveys.
Figures 2, 3, 4 and 5 show key measures in 2013. Findings are presented for sub-groups where
base sizes are 50 or more. If a subgroup with fewer than 50 respondents is referred to, it is
accompanied by a note to indicate a low base size.
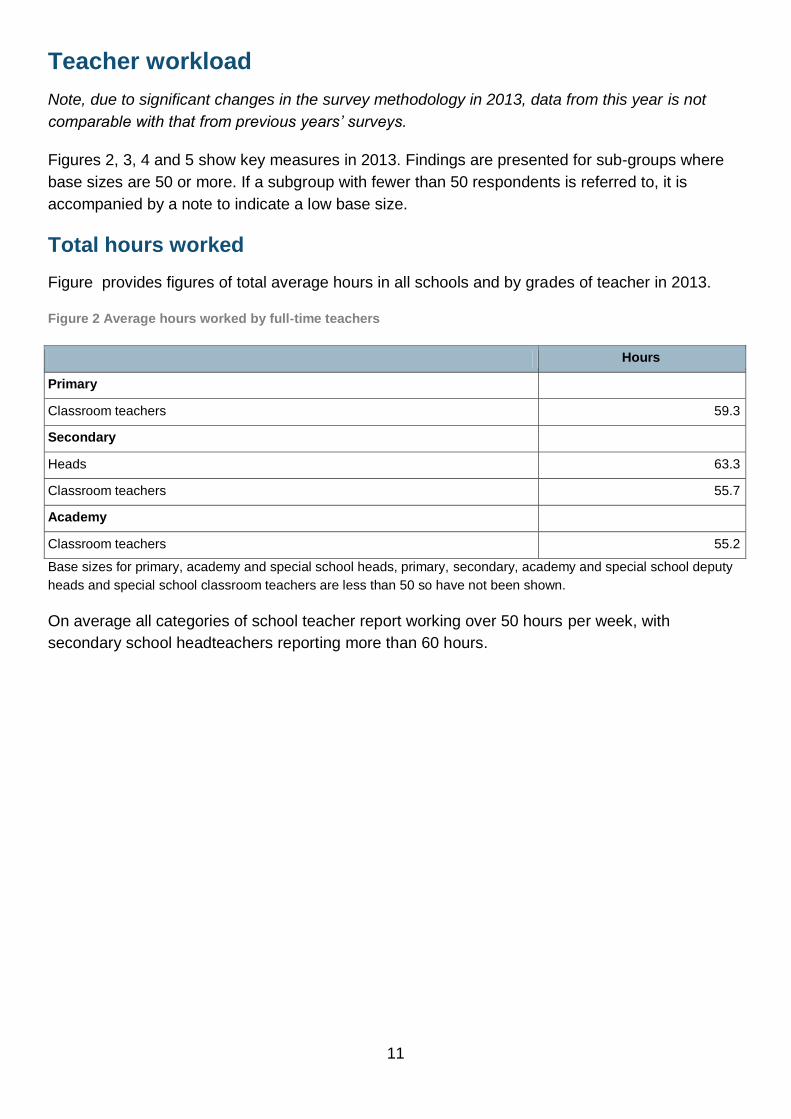
Total hours worked
Figure provides figures of total average hours in all schools and by grades of teacher in 2013.
Figure 2 Average hours worked by full-time teachers
Hours
Primary
Classroom teachers 59.3
Secondary
Heads 63.3
Classroom teachers 55.7
Academy
Classroom teachers 55.2
Base sizes for primary, academy and special school heads, primary, secondary, academy and special school deputy
heads and special school classroom teachers are less than 50 so have not been shown.
On average all categories of school teacher report working over 50 hours per week, with
secondary school headteachers reporting more than 60 hours.

12
Teaching hours
Figure shows the average number of teaching hours by type of teacher in 2013.
Figure 3 Average total teaching hours worked by full-time teachers
Hours
Primary
Classroom teachers 19.0
Secondary
Heads 2.8
Classroom teachers 19.6
Academy
Classroom teachers 20.2
Base sizes for primary, academy and special school heads, primary, secondary, academy and special school deputy
heads and special school classroom teachers are less than 50 so have not been shown.
Classroom teachers in most school types report teaching 19 to 20 hours a week. Headteachers
also report some teaching in their workload.
Figure shows teaching time as a percentage of total working time for 2013.
Figure 4 Percentage of teaching hours as a proportion of total working hours for full-time teachers
%
Primary
Classroom teachers 32.0
Secondary
Heads 4.4
Classroom teachers 35.2
Academy
Classroom teachers 36.6
Base sizes for primary, academy and special school heads, primary, secondary, academy and special school deputy heads and special school classroom teachers are less than 50 so have not been shown.

13
Before school day, evening and weekend working
It is possible to estimate the number of hours full-time teachers work ‘out of hours’ (before 8am,
after 6pm and on weekends4) from the survey data.
Figure 5 shows the proportion of teachers’ total hours worked outside normal working hours in
2013.
The activities most commonly done by heads outside of the school day related to school and staff
management (46% - 57%). Classroom teachers on the other hand spent most of their out of
school hours working time on planning, preparation and assessment (72% - 84%).
Figure 5 Percentage of hours worked in the evening, before the school day and on weekends as percentage of total hours worked per week, full-time teachers only
%
Primary
Classroom teachers 23.8
Secondary
Heads 21.5
Deputy heads (b) 19.1
Classroom teachers 21.4
Academy
Classroom teachers 19.7
Base sizes for primary, academy and special school heads, primary, secondary, academy and special school deputy
heads and special school classroom teachers are less than 50 so have not been shown.
4 The definition of before school activities prior to 2013 was based on the headteachers’ questionnaire which asked
about the structure of the school day. Before school activities were all that occurred before the first school activity (e.g. registration). There was no headteachers’ questionnaire in 2013 so ‘out of hours’ activities are defined as occurring wholly before 8am, after 6pm or at the weekend.

14
Survey findings
Analysis of hours spent in total and on each activity
Total hours worked overall
The total hours worked per week on average by teachers in different types of school and role is
shown in Figure below.
The average hours worked increases with seniority in both primary and secondary schools. On
average all categories of school teacher report working over 50 hours per week, with secondary
school headteachers reporting more than 60 hours.
Figure 6 Total hours worked by type of school and role
Total hours worked per week,
full-time only
Primary
Classroom teachers 59.3
Secondary
Heads 63.3
Classroom teachers 55.7
Academy
Classroom teachers 55.2
Base sizes for primary, academy and special school heads, primary, secondary, academy and special school deputy
heads and special school classroom teachers are less than 50 so have not been shown.
This section presents a breakdown of total hours into activity groupings which include: teaching;
planning, preparation and assessment (PPA); non-teaching pupil or parent contact; school or staff
management; general administrative support and individual or professional activity.
Throughout this section findings are presented where the base size is 50 or more. Detailed tables
are in Annex A.
15
Teaching hours
On average, classroom teachers in primary schools spent around 19 hours a week teaching. The
vast majority of this time was regular timetabled teaching (17.8 hours). The remaining teaching
time was spent on non-regular teaching such as cover for an absent colleague within the
timetabled day (not including cover supervision), teaching outside timetabled hours, and assisting
in other lessons or on educational visits.
The pattern was similar for classroom teachers in secondary and academy schools. In secondary
schools classroom teachers spent 19.6 hours teaching where there was no difference by gender
of age, while classroom teachers in academy schools spent 20.2 hours teaching. Teachers in both
of these school types spent just over an hour a week on non-regular teaching activity.
Headteachers in secondary schools spent a small proportion (2.8 hours) of their week teaching,
and like classroom teachers the majority of it was regular timetabled teaching (2.2 hours).
Planning, preparation and assessment (PPA)
PPA as a grouped activity was as common for classroom teachers in primary, secondary and
academy schools as teaching. Specific activities included planning and preparing for lessons or
tests, marking or assessing pupils and writing reports on pupil progress.
One of the two most common PPA activities was lesson planning or preparing for tests. Primary
classroom teachers spent an average of 10.6 hours per week on this activity, while secondary
teachers spent 8.5 hours on it. Classroom teachers in academy schools spent 8.2 hours on lesson
planning or preparing for tests.
The second of the two common PPA activities was assessing and marking pupils’ work (including
more general assessment activities) and writing reports. In primary schools, classroom teachers
spent an average of around 9.7 hours a week on these activities. In secondary schools, classroom
teachers spent 9.4 hours on this activity, and in academy schools it was 8.7 hours.
Headteachers in secondary schools spent 3 hours a week on any PPA activities.
Non-teaching contact with pupils or parents
A number of different activities combined into the non-teaching pupil or parent contact category,
including pupil supervision, covering for absent colleagues, coaching sport or drama, disciplining
or praising pupils, registration and any contact with parents and/or families.
In primary schools, classroom teachers spent an average of 5.9 hours a week on any of these
activities, compared to 7.8 hours for secondary school classroom teachers and 6.1 hours for
classroom teachers in academy schools. It was higher for headteachers in secondary schools at
9.9 hours.

16
The most common tasks for classroom teachers was supervising pupils before, after or during the
school day (1.9 hours for classroom teachers in primary and secondary schools and 1.8 hours in
academy schools) and contact with parents (2.0 hours, 1.4 hours and 0.8 hours per week
respectively). Headteachers in secondary schools spent 4.9 hours per week on supervising pupils
and 2.6 hours on contact with parents or families.
School or staff management
School or staff management can be divided into internal activities (such as meetings, appraising,
mentoring, other contact with staff, and developing policies) and external activities (for example,
contact with educational bodies, local community and other local education providers). As would
be expected, the more senior the staff the more time they spent on school and staff management.
In secondary schools, headteachers spent 38.5 hours per week on these activities. They spent at
least 2 hours per week on average on each of the following activities: staff meetings (9.6 hours),
school policy development (7.7 hours), contact with community or educational bodies (7.7 hours),
contact with staff that was not about specific pupils or planning (2.8 hours) and other contact with
staff (5.9 hours).
Classroom teachers spent around 4 hours a week on school or staff management. No one type of
activity took more than 2 hours a week.
General administrative support
This grouped activity included keeping records (including those on pupil performance), organising
resources and other administrative duties such as preparing displays, setting up the classroom
and photocopying.
Classroom teachers in primary schools spent 4.3 hours on general administration (7% of
workload) which included an hour keeping records, 2.7 hours on organising resources and half an
hour on other activities. Overall, classroom teachers in secondary schools spent 2.3 hours on
general administration (4% of workload) which included an hour on keeping records. Classroom
teachers in academy schools spent 3 hours on administration (6% of workload), including 1 hour
keeping records and 1.5 hours organising resources.
Around half of general administrative activity undertaken by headteachers in secondary schools
was non-specific (0.7 hours out of 1.5 hours in total).
17
Individual or professional activity
Individual or professional activity includes training and development activity including INSET5, peer
observation or being mentored, studying and background reading, as well as time spent keeping
the workload diary itself.
In primary schools, classroom teachers spent 3 hours on individual or professional activity (5% of
workload) which included 2.2 hours of training and development. Classroom teachers in
secondary and academy school spent less time on individual or professional development overall
(1.7 hours and 1.8 hours respectively, 3% - 5% of workload).
Headteachers in secondary school spent 6.6 hours per week on individual or professional activity
(11% of workload), split between training and development (3.4 hours) and other non-specific
activities (3.3 hours).
Attitude to job and workload
The diary booklet contained additional questions to measure teachers’ attitudes to their job and
workload. A section which included these types of questions had been asked in previous years of
the survey but the questions asked in 2013 were all new. Throughout this section these measures
are not broken down by school type.
Teachers’ perceptions of time spent on unnecessary or bureaucratic tasks
All teachers were asked how much of their time they thought they spent on tasks they considered
to be unnecessary or bureaucratic. Results are shown in Figure 7.
Eight in ten deputy heads and classroom teachers felt that only a little or some of their time was
spent on unnecessary and bureaucratic tasks. The overall proportion of headteachers that said
that a little or some of their time was spent on unnecessary and bureaucratic tasks was slightly
higher. Small proportions of headteachers and deputy heads/classroom teachers felt that all or
most of their time was spent on unnecessary or bureaucratic tasks, while around one in ten in
each group did not know or did not give an answer.
5 In-service education and training.

18
Figure 7 Total Amount of time spent on tasks considered to be unnecessary or bureaucratic
Headteachers Deputy heads /
classroom
teachers
% %
All of the time 0.1 0.3
Most of the time 2.5 6.4
Some of the time 56.9 55.2
A little of the time 28.3 25.8
I don't know 1.7 .8
Gave no Answer 10.5 11.5
Base 142 862
Teachers were asked whether they thought the amount of time they spent on unnecessary and
unnecessarily bureaucratic tasks had changed over the last 12 months. Thirty-six per cent of
headteachers and 45% of deputy heads and classroom teachers felt that it had increased while
36% and 42% respectively thought it had stayed the same. Small proportions (9% - 5%
respectively) thought it had decreased (Figure 8).
Figure 8 Change in amount of time spent on tasks considered to be unnecessary or bureaucratic
Headteachers Deputy heads /
classroom
teachers
% %
Yes - it has increased 35.8 44.6
Yes - it has reduced 9.3 4.8
No - it has stayed about the same 36.0 41.7
I don't know 3.0 3.2
No Answer 15.9 5.7
Base 142 862

19
Teachers who thought the time they spent on unnecessary and bureaucratic tasks had increased
were asked to further explain why they thought that.
Among headteachers, the most commonly mentioned reason was Ofsted changes (20%) followed
by preparation for an Ofsted inspection (17%). Reasons mentioned at slightly lower levels were a
non-specific increase in workload (16%), Departmental policy changes (13%) and record keeping
(11%).
The most commonly mentioned reason by deputy heads and classroom teachers was preparation
for an Ofsted inspection (16%) followed by an increase in forms and paperwork (15%). Reasons
mentioned at slightly lower levels were assessments (12%), a change in role or school (11%) and
data collection and reporting (10%), and evidence gathering (10%) (see full tables in Annex A).
Sixty teachers in the survey felt that the time they spent on unnecessary and bureaucratic tasks
had decreased, with the predominant reason being a change in role or a change of school (37%).
Examples of unnecessary and bureaucratic tasks
The 2013 survey also asked a series of questions which the respondents were able to answer in
their own words, rather than respond to predetermined categories. Answers were coded according
to a list of frequent responses in order to be quantified. It is important to bear in mind that the
answer codes had to be quite broad as specific responses were mentioned at too low a level to
sensibly quantify. Teachers were asked for:
examples of paper work that can be unnecessary and bureaucratic
examples of marking or recording pupil progress that can be unnecessary and bureaucratic
examples of data (analysing/reporting/evidence gathering) that can be unnecessary and
bureaucratic
examples of the level of detail and format of planning and preparation in schools that can
be unnecessary and bureaucratic
examples of activities relating to SATS and exams that can be unnecessary and
bureaucratic
examples of other activities that can be unnecessary and bureaucratic
one requirement they would ask DfE to remove
The most frequently mentioned responses are summarised in this section and full tables are in
Annex A.
The examples of unnecessary and bureaucratic paper work mentioned most frequently were the
duplication of data, reports and information (14% deputies/classroom teachers, 10%
headteachers), too much paper work, form filling and round robins (13%). Furthermore, deputy
20
heads and classroom teachers mentioned production of detailed lesson plans relatively frequently
(11%).
The two most frequently mentioned examples of unnecessary and bureaucratic marking or
recording pupil progress were along a similar theme; that marking has to be too detailed (15%
deputies/classroom teachers, 14% headteachers) and that it is too long winded and takes too
much time (13% deputies/classroom teachers). Another frequent concern was the duplication of
paperwork and marking (11% deputies/classroom teachers).
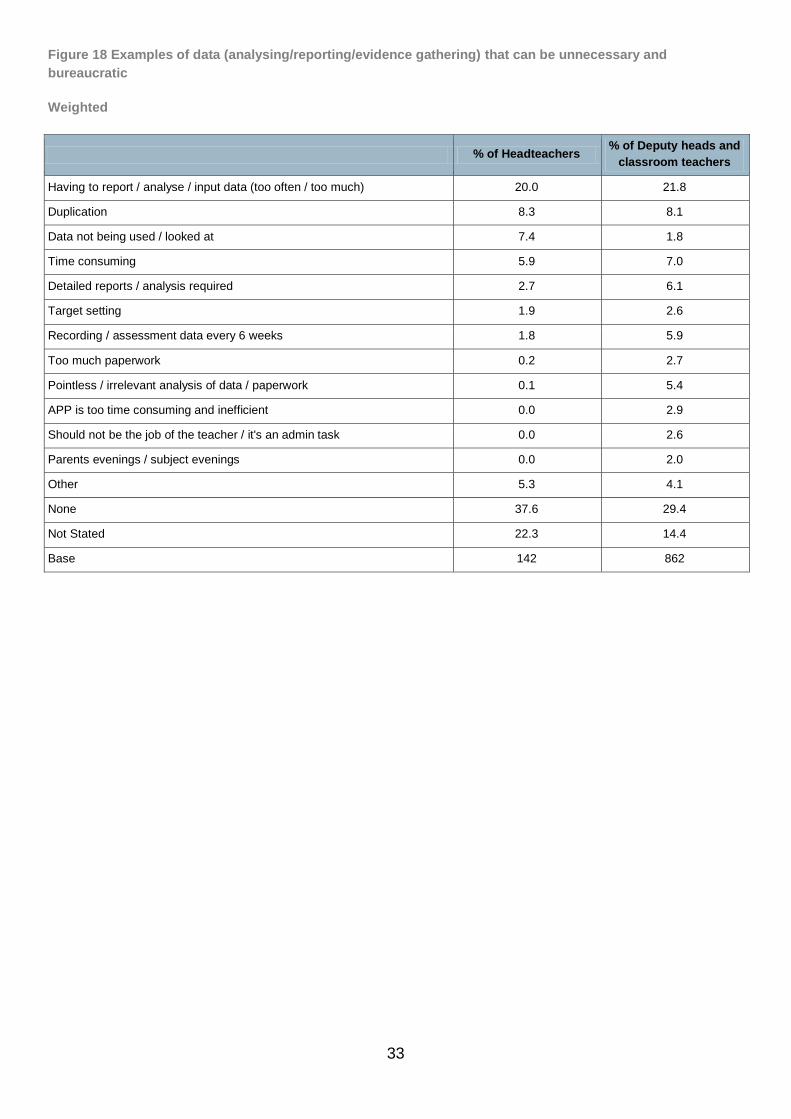
One example of unnecessary and bureaucratic data analysing, reporting and evidence
gathering was mentioned at a much higher level than all others, which was having to report,
analyse or input data too often or too much (22% deputies/classroom teachers, 20%
headteachers). Duplication (8% of both groups) and that it was time consuming (7% deputies/
classroom teachers, 6% headteachers) were comments made most frequently out of the rest.
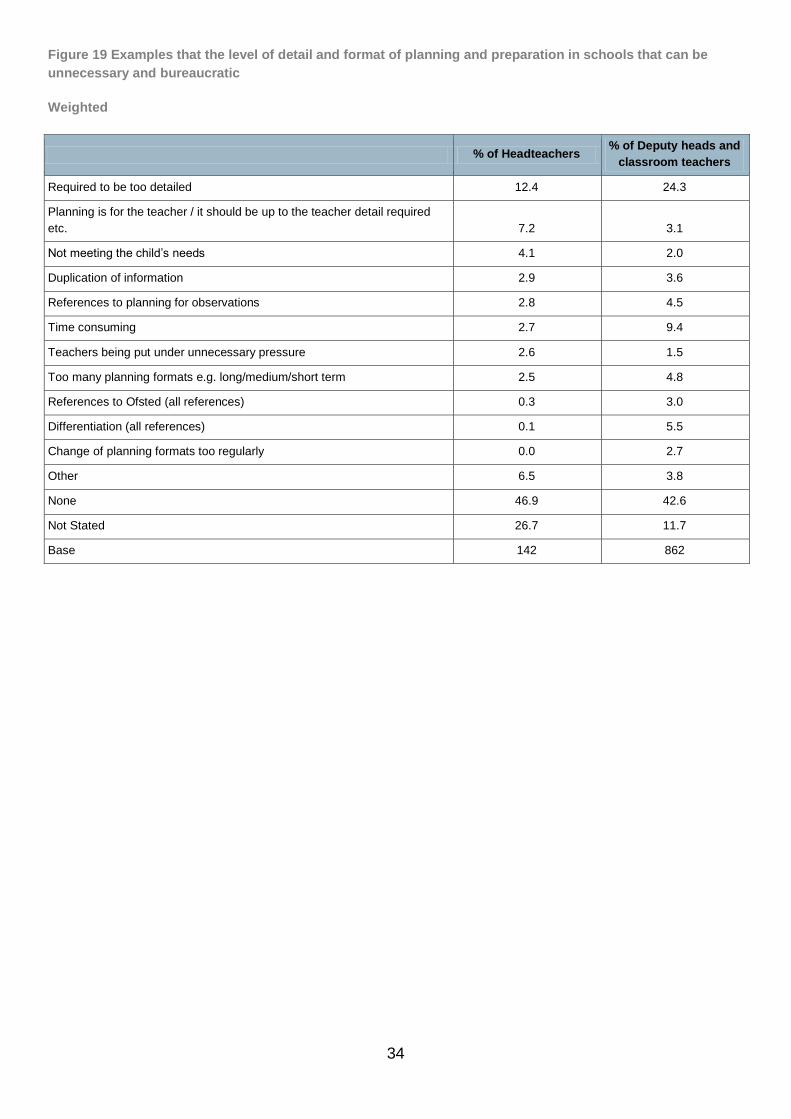
Again one response to the level of unnecessary and bureaucratic planning and preparation in
schools dominated, that was that they were required to be too detailed (24% deputies/classroom
teachers, 12% headteachers). That planning and preparation was time consuming was mentioned
by 9% deputy heads and classroom teachers, while 5% each mentioned differentiation and that
there were too many planning formats. Seven per cent of headteachers said that planning is for
the teacher and it should be up to them how long they spend on it.
When asked for examples of unnecessary and bureaucratic activities relating to SATS6 and
exams one in ten deputy heads and classroom teachers mentioned marking practice papers
(11%). Seven per cent said that these types of activities were time consuming (7%), while 6%
made a reference to assessments. Eleven per cent of headteachers mentioned preparing for
SATS/exams, and of the pressure to track and monitor results.
There was one final question along the same lines which asked teachers to give examples of
other activities that can be unnecessary and bureaucratic. The only response mentioned by more
than one in twenty deputy heads and classroom teachers but not mentioned in response to the
previous questions was meetings and taking minutes of meetings (8%). One in ten headteachers
mentioned adapting to changing policies and/or guidelines from the Government.
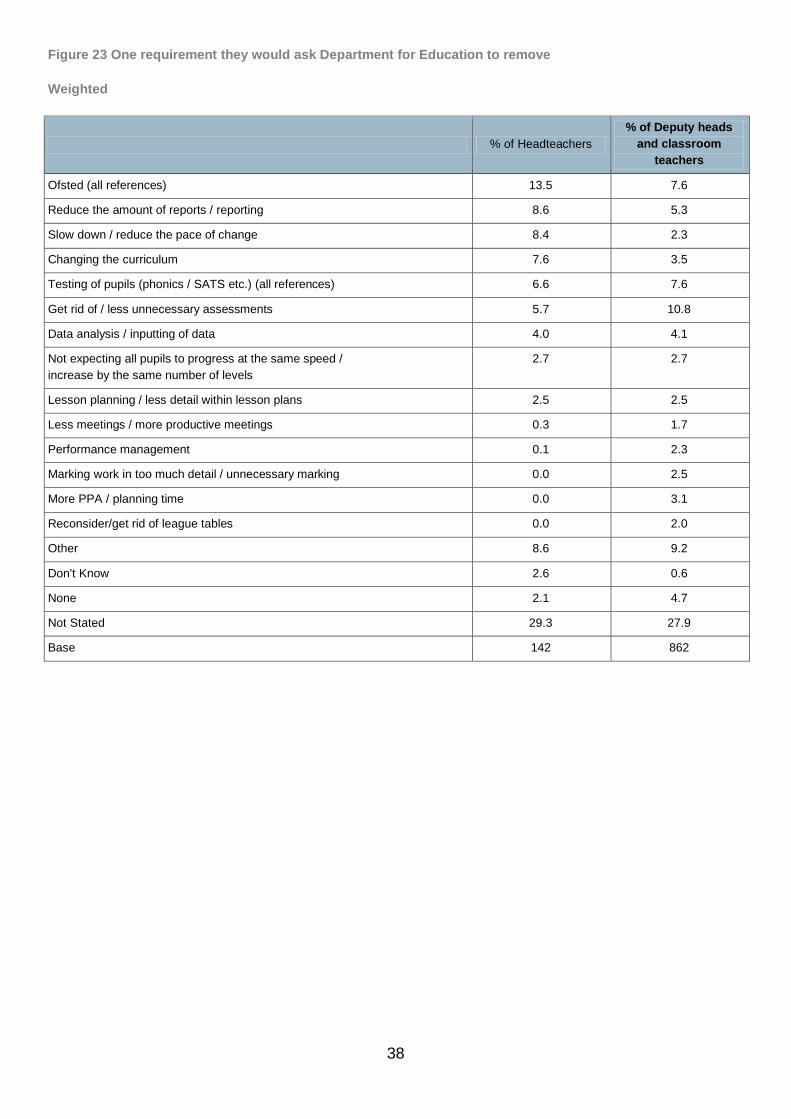
Finally, teachers were asked what one requirement they would ask the Department to remove.
Eleven per cent of deputy heads and classroom teachers would get rid of unnecessary
assessments and, in a similar vein, 8% would remove testing of pupils. Eight per cent would
remove Ofsted, while 5% would reduce the amount of reports and reporting. The most frequently
mentioned requirement to be removed by headteachers was Ofsted (14%).
6 National curriculum tests.

21
What would improve the quality of teaching and pupil learning
Teachers were presented with a list of activities and were asked what three would improve the
quality of teaching and pupil learning if they were able to spend more time on it. Figure 9 shows
the results.
Slightly more than a third of headteachers (36%) included observing colleagues teaching in their
top three, and a similar proportion said observing good practice in other schools (32%). Again,
approximately a third selected mentoring or being mentored (33%), while slightly fewer than this
chose discussing work with individual pupils (28%) and professional learning and development
(22%).
Three in ten deputy heads and classroom teachers (30%) included discussing work with individual
pupils in their top three. Just over a quarter selected one to one and small group teaching (28%),
while a quarter chose collaborative planning with colleagues (26%) and exploring and selecting
resources (25%).
Consistent with the activities thought to be unnecessary and bureaucratic, teachers in both groups
selected marking pupil work and reviewing pupil data at very low levels.
Figure 9 What would improve the quality of teaching and pupil learning?
28
10
15
5
32
20
1
36
9
3
22
15
33
6
9
19
30
28
26
25
21
16
17
14
11
9
8
7
6
6
2
24
Discussing work with individual pupils
One-to-one and small group teaching
Collaborative planning with colleagues
Exploring and selecting resources
Observing good practice in other schools
Long term curriculum review
Planning my own lessons
Observing colleagues teaching
Planning for differentiation
Time instructing support staff
Professional learning and development
Moderation of assessments with colleagues
Mentoring or being mentored or coached
Marking pupils work
Reviewing pupil data
No Answer
Head teachers
Deputies/classroom
22
Other tasks not specifically presented to teachers but mentioned spontaneously by more than one
in ten deputy heads and classroom teachers in terms of what would improve the quality of
teaching and pupil learning, were more planning and preparation time (16%) and sourcing or
developing new resources for innovative teaching (12%). Giving feedback to pupils and more one
to one time (12%) was also mentioned spontaneously by more than one in ten even though it was
similar to a statement that had been shown to teachers in the earlier question.
Headteachers were most likely to spontaneously mention collaborating or planning with support
staff (12%), more training opportunities (12%) or more time to do research (10%).
23
References
European Communities (2004) Guidelines on harmonised European Time Use surveys.
Luxembourg: Office for Official Publications of the European Communities. Available: Guidelines
on harmonised European Time Use surveys report
Smithers, A. and Robinson, P. (2003), ‘Factors Affecting Teachers’ Decisions to Leave the
Profession’, Department for Education and Skills Research Report 430.
Sturgis, Smith and Hughes (2006) A study of suitable methods for raising response rates in
schools surveys. Department for Education and Skills.

24
Annex A: Tables

25
Figure 10 Average hours worked by full-time teachers, on grouped activities and in total
Weighted
Heads (a) Deputy/Assistant Heads Classroom Teachers
Primary Secondary Academy Primary Secondary Academy Special Primary Secondary Academy Special
Hours % Hours % Hours % Hours % Hours % Hours % Hours % Hours % Hours % Hours % Hours %
Teaching 6.6 11.0 2.8 4.4 1.8 2.5 16.8 26.3 13.9 22.6 6.4 11.8 7.8 15.0 19.0 32.0 19.6 35.2 20.2 36.6 16.8 33.4
Non-teaching
pupil/parent contact
9.7 16.1 9.9 15.7 12.5 17.
6
6.9 10.8 11.4 18.6 10.7 19.6 7.5 14.5 5.9 9.9 7.8 14.1 6.1 11.0 6.9 13.8
Planning, preparation
and assessment
8.0 13.3 3.0 4.7 1.0 1.5 21.2 33.2 12.9 21.0 12.9 23.7 6.0 11.7 22.6 38.2 18.9 34.0 18.7 33.9 13.3 26.5
School/staff
management
29.3 48.6 38.5 60.8 43.8 61.
9
14.6 22.8 16.8 27.4 20.5 37.7 20.4 39.5 4.0 6.8 4.6 8.2 4.0 7.3 4.8 9.5
General administrative
support
3.6 6.0 1.5 2.4 1.0 1.5 2.7 4.2 4.1 6.7 1.0 1.8 4.1 8.0 4.3 7.3 2.3 4.2 3.0 5.5 4.8 9.6
Individual/professional
(b)
2.7 4.5 6.6 10.5 10.1 14.
3
1.0 1.6 1.7 2.8 2.8 5.2 2.3 4.4 3.0 5.1 1.7 3.0 1.8 3.3 3.1 6.1
All known working
activities
60.0 99.6 62.3 98.5 70.2 99.
2
63.3 99.0 60.8 99.1 54.3 99.8 48.1 93.1 58.9 99.2 54.9 98.5 53.9 97.6 49.6 98.8
Other working activities
(c)
0.3 0.4 0.9 1.5 0.5 0.8 0.7 1.0 0.6 0.9 0.1 0.2 3.5 6.9 0.5 0.8 0.8 1.5 1.3 2.4 0.6 1.2
All working activities 60.2 100 63.3 100 70.8 10
0
63.9 100 61.3 100 54.3 100 51.6 100 59.3 100 55.7 100 55.2 100 50.2 100
Base 33 79 23 18 38 13 18 129 338 108 42
(a) Excluding special schools where sample numbers (4) were too low to analyse (b) Activities include up to one hour for completing the diary survey (c) Other activities comprise authorised absence in school hours Results have been greyed out where base sizes are less than 30 and results based on fewer than 50 (primary heads, all deputy heads, and special school classroom teachers) should be treated with caution. Total hours worked and individual/professional activity include, as in previous years, completing the diary.
26
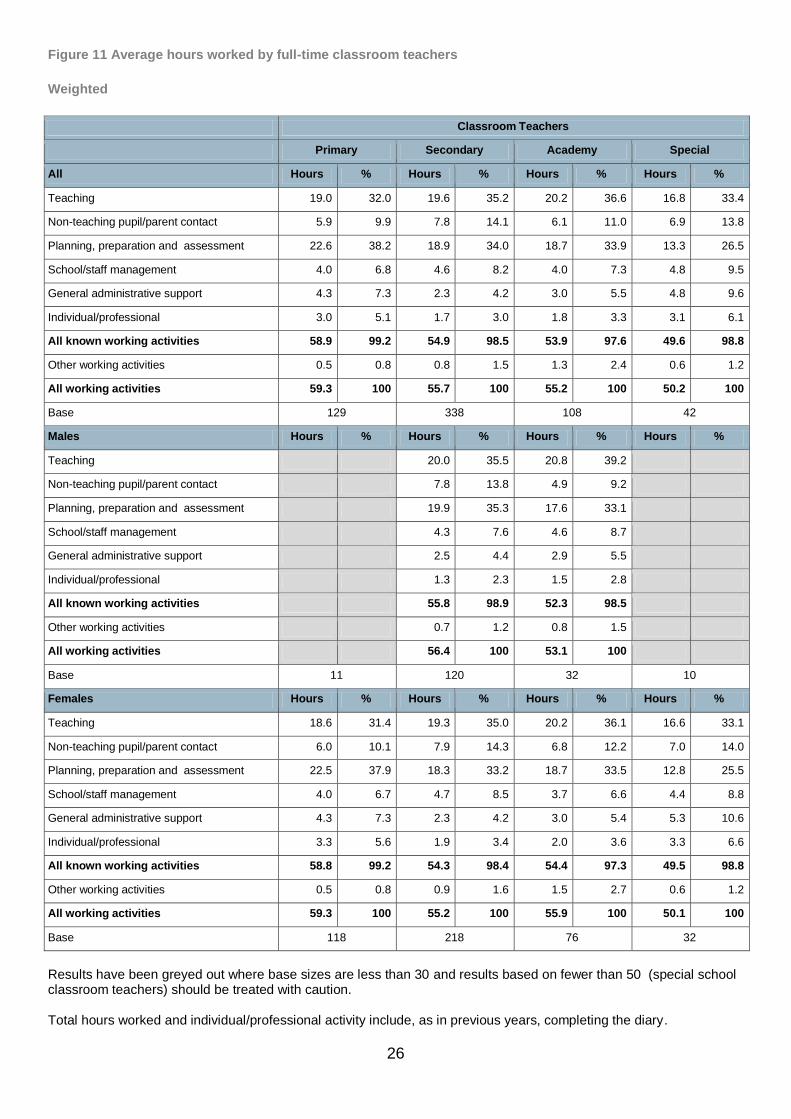
Figure 11 Average hours worked by full-time classroom teachers
Weighted
Classroom Teachers
Primary Secondary Academy Special
All Hours % Hours % Hours % Hours %
Teaching 19.0 32.0 19.6 35.2 20.2 36.6 16.8 33.4
Non-teaching pupil/parent contact 5.9 9.9 7.8 14.1 6.1 11.0 6.9 13.8
Planning, preparation and assessment 22.6 38.2 18.9 34.0 18.7 33.9 13.3 26.5
School/staff management 4.0 6.8 4.6 8.2 4.0 7.3 4.8 9.5
General administrative support 4.3 7.3 2.3 4.2 3.0 5.5 4.8 9.6
Individual/professional 3.0 5.1 1.7 3.0 1.8 3.3 3.1 6.1
All known working activities 58.9 99.2 54.9 98.5 53.9 97.6 49.6 98.8
Other working activities 0.5 0.8 0.8 1.5 1.3 2.4 0.6 1.2
All working activities 59.3 100 55.7 100 55.2 100 50.2 100
Base 129 338 108 42
Males Hours % Hours % Hours % Hours %
Teaching 20.0 35.5 20.8 39.2
Non-teaching pupil/parent contact 7.8 13.8 4.9 9.2
Planning, preparation and assessment 19.9 35.3 17.6 33.1
School/staff management 4.3 7.6 4.6 8.7
General administrative support 2.5 4.4 2.9 5.5
Individual/professional 1.3 2.3 1.5 2.8
All known working activities 55.8 98.9 52.3 98.5
Other working activities 0.7 1.2 0.8 1.5
All working activities 56.4 100 53.1 100
Base 11 120 32 10
Females Hours % Hours % Hours % Hours %
Teaching 18.6 31.4 19.3 35.0 20.2 36.1 16.6 33.1
Non-teaching pupil/parent contact 6.0 10.1 7.9 14.3 6.8 12.2 7.0 14.0
Planning, preparation and assessment 22.5 37.9 18.3 33.2 18.7 33.5 12.8 25.5
School/staff management 4.0 6.7 4.7 8.5 3.7 6.6 4.4 8.8
General administrative support 4.3 7.3 2.3 4.2 3.0 5.4 5.3 10.6
Individual/professional 3.3 5.6 1.9 3.4 2.0 3.6 3.3 6.6
All known working activities 58.8 99.2 54.3 98.4 54.4 97.3 49.5 98.8
Other working activities 0.5 0.8 0.9 1.6 1.5 2.7 0.6 1.2
All working activities 59.3 100 55.2 100 55.9 100 50.1 100
Base 118 218 76 32
Results have been greyed out where base sizes are less than 30 and results based on fewer than 50 (special school classroom teachers) should be treated with caution. Total hours worked and individual/professional activity include, as in previous years, completing the diary.

27
Figure 12 Average total hours worked by full-time classroom teachers by demographics
Weighted
Classroom Teachers
Primary Secondary Academy Special
Base
Total
hours
worked
Base
Total
hours
worked
Base
Total
hours
worked
Base
Total
hours
worked
All 129 59.3 338 55.7 108 55.2 42 50.2
Age Under 25 13 14 2 1
25-34 48 59.4 127 55.1 45 57.6 10
35-44 29 74 55.6 25 6
45-54 23 86 55.8 24 15
55+ 16 37 57.6 11 10
Region Greater London 24 42 57.8 17 4
Metropolitan County 16 65 55.5 31 54.6 10
Non Metropolitan County 56 59.0 150 57.1 26 15
Unitary Authority 33 61.5 81 52.8 34 56.5 13
Results have been greyed out where base sizes are less than 30 and results based on fewer than 50 should be
treated with caution.

28
Figure 13 Average hours spent on individual activities by full-time teacher - Weighted
Heads Classroom Teachers
Primary Secondary Academy Primary Secondary Academy Special
Hr % Hr % Hr % Hr % Hr % Hr % Hr %
Teaching 6.6 11.0 2.8 4.4 19.0 32.0 19.6 35.2 20.2 36.6 16.8 33.4
Regular timetabled teaching 4.6 7.7 2.2 3.5 17.8 30.1 18.2 32.8 19.1 34.6 15.7 31.2
Non-regular teaching 0.6 1.0 0.1 0.2 0.4 0.7 0.2 0.4 0.2 0.4 0.2 0.5
Other teaching activity 1.4 2.3 0.4 0.7 0.7 1.2 1.1 2.0 0.9 1.6 0.8 1.6
Non-teaching pupil/parent contact 9.7 16.1 9.9 15.7 5.9 9.9 7.8 14.1 6.1 11.0 6.9 13.8
Supervising pupils at any time 5.4 9.0 4.9 7.8 1.9 3.1 1.9 3.3 1.8 3.3 2.5 5.0
Covering for absent colleague 0.1 0.2 0.2 0.4 0.1 0.1 0.2 0.3 0.2 0.4 0.0 0.1
Coaching sport, rehearsing drama/music 1.1 1.9 0.0 0.1 0.6 1.0 1.1 2.0 0.7 1.2 0.9 1.7
Disciplining or praising pupils 0.2 0.4 0.8 1.3 0.2 0.3 0.7 1.3 0.6 1.1 0.6 1.2
Registration, general classroom
management or pastoral care
0.4 0.7 0.1 0.1 1.0 1.7 1.5 2.6 1.3 2.4 1.4 2.9
Any contact with parents and families 2.0 3.4 2.6 4.1 2.0 3.4 1.4 2.6 0.8 1.5 1.1 2.2
Other non-teaching activities 0.3 0.6 1.3 2.0 0.2 0.3 1.1 1.9 0.6 1.0 0.4 0.8
Planning, preparation and assessment 8.0 13.3 3.0 4.7 22.6 38.2 18.9 34.0 18.7 33.9 13.3 26.5
Planning/preparing lesson, test,
assessment
3.6 5.9 1.0 1.6 10.6 17.8 8.5 15.2 8.2 14.8 6.6 13.1
Assessing/marking pupil work, reports 3.6 6.0 1.5 2.4 9.7 16.3 9.4 16.8 8.7 15.7 4.5 9.0
Other non-contact activities 0.8 1.4 0.4 0.7 2.4 4.0 1.1 1.9 1.9 3.4 2.2 4.5
School/staff management 29.3 48.6 38.5 60.8 4.0 6.8 4.6 8.2 4.0 7.3 4.8 9.5
General staff/management meeting 5.0 8.3 9.6 15.2 1.4 2.4 2.0 3.6 1.7 3.1 2.1 4.2
Appraising, monitoring, coaching,
mentoring, training other teaching staff
1.9 3.1 2.8 4.4 0.6 1.0 0.7 1.2 0.9 1.6 0.5 1.0
Other contact/interaction with staff 3.9 6.5 5.9 9.2 0.6 1.0 0.7 1.3 0.6 1.1 0.8 1.7
School policy and financial planning 7.3 12.2 7.7 12.1 0.2 0.4 0.2 0.3 0.1 0.1 0.1 0.2
Contact with someone outside of school 6.9 11.4 7.7 12.1 0.5 0.9 0.3 0.6 0.3 0.5 0.9 1.7
Other management related activities 4.2 7.1 4.9 7.8 0.7 1.1 0.7 1.2 0.5 0.8 0.3 0.7
General administrative support 3.6 6.0 1.5 2.4 4.3 7.3 2.3 4.2 3.0 5.5 4.8 9.6
Keeping records 2.1 3.5 0.6 0.9 1.0 1.7 1.0 1.8 1.0 1.8 1.5 3.0
Organising resources 1.1 1.8 0.2 0.4 2.7 4.6 0.8 1.5 1.5 2.6 2.7 5.5
Other kinds of administrative activities 0.4 0.7 0.7 1.2 0.5 0.9 0.5 0.9 0.6 1.0 0.5 1.1
Individual/professional 2.7 4.5 6.6 10.5 3.0 5.1 1.7 3.0 1.8 3.3 3.1 6.1
Training or development activity 2.0 3.3 3.4 5.3 2.2 3.8 1.2 2.1 1.2 2.2 1.7 3.5
Other individual/professional activity 0.8 1.3 3.3 5.2 0.8 1.3 0.5 0.8 0.6 1.1 1.3 2.6
All known working activities 60.0 99.6 62.3 98.5 58.9 99.2 54.9 98.5 53.9 97.6 49.6 98.8
Other working activities 0.3 0.4 0.9 1.5 0.5 0.8 0.8 1.5 1.3 2.4 0.6 1.2
All working activities 60.2 100 63.3 100 59.3 100 55.7 100 55.2 100 50.2 100
Base 33 79 23 129 338 108 42
Results have been greyed out where base sizes are less than 30 and results based on less than 50 (primary heads and special classroom teachers) should be treated with caution.

29
Figure 14 Percentage of total hours worked by full-time teachers at weekends, before school or after 6pm on
weekdays
Weighted
Heads Classroom Teachers
Primary Secondary Academy Primary Secondary Academy Special
All Hours % Hours % Hours % Hours % Hours % Hours % Hours %
At weekends 6.2 10.3 6.9 10.9 7.7 13.0 6.2 11.1 6.1 11.1 5.1 10.2
Before school/after 6pm 6.5 10.8 6.7 10.6 6.4 10.8 5.8 10.4 4.8 8.7 3.6 7.2
Total working hours 60.2 100 63.3 100 59.3 100 55.7 100 55.2 100 50.2 100
Base 33 79 23 129 338 108 42
Results have been greyed out where base sizes are less than 30 and results based on fewer than 50 (primary heads
special classroom teachers) should be treated with caution

30
Figure 15 Composition of hours worked at weekends, before school and after 6pm for full-time teachers
Weighted
% of Heads % of Classroom Teachers
Primary Secondary Academy Primary Secondary Academy Special
Hours % Hours % Hours % Hours % Hours % Hours % Hours %
Teaching 0.2 1.6 0 0.0 0.1 0.7 0.4 3.4 0 0.0 0 0.0
Non-teaching
pupil/parent contact 0.7 5.5 1.6 11.8 0.3 2.1 0.8 6.7 0.1 0.9 0.2 2.3
Planning, preparation
and assessment 4.5 35.4 1.8 13.2 11.6 82.3 9.3 78.2 9.1 83.5 6.3 72.4
School/staff
management 5.8 45.7 7.8 57.4 0.5 3.5 0.5 4.2 0.3 2.8 0.6 6.9
General administrative
support 1.1 8.7 0.5 3.7 0.9 6.4 0.4 3.4 0.5 4.6 0.7 8.0
Individual/professional 0.3 2.4 1.6 11.8 0.5 3.5 0.6 5.0 0.7 6.4 0.9 10.3
Other working activities 0 0.0 0.3 2.2 0.2 1.4 0 0.0 0.2 1.8 0 0.0
Total hours 12.7 100 13.6 100 14.1 100 11.9 100 10.9 100 8.7 100
Base 33 79 23 129 338 108 42
Results have been greyed out where base sizes are less than 30 and results based on fewer than 50 (primary heads
and special classroom teachers) should be treated with caution

31
Figure 16 Examples of paper work that can be unnecessary and bureaucratic
Weighted
% of Headteachers % of Deputy heads and
classroom teachers
Too much / constant paper work / form filling / round robins 10.7 13.4
Duplication of data/reports/information 10.4 14.3
Evidence gathering 8.3 3.0
Completing progress forms / reports 5.9 3.7
Providing Ofsted with information / reports etc. 5.3 1.5
Detailed lesson plans 4.0 11.8
Data collection and analysis 3.0 8.3
Recording evidence - every conservation with students/parents 2.8 1.9
Report writing e.g. end of year/performance management 2.4 6.3
Too many emails 2.4 2.4
Having to fill in questionnaires / surveys 2.3 0.9
Having to complete administration tasks 0.6 4.4
Chasing / recording absences / attendance / behaviour 0.2 2.4
Risk assessment 0.1 2.4
Assessment (all references) 0.0 8.7
Marking work 0.0 3.1
SEN 0.0 2.0
Target setting 0.0 1.2
Other 4.4 2.5
None 21.3 23.9
Not Stated 22.7 11.1
Base 142 862

32
Figure 17 Examples of marking or recording pupil progress that can be unnecessary and bureaucratic
Weighted
% of Headteachers % of Deputy heads and
classroom teachers
Marking has to be too detailed 13.9 15.1
Duplication of paperwork and marking 4.2 11.1
Marking work that doesn't need marking (classwork / notes etc.) 3.4 3.0
Evidence gathering 2.7 2.9
Too long winded / takes too much time 2.7 13.3
Inputting of data 2.6 3.6
APP (all mentions) 1.8 5.9
Difficulty recording progress of student due to ability (SEN) / lack of
progress / amount of hours teaching over a period 1.8 1.7
Not always helpful / relevant / necessary 1.6 4.5
Give a level / assessment / report pupil progress every / half term / term /
too often 0.1 8.4
Written report 0.1 0.8
Ambiguity about need to mark young children 0.0 6.6
Expected to mark / assess too often 0.0 2.1
Heavy (marking) workload (due to amount of classes / students) 0.0 3.0
Repeatedly setting more targets to obtain 0.0 3.7
Too much paperwork 0.0 1.9
Updating of SIMS (as well as other areas) 0.0 1.4
Other 3.4 6.2
Don't Know 0.0 0.1
None 46.8 24.7
Not Stated 17.7 11.1
Base 142 862
33
Figure 18 Examples of data (analysing/reporting/evidence gathering) that can be unnecessary and
bureaucratic
Weighted
% of Headteachers % of Deputy heads and
classroom teachers
Having to report / analyse / input data (too often / too much) 20.0 21.8
Duplication 8.3 8.1
Data not being used / looked at 7.4 1.8
Time consuming 5.9 7.0
Detailed reports / analysis required 2.7 6.1
Target setting 1.9 2.6
Recording / assessment data every 6 weeks 1.8 5.9
Too much paperwork 0.2 2.7
Pointless / irrelevant analysis of data / paperwork 0.1 5.4
APP is too time consuming and inefficient 0.0 2.9
Should not be the job of the teacher / it's an admin task 0.0 2.6
Parents evenings / subject evenings 0.0 2.0
Other 5.3 4.1
None 37.6 29.4
Not Stated 22.3 14.4
Base 142 862
34
Figure 19 Examples that the level of detail and format of planning and preparation in schools that can be
unnecessary and bureaucratic
Weighted
% of Headteachers % of Deputy heads and
classroom teachers
Required to be too detailed 12.4 24.3
Planning is for the teacher / it should be up to the teacher detail required
etc. 7.2 3.1
Not meeting the child’s needs 4.1 2.0
Duplication of information 2.9 3.6
References to planning for observations 2.8 4.5
Time consuming 2.7 9.4
Teachers being put under unnecessary pressure 2.6 1.5
Too many planning formats e.g. long/medium/short term 2.5 4.8
References to Ofsted (all references) 0.3 3.0
Differentiation (all references) 0.1 5.5
Change of planning formats too regularly 0.0 2.7
Other 6.5 3.8
None 46.9 42.6
Not Stated 26.7 11.7
Base 142 862

35
Figure 20 Examples of activities relating to SATS and exams that can be unnecessary and bureaucratic
Weighted
% of Headteachers % of Deputy heads and
classroom teachers
Preparing for SATS / (mock) Exams detracts from the teaching of the
curriculum 10.9 2.8
Pressure to track and monitor results 10.8 5.1
Planning / preparation 8.7 3.5
Time consuming 8.0 6.6
Irrelevant as I do not sit SATS / not a relevant role / accurate reflection 4.7 2.2
Photocopying / putting together practise SATS / Exams 4.3 3.3
Gathering evidence 2.5 1.5
Assessments (all references) 2.2 5.7
Moderation / supervision 2.0 1.5
Too much paperwork / extra workload 0.3 3.5
Marking practice papers 0.3 11.0
Not given any extra time (to complete processes) 0.1 2.0
Checking exam entries 0.0 1.1
After school / extra sessions / booster classes (revision / SATS practise
etc.) 0.0 5.5
Giving up lunch / break time / holidays (to hold revision sessions) 0.0 2.5
Duplication of work 0.0 1.4
Other 8.4 5.4
None 34.9 47.9
Not Stated 19.8 12.2
Base 142 862

36
Figure 21 Examples of other activities that can be unnecessary and bureaucratic
Weighted
% of Headteachers % of Deputy heads and
classroom teachers
Adapting to changing policies / guidelines (from government) 10.3 1.6
Too much admin /form filling/lesson plans 9.7 13.4
Emails 6.8 1.6
Duplication of information 5.5 2.0
Ofsted (all references) 3.2 2.6
Meetings / minutes of meetings (all references) 3.1 7.8
Time consuming 2.2 4.3
Time taken away from teaching / preparing lessons etc. 2.1 4.5
Maintaining records/Data Collection 2.0 3.5
Too much paperwork 0.8 4.6
Preparing reports 0.3 2.8
Inset / staff training 0.3 2.5
Contact with parents (all references) 0.2 2.7
Evidence gathering 0.1 2.2
Assessments 0.0 4.1
Observations (all references) 0.0 1.8
Detailed marking / marking 0.0 3.8
Other 9.8 3.2
None 36.6 33.4
Not Stated 21.0 18.6
Base 142 862

37
Figure 22 Reason for increase in time spent on unnecessary and unnecessarily bureaucratic tasks
Weighted
% of Headteachers
% of Deputy heads
and classroom
teachers
Preparing for Ofsted inspection / fear of impending Ofsted inspection 16.6 16.1
Forms and Paperwork has increased 0.7 15.2
Assessments (all references) 0.4 11.5
A change within my role / change of schools 0.3 10.8
Increase in data reporting / collection 9.2 9.7
Increase in evidence gathering 7.4 9.7
OFSTED changes 19.9 8.5
Increase in workload 16.4 8.6
Changes to curriculum 0.7 9.0
Lesson planning 0.4 8.5
Government initiatives / changes / pressure 6.0 7.8
A change of management / SLT 0.6 6.7
Demands on / from School Leadership Team (SLT) 0.0 6.3
Recording / record keeping 11.2 5.0
Departmental policy changes 12.9 3.1
Extra marking 0.0 3.4
Increase in accountability 9.9 2.8
Increase in monitoring 0.1 2.8
Exam procedures 0.0 1.8
Lack of staff / not enough staff 0.0 1.7
Effects of Academy status 0.1 1.6
Other 29.4 7.5
Not Stated 0.0 0.8
Base 38 398
Results based on fewer than 50 (headteachers) should be treated with caution.
38
Figure 23 One requirement they would ask Department for Education to remove
Weighted
% of Headteachers
% of Deputy heads
and classroom
teachers
Ofsted (all references) 13.5 7.6
Reduce the amount of reports / reporting 8.6 5.3
Slow down / reduce the pace of change 8.4 2.3
Changing the curriculum 7.6 3.5
Testing of pupils (phonics / SATS etc.) (all references) 6.6 7.6
Get rid of / less unnecessary assessments 5.7 10.8
Data analysis / inputting of data 4.0 4.1
Not expecting all pupils to progress at the same speed /
increase by the same number of levels
2.7 2.7
Lesson planning / less detail within lesson plans 2.5 2.5
Less meetings / more productive meetings 0.3 1.7
Performance management 0.1 2.3
Marking work in too much detail / unnecessary marking 0.0 2.5
More PPA / planning time 0.0 3.1
Reconsider/get rid of league tables 0.0 2.0
Other 8.6 9.2
Don't Know 2.6 0.6
None 2.1 4.7
Not Stated 29.3 27.9
Base 142 862

39
Figure 24 Other tasks that would improve the quality of teaching and pupil learning if able to spend more time
on them
Weighted
% of Headteachers
% of Deputy heads
and classroom
teachers
Collaborating / spending time / planning with support staff 12.4 7.7
More training opportunities / CPD 11.7 3.9
More time to research 9.7 2.4
Smaller class sizes / smaller group teaching 7.8 6.8
Giving feedback to pupils / more one to one time 6.4 11.7
More staff required 4.7 1.9
Getting to know / mentor students 4.6 5.0
More planning / preparation time 4.6 16.4
Observing good practice (peer / colleague / other schools) 3.4 5.8
Sourcing / developing new resources / innovative teaching 3.0 12.2
Be allowed to actually teach / focus on teaching 2.7 2.7
Differentiation 2.7 1.7
Extra curricular activities / learning / trips etc. 2.6 1.9
Curriculum (all references) 0.8 3.0
More marking / assessment time 0.4 3.9
Lesson observations 0.3 0.9
Increased funding / budget 0.1 1.7
Collaboration with / involvement of parents 0.1 2.0
SOW / schemes of work (all references) 0.0 1.1
Working with outside organisations 0.0 0.3
Utilising new technologies/software 0.0 0.1
Other 6.5 5.5
None 13.0 17.6
Not Stated 30.4 18.3
Base 142 862

40
Annex B: Technical report and sample
Survey tools
A number of key survey tools were used in the 2013 survey. The main questionnaire pack
contained the paper self-completion diary and questionnaire booklet, a covering letter and a reply
paid envelope (second class). The diary based approach for collecting time use data was
simplified compared to the method used in previous years and consequently the burden on
teachers reduced as:
the number of task codes was substantially reduced
time use data was collected for two consecutive days pre-selected by TNS BMRB at
random for each teacher - this gave the teacher the option to complete it in real time, or at
the end of the second day from memory
The weekend was treated as ‘one’ diary day which meant that a teacher was not randomly
assigned both weekend days and their diary was completed for at least one weekday. The random
allocation of days ensured equal and representative coverage of all five weekdays and the
weekend so that total weekly workload could be estimated.
Part-time teachers were asked to complete the questionnaire on the same basis, but if they were
not contracted to work on one or both of the days assigned to them, they were asked to replace
the non-working day with the nearest day that they did work on.
The diary and questionnaire booklet also contained three pages of questions designed to measure
teachers’ attitudes to their job and workload.
The letter that accompanied the diary and questionnaire booklet was two sides of A4. Its contents
covered the purpose of the survey, the days of the week (and week) the teacher was required to
complete it and brief instructions on what they needed to do to participate, or if they had any
queries.
Sample design
The school workforce census was used as the sampling frame as it was the most comprehensive
and accurate list of teachers in England available. It also carried the advantage of providing
demographic information about teachers, removing the need to ask questions directly in the
survey.
A random selection of qualified teachers was selected after stratification by school level (primary,
secondary, special schools, and academies), within this by whether they were a headteacher or
other teacher, and within this by area type (London, metropolitan, non-metropolitan, and unitary
authorities). After stratification, teachers were selected from within school type and teacher type
strata by random start and equal interval.

41
Figure 25 sets out the drawn sample (i.e. the sample of teachers approached to participate in the
survey) in each strata.
Figure 25 Sample of teachers drawn by strata
Strata Academies Primary Secondary Special
Head Other Head Other Head Other Head Other
Greater London 59 255 20 228 69 393 7 75
Metropolitan County 78 367 55 293 122 683 5 115
Non Metropolitan County 67 266 112 488 188 989 9 175
Unitary Authority 74 362 63 316 121 585 4 110
Total 278 1250 250 1325 500 2650 25 475
Data collection
The data collection mode was a paper self-completion questionnaire. A questionnaire pack was
mailed out to each selected teacher directly at their school, to arrive on the Monday prior to diary
week.
Teachers completed the main questionnaire, recording time for two fixed days (randomly assigned
on each questionnaire) during the week commencing 11 March 2013. They then returned the
completed questionnaire to TNS BMRB in an individual reply paid envelope also provided as part
of the questionnaire pack.
Support was available to all selected teachers before, during and after the fieldwork period via a
telephone helpline, an email helpline and a specially designed website.

42
Response
The overall response rate by type of school for 2013 is set out in Figure 26.
Figure 26 Response rate by school type
Strata Academies Primary Secondary Special
Head Other Head Other Head Other Head Other
Number of teachers responding
Greater London 4 23 1 33 8 57 1 6
Metropolitan county 3 37 9 34 14 85 2 17
Non-metropolitan County 9 32 13 90 33 195 1 33
Unitary authority 7 46 13 47 24 104 0 23
Total 23 138 36 204 79 441 4 79
Response rate
Greater London 7% 9% 5% 14% 12% 15% 14% 8%
Metropolitan county 4% 10% 16% 12% 11% 12% 40% 15%
Non-metropolitan County 13% 12% 12% 18% 18% 20% 11% 19%
Unitary authority 9% 13% 21% 15% 20% 18% 0% 21%
Total 8% 11% 14% 15% 16% 17% 16% 17%
The overall response rate was 15%, but it varied by school and teacher type.
The survey data has been weighted to the population of teachers in different areas to ensure that
schools from different regions and different phases (academies, primary, secondary, special) are
properly represented. However, if schools responding to the survey have different characteristics
from those not responding then the results could be affected by non-response bias. This has not
been directly measured.
Diary completion
Teachers were asked to record all work-related activities for two days in the week commencing 11
March 2013. They completed a separate diary page for each of these two days by recording
activities each diary page. To add an activity teachers entered:
type of activity (the activity code e.g.T01 for regular timetabled teaching)
time the activity started (in 24 hour clock)
time the activity ended (in 24 hour clock)
notes (optional to provide more information about the activity)

43
Teachers had to enter all of the activities they completed on that day from the first work related
activity to the last. They entered a new entry for each change of activity. Teachers were asked to
ensure that:
there were no periods of time for which a teacher had not accounted for between their first
and last work-related activity of the day
there were no overlaps between activities
Five minutes was the minimum duration suggested for a diary entry. The guidance recommended
that very brief activities were classed as part of a longer activity, using the activity code which best
applies to the time as a whole. If an error had been made, teachers were asked to delete the
incorrect entry and re-enter it as necessary. Diary entries did not need to be in chronological order.
All activities and their codes were shown on the page opposite the diary page. The activity codes
were divided into seven general groups (teaching; non-teaching pupil or parent contact; planning,
preparation and assessment; staff/school management; general administrative support;
individual/professional activities, and not working). Each group was divided further into specific
types of activities.
Data processing
All data collected was cleaned, and coded by the TNS BMRB data processing team. Prior to
electronic data entry there was a stage of manual editing. Each of the diary pages in the
questionnaire was checked line by line and any problems or issues with the data were identified.
The clerical team assigned to this task amended the diary as necessary. Written notes or
comments from the teacher were used to clarify any illegibility or ambiguity and ensure that each
diary record was as accurate and complete as possible before it was keyed.
Completed and manually edited questionnaires were electronically scanned. A minimum level of
quality checks were built into the scanning programme automatically to ensure data was scanned
accurately.
Once entered, all data was subject to computer validation. The computer validation specification
programme was written to check the completeness and logic of the diary data and identify any
residual errors or omissions. These were corrected by reference to the paper questionnaires if
necessary or, if appropriate, by the use of forced edits. Edits covered issues such as multi-coding
of single coding questions, gaps or overlaps between diary entries, or the use of invalid task
codes.
Responses at open questions were coded to a code frame agreed with the Department for
Education.

44
Weighting
The weighting approach was designed to correct for unequal selection probabilities (design
weights) and non-response. Data was weighted at the teacher level, firstly applying design weights
to counter the disproportionate selection of school types and headteachers.
After design weights were applied, the profile of teachers was checked against the sample frame,
for characteristics such as type of establishment, region, level of teacher etc. A calibration weight
was calculated to correct for the differences with the population profile.
Estimates of precision
Because the Teachers’ Workload Diary Survey is based on a sample of teachers and not the
whole teacher population, the results are liable to differ to some degree from those that would
have been obtained if every single teacher had participated. We can make some assessment of
sampling variability, that is the differences in hours worked between the teachers in the sample
and in the whole population that arise from random chance. The degree of possible measurement
error depends on both the sample size and on how widely estimates of hours worked vary
between teachers. This ‘sampling error’ is likely to be smallest for categories of teacher with a
large sample and whose reported hours do not vary greatly. Conversely, it is likely to be largest
where sample sizes are small and the numbers of hours reported vary considerably.
Design effects and standard errors
Due to the complex sampling design used, the margins of error associated with the survey
estimates are likely to be larger than if a simple random sample (SRS) design had been used. To
take account of this, Design Effects (DEFFs) have been calculated for the most important
estimates. The Design Effect is the ratio of the variance under the complex sample design to the
variance of a SRS design.
While stratification will tend to decrease the variance, unequal selection probabilities (design
weighting) will tend to increase it. Generally most overall design effects for surveys with complex
sample designs, such as this one, are greater than one.
For this survey, standard error calculations for key measures have been undertaken using the
drop-one jack-knife method applied at sample stratum level. These calculations take into account
the sample design, the achieved sample sizes and the weights calculated within each stratum.
Confidence intervals
We can use the resultant standard errors to assess what the margins of error (‘confidence
intervals’) are likely to be around the survey’s key estimates. It is common when quoting
confidence intervals to refer to the 95% confidence interval around a survey estimate. This is
calculated as 1.96 times the standard error on either side of the estimated percentage or mean
since, under a normal distribution, 95% of values lie within 1.96 standard errors of the mean value.
If it were possible to repeat the survey under the same conditions many times, 95% of these

45
confidence intervals would contain the population values but, when assessing the results of a
single survey, it is usual to assume that there is only a 5% chance that the true population value
falls outside the 95% confidence interval calculated for the survey estimate.
We can therefore establish the interval as x ± 1.96 SEs (where x represents the mean obtained
from the survey). Figure shows the confidence interval for categories of teacher with more than 50
respondents.
Figure 27 Confidence intervals by teach type
Heads Classroom Teachers
Secondary Primary Secondary Academy
Est. min max Est. min max Est. min max Est. min max
Teaching 2.8 1.8 3.8 19.0 17.0 20.9 19.6 18.6 20.6 20.2 18.6 21.9
Non-teaching pupil/parent contact 9.9 8.1 11.7 5.9 5.0 6.8 7.8 7.0 8.6 6.1 5.0 7.1
Planning, preparation and
assessment
3.0
1.9 4.0
22.6
19.5 25.8
18.9
17.7 20.2
18.7
16.0 21.5
School/staff management 38.5 35.0 42.0 4.0 3.1 4.9 4.6 3.9 5.2 4.0 3.0 5.1
General administrative support 1.5 1.0 2.1 4.3 3.5 5.1 2.3 2.0 2.7 3.0 2.3 3.7
Individual/professional 6.6 4.0 9.2 3.0 1.9 4.1 1.7 1.1 2.2 1.8 1.0 2.6
Other working activities 0.9 0.3 1.6 0.5 0.1 0.8 0.8 0.6 1.1 1.3 0.6 2.1
All working activities 63.3 60.5 66.1 59.3 54.5 64.1 55.7 53.6 57.8 55.2 51.5 59.0
Base 79 129 338 108
Taking an example from the 2013 survey, the confidence interval for the average total hours
worked by secondary classroom teachers is: x ± 1.96 SE = 55.7 hours ± (1.96 * 1.09 hours) = 55.7
hours ± 2.1 hours.
In summary, although the survey provides our best estimate (x = 55.7 hours) of the population
mean, statistical theory can be used to show we can be very confident that the true population
mean lies between 53.6 and 57.8 hours.

46
© TNS BMRB [2014]
Reference: DFE- RR316
ISBN: 978-1-78105-293-8
The views expressed in this report are the authors’ and do not necessarily reflect those of the
Department for Education.
Any enquiries regarding this publication should be sent to us at:
[email protected] or www.education.gov.uk/contactus
This document is available for download at www.gov.uk/government/publications