teachers’ day 2005 the changing shape of christchurch doug johnston room 311 ext. 7917
TRANSCRIPT

TEACHERS’ DAY 2005
THE CHANGING SHAPE OF CHRISTCHURCH
Doug Johnston
Room 311
Ext. 7917
OBJECTIVES:
i) to examine the role transport has in influencing the
shape of expanding cities
ii) to outline non-transport factors that also affect the
shape of expanding cities
iii) to examine these ideas in the context of Christchurch
as a case study

1. CHANGING URBAN TRANSPORT TECHNOLOGY
i) Walking [horse]; FOOT city;
ii) horse bus; horse tram; ¦ ¦iii) early railways; ¦ TRACKED city; ¦iv) electric trams; bus services; ¦
v) [bicycle] private car; motorcycle; RUBBER city;

1. CHANGING URBAN TRANSPORT TECHNOLOGY II
Changes in transport technology:
=> higher travel speeds / shorter travel time;
(some) => greater spatial flexibility;
(some) => greater temporal flexibility;

1. CHANGING URBAN TRANSPORT TECHNOLOGY III
BUT: - changes did not occur abruptly (modes oftenco-existed for a long time);
- changes did not occur simultaneously throughoutthe city;
- improved transport technology did not necessarilymean cheaper transport costs;
- assumption of ongoing population growth;
HOWEVER: we can identify distinct phases of urban change in
relation to particular types of modes
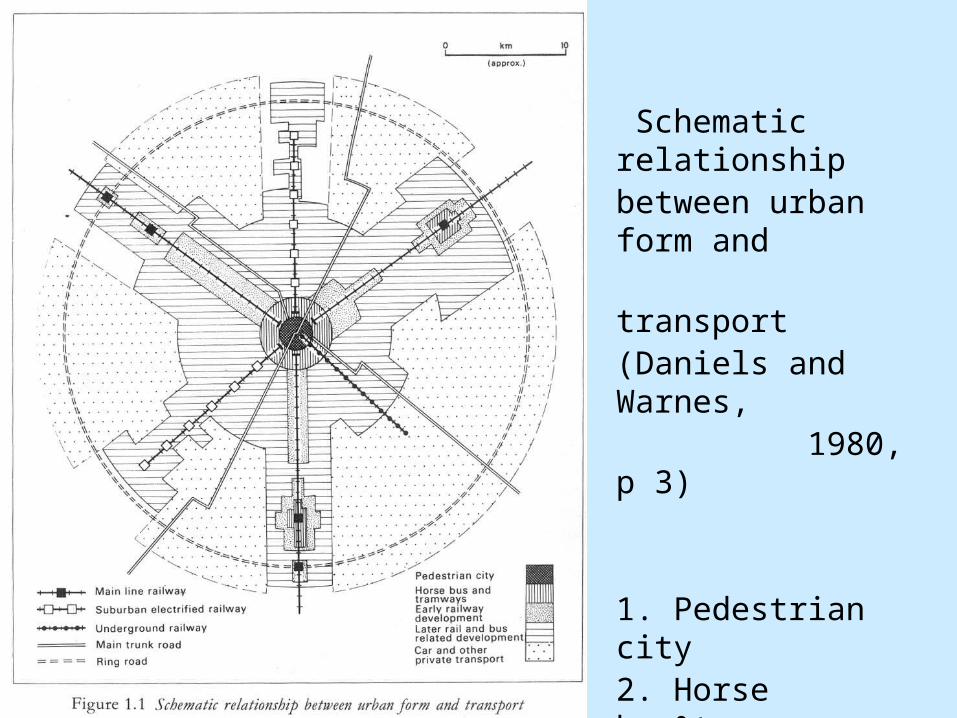
Schematic relationshipbetween urban form and transport (Daniels and Warnes, 1980, p 3)
1. Pedestrian city2. Horse bus&tramways3. Early railway4. Later rail and bus5. Car & other private

a) Foot City / Pedestrian City:
- relatively small area, densely built up;
- little spatial segregation :
- all land-uses together;
- people live at / near work-place;
(ala Asian “shop-house”)
- everything within walking distance;
- only elites had private transport (horse-drawn)
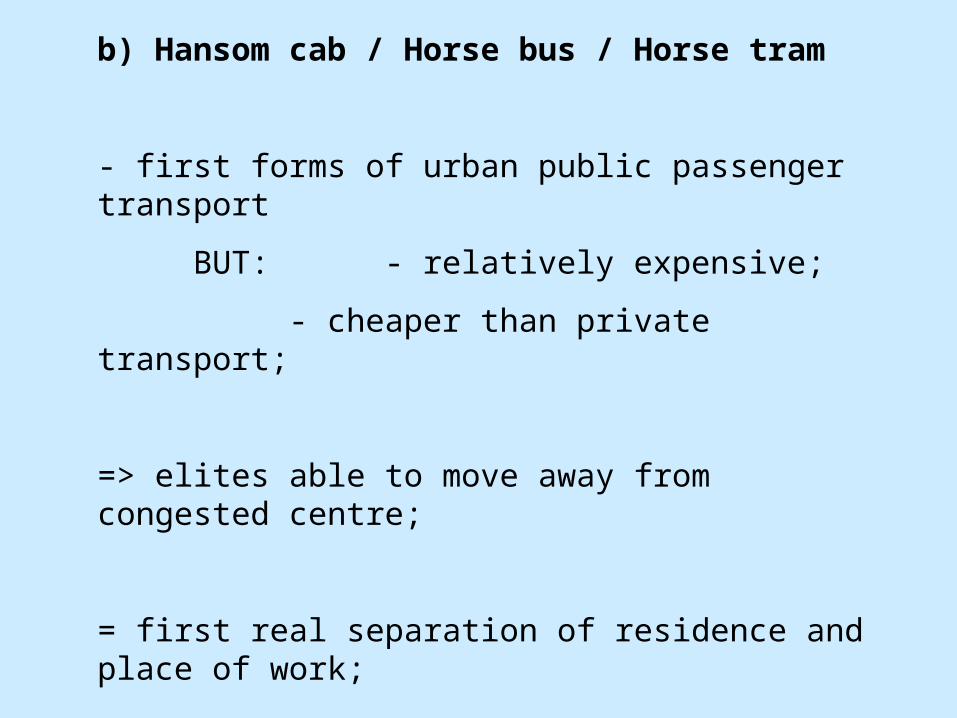
b) Hansom cab / Horse bus / Horse tram
- first forms of urban public passenger transport
BUT: - relatively expensive;
- cheaper than private transport;
=> elites able to move away from congested centre;
= first real separation of residence and place of work;
- expanded areal extent of city but still essentially circular (?)

Hansom cabs at Christchurch Railway Station, 1880s
(Alexander, 1983, p 10)

Horse tram on the Sydenham line, Christchurch
(Alexander, 1985, p 27)

c) Early railways / steam trams:
- allowed urban expansion along distinct corridors
defined by rail tracks;
+ able to commute to CBD from nearby settlements;
=> - commercial development around stations;
+ residential areas within walking distance of stations;
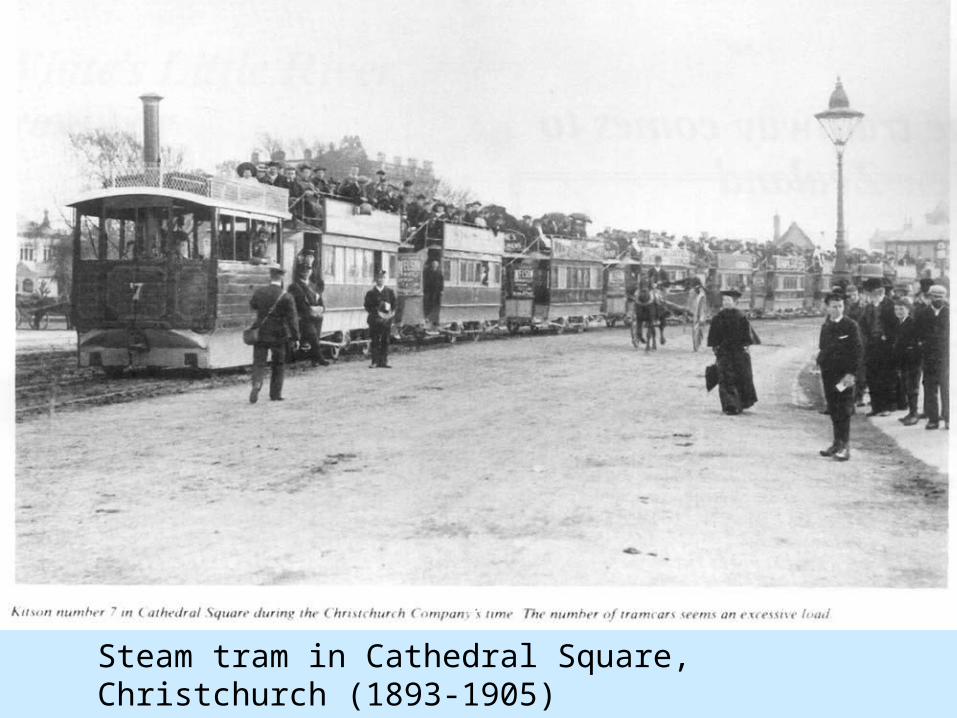
Steam tram in Cathedral Square, Christchurch (1893-1905)
(Alexander, 1985, p 2)
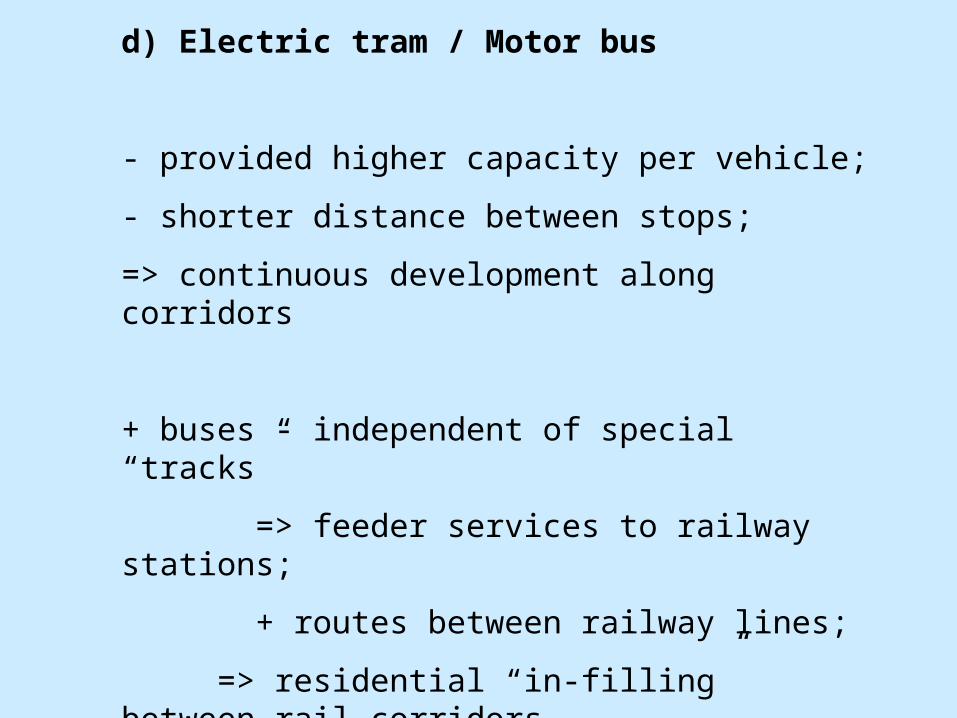
d) Electric tram / Motor bus
- provided higher capacity per vehicle;
- shorter distance between stops;
=> continuous development along corridors
+ buses - independent of special “tracks”
=> feeder services to railway stations;
+ routes between railway lines;
=> residential “in-filling” between rail corridors

Christchurch’s first motor bus, 1904
(Dew, 1996, p 8)

Electric tram and trailers in Christchurch, 1922
(Alexander, 1986, p 52)

Buses in Cathedral Square, Christchurch, 1936
(Dew, 1996, p 17)
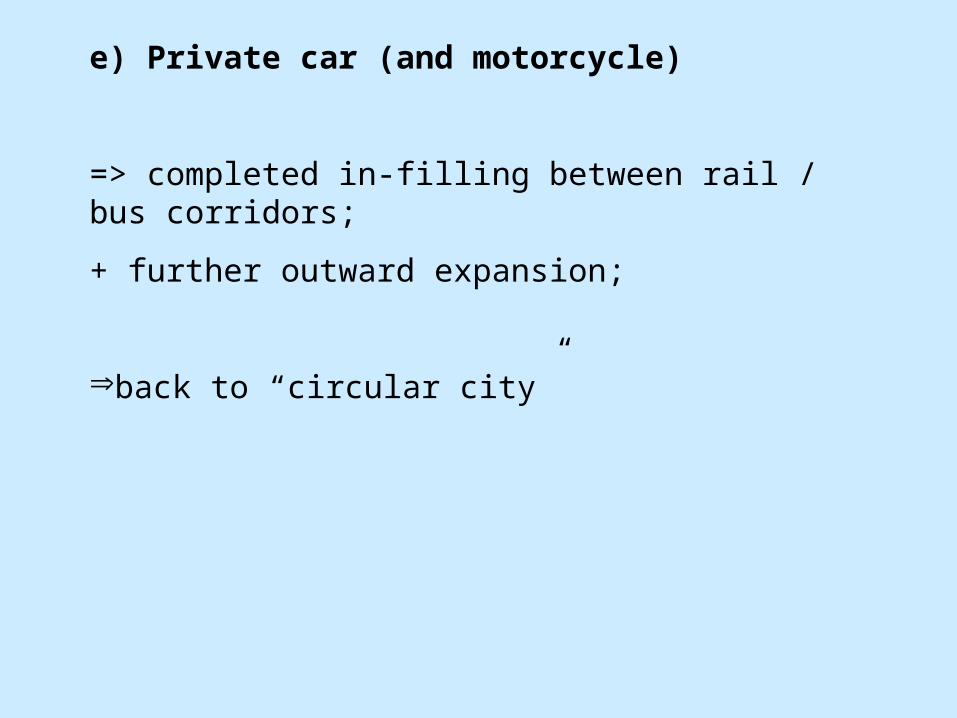
e) Private car (and motorcycle)
=> completed in-filling between rail / bus corridors;
+ further outward expansion;
back to “circular city”
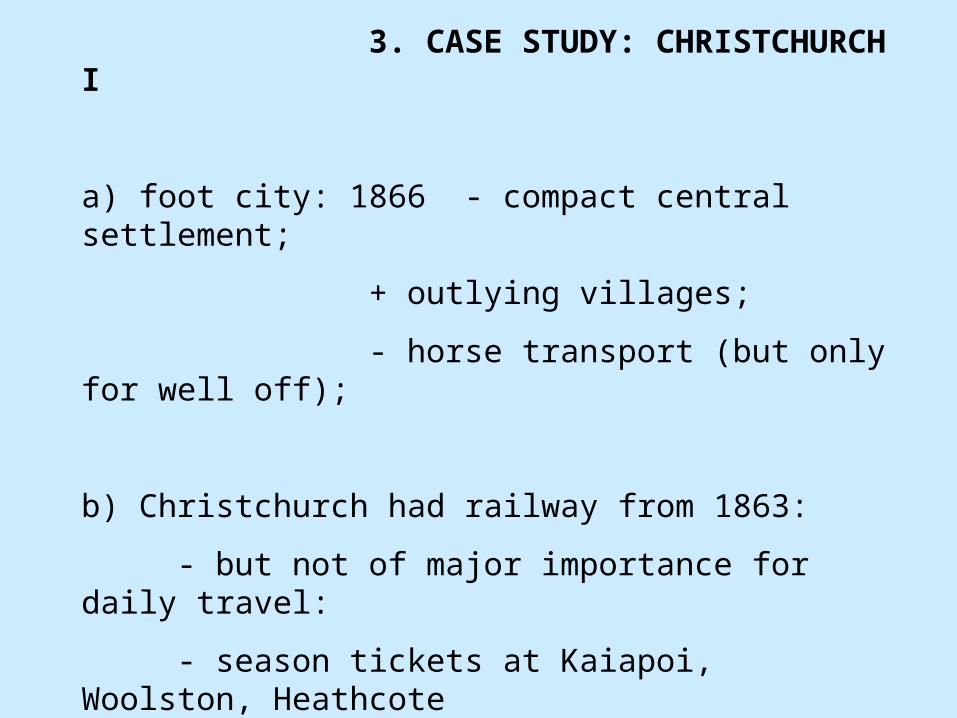
3. CASE STUDY: CHRISTCHURCH I
a) foot city: 1866 - compact central settlement;
+ outlying villages;
- horse transport (but only for well off);
b) Christchurch had railway from 1863:
- but not of major importance for daily travel:
- season tickets at Kaiapoi, Woolston, Heathcote
=> 250 people per day!

(Douglass, 2000, p 2)
Christchurch
1886
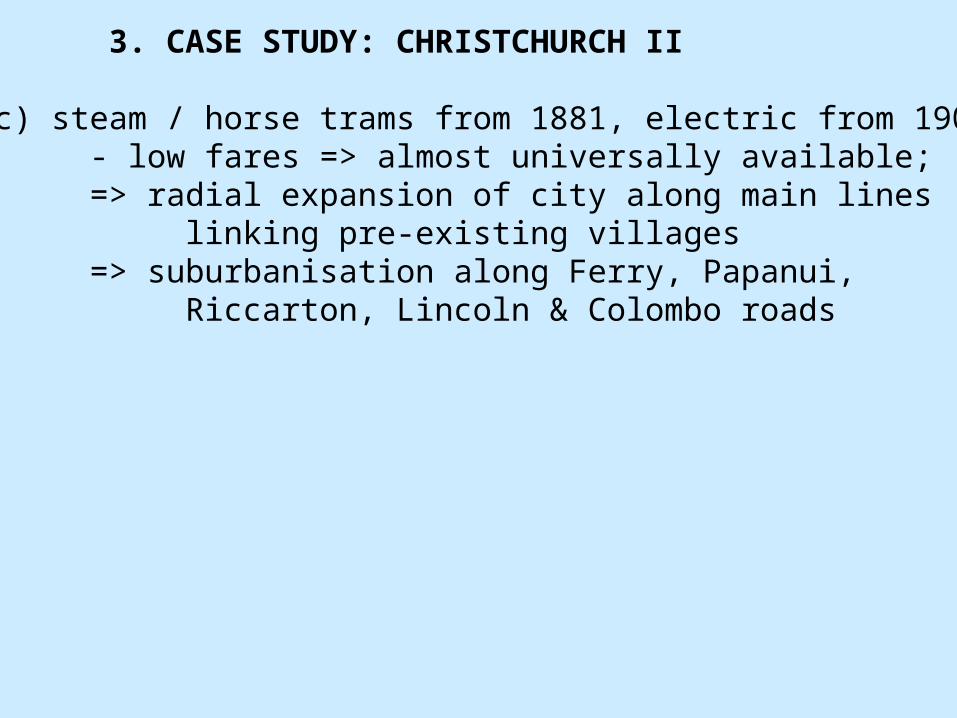
3. CASE STUDY: CHRISTCHURCH II
c) steam / horse trams from 1881, electric from 1905- low fares => almost universally available;=> radial expansion of city along main lines
linking pre-existing villages=> suburbanisation along Ferry, Papanui,
Riccarton, Lincoln & Colombo roads

Tramlines of the steam and horse tram era 1880-1905
(Alexander, 1985, centrefold)

Christchurch Tramway Board’s operations in the 1920s
(Alexander, 1986, centrefold)

3. CASE STUDY: CHRISTCHURCH III
d) motor buses added to system from 1904:- in theory, more flexible than trams:- in practice: took over same network plus
added extra radial spokes=> in-filling between original “corridors”;+ few non-radial routes (i.e. strong focus on CBD)

(Douglass, 2000, p 2)
Christchurch
1926
3. CASE STUDY: CHRISTCHURCH IV
e) Private motor vehicle:
- rapid increase in numbers of vehicles and “availability”per person;
=> significant extension of urban area by 1966;
- not circular but identifiable “obstacles”:- Travis Swamp and the Estuary;- Wigram Airfield;- Harewood Airport;- urban fence;

(Douglass, 2000, p 2)
Christchurch
1976

3. CASE STUDY: CHRISTCHURCH V
f) Expansion continued:
- within urban area;
- extensions: - Halswell;- West Melton;- Kaiapoi;
PLUS - in recent years => “life-style blocks”
- “counter-urbanisation”
- “urban people in rural areas”

(Douglass, 2000, p 2)
Christchurch
1996

3. CASE STUDY: CHRISTCHURCH VI
BUT NOTE:
- transport improvement does not CAUSE expansion
- makes expansion possible via reduced travel time;
- can travel further in “acceptable” time;
OTHER FACTORS affect whether “opportunity” taken up

4. OTHER FACTORS AFFECTING EXPANSION OF CITIES
i) Working hours:
- in old European cities (ala Charles Dickens) worked
10-12 hour days; emphasised need to live close-by;
- NZ => 40 hour, 5-day week from 1936;
- as working day became shorter (custom / law)
=> more time “available” for travel to work;
ii) Income levels relative to transport costs:
- as incomes increased => able to afford public transport
and live more than walking distance from work;

4. OTHER FACTORS AFFECTING EXPANSION OF CITIES
iii) land available for housing influences:- ability to expand;- direction(s) of expansion;- relative cost of land/building;
- affected by: - physical factors (slope, drainage, soil, view, aspect);- cultural factors (ownership, subdivision rules etc);- actions of developers;
+ Christchurch expansion => policies to curb “sprawl”- “urban fence”- minimum subdivision size;- satellite towns (e.g. Rolleston)

4. OTHER FACTORS AFFECTING EXPANSION OF CITIES
iv) availability of housing finance:- New Zealand introduced policies to provide relatively easy
access to housing loans;=> encouraged / allowed transition from rental to owned=> lower density housing and greater spread;
v) Acceptability of “high-density” living:- in-fill housing - “high-rise” apartments

5. OVERVIEW
Transport technology CAN influence the expansion / shape of a city:
- compact pedestrian city- “star” shaped “tracked” city- circular “rubber” city
BUT other factors are also involved:
i) Working hours:ii) Income levels relative to transport costs:iii) Land available for housing influences:iv) Availability of housing finance:v) Acceptability of “high-density” living:
AND: as city expands it changes in structure


(Douglass, 2000, p 5)

CHRISTCHURCH: POPULATION AND PUBLIC TRANSPORT
0
5000000
10000000
15000000
20000000
25000000
30000000
35000000
40000000
1900 1920 1940 1960 1980 2000 2020
Year
Po
pu
lati
on
*1
00
/ P
ub
lic t
ran
sp
ort
pa
ss
en
ge
rs
Pop*100 Passengers

6. THE CASE OF CHRISTCHURCH I -Decentralization of employment:
Percent of EmploymentYear in Central Business District
1959 (55 approx.)
1971 42.5
1986 33.3
1991 30.2
1996 25.0
2001 26.3
(Regional Planning Authority and Census data)

CENTRAL CHRISTCHURCH: POPULATION TRENDS
0
2000
4000
6000
8000
10000
12000
1955 1960 1965 1970 1975 1980 1985 1990 1995 2000 2005
Year
Re
sid
en
t P
op
ula
tio
n
Avon Loop
Cathedral Sq
Hagley Park
TOTAL