td-07-027 fnal hins ch sol 04d expected performance … documents/2007... · td-07-027 fnal october...
TRANSCRIPT

TD-07-027 FNAL October 30, 2007
HINS_CH_SOL_04d Expected Performance and Test Results
E. Barzi, G. Davis, C. Hess, F. Lewis, D. Orris, M. Tartaglia, I. Terechkine, D. Turrioni,
and T. Wokas I. Solenoid data
The second pre-production type 2 (equipped with dipole correctors) solenoid was built using the same primary drawing and the same assembly technology as was used for the first pre-production type 2 solenoid [1]. The solenoid was built from Main Coil (MC) serial number P05, Bucking Coils (BC) BC09 and BC10, and Correction Dipoles (CD) were H03 (horizontal) and V03 (vertical). One main difference in implementation of the design resulted from using different NbTi strand: this time, Oxford 0.8mm (spool 6056-2) strand was used that allowed getting a more tightly wound main coil. After coating, outer strand diameter was 0.846mm. Previous experience in setting the right winding parameters resulted in smooth winding; every odd layer had 105 turns, every even layer had 104 turns, and there were totally 2926 turns in 28 layers of winding. The size of the bucking coil was changed slightly to make it more narrow, but a bit thicker. The modified layout is shown in Fig. 1.
Fig. 1. Second CH section type 2 pre-production solenoid as-built design features.
The goal here was to get better fringe field, and Fig. 2 shows the as-built model
prediction for transfer function of this solenoid, compared with the first pre-production magnet HINS_CH_SOL_03d, at 100A and 200A. The new design does significantly better (about a factor of 2) in bucking the main coil field at large distance from the center, and it is evident from this data that iron saturation at higher current affects the fringe field strength for both solenoids.
1

TD-07-027 FNAL October 30, 2007
Fig. 2. Predicted transfer function in fringe field region at 100A and 200A for the as-built solenoids, HINS_CH_SOL_03d and _04d.
Strand critical current parameters (10-14 Ω-m criterion) were measured by Daniele Turrioni and Emanuela Barzi and are shown in Table 1 (0.8 mm) and Table 2 (0.6 mm). The predicted load lines and quench currents for the Main and Bucking coils are shown in Fig. 3.
Table 1: Measured Performance of 0.8 mm Strand (Spool 6056-2) B (T) 3 4 5 6 7 8 9 Ic (A) 842 711 592 477 356 230 107
Table 2: Measured Performance of 0.6 mm Strand (Spool 1797A) B (T) 1 2 3 4 5 6 7 Ic (A) 749 559 462 392 330 270 210
Fig. 3. Load diagram for the second type 2 pre-production solenoid, HINS_CH_SOL_04d
Quench current in the main coil is expected at 233 A. In the bucking coil quench onset is expected at ~ 237 A.
2

TD-07-027 FNAL October 30, 2007
II. Correction dipole data
As in the previous case [1], two corrector coils were wound in a single layer on concentric cylinders: the inner cylinder was used for the Horizontal Corrector Dipole, which was 90.6 mm in length and had 14 turns; the outer cylinder housed the Vertical corrector Dipole, which was 93.0 mm in length and had 16 turns. Modified (flattened by rolling) ML-coated 0.808 mm NbTi strand was used for the coil fabrication. Final strand dimensions were 0.559 x 0.991 bare (0.61 x 1.01 insulated).
III. Test overview
The solenoid was tested in two thermal cycles. The first cool down was on August 6, 2007, and quench performance studies started and continued through August 7. Problems with the Quench Detection (QD) and Power Systems (PS) prevented completion of the quench studies, and there was no time to perform cold magnetic measurements. Problems with the systems were later found and fixed, and a second cold test was performed on September 14 without the solenoid having been removed from the dewar in the intervening time. The cryogenic conditions were somewhat better than in previous tests: by opening up the dewar vent, the dewar over-pressure was reduced and the liquid helium temperature was kept very constant at 4.25K (except for a brief period on 8/6 when a plug in the transfer line created some consternation) in both thermal cycles. The BCs were internally connected in series, and MC and BCs were separately connected to a pair of power leads for external connections to the power supply. The CDs were also internally connected in series, and the third power lead pair was utilized to power both CDs. Prior to the first cool down, warm z-scans were separately made of the MC and series BC coils powered at 0.5A, to check the field polarities. In connecting MC+BC in series, MC lead connected to PS positive terminal, BC09 (BC+) connected to the MC negative lead, and BC10 (BC-) was connected to the PS negative terminal.
IV. Quench Performance During the first thermal cycle, the main coil and the bucking coils were trained
separately to the maximum currents of 275 A for BCs and 214 A for MC. We then switched to training the MC+BC in series; due to shortage of time and helium, we did not complete the training, but opted to test the quench performance of the CDs in the MC+BC field. In this case, system problems forced us to power all coils together from the same PS, and the CD coils reached 200 A without quenching.
Figure 4 shows the ramp history during the first TC: training was slow in each case, and the training was not “remembered” after the coils were connected in series. This result was not too surprising though, because of the quite different magnetic field distribution. Due to multiple failures in the QD/PS system, and the lack of liquid He, we did not finish the MC+BC training during the first test cycle.
The second thermal cycle ramp history is illustrated in Figure 5. After first capturing the MC+BC magnetic field profile at 200A (using the 3D, 10T Hall probe), MC+BC training was continued and the solenoid reached 235 A, slightly above the predicted
3
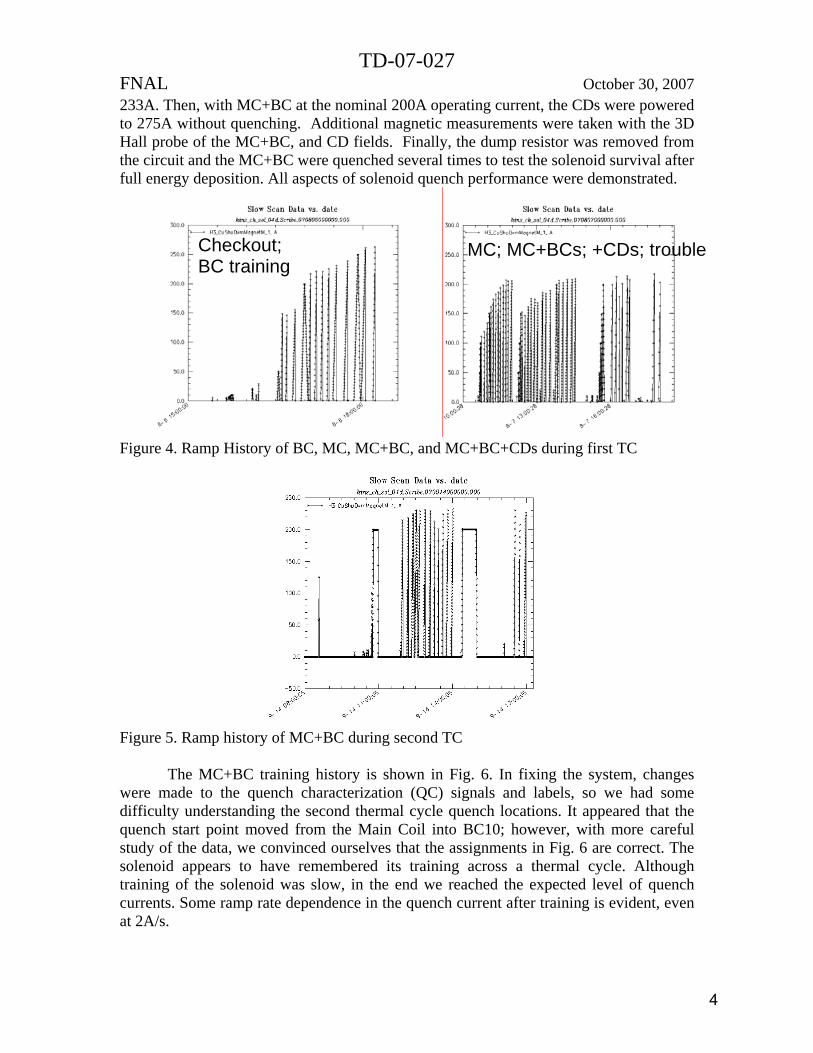
TD-07-027 FNAL October 30, 2007 233A. Then, with MC+BC at the nominal 200A operating current, the CDs were powered to 275A without quenching. Additional magnetic measurements were taken with the 3D Hall probe of the MC+BC, and CD fields. Finally, the dump resistor was removed from the circuit and the MC+BC were quenched several times to test the solenoid survival after full energy deposition. All aspects of solenoid quench performance were demonstrated.
Checkout; MC; MC+BCs; +CDs; trouble BC training
Figure 4. Ramp History of BC, MC, MC+BC, and MC+BC+CDs during first TC
Figure 5. Ramp history of MC+BC during second TC
The MC+BC training history is shown in Fig. 6. In fixing the system, changes
were made to the quench characterization (QC) signals and labels, so we had some difficulty understanding the second thermal cycle quench locations. It appeared that the quench start point moved from the Main Coil into BC10; however, with more careful study of the data, we convinced ourselves that the assignments in Fig. 6 are correct. The solenoid appears to have remembered its training across a thermal cycle. Although training of the solenoid was slow, in the end we reached the expected level of quench currents. Some ramp rate dependence in the quench current after training is evident, even at 2A/s.
4

TD-07-027 FNAL October 30, 2007
In the solenoid survival test, it was somewhat surprising that the quench occurred in BC10, at a higher current (238.6A) than the training plateau, and slightly higher than the predicted 237A BC quench current. The following quench appears to show that the coil did not remember its training after the full deposition event. However, the BC quench is the worst case in terms of temperature rise, and we realized that we had perhaps not waited long enough for that coil to come to thermal equilibrium at 4.2K (time between quenches was 11m41s, and 2A/s ramp rate may also have contributed extra heat): thus, in the second ramp, the quench was also in BC10, at a lower current. The third ramp was made at 1A/s, with 14m46s delay between quenches, and the location returned to the MC at 229A; thus, solenoid appears to have survived.
Fig. 6: MC+BC Solenoid training history; symbols identify the quenching coil and ramp rates. V. Magnetic Performance
Measurements were made at 300K with 0.5A current prior to the first cool down using the 1D axial Hall probe to make a quality check of the MC and BC field shapes and directions (Figure 7). The same probe and electronics setup used in previous tests (probe A, Table 4 in [2]) was utilized here.
Cold magnetic measurements were made in the second thermal cycle only, using the 3-axis 10T Hall probe and readout electronics (probe C in Table 4, [2]), but with a new readout cable and better shield grounding scheme the measurements look to be less noisy and more reproducible than in previous measurements (e.g., Fig. 9 in [2]). In this test, we
5

TD-07-027 FNAL October 30, 2007 captured data in all three dimensions for a number of cases: first, two z-scans of the MC+BC (one quick scan to find the solenoid center, and a thorough scan at a random probe angle position) at 200A; second, an angle scan to align x- and y-axis with the corrector dipole directions; third, a z-scan of the CDs (powered in series) at 200A to get the dipole profiles. Note that the nominal probe calibration is 1T per volt, so figures that show the recorded voltage can be interpreted directly, and accurately, as magnetic flux density in Tesla.
Figure 7. Warm axial field (transfer function) profiles of the MC and BCs at 0.5A prior to first TC (note: point scatter here is an artifact of difference in digitization timing by the DAQ system of the probe z-position and field strength). Corrector Dipoles
Because the CDs were powered in series, and there were no external reference marks to orient the measurement probe to the dipole directions, we do not have knowledge of which probe component is measuring which dipole field. An angle scan in the solenoid center was made to align the x- and y- probe components to the dipole field directions (Figure 8); angle measurements were made by visually aligning an angle scale on the “drive shaft” against a fixed reference mark; the shaft was rotated manually in 45 degree increments. The figure shows fairly nice sinusoidal behavior, with the two components separated by 90 degrees; the probe was then set to the 22.5 degree position for z-scans.
The z-scan of the CD fields is shown in Figure 9: there is some z-component due to fringe field of the dipoles. Figure 10 shows that there is very good agreement with the measurements made of HINS_CH_SOL_03d correctors at the same current [1], which are overlaid here onto the SOL_04d corrector profiles. For the field integrals ∫Bdz at 200A we obtain 0.373 T-cm for the x-component, and 0.406 T-cm for the y-component. These integrals also compare well with the values for HINS_CH_SOL_03d (see Table 2 in [1]), if Bx corresponds to the Horizontal dipole, and By corresponds to the Vertical dipole. The required field integral for the CH solenoid correctors is ~ 0.25 T-cm.
6

TD-07-027 FNAL October 30, 2007
Figure 8. Angle scan at solenoid center with corrector dipoles powered in series at 200A.
Fig. 9. Z-scan of the CDs powered at 200A with probe at 22.5 degree position
Fig. 10. Overlay of Corrector Dipole (transfer function) profiles from solenoids _03d and _04d measured at the same 200A current, showing very good agreement.
7

TD-07-027 FNAL October 30, 2007 Bucked Main Coil The axial field transfer function shape is shown in Figures 11 (peak region) and 12 (fringe region), with a comparison to the model prediction at the same 200A current that measurements were taken. The agreement is generally very good: the measured peak transfer function is 1.25% above the prediction and the fringe field is right at the expected level. The field profile is also very symmetric, and from these data the center z-position (“Zpk”) can be determined (visually) to within about 0.1mm. The squared field integral ∫B2dz (which defines the solenoid focusing strength) calculated from these data at 200A is 246.5 T2-cm, versus the predicted value of 240.3 T2-cm. The required field integral is 180 T2-cm and can be achieved at ~ 170 A.
Fig. 11. Comparison of measured and predicted axial field transfer function profiles for bucked main coil at 200A in the region of the solenoid center.
Fig. 12. Comparison of measured and predicted axial field transfer function profiles for
bucked main coil at 200A in the fringe region outside the solenoid.
8

TD-07-027 FNAL October 30, 2007 If the probe is off axis, this can lead to slightly higher than predicted Bz at the solenoid center (z=0), and slightly lower Bz at large |z|. The prediction for radial dependence of the field was shown in [1] for HINS_CH_SOL_03d, which should be very similar to _04d (Fig. 14 and Fig. 15 in [1]). As was shown in [3] (magnetic measurements discussion and Figures 15-20), we can estimate the probe axis offset using the 3D Hall probe scans. The same analysis can be made here: we assume the Bx and By terms are composed of a probe tilt, which introduces a term proportional to Bz and symmetric in z, plus a radial component due to axis offset, which introduces a term anti-symmetric in z with amplitude that depends upon the offset. Fig. 13 shows the field components Bx, By, and Bz (scaled down by x100) from the 200A z-scan; in Fig. 14 the probe tilt has been removed from the Bx and By terms by finding the scale factor of Bz that symmetrizes each distribution – this yields probe tilt estimates of 3.0 and 5.5 mrad, respectively. The resulting amplitudes of the asymmetric components are approximately Bx/Bz = By/Bz = 0.0033. From Figure 19 in [3], this suggests the probe offset from solenoid axis is approximately 0.2mm in both x and y, for a total radial offset of about 0.3mm. However, Fig. 14 of [1] shows that a radial offset of about 10mm is needed to get a 1% increase in the axial field strength. We suspect the most likely source of the difference between measured and predicted peak transfer function is due to the real versus assumed properties of the iron.
Fig. 13. 3D field components versus z-position along solenoid axis at 200A
Fig. 14. 3D field components after subtracting probe “tilt” components in X and Y
9

TD-07-027 FNAL October 30, 2007 V. Conclusion This solenoid performed acceptably well, and met expectations for both quench current and magnetic field shape for the bucked main coil and corrector dipoles.
References: 1. E. Barzi, G. Davis, C. Hess, F. Lewis, D. Orris, M. Tartaglia, I. Terechkine, D.
Turrioni, and T. Wokas, “Expected Performance and Test Results of the First Pre-Production Solenoid (Type 2, with Correctors): HINS_CH_SOL_03d”, FNAL TD note TD-07-021, FNAL, Aug. 2007.
2. C. Hess, F. Lewis, D. Orris, M. Tartaglia, I. Terechkine, T. Wokas, “Focusing Solenoid HINS_CH_SOL_01 Fabrication Notes and Test Results”, FNAL TD note TD-07-006, FNAL, Oct. 2006.
3. C. Hess, F. Lewis, D. Orris, M. Tartaglia, I. Terechkine, T. Wokas, “Focusing Solenoid HINS_CH_SOL_02 Fabrication Notes and Test Results”, FNAL TD note TD-07-008, FNAL, May 2007.
10