task 1: quality management in the early phases – focus ...€¦ · quality management exam -...
TRANSCRIPT

Quality Management Exam
- Solution -
10/02/2011 Page 1 of 35
Task 1: Quality Management in the Early Phases – Focus: Product (20 points)
You’ve just started your job as a quality manager at the Inkblot Ltd., which is famous for
producing exclusive single-use ballpens. To make a positive impression on your supervisor, you
start off by offering well-meant advice concerning the importance of quality management in the
early phases of product development.
As you remember from your studies, customer orientation is key to the development of
successful products. For this purpose the knowledge of customer requirements and wishes, the
resolution of conflicts in the construction process as well as the prioritization of tasks are
essential. Moreover, the early elimination of constructive and manufacturing-based failures
serves to lower costs.
1.1 Failure prevention (6 points) (L7-3)
You explain to your supervisor that failure elimination is usually reactive and therefore follows
the failure origin by a certain period of time. Picture 1-1 shows the number of faults over a part
of the product life cycle. Please label the two shown graphs and fill in the resulting graph for the
number of failures over the given period of time.
Num
ber
of fa
ults
Development Manufacturing Usage
Failure
occurrence
Failure
elimination
Picture 1-1: Number of failures over different phases of the product lifecycle
Through failure prevention and process organization failures are noticed and can thus be
eliminated earlier. Please indicate and label the two directions for optimization, plot and label the
0.5 points per correctly named
graph
1 point for the correct resulting
graph

Quality Management Exam
- Solution -
10/02/2011 Page 2 of 35
two optimized graphs for failure occurrence and failure elimination as well as the new resulting
graph for the number of faults over the given period of time in picture 1-2.
Num
ber
of fa
ults
Development Manufacturing Usage
Failure
occurrence
Failure
elimination
Process
organization
Failure
prevention
Picture 1-2: Failure prevention and process organization
By reducing the number of faults and an earlier recognition of failures costs for failure
elimination can be reduced significantly. Please plot the graph of failure costs over the lifecycle
in picture 1-3 and indicate the rate (the simplified rule) by which the costs increase.
-.10
1.-
10.-
100.-
Co
sts
pe
r fa
ult
Failureprevention
Failureelimination
Development Manufacturing Usage
Picture 1-3: Failure costs
Rule: ____________________Rule of 10___________
0.5 points per correct
optimization direction incl. label
0.5 points per correct failure
occurrence/failure elimination
graph incl. label
1 point for the correct new
resulting graph
0.5 points for the correct graph
of failure costs
0.5 points for the correct rule

Quality Management Exam
- Solution -
10/02/2011 Page 3 of 35
1.2 Kano-Model (4 points) (L7-6)
Considering customer requirements and ranking them is substantial for the development of
successful products. Therefore, the Kano-Model aids in the visualization of different classes of
customer requirements or characteristics and their contribution to customers’ satisfaction.
Please draw and label the five graphs for different customer requirements/characteristics in
picture 1-4. Also label the axes and indicate the direction by which the
requirements/characteristics shift over time.
Basic characteristics
Quality/Performancecharacteristics
Reverse characteristics
Indifferent characteristics
Exciting characteristics
Cu
sto
me
rsa
tisfa
ction
Fullfilment of requirements
Time
Picture 1-4: Kano-Model
0.5 points per correct graph incl.
correct label
0.5 points per correctly
labeled axis
0.5 points for the correct
indication of the time shift

Quality Management Exam
- Solution -
10/02/2011 Page 4 of 35
1.3 Kano-Interview (4 points) (E7-6)
Some time ago, the Inkblot Ltd. investigated new product characteristics based on single
customer requirements. You now suggest to classify the customer requirements by using the
Kano-Interview.
Tab. 1-1 shows an extract from the results of the conducted Kano-Interview. Please classify the
requirements/characteristics with the help of the matrix given in picture 1-5.
Tab. 1-1: Kano-Interview
I d
on
‘t c
are
I‘d
lik
e t
ha
t
I‘d
dis
like
th
at
I e
xp
ect
tha
t
What would you say if the ink of your ballpen
lasted 6 months?
What would you say if the ink of your ballpen
didn’t last 6 months?
What would you say if your ballpen could not only
write but also scan?
What would you say if your ballpen could only
write but not scan?
What would you say if your ballpen wrote
with invisible ink?
What would you say if your ballpen didn’t write with invisible but with normal ink?
What would you say if your ballpen were light and
ergonomic?
What would you say if your ballpen wasn’t light
and ergonomic?
1
2
3
4

Quality Management Exam
- Solution -
10/02/2011 Page 5 of 35
dislike
indif-
ference
expec-
tation
delight
Fu
lfilme
nt
dislikeindif-
ference
expec-
tationdelight
Non-fulfilment
Delighting characteristic
Quality characteristic with potential forimprovement through substitution by another characteristic
Quality/Performance characteristic
„Bad Idea“ or reason for the dissatisfaction with the product
Basic/Must-becharacteristic
Customer statement is inappropriate
1
2
3
4
Picture 1-5: Matrix for the Kano-Interview
Remark: Please enter each requirement/characteristic with its number (from tab. 1-1) and the
according symbol into the respective field of the matrix (picture 1-5).
0.5 points per
correctly
indicated
attribute
0.5 points per
correct
classification

Quality Management Exam
- Solution -
10/02/2011 Page 6 of 35
1.4 Quality Function Deployment (6 points) (L7-13/14)
To realize the collected customer requirements in your product, you suggest the method of
Quality Function Deployment (QFD) to your supervisor. To answer his questions you explain the
procedure of the QFD in six steps. Please point out the six steps on the right side of picture 1-6
and indicate the according area with the number of the step in the House of Quality on the left
side of picture 1-6.
Selection ofquality characteristics
How?2
Selection ofquality characteristics
How?2
Determination of customer requirements
What?1
Determination of customer requirements
What?1
Correlations of the different
quality characteristics3
Correlations of the different
quality characteristics3
Correlation betweencustomer requirements
and quality characteristics4
Correlation betweencustomer requirements
and quality characteristics4
Ranking the
quality characteristicsHow much?
5Ranking the
quality characteristicsHow much?
5
Deriving new target values
and other indicatorsWhy?
6Deriving new target values
and other indicatorsWhy?
6
1
3
2
4
5
6
6
6
Picture 1-6: House of Quality and the 6 steps for the QFD
0.5 points per correct
description
0.5 points for each correct
indication in the HoQ

Quality Management Exam
- Solution -
10/02/2011 Page 7 of 35
Task 2: Quality Management in the Early Phases – Focus: Deviation (20
points)
2.1 FMEA (7 points)
The Failure Mode and Effects Analysis (FMEA) assesses risk using three risk priority numbers.
Please provide their full names and abbreviations in tab. 2-1. Please decide which type of
malfunction they are associated with. (L9-26)
Tab. 2-1: Risk priority numbers FMEA
Full name Abbreviation Associated malfunction
Severity RnS Failure Effect
Detection probability RnD Failure Cause
Appearance / Occurrence probability RnA / RnO Failure Cause
(0.5 points for each correct answer)
FMEA must always be conducted by a team. Who is a permanent member of the team, no matter
which type of product, no matter which structure level of the product being examined? (L9-28)
Moderator
(0.5 points)

Quality Management Exam
- Solution -
10/02/2011 Page 8 of 35
Correct or incorrect? Please mark the corresponding field in tab. 2-2. (E9-09, -10, -12, -14)
Tab. 2-2: Questions about FMEA
Statement Correct Incorrect
The three measures associated with the risk priority numbers are:
effect limiting measures, suppressing measures and remedial
measures.
X
FMEA risk identification is always based on fixed rules and
limits independent of different industries.
X
FMEA always uses the 3-tuple: failure effect, failure and failure
cause.
X
Risk prioritisation is performed by assessing the occurrence
probability of failure causes.
X
(0.5 points for each correct answer, no points will be subtracted if you give a wrong answer)

Quality Management Exam
- Solution -
10/02/2011 Page 9 of 35
2.2 Usage of methods (4 points)
Quality Management includes several methods and tools to ensure a high quality standard prior
to the start of serial production (SOP). Assign the following methods to the phases. Please mark
the appropriate fields with a cross in tab. 2-3 if the method applies to the respective phase.
(Multiple entries per row are possible.) (L9-4)
Tab. 2-3: Quality management methods
Method
Customer
to
innovation
Idea
to
product
Process
development
Manu-
facturing
release
Quality Function
Deployment X X X
Fault tree
analysis X X
Design Review Based
on Failure Mode X X
System FMEA
process X
(0.5 points for each correct answer)

Quality Management Exam
- Solution -
10/02/2011 Page 10 of 35
2.3 Fault tree analysis (5 points)
Give the symbol for an AND-combination as well as for a NOT-combination including input and
output in tab. 2-4. (L9-18)
Tab. 2-4: Combinations of a FTA
Logical combination Symbol
NOT-combination
I
O
1
AND-combination
I2I1
O
&
Legend: I = Input O = Output (1 point for each correct symbol including input and output)
How are the inputs of a FTA called? Please name the inputs, sketch the respective symbols/icons
and describe the related defect modes in tab. 2-5. (L9-18)
Tab. 2-5: Inputs of a FTA
Name Sketch Description
Standard Input
(primary fault)
Fault under proper use
Secondary Input
(secondary fault)
Fault under improper use
(0.5 points for each correct answer)

Quality Management Exam
- Solution -
10/02/2011 Page 11 of 35
2.4 DRBFM (4 points)
DRBFM is an innovative QM method, originally from Japan, to determine the effects of product
or process changes.
Correct or incorrect? Mark the corresponding field in tab. 2-6.
Tab. 2-6: Questions about DRBFM
Correct Incorrect
DRBFM stands for Design Review based on Failure Measures. x
Variant and application development projects provide the highest
potentials and benefit for DRBFM.
x
In contrast to the practice of FMEA, creative approaches are
emphasised, teamwork is supported and formalism is reduced.
x
(1 point for each correct answer, no points will be subtracted if you give a wrong answer)
Please name the quality concept that DRBFM is based on.
Mizenboushi-GD³
(1 point)

Quality Management Exam
- Solution -
10/02/2011 Page 12 of 35
Task 3: Quality Management in Manufacturing (20 points)
3.1 Waste (2.5 points)
Please name five starting points to detect waste. (L6-03)
Overproduction,
Failures/Repair,
Transports,
Waiting periods,
Depots,
Stocks,
Distances,
Qualification of employees
(0.5 points each)
3.2 Stocks (1.5 points)
Please name three disadvantages of high stocks of inventory. (L6-05)
cover problems, cause costs
require depots, hamper the workflow
prevent control of processes
fosters routine work without further reflection and complacency
prevent opportunities for improvement
(0.5 points each)

Quality Management Exam
- Solution -
10/02/2011 Page 13 of 35
3.3 5S (4 points)
Name the 5S. Please do not only name the expressions but also give the corresponding
explanations. (2.5 points) (L6-09)
Sorting out means taking out unnecessary items and disposing them
Systematizing means arranging necessary items in good order
Sweeping means cleaning the workplace
Sanitizing means maintaining high standard of housekeeping
Self-discipline means doing things spontaneously without being told
(0.5 points each)
Please assign the 5S (items named in the task above) to the three phases of application for the 5S.
Also add the sixth S (Shukan – Familiarisation) to the correct phase. (1.5 points) (L6-16)
Phase 1: Sorting out, Systematizing, Sweeping________________________________________
Phase 2: Sanitizing______________________________________________________________
Phase 3: Self-discipline, Shukan (Familiarisation)______________________________________
(0.5 points for every phase)

Quality Management Exam
- Solution -
10/02/2011 Page 14 of 35
3.4 Value Stream Design (2.5 points)
What is the application of Value Stream Design? What is the desired result of Value Stream
Design? (1.5 points) (L6-18)
Value Stream Design allows drawing an image of the actual state of a value stream.
In Value Stream Design single processes like “blanking” or “welding” are wrapped up into
process categories. Processes and flows are illustrated with a group of symbols.
As soon as the whole stream of the manufacturing facility becomes visible, you can increase or
decrease the zoom factor, so you can either examine one single process or take a look at the
supply chain beyond your facility. Value Stream Design allows to analyze the material stream
and the information stream.
(1 point for answering the first question, 0.5 points for answering the second question)
What is the direction for sketching a Value Stream? (1 point)
Backwards from the customer to the supplier

Quality Management Exam
- Solution -
10/02/2011 Page 15 of 35
3.5 Statistical Process Control (9.5 points)
What is described by cp? (2 points) (L6-24)
The relationship of “tolerance band” to “process spread”
What is described by cpk? (2 points) (L6-24)
The relationship of “miniumum proximity to process limit” to “half process spread”
What is the requirement for a stable process? (1 point) (L6-24)
cp > 1 and cpk > 1
Name the three phases to conduct a Statistical Process Control. (1.5 points) (L6-27)
Preparatory run
Determination of control limits
Keep control charts
(0.5 points each)

Quality Management Exam
- Solution -
10/02/2011 Page 16 of 35
2221201918171615141312111098
---------------
---------------
X
X X
X
s
3
- UGW
Verteilung 1 Verteilung 2 Verteilung 3
UTL
LTL
NV
Distribution 3
LTL
Distribution 2Distribution 1
The illustration above shows three possible distributions of a production. Please match these
three distributions with the following values for cp and cpk. (3 points) (L6-24)
cp=0,71 and cpk=0,71: Distribution 1
cp=1,67 and cpk=1,33: Distribution 3
cp=2,50 and cpk=1,00: Distribution 2
(1 point for each distribution)

Quality Management Exam
- Solution -
10/02/2011 Page 17 of 35
Task 4: Quality Management in Procurement (20 points)
4.1 Procurement Strategies (3 points)
In procurement, portfolios are used to choose the procurement strategy for different products and
suppliers. The portfolio shown below displays different types of suppliers and procured goods.
Please fill in the missing strategies (1 to 3). (3 points)
Strategicgoods
Leveragegoods
Bottleneck-goods
Standardgoods
Standardsources
Bottleneck-sources
Leveragesources
Strategicsources
Displacement1.
2.
Using market potential,then cooperation in
partnership
3.
Supplier development ordisplacement to strategic or
leverage sources
(L10-07)
1: Procuring efficiently (1 p)
2: Securing the availability (1 p)
3: Supplier management in partnership (1 p)

Quality Management Exam
- Solution -
10/02/2011 Page 18 of 35
4.2 Procurement Strategies (8 points)
Please name one advantage and three disadvantages regarding quality for the two procurement
strategies listed below.
Global Sourcing (4 points) (L10-11)
Advantage regarding quality for the procuring company:
1: Procurement from international quality leaders possible (1 point)
Disadvantages regarding quality for the procuring company:
1: Longer reaction time in case of errors (1 point)
2: Difficult communication (1 point)
3: Different quality comprehension and training level (1 point)
…or: More damages in transport
Forward Sourcing (4 points) (L10-13)
Advantage regarding quality for the procuring company:
1.: Utilisation of supplier‘s know-how (1 point)
…or: Reduction of compatibility problems with brought-in parts due to early coordination
…or: Higher innovation ability
Disadvantages regarding quality for the procuring company:
1.: Abandonment of core competence (1 point)
2.: Raising of possible competition (1 point)
3.: High planning efforts (1 point)
Quality Management Exam
- Solution -
10/02/2011 Page 19 of 35
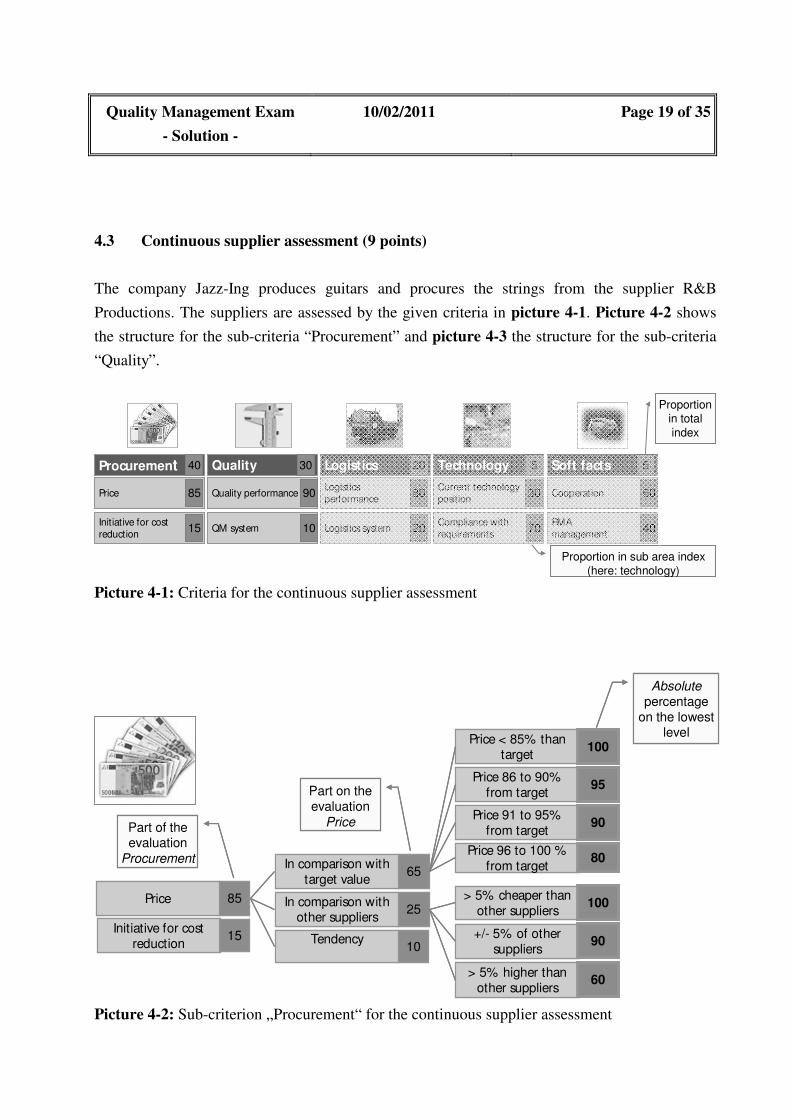
4.3 Continuous supplier assessment (9 points)
The company Jazz-Ing produces guitars and procures the strings from the supplier R&B
Productions. The suppliers are assessed by the given criteria in picture 4-1. Picture 4-2 shows
the structure for the sub-criteria “Procurement” and picture 4-3 the structure for the sub-criteria
“Quality”.
Procurement Quality Logistics Technology
Price Quality performanceLogistics
performance
Current technology
position
Initiative for cost
reductionQM system Logistics system
Compliance with
requirements
Soft facts
Cooperation
RMA
management70 40
603080
2010
9085
15
40 30 20 5 5
Proportion in total
index
Proportion in sub area index
(here: technology)
Picture 4-1: Criteria for the continuous supplier assessment
Price
In comparison withtarget value
In comparison withother suppliers
Tendency
Price < 85% thantarget
Price 86 to 90% from target
Price 91 to 95% from target
Price 96 to 100 % from target65
25
10
Initiative for costreduction
100
95
90
80
85
15
Part of theevaluation
Procurement
Part on theevaluation
Price
Absolute
percentageon the lowest
level
> 5% cheaper thanother suppliers
+/- 5% of othersuppliers
100
90
> 5% higher thanother suppliers
60
Price
In comparison withtarget value
In comparison withother suppliers
Tendency
Price < 85% thantarget
Price 86 to 90% from target
Price 91 to 95% from target
Price 96 to 100 % from target65
25
10
Initiative for costreduction
100
95
90
80
85
15
Part of theevaluation
Procurement
Part on theevaluation
Price
Absolute
percentageon the lowest
level
> 5% cheaper thanother suppliers
+/- 5% of othersuppliers
100
90
> 5% higher thanother suppliers
60
Picture 4-2: Sub-criterion „Procurement“ for the continuous supplier assessment

Quality Management Exam
- Solution -
10/02/2011 Page 20 of 35
Quality performanceRecognized failures
in assembly
Field failures of
brought-in parts
80
20QM-system
90
10
Picture 4-3: Sub-criterion „Quality“ for the continuous supplier assessment
Please conduct an assessment of the company R&B Productions in the categories
“Procurement” and “Quality” for the 4th
quarter of the year. The following data are available:
- The average price of stings on the market is 25 cents.
- R&B Productions offers the strings for 22 cents.
- The target price for the strings is 24 cents.
- The price tendency of R&B Productions was rated 96%.
- The initiative for cost reduction was rated 100%.
- Soft facts were rated 99%.
- The category technology was rated 95%.
- The category logistics was rated 99%.
- In the 4th
quarter of the year 20,000 strings were sold and assembled.
- One string was detected to be defective already during assembly.
- The QM-System of R&B Productions was rated 95%.

Quality Management Exam
- Solution -
10/02/2011 Page 21 of 35
Further data is contained in the following figures:
recognized failures during assembly[ppm]
degree of
performance[%]
100
90
80
70
60
50
40
30
20
10
0 100 200 300 500 600 700 800 1000900400
ppm = parts per million
Recognized failures during assembly from the 4th quarter
recognized failures during assembly[ppm]
degree of
performance[%]
100
90
80
70
60
50
40
30
20
10
0 100 200 300 500 600 700 800 1000900400
ppm = parts per million
Recognized failures during assembly from the 4th quarter
Picture 4-4: Recognized failures during assembly in the 4th quarter
Field failures of procured parts
0
0,5
1
1,5
2
2,5
3
3,5
4
4,5
5
1.
Quarter
2.
Quarter
3.
Quarter
4.
Quarter
R&BProductions
MusicFactory
String AG
Nu
mb
er
of
field
fail
ure
s
Picture 4-5: Field failures of procured parts

Quality Management Exam
- Solution -
10/02/2011 Page 22 of 35
Field failure evaluation of procured parts from the 4th quarter
field failures[ppm]
de
gre
eo
f p
erf
orm
an
ce
[%]
100
90
80
70
60
50
40
30
20
10
0 200 400 600 1000800
ppm = parts per million
Picture 4-6: Field failure evaluation of procured parts in the 4th quarter
Key performance index for “Procurement”
Calculation of the sub-category “Price“ (3 points):
Comparison to other suppliers:
22/25 = 88% --> 100%-88% = 12% --> 90% (1 point)
Comparison to target:
Target price: 22/24 = 91.7% --> 90% (1 point)
Assessment of the sub-criterion „price“:
85% x (65% x 90% + 25% x 100% + 10% x 96%)
= 79.13% (1 point)

Quality Management Exam
- Solution -
10/02/2011 Page 23 of 35
Calculation of the sub-category “Initiative for cost reduction“ (1 point):
Assessment of cost reduction:
15% x 100% = 15% (1 point)
Final calculation of the criterion “Procurement” (1 point):
= 79.13% + 15%
= 94.13% (1 point)
Key performance index for “Quality”
Calculation of the sub-category “Quality performance“ (2 points):
Recognized failures during assembly:
1/20,000 = 50 ppm
Figure „recognized failures during assembly “ at 50 ppm --> 90% (1 point)
Field failures:
Figure „Field failures“: for R&B Productions in the 4th
quarter of the year --> 2 failures
--> 2/20,000 = 100 ppm
--> Figure „Field failure evaluation“ at 100 ppm --> 90% (1 point)
Calculation of the sub-category “QM-Systems“ (1 point):
10% x 95% = 9.5% (1 point)
Final calculation of the criterion “Quality” (1 point):
90% x (80% x 90% + 20% x 90%) + 9.5%
= 90% x 90% + 9.5%
= 90.5% (1 point)

Quality Management Exam
- Solution -
10/02/2011 Page 24 of 35
Task 5: Strategic Quality Programs (20 points)
Aside from the given series of norms and standards Strategic Quality Programs help enterprises
to align and improve their processes with respect to system, product, and process quality. The
EFQM-Model and Six Sigma are two well-known approaches.
5.1 The EFQM-Model (10 points)
The model of the European Foundation for Quality Management (EFQM) is divided into two
parts: enablers and results. The resulting criteria deal with the results achieved by the enterprise.
How the results are achieved is the subject of the enabling criteria. Please fill in the criteria of the
EFQM Model in picture 5-1:
(5 points, 0.5 points for each correct answer) (L3-04)
Partnerships
& Resources
10%
Policy & Strategy
10%
People
10%
Society
Results
10%
Customer
Results
15%
Employee
Results
10%
Key
Perfor-
mance
Results
15%
Processes
10%
Leadership
10%
Enablers 50% Results 50%
Innovation and Learning
Picture 5-1: EFQM-Model

Quality Management Exam
- Solution -
10/02/2011 Page 25 of 35
Please name the aspects of the RADAR-Logic for the evaluation of the EFQM sub-criteria in
tab. 5-1 and give a short description:
Tab. 5-1
Aspect Explanation
R esults Define intended results
A pproach Plan and develop
the approaches
D eployment Deploy the approaches
A ssessment
R eview
Assess and review the approaches and deployment
(4.5 points, 0.5 points for each correct answer) (L3-8)
Which concept of Total Quality Management (TQM) receives particular attention when using the
RADAR-Approach?
(0.5 points for the correct answer) (L3-8)
Answer: Continuous improvement

Quality Management Exam
- Solution -
10/02/2011 Page 26 of 35
5.2 Six Sigma (10 points)
With a wide portfolio of quantitative and qualitative methods the Six Sigma program aims to
achieve the highest possible sigma level, or in other words, to minimize the failure rate for all
processes under examination.
Please fill in the correct terms to the diagram in picture 5-2:
(4 points, 0.5 points for each correct answer) (L3-20)
Lower tolerance boarder
line
-6σσσσ +6σσσσ
Upper tolerance
boarder line
σσσσ
+/- 1,5 σσσσ
Expected value
Long-term of the
mean value displacement
µµµµ
process behavior
distribution parameters
Lower tolerance boarder
line
-6σσσσ +6σσσσ
Upper tolerance
boarder line
σσσσ
+/- 1,5 σσσσ
Expected value
Long-term of the
mean value displacement
µµµµ
process behavior
distribution parameters
Picture 5-2: Diagram of the sigma level

Quality Management Exam
- Solution -
10/02/2011 Page 27 of 35
The DPMO (defects per million opportunities) is a measure for the quality of a process
considering the varying complexity of different processes.
Please give a brief description of each variable and fill in the formula to calculate the DPMO:
(2 points, 1.5 for the correct descriptions and 0.5 for the correct formula) (L3-21)
D (Defect) = Number of defects which don’t satisfy the request of the customer
N (Number) = Number of produced items
O (Opportunity) = Number of defect opportunities per item
Formula:
000.000.1**ON
DDPMO =
Which parameter considers process complexity?
(0.5 points for the correct parameter) (L3-21)
Answer: Number of defect opportunities per item ___________________________________
The shipping service “Upps“ sends 66 packages a day. While 23 never reach their addressee,
field studies show that another 33 packages do not arrive at their respective recipients in the
promised delivery time of three days. Five packages are severely damaged during transport.
The objective of “Upps” is to deliver undamaged packages in the promised delivery time to the
correct addressees.
Being the head of Quality Management it is your job to calculate the exact sigma level of the
shipping process. To this end, evaluate the correct DPMO value and use tab. 5-2 to find the
corresponding sigma level. Just take the DPMO-value of the table which comes closest to your
calculated DPMO. Hint: You do not have to interpolate between the values!
(1 point for the correct calculation of the DPMO) (L3-21)

Quality Management Exam
- Solution -
10/02/2011 Page 28 of 35
DPMO:
D = 23 + 33 + 5 = 61
N = 66
O = 3
DPMO = 308.080
(0.5 points for the correct sigma level) (L3-21)
Sigma level = 2_________________________________________________________________
Tab. 5-2
69000069,00000%31,00000%1F
30800030,80000%69,20000%2F
dpmofaultfault free
3,40,00034%99,99966%6F
2300,02300%99,97700%5F
62100,62100%99,37900%4F
668006,68000%93,32000%3F
69000069%31%1σ
30800030,8%69,2%2σ
dpmoFaultFault-freeσ
Level
3,40,00034%99,99966%6σ
2300,023%99,977%5σ
62100,621%99,379%4σ
668006,68%93,32%3σ
Sigma-Table
Please mark the correct field.
(2 points, 1 point for each correct answer, no points will be subtracted if you give a wrong
answer) (L3-21)
Tab. 5-3
Correct Incorrect
The sigma level is per definition an indicator for long term process
quality.
X
The DPMO measures the short term process performance. X

Quality Management Exam
- Solution -
10/02/2011 Page 29 of 35
Task 6: Quality Management in Field Data Evaluation (20 points)
6.1 Field data evaluation (3 points)
The basis of field data processing is the collection of master data, failure data and reference
quantities. Please locate field data processing in the Aachener Quality Management framework
by marking and labelling the correct field in the framework (see picture 6-1). (1 point) (L5-04)
Picture 6-1: Framework of the Aachener Quality Management Approach
Field data processing can be divided into six primary steps. Please name the four steps that have
to be accomplished after raw data acquisition and before analysis. (0.5 points for each step) (L5-
17)
1) Documentation
2) Preparation
3) Evaluation
4) Reference numbers
Quality stream
Resources &
services
Management
Quality stream
Resources &
services
Management
Field
data
Field
data

Quality Management Exam
- Solution -
10/02/2011 Page 30 of 35
6.2 Determination of the usage behaviour (3 points)
One of the methods to determine usage behaviour is the serial trial. Please name three different
methods of serial trial.
(0.5 points per correct method) (L5-12)
1) Simulation of single loads
2) Environmental simulation
3) Field study
Please name and explain the method which requires the highest test effort? (Explain your
choice!) (0.5 points for correct method, 1 point for correct explanation)
Method: Environmental simulation _________________________________________________
Explanation:
When simulating realistic loads and an accelerated ageing, often additional equipment like
motors, weights and gears are necessary. Therefore constructions and investments have to made
that increase the effort of this method.

Quality Management Exam
- Solution -
10/02/2011 Page 31 of 35
6.3 Isochronous diagram (14 points) (L5-19 to L5-28)
The Nindento GmbH is a German manufacturer of gaming consoles. The company owns two
manufacturing sites. One site is located in Aachen (Germany), the other is located in Stillwater
(Canada). The entire European market is supplied by Aachen, while Stillwater delivers to the
American market.
Nindento initially follows the production strategy of qualifying their manufacturing processes in
the German Site in Aachen. Generally, it takes up to two months for the production to become
capable. Subsequently, the manufacturing processes are established in Canada. To this end,
German engineers visit the Stillwater site for one month to train the local employees and set up
the machines. After one month of training, the engineers travel back to Germany.
The cross-plant chief quality engineer Mr Rosch has evaluated the retailers warranty records and
learned that the helmet system of the newest Vii-console (serial release in December 2009)
shows failures in the field. Obviously, these failures can be traced back to the manufacturing of
the products. To analyse the sources Mr Rosch has collected the failures and number of consoles
produced for both markets and production sites, Aachen and Stillwater.
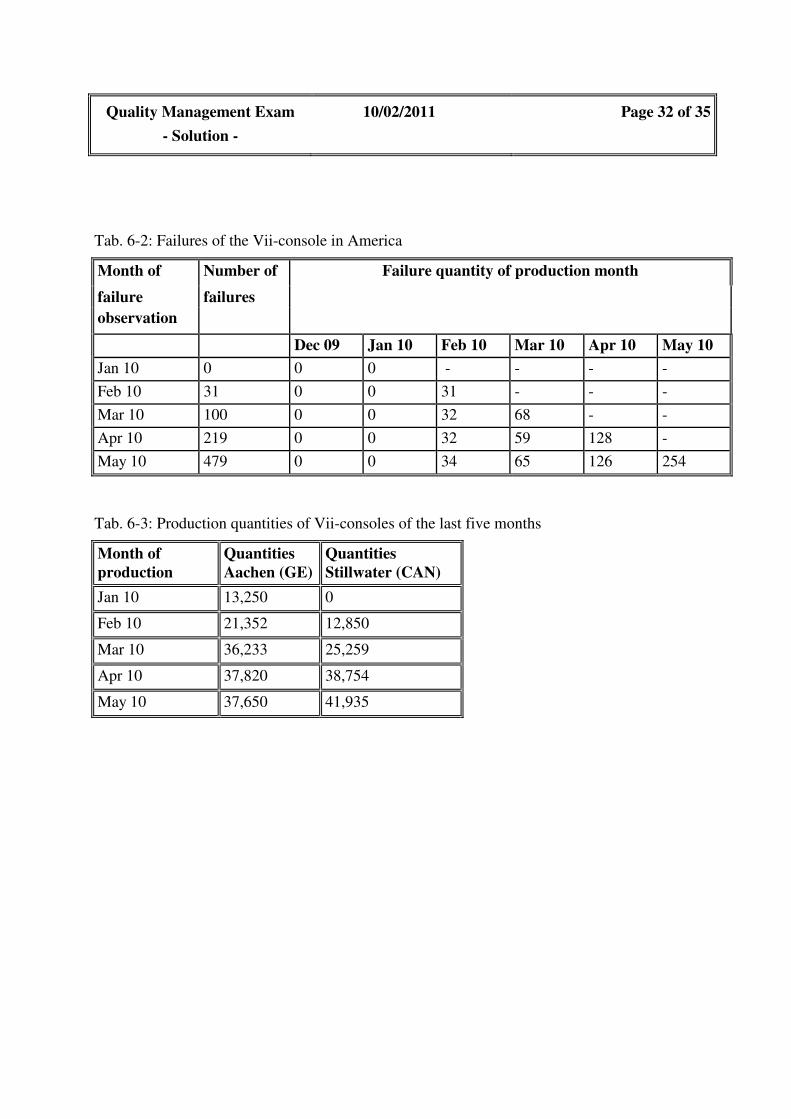
In tab. 6-1 and tab. 6-2 the failures of the Vii-console in Europe and America are given.
In tab. 6-3 the production quantities of the Vii-console for both manufacturing sites are given.
Tab. 6-1: Failures of the Vii-console in Europe
Month of Number of
failure failures
observation
Failure quantity of production month
Dec 09 Jan 10 Feb 10 Mar 10 Apr 10 May 10
Jan 10 35 3 32 - - - -
Feb 10 70 5 37 28 - - -
Mar 10 126 17 29 32 48 - -
Apr 10 157 19 34 29 53 22 -
May 10 165 22 33 26 53 19 12
Quality Management Exam
- Solution -
10/02/2011 Page 32 of 35
Tab. 6-2: Failures of the Vii-console in America
Month of Number of
failure failures
observation
Failure quantity of production month
Dec 09 Jan 10 Feb 10 Mar 10 Apr 10 May 10
Jan 10 0 0 0 - - - -
Feb 10 31 0 0 31 - - -
Mar 10 100 0 0 32 68 - -
Apr 10 219 0 0 32 59 128 -
May 10 479 0 0 34 65 126 254
Tab. 6-3: Production quantities of Vii-consoles of the last five months
Month of
production
Quantities
Aachen (GE)
Quantities
Stillwater (CAN)
Jan 10 13,250 0
Feb 10 21,352 12,850
Mar 10 36,233 25,259
Apr 10 37,820 38,754
May 10 37,650 41,935

Quality Management Exam
- Solution -
10/02/2011 Page 33 of 35
a) Please determine the necessary figures for the tables of failure statistics and fill them in.
(tab. 6-4 and 6-5). Mark the line of same age for products that have not exceeded an age
of three months at the time of their failure within both tab. 6-4 and 6-5 (<3-line).
Please fill in the figures with an accuracy of two decimal places.
(5 points)
European market:
Tab. 6-4: Table of failure statistics of the European market
No. Production
month
Failure quantity since the beginning of the production
month until the end of the monitored month [%]
May 10 Apr 10 Mar 10 Feb 10 Jan 10
1 Jan 10 1.25% 1.00% 0.74%* 0.52% 0.24%
2 Feb 10 0.54% 0.42%* 0.28% 0.13%
3 Mar 10 0.43%* 0.28% 0.13%
4 Apr 10 0.11% 0.06%
5 May 10 0.03%
American market:
Tab. 6-5: Table of failure statistics of the American market
No. Production
month
Failure quantity since the beginning of the production
month until the end of the monitored month [%]
May 10 Apr 10 Mar 10 Feb 10 Jan 10
1 Jan 10 - - - - -
2 Feb 10 1.00% 0.74%* 0.49% 0.24%
3 Mar 10 0.76%* 0.50% 0.27%
4 Apr 10 0.66% 0.33%
5 May 10 0.61%
Points: 23-25 values (4 points), 18-22 values (3 points), 12-17 values (2 points), 5-11 values (1 point),
0.5 points for each <3-month-line*

Quality Management Exam
- Solution -
10/02/2011 Page 34 of 35
b) Please label the axes of the isochronous diagram (picture 6-2)
and enter the calculated failures. Connect the appropriate points to isochronous graphs.
Please draw the isochronous graphs separately for both markets. (4 points)
Please use a straight edge and use different formats for the isochronous graphs of the two
markets!
For example:
Europe: ______
o________
o_______
America: ------X-------X-------
Picture 6-2: Isochronous diagram
(1 point for the correct labelling of the axes, 1.5 points for correctly sketching the isochronous
graphs for Europe, 1.5 points for correctly sketching the isochronous graphs for America)
Fai
lure
rat
e [%
]
Production month (2010)
January February March April May
0.20
0.40
0.60
0.80
1.00
1.20
0.00
1.40
x
x x
x x
x
x x
x
x
Fai
lure
rat
e [%
]
Production month (2010)
January February March April May
0.20
0.40
0.60
0.80
1.00
1.20
0.00
1.40
x
x x
x x
x
x x
x
x

Quality Management Exam
- Solution -
10/02/2011 Page 35 of 35
c) Please interpret the resulting curve with regard to three issues:
1. Failure development in Europe
2. Failure development in America
3. Production strategy of the Nindento GmbH
(3 points)
1) After January 2010, the “European” Isochronous graphs show a continuous
decreasing trend. This illustrates that an effective continuous improvement process is in
place on the German manufacturing site. (1 point)
2) Vii-console production starts in February 2010 in Stillwater (Canada). The
isochronous graphs show an increasing trend in the following months. This illustrates an
increasing number of production failures. (1 point)
3) In the beginning, the production quality in Canada is equal to the German production
in the previous month. This becomes visible by comparing the isochronous graph at start
of production in Canada (Feb. 2010) with the „European“ graphs in January 2010.
After the German employees leave the Canadian site after one month the failures
increase. This leads to the evidence, that the qualification of the employees and processes
in Canada is not sustainable. (1 point)
d) Please name two measures to react to the development of failures in America. Keywords
are sufficient. (2 points)
1) German engineers stay in Stillwater for a longer time for the training of employees.
2) Find failure root causes and improve training concepts.
(1 point for each measure)