target (twd): 350.00 upside: 304.00 initiation: pump up...
TRANSCRIPT

See important disclosures, including any required research certifications, beginning on page 17
■ Investment case Airtac International Group (Airtac) is the second-largest manufacturer of pneumatic components (by 2013 sales volume) in China, where it has a 14% market share and derives about 88% of its revenue. We forecast a solid net-profit CAGR of 19% for 2014-16, driven primarily by further market-share gains, and as we expect its business to benefit from a strong automation demand recovery emerging globally. We initiate coverage with an Outperform (2) rating. ■ Catalysts Market-share gains should continue. Airtac’s competitive pricing strategy, along with moves to increase its number of product stock-keeping units (SKU) and sales offices, have driven market-share gains since 2011. The company
targets to expand its China market share further to 20% by 2020, vs. 16-17% forecast by us for 2014-15. Our analysis shows Airtac’s total sales have a weak correlation with China’s purchasing managers’ index (PMI). Rather, we believe its sales growth and market-share gains over the past 2-3 years reflect the industry’s focus on improving product quality rather than increasing output, amid China’s rising factory automation trend. Beneficiary of a demand recovery. Our industry research indicates that global demand for pneumatic equipment is in the middle of a recovery cycle, which we expect to last for about 24 months, providing a favourable backdrop for Airtac. ■ Valuation Our 6-month target price of TWD350 is based on our 2014E EPS and a 32x PER, its past-4-year peak multiple. We believe Airtac merits a re-rating to this PER as we expect a higher net-profit CAGR of 19% for 2014-16, vs. 13% for 2012-13. Airtac trades at a premium to its closest global peer, SMC of Japan, on 2014-15E PER and PEG, yet this looks warranted given Airtac’s higher 2014-16E net-profit CAGR (19% vs. 17% for SMC) and higher
2014E dividend yield (2% vs. 1% for SMC) on Daiwa’s forecasts. ■ Risks Key risks are weaker-than-expected pneumatic equipment demand in China and greater-than-expected CNY depreciation vs. the TWD.
Industrials / Taiwan1590 TT
15 April 2014
Airtac International Group
Initiation: pump up the volume
• Ramp-up in volume expected to continue and help drive a 19% net-profit CAGR for 2014-16
• Stands to benefit from China’s strong automation demand, and from replacement demand likely kicking in over 2014-15
• Strong earnings-growth should support a PER re-rating; initiating with Outperform rating and target price of TWD350
Source: FactSet, Daiwa forecasts
Industrials / Taiwan
Airtac International Group1590 TT
Target (TWD): 350.00Upside: 15.1%14 Apr price (TWD): 304.00
BuyOutperform (initiation)
HoldUnderperformSell
1
2
3
4
5
80
119
158
196
235
100
164
228
291
355
Apr-13 Jul-13 Oct-13 Jan-14
Share price performance
ATIG (LHS) Relative to TWSE Index (RHS)
(TWD) (%)
12-month range 129.90-352.00Market cap (USDbn) 1.723m avg daily turnover (USDm) 9.98Shares outstanding (m) 171Major shareholder Ding Kan Invest Ltd. (14.9%)
Financial summary (TWD)Year to 31 Dec 14E 15E 16ERevenue (m) 8,786 11,078 13,028Operating profit (m) 2,683 3,417 4,071Net profit (m) 1,874 2,394 2,874Core EPS (fully-diluted) 10.991 14.039 16.855EPS change (%) 9.6 27.7 20.1Daiwa vs Cons. EPS (%) (8.0) (6.3) (3.6)PER (x) 27.7 21.7 18.0Dividend yield (%) 2.1 2.3 2.3DPS 6.3 6.9 6.9PBR (x) 5.3 4.7 4.5EV/EBITDA (x) 18.4 14.1 12.2ROE (%) 20.2 23.2 25.7
Christine Wang(886) 2 8758 6249
John Lai(886) 2 8758 [email protected]
How do we justify our view?How do we justify our view?

Industrials / Taiwan 1590 TT
15 April 2014
- 2 -
Growth outlook Airtac: net profit and YoY growth
We forecast a 19% net profit CAGR for Airtac over 2014-16, on the back of a 21% revenue CAGR, a stable gross margin and mild operating margin expansion. We expect this top-line and bottom-line growth to be driven by market-share gains in China, amid growth in the country’s automation demand.
Source: Company, Daiwa forecasts
Valuation Airtac: 1-year forward PER bands
Our 6-month target price of TWD350 is based on our 2014E EPS and a 32x target PER, corresponding to Airtac’s peak past-4-year trading PER. We believe Airtac deserves to be re-rated to this multiple over the next 6 months, as we forecast a higher net profit CAGR of 19% for 2014-16, vs. a 13% CAGR reported for 2012-13. Our analysis shows a high correlation, especially since mid-2013, between Airtac’s share-price performance and that of its closest Taiwan peer, Hiwin Technologies (Hiwin) (2049 TT, TWD294.5, Buy[1]), with a correlation coefficient as high as 0.97. We see this high correlation continuing this year given our positive earnings growth outlook for both companies.
Source: TEJ, Daiwa forecasts
Earnings revisions Airtac: consensus 2014-15E EPS revisions
The Bloomberg consensus raised its 2014-15 EPS forecasts for Airtac during 2H13 on expectations of a better outlook for the overall automation sector for 2014. Year-to-date, the consensus 2014 EPS forecast has been stable, while that for 2015 has risen slightly. Our 2014-16 EPS forecasts are 4-8% below those of the consensus, but we believe this reflects our more cautious operating margin assumptions.
Source: Bloomberg
How do we justify our view?
Growth outlook
Valuation
Earnings revisions
(40%)
(20%)
0%
20%
40%
60%
80%
100%
120%
140%
0
500
1,000
1,500
2,000
2,500
3,000
3,500
2008 2009 2010 2011 2012 2013 2014E 2015E 2016E
Net profit (LHS) YoY (RHS)
(TWDm)
0
100
200
300
400
500
Dec-
10
Mar
-11
Jun-
11
Sep-
11
Dec-
11
Mar
-12
Jun-
12
Sep-
12
Dec-
12
Mar
-13
Jun-
13
Sep-
13
Dec-
13
Mar
-14
Jun-
14
Sep-
1414x 20x 26x 32x Airtac
(TWD)
8
9
10
11
12
13
14
15
16
May
-12
Jul-1
2
Sep-
12
Nov-
12
Jan-
13
Mar
-13
May
-13
Jul-1
3
Sep-
13
Nov-
13
Jan-
14
Mar
-14
2014E 2015E
(TWD)
BuyOutperform (initiation)
HoldUnderperformSell
1
2
3
4
5

Industrials / Taiwan 1590 TT
15 April 2014
- 3 -
Key assumptions
Profit and loss (TWDm)
Cash flow (TWDm)
Source: FactSet, Daiwa forecasts
Year to 31 Dec 2009 2010 2011 2012 2013 2014E 2015E 2016EChina pneumatic market size (USDm) 745 1,203 1,747 1,626 1,870 2,151 2,473 2,844Worldwide pneumatic market size 8,340 11,841 12,890 12,326 13,559 14,914 16,406 18,046Valve annual capacity ('000 units) 3,414 5,031 6,958 8,004 9,701 10,884 14,397 15,583
Year to 31 Dec 2009 2010 2011 2012 2013 2014E 2015E 2016ECylinder 1,095 1,692 2,258 2,356 2,926 3,745 4,867 5,823Valve 910 1,319 1,705 1,674 2,470 3,008 3,909 4,678Other Revenue 856 1,289 1,676 1,638 1,904 2,033 2,302 2,528Total Revenue 2,862 4,299 5,638 5,668 7,300 8,786 11,078 13,028Other income 0 0 0 0 0 0 0 0COGS (1,385) (2,024) (2,719) (2,700) (3,264) (3,930) (4,954) (5,801)SG&A (610) (868) (1,022) (1,273) (1,641) (1,930) (2,400) (2,794)Other op.expenses (88) (44) (114) (179) (201) (243) (308) (362)Operating profit 779 1,363 1,784 1,516 2,195 2,683 3,417 4,071Net-interest inc./(exp.) (56) (45) (22) (35) (39) (153) (175) (175)Assoc/forex/extraord./others 21 67 54 57 211 47 43 42Pre-tax profit 744 1,385 1,816 1,538 2,367 2,576 3,285 3,938Tax (193) (335) (439) (420) (641) (683) (870) (1,044)Min. int./pref. div./others (91) (10) (27) (14) (15) (19) (21) (21)Net profit (reported) 459 1,040 1,350 1,104 1,710 1,874 2,394 2,874Net profit (adjusted) 459 1,040 1,350 1,104 1,710 1,874 2,394 2,874EPS (reported)(TWD) 7.101 6.932 9.001 7.359 10.030 10.991 14.039 16.855EPS (adjusted)(TWD) 7.101 6.932 9.001 7.359 10.030 10.991 14.039 16.855EPS (adjusted fully-diluted)(TWD) 7.101 6.932 9.001 7.359 10.030 10.991 14.039 16.855DPS (TWD) 9.111 0.000 4.807 5.392 3.800 6.300 6.903 6.903EBIT 779 1,363 1,784 1,516 2,195 2,683 3,417 4,071EBITDA 960 1,560 2,051 1,846 2,626 3,106 4,143 4,798
Year to 31 Dec 2009 2010 2011 2012 2013 2014E 2015E 2016EProfit before tax 744 1,385 1,816 1,538 2,367 2,576 3,285 3,938Depreciation and amortisation 182 197 267 330 431 424 726 726Tax paid (193) (335) (439) (420) (641) (683) (870) (1,044)Change in working capital (124) (346) (643) (248) (977) (80) (495) (1,067)Other operational CF items 74 163 103 (143) 249 (7) (8) (8)Cash flow from operations 681 1,064 1,104 1,057 1,429 2,230 2,638 2,546Capex (131) (615) (1,563) (1,713) (2,882) (3,814) (2,770) (1,694)Net (acquisitions)/disposals 0 0 0 (287) 0 (72) (90) (90)Other investing CF items (18) (61) (295) (87) 219 0 1 1Cash flow from investing (149) (677) (1,858) (2,087) (2,663) (3,885) (2,858) (1,782)Change in debt 22 (41) 774 1,419 570 2,900 600 600Net share issues/(repurchases) 47 1,437 0 0 1,960 0 0 0Dividends paid (589) 0 (721) (809) (570) (1,074) (1,177) (1,177)Other financing CF items 0 (114) (151) 61 (74) 0 0 0Cash flow from financing (521) 1,282 (98) 671 1,885 1,826 (577) (577)Forex effect/others 102 (109) 200 (42) (43) 0 0 0Change in cash 114 1,561 (652) (401) 608 171 (797) 187Free cash flow 550 449 (459) (656) (1,453) (1,583) (132) 853
Financial summary

Industrials / Taiwan 1590 TT
15 April 2014
- 4 -
Balance sheet (TWDm)
Key ratios (%)
Source: FactSet, Daiwa forecasts
Company profile
Founded in 1988, Airtac is the second-largest manufacturer of pneumatic components in China, with a 14% market share based on sales volume for 2013. Its key products include cylinder, valves, and filters, regulators and lubricators (FRL). The company has its own product brand, AirTAC, and also provides after-sales services that include installation, maintenance, etc.
As at 31 Dec 2009 2010 2011 2012 2013 2014E 2015E 2016ECash & short-term investment 354 1,915 1,462 1,086 1,591 1,742 923 1,088Inventory 532 699 986 1,079 1,543 1,578 1,900 2,162Accounts receivable 753 1,056 1,435 1,620 2,288 2,352 2,732 3,213Other current assets 72 82 135 144 100 116 150 140Total current assets 1,711 3,751 4,018 3,929 5,521 5,788 5,705 6,602Fixed assets 2,544 2,791 4,283 5,628 8,106 11,488 13,567 13,138Goodwill & intangibles 0 0 0 0 0 0 0 0Other non-current assets 124 168 261 594 889 967 1,264 1,464Total assets 4,380 6,710 8,561 10,152 14,516 18,243 20,535 21,204Short-term debt 101 608 1,771 3,232 3,044 3,144 3,244 3,244Accounts payable 298 524 508 543 774 793 1,000 1,170Other current liabilities 942 174 269 279 362 362 631 601Total current liabilities 1,340 1,307 2,548 4,054 4,179 4,298 4,874 5,015Long-term debt 446 667 258 236 993 3,793 4,293 4,293Other non-current liabilities 155 203 241 181 300 309 309 309Total liabilities 1,941 2,177 3,048 4,471 5,473 8,400 9,476 9,617Share capital 647 1,500 1,500 1,500 1,705 1,705 1,705 1,705Reserves/R.E./others 1,662 2,911 3,866 4,034 7,194 7,994 9,210 9,738Shareholders' equity 2,309 4,411 5,366 5,534 8,899 9,699 10,915 11,443Minority interests 129 122 147 147 144 144 144 144Total equity & liabilities 4,380 6,710 8,561 10,152 14,516 18,243 20,535 21,204EV 52,154 51,314 52,547 54,361 54,422 57,171 58,590 58,425Net debt/(cash) 193 (640) 568 2,382 2,446 5,195 6,614 6,448BVPS (TWD) 35.695 29.407 35.776 36.891 52.193 56.884 64.020 67.117
Year to 31 Dec 2009 2010 2011 2012 2013 2014E 2015E 2016ESales (YoY) 5.4 50.2 31.2 0.5 28.8 20.3 26.1 17.6EBITDA (YoY) 22.3 62.4 31.4 (10.0) 42.2 18.3 33.4 15.8Operating profit (YoY) 26.2 75.0 30.9 (15.0) 44.8 22.2 27.4 19.2Net profit (YoY) 29.1 126.3 29.8 (18.2) 54.9 9.6 27.7 20.1Core EPS (fully-diluted) (YoY) 29.1 (2.4) 29.8 (18.2) 36.3 9.6 27.7 20.1Gross-profit margin 51.6 52.9 51.8 52.4 55.3 55.3 55.3 55.5EBITDA margin 33.6 36.3 36.4 32.6 36.0 35.4 37.4 36.8Operating-profit margin 27.2 31.7 31.6 26.7 30.1 30.5 30.8 31.3Net profit margin 16.1 24.2 23.9 19.5 23.4 21.3 21.6 22.1ROAE 22.5 30.9 27.6 20.3 23.7 20.2 23.2 25.7ROAA 10.8 18.8 17.7 11.8 13.9 11.4 12.3 13.8ROCE 24.7 31.0 26.7 18.2 19.7 18.0 19.3 21.6ROIC 20.2 31.7 27.1 15.6 16.4 14.9 15.4 16.8Net debt to equity 8.3 net cash 10.6 43.0 27.5 53.6 60.6 56.4Effective tax rate 26.0 24.2 24.2 27.3 27.1 26.5 26.5 26.5Accounts receivable (days) 82.8 76.8 80.6 98.4 97.7 96.4 83.7 83.3Current ratio (x) 1.3 2.9 1.6 1.0 1.3 1.3 1.2 1.3Net interest cover (x) 13.9 30.3 81.4 43.8 56.8 17.5 19.5 23.3Net dividend payout 165.7 0.0 69.3 59.9 51.6 62.8 62.8 49.2Free cash flow yield 1.1 0.9 n.a. n.a. n.a. n.a. n.a. 1.6
Financial summary continued …

Industrials / Taiwan 1590 TT
15 April 2014
- 5 -
Pump up the volume
We expect Airtac to benefit from a demand recovery for pneumatic components and see further ramp-up in volume in the next few years.
Favourable demand outlook
Pneumatic-equipment demand is in the middle of a recovery cycle Based on our industry analysis, we believe global demand for pneumatic equipment is in the middle of a recovery cycle, which started in July 2013. We believe the current recovery cycle is likely to extend for about 24 months (compared to 18 months on average for previous upcycles), as our research across the supply chain shows that demand is recovering at a stronger pace compared to 2 months ago, and given favourable forward indicators for industry areas and markets that we go on to describe. Trend in global pneumatic-equipment demand growth (YoY %)
Source: Japan Fluid Power Association (JFPA)
China’s pneumatic-components market still has strong scope for growth China’s market for pneumatic components is still much smaller in size (in terms of revenue) compared to those of developed regions. The size of the China market equated to only 55% and 70% of that of the US and Japan markets, respectively, for 2012 (the most recent year for which a comparison is available), according to Japan pneumatic-components player SMC. We believe the persistent shortage of manufacturing labour
capacity in much of China will trigger a shift towards more automation in factories in the coming years, thereby driving up the size of the country’s pneumatic-components market. As Airtac is China’s second-largest manufacturer of pneumatic components by 2013 sales volume, with a 14% market share (behind SMC [6273 JP, JPY24605, Hold (3)] with about a 31% share), it looks well-placed to benefit from this trend, in our view. Pneumatic-components market size by region (2012)
Source: SMC, Daiwa estimates
Further evidence of the potential for the China market comes from the outlook for the market for industrial robots, which is one of the segments of the pneumatic-component market. China’s market for industrial robots was the world’s fastest-growing one over 2005-12, with a shipment CAGR of 25%. The International Federation of Robotics (IFR) projects China’s industrial-robots market to see shipments expand at a further 15% CAGR for 2014-16, compared with 4-6% for both North America and Japan (as the next chart shows). According to the IFR, China should become the world’s largest industrial-robots market in terms of shipments in 2015 (overtaking Japan, currently in the top spot), as its shipments should continue to rise over 2014-15, pointing to the substantial further growth potential for factory automation in China. A major reason for this is that industrial-robot density is still very low in China compared with developed countries. Take the technology sector, for example: industrial-robot density in China is only 5 robots per 10,000 workers, much lower than the ratios of 200 workers in the US and 1,180 in Japan, based on the IFR’s data for 2010.
(100)
(50)
0
50
100
150
Feb-
00
Oct
-00
Jun-
01
Feb-
02
Oct
-02
Jun-
03
Feb-
04
Oct
-04
Jun-
05
Feb-
06
Oct
-06
Jun-
07
Feb-
08
Oct
-08
Jun-
09
Feb-
10
Oct
-10
Jun-
11
Feb-
12
Oct
-12
Jun-
13
0
500
1,000
1,500
2,000
2,500
3,000
3,500
4,000
4,500
China US Japan Europe Southeast Asia
(USDm)

Industrials / Taiwan 1590 TT
15 April 2014
- 6 -
Shipment growth for multi-purpose industrial robots
Source: IFR, national robot associations
Industrial-robot density for technology sector in 2010 (no. of robots per 10,000 workers)
Source: IFR
Also, within China’s machine tool market, the size of the metal cutting segment by revenue increased at about a 21% CAGR over 2001-10, and the Industrial Economics & Knowledge Centre (IEK) forecasts it to rise at a further 20% CAGR over 2011-15. This supports our view that demand for factory automation in China should remain strong over the next few years. China machine-tool market: annual revenue trend
Source: IEK
Airtac should see further market-share expansion
Airtac’s revenue drivers are rising factory automation and market-share gains China is Airtac’s main market, accounting for about 88% of its total revenue for 2013. China’s PMI (compiled by HSBC of China) has fallen to below the 50 level since January this year, raising questions among some investors about Airtac’s business outlook in the country. This is because some believe there is a close correlation between Airtac’s overall sales and the China PMI. However, our analysis shows there has been a weak correlation between Airtac’s monthly group revenue trend and the PMI over the past 2-3 years. Rather, we believe the company’s revenue growth over this period has been driven by market-share gains amid China’s expanding demand for factory automation, with the industry focusing on enhancing product quality rather than increasing output. For instance, from January to August 2012, the China PMI declined but Airtac’s monthly group revenue increased. During 2013, Airtac’s monthly group revenue remained resilient, despite a fall in the PMI from early in the year. The following chart displays this lack of a close correlation. Monthly trend in China PMI vs. Airtac’s total revenue
Source: TEJ, Bloomberg, Company
We believe this lack of a correlation between China’s PMI and Airtac’s revenue in the country can be explained by the following. Our industry research indicates that more and more manufacturing production lines in China are starting to implement automation in order to deliver consistent product quality or improvements in quality, but not necessarily to increase their output. As factory owners in China have generally faced high labour turnover rates over
(15%)
(10%)
(5%)
0%
5%
10%
15%
20%
2012 2013E 2014E 2015E 2016E
Worldwide North America Japan China Germany
(YoY)
1,180
1,000
240 200
5 4 0
200
400
600
800
1,000
1,200
1,400
Japan Korea Germany US China Brazil
(No.)
0
50
100
150
200
250
300
350
400
450
2001
2002
2003
2004
2005
2006
2007
2008
2009
2010
2011
E
2012
E
2013
E
2014
E
2015
E
(CNYbn)
Metal cutting Metal forming
44
46
48
50
52
54
56
020406080
100120140160180
Dec-
10
Feb-
11
Apr-1
1
Jun-
11
Aug-
11
Oct
-11
Dec-
11
Feb-
12
Apr-1
2
Jun-
12
Aug-
12
Oct
-12
Dec-
12
Feb-
13
Apr-1
3
Jun-
13
Aug-
13
Oct
-13
Dec-
13
Feb-
14
Airtac monthly sales (LHS) China PMI (RHS)
(CNY) (Index level)

Industrials / Taiwan 1590 TT
15 April 2014
- 7 -
the past 2-3 years, which has led to high costs to train new staff and has tended to result in an inconsistent product quality, moves to address this situation by raising levels of factory automation should continue to drive growth in demand for Airtac’s products within the automation supply chain. China market-share on an uptrend We expect Airtac to enjoy continuous market-share gains in China over the next few years. We forecast the company’s market share by shipments to increase to 16-17% for 2014-15, from 14% for 2013 and 11% for 2010. The company aims to have a 20% market share by 2020. Airtac: shipment market share in China
Source: Company, Daiwa forecasts
The main reasons why we expect this are as follows.
• Flexible pricing strategy. In general, Airtac’s products are priced currently at about a 30% discount to those of SMC, its key competitor in the China market. This strategy has helped Airtac to win China customers who are price-sensitive.
• Expanding product portfolio. The company aims to increase its product SKUs in order to cover more sub-sectors in terms of end applications. It aims to increase its number of SKUs to 70% of SMC’s total number by 2016-18, up from about 30% at the end of 2013. As such, we forecast Airtac’s number of product SKUs to rise to 110,000 for 2016, from 80,000 for 2013. This should help the company to broaden its business to different kinds of end applications and hence increase its customer base.
Airtac: number of SKUs
Source: Company, Daiwa forecasts
• Brand image and increasing channel coverage. We believe the company’s AirTAC brand is perceived as a premium one compared with those of the China companies, due to the company’s timely customer service and product quality. Airtac is expanding the number of its sales offices in China to 100 by the end of 2014 (compared with 49 in 2011). This, together with its planned increase in the number of product SKUs, should enable the company to expand its customer pool in China, driving market-share gains.
China: pneumatic-equipment players’ market shares
Source: Company (Airtac’s annual reports)
New demand is coming mainly from price-sensitive customers New product demand (ie, as opposed to replacement demand) accounted for about 60% of Airtac’s sales for 2013. We believe the company would be less vulnerable than competitors if demand were to slow, due mainly to the following considerations:
• The 30% price discount between Airtac’s products and those of SMC in China (the company’s key competitor in its key market) should help the company gain market share among more price-sensitive customers in China.
0%
2%
4%
6%
8%
10%
12%
14%
16%
18%
2010 2011 2012 2013 2014E 2015E
0
20
40
60
80
100
120
2011 2012 2013 2014E 2015E 2016E
23%
30% 31% 31%
12% 11% 12% 13%12%10% 9% 9%
0%
5%
10%
15%
20%
25%
30%
35%
2009 2010 2011 2012
SMC Airtac Festo

Industrials / Taiwan 1590 TT
15 April 2014
- 8 -
• The continued expansion of end applications should help Airtac win customers in new fields.
From the following chart, we can see that SMC’s sales dropped during the financial crisis from 2008-09, while Airtac achieved YoY revenue growth over the period. The same was true for 2012 as well. Airtac vs. SMC: revenue (YoY)
Source: Company data, Daiwa estimates
Stable margins
Reduced costs and new-product launches Airtac expects its gross margin to remain at about 55% over the next 3 years as a result of continuing efforts to reduce costs. It also guides for the operating margin to be maintained at 30% or above over the same period. We see several positive factors supporting the company’s gross margin.
• Automation. Airtac is replacing labour with automated equipment at its own production plants. Currently, only about 50% (only the ones that could be automated) of its process steps have been automated. Hence, there is considerable scope to improve in this area.
Airtac: automation rate vs. gross margin
Source: Company, Daiwa forecasts
• Vertical integration. Airtac’s vertical integration into key components should reduce costs and result in improved quality control. Currently, about 90% of the company’s key components are sourced in-house and aluminium extrusion capacity can meet 70% of its demand.
Airtac: vertical integration model
Source: Company
• New-product launches. The company continues to launch new products, which usually carry better profitability and generally have higher gross margins than its existing range of products. It launched several products in 4Q13, including a precision-slide cylinder, a rod-less cylinder, and an integrated cylinder, all of which are used in the auto industry.
A higher operating margin than SMC Airtac’s operating margin has been higher than that of SMC since 2009, despite Airtac’s products being priced about 30% lower than SMC’s. This shows Airtac’s superior cost-reduction capability, in our view. Airtac vs. SMC: operating margins
Source: Company
(60%)
(40%)
(20%)
0%
20%
40%
60%
80%
2008 2009 2010 2011 2012 2013
SMC Airtac
50%
51%
52%
53%
54%
55%
56%
0%
5%
10%
15%
20%
25%
30%
35%
40%
45%
2011 2012 2013 2014E
Automation (LHS) Gross margin (RHS)
0%
5%
10%
15%
20%
25%
30%
35%
2007 2008 2009 2010 2011 2012 2013
Airtac (1590 TT) SMC (6273 JP)

Industrials / Taiwan 1590 TT
15 April 2014
- 9 -
2014 revenue and earnings outlook
• Airtac guides for 15-20% YoY revenue growth for this year, with a stable gross margin.
• It expects the operating margin to be more than 30% this year. We expect to see a slight improvement in the company’s operating leverage (in view of our positive business outlook and new applications from different sectors) even though the company is still in a rapid-expansion phase. We forecast a 30.5% operating margin for 2014.
We forecast a 19% net-profit CAGR over 2014-16 on the back of 21% revenue CAGR, a stable gross margin and a mild upward trend in the operating margin. Airtac: net profit and YoY growth
Source: Company, Daiwa forecasts
Valuation and target price
Initiating with an Outperform rating and a target price of TWD350 We initiate coverage of Airtac with an Outperform (2) rating. We forecast a strong net-profit CAGR of 19% over 2014-16 on the back of continuous market-share gains, resulting from a competitive pricing strategy, an increasing number of product SKUs, and a rise in the number of sales offices, against a favourable industry backdrop. We set a 6-month target price for Airtac of TWD350. This is based on our 2014 EPS forecast, to which we assign a target PER of 32x, which is equivalent to the stock’s past-4-year high. We believe Airtac deserves a re-rating from its current trading 2014E PER of 27.7x, given our higher net-profit CAGR of 19% for 2014-16E, compared with a CAGR of only 13% reported over 2012-13.
Our PER-based method used to derive our target price is supported by our DCF model, which shows a fair value per share of TWD348 (assuming a WACC of 8.7% and a terminal growth rate of 1%). In addition, we expect Airtac to start generating positive free cash flow from 2016. Currently, the company is generating negative free cash flow due to its high investments in manufacturing plants in both China and Taiwan. We expect the re-rating of Taiwan’s automation sector to continue this year. The sector’s trailing PER has increased from a range of 17-18x for 2012 on average to an average PER of 22x currently. However, as we believe we are only in the middle of a demand-recovery cycle, we expect the re-rating to go on, supporting also a re-rating of Airtac. In terms of a peer multiples comparison, we look at Airtac specifically alongside SMC of Japan. We consider SMC as Airtac’s closest Pan-Asia peer, given SMC is Airtac’s main competitor in China, a key market for both companies and where both companies have high revenue exposure. Based on Daiwa’s forecasts, Airtac trades currently at a premium to SMC on a PER and PEG basis for 2014-15E. Yet Daiwa’s forecasts call for Airtac to deliver a higher a net-profit CAGR for 2014-16 of 19% (compared with 17% for SMC) and imply a higher 2014 dividend yield for Airtac at current share prices (2% compared with 1% for SMC). High share-price correlation with Hiwin Our analysis shows that there has been a high correlation between the share-price performances of Airtac and Hiwin, especially since mid-2013. The correlation coefficient between mid-2013 and now has reached as high as 0.97. We believe this is due to the following reasons: 1) there are more analysts covering Airtac (19 now compared with 11 prior to mid-2013 based on Bloomberg data), so that more investors compare this company with Hiwin, and 2) Airtac has more foreign investors: its QFIIs’ total shareholding is currently 36%, which is higher than Hiwin’s 31%, though we believe share buying by QFIIs has benefitted both stocks given the increasing tendency to compare the 2 companies. We expect Airtac’s share price to continue to follow that of Hiwin in the coming months, even though we believe Hiwin has better exposure internationally (Europe contributes 25 % of Hiwin’s total sales) compared with Airtac (which depends on China for about 88% of its sales).
(30%)
(20%)
(10%)
0%
10%
20%
30%
40%
50%
60%
0
500
1,000
1,500
2,000
2,500
3,000
3,500
2012 2013 2014E 2015E 2016E
Net profit (LHS) YoY (RHS)
(TWDm)

Industrials / Taiwan 1590 TT
15 April 2014
- 10 -
Airtac vs. Hiwin: share-price comparison (absolute terms)
Source: TEJ
Airtac: share-price premium to Hiwin
Source: TEJ
Limited concerns about account receivables from China Airtac’s accounts receivable equate to about 3 months currently, and of these we estimate that a maximum of two-thirds would be at risk if China were to face a
challenging credit environment. However, we do not foresee issues with the company’s accounts receivable from China this year, because our market research suggests that demand for its products will continue to be solid and that there will not be an over-supply situation this year.
Investment risks
• The main risk we see to our positive investment case for Airtac relates to the company’s exposure to China. As about 88% of Airtac’s revenue comes from China, weaker-than-expected demand for automation equipment in that market would likely result in lower earnings growth for the company compared with our current expectations and a contraction in its PER multiple.
• Higher-than-expected salary increases in China might lead to gross and operating margin contraction, as there are still some process steps that cannot be automated.
• An unfavourable capex cycle would also affect the company’s earnings growth negatively, even though replacement demand accounts for about 40% of Airtac’s sales currently.
• Greater depreciation of the Renminbi versus the New Taiwan Dollar compared to Daiwa’s current expectations would be negative for Airtac given its significant revenue exposure to China.
Airtac: forward 1-year PER bands Airtac: trailing 1-year PBR bands
Source: TEJ, Daiwa forecasts
Source: TEJ, Daiwa forecasts
0
50
100
150
200
250
300
350
400
26-Jun-09 26-Jun-10 26-Jun-11 26-Jun-12 26-Jun-13
Hiwin 2049 TT Airtac 1590 TT
(TWD)
(15)
(10)
(5)
0
5
10
15
20
1-Au
g-13
15-A
ug-1
3
29-A
ug-1
3
12-S
ep-1
3
26-S
ep-1
3
10-O
ct-1
3
24-O
ct-1
3
7-No
v-13
21-N
ov-1
3
5-De
c-13
19-D
ec-1
3
2-Ja
n-14
16-J
an-1
4
30-J
an-1
4
13-F
eb-1
4
27-F
eb-1
4
13-M
ar-1
4
27-M
ar-1
4
(%)
0
100
200
300
400
500
Dec-
10
Mar
-11
Jun-
11
Sep-
11
Dec-
11
Mar
-12
Jun-
12
Sep-
12
Dec-
12
Mar
-13
Jun-
13
Sep-
13
Dec-
13
Mar
-14
Jun-
14
Sep-
14
14x 20x 26x 32x Airtac
(TWD)
0
100
200
300
400
500
Dec-
10
Mar
-11
Jun-
11
Sep-
11
Dec-
11
Mar
-12
Jun-
12
Sep-
12
Dec-
12
Mar
-13
Jun-
13
Sep-
13
Dec-
13
Mar
-14
Jun-
14
Sep-
14
3x 4.5x 6x 7.5x Airtac
(TWD)

Industrials / Taiwan 1590 TT
15 April 2014
- 11 -
Airtac and peers: valuation comparison
Bloomberg
Share price (lc) Target Daiwa Mkt cap
Daily turnover
PER (x) PEG ratio
EPS growth (%) ROE (%) PBR (x)
Dividend yield
Company code 14-Apr-2014 price (lc) rating (USDm) (USDm) 2013E 2014E 2015E 2014E 2014E 2015E 2013E 2014E 2015E 2013E 2014E 2015E 2013E 2014E
Taiwan peers
Airtac 1590 TT 304 350 Outperform 1818 10 29 28 22 1.7 4% 28% 24% 20% 23% 3.7 5.4 4.7 3% 2%Hiwin 2049 TT 294.5 385 Buy 2551 25 37 24 20 0.8 46% 20% 20% 24% 24% 4.6 5.4 4.5 1% 1%Chroma ATE 2360 TT 73 75 Outperform 921 7 23 19 15 0.8 16% 30% 16% 18% 22% 2.8 3.1 2.9 4% 4%Delta Electronics 2308 TT 180 195 Outperform 14688 40 25 21 18 1.2 19% 16% 20% 21% 23% 3.5 4.2 3.9 4% 3%ADVANTECH 2395 TT 199 140 Sell 3723 6 27 25 22 2.0 10% 14% 23% 23% 25% 4.6 5.5 5.0 3% 4%TECO 1504 TT 33.2 NA NR 2207 5 17 15 14 1.7 10% 9% 9% 10% 10% 1.4 1.5 1.4 4% 4%Average 26.2 22.0 18.4 1.4 17% 19% 19% 20% 21% 3.4 4.2 3.7 3% 3% Global peers Fanuc 6954 JP 17865 21000 Outperform 42285 707 25 33 26 4.5 -12% 27% 12% 9% 11% 2.9 3.0 2.8 1% 1%NSK 6471 JP 1029 1100 Hold 5715 96 35 16 13 0.2 119% 21% 5% 11% 12% 1.7 1.6 1.4 1% 1%SMC 6273 JP 24605 24000 Hold 16749 188 26 20 20 1.2 32% 2% 10% 12% 11% 2.2 2.2 2.0 1% 1%THK 6481 JP 2174 3000 Outperform 2833 100 28 19 16 0.5 50% 21% 5% 7% 8% 1.5 1.4 1.3 1% 1%Yaskawa Electric 6506 JP 1293 NA NR 3220 140 48 20 16 0.2 140% 26% 6% 14% 15% 2.8 2.5 2.2 1% 1%OMRON 6645 JP 3835 4000 Hold 8584 143 28 18 16 0.5 56% 12% 9% 12% 12% 2.0 2.1 1.9 1% 1%NABTESCO 6268 JP 2215 2300 Hold 2790 70 21 19 17 1.5 9% 17% 12% 12% 12% 2.5 2.3 2.1 2% 2%SIASUN 300024 CH 52.2 NA NR 2534 10 62 40 30 0.9 57% 31% 17% 19% 21% 7.0 7.8 6.3 0% 0%Emerson EMR US 65.4 NA NR 45954 8 24 17 16 0.7 36% 11% 19% 24% 25% 4.2 4.1 3.8 3% 3%Honeywell HON US 90.9 NA NR 71099 10 18 16 15 1.5 11% 11% 26% 23% 23% 4.1 3.6 3.2 2% 2%Rockwell Automation ROK US 121.5 NA NR 16855 3 22 19 17 1.4 16% 11% 34% 32% 33% 6.6 6.2 5.4 2% 2%ABB ABBN VX 22.5 NA NR 59104 5 19 16 15 1.5 13% 10% 16% 18% 18% 3.0 2.9 2.7 3% 3%Kuka KU2 GY 34.7 NA NR 1627 0 20 19 15 1.1 7% 28% 17% 15% 17% 3.1 2.8 2.4 1% 1%Siemens SIE GY 96.4 NA NR 117276 8 19 14 13 0.6 34% 13% 15% 19% 20% 2.3 2.6 2.4 4% 3%KONTRON KBC GR 5 NA NR 383 0 n.a. n.a. 18 n.a. n.a. n.a. -2% -2% 7% 0.9 1.2 1.1 1% 0%Schneider Electric SU FP 64.3 NA NR 51431 4 19 16 14 1.0 19% 13% 11% 13% 13% 1.9 1.9 1.8 3% 3%IMI IMI LN 1501 NA NR 6810 38 21 17 16 1.1 21% 11% 36% 40% 40% 7.5 7.2 5.8 2% 3%Average 27.2 20.0 17.1 1.2 38% 17% 15% 16% 18% 3.3 3.3 2.9 2% 2%
Source: Bloomberg, Daiwa forecasts
Airtac: quarterly and annual financial statement 2013 2014E 2013 2014E 2015E(TWDm) 1Q 2Q 3Q 4Q 1Q 2Q 3Q 4Q
Net sales 1,447 2,050 2,019 1,784 1,804 2,394 2,361 2,227 7,300 8,786 11,078COGS -671 -917 -893 -783 -809 -1,062 -1,054 -1,004 -3,264 -3,930 -4,954Gross profit 776 1,133 1,126 1,001 995 1,332 1,307 1,222 4,036 4,856 6,124Operating costs -401 -470 -513 -458 -447 -591 -593 -542 -1,841 -2,173 -2,707Operating profit 375 663 613 544 548 741 714 680 2,195 2,683 3,417Non-operating profit -6 71 56 50 -25 -22 -25 -34 211 -107 -132Pre-tax profit 369 735 669 594 523 718 689 646 2,367 2,576 3,285Taxes -106 -191 -177 -167 -139 -190 -183 -171 -657 -702 -891Net profit 262 541 489 417 380 523 501 469 1,710 1,874 2,394
Pre-tax EPS (TWD) 2.5 4.6 4.2 3.5 3.1 4.2 4.0 3.8 13.9 15.1 19.3Net EPS (TWD) 1.7 3.4 3.0 2.4 2.2 3.1 2.9 2.8 10.0 11.0 14.0Outstanding shares (m) 150 161 161 171 171 171 171 171 171 171 171 Operating ratios Gross margins 53.6% 55.3% 55.8% 56.1% 55.2% 55.6% 55.4% 54.9% 55.3% 55.3% 55.3%Operating margin 25.9% 32.3% 30.4% 30.5% 30.4% 30.9% 30.2% 30.6% 30.1% 30.5% 30.8%Pre-tax margin 25.5% 35.8% 33.1% 33.3% 29.0% 30.0% 29.2% 29.0% 32.4% 29.3% 29.6%Net margin 18.1% 26.4% 24.2% 23.4% 21.1% 21.9% 21.2% 21.1% 23.4% 21.3% 21.6% YoY % Net revenue 16% 30% 38% 29% 25% 17% 17% 25% 29% 20% 26%Gross profit 17% 40% 46% 38% 21% 16% 18% 28% 36% 20% 26%Operating income 15% 42% 53% 68% 28% 18% 16% 22% 45% 22% 27%Pre-tax income 7% 62% 69% 73% 42% -2% 3% 9% 54% 9% 28%Net income 12% 63% 70% 69% 45% -3% 2% 12% 55% 10% 28% QoQ % Net revenue 5% 42% -2% -12% 1% 33% -1% -6%Gross profit 7% 46% -1% -11% -1% 34% -2% -6%Operating income 16% 77% -8% -11% 1% 35% -4% -5%Pre-tax income 7% 99% -9% -11% -12% 37% -4% -6%Net income 6% 106% -10% -15% -9% 38% -4% -6%
Source: Company data, Daiwa forecasts
Industrials / Taiwan 1590 TT
15 April 2014
- 12 -
Company background
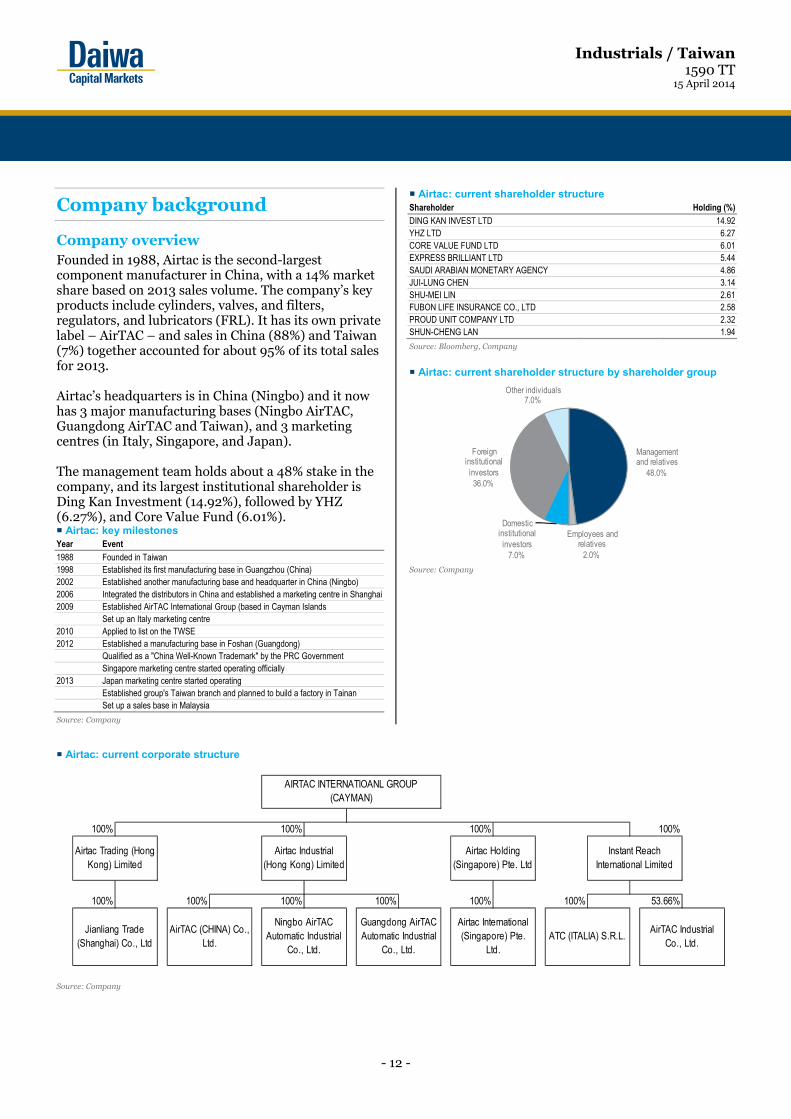
Company overview Founded in 1988, Airtac is the second-largest component manufacturer in China, with a 14% market share based on 2013 sales volume. The company’s key products include cylinders, valves, and filters, regulators, and lubricators (FRL). It has its own private label – AirTAC – and sales in China (88%) and Taiwan (7%) together accounted for about 95% of its total sales for 2013. Airtac’s headquarters is in China (Ningbo) and it now has 3 major manufacturing bases (Ningbo AirTAC, Guangdong AirTAC and Taiwan), and 3 marketing centres (in Italy, Singapore, and Japan). The management team holds about a 48% stake in the company, and its largest institutional shareholder is Ding Kan Investment (14.92%), followed by YHZ (6.27%), and Core Value Fund (6.01%). Airtac: key milestones Year Event 1988 Founded in Taiwan 1998 Established its first manufacturing base in Guangzhou (China) 2002 Established another manufacturing base and headquarter in China (Ningbo)2006 Integrated the distributors in China and established a marketing centre in Shanghai2009 Established AirTAC International Group (based in Cayman Islands
Set up an Italy marketing centre 2010 Applied to list on the TWSE 2012 Established a manufacturing base in Foshan (Guangdong)
Qualified as a "China Well-Known Trademark" by the PRC GovernmentSingapore marketing centre started operating officially
2013 Japan marketing centre started operatingEstablished group's Taiwan branch and planned to build a factory in Tainan Set up a sales base in Malaysia
Source: Company
Airtac: current shareholder structure Shareholder Holding (%)DING KAN INVEST LTD 14.92YHZ LTD 6.27CORE VALUE FUND LTD 6.01EXPRESS BRILLIANT LTD 5.44SAUDI ARABIAN MONETARY AGENCY 4.86JUI-LUNG CHEN 3.14SHU-MEI LIN 2.61FUBON LIFE INSURANCE CO., LTD 2.58PROUD UNIT COMPANY LTD 2.32SHUN-CHENG LAN 1.94
Source: Bloomberg, Company
Airtac: current shareholder structure by shareholder group
Source: Company
Airtac: current corporate structure
Source: Company
Management and relatives
48.0%
Employees and relatives
2.0%
Domestic institutional investors
7.0%
Foreign institutional investors36.0%
Other individuals7.0%
100% 100% 100% 100%
100% 100% 100% 100% 100% 100% 53.66%
ATC (ITALIA) S.R.L.AirTAC Industrial
Co., Ltd.
AIRTAC INTERNATIOANL GROUP (CAYMAN)
Airtac Trading (Hong Kong) Limited
Airtac Industrial (Hong Kong) Limited
Airtac Holding (Singapore) Pte. Ltd
Instant Reach International Limited
Jianliang Trade (Shanghai) Co., Ltd
AirTAC (CHINA) Co., Ltd.
Ningbo AirTAC Automatic Industrial
Co., Ltd.
Guangdong AirTAC Automatic Industrial
Co., Ltd.
Airtac International (Singapore) Pte.
Ltd.

Industrials / Taiwan 1590 TT
15 April 2014
- 13 -
Product overview Airtac is well-known internationally as a pneumatic vendor. Pneumatic systems are used to transmit and control energy by compressing air, which makes them able to drive automotive machines. They are used in many different fields, including electronics, machine tools, packaging, and construction. In general, a pneumatic operation process requires air compressors, FRLs (filter, regulator, and lubricator), valves, and cylinders. In an air compressor, the air is compressed by reducing its volume. Then the compressed air will go through a filter to clear out any impurities before going into the valves. Meanwhile, other FRLs help to achieve appropriate working conditions by ensuring the correct pressure and humidity level. The valve controls the flow of the air current to ensure that it flows in the right direction into the cylinder, pushing the pistons so as to drive the motion of the cylinder, for example in a linear motion. Airtac: revenue breakdown by client industry (2013)
Source: Company
Pneumatic operation process
Source: Company
1) FRLs (10% of 2012 sales, down 6% YoY). These comprise a filter, regulator, and lubricator. Filters are used to remove impurities, preventing them from getting into the components of the pneumatic system. Impurities would affect adversely the moving parts and shorten the life of the components. The regulator is used to stabilise pressure and adjust the operation of components. The lubricator helps lubricate parts so that they move smoothly.
2) Valves (30% of 2012 sales, down 2% YoY). These help control the flow of air between the components. The valves ensure the correct air current inside the components, by means of switches enabling the air current to be turned on and off, or varied inside the component. The valve has many different types of mechanisms (ie, different movement types and strengths) to cater to different manufacturing processes. The valve design can be adapted accordingly.
3) Cylinders (42% of 2012 sales, up 4% YoY). These provide linear or swing motions, such as of an air piston and air motor, to cater to different manufacturing processes.
Airtac: FRL – filter, regulator, and lubricator
Source: Company
Electronic equipment
18.0%
General machinery & machine tool
15.0%
Packaging8.0%
Construction7.0%Automaker
5.0%Battery4.0%
Dress & Accessories
3.0%
Printing3.0%
Other37.0%

Industrials / Taiwan 1590 TT
15 April 2014
- 14 -
Airtac: pneumatic control valves
Source: Company
Airtac: standard cylinder (with valve)
Source: Company
Overseas expansion Airtac’s sales in China accounted for about 88% of the company’s total sales for 2013, and the company aims to reduce this to about 60% by 2016. As a result, it has been concentrating on overseas expansion. Airtac added a branch in Italy in 2009 to win orders in Europe, and set up a Singapore branch in 2012 and a sales base there in 2013 for the Southeast Asia market. In addition, the company opened a branch in Japan in 2013, with the goal of expanding its overseas sales from 12% currently to 40% by 2016. Airtac: overseas expansion roadmap
2006 2007 2008 2009 2010 2011 2012 2013China Italy
SingaporeJapan Malaysia
Source: Company
Airtac: overseas branches and sales offices
Source: Company

Industrials / Taiwan 1590 TT
15 April 2014
- 15 -
Daiwa’s Asia Pacific Research Directory
HONG KONG
Hiroaki KATO (852) 2532 4121 [email protected] Regional Research Head
John HETHERINGTON (852) 2773 8787 [email protected] Regional Deputy Head of Asia Pacific Research
Rohan DALZIELL (852) 2848 4938 [email protected] Regional Head of Product Management
Kevin LAI (852) 2848 4926 [email protected] Deputy Head of Regional Economics; Macro Economics (Regional)
Christie CHIEN (852) 2848 4482 [email protected] Macro Economics (Taiwan)
Jonas KAN (852) 2848 4439 [email protected] Head of Hong Kong Research; Head of Hong Kong and China Property
Grace WU (852) 2532 4383 [email protected] Head of Greater China FIG; Banking (Hong Kong, China)
Jerry YANG (852) 2773 8842 [email protected] Banking (Taiwan); Insurance (Taiwan and China)
Leon QI (852) 2532 4381 [email protected] Banking (Hong Kong, China); Broker (China)
Winston CAO (852) 2848 4469 [email protected] Capital Goods – Machinery (China)
Alison LAW (852) 2532 4308 [email protected] Head of Regional Consumer; Consumer (Hong Kong/China); Gaming and Leisure (Hong Kong, China)
Jamie SOO (852) 2773 8529 [email protected]
Consumer (Hong Kong/China)
Anson CHAN (852) 2532 4350 [email protected]
Consumer (Hong Kong/China)
Eric CHEN (852) 2773 8702 [email protected] Pan-Asia/Regional Head of IT/Electronics; Semiconductor/IC Design (Regional)
Lynn CHENG (852) 2773 8822 [email protected]
IT/Electronics (Semiconductor)
Felix LAM (852) 2532 4341 [email protected] Head of Materials (Hong Kong, China); Cement and Building Materials (China, Taiwan); Property (China)
Dennis IP (852) 2848 4068 [email protected] Power; Utilities; Renewables and Environment (Hong Kong/China)
John CHOI (852) 2773 8730 [email protected] Regional Head of Small/Mid Cap; Small/Mid Cap (Regional); Internet (China)
Jackson YU (852) 2848 4976 [email protected]
Small/Mid Cap (Regional)
Joey CHEN (852) 2848 4483 [email protected] Steel (China)
Kelvin LAU (852) 2848 4467 [email protected] Head of Transportation (Hong Kong, China); Transportation (Regional)
Jibo MA (852) 2848 4489 [email protected] Head of Custom Products Group; Custom Products Group
Thomas HO (852) 2773 8716 [email protected] Custom Products Group
PHILIPPINES
Norman H PENA (63) 2 737 3021 [email protected] Banking/Property
Michael David MONTEMAYOR
(63) 2 737 3023 [email protected]
Consumer/Retail
Patricia PALANCA (63) 2 737 3024 [email protected] Utilities/Mining
SOUTH KOREA
Chang H LEE (82) 2 787 9177 [email protected] Head of Korea Research; Strategy; Banking
Sung Yop CHUNG (82) 2 787 9157 [email protected] Pan-Asia Co-head/Regional Head of Automobiles and Components; Automobiles; Shipbuilding; Steel
Jun Yong BANG (82) 2 787 9168 [email protected] Tyres; Chemicals
Mike OH (82) 2 787 9179 [email protected] Capital Goods (Construction and Machinery)
Sang Hee PARK (82) 2 787 9165 [email protected] Consumer/Retail
Joshua OH (82) 2 787 9176 [email protected] IT/Electronics (Handset Components)
Thomas Y KWON (82) 2 787 9181 [email protected] Pan-Asia Head of Internet & Telecommunications; Software (Korea) – Internet/On-line Game
TAIWAN
Mark CHANG (886) 2 8758 6245 [email protected] Head of Taiwan Research
Steven TSENG (886) 2 8758 6252 [email protected]
IT/Technology Hardware (PC Hardware)
Christine WANG (886) 2 8758 6249 [email protected] IT/Technology Hardware (Automation); Cement; Consumer
Kylie HUANG (886) 2 8758 6248 [email protected] IT/Technology Hardware (Handsets and Components)
INDIA
Punit SRIVASTAVA (91) 22 6622 1013 [email protected] Head of India Research; Strategy; Banking/Finance
Saurabh MEHTA (91) 22 6622 1009 [email protected] Capital Goods; Utilities
SINGAPORE
Adrian LOH (65) 6499 6548 [email protected] Head of Singapore Research, Regional Head of Oil and Gas; Oil and Gas (ASEAN and China); Capital Goods (Singapore)
Benjamin LIM (65) 6321 3086 [email protected]
Oil and Gas (ASEAN and China); Capital Goods (Singapore)
Angeline LOH (65) 6499 6570 [email protected] Banking/Finance, Consumer/Retail
David LUM (65) 6329 2102 [email protected] Property and REITs
Evon TAN (65) 6499 6546 [email protected] Property and REITs
Ramakrishna MARUVADA (65) 6499 6543 [email protected] Head of ASEAN & India Telecommunications; Telecommunications (China, ASEAN & India)
Jame OSMAN (65) 6321 3092 [email protected] Telecom (ASEAN & India); Pharmaceuticals and Healthcare (Singapore)

Industrials / Taiwan 1590 TT
15 April 2014
- 16 -
Daiwa’s Offices
Office / Branch / Affiliate Address Tel Fax
DAIWA SECURITIES GROUP INC
HEAD OFFICE Gran Tokyo North Tower, 1-9-1, Marunouchi, Chiyoda-ku, Tokyo, 100-6753 (81) 3 5555 3111 (81) 3 5555 0661
Daiwa Securities Trust Company One Evertrust Plaza, Jersey City, NJ 07302, U.S.A. (1) 201 333 7300 (1) 201 333 7726
Daiwa Securities Trust and Banking (Europe) PLC (Head Office) 5 King William Street, London EC4N 7JB, United Kingdom (44) 207 320 8000 (44) 207 410 0129
Daiwa Europe Trustees (Ireland) Ltd Level 3, Block 5, Harcourt Centre, Harcourt Road, Dublin 2, Ireland (353) 1 603 9900 (353) 1 478 3469
Daiwa Capital Markets America Inc Financial Square, 32 Old Slip, New York, NY10005, U.S.A. (1) 212 612 7000 (1) 212 612 7100
Daiwa Capital Markets America Inc. San Francisco Branch 555 California Street, Suite 3360, San Francisco, CA 94104, U.S.A. (1) 415 955 8100 (1) 415 956 1935
Daiwa Capital Markets Europe Limited 5 King William Street, London EC4N 7AX, United Kingdom (44) 20 7597 8000 (44) 20 7597 8600
Daiwa Capital Markets Europe Limited, Frankfurt Branch Trianon Building, Mainzer Landstrasse 16, 60325 Frankfurt am Main, Federal Republic of Germany
(49) 69 717 080 (49) 69 723 340
Daiwa Capital Markets Europe Limited, Paris Representative Office 36, rue de Naples, 75008 Paris, France (33) 1 56 262 200 (33) 1 47 550 808
Daiwa Capital Markets Europe Limited, London, Geneva Branch 50 rue du Rhône, P.O.Box 3198, 1211 Geneva 3, Switzerland (41) 22 818 7400 (41) 22 818 7441
Daiwa Capital Markets Europe Limited, Moscow Representative Office
Midland Plaza 7th Floor, 10 Arbat Street, Moscow 119002, Russian Federation
(7) 495 641 3416 (7) 495 775 6238
Daiwa Capital Markets Europe Limited, Bahrain Branch 7th Floor, The Tower, Bahrain Commercial Complex, P.O. Box 30069, Manama, Bahrain
(973) 17 534 452 (973) 17 535 113
Daiwa Capital Markets Hong Kong Limited Level 28, One Pacific Place, 88 Queensway, Hong Kong (852) 2525 0121 (852) 2845 1621
Daiwa Capital Markets Singapore Limited 6 Shenton Way #26-08, DBS Building Tower Two, Singapore 068809, Republic of Singapore
(65) 6220 3666 (65) 6223 6198
Daiwa Capital Markets Australia Limited Level 34, Rialto North Tower, 525 Collins Street, Melbourne, Victoria 3000, Australia
(61) 3 9916 1300 (61) 3 9916 1330
DBP-Daiwa Capital Markets Philippines, Inc 18th Floor, Citibank Tower, 8741 Paseo de Roxas, Salcedo Village, Makati City, Republic of the Philippines
(632) 813 7344 (632) 848 0105
Daiwa-Cathay Capital Markets Co Ltd 14/F, 200, Keelung Road, Sec 1, Taipei, Taiwan, R.O.C. (886) 2 2723 9698 (886) 2 2345 3638
Daiwa Securities Capital Markets Korea Co., Ltd. One IFC, 10 Gukjegeumyung-Ro, Yeouido-dong, Yeongdeungpo-gu, Seoul, 150-876, Korea
(82) 2 787 9100 (82) 2 787 9191
Daiwa Securities Capital Markets Co Ltd, Beijing Representative Office
Room 301/302,Kerry Center, 1 Guanghua Road,Chaoyang District, Beijing 100020, People’s Republic of China
(86) 10 6500 6688 (86) 10 6500 3594
Daiwa SSC Securities Co Ltd 45/F, Hang Seng Tower, 1000 Lujiazui Ring Road, Pudong, Shanghai 200120, People’s Republic of China
(86) 21 3858 2000 (86) 21 3858 2111
Daiwa Securities Capital Markets Co. Ltd, Bangkok Representative Office
18th Floor, M Thai Tower, All Seasons Place, 87 Wireless Road, Lumpini, Pathumwan, Bangkok 10330, Thailand
(66) 2 252 5650 (66) 2 252 5665
Daiwa Capital Markets India Private Ltd 10th Floor, 3 North Avenue, Maker Maxity, Bandra Kurla Complex, Bandra East, Mumbai – 400051, India
(91) 22 6622 1000 (91) 22 6622 1019
Daiwa Securities Capital Markets Co. Ltd, Hanoi Representative Office
Suite 405, Pacific Palace Building, 83B, Ly Thuong Kiet Street, Hoan Kiem Dist. Hanoi, Vietnam
(84) 4 3946 0460 (84) 4 3946 0461
DAIWA INSTITUTE OF RESEARCH LTD
HEAD OFFICE 15-6, Fuyuki, Koto-ku, Tokyo, 135-8460, Japan (81) 3 5620 5100 (81) 3 5620 5603
MARUNOUCHI OFFICE Gran Tokyo North Tower, 1-9-1, Marunouchi, Chiyoda-ku, Tokyo, 100-6756 (81) 3 5555 7011 (81) 3 5202 2021
New York Research Center 11th Floor, Financial Square, 32 Old Slip, NY, NY 10005-3504, U.S.A. (1) 212 612 6100 (1) 212 612 8417
London Research Centre 3/F, 5 King William Street, London, EC4N 7AX, United Kingdom (44) 207 597 8000 (44) 207 597 8550

Industrials / Taiwan 1590 TT
15 April 2014
- 17 -
Disclaimer
This publication is produced by Daiwa Securities Group Inc. and/or its non-U.S. affiliates, and distributed by Daiwa Securities Group Inc. and/or its non-U.S. affiliates, except to the extent expressly provided herein. This publication and the contents hereof are intended for information purposes only, and may be subject to change without further notice. Any use, disclosure, distribution, dissemination, copying, printing or reliance on this publication for any other purpose without our prior consent or approval is strictly prohibited. Neither Daiwa Securities Group Inc. nor any of its respective parent, holding, subsidiaries or affiliates, nor any of its respective directors, officers, servants and employees, represent nor warrant the accuracy or completeness of the information contained herein or as to the existence of other facts which might be significant, and will not accept any responsibility or liability whatsoever for any use of or reliance upon this publication or any of the contents hereof. Neither this publication, nor any content hereof, constitute, or are to be construed as, an offer or solicitation of an offer to buy or sell any of the securities or investments mentioned herein in any country or jurisdiction nor, unless expressly provided, any recommendation or investment opinion or advice. Any view, recommendation, opinion or advice expressed in this publication may not necessarily reflect those of Daiwa Securities Capital Markets Co. Ltd., and/or its affiliates nor any of its respective directors, officers, servants and employees except where the publication states otherwise. This research report is not to be relied upon by any person in making any investment decision or otherwise advising with respect to, or dealing in, the securities mentioned, as it does not take into account the specific investment objectives, financial situation and particular needs of any person. Daiwa Securities Group Inc., its subsidiaries or affiliates, or its or their respective directors, officers and employees from time to time have trades as principals, or have positions in, or have other interests in the securities of the company under research including derivatives in respect of such securities or may have also performed investment banking and other services for the issuer of such securities. The following are additional disclosures. Japan Daiwa Securities Co. Ltd. and Daiwa Securities Group Inc. Daiwa Securities Co. Ltd. is a subsidiary of Daiwa Securities Group Inc. Investment Banking Relationship
Within the preceding 12 months, The subsidiaries and/or affiliates of Daiwa Securities Group Inc. * has lead-managed public offerings and/or secondary offerings (excluding straight bonds) of the securities of the following companies: Blackgold International Holdings Ltd (BGG AU); Tosei Corporation (8923 JP); Modern Land (China) Co. Ltd (1107 HK); China Everbright Bank Company Limited (6818 HK); econtext Asia Ltd (1390 HK); Lotte Shopping Co (023530 KS).
*Subsidiaries of Daiwa Securities Group Inc. for the purposes of this section shall mean any one or more of: Daiwa Capital Markets Hong Kong Limited (大和資本市場香港有限公司), Daiwa Capital Markets Singapore Limited, Daiwa Capital Markets Australia Limited, Daiwa Capital Markets India Private Limited, Daiwa-Cathay Capital Markets Co., Ltd., Daiwa Securities Capital Markets Korea Co., Ltd. Hong Kong This research is distributed in Hong Kong by Daiwa Capital Markets Hong Kong Limited (大和資本市場香港有限公司) (“DHK”) which is regulated by the Hong Kong Securities and Futures Commission. Recipients of this research in Hong Kong may contact DHK in respect of any matter arising from or in connection with this research. Ownership of Securities For “Ownership of Securities” information, please visit BlueMatrix disclosure Link at https://daiwa3.bluematrix.com/sellside/Disclosures.action. Investment Banking Relationship For “Investment Banking Relationship”, please visit BlueMatrix disclosure Link at https://daiwa3.bluematrix.com/sellside/Disclosures.action. Relevant Relationship (DHK) DHK may from time to time have an individual employed by or associated with it serves as an officer of any of the companies under its research coverage. DHK market making DHK may from time to time make a market in securities covered by this research.
Singapore This research is distributed in Singapore by Daiwa Capital Markets Singapore Limited and it may only be distributed in Singapore to accredited investors, expert investors and institutional investors as defined in the Financial Advisers Regulations and the Securities and Futures Act (Chapter 289), as amended from time to time. By virtue of distribution to these category of investors, Daiwa Capital Markets Singapore Limited and its representatives are not required to comply with Section 36 of the Financial Advisers Act (Chapter 110) (Section 36 relates to disclosure of Daiwa Capital Markets Singapore Limited’s interest and/or its representative’s interest in securities). Recipients of this research in Singapore may contact Daiwa Capital Markets Singapore Limited in respect of any matter arising from or in connection with the research. Australia This research is distributed in Australia by Daiwa Capital Markets Stockbroking Limited and it may only be distributed in Australia to wholesale investors within the meaning of the Corporations Act. Recipients of this research in Australia may contact Daiwa Capital Markets Stockbroking Limited in respect of any matter arising from or in connection with the research. Ownership of Securities For “Ownership of Securities” information, please visit BlueMatrix disclosure Link at https://daiwa3.bluematrix.com/sellside/Disclosures.action. India This research is distributed by Daiwa Capital Markets India Private Limited (DAIWA) which is an intermediary registered with Securities & Exchange Board of India. This report is not to be considered as an offer or solicitation for any dealings in securities. While the information in this report has been compiled by DAIWA in good faith from sources believed to be reliable, no representation or warranty, express of implied, is made or given as to its accuracy, completeness or correctness. DAIWA its officers, employees, representatives and agents accept no liability whatsoever for any loss or damage whether direct, indirect, consequential or otherwise howsoever arising (whether in negligence or otherwise) out of or in connection with or from any use of or reliance on the contents of and/or omissions from this document. Consequently DAIWA expressly disclaims any and all liability for, or based on or relating to any such information contained in or errors in or omissions in this report. Accordingly, you are recommended to seek your own legal, tax or other advice and should rely solely on your own judgment, review and analysis, in evaluating the information in this document. The data contained in this document is subject to change without any prior notice DAIWA reserves its right to modify this report as maybe required from time to time. DAIWA is committed to providing independent recommendations to its Clients and would be happy to provide any information in response to any query from its Clients. This report is strictly confidential and is being furnished to you solely for your information. The information contained in this document should not be reproduced (in whole or in part) or redistributed in any form to any other person. We and our group companies, affiliates, officers, directors and employees may from time to time, have long or short positions, in and buy sell the securities thereof, of company(ies) mentioned herein or be engaged in any other transactions involving such securities and earn brokerage or other compensation or act as advisor or have the potential conflict of interest with respect to any recommendation and related information or opinion. DAIWA prohibits its analyst and their family members from maintaining a financial interest in the securities or derivatives of any companies that the analyst cover. This report is not intended or directed for distribution to, or use by any person, citizen or entity which is resident or located in any state or country or jurisdiction where such publication, distribution or use would be contrary to any statutory legislation, or regulation which would require DAIWA and its affiliates/ group companies to any registration or licensing requirements. The views expressed in the report accurately reflect the analyst’s personal views about the securities and issuers that are subject of the Report, and that no part of the analyst’s compensation was, is or will be directly or indirectly, related to the recommendations or views expressed in the Report. This report does not recommend to US recipients the use of Daiwa Capital Markets India Private Limited or any of its non – US affiliates to effect trades in any securities and is not supplied with any understanding that US recipients will direct commission business to Daiwa Capital Markets India Private Limited. Taiwan This research is distributed in Taiwan by Daiwa-Cathay Capital Markets Co., Ltd and it may only be distributed in Taiwan to institutional investors or specific investors who have signed recommendation contracts with Daiwa-Cathay Capital Markets Co., Ltd in accordance with the Operational Regulations Governing Securities Firms Recommending Trades in Securities to Customers. Recipients of this research in Taiwan may contact Daiwa-Cathay Capital Markets Co., Ltd in respect of any matter arising from or in connection with the research. Philippines This research is distributed in the Philippines by DBP-Daiwa Capital Markets Philippines, Inc. which is regulated by the Philippines Securities and Exchange Commission and the Philippines Stock Exchange, Inc. Recipients of this research in the Philippines may contact DBP-Daiwa Capital Markets Philippines, Inc. in respect of any matter arising from or in connection with the research. DBP-Daiwa Capital Markets Philippines, Inc. recommends that investors independently assess, with a professional advisor, the specific financial risks as well as the legal, regulatory, tax, accounting, and other consequences of a proposed transaction. DBP-Daiwa Capital Markets Philippines, Inc. may have positions or may be materially interested in the securities in any of the markets mentioned in the publication or may have performed other services for the issuers of such securities. For relevant securities and trading rules please visit SEC and PSE Link at http://www.sec.gov.ph/irr/AmendedIRRfinalversion.pdf and http://www.pse.com.ph/ respectively. United Kingdom This research report is produced by Daiwa Capital Markets Europe Limited and/or its affiliates and is distributed in the European Union, Iceland, Liechtenstein, Norway and Switzerland. Daiwa Capital Markets Europe Limited is authorised and regulated by The Financial Conduct Authority (“FCA”) and is a member of the London Stock Exchange, Eurex and NYSE Liffe. Daiwa Capital Markets Europe Limited and/or its affiliates may, from time to time, to the extent permitted by law, participate or invest in other financing transactions with the issuers of the securities referred to herein (the “Securities”), perform services for or solicit business from such issuers, and/or have a position or effect transactions in the Securities or options thereof and/or may have acted as an underwriter during the past twelve months for the issuer of such securities. In addition, employees of Daiwa Capital Markets Europe Limited and/or its affiliates may have positions and effect transactions in such securities or options and may serve as Directors of such issuers. Daiwa Capital Markets Europe Limited may, to the extent permitted by applicable UK law and other applicable law or regulation, effect transactions in the Securities before this material is published to recipients.

Industrials / Taiwan 1590 TT
15 April 2014
- 18 -
This publication is intended for investors who are not Retail Clients in the United Kingdom within the meaning of the Rules of the FCA and should not therefore be distributed to such Retail Clients in the United Kingdom. Should you enter into investment business with Daiwa Capital Markets Europe’s affiliates outside the United Kingdom, we are obliged to advise that the protection afforded by the United Kingdom regulatory system may not apply; in particular, the benefits of the Financial Services Compensation Scheme may not be available. Daiwa Capital Markets Europe Limited has in place organisational arrangements for the prevention and avoidance of conflicts of interest. Our conflict management policy is available at http://www.uk.daiwacm.com/about-us/corporate-governance-regulatory . Regulatory disclosures of investment banking relationships are available at https://daiwa3.bluematrix.com/sellside/Disclosures.action. Germany This document has been approved by Daiwa Capital Markets Europe Limited and is distributed in Germany by Daiwa Capital Markets Europe Limited, Niederlassung Frankfurt which is regulated by BaFin (Bundesanstalt fuer Finanzdienstleistungsaufsicht) for the conduct of business in Germany. Bahrain
This research material is issued/compiled by Daiwa Capital Markets Europe Limited, Bahrain Branch, regulated by The Central Bank of Bahrain and holds Investment Business Firm – Category 2 license and having its official place of business at the Bahrain World Trade Centre, South Tower, 7th floor, P.O. Box 30069, Manama, Kingdom of Bahrain. Tel No. +973 17534452 Fax No. +973 535113
This material is provided as a reference for making investment decisions and is not intended to be a solicitation for investment. Investment decisions should be made at your own discretion and risk. Accordingly, no representation or warranty, express or implied, is made as to and no reliance should be placed on the fairness, accuracy, completeness or correctness of the information and opinions contained in this document, Content herein is based on information available at the time the research material was prepared and may be amended or otherwise changed in the future without notice. All information is intended for the private use of the person to whom it is provided without any liability whatsoever on the part of Daiwa Capital Markets Europe Limited, Bahrain Branch, any associated company or the employees thereof. If you are in doubt about the suitability of the product or the research material itself, please consult your own financial adviser. Daiwa Capital Markets Europe Limited, Bahrain Branch retains all rights related to the content of this material, which may not be redistributed or otherwise transmitted without prior consent. United States This report is distributed in the U.S. by Daiwa Capital Markets America Inc. (DCMA). It may not be accurate or complete and should not be relied upon as such. It reflects the preparer’s views at the time of its preparation, but may not reflect events occurring after its preparation; nor does it reflect DCMA’s views at any time. Neither DCMA nor the preparer has any obligation to update this report or to continue to prepare research on this subject. This report is not an offer to sell or the solicitation of any offer to buy securities. Unless this report says otherwise, any recommendation it makes is risky and appropriate only for sophisticated speculative investors able to incur significant losses. Readers should consult their financial advisors to determine whether any such recommendation is consistent with their own investment objectives, financial situation and needs. This report does not recommend to U.S. recipients the use of any of DCMA’s non-U.S. affiliates to effect trades in any security and is not supplied with any understanding that U.S. recipients of this report will direct commission business to such non-U.S. entities. Unless applicable law permits otherwise, non-U.S. customers wishing to effect a transaction in any securities referenced in this material should contact a Daiwa entity in their local jurisdiction. Most countries throughout the world have their own laws regulating the types of securities and other investment products which may be offered to their residents, as well as a process for doing so. As a result, the securities discussed in this report may not be eligible for sales in some jurisdictions. Customers wishing to obtain further information about this report should contact DCMA: Daiwa Capital Markets America Inc., Financial Square, 32 Old Slip, New York, New York 10005 (telephone 212-612-7000). Ownership of Securities For “Ownership of Securities” information please visit BlueMatrix disclosure Link at https://daiwa3.bluematrix.com/sellside/Disclosures.action. Investment Banking Relationships For “Investment Banking Relationships” please visit BlueMatrix disclosure link at https://daiwa3.bluematrix.com/sellside/Disclosures.action. DCMA Market Making For “DCMA Market Making” please visit BlueMatrix disclosure link at https://daiwa3.bluematrix.com/sellside/Disclosures.action. Research Analyst Conflicts For updates on “Research Analyst Conflicts” please visit BlueMatrix disclosure link at https://daiwa3.bluematrix.com/sellside/Disclosures.action. The principal research analysts who prepared this report have no financial interest in securities of the issuers covered in the report, are not (nor are any members of their household) an officer, director or advisory board member of the issuer(s) covered in the report, and are not aware of any material relevant conflict of interest involving the analyst or DCMA, and did not receive any compensation from the issuer during the past 12 months except as noted: no exceptions. Research Analyst Certification For updates on “Research Analyst Certification” and “Rating System” please visit BlueMatrix disclosure link at https://daiwa3.bluematrix.com/sellside/Disclosures.action. The views about any and all of the subject securities and issuers expressed in this Research Report accurately reflect the personal views of the research analyst(s) primarily responsible for this report (or the views of the firm producing the report if no individual analysts[s] is named on the report); and no part of the compensation of such analyst(s) (or no part of the compensation of the firm if no individual analyst[s)] is named on the report) was, is, or will be directly or indirectly related to the specific recommendations or views contained in this Research Report. The following explains the rating system in the report as compared to relevant local indices, based on the beliefs of the author of the report. "1": the security could outperform the local index by more than 15% over the next six months. "2": the security is expected to outperform the local index by 5-15% over the next six months. "3": the security is expected to perform within 5% of the local index (better or worse) over the next six months. "4": the security is expected to underperform the local index by 5-15% over the next six months. "5": the security could underperform the local index by more than 15% over the next six months. Additional information may be available upon request. Japan - additional notification items pursuant to Article 37 of the Financial Instruments and Exchange Law (This Notification is only applicable where report is distributed by Daiwa Securities Co. Ltd.) If you decide to enter into a business arrangement with us based on the information described in materials presented along with this document, we ask you to pay close attention to the following items. • In addition to the purchase price of a financial instrument, we will collect a trading commission* for each transaction as agreed beforehand with you. Since commissions may be included in
the purchase price or may not be charged for certain transactions, we recommend that you confirm the commission for each transaction. • In some cases, we may also charge a maximum of ¥ 2 million (including tax) per year as a standing proxy fee for our deposit of your securities, if you are a non-resident of Japan. • For derivative and margin transactions etc., we may require collateral or margin requirements in accordance with an agreement made beforehand with you. Ordinarily in such cases, the
amount of the transaction will be in excess of the required collateral or margin requirements. • There is a risk that you will incur losses on your transactions due to changes in the market price of financial instruments based on fluctuations in interest rates, exchange rates, stock prices,
real estate prices, commodity prices, and others. In addition, depending on the content of the transaction, the loss could exceed the amount of the collateral or margin requirements. • There may be a difference between bid price etc. and ask price etc. of OTC derivatives handled by us. • Before engaging in any trading, please thoroughly confirm accounting and tax treatments regarding your trading in financial instruments with such experts as certified public accountants.
*The amount of the trading commission cannot be stated here in advance because it will be determined between our company and you based on current market conditions and the content of each transaction etc.
When making an actual transaction, please be sure to carefully read the materials presented to you prior to the execution of agreement, and to take responsibility for your own decisions regarding the signing of the agreement with us. Corporate Name: Daiwa Securities Co. Ltd. Financial instruments firm: chief of Kanto Local Finance Bureau (Kin-sho) No.108 Memberships: Japan Securities Dealers Association, Financial Futures Association of Japan Japan Securities Investment Advisers Association Type II Financial Instruments Firms Association