target hub proteins serve as master regulators of...
TRANSCRIPT
Target hub proteins serve as masterregulators of development in yeastAnthony R. Borneman,1 Justine A. Leigh-Bell,1 Haiyuan Yu,2 Paul Bertone,1,2 Mark Gerstein,2
and Michael Snyder1,2,3
1Department of Molecular, Cellular, and Developmental Biology, 2Department of Molecular Biophysics and Biochemistry,Yale University, New Haven, Connecticut 06511, USA
To understand the organization of the transcriptional networks that govern cell differentiation, we haveinvestigated the transcriptional circuitry controlling pseudohyphal development in Saccharomyces cerevisiae.The binding targets of Ste12, Tec1, Sok2, Phd1, Mga1, and Flo8 were globally mapped across the yeastgenome. The factors and their targets form a complex binding network, containing patterns characteristic ofautoregulation, feedback and feed-forward loops, and cross-talk. Combinatorial binding to intergenic regionswas commonly observed, which allowed for the identification of a novel binding association between Mga1and Flo8, in which Mga1 requires Flo8 for binding to promoter regions. Further analysis of the networkshowed that the promoters of MGA1 and PHD1 were bound by all of the factors used in this study,identifying them as key target hubs. Overexpression of either of these two proteins specifically inducedpseudohyphal growth under noninducing conditions, highlighting them as master regulators of the system.Our results indicate that target hubs can serve as master regulators whose activity is sufficient for theinduction of complex developmental responses and therefore represent important regulatory nodes inbiological networks.
[Keywords: Binding network; ChIP chip; genomics; master regulator; yeast]
Supplemental material is available at http://www.genesdev.org.
Received October 31, 2005; revised version accepted December 20, 2005.
Investigating the mechanisms of cellular differentiationis fundamental to the understanding of eukaryotic devel-opment. Transcriptional regulatory networks play a keyrole in mediating developmental pathways through thecoordinated activation of specific downstream genes(Levine and Davidson 2005). Thus, there is considerableinterest in elucidating the hierarchy of networks formedby transcription factors, the combinations in whichthese factors associate, and the key regulatory elementswithin the network. Determination of the componentsthat function together, particularly those that are likelyto be weakly associated as binary interactions is particu-larly difficult, and new techniques are required to iden-tify and characterize these physiologically important as-sociations.
In some systems, key “master regulators” have beenidentified whose action is sufficient to induce an entirecomplex developmental pathway. For example, in Dro-sophila melanogaster the expression of the transcriptionfactor eyeless induces ectopic eye formation, while invertebrates, expression of the proteins MyoD, Myf5, andNeuroD can induce muscle and neural development, re-
spectively (Braun et al. 1989; Weintraub et al. 1989; Hal-der et al. 1995; Lee et al. 1995). Identification of thesekey regulatory components has provided useful insightinto these developmental process and has enormous po-tential for controlling them. Thus, the development ofapproaches to identify master regulators and understandwhere they reside in regulatory hierarchies is expected tobe extremely valuable.
We have studied the transcriptional control of devel-opment using Saccharomyces cerevisiae as a model sys-tem by investigating the networks formed by severaltranscription factors involved in the pseudohyphal de-velopmental pathway. When exposed to an environmentwith limited available nitrogen, diploid strains of S. cere-visiae switch from their normal, vegetative growth pat-tern and begin growing as pseudohyphae, in which cellsform branched chains of connected cells that are capableof invading their growth substrate (Gimeno et al. 1992).Previous work identified many genes that affect pseudo-hyphal growth, and several of these encode transcriptionfactors (for reviews, see Pan et al. 2000; Gancedo 2001).The genes STE12 and TEC1 are predicted to encode ho-meodomain and TEA/ATTS transcription factors, re-spectively, and both are required for the formation ofpseudohyphae (Liu et al. 1993; Gavrias et al. 1996). Thesetwo proteins bind cooperatively to activate the expres-sion of downstream targets under pseudohyphal growth
3Corresponding author.E-MAIL [email protected]; FAX (203) 432-6161.Article published online ahead of print. Article and publication date areat http://www.genesdev.org/cgi/doi/10.1101/gad.1389306.
GENES & DEVELOPMENT 20:435–448 © 2006 by Cold Spring Harbor Laboratory Press ISSN 0890-9369/06; www.genesdev.org 435
Cold Spring Harbor Laboratory Press on November 11, 2010 - Published by genesdev.cshlp.orgDownloaded from

conditions (Madhani and Fink 1997). The activity ofSte12 is dependent on a MAPK cascade, which also af-fects the formation of pseudohyphae (Liu et al. 1993;Cook et al. 1997).
In addition to the MAPK signaling pathway, a cAMP-responsive cascade is also required for pseudohyphalgrowth (Kubler et al. 1997; Lorenz and Heitman 1997;Robertson and Fink 1998; Pan and Heitman 1999). Theprotein products of the SOK2, PHD1, FLO8, and MGA1genes are all predicted to be transcription factors con-trolled by the cAMP pathway during pseudohyphalgrowth (Ward et al. 1995; Robertson and Fink 1998; Panand Heitman 1999; Rupp et al. 1999). Sok2 and Phd1both contain basic helix–loop–helix DNA-binding mo-tifs; Mga1 has a heat-shock factor (HSF) DNA-bindingdomain, whereas the binding domain of Flo8 is yet to becharacterized (Gimeno and Fink 1994; Ward et al. 1995;Kobayashi et al. 1996; Feroli et al. 1997). Phd1 and Sok2modulate the pseudohyphal response either positively(Phd1) or negatively (Sok2), while Flo8 and Mga1, likeSte12 and Tec1, are both required for pseudohyphal for-mation (Ward et al. 1995; Liu et al. 1996; Lorenz andHeitman 1998b). The targets bound by each of these fac-tors during pseudohyphal growth have not been charac-terized previously, and the role of Mga1 in particular, ispoorly understood. Of high interest is understanding thehierarchy of the regulatory network, the relationships ofits components, and whether key elements exist in thenetwork that can serve as master regulators.
In this study we have sought to address these issuesthrough the investigation of the networks formed by sixkey regulators of pseudohyphal growth—Tec1, Ste12,Sok2, Phd1, Flo8, and Mga1—and their DNA-bindingtargets using chromatin immunoprecipitation and DNAmicroarrays (ChIP chip). ChIP chip allows for the iden-tification of the complete genomic complement of invivo binding sites for a DNA-binding protein, allowingfor entire downstream networks to be determined with-out a priori knowledge of the binding specificity of thatfactor (Ren et al. 2000; Iyer et al. 2001). Our results dem-onstrate that pseudohyphal differentiation is mediatedby a complex pathway involving autoregulation, cross-factor control, and feedback and feed-forward loops.Moreover, we find that Mga1 and Phd1 are key targethubs for the network and overexpression of either ofthese factors resulted in pseudohyphal growth undernoninducing conditions. We therefore demonstrate thattarget hubs can serve as master regulators, with theirexpression being sufficient to ectopically drive complexdevelopment, making them attractive as possible controlpoints in biological pathways.
Results
The transcription factors Tec1, Ste12, Sok2, Phd1,Flo8, and Mga1 bind to a large number ofdownstream genes
To identify the targets of Tec1, Ste12, Sok2, Phd1, Flo8,and Mga1, we tagged each protein by creating C-terminal
fusions to the c-myc epitope by a PCR-based approach(Longtine et al. 1998). These fusions were made indepen-dently in both a and ! haploid strains in the pseudohy-phal-competent "1278b background, and homozygousdiploids were formed by mating. The tagged strains wereshown to be phenotypically indistinguishable from wildtype with respect to pseudohyphal growth, and immu-noblot analysis showed the presence of the tagged pro-tein in each strain (data not shown).
The binding targets for each of the transcription fac-tors were determined in cells grown in liquid low nitro-gen (SLAD) medium by ChIP, followed by DNA isolationand the probing of microarrays (see Materials and Meth-ods). At least five independent biological replicates wereperformed for each factor, and following normalization, astringent cut-off was used to identify intergenic regionswhose tagged versus untagged ratios were >4 standarddeviations (SD) from the mean (Horak et al. 2002). Atleast 40 binding targets for each transcription factor fromacross the range of standard deviations were also shownto be enriched in the immunoprecipitations by PCR withan !90% success rate, with PCR results for three inter-genic regions bound by all six factors shown in Figure 1.
Each transcription factor bound to a large number ofintergenic regions, ranging from 116 for Mga1 to 306 forPhd1. Collectively, 625 unique intergenic regions werebound by at least one of the six factors (see Supplemen-tary Table 1); the targets were distributed across all 16 S.cerevisiae chromosomes (Fig. 2). The enriched intergenicregions were subsequently mapped to the promoter re-gions of 699 S. cerevisiae open reading frames (ORFs).Only ORFs whose 5! ends were downstream of, and di-rectly flanking, the intergenic target region were scoredas gene targets for that factor (Supplementary Table 2).
Once the lists of target genes were established, “GOterm finder” was used to search for specific Gene Ontol-ogy (GO) terms that were enriched in the gene targets ofthese factors relative to the entire yeast genome (Table 1;Boyle et al. 2004). Several classes of genes were enrichedby the ChIP chip procedure, including the “filamentousgrowth” (p = 2.8 ! 10!3) and “growth” (p = 7.5 " 10!3)categories, which contain large numbers of genes knownto be involved in pseudohyphal growth. Interestingly,
Figure 1. PCR confirmation of factor binding. Three intergenicregions that were shown to be bound by all six factors(iYIR020C, iYKL045C and iYIL119C), in addition to a regionshown to be unbound (iYBL055C), were amplified from ChIPsamples from either an untagged control strain (WT) or strainscontaining c-myc-tagged Tec1, Ste12, Sok2, Mga1, Flo8, orPhd1.
Borneman et al.
436 GENES & DEVELOPMENT
Cold Spring Harbor Laboratory Press on November 11, 2010 - Published by genesdev.cshlp.orgDownloaded from
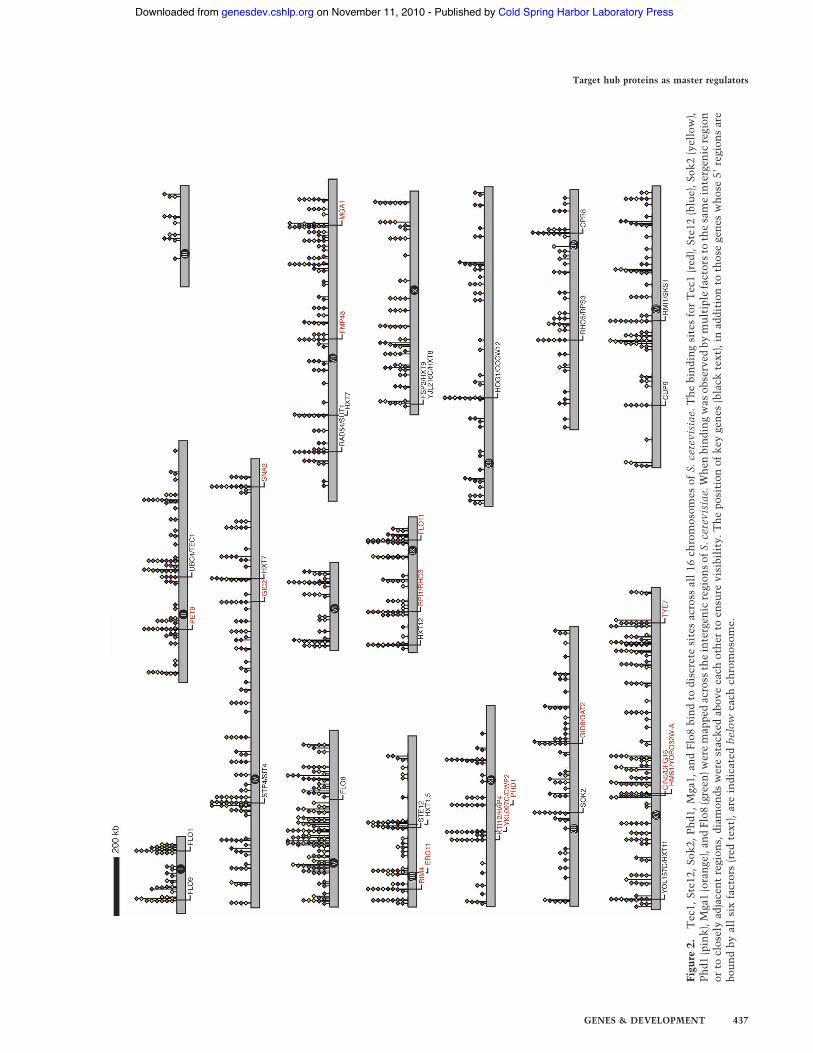
Figu
re2.
Tec
1,St
e12,
Sok2
,Phd
1,M
ga1,
and
Flo8
bind
todi
scre
tesi
tes
acro
ssal
l16
chro
mos
omes
ofS.
cere
visi
ae.T
hebi
ndin
gsi
tes
for
Tec
1(r
ed),
Ste1
2(b
lue)
,Sok
2(y
ello
w),
Phd1
(pin
k),M
ga1
(ora
nge)
,and
Flo8
(gre
en)w
ere
map
ped
acro
ssth
ein
terg
enic
regi
ons
ofS.
cere
visi
ae.W
hen
bind
ing
was
obse
rved
bym
ulti
ple
fact
ors
toth
esa
me
inte
rgen
icre
gion
orto
clos
ely
adja
cent
regi
ons,
diam
onds
wer
est
acke
dab
ove
each
othe
rto
ensu
revi
sibi
lity
.The
posi
tion
ofke
yge
nes
(bla
ckte
xt),
inad
diti
onto
thos
ege
nes
who
se5!
regi
ons
are
boun
dby
all
six
fact
ors
(red
text
),ar
ein
dica
ted
belo
wea
chch
rom
osom
e.
Target hub proteins as master regulators
GENES & DEVELOPMENT 437
Cold Spring Harbor Laboratory Press on November 11, 2010 - Published by genesdev.cshlp.orgDownloaded from

other categories such as “hexose transport” (p = 1.6 "10!7) and “alcohol metabolism” (p = 6.2 " 10!4) were alsohighly enriched in the target gene list. This indicatesthat there are very strong links between pseudohyphalgrowth and carbon metabolism, in agreement with pre-vious studies (Lambrechts et al. 1996).
To further investigate the validity of the targets of thetranscription factors identified by ChIP chip, the list oftarget genes was compared with expression microarrayexperiments performed with pseudohyphal cells (Prinzet al. 2004). Of the 699 genes identified by the ChIP chip,direct partners could be found for 638 in the expressiondata set (Ty elements were excluded as these were scoreddifferently by the two studies); 131 (20.5%) of thesegenes were shown to also be significantly regulated ei-ther positively or negatively (from 873 regulated genes)(Prinz et al. 2004) during pseudohyphal growth (Fig. 3A).GO category enrichment showed that many genes in-volved in nitrogen compound metabolism were boundand up-regulated, especially the DAL genes that are in-volved in allantoin metabolism, while those involved incell wall organization and sterol metabolism were boundand down-regulated.
A high degree of combinatorial binding existsfor downstream targets genes
The intergenic targets of the six factors were examinedto determine the proportion of genes bound by multiplefactors. A large number of promoter regions (n = 246,40%) were bound by at least two factors, and 20 inter-genic regions, many of which are upstream of genes as-sociated with pseudohyphal growth, including FLO11,PHD1, MGA1, and HMS1, were bound by all six (Figs. 2,
3B; Gimeno and Fink 1994; Lo and Dranginis 1998;Lorenz and Heitman 1998b). These data therefore sup-port previous work which showed that Tec1, Ste12,Sok2, and Flo8 each control the expression of Flo11(Rupp et al. 1999; van Dyk et al. 2005). Our work dem-onstrates that Phd1 and Mga1 also bind Flo11 and, in ad-dition, that large numbers of transcription factors oftenbind concurrently to the promoters of pseudohyphal genes.
Following this initial analysis, the factors were clus-tered by the similarity of their target lists, resolving theproteins into two main groups. Group 1 contained Ste12and Tec1, while the second group contained Sok2, Phd1,Flo8, and Mga1. This distribution of factors is particu-larly interesting as it follows the particular signalingpathway that lies upstream of each protein, with Tec1and Ste12 lying downstream of the MAPK cascade andSok2, Phd1, Mga1, and Flo8 all associated with thecAMP pathway (Liu et al. 1993; Madhani and Fink 1997;Robertson and Fink 1998; Pan and Heitman 1999, 2000;Rupp et al. 1999). To examine the differences betweenthese two pathways, the downstream targets unique toeither group were also examined for GO category enrich-ment. The major category enriched in the Ste12 andTec1 group was “pseudohyphal growth” (p = 1.4 " 10!4),followed distantly by “allantoin metabolism” (p = 0.02).In contrast, the major category enriched in the cAMP-regulated group was “hexose transport” (p = 7.9 " 10!4),followed by “amine transport” (p = 6 " 10!3). Interest-ingly, the cAMP group also contained many members ofseveral other categories related to the metabolism andcatabolism of various compounds, including alcohol,hexose sugars, steroid compounds, and organic acids.Thus, the MAPK and cAMP pathways transcriptionallyactivate distinct functional groups of proteins.
Table 1. GO term enrichment by ChIP chip
GO term ChIP Gen P value Genes
Hexosetransport
2.1% 0.3% 1.6 " 10!7 HXT9, HXT1, HXT5, HXT2, SKS1, HXT6, HXT4, HXT3,HXT16, HXT11, HXT8, HXT7, HXT13
Aminetransport
2.8% 0.7% 1.5 " 10!4 CAN1, AGP1, ORT1, GAP1, YMR088C, GNP1, DUR3,PTK2, TPO4, HIP1, TPO1, PUT4, UGA4, PTK1, BAP2,NPR2, SAM3
Alcoholmetabolism
5.3% 2.2% 6.2 " 10!4 ERG2, GID8, ERG5, ERG11, SOR2, DAK2, RHR2, PSA1,MUQ1, ERG28, TDH2, MDH2, ERG6, NDE1, HOR2,ENO2, STD1, TDH3, HMG1, RKI1, TOS3, ERG25,GAL2, PDR16, PGI1, MIG2, ARE2, ATG26, HXK1,ZWF1, SOR1, NCP1, TYE7
Filamentousgrowth
3.6% 1.2% 2.8 " 10!3 SHO1, HMS1, FLO11, BMH1, SOK2, PEA2, MSS11,DIA3, MGA1, BUD8, PHD1, GPA2, MEP2, DFG16,MSB2, TEC1, NRG2, STE12, DOT6, DIA2, RGA2,DIG1
Growth 4.1% 1.6% 7.5 " 10!3 SHO1, HMS1, FLO11, BMH1, SOK2, KCC4, PEA2,ACT1, MSS11, DIA3, MGA1, PHD1, BUD8, GPA2,MEP2, DFG16, MSB2, TEC1, NRG2, STE12, DOT6,DIA2, TOS2, RGA2, DIG1
Ion transport 3.9% 1.5% 8.3 " 10!5 FRE4, ATO3, PMP1, SIT1, GIT1, ARN1, FET4, ATP1,HIP1, ENA1, PMP2, INH1, PIC2, MEP1, FET3, VCX1,FTR1, NHX1, MEP2, PHO89, PHO91, RCS1, COT1,FRE1
Borneman et al.
438 GENES & DEVELOPMENT
Cold Spring Harbor Laboratory Press on November 11, 2010 - Published by genesdev.cshlp.orgDownloaded from
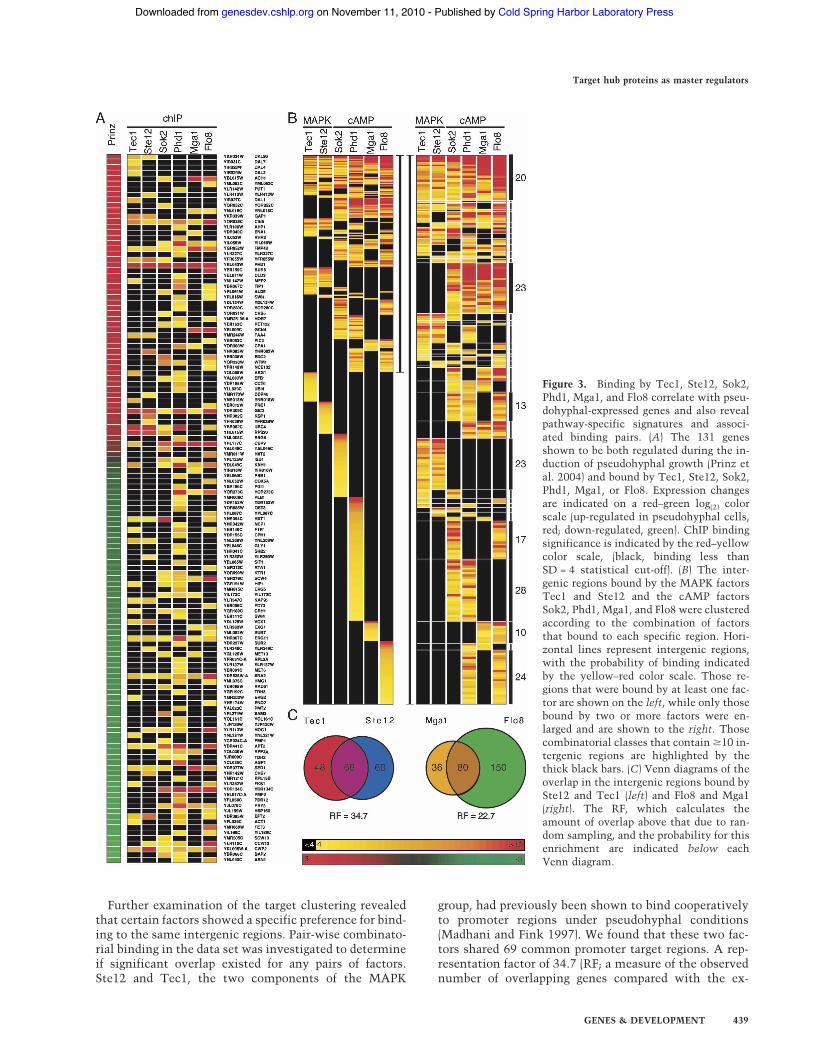
Further examination of the target clustering revealedthat certain factors showed a specific preference for bind-ing to the same intergenic regions. Pair-wise combinato-rial binding in the data set was investigated to determineif significant overlap existed for any pairs of factors.Ste12 and Tec1, the two components of the MAPK
group, had previously been shown to bind cooperativelyto promoter regions under pseudohyphal conditions(Madhani and Fink 1997). We found that these two fac-tors shared 69 common promoter target regions. A rep-resentation factor of 34.7 (RF; a measure of the observednumber of overlapping genes compared with the ex-
Figure 3. Binding by Tec1, Ste12, Sok2,Phd1, Mga1, and Flo8 correlate with pseu-dohyphal-expressed genes and also revealpathway-specific signatures and associ-ated binding pairs. (A) The 131 genesshown to be both regulated during the in-duction of pseudohyphal growth (Prinz etal. 2004) and bound by Tec1, Ste12, Sok2,Phd1, Mga1, or Flo8. Expression changesare indicated on a red–green log(2) colorscale (up-regulated in pseudohyphal cells,red; down-regulated, green). ChIP bindingsignificance is indicated by the red–yellowcolor scale, (black, binding less thanSD = 4 statistical cut-off). (B) The inter-genic regions bound by the MAPK factorsTec1 and Ste12 and the cAMP factorsSok2, Phd1, Mga1, and Flo8 were clusteredaccording to the combination of factorsthat bound to each specific region. Hori-zontal lines represent intergenic regions,with the probability of binding indicatedby the yellow–red color scale. Those re-gions that were bound by at least one fac-tor are shown on the left, while only thosebound by two or more factors were en-larged and are shown to the right. Thosecombinatorial classes that contain #10 in-tergenic regions are highlighted by thethick black bars. (C) Venn diagrams of theoverlap in the intergenic regions bound bySte12 and Tec1 (left) and Flo8 and Mga1(right). The RF, which calculates theamount of overlap above that due to ran-dom sampling, and the probability for thisenrichment are indicated below eachVenn diagram.
Target hub proteins as master regulators
GENES & DEVELOPMENT 439
Cold Spring Harbor Laboratory Press on November 11, 2010 - Published by genesdev.cshlp.orgDownloaded from
pected number) was calculated for this overlap (p <1.98 " 10!99), supporting their established cooperativeinteraction (Fig. 3C). However, there were also numer-ous intergenic regions that uniquely bound either Tec1(n = 60) or Ste12 (n = 48), suggesting that this codepen-dence may not be absolute.
In addition to the Ste12–Tec1 combination, there wasalso significant enrichment among all of the transcrip-tion factors pairs, reflecting their common function inpseudohyphal growth (lowest RF = 9.5, p < 2.9 " 10!33).However, the only factors whose pair-wise enrichmentapproached that of Ste12 and Tec1 were Flo8 and Mga1(RF = 22.7, p < 1.5 " 10!96), two factors that had not pre-viously been shown to associate. Flo8 and Mga1 boundto 80 common promoter regions, representing 69% ofthe total binding sites for Mga1 (Fig. 3C). These two fac-tors therefore represented an attractive candidate forforming a novel binding pair and were selected for fur-ther study.
Mga1 and Flo8 display a novel binding association
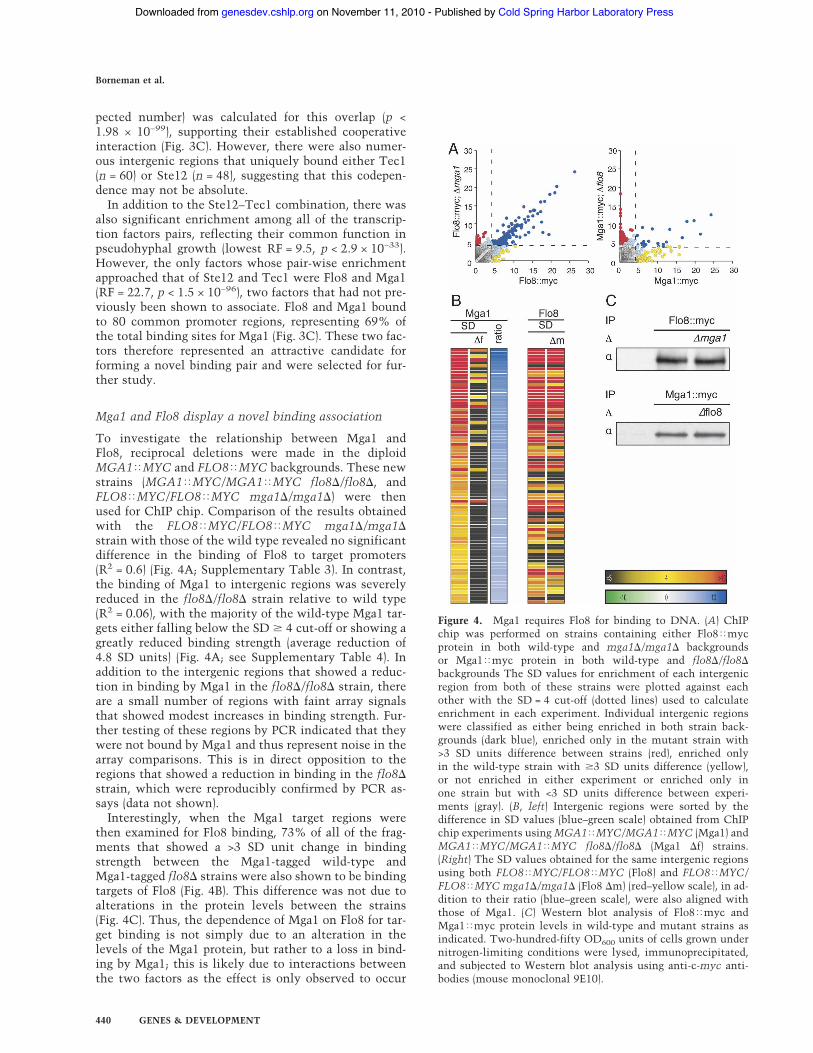
To investigate the relationship between Mga1 andFlo8, reciprocal deletions were made in the diploidMGA1!MYC and FLO8!MYC backgrounds. These newstrains (MGA1!MYC/MGA1!MYC flo8$/flo8$, andFLO8!MYC/FLO8!MYC mga1$/mga1$) were thenused for ChIP chip. Comparison of the results obtainedwith the FLO8!MYC/FLO8!MYC mga1$/mga1$strain with those of the wild type revealed no significantdifference in the binding of Flo8 to target promoters(R2 = 0.6) (Fig. 4A; Supplementary Table 3). In contrast,the binding of Mga1 to intergenic regions was severelyreduced in the flo8$/flo8$ strain relative to wild type(R2 = 0.06), with the majority of the wild-type Mga1 tar-gets either falling below the SD # 4 cut-off or showing agreatly reduced binding strength (average reduction of4.8 SD units) (Fig. 4A; see Supplementary Table 4). Inaddition to the intergenic regions that showed a reduc-tion in binding by Mga1 in the flo8$/flo8$ strain, thereare a small number of regions with faint array signalsthat showed modest increases in binding strength. Fur-ther testing of these regions by PCR indicated that theywere not bound by Mga1 and thus represent noise in thearray comparisons. This is in direct opposition to theregions that showed a reduction in binding in the flo8$strain, which were reproducibly confirmed by PCR as-says (data not shown).
Interestingly, when the Mga1 target regions werethen examined for Flo8 binding, 73% of all of the frag-ments that showed a >3 SD unit change in bindingstrength between the Mga1-tagged wild-type andMga1-tagged flo8$ strains were also shown to be bindingtargets of Flo8 (Fig. 4B). This difference was not due toalterations in the protein levels between the strains(Fig. 4C). Thus, the dependence of Mga1 on Flo8 for tar-get binding is not simply due to an alteration in thelevels of the Mga1 protein, but rather to a loss in bind-ing by Mga1; this is likely due to interactions betweenthe two factors as the effect is only observed to occur
Figure 4. Mga1 requires Flo8 for binding to DNA. (A) ChIPchip was performed on strains containing either Flo8!mycprotein in both wild-type and mga1$/mga1$ backgroundsor Mga1!myc protein in both wild-type and flo8$/flo8$backgrounds The SD values for enrichment of each intergenicregion from both of these strains were plotted against eachother with the SD = 4 cut-off (dotted lines) used to calculateenrichment in each experiment. Individual intergenic regionswere classified as either being enriched in both strain back-grounds (dark blue), enriched only in the mutant strain with>3 SD units difference between strains (red), enriched onlyin the wild-type strain with #3 SD units difference (yellow),or not enriched in either experiment or enriched only inone strain but with <3 SD units difference between experi-ments (gray). (B, left) Intergenic regions were sorted by thedifference in SD values (blue–green scale) obtained from ChIPchip experiments using MGA1!MYC/MGA1!MYC (Mga1) andMGA1!MYC/MGA1!MYC flo8$/flo8$ (Mga1 $f) strains.(Right) The SD values obtained for the same intergenic regionsusing both FLO8!MYC/FLO8!MYC (Flo8) and FLO8!MYC/FLO8!MYC mga1$/mga1$ (Flo8 $m) (red–yellow scale), in ad-dition to their ratio (blue–green scale), were also aligned withthose of Mga1. (C) Western blot analysis of Flo8!myc andMga1!myc protein levels in wild-type and mutant strains asindicated. Two-hundred-fifty OD600 units of cells grown undernitrogen-limiting conditions were lysed, immunoprecipitated,and subjected to Western blot analysis using anti-c-myc anti-bodies (mouse monoclonal 9E10).
Borneman et al.
440 GENES & DEVELOPMENT
Cold Spring Harbor Laboratory Press on November 11, 2010 - Published by genesdev.cshlp.orgDownloaded from
at promoter regions where both proteins are normallypresent.
A complex binding network is formed by Tec1, Ste12,Sok2, Phd1, Mga1, and Flo8
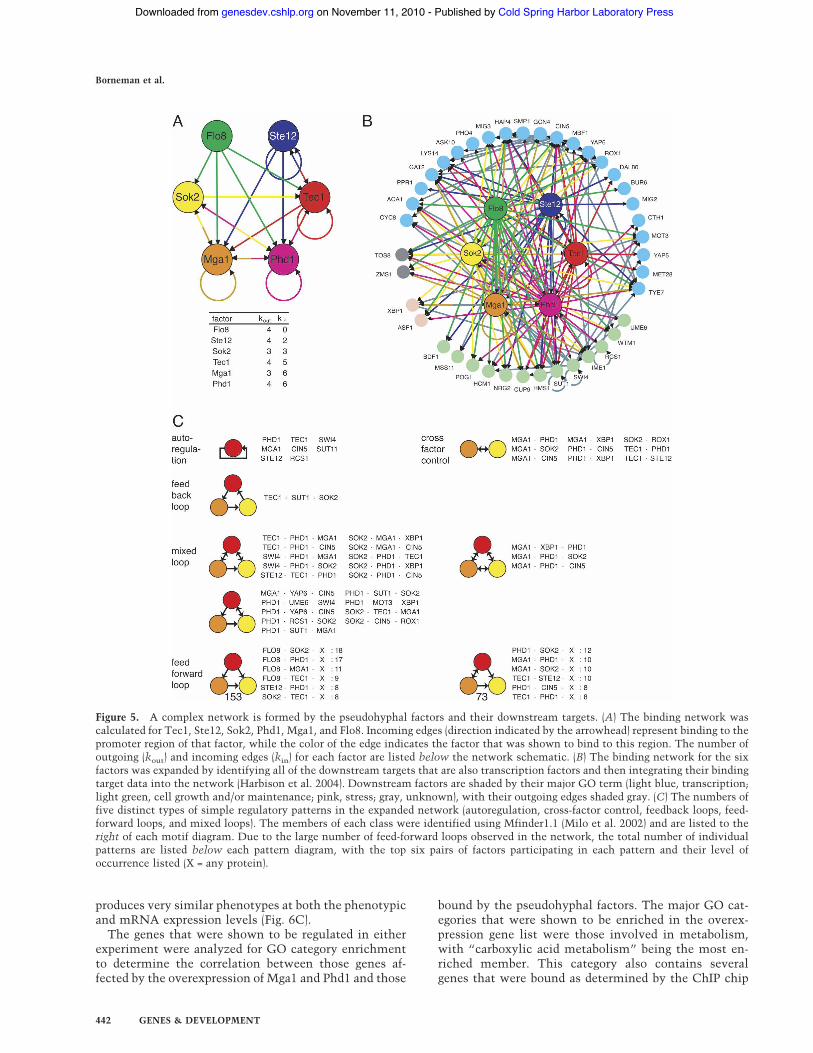
To investigate the network hierarchies in which the sixtranscription factors operate, we determined how theirbinding relationships were organized among themselvesand with other transcription factors. Analysis of thedownstream targets of the six factors revealed that theyoften bound to the promoter regions of the other factorsused in this study, such that the six factors form a highlyinterconnected network (Fig. 5A). In recent years therehas been significant progress in characterizing biologicalnetworks mathematically to assist in the study of thesecomplex systems (for review, see Barabasi and Oltvai2004). Networks can therefore be represented by a seriesof nodes (in this case transcription factors and their tar-gets) and edges (representing binding by a factor to itstarget). Nodes can then be classified by a number of prop-erties, with the most basic being the number of outgoingedges (kout), representing the number of targets bound byeach factor, and by the number of incoming edges (kin),representing the number of factors that bind to upstreamof a particular gene.
When this analysis was applied to the network formedby the pseudohyphal transcription factors, we found thatthe kout was relatively uniform (between three and four),whereas the kin varied significantly between factors,ranging from zero for Flo8 to six for Mga1 and Phd1 (Fig.5A). In addition, many of the downstream targets of thepseudohyphal factors are also transcription factors. Formany of these proteins, binding data are available fromother high-throughput studies, although not from dip-loid cells exposed to nitrogen starvation conditions (Har-bison et al. 2004). Despite these differences in growthenvironment, the targets of Tec1, Ste12, Sok2, Phd1,Mga1, and Flo8 were overlayed with these other factorsto obtain a broad approximation of the total networkenvironment that could be encountered by each factor.This expanded list of factors was shown to form an evenmore connected binding network than that observed forthe pseudohyphal factors alone (average kout = 8.5; aver-age kin = 4) (Fig. 5B).
To facilitate the visualization of the interactions be-tween the factors, this expanded network was brokendown into several simple network patterns (autoregula-tion, cross-factor control, and feedback and feed-forwardloops) (Fig. 5C). Four of the factors (eight in the extendednetwork) displayed binding to their own promoter region(autoregulation), including Tec1, Ste12, Mga1, and Phd1.There were also nine cases of cross-factor control, wherepairs of factors each bound to the promoter region of thereciprocal factor. Of the factors used in this study, Phd1and Mga1 were the most likely to form this type of in-teraction. In addition to direct cross-factor control, therewere 23 instances of feedback loops, where three pro-teins form a closed loop; although due to the reciprocalbinding nature of many of the factors, 22 of these may
also function as feed-forward loops and were thereforeclassified as mixed loops. Again, Phd1 and Mga1 werethe predominate factors participating in the feedbackand mixed loop categories. Finally, true feed-forwardloops were also observed in the network, with this pat-tern classified by one protein binding to the promoter ofa second through a tertiary intermediate as well as bind-ing it directly. This was the most common type of pat-tern, with 226 observed in the expanded network andwith Flo8 representing the most prevalent member.
Constitutive expression of the target hub proteinsMga1 and Phd1 induces pseudohyphal growth undernoninducing conditions
Network analysis revealed that Mga1 and Phd1 had themost incoming connections (kin = 6 for both proteinswhen using only the factors from this study, kin = 9 forPhd1, kin = 10 for Mga1 when other factors are included).These two factors therefore represent key “target hubs”in this network as their numerous interactions makethem significant points for coordinating pseudohyphalgrowth signals. We hypothesized that Mga1, Phd1, andpossibly Tec1 (which had five incoming connections)may be master regulators whose expression would becapable of ectopically activating the developmentalpathway.
To test this possibility, the ORFs of Phd1, Mga1, andTec1 along with Ste12, Sok2, and Flo8 were cloned intoplasmid vectors that expressed the proteins from theconstitutive ADH3 promoter (Melcher 2000). Strainswere grown under high nitrogen conditions (SC-URA),which normally suppress the pseudohyphal pathway. Ec-topic expression of Ste12, Sok2, and Flo8 produced cellswith morphologies indistinguishable from the emptyvector control strain, although the expression of Flo8made cells clump together significantly more than ob-served with the vector control (Fig. 6A,B). However, theexpression of either Mga1, Phd1, or Tec1 caused cells toacquire pseudohyphal characteristics as evidenced byseveral criteria. First, overexpression of Mga1, Phd1, andTec1 all stimulated agar invasion, although expression ofTec1 produced far less invasiveness than either Phd1 orMga1 (Fig. 6A). Second, strains overexpressing Mga1,Phd1, and Tec1 were elongated and formed chains ofpseudohyphal cells when grown in high nitrogen liquidmedia. The chains and clumps of Mga1 and Phd1 over-expressing strains were much larger than those observedwith Tec1, correlating with their higher levels of inva-siveness (Fig. 6B). Neither of these morphological fea-tures was observed for Sok2, Ste12, and Flo8 overexpress-ing cells.
Finally, to examine the ectopic induction of pseudo-hyphal growth at the molecular level, strains overex-pressing Mga1 and Phd1 were subjected to expressionmicroarray analysis. Overexpression of Mga1 and Phd1were shown to induce 211 and 214 genes, respectively(twofold change cut-off). There was a high degree of cor-relation between the results obtained with the two fac-tors, indicating that the overexpression of either factor
Target hub proteins as master regulators
GENES & DEVELOPMENT 441
Cold Spring Harbor Laboratory Press on November 11, 2010 - Published by genesdev.cshlp.orgDownloaded from
produces very similar phenotypes at both the phenotypicand mRNA expression levels (Fig. 6C).
The genes that were shown to be regulated in eitherexperiment were analyzed for GO category enrichmentto determine the correlation between those genes af-fected by the overexpression of Mga1 and Phd1 and those
bound by the pseudohyphal factors. The major GO cat-egories that were shown to be enriched in the overex-pression gene list were those involved in metabolism,with “carboxylic acid metabolism” being the most en-riched member. This category also contains severalgenes that were bound as determined by the ChIP chip
Figure 5. A complex network is formed by the pseudohyphal factors and their downstream targets. (A) The binding network wascalculated for Tec1, Ste12, Sok2, Phd1, Mga1, and Flo8. Incoming edges (direction indicated by the arrowhead) represent binding to thepromoter region of that factor, while the color of the edge indicates the factor that was shown to bind to this region. The number ofoutgoing (kout) and incoming edges (kin) for each factor are listed below the network schematic. (B) The binding network for the sixfactors was expanded by identifying all of the downstream targets that are also transcription factors and then integrating their bindingtarget data into the network (Harbison et al. 2004). Downstream factors are shaded by their major GO term (light blue, transcription;light green, cell growth and/or maintenance; pink, stress; gray, unknown), with their outgoing edges shaded gray. (C) The numbers offive distinct types of simple regulatory patterns in the expanded network (autoregulation, cross-factor control, feedback loops, feed-forward loops, and mixed loops). The members of each class were identified using Mfinder1.1 (Milo et al. 2002) and are listed to theright of each motif diagram. Due to the large number of feed-forward loops observed in the network, the total number of individualpatterns are listed below each pattern diagram, with the top six pairs of factors participating in each pattern and their level ofoccurrence listed (X = any protein).
Borneman et al.
442 GENES & DEVELOPMENT
Cold Spring Harbor Laboratory Press on November 11, 2010 - Published by genesdev.cshlp.orgDownloaded from
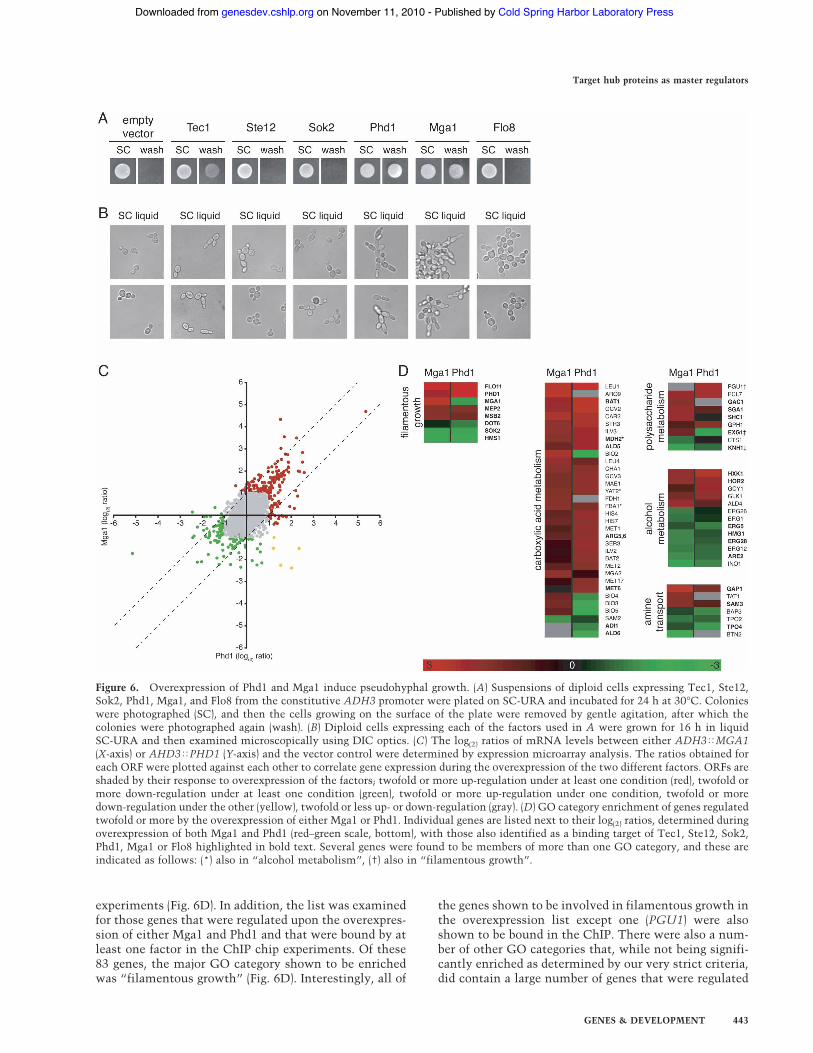
experiments (Fig. 6D). In addition, the list was examinedfor those genes that were regulated upon the overexpres-sion of either Mga1 and Phd1 and that were bound by atleast one factor in the ChIP chip experiments. Of these83 genes, the major GO category shown to be enrichedwas “filamentous growth” (Fig. 6D). Interestingly, all of
the genes shown to be involved in filamentous growth inthe overexpression list except one (PGU1) were alsoshown to be bound in the ChIP. There were also a num-ber of other GO categories that, while not being signifi-cantly enriched as determined by our very strict criteria,did contain a large number of genes that were regulated
Figure 6. Overexpression of Phd1 and Mga1 induce pseudohyphal growth. (A) Suspensions of diploid cells expressing Tec1, Ste12,Sok2, Phd1, Mga1, and Flo8 from the constitutive ADH3 promoter were plated on SC-URA and incubated for 24 h at 30°C. Colonieswere photographed (SC), and then the cells growing on the surface of the plate were removed by gentle agitation, after which thecolonies were photographed again (wash). (B) Diploid cells expressing each of the factors used in A were grown for 16 h in liquidSC-URA and then examined microscopically using DIC optics. (C) The log(2) ratios of mRNA levels between either ADH3!MGA1(X-axis) or AHD3!PHD1 (Y-axis) and the vector control were determined by expression microarray analysis. The ratios obtained foreach ORF were plotted against each other to correlate gene expression during the overexpression of the two different factors. ORFs areshaded by their response to overexpression of the factors; twofold or more up-regulation under at least one condition (red), twofold ormore down-regulation under at least one condition (green), twofold or more up-regulation under one condition, twofold or moredown-regulation under the other (yellow), twofold or less up- or down-regulation (gray). (D) GO category enrichment of genes regulatedtwofold or more by the overexpression of either Mga1 or Phd1. Individual genes are listed next to their log(2) ratios, determined duringoverexpression of both Mga1 and Phd1 (red–green scale, bottom), with those also identified as a binding target of Tec1, Ste12, Sok2,Phd1, Mga1 or Flo8 highlighted in bold text. Several genes were found to be members of more than one GO category, and these areindicated as follows: (*) also in “alcohol metabolism”, (†) also in “filamentous growth”.
Target hub proteins as master regulators
GENES & DEVELOPMENT 443
Cold Spring Harbor Laboratory Press on November 11, 2010 - Published by genesdev.cshlp.orgDownloaded from
upon expression of Mga1 or Phd1 and that were shown tobe bound by the ChIP chip experiments. These also rep-resented metabolic genes, strengthening the links be-tween morphogenesis and metabolism in this pathway(Fig. 6D).
Comparison of the Mga1 and Phd1 overexpression tar-gets with those found to be regulated during “normal”pseudohyphal growth (Prinz et al. 2004), revealed thatmany of the overexpression-regulated genes (20%–69%depending on the precise scoring method applied to theexpression data) (see Supplementary Table 5) are alsoregulated during the pseudohyphal response. Thus, usingseveral criteria, including cell morphology, invasive-ness, and expression patterns, it was shown that theectopic expression of Mga1 and Phd1 was driving pseu-dohyphal growth under noninducing conditions. Thisoccurred through the regulation of pathways similar tothose expressed under normal pseudohyphal growth con-ditions.
Discussion
The targets of transcription factors involvedin pseudohyphal growth reflect theirupstream signaling pathways
Although transcriptional regulation is critical for medi-ating many cellular and developmental processes, thereis still a great deal to be learned concerning how tran-scriptional networks are organized to control gene ex-pression. In particular, our understanding of the degreeto which factors cooperate to regulate downstream genesand how the hierarchy of networks is structured is quitelimited. Pseudohyphal growth is one example of thistype of complex developmental process, requiring a largearray of gene products, including several transcriptionfactors (Gimeno and Fink 1994; Ward et al. 1995; Gavriaset al. 1996; Liu et al. 1996; Chandarlapaty and Errede1998; van Dyk et al. 2005). While a large number of geneshave been identified as having important roles in signal-ing and transcriptional regulation during pseudohyphalgrowth, the downstream targets of these factors re-mained largely undiscovered. This work has sought toaddress this shortcoming by applying ChIP chip to glo-bally identify the downstream transcriptional networksthat exist for several factors that regulate pseudohyphalgrowth. The targets of Ste12, Tec1, Sok2, Flo8, and Mga1were shown to be enriched for a variety of specificclasses of genes, including many that had previouslybeen shown to be involved in this developmental pro-cess.
It was possible to categorize transcription factors intotwo broad groups based on the clustering of their genetargets; Ste12 and Tec1 formed one group and Sok2,Phd1, Mga1, and Flo8 represented a second. This target-based classification mirrors the upstream signaling path-ways that have been established for these factors, withSte12 and Tec1 lying downstream of the MAPK path-way, whereas Sok2, Phd1, Flo8, and Mga1 all have linksto the cAMP pathway (Liu et al. 1993; Madhani and Fink
1997; Robertson and Fink 1998; Pan and Heitman 1999,2000, 2002; Rupp et al. 1999). We identified severalgroups of genes that were bound specifically in either theMAPK or cAMP groups, showing that each pathway hasa unique function(s) required for different aspects ofpseudohyphal growth. The targets of the MAPK groupprimarily focused on morphology, while the cAMP groupcontained many genes involved in catabolism and me-tabolism, suggesting that the cAMP pathway may helpto coordinate developmental changes with the metabolicalterations that accompany the nutrient-limiting envi-ronment encountered by pseudohyphal cells. This divi-sion of function between the two pathways may there-fore account for why two independent signaling path-ways have evolved to induce pseudohyphal growth, withthe MAPK pathway and Tec1/Ste12 regulating morpho-genesis, whereas the cAMP pathway with Sok2/Phd1/Flo8/Mga1 regulates the many metabolic changes thataccompany the pseudohyphal transition.
While the targets of three factors examined in thisstudy, Tec1, Ste12, and Sok2, have been investigated byChIP chip previously (Lee et al. 2002; Zeitlinger et al.2003), those studies used haploid cells grown in rich me-dia or treated with N-butanol, a condition with uncer-tain physiological significance with respect to pseudohy-phal growth (Martinez-Anaya et al. 2003). Consequentlythese studies failed to identify many known targets ofSte12, Tec1, and Sok2 during pseudohyphal growth, in-cluding Flo11 for Tec1 and Sok2 (Rupp et al. 1999).Nonetheless, we did observe some overlap betweenthose studies and ours (10%–15% overlap each for Ste12,Tec1, or Sok2). As our study analyzed both more factorsand used conditions more physiologically associatedwith pseudohyphal growth, it is expected to provide amore comprehensive and accurate assessment of thegene targets involved in this process.
Interestingly, a comparison of the ChIP chip data withexpression microarray data obtained using pseudohyphalcells produced only a small, although significant, over-lap. While the discrepancies may be due in part to thedifference between the solid and liquid medium, otherstudies have also noted that binding is not always reflec-tive of alterations in gene expression as determined bymicroarrays (Martone et al. 2003; Euskirchen et al. 2004).Most likely, multiple factors help to regulate gene ex-pression, and the specific combination of bound proteinsultimately controls the output (positive or negative) ofgene expression.
A complex transcriptional network controlspseudohyphal development
Ste12, Tec1, Sok2, Flo8, and Mga1 and their downstreamtargets form a highly connected network that containsbinding patterns consistent with the presence of auto-regulatory loops, cross-talk between factors, and feed-back and feed-forward loops. While the complexity of thepathway may suggest robustness in the network to lossof individual factors, this appears to not be the case asstrains lacking any of four of the factors examined in this
Borneman et al.
444 GENES & DEVELOPMENT
Cold Spring Harbor Laboratory Press on November 11, 2010 - Published by genesdev.cshlp.orgDownloaded from
study (Tec1, Ste12, Flo8, and Mga1) fail to undergo thepseudohyphal response (Liu et al. 1993, 1996; Gavrias etal. 1996; Lorenz and Heitman 1998a). This may be due tothe combinatorial binding displayed by many of the fac-tors. Loss of one factor may actually disrupt the forma-tion of tertiary complexes at promoter regions. Howeverthe connectedness of the network does allow for precisecontrol and coordination of events required for mediat-ing this complex process. This was highlighted by theexpression assays that showed that overexpression of ei-ther Mga1 or Phd1 led to very similar expression profiles.The interconnectedness of the pathway therefore allowsfor similar overall results to be obtained from the acti-vation of different key upstream factors.
Binding by Mga1 to promoter regions requiresthe presence of Flo8
Tec1 and Ste12 bind cooperatively to promoter regionsto activate expression during the induction of pseudohy-phal growth (Madhani and Fink 1997). In addition, Flo8has been shown to bind cooperatively with the proteinMss11 to activate Flo11 expression (van Dyk et al. 2005).Cooperation between multiple factors therefore appearsto be a recurring theme during pseudohyphal growth. Bycomparing the target lists of the different factors, wewere able to confirm the association between Ste12 andTec1 as well as uncover a novel association between Flo8and Mga1. The Mga1–Flo8 association was subsequentlyconfirmed by performing ChIP chip using mga1$ andflo8$ mutant strains. Interestingly, the effect observedbetween Flo8 and Mga1 is unlike the situations observedfor either Tec1 and Ste12 or for Flo8 and Mss11 as itappears that the association between the factors is non-reciprocal, since Mga1 requires Flo8 for binding whereasFlo8 binds DNA independently of Mga1.
While Mga1 required Flo8 for DNA binding as assayedby ChIP, the formaldehyde cross-linking cannot dis-criminate between direct DNA binding and interactionsfacilitated through a secondary factor. Mga1 may there-fore bind to DNA directly, with Flo8 stabilizing thisbinding, or alternatively, Mga1 may bind indirectlythrough Flo8. Yeast two-hybrid experiments and coim-munoprecipitation studies have so far failed to detect astable interaction between Mga1 and Flo8, suggestingthat the proteins likely require a tertiary intermediate,perhaps DNA, for their apparent association at promoterregions (A.R. Borneman and M. Snyder, unpubl.).
Regardless of whether Mga1 requires Flo8 to stabilizebinding to DNA or whether Mga1 interacts with DNAindirectly through Flo8, this study has shown for thefirst time that it is possible to detect novel interactionsin transcriptional networks through the global study oftheir specific target genes. This type of study couldtherefore be applied to large-scale studies of transcrip-tion factor networks, by identifying pairs of factors thatshare significant numbers of common gene targets andthen examining their binding using ChIP chip in rel-evant mutant strains to highlight possible cooperativity.This technique also provides the major benefit of being
able to uncover protein associations, such as those dis-covered for Mga1 and Flo8, which would be difficult todefine using classical techniques, given the failure oftwo-hybrid and coimmunoprecipitation to detect anybiochemical interaction, despite a clear association be-tween the two factors.
Target hubs as key regulators of cellularand developmental processes
Master regulators are defined as proteins whose ectopicexpression is capable of inducing developmental pro-cesses. Interestingly, these proteins do not have to beessential for that process, as shown previously for MyoDand Phd1 (Rudnicki et al. 1993; Gimeno and Fink 1994).Likewise, other components of the pathway can be es-sential for a process but not serve as master regulators.Master regulators are therefore presumed to be key com-ponents whose ectopic activation affects a number ofcritical components that can then mediate the entire de-velopmental process.
In this study we identified two highly connected hubsthat are targets of many transcription factors and postu-lated that these may serve as master regulators of thepathway. Overexpression of PHD1 has been shown pre-viously to induce pseudohyphal growth (Gimeno andFink 1994). We have confirmed this in our assays andfurther demonstrated that overexpression of Mga1, andto a lesser extent Tec1, can induce the pseudohyphaldevelopmental pathway in nitrogen-rich medium,whereas the nontarget hubs proteins could not. Severalother master regulators (MyoD, Myf5, and NeuroD) havealso shown to be highly regulated in their respective de-velopmental networks (Chae et al. 2004; Tapscott 2005).Thus, we suggest that in many cases, target hubs may bekey regulators of developmental pathways and that ourapproach of extensively mapping transcription factor-binding sites may be a useful way to identify them. Glo-bal mapping of transcription factor-binding sites there-fore represents a useful approach for identifying suchhubs in a variety of other systems. The subsequent iden-tification and activation of these factors could thereforebe used to potentially control deficiencies in upstreamcomponents, and have enormous therapeutic potentialfor the treatment of a variety of medical disorders.
Materials and methods
Yeast strains and growth conditions
S. cerevisiae strains were all derived from Y825 (MATa, ura3-52, $leu2) and Y826 (MAT!, ura3-52, $leu2), which both havea "1278b background. For the induction of pseudohyphal geneexpression, S. cerevisiae strains were grown to OD600 = 0.3 at30°C in liquid minimal medium (SD; 2% glucose, 0.5% [38mM] ammonium sulphate, 0.17% yeast nitrogen base, 5 mMuracil), harvested by vacuum filtration and transferred to liquidSLAD medium (2% glucose, 50 µM ammonium sulphate,0.17% yeast nitrogen base, 5 mM uracil) for an additional 4-hgrowth at 30°C (Madhani et al. 1999).
Target hub proteins as master regulators
GENES & DEVELOPMENT 445
Cold Spring Harbor Laboratory Press on November 11, 2010 - Published by genesdev.cshlp.orgDownloaded from

Gene deletion, epitope tagging, and Western blotting
S. cerevisiae genes were either deleted or epitope-tagged by thelong-primer PCR approach using the plasmid pFA6a-KanMX(deletion) or pFA6a-13myc-KanMX (tagging)—which both con-tain the KanMX gene (G418R) as a selectable marker—as a tem-plate (Lorenz et al. 1995; Longtine et al. 1998). The sequence ofthe primers used for the deletions and tagging are listed inSupplementary Table 6 (tagging primers are indicated by “tag”,deletion primers by “$”). For the Mga1!myc; $flo8 andFlo8!myc; $mga1 strains, the KanMX cassette of the deletionallele was replaced by the NatMX (nourseothricin [NAT]R) cas-sette (Goldstein and McCusker 1999) by transformation with aPCR fragment of the NatMX cassette.
PCR products were transformed into the haploid strains Y825and Y826 using a lithium acetate (LiAc) technique (Gietz andWoods 2002). Transformants were selected by growth on YPDplates containing 200 mg/mL of G418 or 150 mg/mL NAT.Strains were tested for correct integration by PCR.
Western blots were performed on protein lysates preparedfrom induced (see above) cells. Following SDS-PAGE and trans-fer to nitrocellulose, fusion proteins were detected using anti-myc antibody (monoclonal 9E10 1:2000 dilution) and visualizedby chemiluminescence.
ChIP
ChIPs were performed by a method modified from Horak et al.(2002) and Horak and Snyder (2002). Briefly, 500 mL cultures ofboth an epitope-tagged and an untagged control were inducedand then fixed by the addition of formaldehyde (1% final con-centration). Cell pellets were resuspended in 2.5 mL lysis buffer(0.1% deoxycholic acid, 1 mM EDTA, 50 mM HEPES-KOH atpH 7.5, 140 mM NaCl, 1% Triton X-100 with the addition ofprotease inhibitors) per gram of cells. Three milliliters of thissuspension was disrupted using Zirconia beads and then soni-cated to shear chromatin (Branson sonifier, 3 " 30 sec, powersetting 5, 50% duty cycle). Lysates were clarified, and anti-mycantibody was added (monoclonal antibody 9E10, 1:250 dilution).Samples were incubated overnight at 4°C with nutation. Pro-tein A/G-coupled beads (Pierce) were then added, and sampleswere incubated for an additional 2 h at 4°C. Beads were sequen-tially washed for 5 min at 4°C in lysis buffer, high-salt lysisbuffer (0.1% deoxycholic acid, 1 mM EDTA, 50 mM HEPES-KOH at pH 7.5, 500 mM NaCl, 1% Triton X-100), LiCl deter-gent solution (0.5% deoxycolic acid, 1 mM EDTA, 250 mMLiCl, 0.5% NP-40, 10 mM Tris-HCl at pH 8), and finally TBS (20mM Tris-Hcl at pH 7.5, 150 mM NaCI). Immunoprecipitatedprotein–DNA complexes were eluted from the beads by incu-bation in TES (10 mM Tris, 1 mM EDTA, 0.75% SDS) for 20min at 65°C. Eluted samples were incubated overnight at 65°Cto reverse the formaldehyde cross-linking, treated with protein-ase K, and phenol-chloroform extracted to remove the proteins.
DNA labeling and array hybridization
DNA obtained from the ChIP was purified using the MinElutePCR purification kit (Qiagen). The ChIP chip samples were thenlabeled using Klenow polymerase and random primers(Bioprime kit, Invitrogen) in the presence of 240 µM amino-allyldUTP (aa-dUTP). aa-dUTP-incorporated samples were thenchemically coupled to either Cy5 (tagged) or Cy3 (untagged)dyes (amino-allyl cDNA labeling kit, Ambion). Following cou-pling, Cy5 and Cy3 sample pairs were mixed and applied tomicroarrays containing PCR products representing the inter-genic regions of the S. cerevisiae genome (Iyer et al. 2001)
printed on UltraGAPS slides (Corning), and then processed ac-cording to Corning UltraGAPS hybridization and washing pro-tocols.
Data acquisition and analysis
Slides were scanned using a Genepix 4000A scanner (Axon In-struments) and Genepix 3.0 (Axon Instruments). Followingscanning, Genepix result (.gpr) files were uploaded to the Ex-pressYourself Web site (http://array.mbb.yale.edu/analysis;Luscombe et al. 2003) for normalization. Enriched spots weredeterminedusing the Cy3 noise method (Horak et al. 2002). Astatistically stringent cut-off (SD # 4) was used for this scoring(false-positive rate of !0.001). Intensity shading and clusteringwere performed using the Genespring microarray analysis plat-form (Silicon Genetics).
GO enrichment of the ChIP chip target gene lists was calcu-lated using “GO term finder” (Boyle et al. 2004), which uses avery stringent p-value test that corrects for multiple testings.Pair-wise binding enrichment values and probability calcula-tions were performed using the “Statistical significance of theoverlap between two groups of genes” resource (http://elegans.uky.edu/MA/progs/overlap_stats.html), which calculates RFsand hypergeometric probabilities for any two groups of genes(for details of the calculations, see http://elegans.uky.edu/MA/progs/representation.stats.html).
PCR verification
PCR verification of the ChIP chip results was performed bydesigning oligonucleotides to 40–45 enriched and three nonen-riched intergenic regions for each factor and then performing 30cycles of PCR on 20 ng of DNA from both the tagged and un-tagged strains. Band intensities from each PCR reaction werecompared by gel electrophoresis.
Transcription factor overexpression
For the overexpression of the transcription factors, each ORFwas PCR amplified and cloned into the expression plasmidpVTU260 by gap repair (Melcher 2000). DNA for each ORF wasamplified from the strains used for the ChIP chip assays suchthat the expressed protein would contain the same c-myc epi-tope tag at the C terminus. The primers used for this PCR arelisted in Supplementary Table 5 (“oe” primers). PCR productswere cotransformed into S. cerevisiae NheI, NcoI digestedpVTU260. Plasmid DNA was rescued from URA+ transfor-mants for each factor into Escherichia coli, and the resultingplasmids were screened for correct integration by restrictiondigestion. Plasmids were then retransformed into a diploidstrain created from the haploid strains Y825 and Y826. Strainswere tested for protein production by Western blot using thec-myc epitope tag for detection, with two independent transfor-mants that were shown to produce tagged protein used for fur-ther analysis.
Expression microarrays
Poly-A RNA was isolated from diploid cells containing eitherthe pVTU!MGA1!MYC and pVTU!PHD1!MYC plasmidsor the empty pVTU260 vector that had been grown for twogenerations in SC-URA (Ambion). Dye-labeled cDNA was pre-pared from 1 µg of poly-A RNA (amino-allyl cDNA labeling kit,Ambion) and hybridized to microarrays that were spotted with70-mer oligonucleotide probes representing all of the ORFs of S.cerevisiae (Yeast AROS version 1.1, Qiagen).
Borneman et al.
446 GENES & DEVELOPMENT
Cold Spring Harbor Laboratory Press on November 11, 2010 - Published by genesdev.cshlp.orgDownloaded from
Acknowledgments
We thank Tom Royce for assistance with the ExpressYourselfWeb site; Ken Nelson for assistance in array printing; and Ste-phen Hartman, Daniel Gelperin, Lee Kung, and Michael Smithfor critical reading of this manuscript. This work was supportedby Burroughs Wellcome and NIH grants to M.S and M.G.
References
Barabasi, A.L. and Oltvai, Z.N. 2004. Network biology: Under-standing the cell’s functional organization. Nat. Rev. Genet.5: 101–113.
Boyle, E.I., Weng, S., Gollub, J., Jin, H., Botstein, D., Cherry,J.M., and Sherlock, G. 2004. GO!TermFinder: Open sourcesoftware for accessing Gene Ontology information and find-ing significantly enriched Gene Ontology terms associatedwith a list of genes. Bioinformatics 20: 3710–3715.
Braun, T., Bober, E., Buschhausen-Denker, G., Kohtz, S.,Grzeschik, K.H., and Arnold, H.H. 1989. Differential expres-sion of myogenic determination genes in muscle cells: Pos-sible autoactivation by the Myf gene products. EMBO J.8: 3617–3625.
Chae, J.H., Stein, G.H., and Lee, J.E. 2004. NeuroD: The pre-dicted and the surprising. Mol. Cell 18: 271–288.
Chandarlapaty, S. and Errede, B. 1998. Ash1, a daughter cell-specific protein, is required for pseudohyphal growth of Sac-charomyces cerevisiae. Mol. Cell Biol. 18: 2884–2891.
Cook, J.G., Bardwell, O., and Thorner, J. 1997. Inhibitory andactivating functions for MAPK Kss1 in the S. cerevisiae fila-mentous-growth signalling pathway. Nature 390: 85–88.
Euskirchen, G., Royce, T.E., Bertone, P., Martone, R., Rinn, J.L.,Nelson, F.K., Sayward, F., Luscombe, N.M., Miller, P., Ger-stein., M., et al. 2004. CREB binds to multiple loci on humanchromosome 22. Mol. Cell Biol. 24: 3804–3814.
Feroli, F., Carignani, G., Pavanello, A., Guerreiro, P., Azevedo,D., Rodrigues-Pousada, C., Melchioretto, P., Panzeri, L., andAgostoni Carbone, M.L. 1997. Analysis of a 17.9 kb regionfrom Saccharomyces cerevisiae chromosome VII reveals thepresence of eight open reading frames, including BRF1(TFIIIB70) and GCN5 genes. Yeast 13: 373–377.
Gancedo, J.M. 2001. Control of pseudohyphae formation in Sac-charomyces cerevisiae. FEMS Microbiol. Rev. 25: 107–123.
Gavrias, V., Andrianopoulos, A., Gimeno, C.J., and Timberlake,W.E. 1996. Saccharomyces cerevisiae TEC1 is required forpseudohyphal growth. Mol. Microbiol. 19: 1255–1263.
Gietz, R.D. and Woods, R.A. 2002. Transformation of yeast bylithium acetate/single-stranded carrier DNA/polyethyleneglycol method. Methods Enzymol. 350: 87–96.
Gimeno, C.J. and Fink, G.R. 1994. Induction of pseudohyphalgrowth by overexpression of PHD1, a Saccharomyces cerevi-siae gene related to transcriptional regulators of fungal de-velopment. Mol. Cell Biol. 14: 2100–2112.
Gimeno, C.J., Ljungdahl, P.O., Styles, C.A., and Fink, G.R.1992. Unipolar cell divisions in the yeast S. cerevisiae lead tofilamentous growth: Regulation by starvation and RAS. Cell68: 1077–1090.
Goldstein, A.L. and McCusker, J.H. 1999. Three new dominantdrug resistance cassettes for gene disruption in Saccharomy-ces cerevisiae. Yeast 15: 1541–1553.
Halder, G., Callaerts, P., and Gehring, W.J. 1995. Induction ofectopic eyes by targeted expression of the eyeless gene inDrosophila. Science 267: 1788–1792.
Harbison, C.T., Gordon, D.B., Lee, T.I., Rinaldi, N.J., Macisaac,K.D., Danford, T.W., Hannett, N.M., Tagne, J.B., Reynolds,D.B., Yoo, J., et al. 2004. Transcriptional regulatory code of a
eukaryotic genome. Nature 431: 99–104.Horak, C.E. and Snyder, M. 2002. ChIP–chip: A genomic ap-
proach for identifying transcription factor binding sites.Methods Enzymol. 350: 469–483.
Horak, C.E., Luscombe, N.M., Qian, J., Bertone, P., Piccirrillo,S., Gerstein, M., and Snyder, M. 2002. Complex transcrip-tional circuitry at the G1/S transition in Saccharomyces ce-revisiae. Genes & Dev. 16: 3017–3033.
Iyer, V.R., Horak, C.E., Scafe, C.S., Botstein, D., Snyder, M., andBrown, P.O. 2001. Genomic binding sites of the yeast cell-cycle transcription factors SBF and MBF. Nature 409: 533–538.
Kobayashi, O., Suda, H., Ohtani, T., and Sone, H. 1996. Molecu-lar cloning and analysis of the dominant flocculation geneFLO8 from Saccharomyces cerevisiae. Mol. Gen. Genet.251: 707–715.
Kubler, E., Mosch, H.U., Rupp, S., and Lisanti, M.P. 1997.Gpa2p, a G-protein !-subunit, regulates growth and pseudo-hyphal development in Saccharomyces cerevisiae via acAMP-dependent mechanism. J. Biol. Chem. 272: 20321–20323.
Lambrechts, M.G., Bauer, F.F., Marmur, J., and Pretorius, I.S.1996. Muc1, a mucin-like protein that is regulated by Mss10,is critical for pseudohyphal differentiation in yeast. Proc.Natl. Acad. Sci. 93: 8419–8424.
Lee, J.E., Hollenberg, S.M., Snider, L., Turner, D.L., Lipnick, N.,and Weintraub, H. 1995. Conversion of Xenopus ectoderminto neurons by NeuroD, a basic helix–loop–helix protein.Science 268: 836–844.
Lee, T.I., Rinaldi, N.J., Robert, F., Odom, D.T., Bar-Joseph, Z.,Gerber, G.K., Hannett, N.M., Harbison, C.T., Thompson,C.M., Simon, I., et al. 2002. Transcriptional regulatory net-works in Saccharomyces cerevisiae. Science 298: 799–804.
Levine, M. and Davidson, E.H. 2005. Gene regulatory networksfor development. Proc. Natl. Acad. Sci. 102: 4936–4942.
Liu, H., Styles, C.A., and Fink, G.R. 1993. Elements of the yeastpheromone response pathway required for filamentousgrowth of diploids. Science 262: 1741–1744.
———. 1996. Saccharomyces cerevisiae S288C has a mutationin FLO8, a gene required for filamentous growth. Genetics144: 967–978.
Lo, W.S. and Dranginis, A.M. 1998. The cell surface flocculinFlo11 is required for pseudohyphae formation and invasionby Saccharomyces cerevisiae. Mol. Biol. Cell. 9: 161–171.
Longtine, M.S., McKenzie III, A., Demarini, D.J., Shah, N.G.,Wach, A., Brachat, A., Philippsen, P., and Pringle, J.R. 1998.Additional modules for versatile and economical PCR-basedgene deletion and modification in Saccharomyces cerevi-siae. Yeast 14: 953–961.
Lorenz, M.C. and Heitman, J. 1997. Yeast pseudohyphal growthis regulated by GPA2, a G protein ! homolog. EMBO J.16: 7008–7018.
———. 1998a. The MEP2 ammonium permease regulates pseu-dohyphal differentiation in Saccharomyces cerevisiae.EMBO J. 17: 1236–1247.
———. 1998b. Regulators of pseudohyphal differentiation inSaccharomyces cerevisiae identified through multicopy sup-pressor analysis in ammonium permease mutant strains. Ge-netics 150: 1443–1457.
Lorenz, M.C., Muir, R.S., Lim, E., McElver, J., Weber, S.C., andHeitman, J. 1995. Gene disruption with PCR products inSaccharomyces cerevisiae. Gene 158: 113–117.
Luscombe, N.M., Royce, T.E., Bertone, P., Echols, N., Horak,C.E., Chang, J.T., Snyder, M., and Gerstein, M. 2003. Ex-pressYourself: A modular platform for processing and visu-alizing microarray data. Nucleic Acids Res. 31: 3477–3482.
Target hub proteins as master regulators
GENES & DEVELOPMENT 447
Cold Spring Harbor Laboratory Press on November 11, 2010 - Published by genesdev.cshlp.orgDownloaded from
Madhani, H.D. and Fink, G.R. 1997. Combinatorial control re-quired for the specificity of yeast MAPK signaling. Science275: 1314–1317.
Madhani, H.D., Galitski, T., Lander, E.S., and Fink, G.R. 1999.Effectors of a developmental mitogen-activated protein ki-nase cascade revealed by expression signatures of signalingmutants. Proc. Natl. Acad. Sci. 96: 12530–12535.
Martinez-Anaya, C., Dickinson, J.R., and Sudbery, P.E. 2003. Inyeast, the pseudohyphal phenotype induced by isoamyl al-cohol results from the operation of the morphogenesischeckpoint. J. Cell. Sci. 116: 3423–3431.
Martone, R., Euskirchen, G., Hartman, S., Royce, T.E., Lus-combe, N.M., Rinn, J.L., Nelson, F.K., Miller, P., Gerstein,M., Weissman, S., et al. 2003. Distribution of NF-%B-bindingsites across human chromosome 22. Proc. Natl. Acad. Sci.100: 12247–12252.
Melcher, K. 2000. A modular set of prokaryotic and eukaryoticexpression vectors. Anal. Biochem. 277: 109–120.
Milo, R., Shen-Orr, S., Itzkovitz, S., Kashtan, N., Chklovskii, D.,and Alon, U. 2002. Network motifs: Simple building blocksof complex networks. Science 298: 763–764.
Pan, X. and Heitman, J. 1999. Cyclic AMP-dependent proteinkinase regulates pseudohyphal differentiation in Saccharo-myces cerevisiae. Mol. Cell Biol. 19: 4874–4887.
———. 2000. Sok2 regulates yeast pseudohyphal differentiationvia a transcription factor cascade that regulates cell–cell ad-hesion. Mol. Cell Biol. 20: 8364–8372.
———. 2002. Protein kinase a operates a molecular switch thatgoverns yeast pseudohyphal differentiation. Mol. Cell Biol.22: 3981–3993.
Pan, X., Harashima, T., and Heitman, J. 2000. Signal transduc-tion cascades regulating pseudohyphal differentiation of Sac-charomyces cerevisiae. Curr. Opin. Microbiol. 3: 567–572.
Prinz, S., Avila-Campillo, I., Aldridge, C., Srinivasan, A., Dimi-trov, K., Siegel, A.F., and Galitski, T. 2004. Control of yeastfilamentous-form growth by modules in an integrated mo-lecular network. Genome Res. 14: 380–390.
Ren, B., Robert, F., Wyrick, J.J., Aparicio, O., Jennings, E.G.,Simon, I., Zeitlinger, J., Schreiber, J., Hannett, N., Kanin, E.,et al. 2000. Genome-wide location and function of DNAbinding proteins. Science 290: 2306–2309.
Robertson, L.S. and Fink, G.R. 1998. The three yeast A kinaseshave specific signaling functions in pseudohyphal growth.Proc. Natl. Acad. Sci. 95: 13783–13787.
Rudnicki, M.A., Schnegelsberg, P.N.J., Stead, R.H., Braun, T.,Arnold, H.H., and Jaenisch, R. 1993. MyoD or Myf-5 is re-quired for the formation of skeletal muscle. Cell 75: 1351–1359.
Rupp, S., Summers, E., Lo, H.J., Madhani, H., and Fink, G. 1999.MAP kinase and cAMP filamentation signaling pathwaysconverge on the unusually large promoter of the yeastFLO11 gene. EMBO J. 18: 1257–1269.
Tapscott, S.J. 2005. The circuitry of a master switch: Myod andthe regulation of skeletal muscle gene transcription. Devel-opment 132: 2685–2695.
van Dyk, D., Pretorius, I.S., and Bauer, F.F. 2005. Mss11p is acentral element of the regulatory network that controlsFLO11 expression and invasive growth in Saccharomycescerevisiae. Genetics 169: 91–106.
Ward, M.P., Gimeno, C.J., Fink, G.R., and Garrett, S. 1995.SOK2 may regulate cyclic AMP-dependent protein kinase-stimulated growth and pseudohyphal development by re-pressing transcription. Mol. Cell Biol. 15: 6854–6863.
Weintraub, H., Tapscott, S.J., Davis, R.L., Thayer, M.J., Adam,M.A., Lassar, A.B., and Miller, A.D. 1989. Activation ofmuscle-specific genes in pigment, nerve, fat, liver, and fibro-
blast cell lines by forced expression of MyoD. Proc. Natl.Acad. Sci. 86: 5434–5438.
Zeitlinger, J., Simon, I., Harbison, C.T., Hannett, N.M., Volkert,T.L., Fink, G.R., and Young, R.A. 2003. Program-specific dis-tribution of a transcription factor dependent on partner tran-scription factor and MAPK signaling. Cell 113: 395–404.
Borneman et al.
448 GENES & DEVELOPMENT
Cold Spring Harbor Laboratory Press on November 11, 2010 - Published by genesdev.cshlp.orgDownloaded from