tardir/mig/a329158 - defense technical information … b: setup procedures to operate & run ccd...
TRANSCRIPT
PL-TR-97-2024
OPTICAL DIAGNOSTICS OF IONOSPHERIC STRUCTURES AND DYNAMICS
Robert H. Eather Peter Ning
Keo Consultants 27 Irving Street Brookline, MA 02146
7 February 1997
Final Report 1 April 1993-30 September 1996
Approved for public release; distribution unlimited
19970916 153 DTIC QUALITY INSPECTED S
PHILLIPS LABORATORY Directorate of Geophysics AIR FORCE MATERIEL COMMAND HANSCOM AFB, MA 01731-3010
This technical report has been reviewed and is approved for publication.
Ipf&cO CUJJ/6ct. x/c<^<X^i^
HOWARD W. KUENZLER Contract Manager
EDWARD WEBER Branch Chief
DAVID HARDY Division Director
This report has been reviewed by the ESC Public Affairs Office(PA) and is releasable to the National Technical Information Service (NTIS).
Qualified requestors may obtain additional copies from the Defense Technical Information Center (DTIC). All others should apply to the National Technical Information Service (NTIS).
If your address has changed, if you wish to be removed from the mailing list, or if the addressee is no longer employed by your organization, please notify PL/IM, 29 Randolph Road, Hanscom AFB, 01731-3010. This will assist us in maintaining a current mailing list.
MA
Do not return copies of this report unless contractural obligations or notices on a specific document require that it be returned.
REPORT DOCUMENTATION PAGE Form Approved OMB No. 0704-0188
Public reporting burden for this collection of information is estimated to average 1 hour per response, including the time for reviewing instructions, searching existing data sources, gathering and maintaining the data needed, and completing and reviewing the collection of information. Send comments regarding this burden estimate or any other aspect of this collection of information, including suggestions for reducing this burden, to Washington Headquarters Services, Directorate for Information Operations and Reports, 1215 Jefferson Davis Highway, Suite 1204, Arlington, VA 222024302, and to the Office of Management and Budget, Paperwork Reduction Project 10704-0188), Washington, DC 20503.
1. AGENCY USE ONLY (Leave blank) 2. REPORT DATE
07 FEB 1997
3. REPORT TYPE AND DATES COVERED
Final - 01APR1993 - 30SEP1996 4. TITLE AND SUBTITLE
Optical Diagnostics of Ionospheric Structures and Dynamics
6. AUTHOR(S)
Robert H. Eather Peter Ning
5. FUNDING NUMBERS
PE61102F PR2310TAGH WUAD
Contract: F19628-93-C-0053
7. PERFORMING ORGANIZATION NAME(S) AND ADORESS(ES)
Keo Consultants 27 Irving St. Brookline, MA 02146
8. PERFORMING ORGANIZATION REPORT NUMBER
9. SPONSORING/MONITORING AGENCY NAME(S) AND ADDRESS(ES)
Phillips Laboratory 29 Randolph Road Hanscom AFB MA 01731-3010
Contract Manager: Mr. Howard Kuenzler/GPIA
10. SPONSORING/MONITORING AGENCY REPORT NUMBER
PL-TR-97-2024
11. SUPPLEMENTARY NOTES
12a. DISTRIBUTION AVAILABILITY STATEMENT
Approved for public release; distribution unlimited
12b. DISTRIBUTION CODE
13. ABSTRACT (Maximum 200 words/
Keo Consultants participated in the research of the Ionospheric Applications Branch at Phillips Laboratory, by implementing improvements in research optical instrumentation (imagers and photometers). This research involved numerous field trips to study aurora, airglow, ionospheric scintillations, barium releases, and heater experiments. Keo customized instrument control software for each application, and developed software to display the resultant images and compared with other data sets.
14. SUBJECT TERMS
Optical instrumentation; Imagers; Photometers; Scintillation measurements; Aurora; Airglow
17. SECURITY CLASSIFICATION OF REPORT
Unclassified
18. SECURITY CLASSIFICATION OF THIS PAGE
Unclassified
19. SECURITY CLASSIFICATION OF ABSTRACT
Unclassified
15. NUMBER OF PAGES
114 16. PRICE CODE
20. LIMITATION OF ABSTRACT
SAR Standard Form 298 (Rev. 2-89) (EG) Prescribed by ANSI Std. 239.18 Designed using Perform Pro, WHS/DIOR, Oct 94
Table of Contents
1. CONTRACT OBJECTIVES 1
2. HARDWARE SUPPORT 2
3. SOFTWARE DEVELOPMENT 20
4. DATA ANALYSIS 35
5. LIAISON OF PL/GPIA WITH THE BROADER SCIENTIFIC COMMUNITY ...52
6. SCIENTIFIC REPORTS, JOURNAL ARTICLES 56
7. PERSONNEL 57
8. PROCUREMENT 58
9. TRAVEL 59
Appendix A: Source Code to Operate ASIP-II Filter Wheel & lntensifier..61
Appendix B: Setup Procedures to Operate & Run CCD Camera 63
Appendix C: ASIP-II Setup/Start Instructions 65
Appendix D: MIP Imager Setup Summary 67
Appendix E: MIP Software Version 5.3.6 Release Notes 83
Appendix F: HDRFIX Software Documentation Version 1.1 89
Appendix G: Shell Script to Compress Data Files 97
Appendix H: DIP Dialup Script Used at Ancon, Peru 99
Appendix I: MIPCTL Monitor Calibration 101
Appendix J: Active Experiments Newsletter Volume 1 109
in
1. Contract Objectives
The Ionospheric Applications Branch at the AF Phillips Laboratory (AFPL)
is actively engaged in ionospheric research programs to investigate the
fundamental processes controlling ionospheric structure and dynamics, and to
quantify effects of disturbed ionospheric regions on the operation of AF
communications and navigation systems. The experimental programs employ a
variety of diagnostic techniques including ground based Digital Ionospheric
Sounders, Incoherent Scatter Radars, Scintillation Measurements, Imaging
Photometers, and Scanning Photometers. These diagnostics are often
coordinated with satellite based in situ measurements of energetic particle
precipitation characteristics, and thermal plasma density, density fluctuation, and
plasma drift measurements. The goal of this research is to understand the basic
physical processes which control ionospheric structure and dynamics by
combining simultaneous information from multiple diagnostic instruments. These
studies have previously been conducted both from the ground and from a
specially instrumented research aircraft (the Airborne Ionospheric Observatory,
AIO), but in the future these experiments will be conducted only from ground
stations.
Keo Consultants responsibility was to assist in the conduct of this
research program as follows:
(a) Maintain and upgrade instrumentation.
(b) Improve and develop operating software for instrument control.
(c) Develop software for data analysis and display.
(d) Assist in planning and conducting field campaigns.
(e) Assist in data analysis and interpretation, and publishing of results.
(f) Make recommendations for future research programs.
To this end, Keo provided a full-time hardware/software engineer based at
PL/GPIA, and part-time consultants with expertise in optical instrumentation,
instrumentation control software, scientific analysis, and overall program
planning and liason with the broader scientific community.
2. Hardware Support
Keo was responsible for the operation, maintenance, and repair of several
research and analysis instrumentation systems. These primarily optical systems
were taken to field to obtain ionospheric measurements. The complement of
instruments included the Miniature Imaging Photometer (MIP), High Frequency
Active Auroral Research Program Photometer (HAARP), All-sky Imaging
Photometer-ll (ASIP-II), two (upgraded from 35mm film-based) imaging cameras,
and various NTSC video-based intensified cameras. Other ancillary systems
included a multi-instrumented HAARP Azimuth/Elevation Mount, a 35mm film
digitizer, SGI-workstation for data analysis, and several variations of PC-based
Scintillation/GPS data-server/telephony systems (also called RASWS - Remote
Access Scintillation Warning System).
The following chronologically lists the main areas of hardware
development, upgrading and maintenance during this Contract:
1st Quarter: 1. Two portable 386 PC computers with voicemail cards were provided by
PL/GPIA for the RASWS project; one unit was used as an in-house demo
system and the second unit was deployed out in the field. KEO provided
memory upgrades and mouse input devices for these systems in order to
support software development under Microsoft's Windows 3.1 operating system.
Tools, cables, connectors, and telephony products were purchased to facilitate
interfacing RASWS to phone networks.
2. The first operational RASWS system was installed at the SRI Incoherent
Scatter Radar Facility in Sondrestrom, Greenland. One concern about the dry
environment there was static discharging. A discharging "rug" made from a wire
mesh screen was attached to the two RASWS PC's chassis and to an earth
ground from the building's frame. This eliminated regular crashes to both PC's
when personnel approached and interacted with the system.
3. The in-house RASWS demo unit was installed for demonstration at Phillips
Lab Science and Technology Spring Review in Albuquerque, NM. The voice
scripting file was identical to the one installed at Sondrestrom. Calls to
Sondrestrom were placed at the Review to demonstrate its access capabilities.
4. MIP's rear shutter was sent back to Melles-Griot for refurbishing since its
reliability was compromised due to the rain damage on the '92 CRRES
campaign. It was reinstalled in the MIP and tested with a test routine written in
FORTH and downloaded onto the MIP instrument. Testing showed that the
shutter was working reliably (>1,000 operations without failure).
2nd Quarter: 1. Preparations were made for permanent installation of The ASIP-II system at
NSF's Early Polar Cap Observatory (EPCO) located at Resolute Bay, NWT,
Canada. This system needed to be operated on a non-campaign mode for an
entire winter period. Data recording media cost considerations motivated us to
switch from Magneto Optical recording to a less expensive time-lapsed VTR
system. One tape lasts up to a week. Inquiries were made on the Panasonic
models AG-6040, AG6020, AG-1 050, AG-6760, and AG6730. However, all
were limited by their field only recording mode. We acquired the Sony Time
Lapse VTR model EVT-801 which provides full-frame recording and gives twice
the horizontal resolution. KEO has had previous experience using this unit on
"unattended" auroral imaging systems.
3rd Quarter:
1. ASIP-II modifications for the EPCO installation were completed. They
included the addition of a light sensor to shut down the intensifier should any
bright light source be present. The 8mm Sony Time-Lapse Video Recorder,
procured the previous quarter, was integrated into this system as the primary
data recording medium. A digitally controlled AC switch was added to the filter
wheel/intensifier chassis to allow software control over turning on/off of the Video
Recorder. A GOES clock unit with a serial interface was added to ASIP-II for
real-time verification.
2. The light sensor failed to work reliably during ASIP-ll's installation.
Adjustments to the threshold potentiometer did not produce consistent cut-off
levels, so the sensor was disengaged for the duration of ASIP-ll's operation.
Initial videotapes from ASIP-II indicated good measurements of polar cap
auroras. Occasional switching of the site's power generators had halted
operation of ASIP-II. A good Uninterruptable Power Supply (UPS) of at least 1
KVA was recommended to eliminate this problem.
3. The HAARP camera experienced its first field test alongside the MIP camera
during the RODEOVI Campaign in Sondrestrom, Greenland. For the most part
the HAARP camera performed well. Both systems shared a common
mechanical problem with the shutter microswitches. Occasional bad readings of
shutter state reported to the software application halted the data acquisition
cycle. The work around for this was to change the error reporting level by the
camera controller's 68HC11 processor. This was done by changing the value of
the FORTH variable holding the error-reporting level via the MS-DOS Terminal
application.
4th Quarter:
1. The HAARP Az/EI mount was delivered to AFPL. After initial testing, the
mount was returned to Sagebrush Technologies, Inc. to correct some problems
encountered with its mechanical stability. When the mount was returned to
AFPL, it was found to be mechanically stable. The control electronics were
tested and found to be reliable and flexible. The wiring delivered with the mount
(specified as test cables) will need to be upgraded for field use. Detailed wiring
documentation was provided with the mount.
5th Quarter: 1. The HAARP azimuth/elevation drive mount was used to support tracking of a
rocket with both HAARP and MIP imagers and video cameras attached. The two
imagers were attached on opposing mount side plates with centers of gravity
close to the elevation motor drive axis. Makeshift brackets and a base for the
HAARP imager were fabricated to support the LEAP rocket launch experiments.
Two video cameras, one BAA/ and one color, were attached to the mount's top
plate. A sodium filter was placed in front of the BAA/ camera. Neutral density
filters were installed on the ASIP cameras to reduce intensities to a usable level.
These video images were recorded on standard VHS tape. The Az/EI mount
under joystick control provided adequate tracking during the critical initial rocket
plume generation immediately after liftoff. However, tracking was lost
momentarily due to the slew rate limitation of the elevation drive; the software
speed setting had already been set to its maximum.
2. The mount motors were re-wired in parallel to give a maximum velocity of
about 15 degrees/sec so as to facilitate rocket tracking; the default serial
configuration limited slew velocity to 7.5 degrees/sec. There were still some
problems with the mount drive cables occasionally jumping the guide grooves.
3. Several problems on the HAARP Imager were fixed this quarter. The
intensifier temperature readout failure resulted from intermittent wiring in the
intensifier connector to the control panel inside the imager. The shutter limit
micro-switches were found again to be intermittent, and it was concluded that
these switches inside the Melles-Griot shutters were not reliable enough to
determine whether the shutters were opening fully. However, the shutters
seemed to be working reliably in the field.
4. New filter wheel EPROMs were installed in both the HAARP and the MIP
imagers this quarter to improve filter wheel reliability. These new EPROMs
checked for position errors and then slewed to the next position if an error was
detected. In almost all cases this corrected this problem automatically.
5. The optics of both the MIP and the HAARP were examined this quarter to see
if we could improve both the vignetting and the resolution of the imagers. The
curvature correction lens mounted in the MIP was found to have a focal length of
-50mm which was much stronger than specified, so must have been installed in
error. Through experience, KEO has found that reversing the last achromatic
lens in the collimating tube (the close-up lens) significantly increased the image
resolution, even though it is opposite of what is determined with optics design
software. Reversing this lens, and installing a -100mm focal length curvature
correction lens, increased image resolution and reduced vignetting of the MIP
image. Reversal of the close-up lens was also carried out on the HAARP
imager. Both imagers were tested in the lab and in the field, and found to have a
much improved resolution, especially the MIP imager.
6. During the LEAP campaign, there were some intermittent problems with the
MIP imager computer system, probably due to the high heat and humidity of the
field operating conditions. Dry Nitrogen was fed through the computer's hard
drive chassis to try to prevent computer crashes. The MIP 386 computer had to
be operated with the cover off to get as much ventilation and cooling as possible.
We also kept the air conditioner, albeit weak, running in the vehicle which
housed the computers. But the extreme humid environment caused the hard
disk and optical disk drive to fail during pre-launch instrument checkouts.
6th Quarter:
1. An aluminum base platform was constructed for the HAARP camera head to
allow both this imager and the MIP camera to be mounted on HAARP's Azimuth
and Elevation Drive Mount.
2. An electronics enclosure was designed and fabricated to mount all the Az/EI
Mount electronics and interface to MS-type connectors. The enclosure fitted
neatly into a shipping container, and had fans for heat ventilation. It was also
designed to easily mount on a wall (for eventual installation at the HAARP
facility). Cabling had been ordered to allow a 50' separation from the mount. A
desktop enclosure was fabricated to hold the control panel and joystick control,
also with a 50' cable to connect to the electronics unit. Thus, there was a total of
100' of cable between the operator control and the mount. (Low-temperature
cabling was not procured due to high cost; it was decided to wait on this until the
actual installation at the HAARP facility has been determined.)
3. The Melles Griot shutters for both the MIP and HAARP imagers were
disassembled for cleaning and evaluation, as they had been failing at times
during field campaigns. Extreme wear was found, explaining the operational
problems. The shutters were modified and adjusted on a rush basis for the Chile
campaign, and fortunately no failures resulted during that trip. Keo contacted
Melles Griot, and was informed that these large shutters are only rated at 50,000
operations (not mentioned in the Melles Griot literature!). At our data rates, this
lifetime can be reached in just two field trips. This was consistent with our
experience with both new and rebuilt shutters from Melles Griot. Melles Griot
has now agreed to modify wear-critical parts to hardened versions, so we have
decided to have the shutters rebuilt yet again and see how they perform. This
was a more affordable and time efficient approach, rather than replacing the
shutters altogether. (However a new model Pronto shutter is available with a
rated lifetime of 106 operations.)
4. A simple plywood platform was constructed to hold two commercial video
cameras (one color, and the other, B/W with a sodium filter) on one tripod to
manually hand track the plume of a rocket.
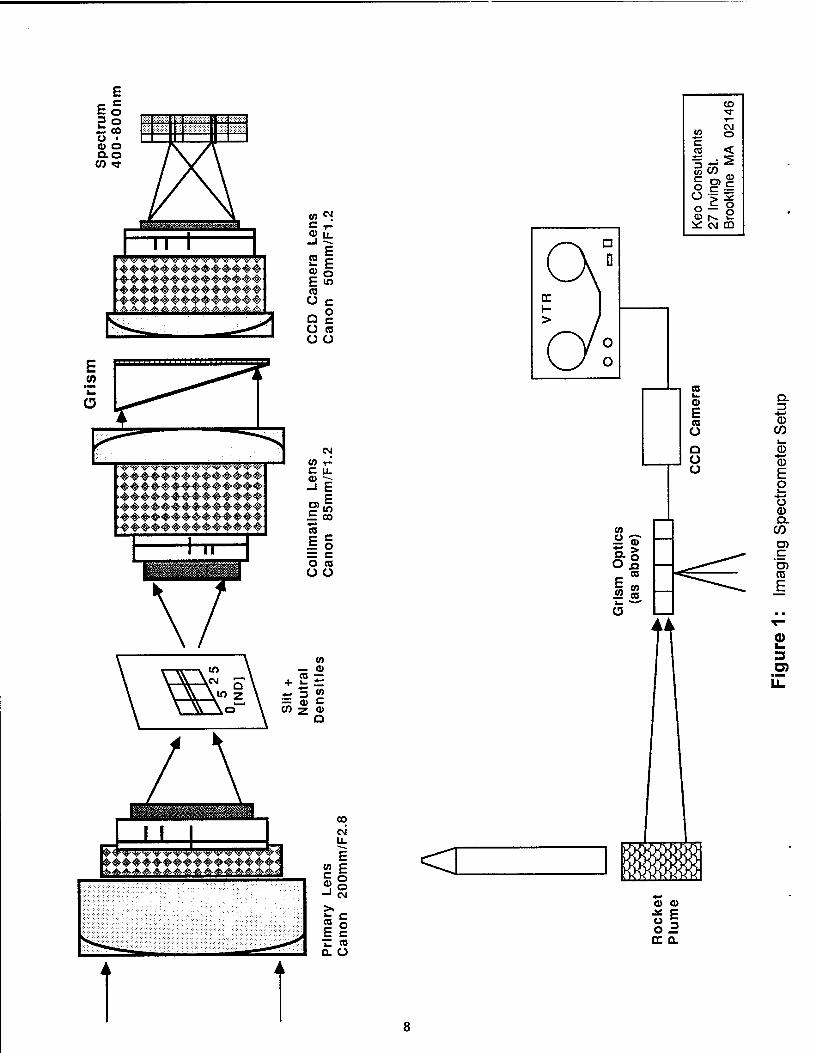
5. An imaging spectrometer was constructed, mostly from available Keo optical
components, for rocket plume imaging. The optical setup is shown in Figure 1.
J ■ ' m
CO
CM u. £
•g -1 CM
>. m C
Eg D. O
;^. ^
CO •* T— CM CO O
c re < 3 2
C o O)
f- 0}
Ü o
.a: o o i«: CM CD
0) E
Q.
CO CD Ü CO
I— Q 0) Ü CD Ü E
o «4—» Ü CO Q.
CO D)
.. c D) co E
o I» 3
<t> o
o 2 DC a
6. An "RG-9", 7500 A low-pass cut-off filter, was added to MIP's repertoire of
available filters. This particular filter was requested by PL so as to attempt to
measure gravity waves. In addition, a grism was designed and procured for the
MIP, to allow spectrographic imaging over the range 4000-8000 A.
7. KEO provided support in the construction of a plywood based frame to hold
the newly delivered Doppler Imager (DIM) camera head. KEO supplied the
materials necessary to mount the head in a zenith pointing position.
8. KEO interfaced with Daedalus Enterprises, Inc.'s Randy Zywicki on
familiarizing ourselves with this instrument. This included stepping through the
operations of this instrument from initialization, data acquisition, to post
processing measured data. A considerable amount of engineering issues will
have to be addressed, both hardware and software, before this system becomes
scientifically useful.
9. A blur spot was noticed during initial checkout of the MIP optics in Chile using
a narrow field-of-view primary lens. All the lens stages were cleaned. It turned
out that a hair-line contaminant was found inside the sealed CCD vacuum
chamber. This was not serviceable out in the field; fortunately, with the all-sky
(180° FoV) lens, the blur spot was less noticeable. Every effort was made to
preserve the optical alignment during the lens cleaning process.
10.The MIP's 386-PC computer encountered similar boot up problems as in the
last quarter. However, this failure under extremely dry and moderately cool
conditions refuted our earlier suspicion that it was solely a heat and humidity
related problem. The problem systematically disappeared within one hour after
power-up, so it did not jeopardize our data acquisition window. A computer
upgrade to a 486 or Pentium CPU is planned to remove this problem, and at the
same time this will upgrade the performance to match that of the HAARP
computer.
11.The optical site in Chile provided an unfavorable condition for the imagers;
the proliferation of dust in the desert environment forced us to shield and cover
our shutters, keyboards, optical disks, and other air ducts on our instrument
components. Removable data disks had to be stored in sealed Zip-lock plastic
bags. Both imagers had to have portions of the primary all-sky lens taped up to
block out excessive illumination near the horizon from local lighting. Leafless
trees in the FoV near the horizon and random illumination from vehicle lights
were unavoidable and tolerated.
12. The tripod was damaged en route to Chile. A broken gear track on the
elevation axis rendered it unusable. A makeshift zenith-pointing plywood
platform was used to support the imagers.
7th Quarter:
1. The MIP imager, checked out with the new stand-alone software prior to
shipment, failed to operate in Svalbard. After lengthy telephone troubleshooting
sessions, the problem was narrowed down to the image intensifier unit, which
appeared to have failed. Constrained by limited resources and time left in the
observation window, no attempt was made to fix the problem in Svalbard. The
imager was shipped back to PL for evaluation and repair.
2. An instructional 1-hour videotape was made on how to install the MIP imager
camera head with HAARP's 486-PC computer. This included the proper cabling
assembly and a walk-through on using and setting up the software to acquire
measurements in both the stand-alone and attended mode of operating the
imager. This tape was included with the shipment up to Svalbard.
8th Quarter:
1. MIP was returned from Svalbard, Norway for evaluation following a
troubleshooting process that led us to believe a problem with the camera head's
image intensifier unit, specifically the power supply component. This unit was
disassembled and returned to the manufacturer, Vero, Inc., for failure mode
confirmation and repair, if possible. They found that the intensifier's sealed
vacuum tube had been broken (a rare occurrence from their experience), and
10
was deemed unrepairable. A new unit was ordered to get the MIP system
operational again.
2. This downtime has afforded us the opportunity to begin upgrading MIP's
computer subsystem from a 386 to 486 CPU. The physical form factor of the
computer chassis was changed from a bulky desktop to a mini-tower
configuration. This resulted in a 30 lb. shipping weight reduction by using a
smaller and lighter shipping case. The computational and operational
performance has been greatly enhanced with the 40MHz 486DX CPU as
compared with the 25MHz 386DX. The new CPU motherboard can
accommodate a 486DX4 at 100Mhz CPU should we have additional
performance needs. Other component upgrades included a 1 Gigabyte SCSI
Hard Disk, a high speed Localbus SCSI-11 HD controller card, and a 2 Meg
Localbus Video Adapter Card. These components were ordered along with a
15-inch Sony Multisync Monitor. All hardware identified above were made
available at PL/GPI at no cost to KEO.
3. The HAARP Azimuth/Elevation Mount was shipped back to the original
manufacturer, Sagebrush Technologies, Inc., for repair of out-of-tolerance
problems with platform stability.
4. KEO assisted with the successful installation of the Branch's Remote Access
Scintillation Warning System (RASWS) at Howard AFB, in the Panama Canal
Zone. The phone-voice mail sub-system performed well, even as occasional
volume drops on the phone line were noted.
5. Two more attempts were made to capture a spectral snapshot of optical
rocket plume signatures as part of a BMDO sponsored program at NASA's
Wallops Island Rocket Launch Facility. The first launch had to be abandoned
due to the unexpected delay/rescheduling by NASA; KEO and PL/GPIA had
other pressing commitments. The second launch was covered. The
grism/CCD/video - based optical system recorded a bloomed/saturated CCD
despite our best estimate of optical settings. A film-based spectrographic
camera system was operated by KEO for Technology International Corp., and
11

this yielded good results.
9th Quarter:
1. The ASIP-II camera system was returned from Resolute Bay, Canada for
evaluation and upgrade at Stanford Research International (SRI) in Menlo Park,
CA. The instrument was donated to NSF's Early Polar Cap Observatory (EPCO)
and will be operated by SRI with support from KEO. The checkout of the system
confirmed a bad SCSI hard disk. The system was able to boot and operate from
8-inch floppy disks. This was sufficient to functionally test the rest of the system.
The camera head, filter wheel/intensifier controller unit, and the Photometries
Camera Controller appeared to be working properly. The decision to upgrade
the computer system to a LINUX-PC platform was necessary in order to move
away from antiquated and unsupported hardware. KEO provided
recommendations and technical consultation to SRI for this upgrade. This
included working with SRI sub-contractors to deliver the interface controller
between the LINUX operating system and the Photometries Camera Controller
via a National Instruments Digital I/O card.
2. A low-light-level intensified CCD camera system (tripod mounted) was
assembled from existing KEO and PL/GPI inventory for preliminary
measurements of sprite phenomena. A range of various focal length lenses was
provided for field situation optimization. Other parts of the system included a S-
VHS Video Recorder and Time/Date Stamp Video Overlay Unit.
3. The development of the remote access communications system required the
purchase of several hardware components. They included high speed external
28.8 Kbaud v3.4 modems, network cards, and a laptop for field diagnostics. The
laptop's memory and hard disk requirements had to be sufficiently large to
accommodate the multi-tasking LINUX (Unix-based) operation system; 16 Meg
RAM and 800 Meg+ HD, respectively.
4. PL's visiting scientist, Dr. Joeran Moen was given a tutorial on the operation
of the HAARP Imager. He is now familiar with the setting up and running of the
12
acquisition software. The MIP camera head and HAARP's computer subsystem
was to be made available to Dr. Moen this winter in Longyearbyen, Svalbard for
auroral research and instruction in support of the new EISCAT radar facility.
10th Quarter:
1. The development of remote data access capabilities with Stanford Research
International's (SRI) Scintillation Receiver, SATSIN-II, required the purchase of a
Pentium-based PC configured to support real-time file server capabilities. This
included a 75Mhz processor, 16 Megabyte RAM, 1.2 Gigabyte IDE Hard Disk,
PCI-based Ethernet-combo Card, 2 Megabyte PCI-bus Video Card, and a 7
Gigabyte Exabyte 8mm Tape Drive. Along with a v.34bis 28.8 Kbaud external
modem, this PC was provided to SRI to complement SATSIN-II; the total system
is referred to as the PL/SRI RASWS (Remote Access Scintillation Warning
System).
2. KEO continued its participation with the ASIP-II lmager system upgrade by
working with SRI sub-contractor John Noto of Research Solutions, Inc. (RSI) to
deliver the interface controller driver software between the LINUX operating
system and the Photometries Camera Controller via a National Instruments
Digital I/O card. KEO made available the Camera Controller to RSI at PL,
provided technical specifications on the interface, and defined the acceptance
criteria for project completion. An initial checkout of the "pre-deliverable" driver
software was conducted at SRI by KEO with their Principal Investigator, Dr. Rick
Doe. Much effort was spent on probing the interface behavior using a logic
analyzer and it was determined that desired signal conditioning was not met. No
effort was made to connect the camera head to the system until camera
controller communications has been verified. Our findings were provided to RSI.
Further code development and testing was necessary. RSI personnel's non-
availability at SRI made the test and evaluation process of their camera
controller driver software very difficult, as describing signal behaviors over the
phone and fax was not very productive. Much of RSI code development efforts
13
in Boston were hampered by the lack of proper test instrumentation, particularly
a good logic analyzer. KEO's further participation on this project required both
RSI personnel and adequate test instrumentation to be simultaneously available.
This recommendation was made clear to PL and SRI.
3. The 35mm film-based all-sky imagers from Qaanaaq, Greenland and Ny
Alesund, Svalbard were returned to KEO for conversion to video-based
recording. Machining work and optical upgrades were completed and they are
now configured with commercial NTSC output CCD Cameras. Sony 8mm time-
lapse video recorders were ordered for image storage. Hardware was designed
to update the old electronics system and a new circuit board for shutter and
image intensifier control was designed and fabricated. An inexpensive RS-170
ISA frame-grabber was specified for the computer control system. This allowed
freezing the integrated image, putting text into the image overlay, and outputting
to the time-lapse recorder. In addition, the frame grabber gives the instruments
digital storage capability if needed in the future, and also the ability to integrate
the instruments into a network environment to retrieve data sets remotely.
4. KEO coordinated the calibration and preparation of the MIP camera system
for delivery to Dr. Joeran Moen of the University Courses at Svalbard as a loan
from PL. The computer system was purged of all unnecessary files to maximize
available disk space. A 4278A N2+ filter was ordered to replace the current one
contaminated by moisture.
5. KEO provided purchasing recommendations to PL and Boston College of
site-specific "data-concentrator" PC systems to be used in PL's remote data
access program for its field instruments. This includes modems and GPS
receivers.
11th Quarter:
1. INTERNET-related hardware was procured for the installation, evaluation,
and testing, of the remote access data collector system. They included a
network repeater box and a signal coupling translator. The former provided local
14
inter-system integrity when a host network system is down while the latter
ensured network media compatibility between RJ-45 and BNC connections.
2. The conversion of the 35mm film-based all-sky imagers from Qaanaaq,
Greenland and Ny Alesund, Svalbard to computer controlled CCD based
systems was completed in this quarter. PL provided the two computers at no
cost to KEO. KEO purchased low cost frame grabber boards from ImagiNation
Corp. to digitize the NTSC outputs of the commercial CCD Cameras. The image
archival subsystem was a Sony 8mm time-lapse video recorder. Viewing was
done both on the PC monitor and a 9-inch black and white television monitor.
The video recorder, TV monitor, and the camera controller unit are rack mounted
in a self-supported steel chassis.
3. In Chile, KEO conducted training on the routine operation and maintenance
of the data server PC installed at UCN. KEO time was spent assisting Bob
Livingston with antennae and cable installations at UCN. Additionally, KEO
conducted site surveys in Arica and nearby Antofagasta in support for the
upcoming 1996 PL/GPI Equatorial Campaign in March. Video and photo footage
were taken.
4. KEO provided instructional assistance to Dr. Juan Rodriguez with the
operation of the upgraded CCD-based all-sky imagerto be installed in Qaanaaq,
Greenland.
5. The MIP all-sky imager on loan to the University Courses at Svalbard
experienced some initial problems. One immediately addressed was the MS-
DOS directory limitation; only 500 files can be stored at the top level directory.
The solution was to store image files only in sub-directories which does not have
this limitation. As always with shipping, much of the PC internals had to be
checked and reseated prior to initial power up. The rear shutter was left opened
throughout the campaign as they believed that it was not operating correctly.
12th Quarter:
15
1. A special ribbon cable was constructed from a DB-25 pin connector to a 50-
pin IDC connector as part of ASIP-ll's system upgrade. This connection routed
TTL-level control signals from a PC's parallel printer port (LPT1) to ASIP-ll's filter
wheel and intensifier controller interface. The pin assignments are documented
in the driver software source code file, "Ipio.c" (see Appendix A). This was done
to allow a PC-based UNIX operating system (LINUX) to control ASIP-ll's filter
wheel position and intensifier gain.
2. The MIP all-sky camera system was returned from Svalbard, Norway.
Concern over possible intermittent failures of the rear shutter was investigated.
After careful examination, no noticeable failure was found during bench testing.
3. Three KEO all-sky imaging systems were checked out for deployment -
HAARP, MIP, and the recently converted CCD-based (from 35mm film-based)
intensified 4-position filter wheel camera. Magneto-Optical (MO) disks for
HAARP and MIP were recycled and re-formatted to provide up to 100 recording
hours each for a typical acquisition cycle (4 images per minute at 2x2 binning).
Sufficient 8mm NTSC video cassettes were sourced at AFPL to provide
extended time-lapse recording for the other camera. This camera is to be
deployed on a non-campaign basis in Chile for routine measurements.
4. KEO coordinated the shipment of other participants' instruments to AFPL for
the March 1996 Equatorial Campaign. Unfortunately, the campaign was
canceled due to the inability of the Air Force to secure permission to conduct
research in Chile. Most instruments were returned to the P.l.'s who had other
commintments for their instrumentation.
5. KEO worked with the Universidad Catolica in Chile with managing the
RASWS scintillation data. Problems with the on-campus INTERNET
connections prompted us to change network (IP) addresses. The host names in
their name servers were preserved for the two computers; they are
"plgpidatacon.cecun.ucn.cl" (146.83.124.79) and "rasws.cecun.ucn.cl"
(146.83.124.87). KEO had routinely retrieved and backed up monthly data files
in compressed format over the INTERNET to AFPL.
16
6. KEO attended the 1996 High Power RF Ionospheric Modification Workshop
in Santa Fe, New Mexico at the request of AFPL's HAARP Program to
demonstrate optical imaging capabilities of the HAARP imager to this scientific
community. Two image data sets, one auroral and one equatorial airglow, were
presented. Questions and answers were made available during the Optical
Diagnostics Tutorial and Poster Paper Sessions.
13th Quarter:
1. KEO configured and deployed an intensified CCD video system from existing
AFPL and KEO hardware to La Salle, Colorado in support of the branch's effort
to make sprite measurements. They appear as bright flashes of light above
normal lightning discharges and lasts only a few milliseconds. The field
deployable video system consisted of a tripod-mountable intensified camera
head assembly, an image intensifier controller unit, a detachable camera
controller unit, a B/W video monitor, an S-VHS video recorder, and a tripod.
Three primary commercial lens were made available, 20mm/F2.8, 24mm/F2.8,
and 50mm/F1.2 to provide 40, 33, and 16 degrees FoV (field of view)
respectively. The image intensifiers' sensitivity was adjusted with a 4 position
intensifier gain selector switch box. The CCD camera was set with the auto-gain
control defeated. An azimuth and elevation adjustable tripod was used to point
the camera to any desired position. Recording was done on a broadcast-grade
Panasonic S-VHS Video Recorder (model GA-7750) and includes an optional
time-code generator/reader board. Hence, all video frames had a time stamp
encoded in the "non-viewable" portion of the frame. Twenty blank S-VHS tapes
were purchased to provide 40 hours of measurements. KEO also trained others
to setup and conduct measurements. An operational checklist was written for
this purpose (see Appendix B).
2. An NTSC video digitization station was set up at AFPL's Optics Lab to
process the optical sprite data. We used the Panasonic GA-7355 S-VHS unit to
ensure image stability during digitization. This unit has a built-in digital frame
17
and field memory. A PC-based video frame grabber was borrowed from the
Chile-destined imaging system. The ImageNation CX100 frame grabber
provided 8-bit greyscale resolution of 512x486 image array size.
3. KEO set up a viewing station consisting of existing KEO video equipment (a
Sony 8mm Time Lapse Video Cassette Recorder, model EVT-801) to screen
and catalog filtered, all-sky, auroral data from Qaanaaq, Greenland. A
preliminary view of the data showed that the upgraded imager was working
properly. The 8mm data cartridges were routinely mailed to AFPL for screening
by Dr.. Katsura Fukui. Desired sequence of images was digitized using the
NTSC video frame grabber.
4. KEO installed and maintained an AFPL procured 35mm film media digitizer.
This professional grade unit, the Kodak RFS 2035 Plus Film Scanner, can
selectively digitize up to 2000 dpi (dots-per-inch) with 24-bit color pixel
resolution; both 35mm film negatives and slides (positives) can be scanned. The
primary use of this unit was to process 35mm black and white film based auroral
data from earlier KEO imagers. This unit interfaced with a PC via a SCSI cable
connection.
5. The time-code module on the Panasonic S-VHS Video Cassette Recorder
unit used for the Sprites '96 Campaign drifted considerably. We calculated a
loss of 4 seconds per hour of recording. This was very unusual for a broadcast
grade unit. Since a time accuracy on the order of +/- second (vs. milliseconds)
was acceptable, we were able to correct for this knowing the drift rate.
14th Quarter:
1. KEO worked with Dr. Cesar Valladares of Boston College at troubleshooting a
PL-sponsored remote data access computer in Ancon, Peru. This system
provided INTERNET access to scintillation and GPS data using a phone-based
SLIP connection to Lima's INTERNET hub. The LINUX-based PC failed to boot
into the scheduled data transfer mode and it was suspected that the PC's hard
disk was corrupted from power transients at the site. The rest of the system
18
appeared to be functional as verified by being able to boot a DOS operating
system from the floppy drive. The hard disk was sent back to PL for inspection.
PL maintained a functionally identical system that was used to check out the
Ancon system's hard disk. Both have the same NCR 53c series SCSI hard disk
controller card. But the 1.2 Gigabyte hard disks were from different vendors.
Ancon's Western Digital hard disk was tested inside the PL system. As
expected, it failed to boot. We tried to low-level format the hard disk without
success. To prevent delay in data gathering, we configured the exist PL
system's working hard disk to that of the broken unit. All network, scheduler, and
communications software were installed on the hard disk and system tested at
PL. Final installation instructions with Ancon's site personnel restored the
scintillation data access computer to prior operating conditions.
19
3. Software Development
Keo provided continuing software development, mostly for support of PL's
in-house optical-based field and lab instrumentation systems. Development and
upgrades typically fall under one of the following categories: data acquisition
(operational), data archiving (both file storage and retrieval), data conversion,
data analysis, data presentation, networking and communications, device
drivers, or 3rd party vendor software installation and configuration.
The overall goal was to optimize the performance of existing systems by
factoring in cost, speed, storage capacity, and user-friendliness. A great effort
was made to ensure (through upgrades and evaluation) that software remains
current in the fast-paced commercial computer market.
The delivered software support was driven by PL's needs, particularly with
field support and data analysis. Most of the work was conducted on PC-based
platforms running Microsoft's DOS/Windows 3.11 or Linux (UNIX) with code
development using the C-based language and compiler. The following
chronologically summarize the software development support provided under
this contract:
1st Quarter:
1. A major software upgrade on the voicemail portion of the RASWS system
was started to convert the previous non-Windows-based demo version to a
Windows-based application so that it would run concurrently with a Windows-
based SDRS data processing software on one physical PC platform; previously,
they ran on two separate PCs linked via serial ports. Microsoft C/C++ V7.0 and
DLL library support for the voicemail boards were used for developing the
Windows 3.1-based voice processing application software. Additional
application software "V-EDIT" from Pika, Inc. allowed us to generate and edit
voice script files used with our voice processing software. Key features of the
20
new voice processing system over the previous demo version were:
* Movable and sizable display windows.
* Logs number of calls into the system.
* Real-time phone session event monitor.
* Changeable phone session time limit.
* Changeable access code.
* Serial data stream monitor window.
* More naturally and smoother flowing voice scripts.
2. Software development for both the HAARP and the MIP imagers was carried
out this Quarter. Updates in the software from the HAARP contract were
installed and tested to be compatible with the MIP imager and its computer
system. The plotting facilities were revamped to provide more accurate manual
rescaling, and the ability to save the plot data in a text format that can easily be
imported into spreadsheet and statistics packages such as Microsoft Excel.
3. A window-based movie utility was written on the Miniature Imaging
Photometer (MIP) system. This gave us the capability to sequence a series of
image files on an RGB monitor for motion analysis. A list file containing the
filenames of a sequence of images was used as an index for the motion frames.
One selected start and stop frames, forward or reverse viewing, single step or
continuous mode, and the inter-frame period. Additionally, the user controlled
the dynamic range of the display by selecting the minimum and maximum values
used to scale the image pixels. Relevant parameters associated with each
image were displayed using red text fonts. This utility was used to make a
preliminary screening of data from the Spitsbergen '93 data set.
2nd Quarter:
1. The RASWS system was upgraded to address compatibility with site specific
phone systems. The ring characters of phone systems differed in duration and
segmentation, i.e. outside lines tend to generate "double rings", while in-house
extensions have single rings. This parameter must be acknowledged by the
21

voicemail board for proper automated pickup of the line. The software
application "RASWS.EXE" now takes a parameter argument on the command
line specifying the number of rings detected for pickup.
2. Both imagers were tested and upgraded with the latest software. The latest
software revision .MIPCTL v5.3.3, eradicated all known run-time bugs and used
a new utility to check all memory and resource allocation errors for the program.
Due to this, a much more robust operating system was developed. The camera
heads were upgraded with the latest FORTH drivers, MIP10.FOR.
3rd Quarter:
1. FORTH code development was required on ASIP-II for unattended operation.
The only user interaction necessary was to set the system clock and the start
and stop times for one or two observation windows. The filter, gain, exposure,
and cycle settings have been preset at Resolute. A key component of the
application software was the GOES clock support. A driver was written to read
the serial output of the GOES clock receiver. During data acquisition, any GOES
clock readings were displayed and recorded from the monitors; this was used to
validate the accuracy of the computer system clock. The user level FORTH
words can be found in the FORTH file "epco.txt" (see Appendix C).
2. The acquisition cycle time for MIP/HAARP's operation software was reduced
by initiating the filterwheel advance command directly after the termination of an
exposure so that by the time the software had finished handling the exposure,
the filterwheel would already be at the next position and ready for the next
exposure. This decreased the minimum cycle time by about 5 seconds which
was important for the PULSAUR II campaign where time resolution was very
critical. Error setting code was included into the software as well, to allow
continuous operation in the event of shutter errors. This was necessary as the
failure mode of the shutters was associated with the limit switches, and not with
the actual shutter mechanism, thus providing false error messages.
3. A fatal bug that has been inherent in the MIP/HAARP imagers since their
22
delivery from Advanced Technologies was finally identified. This bug caused the
CCD camera head to lock up intermittently on the order of every few hours,
requiring an operator to constantly monitor the imagers and make sure that they
were running. The bug turned out to be in the Advanced Technologies timing
firmware, and a new interrupt-driven routine was written and tested on both the
MIP and HAARP imagers.
4. The filter wheel EPROM program was updated in the MIP/HAARP imagers to
improve reliability in the event of a position read failure. If a position error
occurs, the filter wheel automatically steps forward to the next filter position and
re-tries the position move.
5. A simple step-by-step manual was written to guide an unfamiliar user through
the essential steps of operating the imagers without supervision. This was
tested out on the PULSAUR II campaign and the optics manager at Andoya
Rocket Range had no problems operating both imagers simultaneously to
support their campaign. A later revised version can be found in Appendix D.
6. A graphical image analysis toolkit software has been started on the IDL/IMSL
environment on PL/GPIA's Silicon Graphics (SGI) workstation. This used the X-
Windows/MOTIF graphical user interface (GUI) based on widgets to view
greyscale images. Images can be viewed with header info and display cursor-
based pixel values. Some IDL/IMSL analytical functions were made available to
the toolkit. They included intensity plots along an arbitrary line and dynamic
manipulation of the display lookup table.
4th quarter:
1. Another utility was added to the image analysis toolkit. This IDL script called
"montage.pro" generated a sequence of image frames sorted by time and filter.
A landscape page has filter (wavelength) sorted by row and time sorted by
column, resulting in a display of two "time strips" of four wavelengths (4 row
entries) going across in time (10 column entries). The time and date stamp, filter
wavelength, and location labels are embedded in the corners of each frame. IDL
23
generates Adobe Postscript files to obtain quality printable outputs. Greyscale
images are dithered by black and white printers. Adequate low cost printouts
were obtained using a Hewlett Packard Laserjet 4M with 600 dpi (dots per inch)
resolution. PostScript files has each frame scaled arbitrarily to 72 dpi. This was
a compromise between keeping the file size under 1 Megabyte while preserving
"viewable" frames. True greyscale outputs were obtained with PL's KODAK
XL7700 Digital Continuous Tone Color Printer.
2. A change in requirement for the RASWS resulted in modifications to its
application software. Current touch-tone activated data requests was changed
from average S4 index values to dB fades. Voice messages now process signal
fade levels in dB units. Time selection windows changed from 15 min - 1 hr - 3
hr to 15 min - 30 min - 1 hr. Unlike S4 values which are averaged for time
selection, dB signal fade levels are median values.
3. Many new features were added to the acquisition and display software,
MIPCTL this quarter. Plot and histogram windows are now linked to the image
structure from where their data came from, so that when the data in the image
changes, the plot and histogram for that image is automatically updated. One
Plot window and one Histogram window per image can be linked in this way.
This is extremely useful for watching certain features change dynamically as an
image is updated (such as for a rocket launch). This latest version now has a
field for the AFG configuration file in the initialization file. This allows the
software to initialize in multiple formats without having to change the
AUTOEXEC.BAT default and rebooting the computer. This is most useful for
switching between single and dual-monitor operations. In addition to these new
features, more bugs were corrected and the software reliability was enhanced.
For a detailed description of these updates, please refer to the MIPCTL v5.3.6
Software Release Notes (see Appendix E).
4. Software for the HAARP Az/EI Mount was written for stand-alone operation
via a Joystick and a control panel. Features implemented for stand-alone
operation are:
24
HOME: Moves to and checks the HOME position
LIMITS: Moves to and checks software and hardware limits
MOVE: Moves to a selected position
JOYSTICK: Puts the mount in JOYSTICK mode
JOG: Allows JOGGING from the control panel
CALIBRATION: Calibrates the mount for a know position
SUN-TRACK: Tracks the sun (or star) in real-time
Real-time position readout and data entry was implemented on the control panel.
In addition, a serial interface and display software for the mount was developed
and tested. Commands can be manually entered via the serial port using the
6000 series language of the mount controller.
5th Quarter:
1. An IMSL/IDL program called "meridian.pro" was written to provide a stack plot
of intensity versus time over a sequence of images along the magnetic meridian.
Each printed data page displays two plots, one using "stacked" lines
representing different times in UT and the other, a "surface" plot with a contour
map of intensity spread over an area defined by zenith angle and time in UT.
IMSL/IDL was also used to process EISCAT radar data in raw text file format.
The equivalent radar vector generating software used on the PC-based
Northwest Research "Omni" system was ported over to the IMSL/IDL
environment. It also generated the same text format command file to plot
vectors over transformed images on the "Omni" system.
2. Keo worked with the University of Lowell on the development of new
visualization software for PL/GPIA. An initial step toward this effort was to
convert the "Omni" system's image transformation code written in Microsoft C to
a usable executable version on PL's Silicon Graphics workstation. Keo has
provided Lowell student David Pinkney with background documentation and
systems familiarization to carryout this initial step as well as providing general
guidance with portability issues.
25
3. A new image header definition was created for the imagers' latest version,
MIPCTL v5.4.0, that accounts for problems found in previous images. A
software utility was written this quarter called HDRFIX that converts all previously
recorded images using the MIP and HAARP images into the present header
version. HDRFIX rebuilds the UNIX binary time-stamp from the ASCII time/date
stamp in the image header. This utility requires the imager's AFG framegrabber
board to run and is summarized in HDRFIX Software Documentation v1.1 (see
Appendix F).
4. The HAARP Mount software was developed further this quarter to allow
complete adjustment of all velocity, acceleration and deceleration parameters.
This allowed us to maximize the performance of slewing for the LEAP campaign
to track a rocket.
6th Quarter:
1. In preparation for the Chile campaign, software for both imagers was
standardized and given a directory convention:
Source Code: c:\mip\mipctl
Executables: c:\mip\mipexe
Executable names now declare the version number to avoid confusion;
"mipcthexe" is renamed to "mip540.exe" which corresponds to version 5.4.0.
2. Programming the IMSL/IDL environment on PL's Silicon Graphics (SGI)
workstation was carried out this quarter to support a visual demonstration of
optical and scintillation data collected in Chile for PL/GPIA's Equatorial
Campaign. This required the following functional software modules to be
constructed and incorporated with previously written software:
- A file selection sorter based on wavelength with image files
sourced from a sub-directory instead of a list file.
- An image overlay referencing a UT time-stamp and spatial
reference symbol of an arbitrary point in the all-sky image (this was
used for the satellite position of the scintillation measurements).
26
- A widget-based window graphically displaying the scintillation data
in a "strip-chart" mode.
- A scintillation ASCII data file decoder.
- A semaphore link between the scintillation data and image data
that allows dynamic temporal access and display of any given time
reference.
7th Quarter:
1. The image analysis software on PL's SGI workstation platform was extended
to provide cursor-based positioning information of digitized all-sky images. Any
point in the field-of-view is mapped in real-time to a look angle in azimuth and
elevation coordinates. This, in turn, generates a projection down to the earth's
geographic coordinates of latitude and longitude, given an assumed altitude of
the observed phenomenon. An interactive slider icon is provided to adjust the
assumed altitude, which typically varies with images exposed through different
narrow-band filters. The coordinates are displayed in X-Window styled "Widget"
Text Box Items on the screen.
2. An IDL script was developed to overlay a spectral scale onto digitized images
of rocket plume emissions. Calibration images of known emissions were
provided to calculate the wavelength/pixel ratio and absolute alignment for the
scale.
3. The MIP/HAARP control software was upgraded to operate in a "stand-alone"
capability. This new MIPCTL version 6.0.0 superseded version 5.4.0 and
included all its "non-stand alone" functions. This upgrade was driven by an
intended use by the University of Oslo in Svalbard to cover most of their winter's
dayside cusp measurements. Such a system had to be capable of running in a
"routine" mode. The stand alone addition allowed the imager system to execute
multiple sets of data acquisition parameter tables at pre-designated time
intervals. A typical entry would be the start and stop times plus a reference to an
acquisition table file defining cycle parameters such as filter sequence, intensifier
27
gains, and exposure times. The acquisition tables run are created by the
existing Acquisition Setup feature in this MIPCTL application. This feature was
designed for extended data gathering, where start/stop times depend on
sunrise/sunset, moonrise/moonset, etc.
8th Quarter:
1. A new commercial scientific data analysis software package was installed on
PL/GPIA's SGI workstation platform. This package, called PV-Wave Version 5.0,
is advertised as a "superset" of the current working , albeit outdated, version of
IDL. PV-Wave was selected because PL already has a site license for this
product. The package has enhancements and additional features that may
prove useful for our use, particularly with overlay mapping functions and
time/date decoding and encoding; these features are limited or not available in
IDL. A quick evaluation of running IDL code in PV-Wave resulted in some
compatibility problems; so far all of them appearing with graphical user interface
operations. This was attributed to different syntactical representation of
functions that create and handle widget objects. Additional flexibility to the
current image analysis tools now include an option to display optical images on
screen of arbitrary size, pixel aspect ratio, and positioning (local-offsetting) within
an X/Motif display window. This was mainly done by manipulating IDL's system
variables that control plot features.
2. An IDL-based digital ionosonde data file parser routine was written to extract
and overlay digital sounder line-of-sight (LOS) drift skymaps onto untransformed
all-sky optical data. The parser parameters included filename, start and stop
times, and frequency selection. The selected data points are displayed on
screen in real-time as it is being parsed. After corresponding optical image
selection, a Postscript printer ready file is generated as output using 5x5 inch,
centered, landscape orientation format.
3. In collaboration with PL/GPI and UML (Univ. of Mass at Lowell) scientists
and engineers, an effort was made to identify a visualization software package to
28
be used to expand PL/GPI's available data analysis tools. A visit was made to
SAIC (Scientific Applications International Corp.) in Washington, DC to evaluate,
what turned out to be a loosely coupled, customized AVS-based visualization
package for the space physics community. The only conclusive decision made
was that AVS, Inc.'s commercial visualization package would be used as the
base software system for our development.
9th Quarter:
1. A LINUX operating system was selected as the base software platform for the
remote access communications project. This freeware package was chosen
over commercial software mainly for three features: true multi-tasking O/S-Unix,
built-in network support -TCP/IP and NFS and zero cost. LINUX was developed
for PC-based systems with the intent of getting mid-range workstation
performance for a fraction of the cost. The typical installation involves
partitioning the hard-disk between LINUX and DOS, if desired, then retrieving
over the INTERNET the LINUX software distribution, in our case, "slackware", at
tsx-11.mit.edu or at sunsite.unc.edu, and then running the various configuration
modules to install the kernel and other system software. The most time
consuming modules to install are the display drivers for X-windows and the
network configuration modules to reach the "outside world."
2. The first instrument to be used with our LINUX system was a satellite
scintillation system, SATSIN-II, developed by SRI for PL. The LINUX PC served
as a remote field site "data-concentrator" system. Its role was to make available
data from its connected instruments back to PL via INTERNET, either direct or
over a phone line. SATSIN-II plans to make use of the data-concentrator as a
file-server. KEO demonstrated this capability at SRI using the field LINUX
laptop. A key networking software program, "pcnfsd", had to be running on the
LINUX system. This allowed file access across different operating system
platforms, in our case, between LINUX and DOS.
29
3. PV-Wave code on the SGI workstation had to be written to access and plot
GPS scintillation and position data. ASCII data files had to be parsed and sorted
based on time and satellite number. Time representation had to be converted to
UNIX time (seconds elapsed since 1/1/70) then to PV-Wave's own Date/Time
data structure. Satellite ground-referenced look angles were used to translate
and position satellite icons over our all-sky images. FFT analysis on scintillation
data was applied to obtain spectral information as well as to low pass filter multi-
path signal components. Plots were generated to printer Postscript files.
10th Quarter:
1. Software centered on co-development and integration of the PL/SRI RASWS
system with Bob Livingston at SRI. Most of the effort was to get the "data
concentrator" LINUX-PC operational as a file server on the INTERNET. SRI's
SATSIN-II acquisition system, an MS-Windows/Labview based PC, used the
LINUX-PC as a real-time file server accessible over the INTERNET. Actual first-
order statistics data files from SATSIN-II was recorded at real-time rates at full
capacity of four receiver channels, three UHF and one L-Band. This includes the
decimated time series output. Remote access of the files from PL was
demonstrated. Other ancillary configuration tasks included user accounts,
directory structures, and network access privileges. The ability to archive data
files onto the 8mm tape drive was verified. The v.34 28.8 Kbaud modem hook-
up was tested using LINUX's "minicom" application. The ability to quickly
develop graphical scintillation plots was demonstrated using "gnuplot."
2. KEO has worked with Dan Moonan of RADEX Inc. by providing data format
and system specifications to access and extract relevant parameters from the
RASWS. They were tasked to access this data to feed into their predictive
scintillation modeling program.
11th Quarter:
30
1. The PC-based acquisition software for the upgraded film-based imagers
using Microsoft's Visual Basic was developed. The look and feel interface is
modeled after the acquisition software used on PL's MIP and HAARP all-sky
imager systems developed by KEO. The frame grabber driver software provided
text overlay capabilities for displaying imaging parameters. Setup features
included configuring and running the system for unattended operations. A user's
manual was provided to accompany the systems.
2. Software evaluation of a commercial six-channel, single frequency Global
Positioning System (GPS) receiver development system, Accutime II by Trimble
Navigation, Inc., was carried out to determine the feasibility of programming and
incorporating such a unit for field measurements of GPS satellite signal levels
and of the effects on positional errors. The PL furnished system and developer
software kit was installed on a PC. Trimble's TSIPCHAT software application
demonstrated that relevant time, position, and satellite signal levels could be
logged for post-processing and output parameters can be dynamically
configurable. The intent was to develop a code to run these units on selective
field installed LINUX-based PC systems and retrieve the measurements
remotely over the INTERNET computer network. The application TSIPPRNT
was used to ASCII screen print the unreadable logged binary data files.
3. A Microsoft Windows Network File Server (NFS) application from
Hummingbird, Inc., was procured and installed on PL's Remote Access
Scintillation System (RASWS) destined for Peru. This was necessary in order to
integrate this particular RASWS system to PL's real-time data access network
over the INTERNET. Data files archived over a local network link using a
repeater in real-time was demonstrated at PL between the RASWS data
acquisition computer and the LINUX-based data server computer.
4. PL/SRI RASWS system software development was carried out in Antofagasta,
Chile. Working with SRI engineer Bob Livingston, and local computer network
support personnel at the Universidad Catolica del Norte, we configured the two
PC-based systems to be INTERNET accessible. The necessary directories were
31
created on the LINUX-based PC, the data server, to accommodate the
scintillation data generated by SRI's SATSIN-M PC. A plotting script was written
with the "gnuplot" program to locally display a summary time plot of S-4 indexes,
a measure of scintillation, and satellite signal levels for the four receiver
channels in real-time. An 8mm data tape archiving script was written to carry out
local backup of the data; this is to be executed monthly. A shell script was
written for automated execution at fixed time intervals to report the status of hard
disk usage (see Appendix G).
12th Quarter:
1. A parallel driver interface for ASIP-II filter wheel and intensifier controller was
written for the LINUX-based host computer. The program, called "Ipio" (for line
printer I/O - see Appendix A), took two arguments, the first was a command, and
the second was a value. An invalid or null argument would print the available
choices for the command. An "f' argument would position the (f)ilter wheel to the
second argument value. Likewise, a "g" argument would set the intensifier (g)ain
to the second argument value.
2. Enhancements to current image display software in PW-WAVE (an IDL-
derivative) code were written to address auto scaling of Postscript fonts and auto
display of imaging parameters extracted from the image file's header info. These
features was utilized in a generic "loadimage" function that takes as arguments:
filename, image dimensions, relative output position and image intensity scale.
3. A telephone-based SLIP (Serial Line Internet Protocol) script was configured
to implement a phone/modem-based INTERNET connection for the LINUX-
based PC data concentrator systems. This was needed at sites where
INTERNET access is not available. Both SLIP client and server configurations
were looked into using the following applications, "mgetty" and "dip". Only the
client mode was implemented successfully using dialup IP (dip). A UNIX-shell
script file was written to transfer arbitrary files over the INTERNET using "ftp" (file
transfer program). This program can be scheduled at arbitrary intervals using
32
the built-in "crontab" utility; this is effectively a program scheduler. See Appendix
H for a sample listing used at Ancon, Peru.
13th Quarter:
1. A utility program, MONITCAL.EXE, was written to address the wide variety of
monitors and video systems being used on the MIP and HAARP Imaging
systems. This program was used on PC systems that include the AFG Frame
Grabber hardware and calibrates the conversion transformation between the
AFG pixel locations and the VGA pixel locations during video overlay. The
application generated an output file called COORD.TXT which includes all
system information, calibration date, data points, and transformations results.
Once the user was satisfied that this data best represented the current video
display system, this file was renamed and copied into the directory of the current
MIPCTL executable file. A new version of the imagery control software was
compiled to accommodate this feature - MIP610.EXE, revision 6.1.0 (see
Appendix I).
2. AFPL's in-house 35mm film digitizer needed to have software installed and
configured. A device driver (TWAIN-based) was installed along with a
commercial photographic editing software, Adobe Photoshop Deluxe for
Windows. The flexibility of the software allowed us to store images in a variety of
formats - the most useful was TIFF and Postscript. KEO demonstrated this by
generating several viewgraphs of 35mm pictures documenting the Sprites '96
Experiment at La Salle, Colorado.
14th Quarter:
1. KEO began preliminary software evaluation of PL's GPS-based scintillation
receivers. They operate under a host laptop PC. This involved a visit to PAQ
Communications, Inc. in Milpitas, CA for initial consultation with Dr. Quyen Hua,
the developer of these receivers. A step through of the delivered user's manual
(PAQ12 Ionospheric Scintillation Monitor User's Manual Draft Version 1.0) was
33
conducted at PL and a few minor discrepancies were found between the
instructions and the software. Most notable was the DOS command line
execution of the application, "PAQ12.EXE", which did not require a space after
the "-F" switch to specify an optional output filename. Several features were
noted. First, time logged and displayed was using GPS time, not UTC time.
Currently GPS time lags UTC time by about 13 seconds. This is due to the fact
that GPS time does not count leap seconds. Second, there were no provisions
to support unattended operation file management and auto-restart. Third, very
little effort was placed on optimizing data recording by minimizing screen
management overhead. The primary objectives to meet with PAQ were to
acquire enough information for PL to understand the operation of the existing
software package as delivered to PL and to be able to compile and modify the
software as requested by PL. Various aspects of the source code were
discussed and explained in terms of functionality and overall architecture. We
exercised the compilation process by deriving the deliverable code using Borland
C/C++ Compiler Version 3.1. We concluded that this menu-driven software was
very inefficient and it's shortfalls along with recommended improvements were
articulated to PL. We obtained the necessary software tools to modify the
existing software application.
34
4. Data Analysis
Keo provided support by managing and analyzing optical data with other
related instrumentation data obtained from PL's field campaigns. They included
scintillation, sounder, satellite-based sensor and radar data. Keo was
responsible for the archiving, retrieval, and distribution of optical, and in a limited
capacity, scintillation data. The following data media were used: VHS, S-VHS,
8mm video tapes, 35mm film, 9-track digital tape, Magneto-Optical digital disks,
analog optical disks, CD-ROM's, and 8mm digital data cartridges.
The data analysis involved processing optical images using various
coordinate transformations, parametric label and reference overlaying, and
image enhancement operations. Other sensor measurements were often
processed and correlated with the optical data. Most analyses, particularly those
for publication-ready plots and figures, were done on PL's Silicon Graphics (SGI)
workstation computer and used an IDL-based commercial scientific data analysis
and visualization software package.
These data analysis services were generally conducted at the request of
PL's scientists and their collaborating colleagues, who were responsible for the
ultimate scientific interpretation of the data. The following list chronologically
summarizes the data analysis services provided during this contract:
1st Quarter:
1. Combined DMSP electron flux and driftmeter data with ground based imaging
data were processed for the Spitsbergen 1993, Rodeo I (DEC88) and Rodeo II
(OCT89) campaigns. The LOKANG program was used to determine satellite
positions for ground track overlays.
2. KEO digitized Qaanaaq film-based images to analog optical disks using the
11 PS/OMNI system and it's automated film transport system.
3. KEO processed Rodeo II (OCT89) images with FEB91 Sondrestrom radar
35
data. This involved overlaying radar velocity vectors and geographic maps on
selected transformed images. Publication ready B/W photographic prints were
generated.
4. KEO continued to archive magnetic tape based image data to Magneto-
Optical (MO) disks with a physical media reduction of 36 tapes to one MO disk
(both sides).
2nd Quarter:
1. PLAGPIA's Silicon Graphics (SGI) IRIS workstation running the IMSL/IDL
interactive analysis and visualization software package was used to display MIP
images with map overlays. Playback of sequential image frames using the
movie-modules was demonstrated using ground-base MIP images of the
CRRES'92 barium release on July 4, 1993.
2. The SGI IRIS was also used by KEO to evaluate University of Lowell's UNIX-
based software package used for the analysis of auroral arc motion.
3rd Quarter:
1. KEO continued to use IMSL/IDL on ground-based MIP images of the CRRES
'92 barium release on July 4, 1993 from Ramey, Puerto Rico. For that same
day, we also looked at ground-based filtered images from St. Croix.
4th Quarter:
1. A VHS videotape was made showing active auroral periods during the '93-'94
winter period at the Early Polar Cap Observatory (EPCO) in Resolute Bay,
Canada using ASIP-II data recorded on 8mm videotapes.
2. An initial screening of the PULSAUR II (Pulsating Aurora) Rocket Experiment
data from both the HAARP and MIP imagers was conducted. A discrepancy with
the time stamps was found. We believe the Andoya site personnel operating
KEO's imagers did not reset the PC's system clocks on a daily basis as we had
recommended. A correction effort should be possible on the HAARP (all-sky
36
view) images by using the rocket plume frames and correlating it with the
rocket's telemetry data. On the other hand, correcting the time with the MIP
images (90° FoV) would be more difficult. This would require us to establish a
spatial frame reference with the all-sky view first and then match temporal events
between the two imagers. Both the HAARP and MIP data covering the rocket
launch was presented to the campaign's principal investigator, Finn Soraas, of
the University of Bergen during his visit to Boston. KEO provided digital color
prints and a movie playing utility covering the rocket launch at a selected filter
wavelength. The image files can be accessed on the SGI computer on the
INTERNET via FTP.
3. In processing pre-PULSAUR II (Jan-Feb '94) MIP image files, we found
occasional bad header info sections in the image files. An erroneous software
version stamp was found in one case. A more serious problem was the UNIX
time stamp in the header (comment) field. This non-printable long integer
representation often gets corrupted when any one of the four bytes values
representing the long integer happened to be zero ( OXOO ). This was
interpreted by the Imaging Technologies, Inc. (ITI) software routine that built the
comment field as a comment delimiter and so truncated it. With the actual image
data bytes appended after the comment field, the entire file size can decrease by
as much a four byte counts. Old data files had to be corrected to reflect the
correct file size.
4. Digital MIP data covering the CRRES '92 barium release on July 4 from
Ramey, Puerto Rico was provided to Dr. Miguel Larsen of Clemson University
who has been tasked by PL to determine the true altitude extent of the barium
cloud with multi-site observations. The specification of the image files was
provided to him in order to decode the image parameters.
5. KEO had begun training PL's Capt. Frank Hughes on the Northwest
Research's image processing tools. He was designated by PL to assist with the
analysis and processing of data used in his research.
37
5th Quarter:
1. KEO had begun training PL's Sgt. Vaughn Hickman on the Northwest
Research's image processing (UPS) tools. He was assigned to replace Capt.
Frank Hughes to provide data analysis and processing support.
2. We used ASIP-I all-sky images from an Andoya flight on January 16, 1990 for
Sgt. Hickman's training. The final output images included radar vector overplots
along with coastline contours. This also satisfied a publication data request for
Dr. Loretta Weiss of Los Alamos Lab.
3. A set of Postscript printouts and viewgraphs of raw images from Ny Alesund,
Norway, January 12, 1993 was provided for the annual CEDAR/HLPS Workshop
in Boulder, CO. They contained all images acquired during that day, both in the
dense (80 images/page) and in the detailed (20 images/page) layout formats.
An example can be seen in Figure 2. Time-sequenced meridian scan plots of
intensity were made to quantitatively complement the all-sky image printouts.
4. Video tape copies of a Wallops Is. rocket launch coverage using KEO's
grism-based camera were made for Dr. Keith Groves. Color printouts and
overheads were made from digitized still frames showing the rocket plume both
in the raw and contoured formats.
6th Quarter:
1. KEO trained Sgt. Hickman to transfer data files electronically using the FTP
(File Transfer Program) application over the INTERNET computer network.
Specifically, MIP and HAARP image files were sent to Utah State graduate
student, Todd Pedersen, on a ongoing basis; he has also received a version of
IMSL/IDL image viewing software tools developed by KEO for in-house use on
PL's SGI workstation. This device independent software allowed any IMSL/IDL
supported system to view KEO's MIP and HAARP image files.
7th Quarter:
38
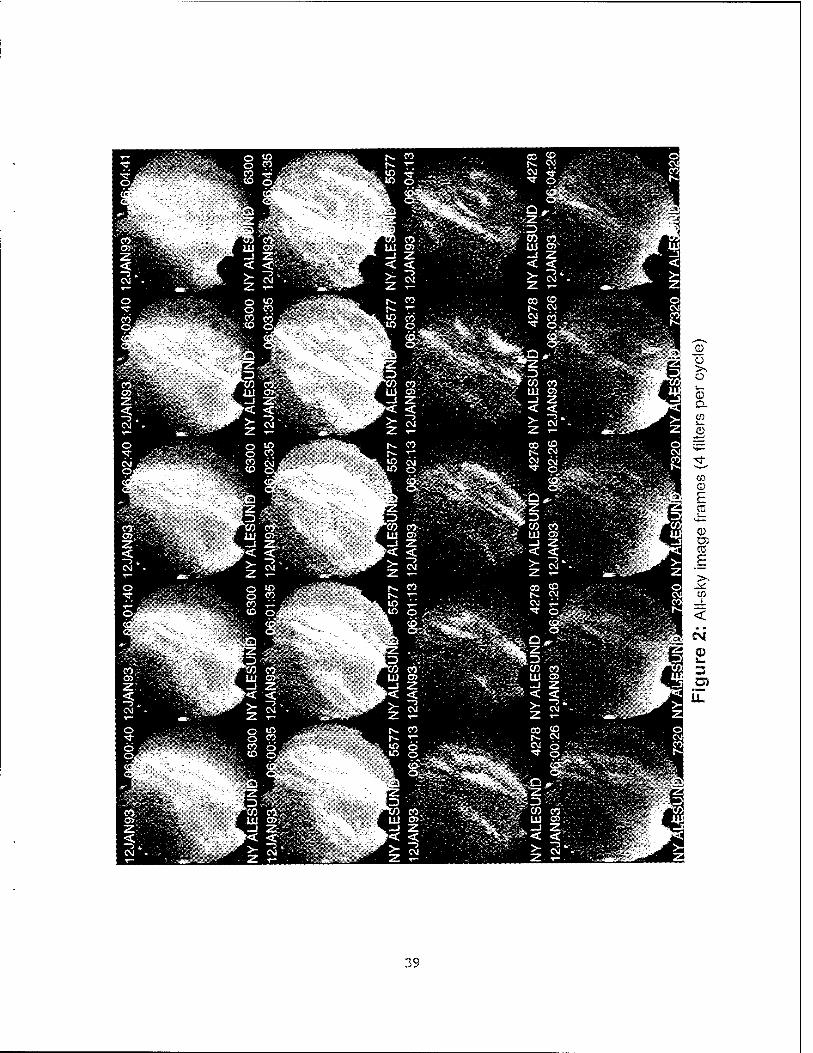
39
1. A large scale effort was made with measurements obtained during the
Equatorial Campaign of Sept/Oct '94 in Chile. Several hard copy prints and
overhead transparencies were made showing the temporal variations of the
equatorial anomalies. Typically, five time sequence sets of four filter images are
displayed on 8.5 x 11 inch sheets. A video screen animation tool was used to
playback images at 6300A showing the evolution of the depletion regions. A
time-stamp label was overlaid on each image frame as well as a reference
marker showing the position of the geosynchronous satellite used to obtain
concurrent scintillation measurements.
2. Overhead transparencies and hard copies of digitized video frames were
made from data obtained during a BMDO static rocket plume measurement.
They were overlaid with a spectral scale.
3. The unexpected lack of availability by PL/GPIA's Sgt. Vaughn Hickman, due
primarily to his other military duty obligations, had become a major setback to
KEO at handling and upgrading the branch's optical data processing tasks. He
was originally detailed to provide full-time data analysis and processing support.
8th Quarter:
1. An effort was made by U. Mass at Lowell (UML) scientist Dr. Gary Sales at
using KEO's IDL-based analysis tools to validate equatorial anomaly models
based on digital sounder skymap of drift data and optical all-sky images.
Preliminary findings showed good correlation between the two data sets from the
Equatorial Campaign '94 in Chile. Dr. Sales used KEO software to generate
printouts of digital sounder drift vectors overlaid onto 6300A all-sky images.
2. Other overlays included GPS-based scintillation measurements plotted as
active or non-active icons for each GPS-satellite in the all-sky imager's field-of-
view. Again, excellent correlation was noted on the resulting printouts.
3. NSF's Jicamarca Radar Plots of Power Densities were obtained and
viewgraphs made from the INTERNET'S WWW Website Databases for Dr. Santi
Basu who presented it along with the aforementioned overlay plots/printouts at
40
the ISEA Conference summarizing our preliminary Equatorial Campaign '94
measurements in Chile.
9th Quarter:
1. Continued analysis of GPS scintillation data with optical measurements from
PL/GPI's Equatorial Campaign '94 in Chile were carried out. Plots of GPS
scintillation and TEC (Total Electron Content) on three primary visible satellites,
#21 ,#22, and #23 were plotted during a two hour active period, 0:00-2:00 UT on
10CT94. Additionally, navigation error on position were plotted for the same
time period. This was reflected via the latitude, longitude, and altitude
components.
2. Horizontal intensity profiles of 6300A all-sky images, both raw and smoothed,
were plotted to assist UML scientists, Drs. Gary Sales and Ron Pickett, with their
evaluation of the motion analysis software.
10th Quarter:
1. Discrepancies between DMSP satellite passes and auroral images from the
CUSP Campaign of January, 1993 prompted an effort to validate the visual
azimuthal reference in the auroral images of the dome used at the Ny Alesund,
Svalbard optical facility. The dome marking was thought to be referenced to
geographical north. Using Mars at 120° azimuth from 15JAN93 at 19:00UT we
found it to appear in the image at 95° azimuth. This concluded that the image
had to be rotated clockwise by 25° to correct for this azimuthal error.
2. Additional plots of GPS scintillation and TEC (Total Electron Content) with
multi-path effects removed were plotted from the Chile Campaign. Optical sites
were added to the campaign map to reflect the area of coverage at 160° FoV. A
quick plot of depletion region drift velocities was generated from visual sampling
of sequenced images in the 6300A wavelength.
41
2. KEO provided SGI workstation system support with account generation and
instructional assistance to Drs. Juan Rodriguez and Caesar Valledares, primarily
with printing and plotting needs.
11th Quarter:
1. The cumulative effort of analyzing GPS scintillation data with optical
measurements from PL/GPI's Equatorial Campaign '94 in Chile concluded with
generating print-ready plots and figures for submission to the Journal of
Geophysical Research. Final plots included time sequence images of 6300A all-
sky images, GPS satellite signal levels, TEC (Total Electron Content), latitude,
longitude, and altitude variations, and optical sky coverage maps with magnetic
field line traces (see Figures 3, 4, and 5).
12th Quarter:
1. Viewgraphs and hardcopy samples of auroral and equatorial airglow images
taken from past campaigns with the HAARP and MIP imagers were created
using the new PV-WAVE-based image "layout" software. Selective airglow
images have GPS satellite overlays reflecting their corresponding line of sight
positions. The look angles have been sourced from processed GPS data files
generated by the NWRA (Northwest Research Associates) group at AFPL.
2. Camera ready plots and glossy (photographic) printouts of GPS scintillation
data with optical measurements from PL/GPI's Equatorial Campaign '94 in Chile
were made for final submission of figures to the Journal of Geophysical
Research. This is in response to changes proposed by the JGR reviewers of the
first draft paper.
13th Quarter:
1. Selective video frames of sprite events have been digitized using the PC-
based frame grabber system set up by KEO. The vendor supplied applications
CXDEMO.EXE and FILEIT.EXE were used to get image files onto the computer.
42
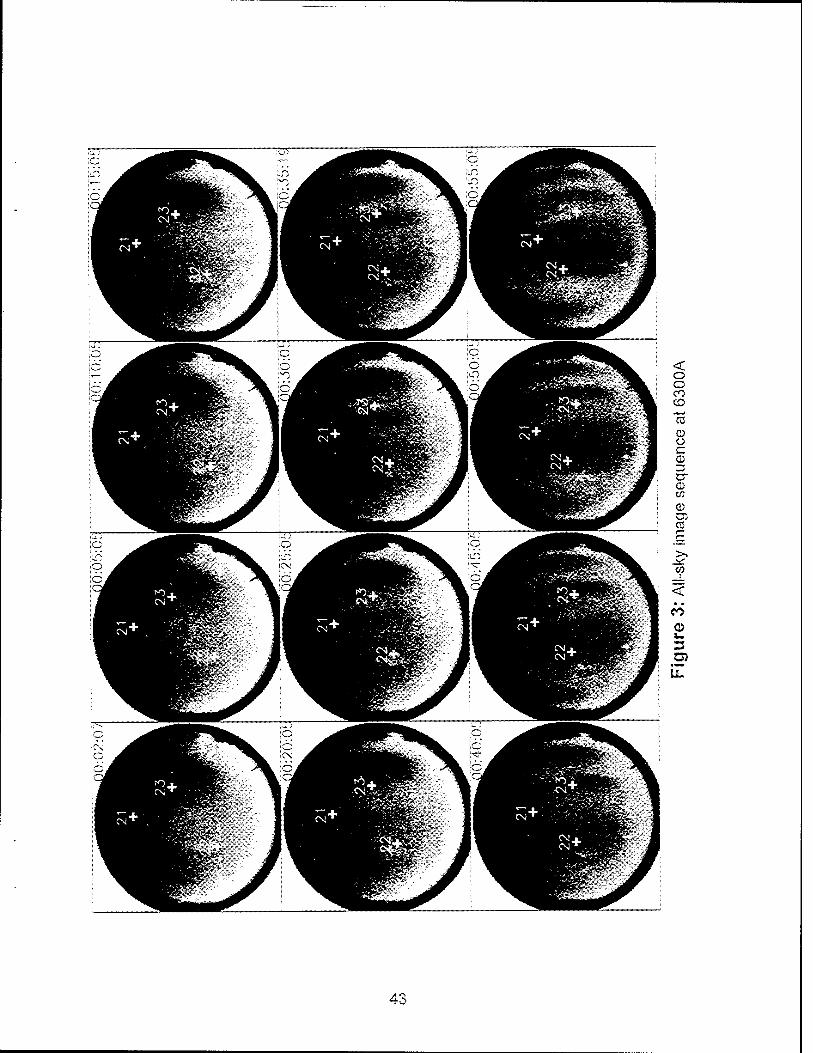
< o o oo CD
© o c a> tr <D CO
Q> CD TO
CO
43
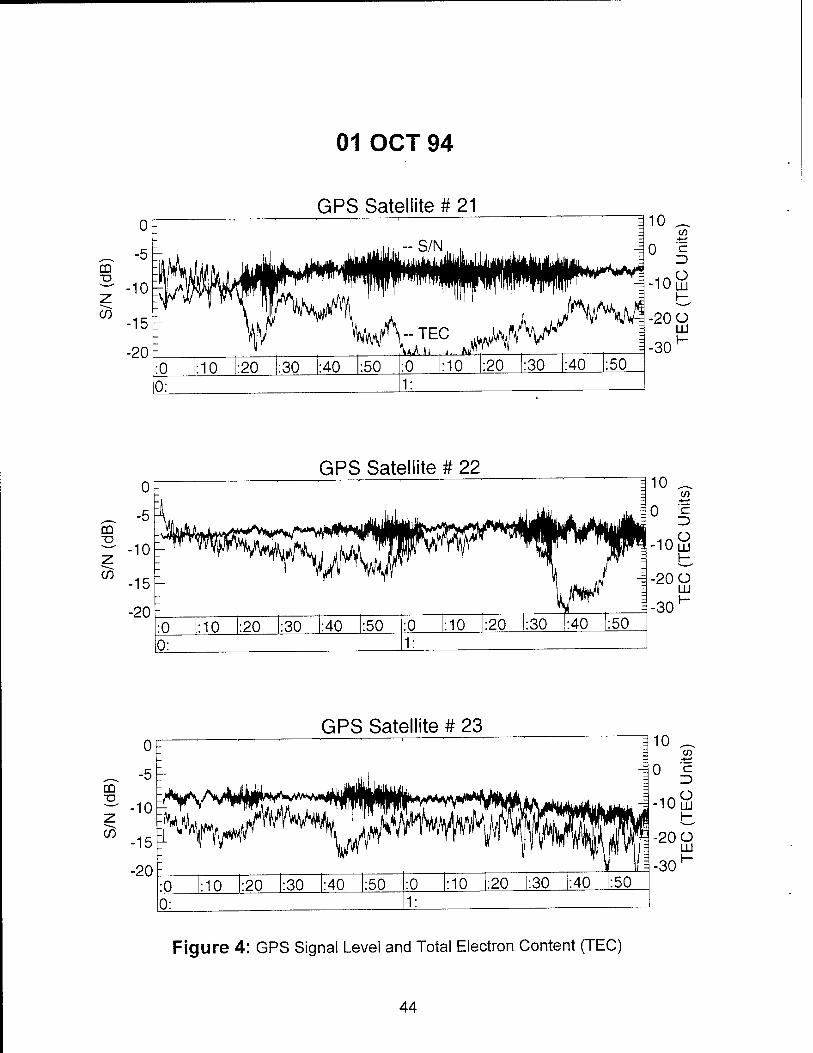
01 OCT 94
GPS Satellite # 21
CD ■o
CO
0
-5
-10
-15
-20
T k - S/N , -=.
— , - TEC .
wJy-=
- \t^ h J. Ail" -
:0 :10 :20 :30 :40 :50 :0 :10 :20 :30 :40 :50 0: 1:
10
40 c/3
"E
■10Ö
•20 Ü UJ
■30 H
CD ■o
CO
GPS Satellite # 22 Ü =
-5 |L -E
10 _ n /r -
15 - 4
20 =
■o •10 :20 :30 :40 :50 :0 :10 :20 :30 :40 :50 0: 1:
no 40
if) -t—'
'c Z)
■10Ö
-20 O LU
= -30
GPS Satellite # 23
CO "O
CO
■10^.
-15
-20
'^^^^^^ WÄ :0 :10 :20 :30 :40 :50 :0 :10 :20 :30 :40 :50 0: 1:
10
0 CO
'c 3
■100
-20 Ü LU
-30 H
Figure 4: GPS Signal Level and Total Electron Content (TEC)
44
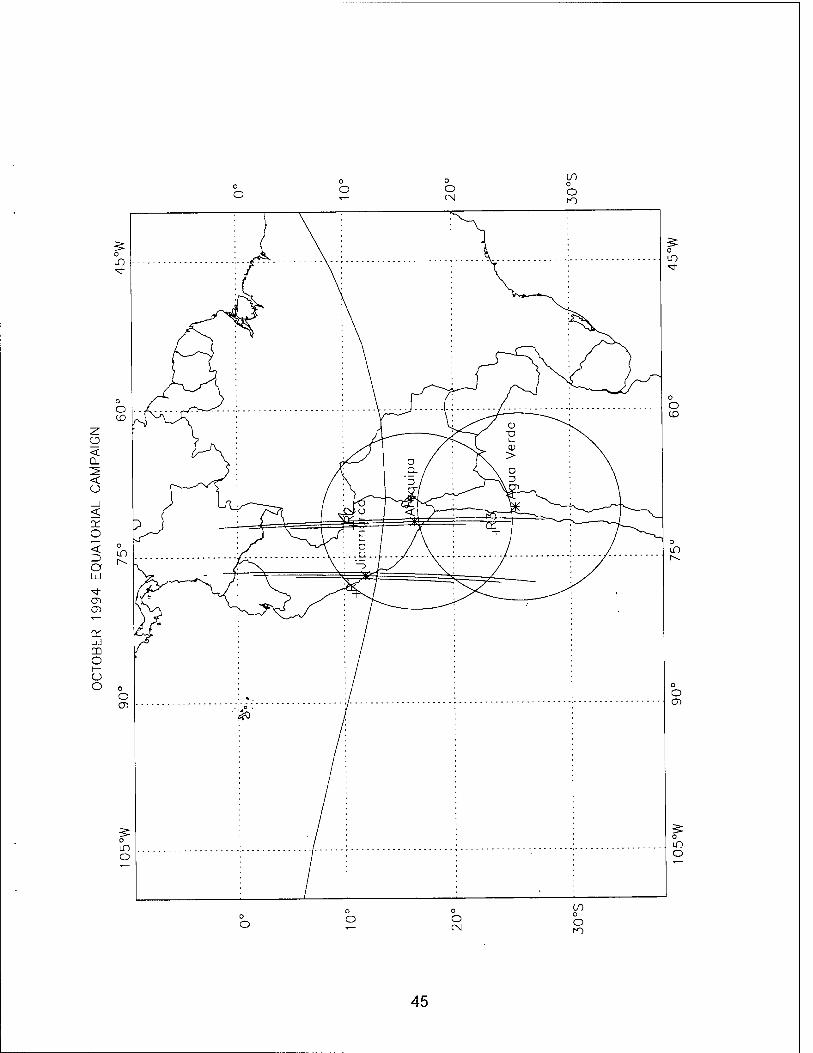
o CO
O
uO
o co
z Ü < CL ^ < o
1 < cr O i— < o
in
LÜ
^1- CT> CD ,—
a: Ld CD o 1— o o o
O CD
C / CL /
'D /
r\ >
s. \ ° j—\ D
si { i Vy* i- . ., <u /— ; srf—r^—^ Hit—* : *-i 1 =»—» ^J ; ;—=*f 'v- 1 J
£ A o / / \ W \ r\ \
"1L''l^ -^-
'
> !
'■f /
uD it
O CD
o CD
LO O
o o CM
00
o
45
CDXDEMO.EXE provided menu-driven control of the frame grabber board's
various capabilities, including capturing a frame and saving it to a filename in
their own format. The post-processing format conversion software, FILEIT.EXE,
allowed conversions to popular image file formats: GIF, TIF, and BMP. Some
data examples showing the various morphology of these sprites can be found in
Figure 6. Camera alignment verification is done by comparing star images with
computer generated star maps. A sample starmap, shown in Figure 7, was
generated for the observation site. The UNIX shareware program "xephem" was
used from a LINUX-PC. All relevant parameters are labeled in the Postscript file.
2. We continue to work with the Universidad Catolica in Chile with managing the
RASWS scintillation data. KEO routinely retrieved and backed up monthly data
files in compressed format over the INTERNET to AFPL. They are then archived
to 8mm data cartridges using the UNIX "tar" (tape archiving) utility.
14th Quarter:
1. As part of an ongoing effort to manage our image data, we began transferring
our image data from re-writable MO disks to CD-ROM's using AFPL's CD-R
(Compact Disc Recorder) system. Both sides of one MO disk were written to
one CD-ROM for a maximum capacity of approximately 600 Megabytes. This
reduced the media cost ten-fold; a blank CD costs $10 vs. $100 for one MO disk.
Consequently, MO disks are recycled for campaign use. We used the software
application "SimpliCD" from Young Mind's, Inc. to generate ISO-9660 standard
CD-ROM data format. This allowed us to read the CD-ROM contents from
various computer platforms and operating systems. We typically made one CD-
ROM from both sides of one MO disk of optical image data. Addition sets, as
requested, were made for distribution.
Consultative Data Analysis:
Throughout the contract, an ongoing data analysis effort by consultant
Hugh Gallagher studied plasma flow in the vicinity of high-latitude aurora. The
46
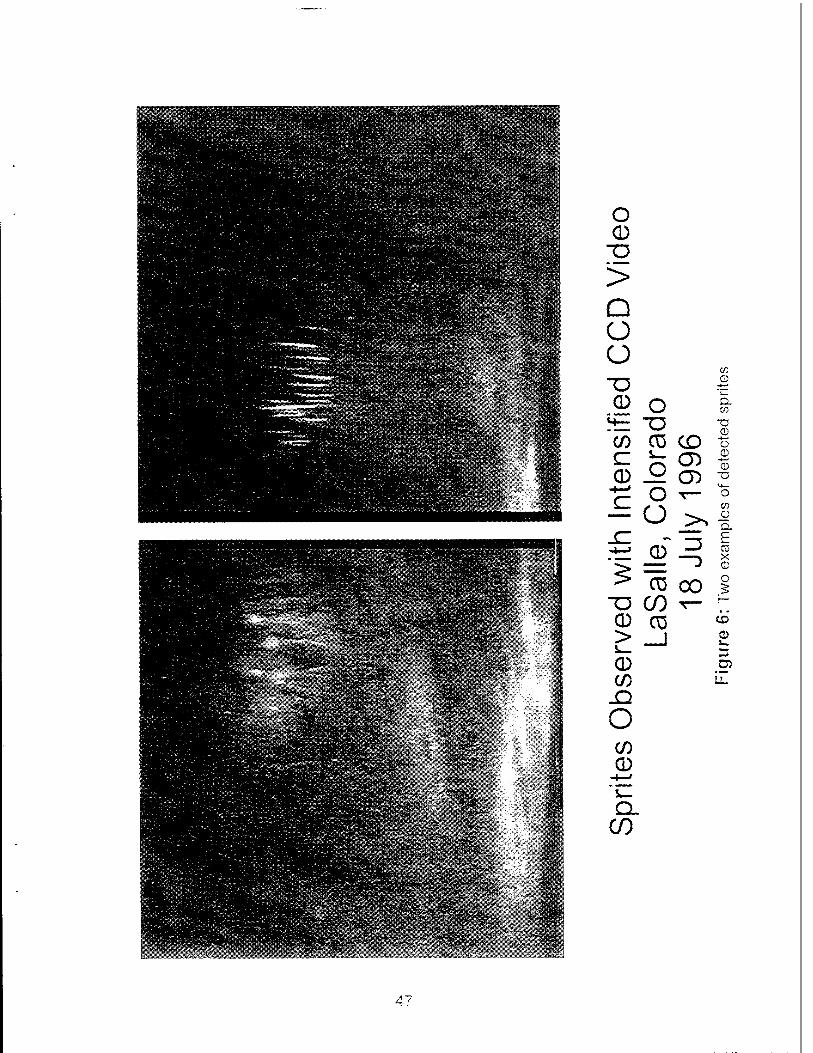
|BBESEaiSBlM|Hre ... - j IHBMii|iiiiMTTnHPiffli?ViiT "iT i ' i i— ^ nrn .•:•..»•
J»-i
i
••SBfe
o 0
>
Q O o
w ~o -2 <D o Q.
H— T3 0 CO CD CD "ü
CD O CD ©
c o O
x— o
JZ ~ Z3
—)
{— r- -4—1 _a> X
> CD
CD CD
0 CO
O CO CD
CL CO
00
C£>
©
y_
47
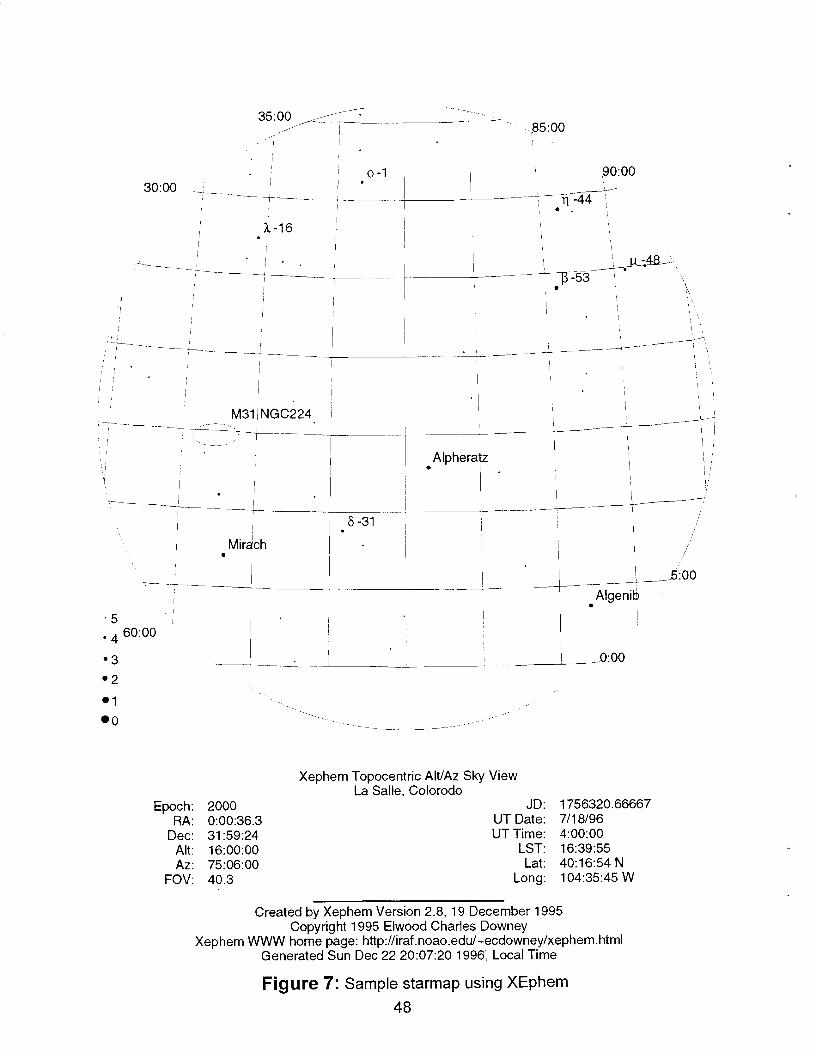
35:00 ,-"T ,85:00
0-1 .90:00 30:00
1-16
Ti -44
"F53 _ju4a.-\
M31 NGC224
Alpheratz
5-31
Mirach
Algenitj)
•4
•3
•2
•1
• 0
60:00
.0:00
Xephem Topocentric Alt/Az Sky View La Salle, Colorodo
Epoch 2000 JD 1756320.66667 RA 0:00:36.3 UT Date 7/18/96
Dec 31:59:24 UT Time 4:00:00 Alt 16:00:00 LST 16:39:55 Az 75:06:00 Lat 40:16:54 N
FOV 40.3 Long 104:35:45 W
Created by Xephem Version 2.8, 19 December 1995 Copyright 1995 Eiwood Charles Downey
Xephem WWW home page: http://iraf.noao.edu/~ecdowney/xephem.html Generated Sun Dec 22 20:07:20 1996, Local Time
Figure 7: Sample starmap using XEphem
48
overall goal of this work was to study ionospheric signatures of the interaction
between the solar wind, magnetosphere and ionosphere. To this end,
simultaneous all-sky imaging photometer (ASIP II) and incoherent scatter radar
(ISR) observations from Sondrestromfjord, Greenland were analyzed to
determine the plasma flow in the vicinity of discrete high-latitude aurora in the
context of local time and auroral morphology.
A more detailed examination of five arcs, selected because of their
distribution in local time, relatively long duration, and varied morphology,
revealed two distinct convection patterns. Three of the arcs, which are sun-
aligned and occur at dusk, midnight, and dawn, lie along a shear reversal in the
tangential component of the plasma flow consistent with V*E<0. In all three
cases, the normal component of the plasma convection tended to be equal to the
velocity of the arc so that the arcs were embedded in the background
convection. These arcs are characterized by soft particle precipitation (-.3 keV
to 1.5 keV), weak and relatively constant emissions, and regular motion. While a
net upward field-aligned current (FAC) density is associated with all three arcs, a
more detailed determination of the FAC density of two of the arcs showed that
these arcs couple to the magnetosphere via an upward-downward FAC pair with
the more intense upward FAC located on the duskside of the arc.
In addition to the ASIP II and ISR observations, measurements of the sun-
aligned arc located at dawn are also made by the Qaanaaq, Greenland all-sky
imaging photometer and the DMSP F8 and F9 plasma instruments. These
indicate that this arc is a theta aurora that forms near the dawn auroral oval and
drifts toward the center of the polar cap. Currently, a paper is being written (for
submission to the J. Geophysical Res.) that examines the electrodynamics and
global morphology of this extremely interesting set of observations.
The two remaining arcs were aligned parallel to the auroral oval and
occurred during active periods characterized by a rapid poleward motion of the
most poleward arc. The associated convection pattern was characterized by
49
strong (-400 m/s) generally antisunward plasma flow across the most poleward
arc and a latitudinally narrow region of enhanced eastward plasma flow (-1000
m/s) along the poleward edge of the most poleward arc. The strong eastward
plasma flow is the response of the ionosphere to an upward-downward FAC pair
with the upward current corresponding to the arc and the downward current
poleward of the arc. On the other hand, the strong antisunward flow across the
arc is indicative of a nightside gap in the polar cap boundary and suggestive of
magnetospheric reconnection. An important future project should employ the
entire ASIP II Sondrestromfjord data base to further investigate the two
dimensional plasma flow and auroral and magnetic activity during a rapid
poleward expansion of the auroral oval.
The specialized experimental and analysis techniques developed herein
provide an extensive set of plasma and field measurements that may be used to
examine the ionospheric effects of auroral arcs and provide a context for other
ground and space based measurements.
Several C and IDL programs and procedures were developed and
implemented in order to conduct the above analysis. They included an analysis
technique developed to infer two-dimensional plasma flow patterns from multi-
position Doppler velocity measurements and to compare model flow patterns to
multi-position Doppler velocity measurements. The ionospheric plasma flow is
related to the electric field distribution by the equation E = -V x B. This analysis
program is being translated to IDL for more general use with IDL routines that
were developed to display the two dimensional flow pattern superposed on the
appropriate all-sky image. Several different techniques for inferring the
convection should be included in the future releases of the code for comparative
purposes. A C program was written to calculate the ionospheric conductivity
using the measured electron density and an appropriate MSIS neutral
atmosphere profile. Additionally, a C program was written to successfully
calculate the field-aligned currents that couple the ionosphere and
magnetosphere using the electric field and conductivity distributions determined
50
above. In order to show the temporal evolution of the auroral emissions and
make proper comparisons between the optical and radar data, an IDL program
was written to extract intensity profiles coincident with the location of the radar
scans. Using an IDL routine, the intensity profiles are displayed as a function of
time in a format analogous to keograms. Alternatively, the profiles were
exported to commercial graphics packages (DeltaGraph or KaleidaGraph) for
comparison to radar and satellite measurements. IDL software to analyze all-sky
camera calibration data and apply calibration parameters to obtain
photometrically correct all-sky images has been developed and implemented.
This software can remove background counts, converts counts to Rayleighs,
correct for instrument vignetting, and correct for the van Rhijn effect. The
corrected images have been used in collaborative studies with R. Doe of SRI
international and T. Pedersen of Utah State University.
51
5. Liaison of PL/GPIA with the Broader Scientific Community
Dr. M. Kelley of Cornell University was employed throughout this contract
as a Consultant to provide overall planning recommendations to PL/GPIA, and to
liaise PL efforts with related research in the broader scientific community. There
were two components to his effort, summarized below:
HAARP Program:
The HAARP Project was at a crucial stage of its evolution in the 1993
period. In prior years, the driving practical interests of the Air Force and Navy
involved the ability to artificially modify the ionosphere and to modulate the
currents which flow therein for communications purposes. These interests
remain but have lost some of their luster in the present downsizing of many
military systems. Similarly, the NSF Ionospheric Modification Program was
languishing somewhat due to low funding and the slowly developing Arecibo
upgrade project.
The notion was floated that the US Ionospheric Heating Effort might be
organized in a manner analogous to the NSF CEDAR Program. Since Professor
Kelley (hereafter designated as MCK) was the Chairman of the CEDAR Steering
Committee, it is natural for him to help study this option under the present
Consulting Agreement. To this end several white papers were written to outline
and refine the idea, meetings were held to discuss the choice of Chairman and
Steering Committee members, and the plans for a yearly meeting of the heating
community outlined.
In March 1994, a crucial meeting was held with the National Science
Foundation, ONR and Phillips Lab personnel. The proposed Chairman (Lewis
Duncan) was present ( as well as MCK) and a decision was made to proceed on
the concept. From the NSF standpoint there was interest in both the
Modification aspects, witness the Arecibo Program, and the possibility that a
52
cadre of HAARP funded instrumentation could make an impact on upper
atmospheric studies in the Alaskan sector. The plans for a yearly meeting of the
community were outlined.
Early in January 1995, a crucial meeting was held at URSI to initiate the
effort. Many issues concerning the planning of the U. S. Ionospheric
Modification program were discussed. They included various educational
contributions dealing with HAARP, planning for the upcoming nationwide
campaigns using the Arecibo, HIPAS and HAARP facilities, and preparation for a
major meeting at Santa Fe. These details were discussed and agreed to by the
Steering Committee at URSI.
In this period a real beginning of the work toward an ISR for HAARP
commenced. There was a working session of the joint HAARP/PCO committees
at the Santa Fe workshop on this topic and plans made for further meetings.
Contacts with Lee Snyder began in this regard since he was instrumental in the
initial joint meetings between HARP and PCO scientists. At the 1996 Santa Fe
meeting a clear statement was sent to the major funding agencies that the
requirements for the PCO and HAARP ISR's are fully compatible.
At this meeting MCK was installed as the Chairman of the Ionospheric
Modification Steering Committee. One of the important roles he has taken under
the KEO umbrella was to publish a newsletter for the community. The front page
of the first newsletter is presented in Appendix J.
Space Weather Program:
One issue of importance to the ionospheric research component of the
Phillips Laboratory involves the direction which their research should take in the
aftermath of the end of the cold war. Much of the efforts in the 1980's involved
detailed characterization of the polar regions since in any likely scenario for
World War III this region would play a crucial role. The Panama Incident, the
Gulf War and the confilict in Somalia showed that the tropical zones may play a
more central role in future conflicts than previously thought.
53
Against this backdrop, the work done under this consulting agreement has
concentrated on the low-latitude to equatorial zone, and how the expertise and
experience of MCK could be used to help guide a renewed research effort in this
area. The term renewed is used since the Phillips group has a long history of
equatorial research stemming from the period when equatorial irregularities
were, (a) an important source of trans-equatorial communications problems and
(b) were a convenient source of ionospheric structure comparable to the chaos in
a nuclear environment. With this history, such a transition was not thought to be
a problem until the tragic loss of a key researcher in the group. In his efforts to
assist the group MCK has concentrated on the two potentially important aspects
of this ionospheric sector described in the paragraphs below.
There seems little doubt that the single most important technical
breakthrough in C31 in the last decade is the Global Positional Satellite System
(GPS). Since such systems must propagate through the ionosphere, it becomes
a component in the accuracy and reliability of such systems. Now it is true that
with sufficiently sophisticated receivers, many of the ionospheric effects can be
negated. But from a purely economic argument when the concept of the
commercial airplane or even the individual soldier carrying a GPS receiver is
floated, the role of the ionosphere must be considered since it is unlikely that
such receivers will be feasible at this deployment scale. As part of this project,
MCK has synthesized the GPS observations made by NOAA on the island of
Kwajalein in 1990 with the fortuitously simultaneous observations made during
the NASA/CRRES Rocket Project at the same location. The process has been
tortuous but is beginning to give results. There may be important implications for
GPS systems in the presence of equatorial spread-F, the ionospheric version of
a thunderstorm.
Secondly, the Gulf War made it clear that intelligence information in the
tropics and mid-latitude zones is crucial. For broad area surveillance, there is
nothing to compete with OTH systems, but with the outbreak of peace there has
been a rush to close the existing systems in the US sector. So how can we
54
remain current in such a potentially crucial area against this backdrop? The
Australians are investing substantial funding in OTH due to their unique
surveillance needs and are more than willing to share their data and knowledge
in this arena (witness the Memoranda of Agreement for joint-OTH research).
The consultant has conceptualized a potentially important experiment in the
Australian sector and encouraged Phillips Lab to participate with an all-sky
imager located below the reflection point of a powerful OTH system on a mid-
latitude path. Planning proceeds and it seems likely that the project will be
carried out in the future when the ionospheric disturbances maximize in that
sector.
MCK also helped design the HF aspects of the MISETA Project. There
were to be several channel probes and airglow instruments. An interesting new
aspect MCK worked on is the inclusion of the ROTHR system in Virginia in the
campaign. Also, the idea to perform extensive GPS observations is being
considered and would involve a number of receivers modified for scintillation
work. This upsurge of equatorial science has come up against a problem
between the U. S. State Department and that of Chile however and so far not a
single instrument has been fielded.
Slightly in the future is the idea to support a DNA project in the Kwajalein
sector. MCK has begun to help plan this cooperative project. We hope it has a
better cooperation at the State Department level than the MISETA/Phillips
Project.
55
6. Scientific Reports, Journal Articles
Weber, E.J., S. Basu, T.W. Bullett, C. Valladares, G. Bishop, K. Groves, H.
Kuenzler, P. Ning, P. J. Sultan, R.H. Sheehan, J. Araya, "Equatorial Plasma
Depletion Onset and Precursor Signatures at 11° South of the Magnetic
Equator", Journal of Geophysical Research, Vol. 101, No. A12, Pages 26,829-
26,838, December 1, 1996.
Sales, G.S., B.W. Reinisch, J.L. Scali, C. Dozois, T.W. Bullett, E.J. Weber, P.
Ning, "Spread-F and the Structure of Equatorial lonization Depletions in the
Southern Anomoly Region", Journal of Geophysical Research, Vol. 101, No.
A12, Pages 26,819-26,827, December 1, 1996.
Bishop, G.J., E.J. Weber, A.J. Mazzella, E.A. Holland, S. Rao, P. Ning,
"Simultaneous TEC Decreases and Scintillation Observed on GPS Signals
Traversing Equatorial Plasma Depletions", Ionospheric Effects Symposium,
Alexandria, VA, 7-9 May, 1996.
56
7. Personnel
Personnel working on this contract were as follows:
Principal Investigator:
Senior Engineer:
Consulting Engineer:
Consulting Scientists:
Consulting Technician:
Robert H. Eather
Peter Ning
Cyril Lance
Michael Kelley
Hugh Gallagher
Timothy McEnerney
57
8. Procurement
Major equipment items purchased during this contract:
1 HAARP Azimuth/Elevation Mount
2 Sony EVT 800 Time Lapse Recorder
1 Pronto electric shutter
2 50mm dia. grism
1 Motor/clutch replacement for aurora film camera
1 Winbook DX4-100 Laptop Computer
1 Varo Image Intensifier (replacement for the MIP)
2 Pulnix Video Cameras
1 Custom circuit board
2 Sony time-lapse VCRs
2 Canon 85mm/F1.2 lenses
1 CAD design software
1 Pentium Computer with Exabyte Tape Drive
1 Barr Assoc. Interference Filter
2 Fujinon 25mm/F0.85 Lenses
58
9. Travel
The following lists travel of Keo personnel in support of this Contract:
Dates Personnel Location Purpose
4/18/93- P. Ning Sondrestrom, Greenland Field Support 4/27/93
5/4/93- P. Ning Albuquerque, New Mexico Demonstrate RASWS 5/13/93
11/6/93- P. Ning Sondrestrom, Greenland Field Support 11/20/93
12/8/93- P. Ning Resolute Bay, Canada Field Support 12/15/93
1/6/94- P. Ning Andoya , Norway Field Support 1/23/94 C. Lance
7/5/94- P. Ning Wallops Island, VA Field Support 7/11/94 T. McEnerney
8/16/94- P. Ning Wallops Island, VA Field Support 8/19/94
9/19/94- P. Ning Agua Verde, Chile Field Support 10/10/94
2/7/95- P. Ning Wallops Island, VA Field Support 2/10/95
2/25/95- P. Ning Howard AFB, Panama RASWS Instal 3/4/95
4/25/95 P. Ning Washington, DC SAIC Meeting
7/14/95- P. Ning Menlo Park, CA RASWS/ASIP 7/21/95 Development
8/21/95- P. Ning Menlo Park, CA RASWS/ASIP
59
8/28/95 Development
9/18/95- P. Ning Menlo Park, CA 9/22/95
11/11/95- P. Ning Northern Chile 12/5/95
3/18/96- P. Ning Menlo Park, CA 3/21/96
4/19/96- P. Ning Santa Fe, NM 4/23/96
6/10/96- P. Ning La Salle, CO 6/16/96
7/21/96- P. Ning La Salle, CO 7/31/96
RASWS/ASIPII Development
RASWS Deployment
RASWS/ASIP-II Development
HAARP Imager Demonstration
Field Support
Field Support
60
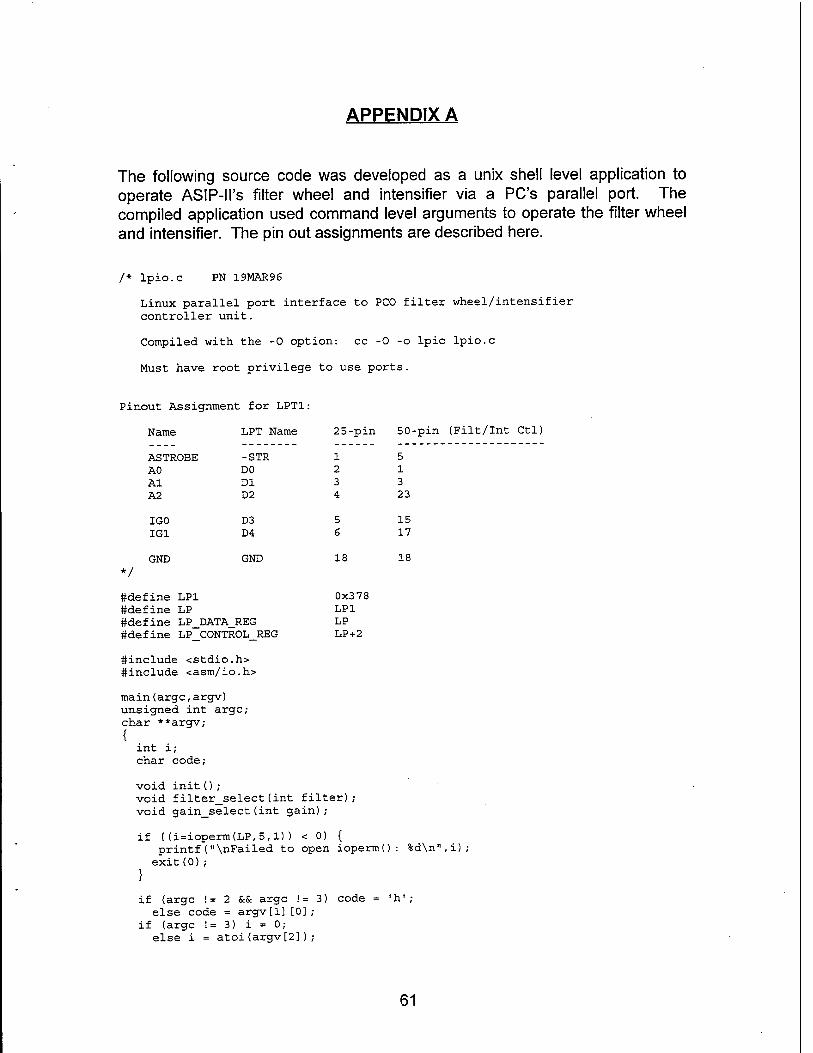
APPENDIX A
The following source code was developed as a unix shell level application to operate ASIP-ll's filter wheel and intensifier via a PC's parallel port. The compiled application used command level arguments to operate the filter wheel and intensifier. The pin out assignments are described here.
/* lpio.c PN 19MAR96
Linux parallel port interface to PCO filter wheel/intensifier controller unit.
Compiled with the -0 option: cc -0 -o lpio lpio.c
Must have root privilege to use ports.
Pinout Assignment for LPT1:
Name LPT Name
-STR
25-pin
1
50
ASTROBE 5 AO DO 2 1 Al Dl 3 3 A2 D2 4 23
IGO D3 5 15 IG1 D4 6 17
GND "/
GND 18
#define LP1 #define LP #define LP_DATA_REG #define LP_CONTROL_REG
#include <stdio.h> #include <asm/io.h>
main(arge,argv) unsigned int arge; char **argv; {
0x378 LP1 LP LP+2
int i ; char code;
void init(); void filter_select(int filter); void gain_select(int gain);
if ((i=ioperm(LP,5,l)) < 0) { printf ("\nFailed to open iopermO: %d\n",i); exit(0);
}
if (arge != 2 && arge != 3) code = 'h'; else code = argv[l][0];
if (arge != 3) i = 0; else i = atoi(argv[2]);
61
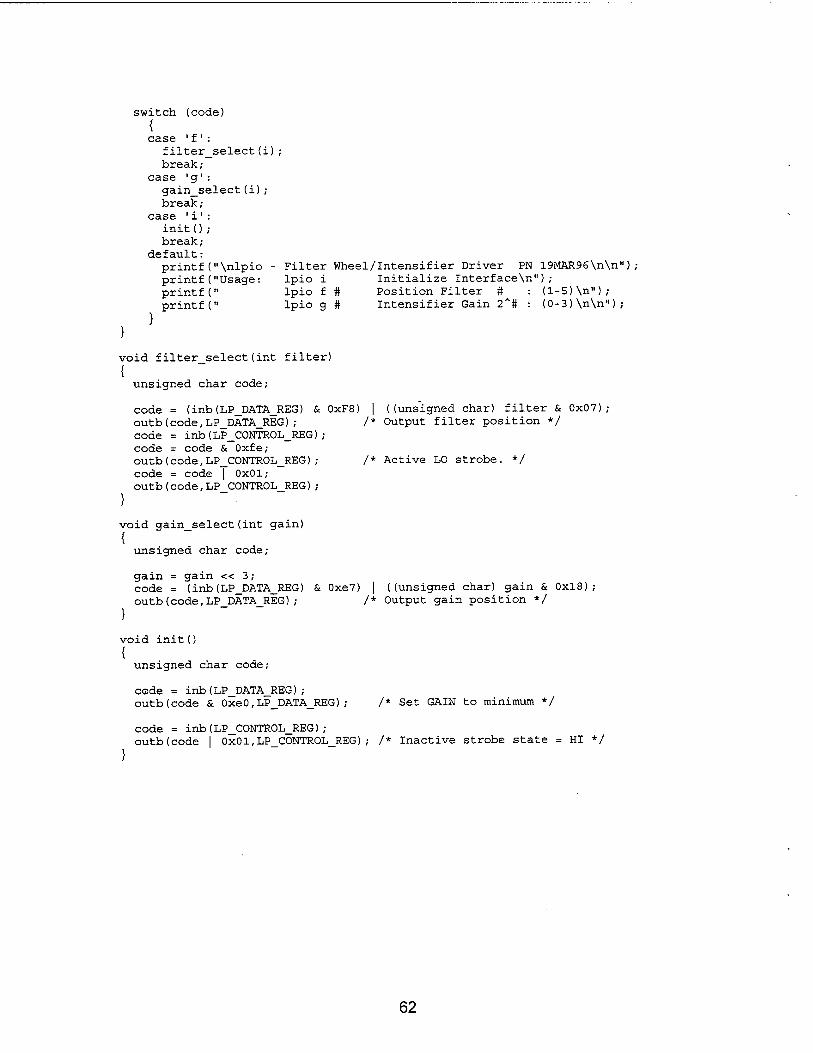
switch (code) { case 'f':
filter_select(i) ; break;
case 'g': gain_select(i) ; break;
case 'i': init(); break;
default: printf("\nlpio - Filter Wheel/Intensifier Driver PN 19MAR96\n\n"); printf("Usage: lpio i Initialize Interface\n"); printf(" lpio f # Position Filter # : (1-5)\nM); printf(" lpio g # Intensifier Gain 2^# : (0-3)\n\n");
}
void filter_select(int filter) { unsigned char code-
code = (inb(LP_DATA_REG) & 0xF8 outb(code,LP_DATA_REG); code = inb(LP_CONTROL_REG); code = code & Oxfe; outb(code,LP_C0NTR0L_REG); code = code | 0x01; outb(code,LP_C0NTR0L_REG);
}
| ((unsigned char) filter & 0x07); /* Output filter position */
/* Active LO strobe. */
void gain_select(int gain) { unsigned char code;
}
gain = gain << 3; code = (inb(LP_DATA_REG) & 0xe7) | ((unsigned char) gain & 0x18); outb(code,LP DATA_REG); /* Output gain position */
void init() { unsigned char code;
code = inb(LP_DATA_REG); outb(code & 0xe0,LP DATA_REG) /* Set GAIN to minimum */
code = inb(LP_CONTROL_REG); outb(code I 0x01,LP C0NTR0L_REG); /* Inactive strobe state = HI */
62
APPENDIX B
The following file describes the setup procedures to operate and run an intensified CCD camera developed by KEO for telescope operations but modified and adapted for observing sprite phenomenon. The instructions were written in a concise non-technical language.
OPERATION CHECKLIST FOR SPRITE MEASUREMENTS:
KEO OPTICAL CAMERA CHEAT SHEET FOR SPRITES '96 PN 14JUN96
[ OUTSIDE CAMERA SETUP ]
-Remove tarp, check tripod level indicator-bubble inside black circle. -Screw down camera head with platform leveled - knob underneath base plate. -Connect camera and intensifier cables. Remove lens cover. -Verify front lens aperture is opened fully (the smallest F-stop number). This can be done without looking by rotating fully counter-clockwise to the stop as you look into the lens from the front. -Adjust and lock desired azimuth and elevation positions.
[ INSIDE CAMERA SETUP ]
-Confirm intensifier power unit switch OFF (down) and at lowest level, #1. -Manually power ON in sequence: Monitor,VCR, Camera Controller,Intensifier. -Adjust UTC time on VCR: +Select MENU from SEARCH/MENU switch on front black panel. +Push lighted READY/MENU button (2nd left button from dial) . +Dial should be in JOG mode - if not,push dial to toggle from SHUTTLE mode. +Rotate (DO NOT PUSH!) dial counter-clockwise (CCW) SLOWLY till the menu #5008 "08 TIME CODE PRESET" blinks. Then push the DATA/STOP button.
+Set UTC time to nearest second (allow enough time for setup), HH:MM:SS:00 using dial and DATA/STOP button. Dial alone selects blinking displayed digit. Hold DATA/STOP button down while rotating dial selects the value. +When ready to sync, push the SET/SEARCH button approximately 0.5 sec BEFORE start time. +Select SEARCH from SEARCH/MENU switch to exit set time mode. -Install blank videotape. Press REWIND to start of tape. -Begin record by pushing simultaneously the PLAY and REC buttons. Clock will "free run" on the monitor. Note the start time to label the tape. Note: Video tape length is 2 hours. VCR clock LOSES 4 seconds per hour! -Obtain a starmap: cycle all levels of the image intensifier for 5 seconds each. Then return to desired level for viewing - usually at #1 or #2.
[ STOP RECORDING/CHANGING TAPES ]
-Press STOP button, then the blue EJECT button. Remove recorded tape. -Insert and rewind new tape. -Repeat above procedures from adjust the UTC time again. This is necessary to minimize the VCR's clock drift. -Label the previously recorded tape with DATE/TIME and any relevant info: lenses used, intensifier & aperture settings, look angles, etc. -Remove plastic recording tab on any tape you plan to keep the data instead of re-recording. This will prevent accidental erasure.
63
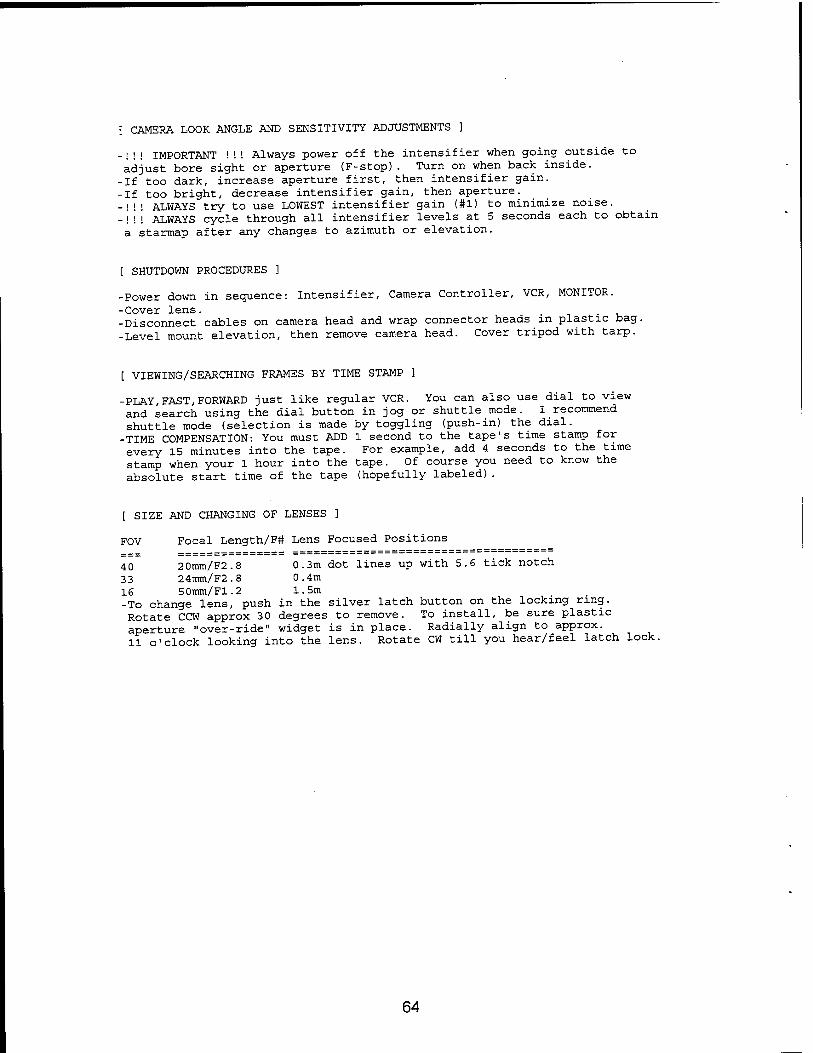
[ CAMERA LOOK ANGLE AND SENSITIVITY ADJUSTMENTS ]
iii IMPORTANT !!! Always power off the intensifier when going outside to adjust bore sight or aperture (F-stop). Turn on when back inside. -If too dark, increase aperture first, then intensifier gain. -If too bright, decrease intensifier gain, then aperture. -!!! ALWAYS try to use LOWEST intensifier gain (#1) to minimize noise. -!!! ALWAYS cycle through all intensifier levels at 5 seconds each to obtain a starmap after any changes to azimuth or elevation.
[ SHUTDOWN PROCEDURES ]
-Power down in sequence: Intensifier, Camera Controller, VCR, MONITOR. -Cover lens. . -Disconnect cables on camera head and wrap connector heads in plastic bag. -Level mount elevation, then remove camera head. Cover tripod with tarp.
[ VIEWING/SEARCHING FRAMES BY TIME STAMP ]
-PLAY,FAST,FORWARD just like regular VCR. You can also use dial to view and search using the dial button in jog or shuttle mode. I recommend shuttle mode (selection is made by toggling (push-in) the dial. -TIME COMPENSATION: You must ADD 1 second to the tape's time stamp for every 15 minutes into the tape. For example, add 4 seconds to the time stamp when your 1 hour into the tape. Of course you need to know the absolute start time of the tape (hopefully labeled).
[ SIZE AND CHANGING OF LENSES ]
FOV Focal Length/F# Lens Focused Positions
40 20mm/F2.8 0.3m dot lines up with 5.6 tick notch 33 24mm/F2.8 0.4m 16 50mm/F1.2 1.5m -To change lens, push in the silver latch button on the locking ring. Rotate CCW approx 30 degrees to remove. To install, be sure plastic aperture "over-ride" widget is in place. Radially align to approx. 11 o'clock looking into the lens. Rotate CW till you hear/feel latch lock.
64
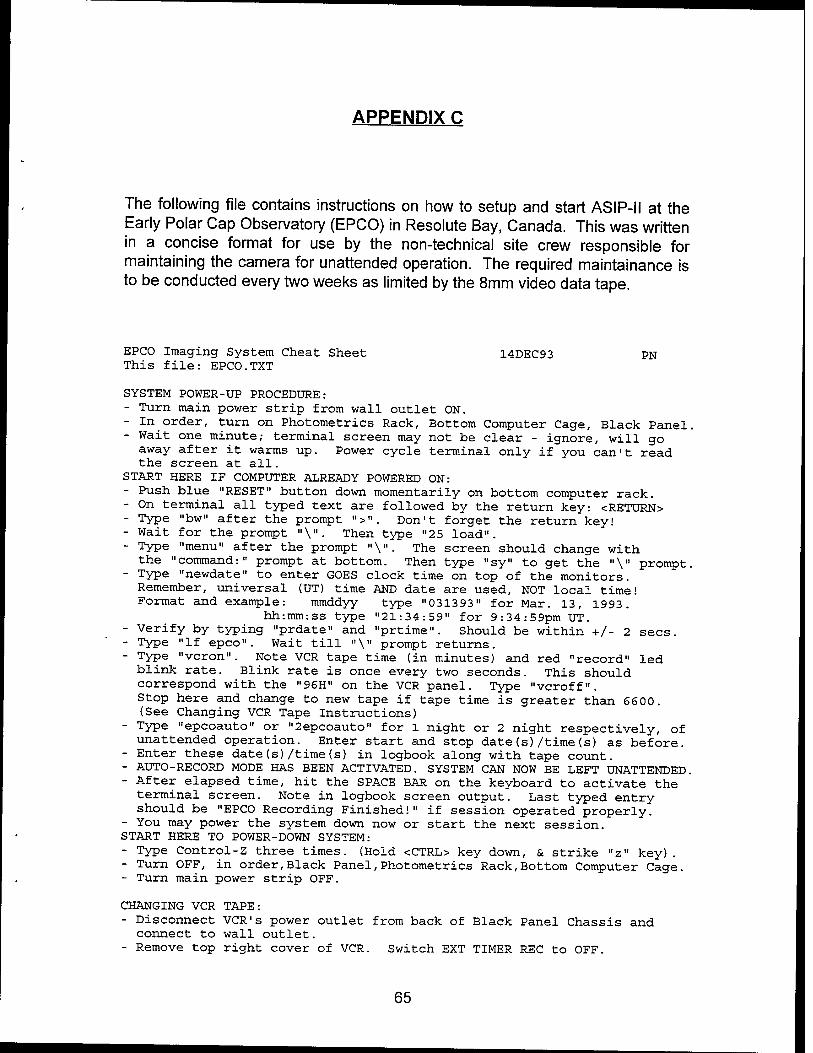
APPENDIX C
The following file contains instructions on how to setup and start ASIP-II at the Early Polar Cap Observatory (EPCO) in Resolute Bay, Canada. This was written in a concise format for use by the non-technical site crew responsible for maintaining the camera for unattended operation. The required maintainance is to be conducted every two weeks as limited by the 8mm video data tape.
EPCO Imaging System Cheat Sheet 14DEC93 PN This file: EPCO.TXT
SYSTEM POWER-UP PROCEDURE: - Turn main power strip from wall outlet ON. - In order, turn on Photometries Rack, Bottom Computer Cage, Black Panel. - Wait one minute; terminal screen may not be clear - ignore, will go away after it warms up. Power cycle terminal only if you can't read the screen at all.
START HERE IF COMPUTER ALREADY POWERED ON: - Push blue "RESET" button down momentarily on bottom computer rack. - On terminal all typed text are followed by the return key: <RETURN> - Type "bw" after the prompt ">". Don't forget the return key! - Wait for the prompt "\". Then type "25 load". - Type "menu" after the prompt "\". The screen should change with the "command:" prompt at bottom. Then type "sy" to get the "\" prompt.
- Type "newdate" to enter GOES clock time on top of the monitors. Remember, universal (UT) time AND date are used, NOT local time! Format and example: mmddyy type "031393" for Mar. 13, 1993.
hh:mm:ss type "21:34:59" for 9:34:59pm UT. - Verify by typing "prdate" and "prtime". Should be within +/- 2 sees. - Type "If epco". Wait till "\" prompt returns. - Type "vcron". Note VCR tape time (in minutes) and red "record" led blink rate. Blink rate is once every two seconds. This should correspond with the "96H" on the VCR panel. Type "vcroff". Stop here and change to new tape if tape time is greater than 6600. (See Changing VCR Tape Instructions)
- Type "epcoauto" or "2epcoauto" for 1 night or 2 night respectively, of unattended operation. Enter start and stop date(s)/time(s) as before.
- Enter these date(s)/time(s) in logbook along with tape count. - AUTO-RECORD MODE HAS BEEN ACTIVATED. SYSTEM CAN NOW BE LEFT UNATTENDED. - After elapsed time, hit the SPACE BAR on the keyboard to activate the terminal screen. Note in logbook screen output. Last typed entry should be "EPCO Recording Finished!" if session operated properly.
- You may power the system down now or start the next session. START HERE TO POWER-DOWN SYSTEM: - Type Control-Z three times. (Hold <CTRL> key down, & strike "z" key). - Turn OFF, in order,Black Panel,Photometries Rack,Bottom Computer Cage. - Turn main power strip OFF.
CHANGING VCR TAPE: - Disconnect VCR's power outlet from back of Black Panel Chassis and connect to wall outlet.
- Remove top right cover of VCR. Switch EXT TIMER REC to OFF.
65
Turn VCR ON. Rewind tape and remove. Clean tape head with Tape Cleaning Cartridge. Follow box instructions. Install blank tape. Rewind and hit RESET button on front panel. Verify that "96H" TIME MODE is displayed. Adjust if necessary. Power OFF VCR. Switch EXT TIMER REC button to ON. Replace cover. Reconnect VCR's power cord to cord on back of Black Panel Chassis.
66
APPENDIX D
M1P Imager - Setup Summary
KEO Consultants 12/94
Introduction: The following is a brief summary - a 'Starter Kit' for the MIP Imager sent to you by Phillips Lab for auroral observations. This will be an attempt to guide you through setting up the instrument and getting some rudimentary data. For a thorough understanding of how the imager works, and a more detailed explanation of the software package MIPCTL, please read the manual supplied with the imager. There has been an additional package written specifically for your campaign called the Stand-Alone Acquisition System and will be discussed in some detail in this document.
The manual supplied with this imager was written for the HAARP imager which is a bigger version (more sensitive) of the MIP imager supplied. Chapters 1 and 2 deal with the fundamental design and calibration of the HAARP imager. While the numbers may be different, the underlying design and principles can be applied to this camera. These first two chapters are not necessary for running the instrument. Chapters 4 and 5 talk about the MIPCTL application as of version 5.3.1. While there have been many changes in the software since this manual was printed, the fundamental operation is identical. Therefore these chapters will probably be the most useful to you.
It is hoped, however, that you will not need to reference this manual at all, and that the instrument becomes self-explanatory as you read this document. Good-luck!!!
Instructional Video: We have provided for you a video-tape of us putting together the system and running the software. We apologize for the poor production and what is probably a fairly boring tape, but we hope it will be useful in setting up the system and collecting data. Watch this first, and if you have questions, refer to this document and subsequently to the manual.
Unpacking the Instrument and Inspection: Due to shipping conditions, it is important to check the instrument carefully before plugging everything together and connecting power to the system. We have found from experience
67
that boards come loose, and need to be reseated sometimes to get everything working properly.
A visual inspection helps a lot. Take off the bottom panel of the imager when you pull it out of it's case and look to make sure that all the circuit boards in the card cage to the back of the camera are seated firmly. In addition, it is good to take off the cover to the computer and visually inspect all the circuit boards inside and make sure they are firmly seated in the PC.
Once you are convinced that everything survived shipping adequately, you are ready to start connecting everything up.
A Word about Power: The computer and camera take only 110VAC, 60Hz AC Power. Please do not try any other power to the camera as it will destroy the electronics which are very sensitive and extremely expensive.
The Computer: Start by hooking up the computer. This should have four major components:
Computer Chassis (Gateway2000 486) Computer Monitor (NEC 3FGx) Computer Keyboard Computer Mouse
• Connect the 110VAC power cable from your power source to the computer chassis (make sure the computer is off).
• Connect the 110VAC power cable from the computer monitor to the computer chassis (again, make sure the computer is off).
• Connect the keyboard to the Keyboard connector on the back of the computer chassis.
• Connect the Mouse to the DB-9 connector labeled COMM1 on the back of the computer chassis.
There is a VGA Mixing cable that is a short cable with three DB-15 connectors on it labeled 'P1 (AFG)\ 'P2 (VGA)', and 'P3 (Monitor)'. Make sure that you screw these connectors on as they are somewhat sensitive to movement. Hook this up as follows:
• Connect P1 (VGA) to the connector on the back of the computer chassis labeled "AFG Video Out'.
68
• Connect P2 (VGA) to the connector on the back of the computer chassis labeled "Monitor".
• Connect P3 (Monitor) to the monitor cable coming from the NEC 3FGx video monitor supplied with the system.
You should now be ready to power up the computer and test whether everything survived shipping! Turn on the computer power by pushing the power button on the front of the unit. Make sure the monitor power is on by depressing the power button on the front lower corner of the video monitor.
You should see the computer boot up and eventually run Windows 3.1 the operating system for the computer. If the boot process ends up leaving the system at the DOS level, you will see a prompt like:
C:>
Type the command:
C:>win<cr>
and wait for Windows 3.1 to load up.
The Camera Cable: There will be supplied a long camera cable with the system. The end with two D-type connectors is connected to the computer. Be careful with the large D-sub connector that has 44 pins. The pins are quite fragile and the connector needs to be inserted correctly and carefully.
• Connect the larger DB-44 connector to the back of the computer chassis to the connector labeled "AFG Video In".
• Connect the smaller DB-9 connector to the back of the computer chassis to the connector labeled "COMM4 'RS^r'.
• Connect the ground shield to the case ground of the computer chassis. One easy way to do this is to pry off the back plastic cover of the computer chassis and connect the ground lug to the closet chassis screw.
The Camera light Sensor: Before turning on the camera, we want to make sure that we have protected the intensifier from being exposed to light while the camera power is applied. There is a light detector supplied with the unit that looks like a little LEMO connector. This plugs into the front of the camera (it is a two-conductor connector). This detector should be installed at all times to
69
protect damaging the image intensifies The camera should never be used in bright (daylight) conditions!!!
Now, we need to connect up the camera. There are only two cables to connect on the camera-head, but make sure you connect in the following order:
• With the computer and camera off, connect the other end of the camera cable to the large circular connector on the back of the camera. This connector aligns only in one orientation.
• Turn on the computer first and make sure the computer is operating properly. The first time running the camera, it is helpful to look at the output of the camera's computer to verify operation. To do this, make sure the Windows 3.1 operating system is running and under the Stand-Alone program group, execute the Term -- HRP.TRM program by double-clicking with the mouse on the Term icon. This software will appear with a blank window.
• Connect the AC power cable to the camera head and then to your 110VAC, 60HZ power line.
• You will now be able to watch the startup sequence of the camera's computer output to the Terminal window. The output should look like this:
RETRIEVING THE DICTIONARY RETRIEVING FORTH USER AREA RETRIEVE STATE COMPLETE
ISR = CVR = RXH = RXM = RXL =
DSP READY STATES DOWNLOADED FORMAT INITIALIZED
MIP Control Software Version 11 Hit '0' to return to FORTH Kernel #
If this is what you see in the Terminal window, you are all set - the camera is working. This process takes a minute or so, so be patient. If you not get anything in the window, check to make sure that the cables are hooked up correctly. If you do not get the # prompt at the end of the camera's startup
70
sequence, something is wrong, and we suggest trying to reseat the boards inside the back of the camera (open up the sliding doors underneath the base of the camera).
Again, this is covered in detail in the video tape so we suggest you watch that first.
Once you have verified that the camera is working correctly, it is time to make sure it is set up right.
The camera control panel: The control panel on the camera should be set up correctly, but you can verify this by taking off the control panel on the side of the camera. The cover is just held in magnetically so it should easily come off with your fingers. Verify that the toggle switches controlling the shutters, intensifier, and filterwheel are all set to the REMOTE position.
You can toggle the display to the ON position and look at the LED indicators. The intensifier gain can be set from 0 to 3, and the filterwheel positions can be set from 1 to 5. You can look at the different temperatures of the camera by selecting them with the rotary switch. Typical temperatures for the camera should be around:
T-CCD-30C (takes about 15 minutes to achieve) T-TEC+35C (takes about 15 minutes to achieve) T-INT +1C (takes about 30 minute to achieve) T-FW +28C (takes about 5 minutes to achieve)
Watch the CCD cool as the camera is turned off. Verify that the difference between T-CCD and T-TEC is about 65C. Normally, you wont have to think about these things, and once the camera is set up, you can leave the control panel off.
Once you are satisfied that the control panel is setup correctly (again, you shouldn't have to adjust anything - we shipped the camera configured correctly), turn the DISPLAY off again, and put the cover back on.
Checking the Camera Optics: With power to the camera turned off and the light sensor installed, unscrew the filterwheel face plate on the front of the camera. This is the small circular ring with knurled edges. Do this in a clean environment as this exposes the filters to dust which degrades the image quality. With the filters exposed, take the lens supplied with the camera (a 180 fisheye lens) and very carefully screw this lens into the front of the filterwheel. The threads are very fine and care should be taken not to cross-thread it. Lightly tighten the lens.
71
The front lens should always be set at /4, and focused at _ and, once set, should be taped up so that the settings cannot be accidentally changed.
The second camera lens in the system is in front of the image intensifier housing. The should be set at /2 (all the way open), and focused somewhere around 2-3'. This focus will be adjusted once you have the camera imaged on some stars. The back lenses between the image intensifier and the CCD camera are preset and should not be adjusted. If for some reason they have come loose, please contact us on how to adjust.
Running the Camera Control System
Setting UT time: Because the computers are not networked to your time source, and the computer time drifts significantly from day to day, it is a good idea to set the computer time at the beginning of each session. Use the Windows Control Panel to set this. We ALWAYS set our computers to UT time so that our data is consistent from location to location. Setting the correct UT time should be the first thing done on the computer before data acquisition sessions are started.
This is very important!!!! We recommend that you keep a log of the computer time .vs. your accurate time source and when you run the software to acquire images. A good sequence that we suggest is:
. Start the camera and computer systems and make sure that everything is working correctly.
. Shortly before getting ready to acquire data, set the computer's clock to an accurate time source. Always set the clock to UT (or GMT) time!!! This will avoid confusion later!
. Write down in your log book at what time you set the computer's clock and what the previous discrepancy was. Right down accurately you start running the acquisition software MIPCTL.
. Collect data and at the end of your session, when you are leaving the software system, set the computer clock again to an accurate time source. Again, note the computer's time .vs. actual time in your log book, before setting the computer time.
Verifying the KEOCCD.INI File: There seemed to be a problem with this file integrity as we were shipping the system to you, so it will be a good idea to check this before you start the MIPCTL application. To look at the KEOCCD.INI file (DOS: C:\WINDOWS\KEOCCD.INI), open up the Notepad
72
- KEOCCD.INI application in the Stand Alone program group. Double-click on the notepad icon, and verify that the file looks similar to this:
[Camera Settings] Gain = 1 Binning = 1 Camera = MIP
[System] Zoom = 100 Justify = 200 Display = 15 Port = COM4 Monitor = 3FGx
[CCD Acquisition] AqtPath = C:\MIP\MIPEXE\ ImgPath = D:\DATA\ LastTable = SAMPLE.AQT StandAlone = SAMPLE.STA
The important parameter to look out here is the Port = COM4, as this was being corrupted somehow when the software is exited. Make sure that there are no more characters on this line after the COM4. Most of these parameters will change as you set different parameters in the software.
For now, do not change any of these values except to verify the above Port variable. Make sure that these are always the same:
Camera = MIP Port = COM4 Monitor = 3FGx
The other parameters will change around as you use the software. It is recommended that you check the 'Port' parameter in this file each time before launching the MIPCTL application!!!
Launching the computer application: We have written a version of our software for you campaign that has the Stand-Alone Acquisition option. In DOS, this is:
C:\MIP\MIPEXE\MIP600.EXE
However, this is a Windows 3.1 application and needs to be launched from windows. In the Stand-Alone program group in the Program Manager of
73
Windows is the MIPCTL - Stand Alone ICON. Double-click on this icon (or use the RUN C:\MIP\MIPEXE\MIP600.EXE from the File menu).
The first time this software is started after a power-up on the computer takes quite a while as it has to initialize all the image processing hardware. Once the software has initialized, there should be a large black window on the computer monitor with the programs menu bar in the upper-right hand corner.
Timeout Errors: If there is a problem with the camera communication (i.e. no power to the camera, the cable is disconnected, etc.), you will get two errors when launching the MIPCTL application. These will show up as MessageBoxes with an error like:
Timeout Error!
Command: 8\r Returned:
Click on the 'OK' button with the mouse or hit the enter key for each of these errors. You do not need to restart the application (although it is recommended if you have time) to re-establish communication with the camera. Under the Comm menu, chose the Close command. Now, investigate why there is no communication to the camera (ah, I forgot to plug the power cable in... ooh, the RS-422 cable is unplugged...!). If you are powering up the camera (useful way to reset it, in the event of a camera computer error), wait 30 seconds for the camera computer to reboot itself, and then select Initialize under the Comm menu.
Test out the camera interface, try a Shade from under the CCD menu, and then a Bias. The Shade command should fill an image with a pattern from black to white, and the Bias should clear this image back to black again.
Running the software: After launching the application, quickly check to make sure that the camera interface is working. Under the CCD menu function, I usually do a SHADE and then a BIAS. The SHADE should produce a test pattern going from black to white, and the BIAS will produce a background bias signal (dark gray). This verifies that the communications, and the CCD interface is working. Sometimes the first BIAS taken will have a streak of saturated pixels at the top of the image. This is normal for the first read of the CCD after power-up. Another BIAS will clear these pixels (or the next exposure).
Acquiring Data with MIPCTL
74
For acquiring data, there are two options with this version of the re (v6.0.0). software (v6.0.0).
Acquisition tables: Under the Acquisition menu, there are two options: Setup or Stand Alone. Selecting Setup opens up the Acquisition Table Setup window which allows you to create, modify and run acquisition tables. An acquisition table is a sequence of commands that are used to acquire, record and visualize data. This sequence of events is run sequentially until the end of the table and then looped around to the beginning to be run again.
The whole table is run within the parameter called Cycle Time which determines how often the table is run. If the table takes longer to execute than the Cycle Time, then the table just runs continuously without pausing at the end and the subsequent cycle time will be however long it takes to run the whole table once.
It is recommended that you watch the video tape on using the software and refer to the manual Chapters 4 and 5 (especially Section 5.3.7) to learn more about how to use this software.
When first opening up the Acquisition Table Setup Window, the last previously opened acquisition table will be opened. This is determined by the information stored in the initialization file KEOCCD.INI as previously discussed. Usually, you will set up your own acquisition tables, and save them with the DOS extension .AQT. For example:
DAYSIDE.AQT
where DAYSIDE might be the name of an experiment studying the dayside aurora.
Equipment: Under the Edit menu, there is an Equipment command which allows you to set the Equipment parameters that will be stored in your image files. It is extremely important to make sure that this information is accurate as it will determine how you interpret data at a later time (similar to the crucial time parameter).
We have set some of the crucial parameters for you and they should not be changed unless they have been corrupted. The filters placed in the filterwheel have been entered into the equipment info, and should not be changed. Make a note of what these values are in your labbook -- you cannot be TOO CAREFUL with this information!!! For Example:
Filter #1: 4278
75
Filter #2: 4685 Filter #3: 5300 Filter #4: 6300 Filter #5: 7774
Do not attempt to change the filters or their positions and keep this information constant in your software.
Since we have supplied you with a fisheye lens for your campaign, the FoV (field-of-view) parameter should be set to 180. This should also not be changed and should be noted in your labbook!
There are two parameters which you will want to change according to your needs and the experiment you are running. There are the Location and Comment strings. We typically set these to depict the camera's location and the name of the experiment:
Location: Longyearbyen (sorry if I spelled it wrong!) Comment: DAYSIDE94 (fictitious experiment )
Once you have set these parameters, they do not need to be changed again and are stored in the Acquisition File. This ensures that they will be restored when you run that acquisition file again.
Image Path: This command (under the Run command: Set Path) determines where images will be stored when they are recorded during the acquisition process. The MIP computer has several options for storing images. There are two hard drives and one optical drive in the system:
C D E
Used for system software - almost full Used for storing data during acquisition Optical Disk for long term archival
The C: drive is filled with system software and should not be used for recording images. Images are fairly large (2x2 are 131K, 1x1 are 525K) and will fill up this disk very quickly.
The D: drive is the hard-disk used for image archival and is about 700MB of image storage. Writing to the D: drive is the quickest option and should be used when time is of essence - i.e. during a rocket launch, or fast-moving aurora (pulsating, etc.). You must remember that this disk will have to be backed up after recording images and this takes quite a bit of time.
The E: drive is the optical disk. Each optical disk must be formatted before use which takes up to an hour, so make sure you prepare your media before
76
your experiment starts! The drive is a RICOH 5.25" MO drive and takes 5.25" 1024B sector Magneto-Optical media. The disks store 320MB per side and must be initialized after formatting using the MOD utility.
The optical disk is significantly slower than the D: drive for storage but is removable, so you don't need to back the data up after it has been recorded. This media is ideal for long term data acquisition at slow rates where there is plenty of time to archive data.
Initializing and Formatting MO Disks: Go to DOS in the computer system either by exiting Windows 3.1 or put selecting the MS-DOS icon in the MAIN Program Group, and change the directory to C:\ODESSA
C:> cd c:\odessa C:>m C:> mod /4
Typing in the above sequence (only the first two commands in bold), will start the formatting and initialization software. Follow the self-explanatory options in the startup menu to both Format and Initialize the disk. When making partitions on the optical disks, we usually just create one partition the full size of the side of a disk. It is helpful to keep this convention.
Display Quadrant/Display Image: Typically data has been taken in sets of four which historically comes from having four position filter wheels, and is also very much constrained by the fact that four images fit into a rectangular image buffer perfectly. Images are acquired into predefined image buffers called GAOI's. Please read the manual for more information on this as it is very central to the MIPCTL application (Sections 4.3.2 and 4.3.3).
When acquiring data, you can select whether to just view one of these images at a time, or look at all four images in that memories 'quadrant'. For this, you can toggle the Display Quadrant/Display Image state from the Run menu. We have found it helpful to always look at a quadrant and the system should be set up for this when you start it up.
Image Binning: The full resolution of the CCD is 512x512 pixels. Using this resolution best matches the resolution of the image intensifier (>512 pixels), and gives the sharpest images. However, it also takes up a great deal of archival space (four times what a 2x2 binned image takes). If resolution is not that critical and storage media is limited, we suggest taking data in the low-resolution mode (2x2 binning). When running an acquisition table, this binning is determined by the image buffer receiving the data. If a Hi-Res GAOI is selected, then the binning will be 1x1, and if a Lo-Res GAOI
77
is selected, the binning will be 2x2. The image display will be adjusted automatically. You can mix image resolutions during a single acquisition table, but it is not recommended.
Defined Hi-Res and Lo-Res GAOI's are:
Hi-Res: HI-RES
Lo-Res: Data Back Scratch Display
It is recommended that you use the Data Quadrant for the Lo-Res images.
The CCD digitizes the data with a 12 bit converter so that only the lower 12 bits of data are written into when acquiring data. It is recommended that you select the whole 16 bits however, to ensure that no foreign data could be masked into the upper-bits of the image buffer.
Entry Settings
Image Intensifies We would recommend using intensifier gains of 0 or 1, as these produce the best signal-to-noise images and allows you the largest dynamic range on the CCD. If you are using very short exposures for speed purposes and are looking at very faint signals, you way want to go up to gain 2.
Exposure Time: Typical exposures for auroral activity range from about 1 sec to 10 sees. You can select this parameter up to 0.1 second resolution.
Image Min/Max: After the image has been recorded (if selected), you can remap the image to bring out features that were hidden by stretching the image out. The full dynamic range of the CCD is 12 bits, which gives values of black (0) to white (4095). These min/maxes should be used if speed is required during the acquisition process as no additional processing is required on them images.
However if time is not a limitation, and you would like to look a weak features say in the 1000 range, you could adjust your min/max to say black (200) to white (1400). This is very helpful during sub-visual aurora, and encourages you to use the dynamic range of the CCD chip properly (rather than increasing the intensifier gain which will increase the noise to see dim features).
78
Rec(ording): This flag tells whether the current entry will be recorded to the storage media.
DFS: This stands for Dark-Frame-Subtract and was a feature for a Fabery- Perot imager using this software package. This feature was not implemented on these images as since the CCD has such low dark noise build-up for the short exposures used, it is better to store the raw data and process later.
Cycle Time: The cycle time sets the acquisition table repetition rate. We have set these to a minimal value to ensure that data is collected as quickly as possible. Currently the cycle time due to collecting data is about 20-25 seconds/cycle. Setting the cycle time to something like 30 seconds, would assure that the images are acquired at the same time each cycle with reference to the 30 second cycle. Karl wanted to maximize the time resolution of the data, hence the minimal cycle time is used.
Useful Calibrations
Focusing the instrument: It is helpful to use the acquisition table to focus the instrument. Create a new table with just one entry using a Hi-Res GAOI and a mid-range filter such as 5577 or 6300 and a low intensifier gain (0) and longer exposure time. Adjust these parameters until you are getting a nicely exposure image of the sky. Once you have these parameters set, Run Entry in continuous mode. Making sure that the front optics (the fisheye lens) is set at infinity, slowly adjust the second camera lens (in front of the image intensifier) until the stars come crisply into focus (within the resolution of the CCD).
Once you have found the optimum focus, make sure that this lens is all the way open (f2) and tape it so that these settings will not be able to be changed for the term of the experiment. Save this image to a 'calibration' directory for future reference.
Star Images: To calibrate the instruments geographically after the campaign, it would be useful to get star images. You will be able to get decent images by taking long integrated exposures at 6300Ä. Record in your labbook, exactly what time you took the image and then you will be able to correlate these star positions at a later time to get the geographic calibration of the image.
Photometric Calibration: If you have any calibrated light sources at your sight (such as a C14 source), it is a good idea to take some images with this source in the field-of-view and archive them into the 'calibration' directory. Record in your labbook which source you used, the exposure time
79
and intensifier gain, etc. This will be helpful to you for future radiometric interpretation of the data. It is useful to calibrate to a source that you have, as everyone's calibrations of sources is difference and experience bears out the usefulness of having your own calibration.
CCD gain: There are three CCD gains for the camera, but we recommend always leaving the CCD gain on MID (see SETUP... under the CCD menu - you can also set the binning factor here). The cameras and software should presently be setup to operate in this gain mode so you should not have to change anything. This is just something to be aware of.
Stand-Alone Acquisition
If an operator is not going to be able to monitor the instrument, there is now a Stand-alone Acquisition feature implemented under the Acquisition menu. This feature allows you to run pre-defined acquisition tables (*.AQT) defined above at set times and for set duration's.
The setup is very similar in behavior to the Acquisition table setup. A list of stand-alone events is store in a table with the extension *.STA. When you open up this window, the previously used Stand-Alone Table will be read into the computer. This is set in the KEOCCD.INI file and will look something like:
SAMPLE.STA
Depending on what is stored in the table, a sequence of Acquisition tables will appear in the list box. When an entry is selected, it's parameters will be filled below in the edit boxes. The parameters are:
Start Time Stop Time Acquisition Table Name Image Path
Start/Stop Time: These parameters determine when the table will be run and when it will be stopped. When the stop time is reached, the current operation will be terminate upon completion.
Time parameters are standard UNIX format strings and need explicitly to be:
DD Mmm YY HH:MM:SS
For example: 04 Dec 93 22:14:53
80
Months are three letter abbreviation with the first letter always capitalized. The time must always be UT (GMT) time in 24 hour mode.
If an illegal time has been entered into the edit box, the computer will beep and the previously legal entry will be restored. To finalize an edit change, you must change focus from the edit control. This means that you must either click on another edit control or click on the listbox to enable the changes. This enables the parameter validation software which ensures that no illegal entry values to crash an acquisition sequence.
Acquisition Table Name: This is the name of a currently defined working acquisition table. If the software cannot find this acquisition table in the current Acquisition Path, it will been and the previous legal entry will be restored.
Image Path: This is the path that the acquired images will be recorded to. If the path does not currently exist, the user will be asked if they want to create this path. If they do, the software will try and create the path. If there is an error, as always, the previous legal entry will be restored and the computer will beep at you.
Running the Table: Running the table is very self-explanatory. It is suggested that you experiment with many short acquisition tables, and stand-alone tables to get a feel for how it all works.
Stopping Acquisition Tables or Stand-Alone Tables: There is an Exit and Pause/Resume button on both Run Dialogs during acquisition. These buttons should be clicked on once by the mouse to stop the acquisition. However, the current operation will be finished first and this could take a while (for example a 20 second exposure!) so be aware of what is currently happening with the sequence and be patient.
During a command to the camera, the cursor changes to look like a little camera. At this point, the camera communication software is taking full control of the system and mouseclick are directed only to it. If you are running an acquisition table and the camera cursor is displayed. Hitting the left (or right) mouse button once will send a Pause/Resume command to the acquisition Run dialog. Again, only hit this ONCE, as it takes a while for this to take effect. Be patient, and the software will yield to your mouse click!
Experiment and get comfortable!!I
There is a lot to learn about running this instrument. We suggest that you start out by just trying to run rudimentary acquisition tables, and then a stand-alone acquisition sequence. Once you have gotten comfortable with this, you should
81
experiment with some of the other features in the software such as analysis, histograms, ROI statistics, and plotting.
Good luck!!!
Keo Consultants
82
APPENDIX E
MIPCTL Software Version 5.3.6
Release Notes
Adding Modeless dialog boxes to MIPCTL:
To make certain functions easier, we have started to change some of the dialog boxes written for the MIPCTL application from modal to modeless. This allows the dialog box to stay defined (and visible) throughout the application which gives the user much more flexibility. The two most obvious features that were changed in this version upgrade were Image Restore and the Cursor functions.
Changing over to modeless dialog boxes required defining a global variable that contains the dialog box handle. This was implement at the beginning of MIPINIT.C and were named:
HWND hRestoreDIg HWND hCursorDIg HWND hlmlnfoDIg
In the function Miplnit() (MIPINIT.C), the modeless dialog boxes are created using the CreateDialogO functions. These dialog boxes are defined as initially "hidden" in the resource files (MIPCTL.RC).
The modeless messages are handled by the function aqlsModelessMessageQ defined in AQUIS.C. This function is called in the main message loop of WinMain(). When the menu item for the function is selected, MipWndPr() grays the menu item, and shows the dialog box. When the dialog box is 'closed' by the user, it is hidden but kept open.
Image Restore: This dialog box has been changed into a modeless dialog box, so that it will stay open as long as the user likes. Also, all directory information and listbox states are preserved when the dialog box is "closed" (as it is actually just hidden). This makes restoring images into the frame buffer a much easier experience.
The GAOI control is also updated via a new command in the dialog function IDC NEW_GAOI. This message is sent to the Image Restore dialog function
83

when another module has changed the currently displayed GAOL The most common function to send this message (the only presently implemented function) is ShowQuadorlmage().
The Image Restore dialog function MipOpenDlgProcQ now also has a more intelligent handling of image display. If a quandrant is currently being displayed (flagged by the global bQuad_Display), and' the new restored image is in this quadrant, then there is no change in the display. If the new image is in another quadrant, then this new quadrant will be displayed. If an image is currently being displayed, and the new image is being restored to a different image, this new image will automatically be displayed.
It is useful to have this be modeless, and use the Display -> Quadrant, and Display --> Image menu features without having to close the Image Restore dialog box. DoMipOpenDlgQ is now an obsolete function, and can be deleted.
Image Information: Image Information used to be able to be called from the ANALYZE menu, but has been deleted from the menu, and added as a control button from the Image Restore Dialog Box. This stream-lines the process of looking at images and determining if we want to restore them into the image buffer or not. The Image Information box is shown by clicking on the Information button in the Image Restore dialog. To close this dialog, the user just double- clicks on the close box. While this window is shown, the information for the currently selected file in the list box is updated into the information headings. Thus, the user can single click on an image entry in the Restore listbox, look at it's attributes, and if they subsequently wish to restore this image into the image buffer, they double click on the file name in the list box (or press the RESTORE button).
Cursor: The CursorQ function defined in MIPDISPL.C is now a modeless dialog box as explained above. This function now only processes messages from other windows that send CursorQ the WM_MOUSEMOVE command with the window's handle in the wParam variable and the mouse positions relative to the window's client area passed in the IParam variable.
The only windows that presently send this message are the Image Overlay Windows defined in looWndProc(). When there is a mouse movement over one of these windows, the window procedure, passes on it's mouse movement messages to the cursor dialog window to process. The cursor for the looWnd's has been defined as the cross-hair defined in MIPCTL.RC, so whenever the cursor is over an looWnd it appears as the cross-hair.
Changing the VisionPlus Configuration File:
84
Starting with this software version of MIPCTL, you can now set the configuration file for the AFG board initialization from within the KEOCCD.INI file. The initialization file name is stored under:
[System] Config=keo
The file extension is automatically set to .cnf, and the configuration file must be a valid ITEX-AFG configuration file stored in the directory:
C:\VISNPLUS\CONFIG
The feature is very useful for switching between different system configurations. The default configuration is KEO.CNF which sets the system up for VGA-mixing and the digital input camera. Another standard configuration used is a dual- monitor system with the video being sent to an RS-170 monitor. A configuration file for this has been created by Peter Ning and is currently called pn.cnf.
Plots and Images:
In the release, images now hold a pointer to a line-plot and a histogram created in this image. In the structure IMAGESTRUCT, there are two new members: nPlot and nHist. The first line-plot and first Histogram created from data in an image are stored in the image structure.
This is used to provide automatic updating of plotting and histogram windows when an image in the frame buffer is updated. This is particularly useful when scanning through a sequence of images (such as during a chemical release or rocket launch). A plot and histogram are created, and then the sequence of images is stepped through as the operator watches the features in the plotting windows change accordingly.
From a programmer's point of view, the plot and Histogram pointers are initialized to a 'null' value (PFREE or -1) during software initialization in lnitlooWnds(). When a plot is defined, the image structure pointer is set to the plot window number. When a new image is read into an image buffer containing a plot (or Histogram) window, the plot window is updated using UpdatePlotWindow( hlmage ). The plot structure was also changed to contain a handle to the plot window plotlnfo[nPlot].hPlotWnd. This is filled when we initialize the plot window (GSWndProc()). Presently, when a new image is updated, and the new plot data has been retrieved, the software redraws the whole plot including all the labels. Unfortunately, the manual scaling feature is not preserved in this version and should be included in a later version.
85
It should also be noted that v5.3.6 only handles one line-plot and one Histogram window updated per image. Other line-plots and Histograms created from data in this image are left static. A switch should be added to select whether auto- updating is enabled or disabled. Currently, it is always enabled.
Version 5.3.6 Bug Fixes:
Version Number: Older versions of this software had a major error in retrieving the current software version number of the running software. This showed up in two cases. The first (and non-fatal) case was in the About menu. The second (and serious) case was on stamping the software version into the image header for later retrieval. This has great importance, because it determines the format of the information header. After the CRRES campaign in Puerto-Rico (July '92), it became apparent that software version information would be important for later back-tracking. The first campaign using this new software version format was the RODEO campaign (Winter '92).
Unfortunately, there were two problems associated with this feature. The first was that it was assumed that the application MIPCTL was always located in the directory C:\MIP\MIPCTL. When new software versions were added to the MIP, they were put in new directories to keep them separate. Unfortunately, the versions stamped into images while using the new software was really the version number from the application stored in the directory C:\MIP\MIPCTL This problem was fixed in the Fall of '93.
After the Andoya campaign (PULSAURII Jan. '94), it was noticed that there was still a version number problem. Upon adding more versions of the application, we took to naming the application MIP535.EXE instead of MIPCTL.EXE (meaning "MICPTL Version 5.3.5"). Unfortunately, the application looked in the correct directory for the version number, but was still looking for an application called MIPCTL.EXE, once again inflicting an incorrect version number into the image headers in cases where the software was not called MIPCTL.EXE. This only happened in analysis in the lab fortunately.
Version 5.3.6 corrects this problem by using the windows command GetModuleName(), to correctly identify the currently running software, and then retrieving the version number of this software. Future development should include writing a utility that takes into account all the (documented) information header problems for all the campaigns up to now (CRESS, RODEO, CUSP, and PULSAURII), writing a translator for the data, and converting the files to the newest format. More information on the image header formats can be found in the HAARP Final Report, Chapter 6.
86
Image Information for plot windows, and graphics: It was noticed that sometimes erroneous information fields would appear either in the images, or (always) in the plot windows and Histogram windows. This was due to incorrect usage of the function ImlnfoCopyQ which is defined as:
lmlnfoCopy( hlnfoDst, hlnfoSrc )
This was designed to be used similarly to the standard functions such as strcpyQ and strcatQ. These errors were corrected for Version 5.3.6.
Image Recording during Acquisition: When recording images during an acquisition sequence, the return value of the afg_im_save() function is checked to see if a write error occurred. Unfortunately, the function does not rigorously check the resultant file. This was noticed on the Anodya campaign when the hard-disk filled to maximum capacity, no error was return from the function and a long sequence of zero-length files were recorded to hard-disk. Obviously, this could have catastrophic results!
Version 5.3.6 does comprehensive checking on the resultant image file. First the afg_im_save() return value is checked for an error. Next, the file is searched for using the _dos_findfirst() function. The code returns an appropriate error dialog box if either the file does not exist, or the file size is wrong. The image file size is checked against what the know file size is for the current Binning factor.
Image Saving: The same problem existed for storing an image manually from the Image Save menu as did from recording an image from within an acquisition cycle. Therefore, the same error correction as described above was added to this function as well.
87

88
APPENDIX F
HDRF1X Software Documentation Version 1.1
KEO Consultants August 9,1994
Overview:
HDRFIX was written to address the problem of different image information headers embedded into the MIP and HAARP imager Image Files. As the control software MIPCTL developed since 1991, the format of the image header has improved steadily containing more information and a more useful format.
Since data analysis tools being developed are dependent on this header format, HDRFIX was written to update Image Files to the most recent header version. This version is embedded into the header for backwards compatibility.
HDRFIX requires the hardware installation of the Imaging Technology AFG board and the software installation oflTEX-AFG v2.2-2. HDRFIX can be used in VGA mixing mode or RS-170 monitor depending on the default configuration file set in AUTOEXEC.BAT.
As of this documentation, the most recent header version is written by software version v5.4. Since the original implementation of MIPCTL in 1991, there have been five campaigns that the imagers have taken data for. These campaigns are:
CUSP91 CRRES92 CUSP93 RODE093 PULSAURII
Image information formats for these campaigns are updated to the present header format.
Running HDRFIX:
89
HDRFIX.EXE is an MS-DOS application and should be run in a DOS window. The command line format is:
HDRFIX <lnput List> <SourcePath> <Dest.Path> <Campaign> -r -q
where:
<lnput List> is a list of files to be modified. The complete file identifier must be included in this parameter including path, unless the list file resides in the current directory.
<SourcePath>The complete path that holds the input files to be modified.
<Dest.Path> The complete path to write the output files to. If this is identical to the <SourcePath> the input files will be OVERWRITTEN!!! HDRFIX will post a warning if this is the case, however, it is an allowed case.
<Campaign> This identifies the campaign that the data is from. This parameter is case-dependent and can be one of the following pre-defined campaigns:
CUSP91 Spitsbergen--January, 1992 CRRES92 Ramey, PR - July, 1992 CUSP93 Ny Alysund - January, 1993 RODE093 Sondrestrom - November, 1993 PULSAURII Andoya RR - February, 1994
More campaigns may need to added in the future if the image information header changes again.
-r Enables the reporting mode (optional switch). With this switch enabled, HDRFIX will post warnings and progress messages to the terminal screen. This feature is useful for debugging.
-q Enables the query mode (optional switch). With this switch enabled, HDRFIX will pause and post continue options to the user via the terminal screen. This gives the user the option of terminating the software at certain key points. This feature is critical for debugging the software.
90
Errors and the LOG File:
HDRFIX rigorously checks the input and output image files' integrity and the integrity of the final image comment. For each Image File being operated on, errors will be reported to the output terminal. Since there will often be hours of files being updated, a LOG file is created to keep this list for reference. The log file is created in the same directory as the Input List file with the same name and theextension.LOG. For example:
RODE093.LST will create a log file in the same directory: RODE093.LOG
HDRFIX assumes that all image files in the Input list are AFG written 1TEX image files, and will first check for the file's existence, and also that the file identifier 'IM' is contained in the first to bytes of the image.
HDRFIX allows for a MAXIMUM of 20 accumulated errors before it terminates the program with the appropriate messages. This avoids unwanted accumulations of errors and alerts the operator to a possible failure mode. A typical case would be when the destination drive becomes full.
Input File List:
The Input file list is created before HDRFIX is run. It is good to created a separate directory for the input files and an empty directory to receive the output files. The input list file should be saved to a directory on another hard disk to protect against the case when the destination hard disk fills up prematurely.
Let's take the example:
HDRFIX rodeo93.lstd:\source d:\dest RODE093 -r
This command line says that the source files are in the directory d:\source and that the output files will be written to the empty directory d:\dest. To create the Input List "rodeo93.lst", you can use the DOS command (assume we are in the directory containing HDRFIX.EXE):
C:\develop\hdrfix>dir d:\source /b > rodeo93.lst
This will create the file "rodeo93.lst". An example listing of this would be:
C:\deveIop\hdrfix>type rodeo93.lst
91
93111620.001 93111621.001 93111622.001 93111623.001 93111620.002 93111621.002 93111622.002 93111623.002
Example LOG File:
The following listing gives an example of running HDRFIX with the above command line. In this case there was not quite enough room on the D: drive to update all the image files so the last to image files did not have the correct file size. You will notice the error messages on the last two file listings here:
HDRFIX Version 1.0 - KEO Consultants (May '94)
Command Line: HDRFIX rodeo93.lst d:\source d:\dest RODE093
Program started: 26 May 94 17:03:23
File: d:\dest\93111620.001 Successfully updated. File: d:\dest\93111621.001 Successfully updated. File: d:\dest\93111622.001 Successfully updated. File: d:\dest\93111623.001 Successfully updated. File: d:\dest\93111620.002 Successfully updated. File: d:\dest\93111621.002 Successfully updated. File: d:\dest\93111622.002
Updated file is an incorrect size: 92423 Bytes. Possible corruption of data!
File: d:\dest\93111623.002 Updated file is an incorrect size: 0 Bytes. Possible corruption of data!
Program successfully Completed 6 files corrected, 2 Errors encountered
Program finished: 26 May 94 17:03:34
Extracting UNIX Time:
92
Because the earlier campaigns got their UNIX binary time stamp from the computers, there was an error due to the default TimeZone DOS environment variable being set to Pacific Standard Time. Thus, all the UNIX variables will have an eight hour shift from true Universal Time as stamp (correctly) into the header using the ASCII time format. To fix this ambiguities, the UNIX binary time stamp is recreated from the ASCII time format to make absolutely sure that this time stamp IS in Universal Time. The resultant binary time is converted back to an ASCII string and checked with the original ASCII time string for errors.
In addition, it should be noted that in any PC running the MIPCTL software and collecting data for the imagers, the Time Zone environment variable should be set to Universal Time. This is done by adding the following code to your AUTOEXEC.BAT:
set TZ=GMT0
Running HDRFIX under Windows 3.1:
It is handy to run HDRFIX in an MS-DOS window in the Windows 3.1 operating system. If the background of the Windows desktop is set to BLUE ( Use the control panel to set the desktop to the color blue: RGB[0,0,255]), the image being updated will be displayed over the desktop. This assumes that the computer system is set up for VGA mixing using the AFG hardware.
(i) Open up an MS-DOS window from the MAIN program group, (ii) Set the path to C:\DEVELOP\HDRFIX
Minimize all unnecessary windows and size the MS-DOS window to a useful size. As HDRFIX runs, you will see the images updated in the background of the monitor (wherever the BLUE desktop is visible).
HDRFIX Help and Command line errors:
HDRFIX requires the minimum of 4 input parameters in the correct order. The switches (-q) and (-r) are optional. If HDRFIX does not encounter the correct number of command line arguments, it aborts giving the HELP listing. If no arguments are given, this also gives the HELP listing. The help listing explains the command line format of the program and gives details on the Campaign identifiers. This is useful for quick referencing.
Reference Section
ITEX Image File Format:
93
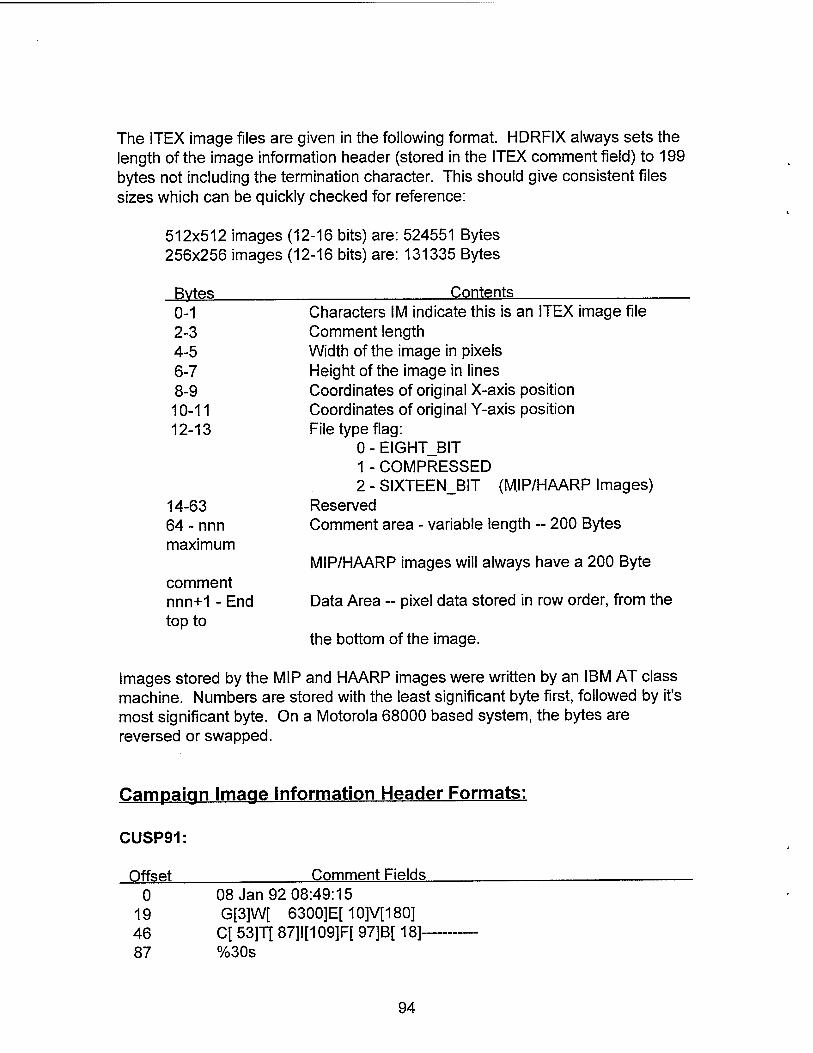
The ITEX image files are given in the following format. HDRFIX always sets the length of the image information header (stored in the ITEX comment field) to 199 bytes not including the termination character. This should give consistent files sizes which can be quickly checked for reference:
512x512 images (12-16 bits) are: 524551 Bytes 256x256 images (12-16 bits) are: 131335 Bytes
Bytes Contents 0-1 2-3 4-5 6-7 8-9 10-11 12-13
14-63 64 - nnn maximum
comment nnn+1 - End top to
Characters IM indicate this is an ITEX image file Comment length Width of the image in pixels Height of the image in lines Coordinates of original X-axis position Coordinates of original Y-axis position File type flag:
0 - EIGHT_BIT 1 - COMPRESSED 2 - SIXTEEN_BIT (M.IP/HAARP Images)
Reserved Comment area - variable length - 200 Bytes
MIP/HAARP images will always have a 200 Byte
Data Area - pixel data stored in row order, from the
the bottom of the image.
Images stored by the MIP and HAARP images were written by an IBM AT class machine. Numbers are stored with the least significant byte first, followed by it's most significant byte. On a Motorola 68000 based system, the bytes are reversed or swapped.
Campaign Image Information Header Formats:
CUSP91:
Offset 0
19 46 87
Comment Fields 08 Jan 92 08:49:15 G[3]W[ 6300]E[10]V[180] C[53]T[87]I[109]F[97]B[18]- %30s
94
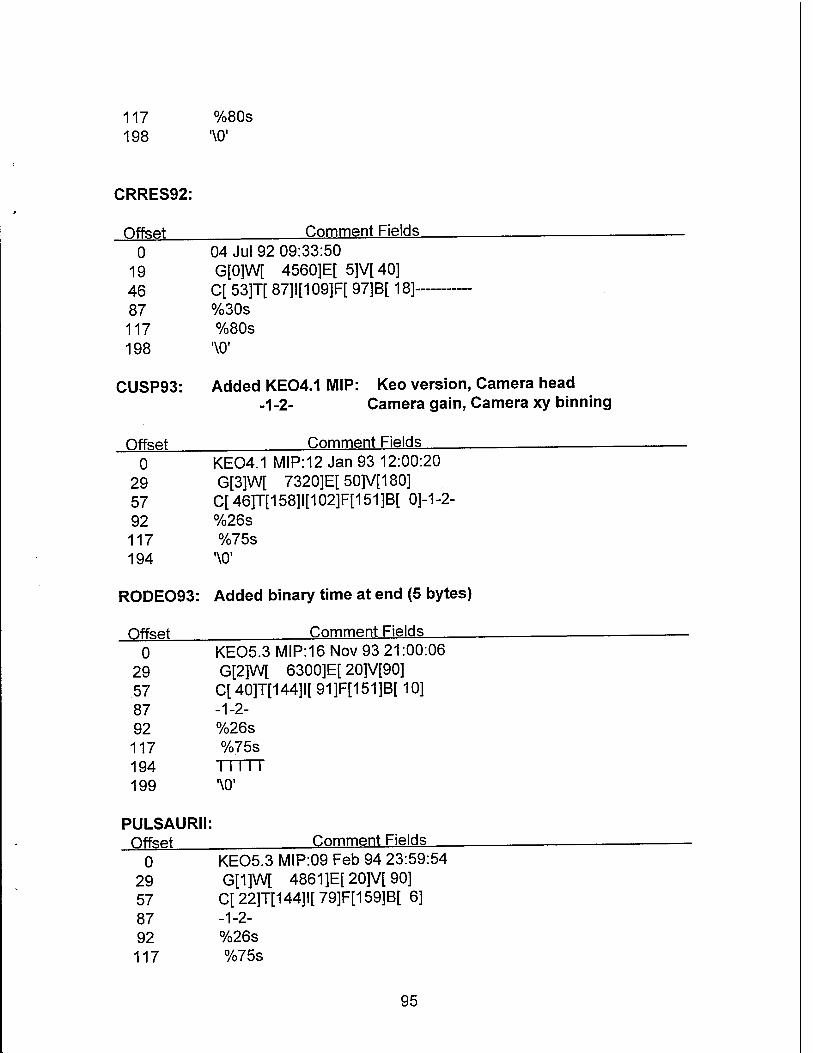
117 198
%80s '\0'
CRRES92:
Offset Comment Fields 0
19 46 87 117 198
CUSP93:
Offset
04 Jul 92 09:33:50 G[0]W[ 4560]E[ 5]V[40] C[ 53]T[ 87]l[109]F[ 97]B[ 18] %30s %80s
■\0'
Added KE04.1 MIP: Keo version, Camera head -1-2- Camera gain, Camera xy binning
Comment Fields 0
29 57 92 117 194
KE04.1 MIP:12 Jan 93 12:00:20 G[3]W[ 7320]E[50]V[180] C[ 46]T[158]1[102]F[151 ]B[ 0]-1 -2- %26s %75s
'\0'
RODE093: Added binary time at end (5 bytes)
Offset Comment Fields 0
29 57 87 92 117 194 199
PULSAURII: Offset
KE05.3 MIP:16 Nov 93 21:00:06 G[2]W[ 6300]E[ 20]V[90] C[40]T[144]I[91]F[151]B[10] -1-2- %26s %75s Mill '\0'
Comment Fields 0
29 57 87 92 117
KE05.3 MIP.09 Feb 94 23:59:54 G[1]W[ 4861]E[20]V[90] C[22]T[144]I[79]F[159]B[ 6] -1-2- %26s %75s
95

194 I I I I I 199 \0'
UPDATED Header v5.4: Added extra char for exposure E[—-] Compressed location/comment strings and added <> delimiter to comment
Offset Comment Fields 0 KE05.4 MIP:16 Nov 93 21:00:06
29 G[2]W[ 6300]E[ 20]V[90] 58 C[40]T[144]I[91]F[151]B[10] 88 -1-2- 93 %25s 118 <%74s> 194 I I I I I 199 '\0'
96
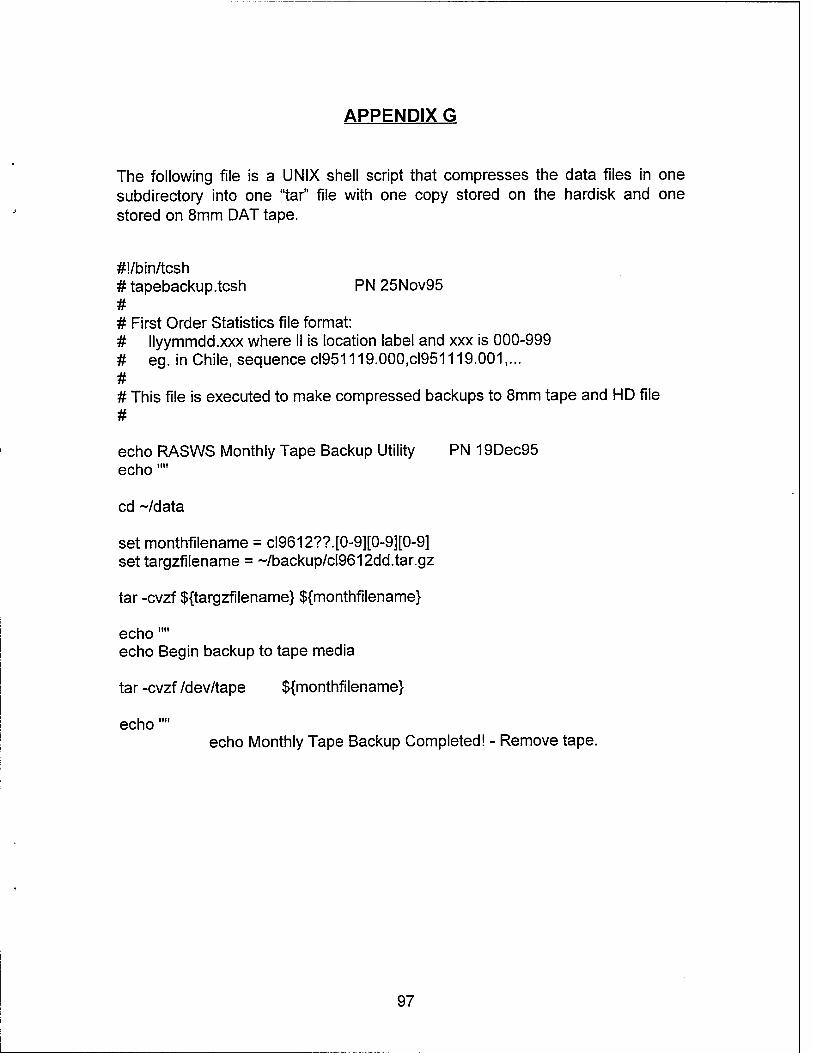
APPENDIX G
The following file is a UNIX shell script that compresses the data files in one subdirectory into one "tar" file with one copy stored on the hardisk and one stored on 8mm DAT tape.
#!/bin/tcsh # tapebackup.tcsh PN 25Nov95 # # First Order Statistics file format: # llyymmdd.xxx where II is location label and xxx is 000-999 # eg. in Chile, sequence cl951119.000.cl951119.001,... # # This file is executed to make compressed backups to 8mm tape and HD file #
echo RASWS Monthly Tape Backup Utility PN 19Dec95 echo""
cd -/data
set monthfilename = cl9612??.[0-9][0-9][0-9] set targzfilename = ~/backup/cl9612dd.tar.gz
tar -cvzf ${targzfilename} ${monthfilename}
echo"" echo Begin backup to tape media
tar -cvzf /dev/tape ${monthfilename}
echo"" echo Monthly Tape Backup Completed! - Remove tape.
97

98
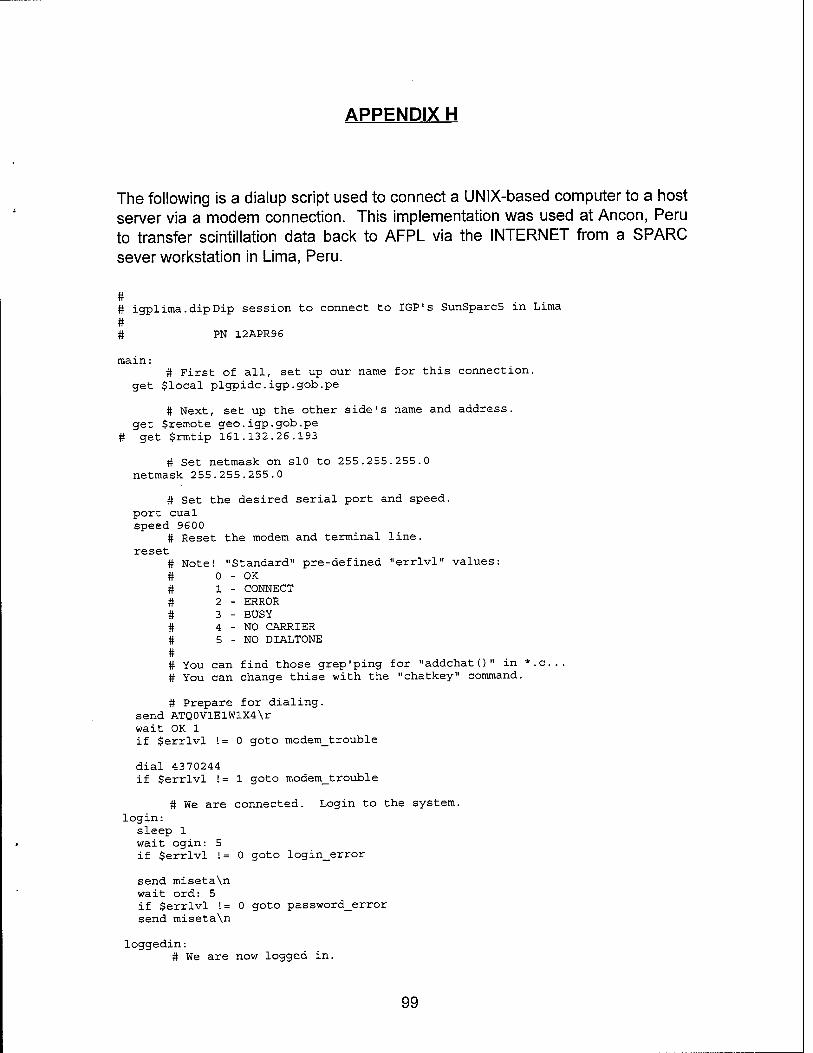
APPENDIX H
The following is a dialup script used to connect a UNIX-based computer to a host server via a modem connection. This implementation was used at Ancon, Peru to transfer scintillation data back to AFPL via the INTERNET from a SPARC sever workstation in Lima, Peru.
# # igplima.dipDip session to connect to IGP' s SunSparc5 in Lima # # PN 12APR96
main: # First of all, set up our name for this connection,
get $local plgpidc.igp.gob.pe
# Next, set up the other side's name and address, get $remote geo.igp.gob.pe
# get $rmtip 161.132.26.193
# Set netmask on slO to 255.255.255.0 netmask 255.255.255.0
# Set the desired serial port and speed, port cual speed 9600
# Reset the modem and terminal line, reset
# Note! "Standard" pre-defined "errlvl" values: # 0 - OK # 1 - CONNECT # 2 - ERROR # 3 - BUSY # 4 - NO CARRIER # 5 - NO DIALTONE # # You can find those grep'ping for "addchatO" in *.c... # You can change thise with the "chatkey" command.
# Prepare for dialing, send ATQ0VlElWlX4\r wait OK 1 if $errlvl != 0 goto modem_trouble
dial 4370244 if $errlvl != 1 goto modem_trouble
# We are connected. Login to the system, login:
sleep 1 wait ogin: 5 if $errlvl != 0 goto login_error
send miseta\n wait ord: 5 if $errlvl != 0 goto password_error send miseta\n
loggedin: # We are now logged in.
99
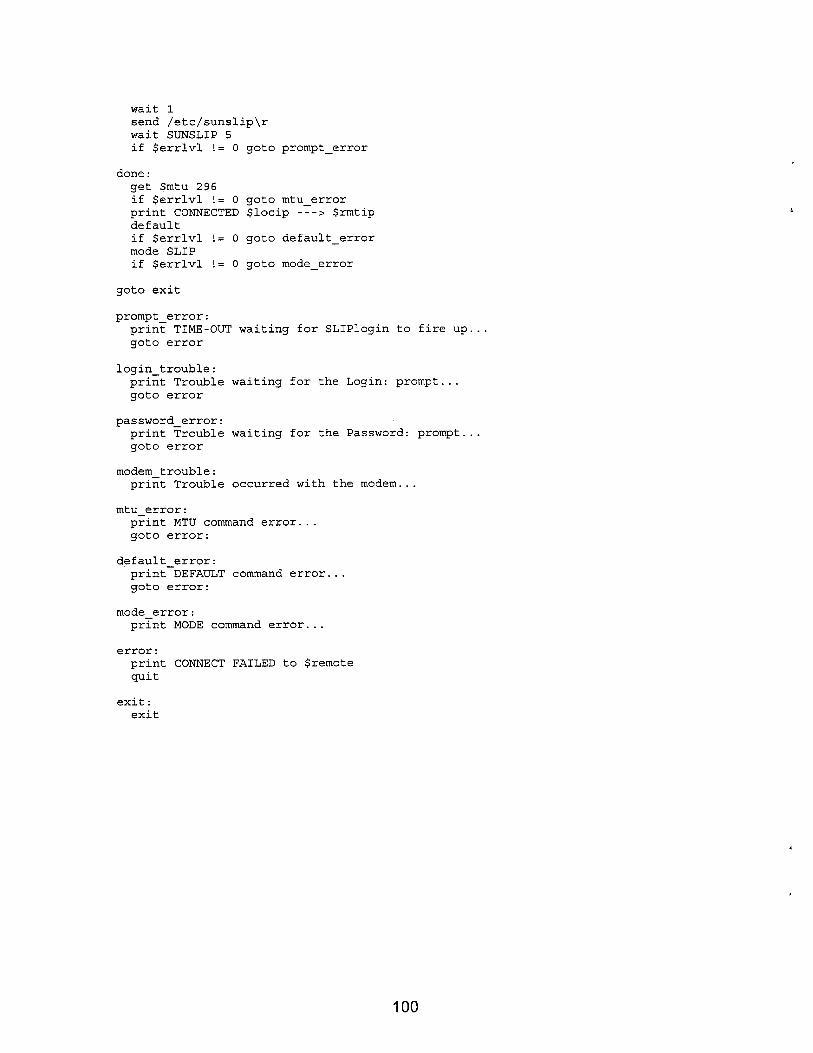
wait 1 send /etc/sunslip\r wait SUNSLIP 5 if $errlvl != 0 goto prompt_error
done: get $ratu 296 if $errlvl != 0 goto mtu_error print CONNECTED $locip > $rmtip default if $errlvl != 0 goto default_error mode SLIP if $errlvl != 0 goto mode_error
goto exit
prompt_error: print TIME-OUT waiting for SLIPlogin to fire up. goto error
login_trouble: print Trouble waiting for the Login: prompt... goto error
password_error: print Trouble waiting for the Password: prompt., goto error
modem_trouble: print Trouble occurred with the modem...
mtu_error: print MTU command error... goto error:
default_error: print DEFAULT command error... goto error:
mode_error: print MODE command error...
error: print CONNECT FAILED to $remote quit
exit: exit
100
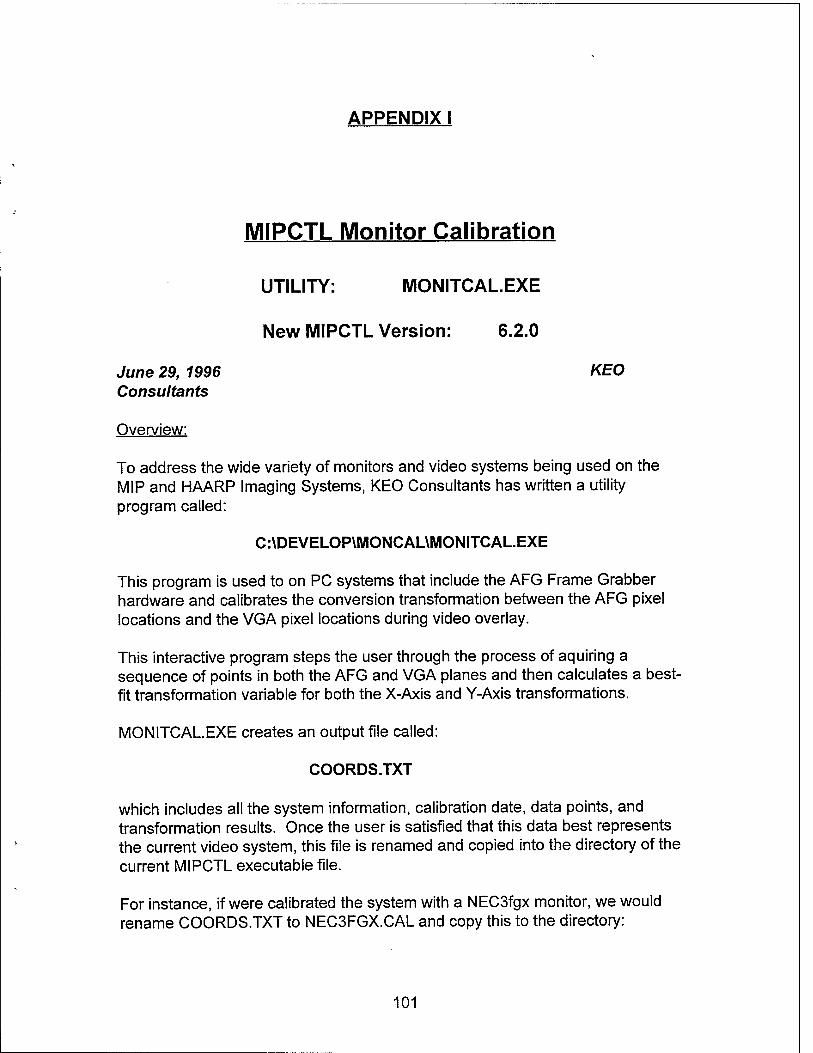
APPENDIX I
MIPCTL Monitor Calibration
UTILITY: MONITCAL.EXE
New MIPCTL Version: 6.2.0
June 29, 1996 KEO Consultants
Overview:
To address the wide variety of monitors and video systems being used on the MIP and HAARP Imaging Systems, KEO Consultants has written a utility program called:
C:\DEVELOP\MONCAL\MONITCAI_.EXE
This program is used to on PC systems that include the AFG Frame Grabber hardware and calibrates the conversion transformation between the AFG pixel locations and the VGA pixel locations during video overlay.
This interactive program steps the user through the process of aquiring a sequence of points in both the AFG and VGA planes and then calculates a best- fit transformation variable for both the X-Axis and Y-Axis transformations.
MONITCAL.EXE creates an output file called:
COORDS.TXT
which includes all the system information, calibration date, data points, and transformation results. Once the user is satisfied that this data best represents the current video system, this file is renamed and copied into the directory of the current MIPCTL executable file.
For instance, if were calibrated the system with a NEC3fgx monitor, we would rename COORDS.TXT to NEC3FGX.CAL and copy this to the directory:
101
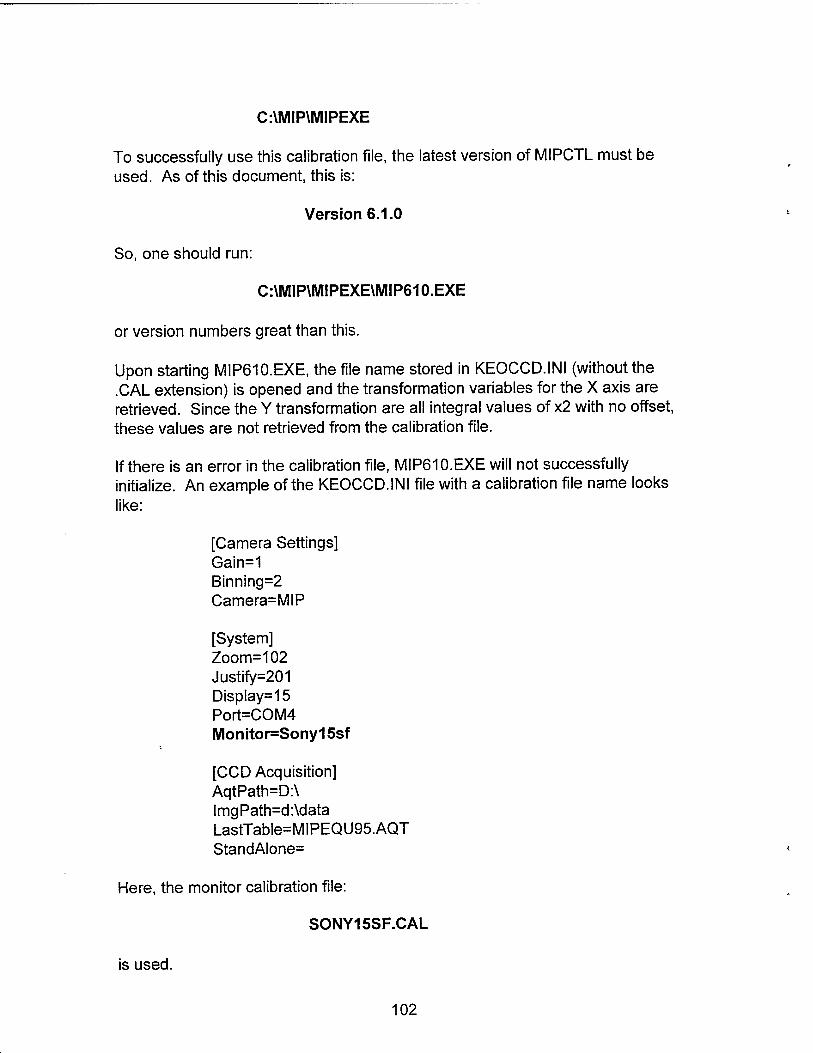
C:\MIP\MIPEXE
To successfully use this calibration file, the latest version of MIPCTL must be used. As of this document, this is:
Version 6.1.0
So, one should run:
C:\MIP\MIPEXE\MIP610.EXE
or version numbers great than this.
Upon starting MIP610.EXE, the file name stored in KEOCCD.INI (without the .CAL extension) is opened and the transformation variables for the X axis are retrieved. Since the Y transformation are all integral values of x2 with no offset, these values are not retrieved from the calibration file.
If there is an error in the calibration file, MIP610.EXE will not successfully initialize. An example of the KEOCCD.INI file with a calibration file name looks like:
[Camera Settings] Gain=1 Binning=2 Camera=MIP
[System] Zoom=102 Justify=201 Display=15 Port=COM4 Monitor=Sony15sf
[CCD Acquisition] AqtPath=D:\ lmgPath=d:\data LastTabIe=MIPEQU95.AQT StandAlone=
Here, the monitor calibration file:
SONY15SF.CAL
is used.
102
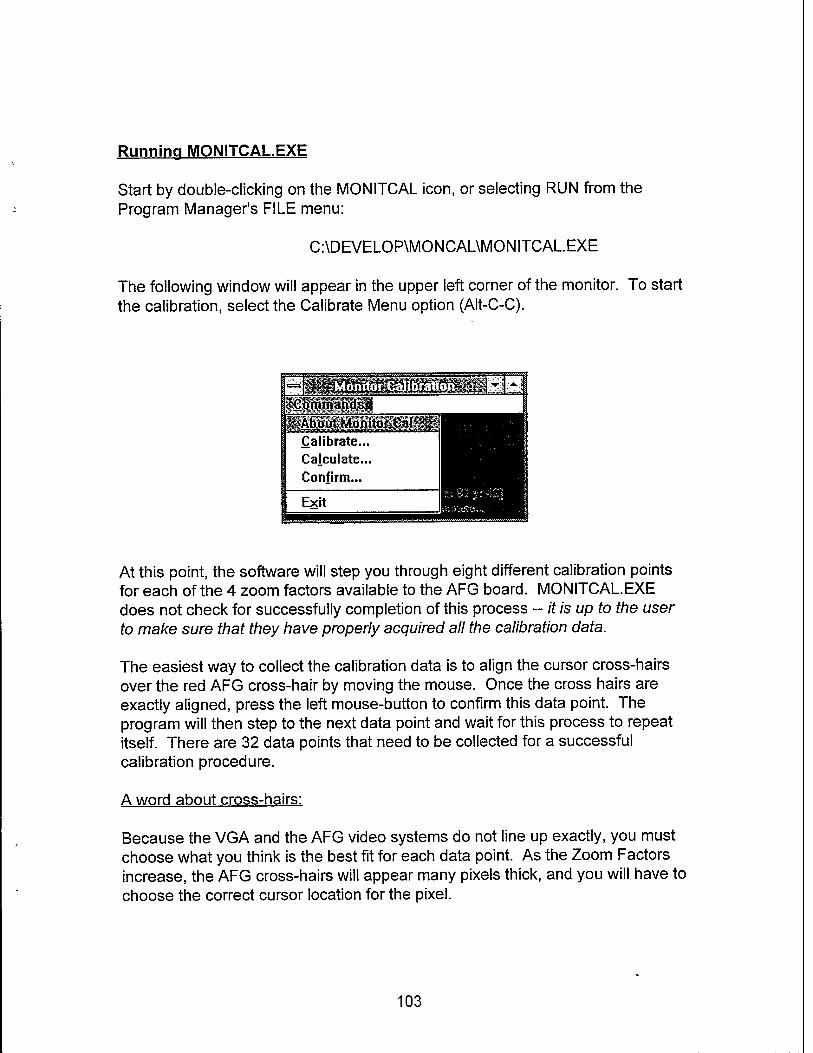
Running MONITCAL.EXE
Start by double-clicking on the MONITCAL icon, or selecting RUN from the Program Manager's FILE menu:
C:\DEVELOP\MONCAL\MONITCAL.EXE
The following window will appear in the upper left corner of the monitor. To start the calibration, select the Calibrate Menu option (Alt-C-C).
_H, Monitor Calibration ■■".A:j|
Momniandsaj ( ^Ai^6üt.M.^rijtpjr_Cal_S^
Calibrate... Calculate... Confirm...
1
I X
Exit j*.
At this point, the software will step you through eight different calibration points for each of the 4 zoom factors available to the AFG board. MONITCAL.EXE does not check for successfully completion of this process - it is up to the user to make sure that they have properly acquired all the calibration data.
The easiest way to collect the calibration data is to align the cursor cross-hairs over the red AFG cross-hair by moving the mouse. Once the cross hairs are exactly aligned, press the left mouse-button to confirm this data point. The program will then step to the next data point and wait for this process to repeat itself. There are 32 data points that need to be collected for a successful calibration procedure.
A word about cross-hairs:
Because the VGA and the AFG video systems do not line up exactly, you must choose what you think is the best fit for each data point. As the Zoom Factors increase, the AFG cross-hairs will appear many pixels thick, and you will have to choose the correct cursor location for the pixel.
103
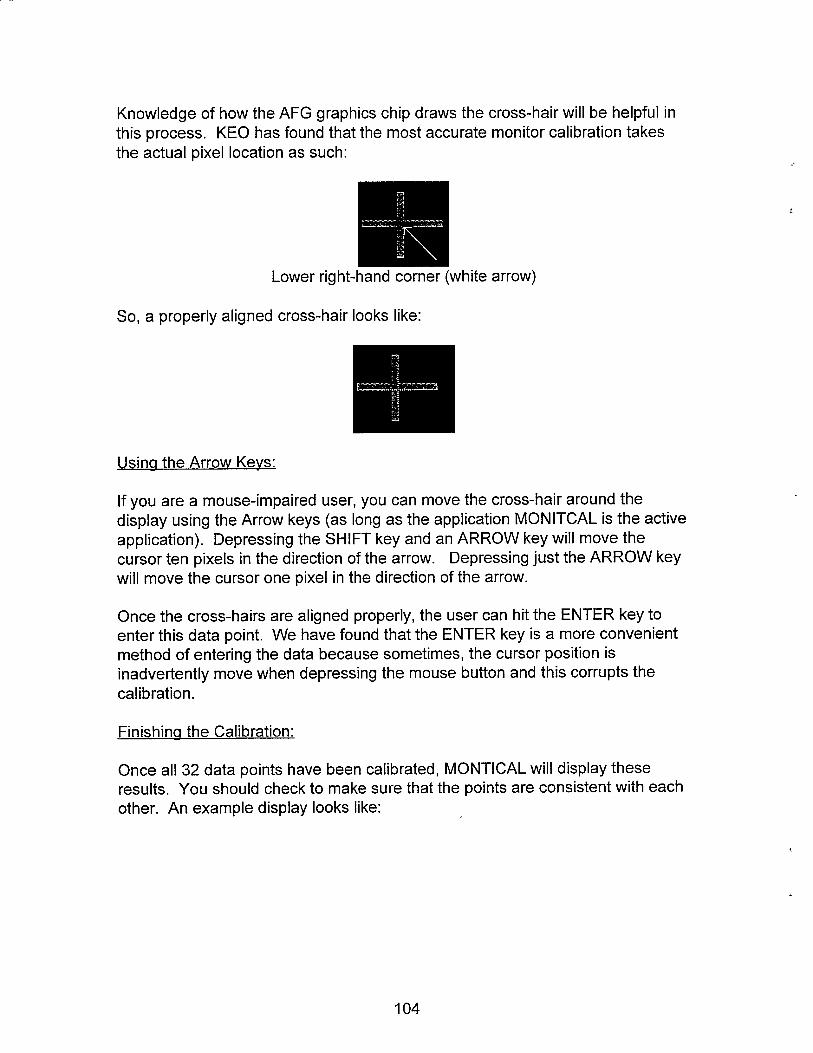
Knowledge of how the AFG graphics chip draws the cross-hair will be helpful in this process. KEO has found that the most accurate monitor calibration takes the actual pixel location as such:
Lower right-hand corner (white arrow)
So, a properly aligned cross-hair looks like:
Using the Arrow Keys:
If you are a mouse-impaired user, you can move the cross-hair around the display using the Arrow keys (as long as the application MONITCAL is the active application). Depressing the SHIFT key and an ARROW key will move the cursor ten pixels in the direction of the arrow. Depressing just the ARROW key will move the cursor one pixel in the direction of the arrow.
Once the cross-hairs are aligned properly, the user can hit the ENTER key to enter this data point. We have found that the ENTER key is a more convenient method of entering the data because sometimes, the cursor position is inadvertently move when depressing the mouse button and this corrupts the calibration.
Finishing the Calibration:
Once all 32 data points have been calibrated, MONTICAL will display these results. You should check to make sure that the points are consistent with each other. An example display looks like:
104
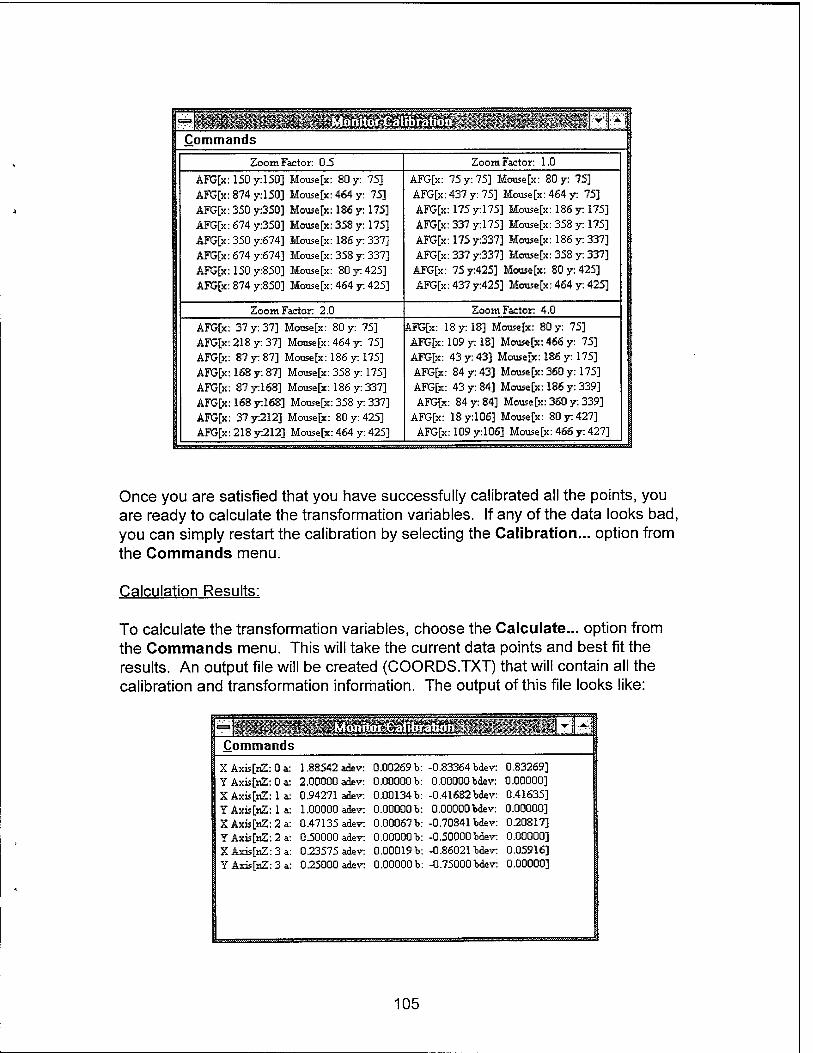
«=,. I MoiiJtorCäirbratSSiflRj^MS^BS ;I.J ■■'*>.■■■
Commands Zoom Factor: 0.5 Zoom Factor: 1.0
'
AFG[x: 150 y:150] Mouse[x: 80 y: 75]
AFG[x: 874 y:150] Mouse [x: 464 y: 75]
AFG[x: 350 y:350] Mouse[x: 186 y: 175]
AFG[x: 674 y:350] Mouse[x: 358 y: 175]
AFG[x: 350 y:674] Mouse [x: 186 y: 337]
AFG[x: 674 y:674] Mouse[x: 358 y: 337]
AFG[x: 150 y:850] Mouse [x: 80 y: 425]
AFG[x: 874 y:850] Mouse[x: 464 y: 425]
AFG[x: 75y:75] Mouse [x: 80 y: 75]
AFG[x: 437 y: 75] Mouse [x: 464 y: 75]
AFG[x: 175 y:175] Mouse [x: 186 y: 175]
AFG[x: 337 y:175] Mouse[x: 358 y: 175]
AFG[x: 175 y:337] Mouse [x: 186 y: 337]
AFG[x: 337 y:337] Mouse[x: 358 y: 337]
AFG[x: 75 y:425] Mouse[x: 80 y: 425]
AFG[x: 437 y:425] Mouse[x: 464 y: 425]
'■
■
Zoom Factor: 2.0 Zoom Factor: 4.0
AFG[x: 37 y: 37] Mouse[x: 80 y: 75]
AFG[x:218y:37] Mouse[x: 464 y: 75]
AFG[x: 87 y: 87] Mouse [x: 186 y: 175]
AFG[x: 168 y: 87] Mouse[x: 358 y: 175]
AFG[x: 87 y:168] Mouse [x: 186 y: 337]
AFG[x: 168 y:168] Mouse[x: 358 y: 337]
AFG[x: 37y:212] Mouse[x: 80 y: 425]
AFG[x:218y:212] Mouse[x: 464 y: 425]
AFG[x: 18y:18] Mouse [x: 80 y: 75]
AFG[x: 109 y: 18] Mouse [x: 466 y: 75]
AFG[x: 43 y: 43] Mouse [x: 186 y: 175]
AFG[x: 84 y: 43] Mouse [x: 360 y: 175]
AFG[x: 43 y: 84] Mouse[x: 186 y: 339]
AFG[x: 84y:84] Mouse [x: 360 y:339]
AFG[x: 18 y: 106] Mouse [x: 80 y: 427]
AFG[x: 109 y:106] Mouse [x: 466 y: 427]
■
Once you are satisfied that you have successfully calibrated all the points, you are ready to calculate the transformation variables. If any of the data looks bad, you can simply restart the calibration by selecting the Calibration... option from the Commands menu.
Calculation Results:
To calculate the transformation variables, choose the Calculate... option from the Commands menu. This will take the current data points and best fit the results. An output file will be created (COORDS.TXT) that will contain all the calibration and transformation information. The output of this file looks like:
rra hitor Calibratio Commands
X Axis[nZ: 0 a: Y Axis[nZ: 0 a: X AxisfnZ: 1 a: Y Axis[nZ: 1 a: X Axis[nZ: 2 a: Y Axis[nZ: 2 a: X Axis[nZ: 3 a: Y Axis[nZ: 3 a:
1.88542 adev: 2.00000 adev: 0.94271 adev: 1.00000 adev: 0.47135 adev: 0.50000 adev: 0.23575 adev: 0.25000 adev:
0.00269 b: 0.00000 b: 0.00134 b: 0.00000 b: 0.00067 b: 0.00000 b: 0.00019 b: 0.00000 b:
-0.83364 bdev: 0.00000 bdev: -0.41682 bdev: 0.00000 bdev:
-0.70841 bdev: -0.50000 bdev: -0.86021 bdev: -0.75000 bdev:
0.83269] 0.00000] 0.41635] 0.00000] 0.20817] 0.00000] 0.05916] 0.00000]
105
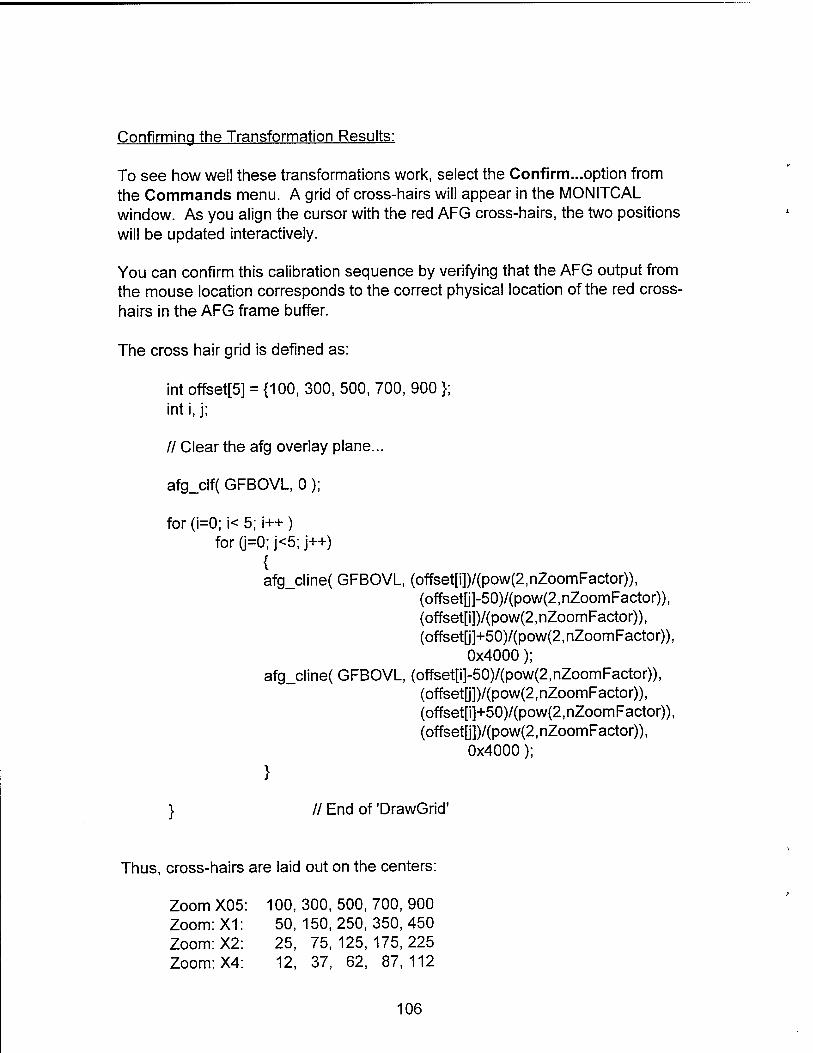
Confirming the Transformation Results:
To see how well these transformations work, select the Confirm...option from the Commands menu. A grid of cross-hairs will appear in the MONITCAL window. As you align the cursor with the red AFG cross-hairs, the two positions will be updated interactively.
You can confirm this calibration sequence by verifying that the AFG output from the mouse location corresponds to the correct physical location of the red cross- hairs in the AFG frame buffer.
The cross hair grid is defined as:
int offset[5] = {100, 300, 500, 700, 900 }; int i, j;
// Clear the afg overlay plane...
afg_clf( GFBOVL, 0);
for (i=0; i< 5; i++ ) for (j=0; j<5; j++)
{ afg_cline( GFBOVL, (offset[i])/(pow(2,nZoomFactor)),
(offset[j]-50)/(pow(2,nZoomFactor)), (offset[i])/(pow(2,nZoomFactor)), (offset[j]+50)/(pow(2,nZoomFactor)),
0x4000); afg_cline( GFBOVL, (offset[i]-50)/(pow(2,nZoomFactor)),
(offset[j])/(pow(2,nZoomFactor)), (offset[i]+50)/(pow(2,nZoomFactor)), (offsetD])/(pow(2,nZoomFactor)),
0x4000);
}
\ II End of 'DrawGrid'
Thus, cross-hairs are laid out on the centers:
Zoom X05: 100, 300, 500, 700, 900 Zoom: X1 Zoom: X2 Zoom: X4
50, 150,250,350,450 25, 75, 125, 175, 225 12, 37, 62, 87,112
106

for both the x and y axes.
Leaving the Calibration Utility MONITCAL:
When you exit the calibration utility, and output file COORDS.TXT is ready to be used as a calibration file for the current video system. You must rename this file with the extension:
.CAL
and move it into the current directory as the MIPCTL executable file. For instance, if the calibration was done with the SONY15SF monitor, you would rename the file COORDS.TXT to:
C:\mip\mipexe\SONY15SF.CAL
Running MIPCTL.EXE Version 6.1.0
As long as the KEOCCD.INI 'Monitor' parameter is set up correctly (see above), and there is a valid calibration file created by MONITCAL.EXE with the file name pointed to in KEOCCD.INI, you will not notice any difference in running the latest version of MIPCTL.
107

108
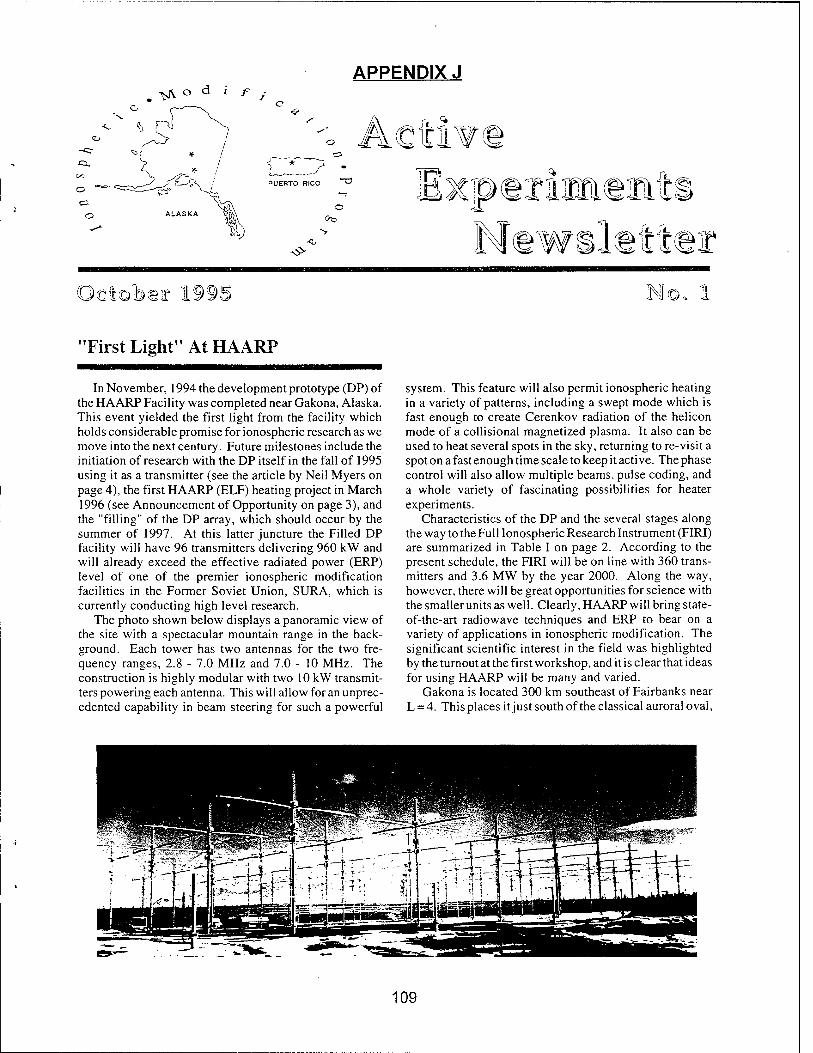
>JV o d i f y
APPENDIX J
A c =UERTO RICO
<*?
<>
October 1995
ftlLV'
SPUES
letter 1
First Light" At HAARP
In November, 1994 the development prototype (DP) of the HAARP Facility was completed near Gakona, Alaska. This event yielded the first light from the facility which holds considerable promise for ionospheric research as we move into the next century. Future milestones include the initiation of research with the DP itself in the fall of 1995 using it as a transmitter (see the article by Neil Myers on page 4), the first HAARP (ELF) heating project in March 1996 (see Announcement of Opportunity on page 3), and the "filling" of the DP array, which should occur by the summer of 1997. At this latter juncture the Filled DP facility will have 96 transmitters delivering 960 kW and will already exceed the effective radiated power (ERP) level of one of the premier ionospheric modification facilities in the Former Soviet Union, SURA, which is currently conducting high level research.
The photo shown below displays a panoramic view of the site with a spectacular mountain range in the back- ground. Each tower has two antennas for the two fre- quency ranges, 2.8 - 7.0 MHz and 7.0 - 10 MHz. The construction is highly modular with two 10 kW transmit- ters powering each antenna. This will allow for an unprec- edented capability in beam steering for such a powerful
system. This feature will also permit ionospheric heating in a variety of patterns, including a swept mode which is fast enough to create Cerenkov radiation of the helicon mode of a collisional magnetized plasma. It also can be used to heat several spots in the sky, returning to re-visit a spot on a fast enough time scale to keep it active. The phase control will also allow multiple beams, pulse coding, and a whole variety of fascinating possibilities for heater experiments.
Characteristics of the DP and the several stages along the way to the Ful 1 Ionospheric Research Instrument (FIRI) are summarized in Table I on page 2. According to the present schedule, the FIRI will be on line with 360 trans- mitters and 3.6 MW by the year 2000. Along the way, however, there will be great opportunities for science with the smaller units as well. Clearly, HAARP will bring state- of-the-art radiowave techniques and ERP to bear on a variety of applications in ionospheric modification. The significant scientific interest in the field was highlighted by the turnout at the first workshop, and it is clear that ideas for using HAARP will be many and varied.
Gakona is located 300 km southeast of Fairbanks near L = 4. This places it just south of the classical auroral oval,
109
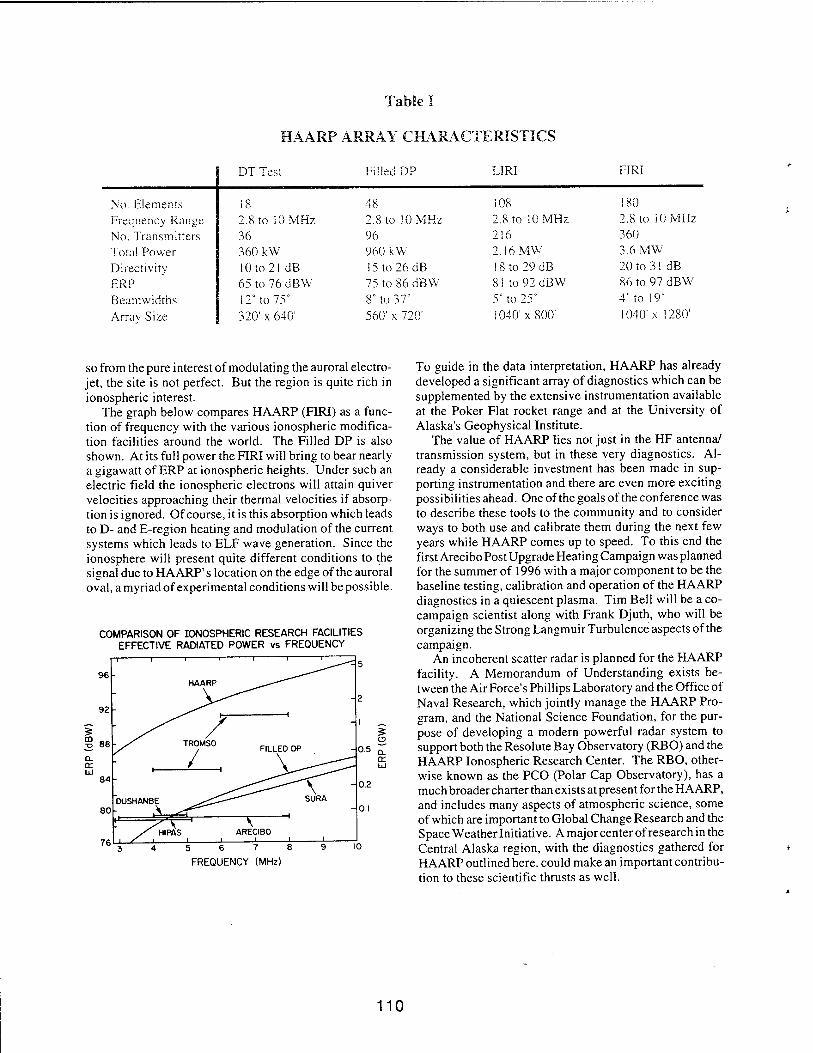
Tabue I
HAARP ARRAY CHARACTERISTICS
DT Test Filled DP LIRI FIRI
No. Elements 18 48 108 180
Frequency Range 2.8 to 10 MHz 2.8 to 10 MHz 2.8 to 10 MHz 2.8 to iOMHz
No. Transmitters 36 96 216 360
Total Power 360 kW 960 kW 2.16MW 3.6 MW
Directivity 10 to 21 dB ! 5 to 26 dB ! 8 to 29 dB 20 to 31 dB
ERP 65 to 76 dBW 75 to 86 dBW 81 to 92 dBW 86 to 97 dBW
Beamwidths 12° to 75" 8° to 37° 5° to 25° 4° to 19°
Arrav Size 320' x 640' 560' x 720' 1040'x 800' 1040'x 1280'
so from the pure interest of modulating the auroral electro- jet, the site is not perfect. But the region is quite rich in ionospheric interest.
The graph below compares HAARP (FIRI) as a func- tion of frequency with the various ionospheric modifica- tion facilities around the world. The Filled DP is also shown. At its full power the FIRI will bring to bear nearly a gigawatt of ERP at ionospheric heights. Under such an electric field the ionospheric electrons will attain quiver velocities approaching their thermal velocities if absorp- tion is ignored. Of course, it is this absorption which leads to D- and E-region heating and modulation of the current systems which leads to ELF wave generation. Since the ionosphere will present quite different conditions to the signal due to HAARP's location on the edge of the auroral oval, a myriad of experimental conditions will be possible.
COMPARISON OF IONOSPHERIC RESEARCH FACILITIES EFFECTIVE RADIATED POWER vs FREQUENCY
3 4 5 6 7 8 9
FREQUENCY (MHz)
10
To guide in the data interpretation, HAARP has already developed a significant array of diagnostics which can be supplemented by the extensive instrumentation available at the Poker Flat rocket range and at the University of Alaska's Geophysical Institute.
The value of HAARP lies not just in the HF antenna/ transmission system, but in these very diagnostics. Al- ready a considerable investment has been made in sup- porting instrumentation and there are even more exciting possibilities ahead. One of the goals of the conference was to describe these tools to the community and to consider ways to both use and calibrate them during the next few years while HAARP comes up to speed. To this end the first Arecibo Post Upgrade Heating Campaign was planned for the summer of 1996 with a major component to be the baseline testing, calibration and operation of the HAARP diagnostics in a quiescent plasma. Tim Bell will be a co- campaign scientist along with Frank Djuth, who will be organizing the Strong Langmuir Turbulence aspects of the campaign.
An incoherent scatter radar is planned for the HAARP facility. A Memorandum of Understanding exists be- tween the Air Force's Phillips Laboratory and the Office of Naval Research, which jointly manage the HAARP Pro- gram, and the National Science Foundation, for the pur- pose of developing a modern powerful radar system to support both the Resolute Bay Observatory (RBO) and the HAARP Ionospheric Research Center. The RBO, other- wise known as the PCO (Polar Cap Observatory), has a much broader charter than exists at present for the HAARP, and includes many aspects of atmospheric science, some of which are important to Global Change Research and the Space Weather Initiative. A major center of research in the Central Alaska region, with the diagnostics gathered for HAARP outlined here, could make an important contribu- tion to these scientific thrusts as well.
110