tandem mass spectrometry for the identification and ...ufdcimages.uflib.ufl.edu › uf › 00 › 09...
TRANSCRIPT

TAIIDEM MASS SPECTROMETRVf FOR THE IDENTIFICATION .^ND QUANTITATION OFTRYPTOLINES (TETRAHYDRO-BETA-CARBOLINES) IN RAT 3RAIN EXTRACTS
BY
JODIE VINCENT JOHNSON
A DISSERTATION PRESENTED TO THE GRADUATE SCHOOLOF THE UNIVERSITY OF FLORIDA IN
PARTIAL FULFILLMENT OF rHS Pj;2tJIREMENTSFOR THE DEGREE OF DOCTOR OF PKILOSOPHY
UNIVERSITY OF FLORIDA
':984

To my loving wife, Karen,
and our son, Joshua

ACKNOWLEDGEMENTS
I would like to express my sincere gratitude to Dr. Kym F. Faull at
the Stanford University Medical Center for his initiation of this pro-
ject and provision of samples and for his advice, patience, and valued
friendship during this collaborative research. I would like to thank
Dr. Olof Beck, at Stanford University also, who helped plan and prepare
samples for the experiments in Chapter 5, and Jack D. Barchas, M.D., for
securing funding for the work performed at Stanford.
I would like to express ray gratitude to Dr. Richard A. Yost for his
acceptance and guidance during this research. His editorial assistance
during the preparation of this dissertation and various papers is very
much appreciated. I will always value his friendship. I thank him also
for offering me a postdoctoral appointment.
I acknowledge the members of my research committee, including Drs.
John G. Dorsey, Gerhard M. Schmid, Martin T. Vala , and Clyde M. Williams
for their suggestions and guidance. I especially thank Dr. Dorsey for
reviving my interest in pursuing a Ph.D. degree.
This research would not have been possible or as much fun without
the support of and discussions with my colleagues and friends in the
MS/MS research group. I would like to give special thanks to Neil
Brotherton and Dean Fetterolf for many helpful discussions. In
addition, I thank Linda Hirschy, Barbara Kirsch, Jonell Kerkhoff, and
Joe Foley for their friendship, help, and lunch-time talks, which helped
to maintain our sanity while taking classes and doing research.

I gratefully acknowledge the Chemistry Department for the first
year scholarship and Proctor and Gamble for sponsoring my fellowship
during this past year. I also thank Dr. Roy King for accepting me as
his graduate assistant and teaching me the varied aspects of high reso-
lution mass spectrometry. I also acknowledge research funding in part
by grants from the National Science Foundation (CHE-8106533) at the
University of Florida and from the National Institute on Alcohol Abuse
and Alcoholism (AA 0592) and the National Institute of Mental Health
(Program Project grant MH 23861 ) at Stanford.
I would like to acknowledge the support of my family during all the
years of my education, whether in or out of the classroom. Most of all,
I thank my wife, Karen, for her love, understanding, and patience during
these years in graduate school. She has made it all possible and worth-
while.

TABLE OF CONTENTS
PAGE
ACKNOWLEDGEMENTS iii
ABSTRACT viii
CHAPTER
1 INTRODUCTION 1
Organization of Dissertation 1
Tryptolines (Tetrahydro-B-Carbolines) 3
Tandem Mass Spectrometry (MS/MS) 7
Instrument Description, Operation, and Application 10
2 TANDEM MASS SPECTROMETRY FOR TRACE ANALYSIS 1
4
Introduction 14
Requirements for Trace Analysis 14
Instrumental Methods to Improve the Limit of
Detection 16
Fluorome try 17
Gas Chromatography/Mass Spectrometry (GC/MS) 17
Tandem Mass Spectrometry 18
Principles of MS/MS 18
Applications of MS/MS for Trace Analysis 19
MS/MS trace analysis with MIKES instruments 19
MS/MS trace analysis with triple
quadrupole instruments 20
Conclusion 23
3 TANDEM MASS SPECTROMETRY FOR THE IDENTIFICATION AND
QUANTITATION OF UNDERIVATIZED TRYPTOLINES 24
Introduction 24
Artefactual Tryptoline Formation 24
MS/MS for Mixture Analysis 25
MS/MS for Structure Elucidation 26
Experimental 27
Materials and Reagents 27
Instrumentation 28
Procedures 29
Mass spectra of standards 29
Selection of positive or negativechemical ionization 29

PCI-CAD collision energy and collisiongas pressure studies 30
Quantitative studies 30
Results and Discussion 31
Nomenclature and Structure 31
EI and EI-CAD Mass Spectra of Standards 32
PCI and PCI-CAD Mass Spectra of Standards 38
NCI and NCI-CAD Mass Spectra of Standards 43
Optimization Studies 51
Mode of ionization 51
PCI-CAD collision energy 52
PCI-CAD collision gas pressure 53
Quantitative studies 56
Conclusion 63
TANDEM MASS SPECTROMETRY FOR THE IDENTIFICATION AND
QUANTITATION OF TRYPTOLINE-HEPTAFLUOROBUTYRYLDERIVATIVES 65
Tryptoline-HFB Derivatives 65
Experimental 66
Materials and Reagents 66
Preparation of Extracts 68
Chemical Derivatization 68
Instrumentation 69
Procedures 70
Mass spectra of standards 70Collision energy and collision gas
pressure studies 70
Selected ion and selected reaction monitoring 71
Quantitative studies 71
Results and Discussion 73
Structure of the Tryptoline-HFB Derivatives 73
Mass Spectral Characteristics 73
EI normal mass spectra 73
PCI normal mass spectra 74
NCI normal mass spectra 74
PCI-CAD daughter mass spectra 75
NCI-CAD daughter mass spectra 79
Optimization of Experimental Parameters 84
Source temperature 84
CAD conditions 84
Quantitative Studies 85
Standard calibration curves 85
Analyses of derivatized crude brain extracts 94
Conclusion 1 04
TANDEM MASS SPECTROMETRY FOR THE IDENTIFICATION AND
QUANTITATION OF TRYPTOLINES IN RAT BRAIN EXTRACTS 105
Experimental 1 07
Materials and Methods 107
Chemicals and reagents 1 07
_jzi.

Synthesis of standards 1 07
Preparation of brain extracts 1 08
Chemical derivatization 108
Gas Chromatography/Tandem Mass Spectrometry
( GC/MS/MS )110
Results and Discussion 112
Mass Spectral Characteristics 112
Indoleamines 112
Tryptolines 113
Assay of Derivatized Rat Brain Extracts 116
Artefactual tryptoline formation 117
Quantitation of endogenous TLN 122
Reproducibility of the TLN-HFB quantitation 126
Assay for other tryptolines 131
Conclusion 1 36
6 CONCLUSIONS AND SUGGESTIONS FOR FUTURE WORK 1 38
BIBLIOGRAPHY 141
BIOGRAPHICAL SKETCH 147

Abstract of Dissertation Presented to the Graduate Schoolof the University of Florida in Partial Fulfillment of the
Requirements for the Degree of Doctor of Philosophy
TANDEM MASS SPECTROMETRY FOR THE IDENTIFICATION AND QUANTITATIONOF TRYPTOLINES (TETRAHYDRO-BETA-CARBOLINES) IN RAT BRAIN EXTRACTS
By
Jodie Vincent Johnson
December, 1984
Chairman: Richard A. YostMajor Department: Chemistry
The natural occurrence of tryptolines in mammalian tissue is the
subject of controversy. This is due to the lack of sensitivity and/or
selectivity in the methods used for identification and the possibility
of artefactual formation of tryptolines dtiring sample preparation. Due
to its excellent sensitivity and inherent selectivity, tandem mass
spectrometry (MS/MS) has been used successfully for the direct analysis
of complex mixtures for trace components with minimal, if any, sample
clean-up.
The triple quadrupole tandem mass spectrometer consists of, in
series, a dual chemical ionization/electron impact ionization source, a
quadrupole mass filter (Q1 ) , a radio- frequency-only quadrupole (Q2), a
second quadrupole mass filter (Q3), and an electron multiplier. In the
analysis of an extract, methane positive or electron capture negative
chemical ionization (PCI or NCI, respectively) of the extract produced
ions characteristic of the components of the extract. The MS/MS quanti-
tation in these studies was performed by selected reaction monitoring

(SRM) whereby the ion characteristic of a tryptoline is mass selected by
i21 for fragmentation in Q2 through collisions with neutral gas mole-
cules, and only the most abundant and characteristic daughter ion is
selected by Q3 for monitoring. The MS/MS quantitation was compared to
selected ion monitoring (SIM), whereby Q1 and Q2 pass all ions and only
the characteristic ion of a tryptoline is selected by Q3 for
monitoring. With sample introduction via a capillary column, the limits
of detection of the heptafluorobutyryl (HFB) derivative of tryptoline
were determined to be 0.50, 0.45, 19, and 60 pg of standard injected
onto the column for NCI-SIM, NCI-SRM, PCI-SIM and PCI-SRM,
respectively. The greater selectivity of the NCI-SRM technique made it
the preferred technique for the analysis of crude extracts of rat brain.
With GC/NCI-SRM analysis of HFB-derivatized crude extracts of rat
brains, it was demonstrated that artefactual formation of tryptoline
during the sample preparation used in these studies was negligible.
Tryptoline (19.2 + 3.6 ng/g wet tissue, n-7), methtryptoline, 5-hydroxy-
tryptoline, and 5-hydroxymethtryptoline , and their presumed precursor
indoleamines, tryptamine and 5-hydroxytryptamine, were identified in rat
brain extracts.

CHAPTER 1
INTRODUCTION
This dissertation describes the use of tandem mass spectrometry for
the qualitative and quantitative characterization of tryptolines (tetra-
hydro-S-carbolines) in crude extracts of rat brains. The in vivo pres-
ence of tryptolines in mammalian systems has been an area of much con-
troversy since the first report describing their presence in 1961 (1).
This has largely been due to the inability of the analytical methods
used to consistently identify and quantitate these compounds at the
trace ( sub-parts-per-billion) levels reported. This dissertation demon-
strates that, due to its inherent selectivity and sensitivity, tandem
mass spectrometry is able to detect reliably and consistently sub-parts-
per-billion levels of derivatized tryptoline in standards. Furthermore,
it describes the use of tandem mass spectrometry to identify four tryp-
tolines (two of which have not been previously reported) and to quanti-
tate one of these tryptolines in heptafluorobutyryl-derivatized crude
extracts of rat brain.
Organization of Dissertation
This dissertation is divided into six chapters. This introductory
chapter provides background information necessary for understanding the
significance of the research presented in later chapters. An overview
of the tryptolines is presented with regard to their physiological
significance and their _in^ vivo presence in mammalian systems. A brief
historical review of tandem mass spectrometry is followed by a descrip-

tlon of the operational modes and applications of the triple quadrupole
tandem mass spectrometer used in these studies.
Chapter 2 describes the use of tandem mass spectrometry for trace
organic analysis. This chapter, in combination with some of the
findings of chapters 4 and 5, has been prepared for publication in
Analytical Chemistry and Applied Spectroscopy Reviews . A brief review
of the fundamental analytical requirements and inherent difficulties of
trace analysis in general is presented. A review of the fundamental
aspects of tandem mass spectrometry is followed by descriptions of
several applications of this technique to trace mixture analysis. The
successful determinations of trace organics in complex matrices in these
applications serve as the basis for the research presented in chapter 3.
In chapter 3, the use of tandem mass spectrometry to structurally
characterize and quantitate underivatized tryptoline standards is dis-
cussed. The fragmentation pathways of the ions resulting from electron
impact and positive and negative chemical ionization are elucidated.
Following optimization of the experimental conditions, quantitation of
underivatized tryptoline standards is performed. The significance of
the limits of detection thus obtained is discussed with regard to deter-
mining the tryptolines in mammalian tissues.
The characterization and determination of the heptafluorobutyryl
derivatives are described in chapter 4. Many of the findings reported
in this chapter have been published recently in Analytical Chemistry
(2). Following a description of the mass spectral characterization of
the standards, the effect of experimental conditions on sensitivity is
discussed and optimized. Quantitation of the heptafluorobutyry1-deriva-
tive of the tryptoline standard is performed by normal and tandem mass

spectrometry with positive and negative chemical ionization and with
sample introduction via packed and capillary gas chromatographic
columns. The sensitivity, limit of detection, and speed of analysis of
each of the techniques are discussed. An application of each technique
to the determination of an amount of tryptoline added to a derivatized
crude extract of rat brain is demonstrated and discussed.
The use of tandem mass spectrometry for the identification and
quantitation of tryptolines in heptafluorobutyryl-derivatized extracts
of rat brains is described in chapter 5. Much of this work has been
submitted for publication as a chapter in "Aldehyde Adducts in
Alcoholism" (3). The tandem mass spectrometric methods developed in
chapter 4 are used to investigate the possibility of artefactual trypto-
line formation occurring during the sample work-up procedure, to quanti-
tate tryptoline, and to tentatively identify three other, two previously
unreported, tryptolines in derivatized crude extracts of rat brains.
The final chapter summarizes the results of this work and presents
some ideas for continued research in the area of tryptolines as well as
in the area of tandem mass spectrometry.
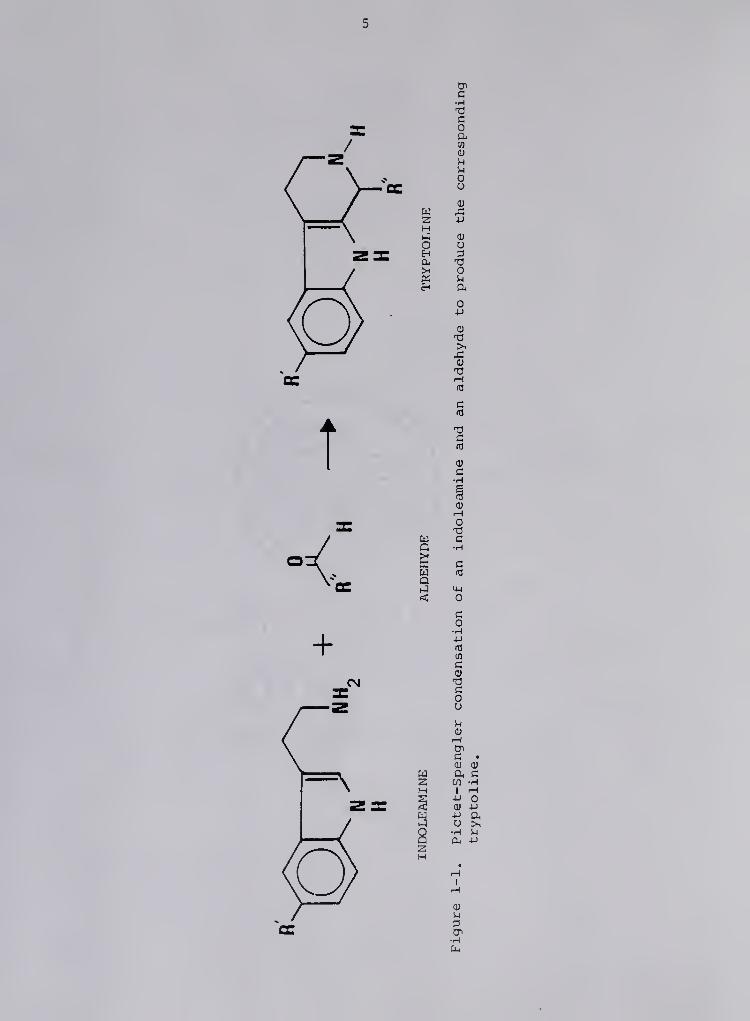
Tryptolines (Tetrahydro-6-Carbolines)
The tryptolines (1 ,2 ,3 ,4-tetrahydro-6-carbolines) are a class of
compounds resulting from the Pictet-Spengler condensation of indole-
amines and aldehydes (Figure 1-1) (4). The laboratory synthesis of
tryptolines by this reaction occurs readily under physiological condi-
tions (1,5). This property has been used in the past as the basis for
the histochemical detection of indoleamines by fluorometry, whereby the
indoleamines are converted to tetrahydro-6-carbolines via condensation

with formaldehyde gas and then oxidized to the highly fluorescent 3-
carbolines (6). In vitro formation of tryptolines also results from the
incubation of methyl tetrahydrofolate and indoleamines with various
tissue extracts having certain enzymatic activities (7-9). This reac-
tion involves the enzymatic formation of formaldehyde from methyl tetra-
hydrofolate followed by non-enzymatic condensation of formaldehyde with
indoleamines (10-12). These results, in conjunction with the fact that
indoleamines (13-16) and formaldehyde (17) are common constituents in
mammalian tissues, have led to the speculation that the tryptolines
could occur naturally in mammalian tissues.
Interest in the physiological significance of the tryptolines stems
largely from three sources. Firstly, they are known to elevate the
levels of serotonin (5-hydroxytryptamine) in the brain. Administration
of tryptolines inhibits the action of monamine oxidase A (18-20), in-
hibits the re-uptake of serotonin by the synaptosomal cells (20-24), and
facilitates the release of serotonin (25). Serotonin has been postu-
lated to be a putative neurotransmitter (26), and imbalance in the brain
serotonin levels has been associated with various mental illnesses
(27). Thus, the _i£ vivo presence of tryptolines may have important
influences upon neurotransmission and mental illness (28,29).
Secondly, tryptolines have been associated with the alcohol abuse
syndrome (30). The level of acetaldehyde, the major metabolite of
ethanol in mammalian systems, increases in the plasma and brain fol-
lowing intake of ethanol (31,32), thus increasing the likelihood of
acetaldehyde-indoleamine condensation reactions. This hypothesis has
been supported by the determination of such tryptolines in the urine of
normal subjects after, but not before, intake of ethanol (33,34), and by
w2HoEH
aEh
C•r-(
cOa.en
a;
uuou
(U
OJ
u3T)OUa,
-p
OJ
0)
T3
t
C(0
C
cH
wQ
uQ<
T3C•H
c
o
+CM
a
2M
co
•r-l
nl
mc0)
T3COU
U0)
i-l
c •
a c
4J
0)
Pu
cu
a>,u-p

the Increased excretion of such tryptolines in the urine of alcoholics
(35,36). In addition, after administration of tryptolines, rats pre-
ferred drinking alcohol over water (37,38). Thus, the in vivo produc-
tion of tryptolines may have important implications with respect to
alcoholism.
Thirdly, the identification of receptor sites in mammalian brain
specific for the benzodiazepines, a class of mild tranquilizers, led to
the search for possible endogeneous ligands (39-42). A 6-carboline
derivative was isolated from human urine which showed a very high af-
finity for the benzodiazepine receptors (43). Although this compound
had been chemically altered during the extraction procedure, it did lead
to the speculation that a member of the S-carbolines or tetrahydro-3-
carbolines could be an endogeneous ligand for the benzodiazepine recep-
tor. This speculation was strengthened when it was shown that several
tryptolines and 6-carbolines which have been found in mammalian systems
were powerful displacers of tritiated flunitrazepam from brain tissue
homogenates (44). Related to this aspect, certain tryptolines have
recently been shown to exert LSD-like effects and to be associated with
the opiate receptors in the brain (45-48).
On the basis of combined thin-layer chromatography (TLC) and fluor-
ometry (49,50), liquid chromatography with electrochemical detection
(51), TLC with scintillation counting (52), and gas chromatography/mass
spectrometry (GC/MS) (33,53-57), the in_ vivo presence of tryptolines
has been described in various extracts of mammalian tissues and
fluids. Despite these numerous reports, widespead support for the
natural occurrence of these compounds in mammalian tissues has not been
forthcoming. This has been largely due to the lack of the sensitivity

and/or the selectivity of the above methods necessary for the consistent
detection of the tryptolines at the trace levels reported. In addition,
the possibility of artefactual formation of tryptolines during the
sample work-up procedure has further confused this issue (58,59).
Tandem Mass Spectrometry (MS/MS)
The demand for more sensitive, selective, rapid, and cost-effective
techniques for mixture analysis has been the spur for the continuing
improvements in mass spectrometry over the years. The need to quanti-
tatively analyze petroleum fractions was the impetus for the commercial
development of single- focusing magnetic mass spectrometers in the
19403. The desire for higher selectivity and more information resulted
in the advent of double- focusing instnaments which combined the momentum
analyzing property of a magnetic sector and the kinetic energy analyzing
property of an electric sector in order to obtain higher mass spectral
resolution. However, these instruments were fairly expensive to pvir-
chase, operate and maintain. This led to the commercial development of
quadrupole mass spectrometers in the 1960s. It was quite apparent early
on that in order to obtain qualitative information about the components
of a mixture, the individual components had to be introduced into the
mass spectrometer in a relatively "pure" form. This was the incentive
for the development of gas chromatography/mass spectrometry (GC/MS) in
the late 1950s (60). The ability to separate and identify hundreds of
components in a mixture at trace levels has made GC/MS one of the most
powerful and widely-used techniques for organic mixture analysis (61).
The need to analyze thermally labile and/or nonvolatile compounds not
amenable to GC prompted the coupling of liquid chromatography to mass
8
spectrometry (LC/MS) in the late 1970s (62). Both of these chromato-
graphic systems provide, it is hoped, not only the introduction of
relatively pure substances into the mass spectrometer, but also the
additional information contained in the elation time of a component
after its injection onto the column, referred to as its retention
time. The combination of having a characteristic retention time and
having a characteristic mass spectrum of a component in a mixture is now
the accepted criterion used for confirming the identity of a compound.
One of the major drawbacks with the use of chromatography/MS for mixture
analysis is the relatively long analysis time. This is not only due to
the time required for the separation and elution of the component of
interest, but also due to the extensive sample clean-up and derivatiza-
tion procedures often necessary prior to the chromatographic step (62).
The mass separation of ions for subsequent fragmentation and mass
analysis, tandem mass spectrometry (MS/MS), has long been used in the
study of ion-molecule reactions (63) and, more recently, in the study of
ion photodissociation (64,65). With the development of mass-analyzed
ion kinetic energy spectrometry (MIKES) (66) and an instrument specifi-
cally designed for MIKES (67), the ability to separate and study ions
mass spectrometrically was dramatically extended. A MIKES instrument is
a double-focusing mass spectrometer having the magnetic sector prior to
the electric sector (reversed geometry). In MIKES, an ion is mass-
selected by the magnetic sector and allowed to undergo metastable (uni-
molecular) or collisionally activated dissociation in the following
field-free region to produce various daughter ions and neutral frag-
ments. The kinetic energy of the daughter ions is then analyzed with
the electric sector. The resulting MIKE spectrum provides information
about both the daughter ions' mass-to-charge ratios (m/z) and the
kinetic energy released upon fragmentation (68). Such information
enables the elucidation of many of the fragmentation pathways, and thus
the structure, of a molecule following its ionization and fragmentation
under electron impact.
As MIKES can involve the separation of ions resulting from the
ionization and fragmentation of a single compound, the next logical
progression was the exploitation of this MS/MS capability of MIKES for
mixture analysis. Subsequent research in the labs of Cooks (69,70) and
McLafferty (71) demonstrated that the inherent selectivity and sensi-
tivity of MIKES-type tandem mass spectrometry (MS/MS) permitted the
rapid analysis of complex mixtures for trace components with minimal, if
any, sample clean-up and preparation. The development in the late 1970s
by Yost and Enke (72) of a triple quadrupole tandem mass spectrometer,
with an RF-only quadrupole serving as an efficient collision cell and
powerful focusing device, led to the commercial development of practical
MS/MS instruments. Since then, many types of tandem mass spectrometers
have been built utilizing magnetic sectors, electric sectors, quadru-
poles, time-of-flight, ion cyclotron resonance cells and various com-
binations of these, each with their own specific characteristics (73).
As in the early days of mass spectrometry, it was soon realized that
more than just tandem mass spectrometry may often be required for com-
plex mixture analysis. Thus, the combination of various chromatographic
systems with MS/MS has fvirther increased the selectivity of the tech-
nique (2,3,74,75).

10
Instrument Description, Operation, and Application
The triple quadrupole tandem mass spectrometer used In these
studies consists of, In series, a dual chemical ionization/electron
impact (CI/EI) ionization source, a quadrupole mass filter (Ql ) , a
radio- frequency-only quadrupole (Q2), a second quadrupole mass filter
(Q3), and an electron multiplier. While Ql and Q3 are operated as mass
filters in the MS/MS modes, Q2 acts as a collision chamber and focusing
device, allowing all ions to be efficiently transmitted. In mixture
analysis, "soft" ionization, e.g. chemical ionization, of a mixture is
utilized in the ion source to produce ions characteristic of the compo-
nents of the mixture. The separation and analysis of the component of
interest is performed by the mass selection of its characteristic ion by
Ql for fragmentation in Q2 through collisions with neutral gas mole-
cules, and the mass analysis of the resulting daughter ions by Q3.
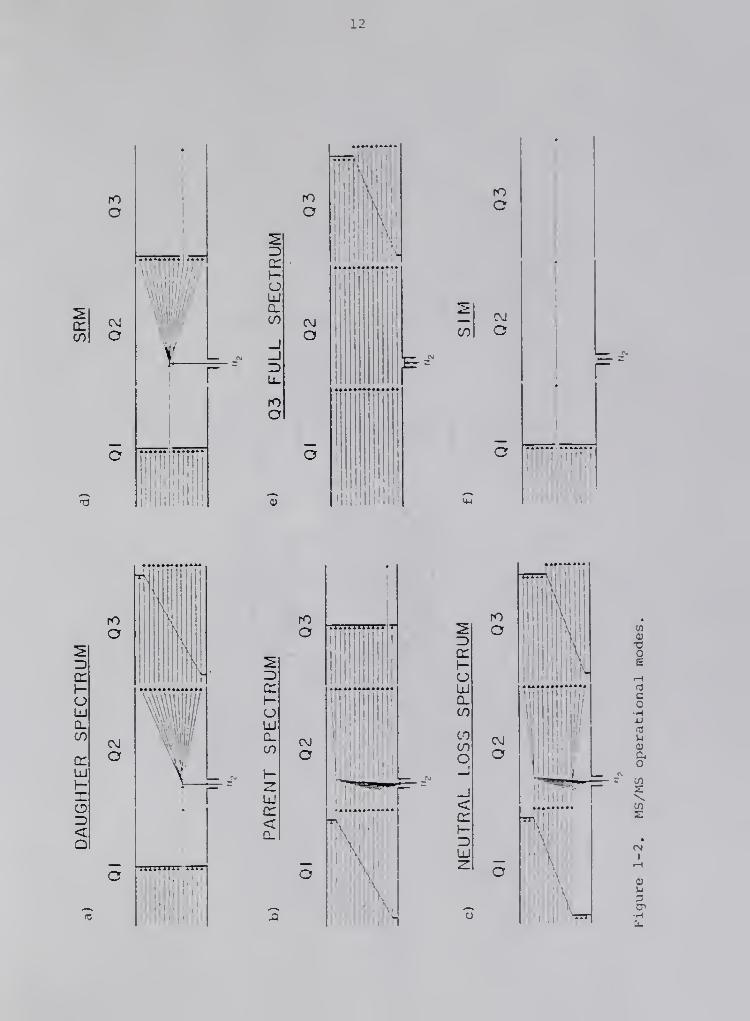
The four most common MS/MS scan or operating modes of the triple
quadrupole instrtunent are daughter scan, parent scan, neutral loss scan,
and selected reaction monitoring (Figure 1-2). The specific MS/MS
operational mode chosen for a particular analysis will depend upon the
information desired. A daughter scan (Figure 1-2a) consists of se-
lecting a single parent ion characteristic of the analyte by Ql , frag-
menting it by collisionally activated dissociation (CAD) in Q2, and then
scanning Q3 to obtain a daughter mass spectriim. Analogous to a normal
mass spectrvun, the daughter mass spectrvim can be used for identification
of an analyte by standard mass spectral interpretation or by matching
the spectrum to that of an authentic sample. In the parent scan mode
(Figure 1-2b), Ql is scanned over a specific mass range, allowing parent
ions of different m/z to sequentially enter and undergo fragmentation in

11
Q2 to produce various daughter ions. Then Q3 , instead of scanning,
selects only an ion of a particular m/z to be transmitted to the
detector. The resulting parent mass spectrum contains all the ions
which fragment to yield a specific daughter ion, and can be used to
screen for a class of compounds which fragment to yield a common sub-
structure. Fragmentation of the positive CI (M+H) ions of most of the
phthalates yields the characteristic daughter ion 149'*'. Therefore, a
parent scan of 149 would be a method for screening mixtures for phthal-
ates. In a neutral loss scan (Figure 1-2c), both Q1 and Q3 are scanned
with a specific mass difference between them. The resulting neutral
loss spectrum contains the daughter ions which result from the loss of a
specific neutral fragment from the parent ions, and is useful for
screening for a class of compounds characterized by the loss of a spe-
cific fragment. The molecular ions of chlorinated organics often lose
CI or HCl during CAD, and thus a neutral loss scan of 35 or 36 (and/or
37 and 38) would provide a rapid screening procedure for chlorinated
organics in a mixture. Although the three operational modes just
described are very selective, as in full scan normal mass spectrometry,
they may not have the sensitivity necessary for the determination of
trace components. Thus, for trace analysis, selected reaction moni-
toring (SRM) (Figure 1-2d) is normally employed, wherein only one
characteristic daughter ion, typically the most abundant, resulting from
the fragmentation of the analyte's characteristic parent ion, is
selected by Q3. Thus, an enhancement in the sensitivity is obtained,
albeit at the expense of some selectivity. In addition to these MS/MS
modes, the tandem mass spectrometer can also be operated as a normal
mass spectrometer by allowing all ions to pass through Q1 and Q2 , in the
12
en
O
CM
O
Z)enI-oUJQ.CO
Z)U.
rOO
rO
O
CM
o
O
1^
1 ! III
••*f**#f«***«
i;l
*«**•
en
fOo
CM
O
IM
*
i
*
!
1
I
(
1

13
absence of a collision gas. The second mass analyzer, Q3 , can then be
scanned to produce a normal mass spectrum (Figure 1-2e) or it can select
only ions of a specific m/z for selected ion monitoring (SIM) (Figure 1-
2f). This allows direct comparisons to be made betweem MS and MS/MS
techniques on the same MS/MS instrument.
In light of the difficulties associated with the determination of
tryptolines in tissue extracts, a study was initiated to assess the
applicability of triple quadrupole tandem mass spectrometry for deter-
mining the trace levels of tryptolines reported in rat brain extracts.
With its inherent selectivity and excellent sensitivity, MS/MS should be
able to more reliably determine these compounds than the more conven-
tional techniques presently in use.

CHAPTER 2
TANDEM MASS SPECTROMETRY FOR TRACE ANALYSIS
Introduction
Tandem mass spectrometry (MS/MS) has gained rapid acceptance with
the analytical community since its development in the 1970 's. Although
it has been applied successfully for structure elucidation of unknowns
(76), its rapid acceptance has largely been due to its ability to
rapidly provide sensitive and selective analysis of complex mixtures,
often with minimal, if any, sample clean-up (69-72,77,78). A recent
book (79) and several recent reviews (73,80,81) contain extended expla-
nations of the theory, instrximentation, and applications of tandem mass
spectrometry. Here, we will deal with the application of tandem mass
spectrometric techniques to the determination of trace organic compo-
nents in complex matrices. The fundamentals and difficulties associated
with trace organic analyses emd the basic MS/MS operating modes will be
reviewed. Various examples taken from research in our labs, as well as
from the general literature, will be used to illustrate how tandem mass
spectrometry meets the needs and overcomes some of these difficulties
associated with trace analyses.
Requirements for Trace Analysis
In order to perform trace analyses successfully, it is necessary to
think in terms of what McLafferty has referred to as the 4 S's of analy-
sis (82): sensitivity, selectivity, speed, and $. The figure of merit
14

15
often used to describe an analytical technique is the first "S", sensi-
tivity, defined by the slope of a calibration curve as the change in the
signal obtained from a change in amount of analyte (Equation 2-1).
Sensitivity may be a useful figure of merit for "pure" analytes, but may
become meaningless for the determination of the analyte in a complex, or
even a simple, matrix. This is due to the possibility that
(2-1) Sensitivity = slope of the calibration curve = -; ^d Amount
other chemical constituents of the matrix or backgrotind may give a
response at or interfere with the signal of the analyte. These types of
effects can be referred to as chemical noise. The factor which then
determines the smallest amount of analyte which can be determined by a
technique may not be its sensitivity but rather its ability to discern
the signal of the analyte from the chemical noise. This is the second
"S", selectivity. Thus, a more descriptive figure of merit for an
analytical technique is the limit of detection, defined as the amount of
signal which results in a signal to noise ratio adequate to provide the
desired confidence (typically S/N = 3) . With the rearrangement of
equation 2-1 , and substitution of the resulting definition of the signal
into the definition of the limit of detection, equation 2-2 is
obtained. - This equation shows that the limit of detection takes into
account both the sensitivity and the selectivity (measured by the level
of chemical noise) of an analytical technique.
noise(2-2) Limit of detection = (amount for S/N =3) =• 3
sensitivity

16
In order to achieve the limits of detection necessary for trace
analyses, the selectivity is normally Improved through the use of exten-
sive clean-up, separation, and often derivatization procedures in order
to physically separate or enhance, respectively, the analyte's signal
with respect to the chemical noise. In trace analyses, such siunple
manipulations can increase the possibilities for sample contamination
and sample loss through adsorption onto glassware, oxidation, etc. In
addition, if the methods necessary to increase the selectivity become
too time-consuming and/or expensive, then the analytical method may
become too impractical for routine work. Thus, the final two "S's",
speed of analysis and cost effectiveness, are also important figiires of
merits.
Instrumental Methods to Improve the Limit of Detection
An alternative method to increase the selectivity is through the
use of two or more types of analytical techniques in conjunction. Cooks
and Busch have shown that, as the number of analytical techniques used
simultaneously for the analysis of a sample increases, the absolute
levels of the signal and noise decrease (83). However, because of the
selectivity that each of the techniques has for the signal over the
noise, the noise level decreases much more rapidly than does the signal,
and an overall improvement in the S/N ratios is obtained. Since the
limit of detection is determined by the S/N ratio, as long as there is a
detectable signal, an increase in the number of analytical techniques
used simultaneously for an analysis will result in improved limits of
detection. Two commonly used analytical methods which utilize this
principle are fluorometry (84) and gas chromatography/mass spectrometry
(GC/MS) (61).

17
Fluorometry
Fluorometry can be considered to be a combination of absorption and
emission spectroscopy. In the absorption experiment, a specific wave-
length of light is selected by the first monochromator for irradiation
of the sample. Absorption of this radiation by the sample results in
its excitation and possible emission of light. The second monochromator
then selects a specific wavelength of the emitted light for detection as
the analytical signal. As the quantvim efficiency for the conversion of
the absorbed energy into emitted light is not one, and only a specific
wavelength is selected for detection, there is a loss in the absolute
signal detected, and therefore, in the sensitivity. However, in order
for a compound to be detected, it must not only absorb energy at a
specific excitation wavelength, but it must also emit radiation at a
specific wavelength. This increase in selectivity reduces the spectral
interference or chemical noise relative to the signal, so that often
lower limits of detection are possible.
Gas Chromatography/Mass Spectrometry (GC/MS)
In GC/MS the selectivity is improved by the actual physical separa-
tion of the components of a mixture by chromatography prior to their
mass analysis. In order to be detected an analyte must elute from the
chromatographic column at a specific retention time and be ionized to
produce ions of specific m/z. The sensitivity is reduced due largely to
the dilution of the analyte during the chromatographic separation. In
addition to reduced sensitivity, another major trade-off for the
increased selectivity is an increased analysis time.

18
Tandem Mass Spectrometry
Instead of using two different methods of analysis, tandem mass
spectrometry, as its name implies, uses one technique, mass spectro-
metry, twice in tandem. A tandem mass spectrometer consists of an ion
source, two mass analyzers separated by a fragmentation region, and an
ion detection device. The mass analyzers which have been used in these
instruments include quadrupoles, magnetic sectors, electric sectors,
time of flight, ion cyclotron resonance cells, and combinations of these
(73 and references therein). Although each of these has its own spe-
cific characteristics, they are based upon the same MS/MS principles.
Principles of MS/MS
The principles of MS/MS are straightforward, and can be compared to
conventional GC/MS as described above. A mixture is introduced into the
ion source of the tandem mass spectrometer, where "soft" ionization
methods can be used to produce ions characteristic of the mixture com-
ponents. The separation of the analyte from the other mixture compo-
nents (the chromatographic step of GC/MS) is then achieved by the mass
selection of the characteristic ion of the analyte by the first mass
analyzer. The parent ion, thus selected, undergoes collisionally acti-
vated dissociation (CAD) through collisions with neutral gas molecules
in the fragmentation region to yield various fragment or daughter ions,
analogous to the fragmentation occuring during the ionization step of
GC/MS. As in GC/MS, subsequent mass analysis of the daughter ions by
the second mass analyzer results in t.he analytical signal. When the
second mass analyzer is scanned, a daughter spectrum is obtained. As
with a normal mass spectrum, the daughter mass spectrum can be used for

19
identification of the parent ion (and thus, the analyte) through conven-
tional mass spectral interpretation or by comparison with an authentic
sample. In order to increase the sensitivity for trace analysis, only a
single characteristic daughter ion, usually the most abundant, may be
selected by the second mass analyzer for monitoring. This selected
reaction monitoring (SRM) is analogous to the selected ion monitoring
(SIM) used for maximal sensitivity in conventional GC/MS. Thus, in
order for an analyte to be detected, it must be ionized to a character-
istic ion and this parent ion must produce a daughter ion of specific
m/z. This again results in decreased sensitivity with respect to normal
MS due to the inefficiencies of the conversions of parent ions to v
daughter ions and the subsequent mass analysis of these daughter ions.
However, the significant reduction in chemical noise often results in
increased S/N ratios and improved limits of detection.
Applications of MS/MS for Trace Analysis
MS/MS trace analysis with MIKES instruments . The increase in
selectivity which results from the use of two mass analyzers in tandem,
in conjunction with the excellent sensitivity of the electron multiplier
for ion detection, has enabled the direct analysis of complex mixtures
for trace components with little or no sample preparation. From a
historical viewpoint, the early MS/MS applications were conducted with
MIKES instruments (see Chapter 1) modified to allow pressurization of
the second field-free region (between the magnetic and electric
sectors). One of the first applications of MS/MS for trace analysis of
mixtures was the determination of cocaine in coca leaf samples and urine
(80,86). Solids probe isobutane PCI-SRM analysis of cocaine standards

20
resulted in a calibration curve extending over 2 or 3 orders of magni-
tude with a limit of detection of approximately 1 ng where the error was
estimated as 30%. This technique permitted the determination of 4 ng of
cocaine in a 1 yg sample of coca leaf diluted in 1 mg of chalk dust, and
of 1.7 ng of cocaine in a 1 \iL urine sample. This work was extended
with multiple reaction monitoring (MRM) to the simultaneous mapping of
cocaine and cinnamonylcocaine in 1 mg samples of coca plant tissue. The
only sample preparation used in these samples was grinding of the coca
leaf samples in liquid nitrogen.
The speed of analysis with MS/MS techniques can be increased by
minimizing the sample preparation, as above, and by eliminating any
chromatographic separation of the mixture components prior to mass
spectrometric analysis. Instead, mixtures can be introduced directly
into the ion source by heatable solids probe. The component separation
then occurs by mass selection of ions characteristic of individual
components for fragmentation and subsequent mass analysis of the
daughter ions. The rapidity of sample analysis possible with a solids
probe is illustrated by the PCI-SRM determination of 20 ng of urea in 1
yL samples of diluted blood serum at a rate of 15 samples per hour
(77). Due to the increased speed of analysis, a more reliable deter-
mination of the amount of analyte and an estimation of the precision of
the analysis can be obtained by performing replicate analyses of the
sample. Thus, the precision of the peak heights in the solids probe
PCI-SRM of urea in blood serum was ±15 % relative standard deviation.
MS/MS trace analysis with triple quadrupole instruments . The
research with MIKES instruments demonstrated that several trace compo-
nents could be rapidly determined in complex mixtures with little or no

21
sample preparation. However, MIKES instruments have several disadvan-
tages. Besides having less than unit mass resolution in the daughter
spectra, the scan laws for the parent and neutral loss scans are compli-
cated and the magnetic sector Ceui not be quickly and accurately "jumped"
between parent ions. With the development of a triple quadrupole
instrument, these disadvantages were overcome (72). The quadrupoles,
having a linear scan function and lacking the hysteresis effects of a
magnet, can be quickly and accurately jumped between many different
parent ions. These same characteristics allows all the various MS/MS
scan modes to be placed under computer control. With a center quadru-
pole as a collision cell and focusing device, very efficient CAD of
parent ions and collection of daughter ions for mass analysis by the
third quadrupole are realized.
The application of triple quadrupole MS/MS to trace mixture analy-
sis is illustrated by the direct determination of illicit drugs in the
urine and blood serum of racing animals by solids probe PCI-MS/MS tech-
niques (78). Presently, screening for illicit drugs is performed by
thin layer chromatography, with confirmation performed on any positives
by GC/MS. These methods entail extensive sample workup prior to their
analysis and therefore only the top three to four animals of each race
typically are tested. With the introduction of 1 yL of blood serum via
a heated solids probe, the MS/MS detection limits for most of the il-
licit drugs studied were in the low parts-per-million (ppm) (ng/yL)
range with PCI-SRM. With a simple solvent extraction of the blood
serum, the detection limits were reduced to the low part-per-billion
(pg/yL) range. The selectivity of MS/MS is more dramatically illus-
trated by the fact that three isobaric (same nominal mass) drugs could

22
be independently quantitated due to their unique daughter ions. Con-
firmation of the drugs at the parts-per-milllon (ng/jL) level in the
blood serum was possible by comparison of the complete daughter spectra
from the simple extract to those of authentic standards. With this
procedure, it was possible to screen for as many as 50 drugs and metabo-
lites in a single sample in less than 5 minutes. The advantages gained
by the simplicity and time-saving of the MS/MS procedure over that
currently in use are quite apparent.
The selectivity, sensitivity, and speed of analysis possible with
MS/MS is dramatically illustrated in the determination of hexachloro-
benzene (HCB) and 2 ,4 , 5-trichlorophenol (TCP) in human blood ser-um and
urine by GC/triple quadrupole MS/MS (85). Rapid sample introduction was
possible using a 50 cm long, 0.75 mm i.d. , packed GC column operated
isothermally to give retention times of 10 and 20 s for HCB and TCP,
respectively. With this rapid means of sample introduction and a simple
1:1 solvent: sample extraction, it was possible to perform triplicate
determinations of TCP (spiked levels ranging from 0.25 to 100 ppb, 1 yL
sample size) in six seiTim samples, six urine samples, six standards, and
associated blanks in approximately 36 minutes, which corresponds to ca.
100 in jections/hr. This speed of analysis did not compromise the sen-
sitivity and selectivity, as the absolute limits of detection for HCB
and TCP were 50 and 250 femtograms, respectively, injected onto the
column. The rapid analysis also made it possible to perform replicate
analyses of each sample, which permitted an estimation of the precision
of quantitation (consistently ±10 percent relative standard
deviation). Often with normal GC/MS , the length of time required for
the chromatographic step makes such replicate analyses impractical. A

23
comparison with the analyses performed with capillary column GC/MS
showed the limits of detection for HCB and TCP with the short packed
column GC/MS/MS to be 4 and 80 times lower, respectively, than those
with GC/MS. In addition, GC/MS/MS was able to perform the same set of
analyses in approximately 1/6 the time of that of the capillary GC/MS
method. This was largely attributed to the time of the actual sample
analyses', although significant savings were also apparent in the seimple
euid instrument preparation.
Conclusion
The MS/MS examples above demonstrate that MS/MS meets the require-
ments necessary for trace analysis: sensitivity, selectivity, speed,
and low cost per sample. Due to the high sensitivity and increased
selectivity of MS/MS, rapid determinations of picogram and femtogram
quantities of analytes have been demonstrated in small (mg and yL)
quantities of complex mixtures with only minimal, if any, sample clean-
up. The reduced sample clean-up not only increases the speed of analy-
sis but also reduces the possibility of contamination of the sample or
loss of the analyte. In addition, the ability to analyze small quan-
tities becomes a major advantage in biological investigations where the
amount of sample is often limited. Although the initial cost of MS/MS
instruments is in the $10 range, because of the rapidity of sample
analysis, MS/MS becomes a very cost-effective technique for performing
trace analyses.
CHAPTER 3
TANDEM MASS SPECTROMETRY FOR THE IDENTIFICATION ANDQUANTITATION OF UNDERIVATI2ED TRYPTOLINES
Introduction
In Chapter 2, the ability of MS/MS to successfully analyze complex
mixtures directly, with minimal or no sample preparation, was illus-
trated. With a reduction in the sample clean-up prior to analysis, the
possibilities of both loss of the trace analytes and contamination of
the sample can be reduced. In particular, the chances of contamination
of the brain extracts with aldehydes, which may lead to artefactual
formation of tryptolines, can be reduced. Thus, this chapter investi-
gates the use of tandem mass spectrometry for the identification and
quantitation of underivatized tryptolines in crude extracts of rat
brains.
Artefactual Tryptoline Formation
The Pictet-Spengler condensation reaction of indoleamines and
aldehydes to produce the corresponding tryptolines occurs readily in the
laboratory under conditions of physiological pH and temperature (1,5).
This fact has led to the possibility of artefactual formation of trypto-
lines occurring during the extensive sample clean-up procedures neces-
sary prior to determination of tryptolines by TLC-fluorescence and/or
GC/MS. It was demonstrated that a major portion of the tryptolines
determined in several instances has largely been due to artefactual

25
formation, with the source of the problem being traced to the presence
of formaldehyde in the solvents used in the sample clean-up procedures
(8,58). This has necessitated the use of aldehyde- trapping reagents in
the solvents and redistillation of solvents just prior to sample clean-
up. These steps have helped to reduce the level of the problem. In
addition, deuterium-labelled indoleamines are now routinely added in the
first step of sample clean-up as internal checks upon the level of
artefactual formation. The formation of deuterivun- labelled tryptolines
would be a measure of the eunount of artefactually- formed tryptolines
relative to endogeneous levels. Faull and others were able to demon-
strate that, by reducing the length and complexity of the clean-up
procedure, the possibility of artefactual tryptoline formation during
the sample clean-up could be minimized, if not eliminated (59).
However, in order to obtain high selectivity and sensitivity, it was
still necessary to derivatize the sample and perform gas chromatographic
separation prior to mass spectral analysis.
MS/MS for Mixture Analysis
The use of two mass analyzers in tandem gives MS/MS a high degree
of selectivity. Because of this, it has been possible to successfully
determine targeted compounds or classes of compounds in very complex
matrices by MS/MS techniques with minimal, if any, sample clean-up.
Examples include the mapping of cocaine and cinnamonoylcocaine in coca
leaves (86), the determination of urea in human blood serum (77), and
the determination of illicit drugs in racing animals' serum (78). Not
only is there a time-saving by having minimal sample clean-up, but
further time-saving results from the ability to do mass separation of

26
components (in a few ms) instead of chromatographic separation (in tens
of min) prior to further mass analysis.
The use of highly selective MS/MS techniques should enable further
reduction in the sample clean-up of brain homogenates. This in turn
should reduce the possibility of contamination with, loss of, and arte-
factual formation of tryptolines during the sample clean-up. In light
of this, tandem mass spectrometry was assessed with regard to its
ability to directly determine trace levels of underivatized tryptolines
without prior chromatographic separation.
MS/MS for Structure Elucidation
In addition to mixture analysis, MS/MS has been used for structure
elucidation studies of organic molecules and ions (72,76,87,88). In
normal EI mass spectrometry, many fragment ions are often produced
following the ionization of a compound. Without tandem mass spectro-
metry, the fragmentation pathways (and thus, the structure of the com-
pound) resulting in these fragment ions can be elucidated with the use
of high resolution mass spectrometry for determination of the elemental
compositions of the ions, isotopic labelling studies, and/or with refer-
ence to compilations of logical fragmentation mechanisms which have been
elucidated by similar methods (89,90). With the use of tandem mass
spectrometric techniques, however, the fragmentation pathways of an
ionized compound can be directly determined by systematically frag-
menting and obtaining daughter spectra of all of the ions in the EI mass
spectrvun of the compound (72). This results in obtaining a "genetic
tree" of an ionized molecule, indicating all the interrelationships and
fragmentation pathways between various daughter ions. Interpretation of

27
the mass spectral Information in order to elucidate the structure of a
compound can then be performed more quickly and reliably.
An additional advantage with MS/MS is realized with the "soft"
ionization techniques generally used in the trace analysis by mass
spectrometry. These "soft" ionization techniques (e.g. chemical ioniza-
tion) increase the selectivity and often the sensitivity of mass spec-
trometric analyses by reducing the fragmentation of the characteristic
ions of the mixture components. However, with normal mass spectrometry,
this results in a loss of structural information about the ions pro-
duced. MS/>1S analysis of the ions produced by CI of a mixture is often
able to provide the structural information necessary to identify a
component without the sample separation necessary in conventional mass
spectrometry. Therefore, a second objective of the work presented in
this chapter is to investigate the ability of MS/MS to structurally
characterize the tryptolines in relatively "pure" forms with EI-CAD, cuid
in mixtures with CI-CAD techniques.
Experimental
Materials and Reagents
All chemicals and reagents were of the highest purity available.
The tryptoline standards were kindly supplied as their HCl salts by Kym
Faull, Ph.D., and Jack Barchas, M.D. (Department of Psychiatry and
Behavioral Sciences, Stanford Medical Center, Stanford, CA). Ultrahigh
purity methane (Matheson, Morrow, GA) and zero grade nitrogen (Airco
Industrial Gases, Researach Triangle Park, NC) were used as a CI
reagent/GC carrier and collision gas, respectively.

28
Instrumentation
o
All data were collected with a Finnigan MAT (San Jose, CA) triple
stage quadrupole GC/MS/MS (91) equipped with a 4500 series ion source,
pulsed positive and negative chemical ionization and INCOS data
system. The Finnigan 9610 gas chromatograph was equipped with packed
and Grob-type capillary injectors. A packed GC column and a heated
direct insertion solids probe were utilized for sample introduction in
these studies.
A short packed glass colunm was used to introduce samples into the
ion source during the optimization studies. The colunm was constructed
f a 38 cm length of 6 mm o.d. and 0.75 mm i.d. U-shaped glass tubing.
A 6.4 cm piece of 0.64 cm o.d. and 4 mm i.d. glass tubing was joined to
each end of the 38 cm length to allow room for the injection needle and
for connection to the GC/MS interface. The tubing was rinsed three
times each with the following solvents, in order: distilled water,
acetone, methanol, and methylene chloride. Upon drying, the tubing was
filled with a 10% solution of dime thyIchlorosilane in toluene for ca.
1 .5 hours, after which it was rinsed three times with toluene and dried
in a GC oven. The tubing was hand-packed with 3% OV-101 on 80/100 mesh
Chromosorb 750. The resulting column was conditioned overnight at 250
"C with 20 ml/min He flow prior to use (note: during conditioning the
column was not connected to the mass spectrometer). The GC/MS interface
consisted of a glass-lined stainless steel tube direct inlet fitted with
a micro-needle valve. During the optimization studies, the GC column
was kept isothermal at 225 'C with a carrier gas flow rate of ca. 18
ml/min CH^. The injection port and the GC/MS interface temperatures
were 220 "C and 250 °C, respectively. These conditions resulted in a
retention time for tryptoline-HCl of ca. 10 s.

29
Procedures
Mass spectra of standards . Standards were introduced into the ion
source by vaporization from a solids probe heated from ca. 50 "C to 400
"C at varying rates under data system control. Electron impact (EI, 70
eV electron energy) and positive and negative chemical ionization (PCI
and NCI, respectively, 100 eV electron energy, 1.0 torr CH^ source
pressure) mass spectra were obtained with a source temperature of 100 "C
in the Q3 normal MS mode. Daughter spectra were acquired for the char-
acteristic ions in the EI and CI mass spectra of each of the tryptolines
at collision gas pressures of 2.0 and 2.9 mtorr N2> respectively, and at
a collision energy of 24 eV. The NCI-CAD daughter spectra of the
(MHC1-H)~ (M denotes the tryptoline, while MHCl denotes the tryptoline-
HCl salt) ions were obtained at a collision gas pressure of 2 .0 mtorr N
and a collision energy of 26 eV. The EI-CAD daughter spectra used to
generate the "genetic tree" of each tryptoline were obtained at a source
temperature of 130 "C with a collision gas pressure of 1.3 mtorr N- and
a collsion energy of 20 eV. The mass spectra acquired during the
highest level of the analyte's ion ciirrent were averaged and background-
subtracted, if necessary, to yield a representative mass spectnam of
each standard.
Selection of positive or negative chemical ionization . Samples of
tryptoline-HCl were introduced via the heated solids probe while per-
forming Q3 selected ion monitoring (SIM) of the (M+H) ion, m/z 173, and
the (M-H)~ ion, m/z 171, with the pulsed positive and negative chemical
ionization feature of the tandem mass spectrometer. The integrated ion
currents of the two ions were compared.

30
PCI-CAD collision energy and collision gas pressure studlea . For
each CAD parameter, studies were conducted with two different techniques
at an ion source temperature of 120 "C. In the first study, tryptoline-
HCl was introduced via the heated solids probe and PCI-CAD daughter
spectra from m/z 140 to m/z 176 were acquired of the (M+H)"*" ion, m/z
173, at a collision gas pressure of 1.2 mtorr N2 and at varying colli-
sion energies. This procedure was repeated for a second sample. The
ion intensity ratios of m/z 144 to m/z 173 obtained at each collision
energy were averaged and plotted versus the collision energy (Q2
offset) . A similar procedure was utilized for the collison gas pressure
study with the exception of having the collision energy set at 26 eV and
analyzing a single sample for each collision gas pressure.
In a second study, for each combination of collision energy and
collision gas pressure, duplicate or triplicate 1 .0 yL injections of a
standard solution of tryptoline-HCl were made onto the packed GC column
(225 "C isothermal). PCI-aelected reaction monitoring (SRM) of m/z 173
to m/z 144 was performed, and the areas of the resulting GC peaks were
plotted against the desired parameter. The collision energy study was
conducted at 1.2 mtorr N_ . The collision gas pressure study was con-
ducted at 24 eV.
Quantitative studies . Serial dilutions were prepared of trypto-
line-HCl and methtiyptoline-HCl to give a series of solutions ranging in
concentration from the parts-per-trillion (pptr) to the parts-per-
million (ppm) level. Triplicate 1 .0 yL samples of each solution were
placed in separate 5 pL glass vials, with care to ensure that no large
air bubbles were present. These were allowed to air dry for ca. 1 hr.
The samples were then introduced into the ion source via a solids probe.

31
whereupon vaporization of the sample ocurred by ballistically heating
from 50 "C to 400 "C in ca. 1 min. PCI-SRM (100 eV, 0.3 mA, 1.0 torr
CH4 source pressure, 140 "C ion source-26 eV, 2.0 mtorr N2 , 1 nominal
mass unit, u, wide scan at 10 Hz) of the ITS'*" to 144"*" and la?"*" to 144"*"
CAD reactions was performed for tryptoline-HCl and methtryptoline-HCl,
respectively, at an electron multiplier voltage of 2200 V and a preamp
Qsensitivity of 10 h/V . Quantitation was obtained by integrating the
ion current over the scans during which tryptoline-HCl and methtryp-
toline-HCl were vaporized from the solids probe. Peak areas are reported
in data system counts. It was estimated that 1 count corresponds to the
detection of one ion.
Results and Discussion
Nomenclature and Structure
The compounds of interest in these studies are tryptoline (TLN)
,
methtryptoline (MTLN), 5 -methoxytryptoline (CH3O-TLN), 5- hydroxytrypto-
line (HTLN) , and S-hydroxymethtryptoline (HMTLN) (Table 3-1). These
compounds are substituted 1 ,2 ,3 ,4-tetrahydro-6-carbolines. Holman et.
al. (30) have suggested a change in the numbering system from that of
the B-carbolines (parenthesized numbers) to one reflecting the numbering
system of the presumed precursor indoleamines (unparenthesized
numbers). They have also suggested the class of compounds be referred
to as tryptolines, which again reflects the presumed indoleamine pre-
cursor tryptamine. Thus, 5-hydroxytryptoline would be the reaction
product resulting from the condensation of 5-hydroxytryptamine with
formaldehye. The tryptoline numbering system and nomenclature will be

32
used thoughout the remainder of the text. When referring to specific
tryptolinea, the abbreviations will be used while the term tryptolines
will be applied to the entire class of compounds.
EI and EI -CAD Mass Spectra of Standards
The normal EI mass spectra of the tryptolines, M, (as their HCl
salts, MHCl) are characterized by relatively intense molecular ions and
numerous fragment ions (Table 3-2). The (M-29)"^ fragment ions, pre-
sumably arising from the loss of CH2=NH from the piperidine ring, are
the most abundant ions in the mass spectra of the tryptolines which lack
a substituent at the 9-position (R"=H). For the tryptolines having a 9-
methyl substituent (R-'-CH^)! i-e. MTLN and 5-HMTLN, cleavage of the
methyl radical from the molecular ion results in the (M-15)"^ fragment
ions being the most abundant, with the (M-29)"^ fragment ions being the
next most abundant ions. The loss of the methyl radical, presumably
from the methoxy group of the (M-29)"^ fragment ion of 5-CH3O-TLN,
results in the second most abundant fragment ion in its mass spectrum.
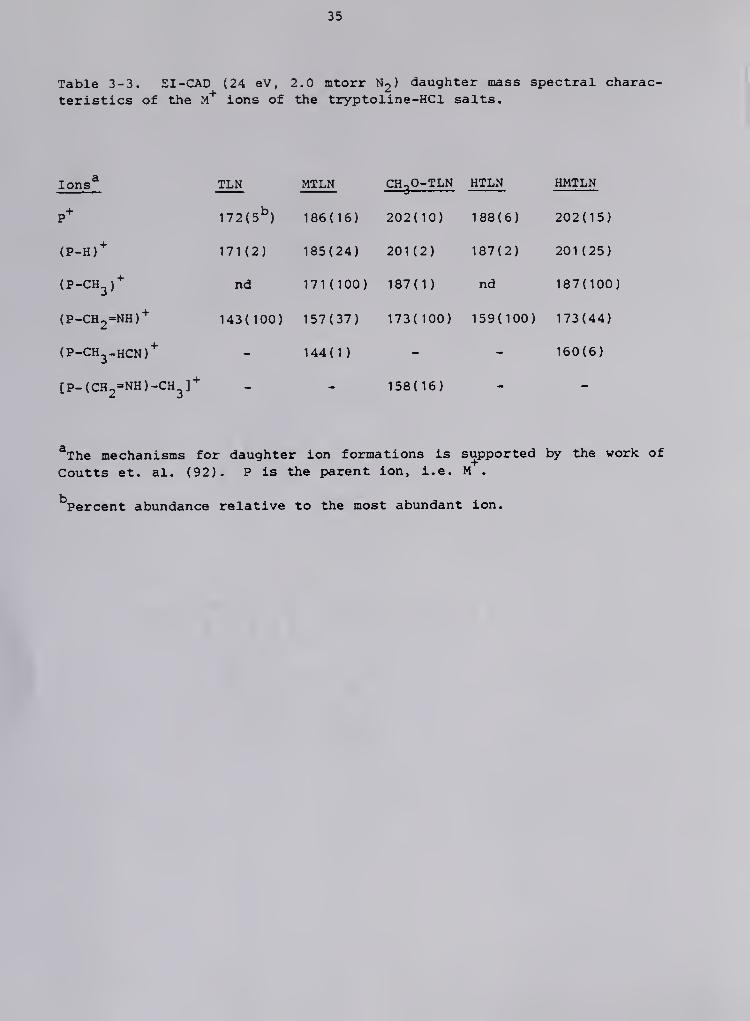
The fragmentation of the molecular ions of the tryptolines under
CAD conditions resulted in good yields of several abundant daughter
ions, with the intensities of the parent molecular ions ranging from 5
to 16% of the most abundant daughter ion (Table 3-3). The most abundant
daughter ions resulted from the same processes as seen in the normal EI
mass spectra, and serve to support the presumed fragmentation pathways,
i.e. the (M-15) and (M-29) daughter ions from the tryptolines with and
without the 9-methyl substituent, respectively. The (M-29)^ daughter
ions were also relatively abundant in the daughter spectra of MTLN and
5-HMTLN. A relatively abundant daughter ion at m/z 158, presumably due

33
Table 3-1. Characteristics of the tryptolines of interest.
Tryptoline

34
Table 3-2. EI mass spectral characteristics of the tryptoline-HClsalts.
lons^
35
Table 3-3. EI -CAD (24 eV, 2.0 mtorr N2 ) daughter mass spectral charac-
teristics of the m"*" ions of the tryptoline-HCl salts.
Ions* TLN MTLN CH-,0-TLN HTLN HMTLNi^
P* 172(5^) 186(16) 202(10) 188(6) 202(15)
(P-H)* 171(2) 185(24) 201(2) 187(2) 201(25)
(P-CH^)"^ nd 171(100) 187(1) nd 187(100)
(P-CH2=NH)* 143(100) 157(37) 173(100) 159(100) 173(44)
(P-CH^-HCN)* - 144(1) - - 160(6)
[P-(CH2=NH)-CH^]'^ - - 158(16)
*The mechanisms for daughter ion formations is supported by the work of
Coutts et. al. (92). P is the parent ion, i.e. M .
Percent abundance relative to the most abundant ion.

36
to [ (M-CH2-NH)-CH2]"'" also resulted from the CAD of the M* ion of 5-CH3O-
TLN.
The characteristic loss of CH2="NH from the EI molecular ions of the
tryptolines under CAD conditions could be used in the neutral loss MS/MS
mode to screen for other possible compounds having a piperidine ring.
Complete characterization of such an unJcnown, once isolated, could be
accomplished by systematically obtaining daughter spectra of all the
ions in its normal EI mass spectrum. The information thus obtained
would give all the genetic relationships between all the substructures
of the molecule, i.e. from what ions a substructiire is produced and to
what ions a substructure fragments, and would allow for easier and more
reliable interpretation of the mass spectral fragmentation pathways.
Such information is illustrated for MTLN in Figure 3-1 . Coutts et al.
(92) have previously determined some of the fragmentation pathways of
the 9-alkyl substituted tryptolines using metastable ions and high
resolution mass spectrometry. However, as relatively few metastable
transitions are observed for these compounds, only a few of the fragmen-
tation pathways could be directly confirmed (indicated by asterisks in
Figure 3-1). However, with an EI-CAD generated "genetic tree" of a
molecule, direct confirmation and analysis were possible of all the
fragmentation pathways. The completeness of this information should
lend itself well to computerized structural analysis. Research is
proceeding towards this goal (33).
The numerousness of fragment ions generated under EI conditions
makes this the preferred technique for structure elucidation of unknown
compounds by MS/MS. However, this characteristic becomes a liability in
quantitative analyses. In the direct determination of trace components

37
uc(0
c3
<
>H4J(0
i-H
(1)
a:
4J
c(U
u
(U
4Jc
u
0^
mco•H
oa:
ua,
0)
s^
(0 •
in wU >i(C M
.-I >.
C TDo o;
eu
U -Ho y-i
X cou
rH tn
3
UI
2 ^h4 +J
O
(0
(n
0)p
=0) c0) <u
4J •
c(1)
iXi in
,_(,_|,Hi-li—l^r—Ir-trHi-ti—li—lr-(i—(i—1^1—l>-li—lf-l(z/m
c3
• jar-t (TJ
I
>
U -U3 fl
•H (1)
Oh U

38
in complex matrices without prior separation, ideally each component
should be ionized to yield a single characteristic ion. This is advan-
tageous for two reasons. Firstly, by reducing the fragmentation of a
molecule after ionization, one can achieve an increase in sensitivity
when monitoring just the characteristic molecular ion. Secondly, by
reducing the number of fragment ions from other compounds in the matrix
having higher molecular weights than the compound of interest, the
possibility of spectral interference at the m/z of interest is reduced,
with a subsequent increase in the selectivity of the technique.
PCI and PCI-CAD Mass Spectra of Standards
Chemical ionization has been shown to be one method of achieving
the above goals (94,95). With methane as a reagent gas, gas-phase
chemical reactions occur in the ion source which result in the ioniza-
tion of the sample with little transfer of energy to the sample mole-
cules. This results in ions of low internal energy, and therefore
little fragmentation of the original ions occurs.
The positive chemical ionization (PCI) mass spectra of the trypto-
line-HCl salts are dominated by the protonated parent tryptoline mole-
cules, (M+H) , and major fragment ions presumably due to loss of CH^=NH
from the (M+H)"^ ions to yield (M+H-29)"^ (Table 3-4). The 5-substituted
tryptolines have several additional fragment ions, which are explained
below. In addition to the fragment ions, all the tryptolines yield the
adduct ions (M+29) and (M+41)'^ characteristic of methane PCI. The
presence of these adduct ions serves to confirm the molecular weight of
the compounds.

39
Table 3-4. Methane PCI mass spectral characteristics of the tryptoline-HCl salts.
Ions
(M+41)'^
(M+29)'^
(M+H)"^
(M+H-IS)"^
(M+H-18)*
(M+H-29)'^
(M+H-43)'^
TLN MTLN CH3O-TLN HTLN HMTLN
213(2^) 227(2) 243(2) 229(2) 243(2)
201(6) 215(7) 231(10) 217(8) 231(9)
173(100) 187(100) 203(100) 189(100) 203(100]
158(1) 172(4) 188(3) 174(1) 188(3)
nd nd nd 171(5) 185(5)
144(50) 158(11) 174(19) 160(20) 174(16)
nd 144(9) nd nd 160(3)
Percent abundance relative to the most abundant peak.

40
The (M+H)* ions of the tryptolines fragment efficiently under the
CAD conditions used (2.0 mtorr N2 , 26 eV) to yield several abundant
daughter ions (Table 3-5), For the non-methylated tryptolines, the most
abundant daughter ion, (M+H-29)*, is presumably due to the loss of
CHo-NH from the (M+H)"^ ions. This serves to confirm the fragmentation
pathway of the (M+H)"*" ions in the PCI spectra. Although the corre-
sponding daughter ions are seen in the daughter spectra of the (M+H)
ions of the 9-methylated tryptolines, the most abundant daughter ions
correspond to (M+H-AS)"^ ions, presumably from the loss of CH^CH-NH from
the piperidine ring. The (M+H-43)* ions could also be explained by a
rearrangement involving migration of the methyl group from the 9-
position to the piperidine nitrogen, and the subsequent loss of
CH =NCH . Coutts et. al. have shown some evidence for such a rear-
rangement occurring under EI conditions (92). The (M+H-15) ions do
fragment to yield some (M+H-43)'^ ions (ca. 40-50 % of the most abundant
(M+H-29)'^ daughter ions) by loss of 28 u. Thus, a third possible expla-
nation of the formation of the (M+H-43) ion may be loss of the methyl
group followed by loss of H and HCN.
In addition to the formation of the (M+H-43) ions, the (M+H) ions
of the methylated tryptolines also yield relatively intense (M+H-17)
daughter ions. These could result from the loss of the CH^ group,
followed by loss of H . However, the daughter spectra of the (M+H-15)
fragment ion has little if any ion corresponding to a loss of H^.
Perhaps a more reasonable explanation is a migration of a hydrogen from
the methyl group to the presumably protonated piperidine NH and subse-
quent loss of NH3. High resolution mass spectrometry and isotopic-
labelling would help to confirm the two possible mechanisms.

41
Table 3-5. Methane PCI-CAD (24 eV, 2.9 mtorr N2) daughter mass spectralcharacteristics of the (M+H)"*" ions of the tryptoline-HCl salts.
lons^ TLN MTLN CH^O-TLN HTLN HMTLN1^
P* 173(2^) 187(1) 203(2) 189(2) 203(2)
(P-15)* 158(<0.6) 172(1) 188(5) nd 188(2)
(P-17)* 156(<0.3) 170(7) 186(0.4) 172(0.3) 186(16)
(P-18) nd nd nd 171(7) 185(7)
(P-29)"^

42
The (M+H) ions of the 5-hydroxytryptolines yield characteristic
daughter ions (M+H-18) and (M+H-47) . The former daughter ions are
presumably due to the protonation of the 5-hydroxy group and subsequent
loss of H2O. The latter are presumably due to the combined losses of
H2O and CH2=NH from the (M+H)"*" ions. This is confirmed by the formation
of the daughter ion corresponding to (M+H-47)''' from the CAD of the (M+H-
18 )"*" and (M+H-29)"'" PCI fragment ions. In addition, the CAD of the
(M+H) ion of 5-HMTLN yields a daughter ion characteristic of both of
its substituents, i.e. (M+H-33) . This could presumably occur by the
combined losses of HO and CH from the (M+H) ion. This is confirmed
by the appropriate losses occurring from the (M+H-15) and (M+H-18) PCI
fragment Ions under CAD to yield the daughter ion corresponding to
(M+H-33)*.
The CAD of the (M+H)* of the 5-CH3O-TLN also produces unique daugh-
ter ions corresponding to (M+H-32) and (M+H-61) . These ions could
possibly result from mechanisms analogous to the formation of (M+H-47)
ions from the 5-hydroxytryptolines' (M+H) ions. Presumably, protona-
tion of the CH-,0 group occurs, and its loss as methanol results in the
(M+H-32)* ion. The subsequent loss of CH_-NH from this ion would result
in the (M+H-61) daughter ion. Little or no evidence was apparent for
loss of methanol from the (M+H-29) fragment ion, and the CAD spectrum
was not obtained of the (M+H-32) fragment ion. However, examination of
the analogous pathways in the 5-hydroxytryptolines reveals that the
major portion of the (M+H-47) ions comes from the loss of CH2='NH from
the (M+H-18)* fragment ions as opposed to loss of H-O from the (M+H-29)*
fragment ions. This supports the above proposed mechanism.

43
Thus, PCI of the tryptolines results in the residing of most of the
ion current in the (M+H) ions and several fragment ions. The PCI-CAD
of the (M+H) ion of each tryptoline yields a unique daughter spectrum,
reflecting the substituents at the 5- and 9-positions of the parent
tryptoline structure. The daughter ions observed can be readily ex-
plained by the loss of CH2=NH, R", CH2=N-R', and R'H, and combinations
of these losses from the (M+H)"'' ions.
NCI and NCI-CAD Mass Spectra of Standards
The electron-capture NCI mass spectra of the tryptoline-HCl salts
are dominated by the ions resulting from loss of H from both the HCl
salt (MHCl) to yield (MHC1-H)~ and the parent tryptoline molecule (M) to
yield (M-H)~ ions (Table 3-6). The (M-H)~ ions may also arise from the
loss of HCl from the (MHC1-H)~ ions. This is supported by the NCI-CAD
of the (MHC1-H)~ ions which fragment to yield the (M-H)~ as daughter
ions (Table 3-7). Also possible is the attachment of Cl~ to the neutral
tryptoline molecules in the gas phase to produce the ion at (M+35)~,
equivalent to (MHC1-H)~. Each of the tryptolines shows a major fragment
ion corresponding to (M-29) , which is again presumably due to loss of
CH2=NH from the molecular ion and supported by the NCI-CAD of the M~
ions (Table 3-8). The 9-methyl tryptolines have a cluster of three
fragment ions, (M-15) , (M-16)~, and (M-17)~, presumably corresponding
to loss of CH3 from the M", (M-H)~, and (M-H2)~, respectively. The 5-
hydroxytryptolines have a major fragment ion (M-17) apparently due to
loss of OH from the M~. Such a loss is substantiated by the daughter
Ions corresponding to a loss of OH from the (M-29)~ fragment ions and a
loss of CH2=NH from the (M-17)~ fragment ions. The 5-methoxytryptoline,
44
in addition, shows a fragment ion at m/z 159 which could correspond to
the loss of CH2=NH from the m/z 188 fragment Ion or by loss of CH-, from
the M~ followed by loss of CO.
All the tryptolines have ions in their NCI mass spectra at higher
m/z than those of their M~ and (MHC1)~ ions. The prominent (M+12)~ and
(MHC1+12)~ ions have been explained in the CH. NCI of organic nitriles
by the attachment of C H^ i present in the methane CI plasma, to the
neutral molecule followed by loss of NH^ prior to ionization (96). An
alternative, but less likely, explanation could be the formation of the
reactant ion C , which could then attach to and ionize the molecule
(97). The mass analyzer was not scanned to low enough mass to see if
this ion was indeed present. The (M+28)~ and (MHCl+28) ions are very
prominent in the spectra of the HCl salts of HTLN and HMTLN, but of only
low relative abundance in the other tryptolines' spectra. These ions
may also be adduct ions due to the addition either of CO to the molecule
prior to ionization or of C0~ to cause ionization. The CO could pos-
sibly be formed from the reaction of CH with Oj (from air leaks) at the
hot filament surface. Another possible source of CO could be the sample
itself, as phenols have been shown to lose CO under EI conditions
(89). Subsequent loss of oxygen from the CO-adducts could also be an
explanation of the (M+12)~ and (MHC1+12)~ ions. In addition to these
possible adduct ions, the mass spectra of the tryptolines contain ions
corresponding to (M+46) and 46 . These ions are of relatively low
abundance for all of the tryptolines, with the exception of TLN-HCl, for
which they represent the two most abundant ions in the NCI mass spec-
tmm. The (M+46)~ ions could be due to attachment of NO2 to the neutral
molecule prior to ionization, or, due to the attachment of N0_~ to the

45
Table 3-6. Methane electron-capture NCI mass spectral characteristicsof the tryptoline-HCl salts.
Ions

46
Table 3-7. Methane electron-capture NCI-CAD (26 eV , 2.0 mtorr N-,
)
daughter mass spectral characteristics of the (MHCl-H)" Ions of thetryptoline-HCl salts.
IO"B TLN MTLN CH3O-TLN HTLN HMTLN
P~ 207(20^) 221(21) 237(12) 223(14) 237(21)
<P-36)" 171(5) 185(32) 201(6) 187(58) 201(77)
(P-38)" nd nd 199(7) 185(13) 199(40)
(P-65) nd nd nd 158(5) 172(5)
m/z 35 (100) (100) (100) (100) (100)
^P is the parent ion, i.e. (MHCl-H)".
bPercent abundance relative to the most abundant ion.

47
Table 3-8. Methane electron-capture NCI-CAD (24 eV, 2.9 mtorr N-,
)
daughter mass spectral characteristics of the M~ ions of the tryptoline-HCl salts.
lons^ TLN MTLN CH^O-TLN HTLN HMTLN
P~ 172(100^) 186(100) 202(7) 188(100) 202(100)
(P-H)~ 171(5) 185(43) 201(1) 187(21) 201(25)
{P-15)~ 157(1) nd 187(100) 173(5) 187(5)
(P-16)" nd 170(2) 186(3) 172(2) 186(3)
(P-29)" 143(76) 157(85) 171(1) 159(68) 173(58)
(P-30)" 142(7) 156(17) nd 158(57) 172(22)
(P-43)~ nd nd nd 145(16) nd
(P-44)" nd nd 158(14) 144(37) 153(19)
(P-45)" nd nd 157(2) nd 157(4)
(P-58)~ nd nd nd nd 144(7)
i> is the parent ion, i.e. M~.
Percent abundance relative to the most abtindant ion.

48
Table 3-9. Methane electron-capture NCI-CAD (24 eV , 2.9 mtorr N )
daughter mass spectral characteristics of the (M-H)~ ions of the trypto-line-HCl salts.
^0"S TLN MTLN CH-^O-TLN HTLN HMTLN
P" 171(95'') 185(99) 201(13) 187(100) 201(100)
(P-H2)" 169(1) 183(2) 199(0.4) 185(2) 199(1)
(P-15)" nd 170(<0.3) 186(100) 172(7) 186(1)
(P-16)" nd 169(2) nd 171(0.4) 185(2)
(P-29)" 142(100) 156(100) nd 158(81) 172(70)
(P-44)" nd nd 157(18) nd 157(9)
145(3) 145(2)
p is the parent ion, i.e. (M-H)~.
T>ercent abundance relative to the most abundant ion.
49
neutral molecule. The latter is supported by the presence of 46" ions
in the background. That NO2 may have added to the molecule is further
supported by the NCI-CAD daughter spectrum of the m/z 218 ion in the
TLN-HCl spectrvim. Fragmentation of this (M+46)~ ion results in daughter
ions at m/z 171 (loss of 47) and m/z 142 (loss of 76), both of rela-
tively low abundance, and at m/z 46, the most abundant ion. The first
two daughter ions are indicative of the TLN molecule. The 46" ion could
be N02~ as its CAD spectrvun contains only a single daughter ion at m/z
16, , presumably due to loss of NO. The NO,' ion could result from
the reaction of N and (from an air leak) in the CH plasma. NO. may
also originate from the decomposition of the sample in the reagent
plasma as the m/z 46 ion is seen to increase with sample pressure.
(M+NOj) adduct ions have been reported in the PCI and NCI spectra of
other nitrogen-compounds, but with no explanation of their formation
(98). However, as the compounds studied in this case contained nitro
groups, they could serve as the source of the NO2. The possibility that
all of the adduct ions described above are not adduct ions, but are
instead due to impurities, seems less likely, as the corresponding ions
are not present for such components in the EI and PCI spectra.
The source of the air in the ion source and CI plasma is most
likely due to the steady leak of air at the O-ring fittings of the
solids probe. The reproducibility of the NCI mass spectra obtained on
different days was much lower than that for the PCI mass spectra. This
is probably directly attributable to the varying amount of air which can
enter through the direct inlet during operation of the solids probe,
depending upon the condition and tightness of the O-ring seals and the
operator's technique. This susceptibility of CH^ electron-capture NCI

50
spectra to air as an impurity has been previously noted (97,99,100).
The formation and nonreproducibility of these adduct ions would result
in an unpredictable decrease in the sensitivity when monitoring only a
single ion, and could introduce large errors into the technique.
However, these adduct ions could also serve to help identify the
molecular weight of an unknown compound, just as the (M+29)''" and (M+41)''"
adduct ions do in the PCI spectra. A more thorough study of the NCI
conditions and CAD spectra of all the NCI ions would be helpful in order
to obtain more conclusive evidence concerning the above. Due to the
consistently higher sensitivity and reproducibility obtained with PCI of
these compounds, this area was not pursued.
The abundant NCI (M-H)~ fragment ions do not fragment as effi-
ciently as the (M+H) ions under the same set of CAD conditions (Tables
3-5 and 3-9). However, the (M-H)~ ions do fragment characteristically,
forming largely daughter ions resulting from the loss of 29 u, CH2=NH,
from the parent ion. The (M-H)~ ion of 5-methoxytryptoline is an excep-
tion in that two major daughter ions are formed. The most abundant,
186 , is presumably due to loss of the methyl group from the 5-methoxy
group and then subsequent loss of CH2=NH from this ion to produce the
next most abundant daughter Ion, 157~.
Thus, electron-capture NCI of the tryptolines results in the forma-
tion of abundant (M-H)~ and (MHC1-H)~ ions, as well as several fragment
and adduct ions. The NCI mass spectra varied considerably when obtained
on different days, largely with respect to the relative abundance of the
adduct ions and also the relative yields of the (M-H)~ and (MHC1-H)~
ions. The NCI-CAD of the abundant (M-H)~ ions of each of the trypto-
lines yields a simple but unique daughter mass spectnim, dominated by

51
the daughter ion due to loss of CH2=NH. The NCI-CAD of the (M-H)~ ion
of CH^O-TLN was an exception to this, in that its most abundant daughter
ion was due to loss of CH^ followed by loss of CH2=NH to yield the next
most abundant daughter ion.
Optimization Studies
Mode of ionization . To determine a mixture component reliably at
trace levels, the highest possible sensitivity and selectivity is de-
sired. Therefore, the optimum mode of ionization and optimum conditions
must be obtained. A comparison was made between positive and negative
CI-SIM of the m/z 173, (M+H)"^, and m/z 171, (M-H)", ions, respectively,
of TLN-HCl. The tandem mass spectrometer is able to sample alternately
positive and negative ions from the ion source very rapidly. Therefore,
it was possible to do this comparison on individual samples, without
taking into account the actual sample amount, but ensuring the signals
for both modes were not near their limits of detection. In doing this
comparison, it was determined that the integrated area ratios,
(M+H) /(M-H)~, were very dependent upon the tuning of the ion optics,
varying from 0.4 to 1000 for seven different tunings and measurements.
In general, when the optics were tuned for the "best" sensitivity of
each of the ionization modes for the ions of perfluoro-tri-N-butylamine,
a mass calibration compound, PCI was more sensitive than NCI for TLN-
HCl, with (M+H) /(M-H)~ ratios averaging approximately 60. In addition,
in order to have good sensitivity with SRM, it is necessary to have a
good yield of the characteristic daughter ion from the characteristic
parent ion. From Tables 3-5 and 3-9, it can be seen that the (M+H)*
ions of all the tryptoline-HCl salts fragment to give higher yields of

52
their characteristic daughter ions than do the corresponding (M-H)~ ions
under the same, relatively harsh, CAD conditions. Therefore, PCI was
chosen as the preferred ionization technique due to its greater sensi-
tivity. However, NCI could offer an advantage with regard to selecti-
vity. In analyzing complex mixtures directly, many components which
lack electrophilic atoms are transparent to NCI , and thus chemical
interference at the m/z of interest may be reduced. With methane's
nearly universal protonating ability, however, almost all mixtures
components are ionized. Due to the quantitative results below, however,
NCI was not further investigated.
PCI-CAD collision energy . It has already been mentioned, that in
order to obtain high sensitivity with SRM, it is necessary to have a
good yield of a characteristic daughter ion from the characteristic
parent ion of the analyte. The yield of daughter ions is very much
dependent upon the collision energy and the collision gas pressure. The
former parameter determines the energy which will be transferred to the
parent ion during a collision, and thus the internal energy available
for bond cleavage and daughter ion formation. The latter parameter is a
measure of the number of collisions that a parent ion (and/or its
daughter ions) will undergo in the transit of the collision region.
Thus, it is important to optimize these parameters for the compounds of
interest. The optimization of the CAD conditions was performed in two
different manners. In the first study, the collision energy was varied
during the vaporization and ionization of TLN-HCl from the solids probe,
while obtaining daughter spectra over a limited mass range (m/z 140 to
m/z 176). The variation with collision energy in the ratio of the
intensities of the major daughter ion at m/z 144 and the parent ion at

53
m/z 173 revealed an optimum collision energy of 28 eV for the (M+H)'*' to
(M+H-29) reaction (Figrore 3-2). However, the variation in the ion
intensity ratios does not reveal any scattering losses of the parent and
daughter ions. The presence of such losses would result in loss of
sensitivity. In order to evaluate this aspect, a second collision
energy study was performed with gas chromatographic introduction of TLN-
HCl. The variation with collision energy of the GC peak areas of TLN-
HCl resulting from the SRM of (M+H) to (M+H-29) was then obtained
(also in Figure 3-2). From this study, a collision energy of ca. 22.5
eV was determined to be optimal for this reaction. The decrease in peak
area following the maximum In both graphs may be due to focusing, scat-
ter, or an increase in the yield of other daughter ions at the expense
of the daughter ion of interest. As a compromise between the two
methods, 26 eV was chosen as the collision energy to be used in the PCI-
SRM studies.
PCI-CAD collision gas pressure . Similar studies were performed for
the optimization of collision gas pressure for maximum CAD sensiti-
vity. With the use of the solids probe for sample introduction, a large
increase is seen in the 144 /1 73 ratio in going from 0.7 to 2.1 mtorr
H- (Figure 3-3). With the chromatographic sample introduction, the peak
area increases to a maximvim as the collision gas pressure is increased,
and then begins declining (Figure 3-3). This decline in peak area is
most likely due to scattering losses of the parent ions. Although 4.0
mtorr N- was apparently the optimum pressure for the highest sensi-
tivity, it was felt that operating the instrument at such high collision
gas pressures for long periods of time might be detrimental to the
vacuum system. Therefore, a collision gas pressure of 2.0 mtorr N_ was
selected for PCI-SRM assays for the tryptolines.

54
100 -I
80 -
10
c•H 60 -
eX 40
s
20 GC Peak Area
—I—
10
r I
12 14
I I
16 18
II
28 308 10 12 14 16 18 20 22 24 26
Collision Energy (eV, Q2 offset)
Figure 3-2. Optimization of the PCI-CAD collisionenergy for TLN-HCl.
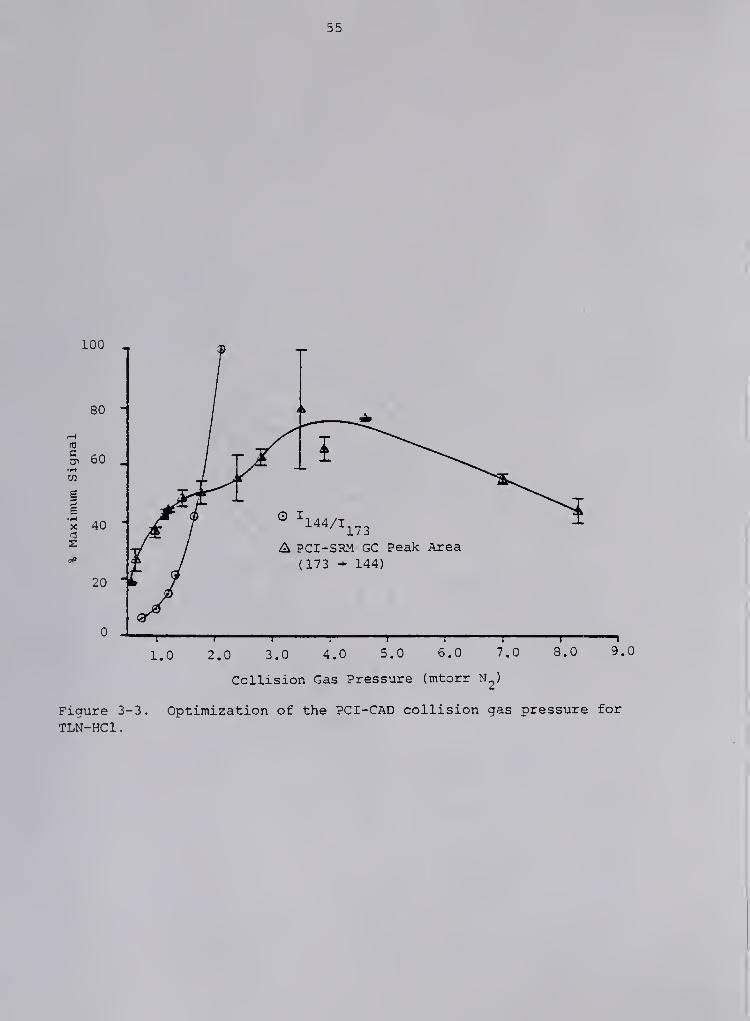
55
100
80 -
10
& 60
X 40
20
2.0 3.0 4.0 5.0 6.0 7.0
Collision Gas Pressure (mtorr N^)
Figure 3-3. Optimization of the PCI-CAD collision gas pressure for
TLN-HCl.

56
Quantitative Studies
With the short, packed GC column operated at the conditions used in
the optimization studies, it was possible to get retention times for
TLN- and MTLN-HCl of ca. 10 s. This allowed very rapid analyses of many
samples much more conveniently than could be done by the solids probe
(ca. 5 min per sample, typically). However, the GC peaks of the trypto-
llnes exhibited extreme tailing, most probably due to solute interac-
tions with the stationary phase and, especially, with the active sites
on exposed hot metal in the GC/MS interface. This extreme tailing was
not a large factor in the studies above, as the large levels of trypto-
line used gave very high signal-to-noise ratios (S/N). However, the
adsorption problem might become the limiting factor for trace
analysis. Therefore, quantitative studies were performed by vapori-
zation of the samples from a glass vial inserted in a heated solids
probe.
In the PCI-SRM analyses, the most abundant and characteristic PCI
ion of an analyte is selected as a parent ion by Q^ , fragmented in Q2
,
amd only the most abundant daughter ion is monitored by Q3. Thus, for
PCI-SRM quantitation of TLN-HCl and MTLN-HCl, the reaction of their
(M+H) ions, m/z 173 and m/z 187, respectively, yielding the m/z 144
daughter ions, was monitored. The quantitation signal was obtained by
integrating the ion current over the time during the vaporization of the
analyte. The limit of detection (LOD) was defined as the amount of
sample necessary to give a (S/N) of 3. The responses obtained from
three solvent blanks were averaged and used as the chemical noise level.
The results of the assay of a series of standard TLN-HCl and MTLN-
HCl solutions (Figures 3-4 and 3-5, and Tables 3-10 and 3-11) were used

57
to construct calibration curves (Figure 3-6). These calibration curves
of the two tryptolines are very similar to each other, as would be
expected from their chemical similarity. From all three figures, it can
be observed that no discemable signal representative of the tryptolines
occurs until the nanogram region is reached, whereupon the signal rises
rapidly with increasing amounts of tryptolines. As more concentrated
solutions were not analyzed, it was not possible to assess the linear
dynamic range of the technique. The lack of reproducibility of the
solids probe quantitation is reflected by the relative standard devia-
tions of the integrated signals varying from +20 to +52 % for the trip-
licate analyses having S/N ratios greater than 3, Most of the lack of
precision is probably due to the process of injecting and drying the 1 .0
jjL samples in the 5 yL sample vials. During this process, it was impor-
tant to ensure that no air bubbles were enclosed in the sample solution,
so that uniform drying would occur. In order to do this, it was neces-
sary to "jiggle" the syringe needle in the sample solution until the air
bubbles were excluded. However, this could have resulted in the drying
of some of the analyte on the needle and its subsequent removal. With
this amount of variability, the need for incorporating an internal
standard for reliable quantitation is apparent.
In Figures 3-4 and 3-5, some of the analyte peaks are split or have
shoulders on their leading edges. Based upon mass spectrometric evi-
dence, this is not due to a separate component in the sample. Rather,
it is most likely due to the uneven drying of the sample on different
portions of the sample vials. As the vial is not heated evenly, this
may lead to differential vaporization of the sample. An additional
source of this peak splitting may be the interaction of the sample with
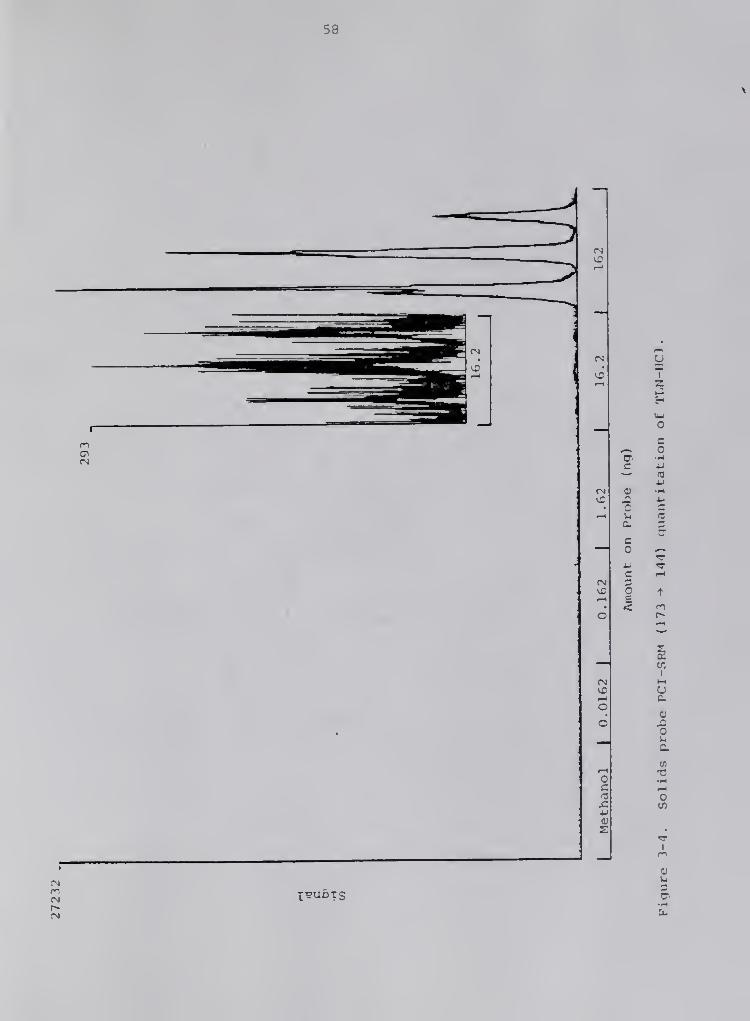
58
VC
z
C-~ o
c -u~ (04-1
0) -H^ JJ
c cu ma. 3
c
c3CE<
^^
oo
cm
4J
0)
I
»->
uc
ctn
en
I
X^UDTS
0)
u

59
T
7•z.
S
u
(0
3
c --
oc
0)
oo X^uBts
CO
wIMUa.
o
tn
C/l
inIo

60
I- o
- O
- o
u =~ z
.JC-,
I
z
O -^
()
c
aem
c
o
<
I-> « , I
^
(s:^.unoo) jsubTS pa'^eaBaq.ui
usI
zJ
-oc
yI
2h-l
fr'
U-i
co-H4J(0
4J•HUc
3cr
wIMU
<u
O
Ck
U)
T3 •H ^•-* C
(TJ
01 r-i
0)
J= i-t
•W Oc
x:Uj 4-1
0)
w 60)
> (0
U J=3 -UU
co
u
(U
(n
coQ.U)
<u
u
I Ul
ro 0)4J
<U
1^ C3 0!
cr T3•Hh 03

61
Table 3-10. PCI-SRM (173"^ — > 144*) solids probe quantitation of TLN-HCl.
Amount on orobe a +I (144 )
Mean
I^ (144"^) + %RSD^ S/N^
Blank
1 .62 fg
16.2 fg
162 fg
1 .62 pg
16.2 pg
162 pg
1 .62 ng
16.2 ng
162 ng
7.8

62
Table 3-11. PCI-SRM (la?"^ — > 144"^) solids probe quantitation of MTLN-HCl.
Mean
Amount on
63
the glass wall. The sample not adhering intimately to the wall may be
vaporized first, with hotter temperatures being necessary to vaporize
the layer of sample which is interacting with the "active sites" of the
glass wall.
From the definition of the limit of detection above, the limits of
detection were calculated to be approximately 17 ng for tryptoline-HCl
and 13 ng for methtryptoline-HCl on the probe. Tryptoline has been
reported to be present in whole rat brain at levels ranging from 400
pg/g to 40 ng/g of tissue (51,53,56,59), while methtryptoline has not,
as of yet, been reported to be present in brain tissue. As a typical
rat brain weighs ca. 2 g, these LOD's are too high to provide reliable
identification and quantitation of the tryptolines which may be present
in individual rat brains. It should be possible, however, to determine
the tryptolines in the brain homogenates pooled from several rats.
However, much of the biological significance as to individual variation
would be missing in this case.
Conclusion
In conclusion, it has been shown that the LOD's of PCI-SRM with
solids probe sample introduction are not low enough for the determina-
tion of underivatized tryptolines in individual rat brain extracts. It
should be possible, however, to use this technique with brain homo-
genates pooled from several rats. With pooled brain homogenates, this
technique would eliminate to a large degree the extensive sample clean-
up procedures which have been necessary for other methods of analysis
and thus, reduce the possibility of artefactual tryptoline formation.
In addition, the structural characterization possible with EI-CAD, PCI-

64
CAD, and NCI-CAD would allow much easier mass spectral structure eluci-
dation of any unknown tryptolines, once isolated.

CHAPTER 4
TANDEM MASS SPECTROMETRY FOR THE IDENTIFICATION ANDQUANTITATION OF TRYPTOLINE-HEPTAFLUOROBUTYRYL DERIVATIVES
Tryptoline-HFB Derivatives
Tryptoline has been reported to be present at the ng/g and pg/g of
tissue level in brain extracts (51,53,54,56,59), while the presence of
the other tryptolines studied in Chapter 3 has not, as yet, been
reported in rat brain. Thus, in order to be able to investigate the
tryptoline levels in individual rat brains, it is necessary to have a
very sensitive and selective detection method. In the previous chapter
it was determined that the limits of detection of solids probe PCI-SRM
of the underivatized tryptolines were not low enough to accomplish this
goal. Derivatization of the tryptolines is an efficient and straight-
forward method to enhance their chemical ionization sensitivity. Hepta-
fluorobutyryl (HFB) derivatization of the tryptolines has been shown to
give greatly enhanced sensitivity and lower limits of detection than
reported for the underivatized tryptolines in Chapter 3 (33,53-
56,59,101). In addition to increasing the sensitivity, HFB-derivati-
zation improves the chromatographic properties of the tryptolines.
Thus, with chromatographic introduction, an increase in the rate of
sample introduction into the ion source per unit time might be realized,
leading to a narrower, taller peak, a greater S/N ratio, and a still
lower LOD. In addition, the speed of analysis may be substantially
increased through the use of very short packed columns operated to allow
65

66
very short retention times of the analyte with minimal chromatographic
separation (85). Rather than use long chromatographic separations,
component separation and subsequent quantitation and identification of
the tryptolines could be performed by MS/MS.
Thus, in this chapter the HFB-derivatives of the tryptolines (Table
4-1) will be studied by GC/MS and GC/MS/MS . The effects of source
temperature and CAD conditions and their optimization will be discussed
with regard to the sensitivity of the methods. Quantitative comparisons
are made between methane positive and electron-capture negative CI and
between selected ion and selected reaction monitoring with a 0.4 m
packed column and a 18 m bonded phase fused silica capillary column. A
practical application is shown for the determination of tryptoline in a
HFB-derivatized crude extract of a rat brain.
Experimental
Materials and Reagents
All chemicals and reagents were of the highest purity available.
The standards of the tryptoline-HFB derivatives were )cindly supplied by
Kym Faull, Ph.D., and Jack Barchas, M.D. (Department of Psychiatry and
Behavioral Sciences, Stanford Medical Center, Stanford, CA) . Their
synthesis is detailed elsewhere (59). The HFB-derivatized crude
extracts of rat brains were also supplied by Kym Faull and Jack Barchas
and their preparation is described below. Aqueous solutions were pre-
pared in doubly distilled deionized water. Ultrahigh purity methane
(Matheson, Morrow, GA) , helivun, and zero grade nitrogen (Airco
Industrial Gases, Research Triangle Park, NC) were used as a CI reagent,
GC carrier, and collision gas, respectively.

67
HFB
Table 4-1. Characteristics of the HFB-derivatives of the
tryptolines of interest.^
Molecular weight
Compoiind
TLN-HFB
MTLN-HFB
CH3O-TLN-HFB
HTLN-HFB
HMTLN-HFB
HTLN- ( HFB
)
^
HMTLN-{HFB)2
R'

68
Preparation of Extracts
Male rats (Sprague-Dawley , Simonaon Labs, CA) were stunned with a
blow to the head and quickly decapitated. The brains were rapidly
removed, weighed, and homogenized in ice-cold perchloric acid (0.4 M, 5
mL/g of tissue). After centrifugation (15000 g, 20 min) the supernatant
was adjusted to pH 3 with 1 N NaOH and passed through a C-18 reverse
phase Sep-PAK» cartridge (Waters Associates, Milford, MA) which had been
previously washed with acetonitrile (2x5 mL) and water (2x5 mL)
.
The cartridge was then washed with water (2 x 500 uL) and eluted with
acetonitrile (3 x 500 u^). The solvent was removed from the eluate in a
stream of nitrogen and the residue was washed to the bottom of the
collection tubes by the addition of acetonitrile (100 yL) which was also
removed in a stream of nitrogen. The samples were then ready for chem-
ical derivatization. The Sep-PAK cleanup procedure gives recoveries of
added tryptolines of between 65 and 97% (59).
Chemical Derivatization (53)
The authentic compounds and dried extracts were treated with hepta-
fluorobutyrylimidazole (Regis Chemical Co., Morton Grove, XL; 100 yL,
80 "C, 60 min) after which methylene chloride was added (2 mL) . The
solution was then extracted with water (four times with 2 mL each time)
using centrifugation to separate the phases. The aqueous layers were
discarded and the methylene chloride was evaporated in a stream of
nitrogen. The dried residue (equivalent to ca. 500 mg of tissue for the
brain extracts) was redissolved in ethyl acetate or methanol prior to
injection onto the GC column.

69
Instrumentation
All data were collected with a Finnigan MAT (San Jose, CA) triple
stage quadrxapole GC/MS/MS equipped with a 4500 series ion source, pulsed
positive and negative chemical ionization, and INCOS data system. The
Finnigan 9610 gas chromatograph was equipped with packed and Grob-type
capillary column injectors.
Samples were introduced into the ion source by either an 18-m DB-5
bonded-phase fused silica capillary column (compliments of J & W
Scientific, Rancho Cordova, CA) inserted directly into the ion source or
a short (38 cm x 0.75 mm i.d.) packed glass column, described more fully
in Chapter 3. The capillary column was operated with a Grob-type split-
less injector using a carrier gas split of 40 mL/min and a septvim sweep
of 9 mL/min; both were closed for 1 min following injection. The GC
oven was held at 100 "C for 1 min following injection and, thereafter,
increased linearly at a rate of 15 °C/min to a maximum of 275 "C. These
conditions resulted in retention times for the tryptoline-HFB deriva-
tives in the 9-13 min range. The short glass column was used for rapid
sample introduction and provided minimal chromatographic resolution
(retention time for TLN-HFB of ca. 55 s) . The glass column was sila-
nized with a 10 % solution of dimethylchlorosilane in toluene prior to
manual packing with 3% OV-101 on 80/100 mesh Chromosorb 750. The GC/MS
interface consisted of a glass-lined stainless steel tube direct inlet
fitted with a microneedle valve. The interface and injection ports were
maintained at 250 'C and 275 "C for packed and capillary column work,
respectively. In the EI mode helium was used as the carrier gas. In
the CI mode methane was used as a combined carrier/reagent gas. With
the packed column CI analyses, the carrier gas flow was set to 10 mL/min

70
CH4. The capillary column CI analyses were conducted with an average
linear velocity of ca. 50 cm/s CH^ (at 275 'C). Additional methane was
added in both cases as makeup gas to give the required ion source pres-
sure,
Procedures
Mass spectra of standards. Standards were introduced on the capil-
lary column and the CI (100 eV electron energy, 1.0 torr CH source
pressure) and EI (70 eV electron energy) mass spectra were obtained with
an ion source temperature of 100 'C in the Q3 normal MS mode. The
effect of the ion source temperature on the fragmentation pattern of the
heptafluorobutyryl derivatives of the tryptolines was studied with
temperatures between 80 and 190 'C. Daughter spectra of m" and (M-HF)'
and (M+H) ions were obtained at collision gas pressures of 1.0 and 2.8
mtorr Nj and collision energies of 20 and 26 eV (Q2 offset) for negative
and positive CI, respectively. The mass spectra acquired during the
elution of each GC peak were averaged and background subtracted to yield
a representative mass spectrum of each standard.
Collision energy and collison gas pressure studies . For each
combination of collision energy and collision gas pressure, duplicate
1 .0 uL injections of a standard solution of TLxN-HFB were made onto the
packed GC column (200 "C isothermal, source temperature at 190 "C). The
GC peak areas resulting from the PCI-SRM of 369"" to 156"" and the NCI-SRM
of 348 to 179 were determined with the data system. The collision
energy studies were conducted at collision gas pressures of 1.5 and 1.7
mtorr N2 for positive and negative CI-SRM, respectively. The collision
gas pressure studies were conducted at collision energies of 25 and 13
eV for positive and negative CI-SRM, respectively.

71
Selected ion and selected reaction monitoring . All SIM experiments
were conducted in the Q3 normal MS mode. The SRM experiments were
conducted in the daughter scan mode with collision gas pressures of 1 .0
and 2.8 mtorr N2 and collision energies of 20 and 26 eV for negative and
positive CI, respectively. The SRM daughter and the SIM ions were
scanned over a 1 u wide window at 10 Hz. The ions and reactions moni-
tored are listed in Table 4-2.
Quantitative studies . Serial dilutions were made of TLN-HFB with
methanol to give solutions with concentrations ranging from 2.0 pptr to
200 ppm. In two separate studies, triplicate or single 1 .O-yL injec-
tions were made of each standard onto the packed GC column (175 "C
isothermal, giving a retention time of ca. 55 s for TLN-HFB). Quantita-
tion was performed under the CI-SIM and CI-SRM conditions above with a
source temperature of 100 "C, and an electron multiplier voltage of 1800
—8V with a preamp sensitivity of 10 A/V. The areas of the TLN-HFB GC
peaks were determined by use of the current data system software and are
reported in units of data system counts. Similar analyses were also
done for quantitation of the crude brain extracts containing added
amounts of TLN-HFB. With the capillary column, a single 1 .0-yL split-
less injection of each sample was made and quantitation was accomplished
as for the packed column. The reproducibility of the capillary column
was studied by measuring the peak areas of 6 replicate 1.0 yL injections
of 2 different TLN-HFB standards with an electron multiplier voltage of
—81300 V and a preamp sensitivity of 10 A/V.

72
I
M
•8
5
n0)
0)

73
Results and Discussion
Structure of the Tryptoline-HFB Derivatives
The derivatization of the tryptolines by heptafluorbutyryl imida-
zole under the experimental conditions used here resulted in the forma-
tion of a single mono-HFB derivative of each of the nonhydroxytrypto-
lines and a single di-HFB derivative and a single mono-HFB derivative of
each of the 5 -hydroxytryptolines as determined by capillary GC/MS
(Tables 4-1, 4-3, 4-4, and 4-5). The relative amounts of the di-HFB and
mono-HFB derivatives of the hydroxytryptolines varied, presumably de-
pending upon the experimental conditions. Based upon the mass spectral
evidence below and that of others (33,53,55,59,101), the mono-HFB deri-
vatives of the tryptolines have the HFB group replacing the hydrogen on
the piperidine nitrogen. For the 5 -hydroxytryptolines di-HFB deriva-
tives, the HFB groups have replaced the hydrogens on the piperidine
nitrogen and the phenolic oxygen. No evidence was observed for the
replacement of the indolic nitrogen's hydrogen.
Mass Spectral Characteristics
EI normal mass spectra . The EI mass spectra of the tryptoline-HFB
derivatives show prominent molecular ions and relatively abundant (M-
225) fragment ions (Table 4-3). These fragment ions presumably arise
by loss of a CH^NCOC^F^ group from the piperidine ring. In addition,
the 9-me thy1- tryptoline-HFB derivatives show an abundant fragment ion
(M-15) . presumably due to the loss of the methyl side chain group. The
mass spectra of the di-HFB derivatives of HTLN and HMTLN, although
having prominent molecular ions, are dominated by the uncharacteristic

74
fragment ion at o/z 69. presumably (CF3)*. As in the underivatized
tryptolines, there is again extensive fragmentation of the molecular
ions. As it was desired to analyze samples with minimal, if any chroma-
tograpic separation, it was necessary to use the softer chemical ioni-
zation to reduce the fragmentation of all components of the extracts.
Thus, there would be less chemical noise at the m/z of the ions of
interest.
PCI normal mass spectra . The methane PCI mass spectra of all the
HFB derivatives are dominated by the protonated molecules (M+H)*, and
the methane adduct ions, (M+29)* and (M+41 )* (Table 4-4). The only
significant fragment ions seen in the spectra of the mono-HFB deriva-
tives correspond to (M+H-HF)"^. The di-HFB derivatives of HTLN and HMTLN
undergo much more fragmentation than do the mono-HFB derivatives. The
fragment ions at (M+H-ISS)"^ are most likely due to the protonation of
the phenolic-HFB group and subsequent loss of C F^CHO from the (M+H)"^.
The other fragment ions are characteristic of the HFB groups, and there-
fore not specific for the tryptolines: Ions at m/z 215, m/z 199, m/z
179, m/z 161, and m/z 141 presumably correspond to (C3F C{OH) )''',
(C^PyCHOE)*. (C^F^COH)"^. (C^F^CHOH j"". and (C^F^CHO)", respectively.
NCI normal mass spectra . In contrast to PCI, the methane electron-
capture NCI mass spectra (at a source temperature of 100 'C) of the
derivatives yield molecular ions in relatively low abundance and show
extensive fragmentation (Table 4-5). The most abundant ion in the NCI
mass spectrum of each mono-HFB derivative and HTLN- (HFB) 2 ^3 <3ue to the
loss of HF from the molecular ion, with less abundant ions being due to
successive losses of P and HF. Although the (M-HF)" ion is abundant in
the NCI mass spectrum of HMTLN- ( HFB)2 , the most abundant ion corresponds

75
to (M-198)", which is also a major fragment ion of HTLN-(HFB)2. This
loss of 198 u is most probably due to a hydrogen rearrangement and
subsequent loss of C^F-CHO from the phenolic portion of the molecular
Ion. In addition, all of the tryptoline-HFB derivatives yield rela-
tively abundant ions at m/z 179, (C3FgHC0)", and m/z 178, (C3F CO)",
attributable to the heptafluorobutyryl portion of the molecule. For the
NCI-SIM experiments, the most abundant and characteristic ion in the CI
mass spectrum of each of the tryptoline derivatives is selected by Q3
for monitoring. Although the (M-198)~ ion is the most abundant ion in
the NCI of HMTLN-CHFB)^, the more characteristic (M-HF)" ion was chosen
for SIM. This would allow direct comparison to the SRM experiments
below.
PCI-CAD daughter mass spectra . The PCI-CAD daughter spectra of
HTLN-(HFB)2 and HMTLN-tHFB)^ were inadvertently not acquired. The PCI-
CAD daughter mass spectrxim of the (M+H) ion of each of the derivatives
is dominated by the daughter ion resulting from the loss of 213 u
(either NH2COC F or HN=COHC F ) from the protonated molecule; as such,
this ion is characteristic of the parent tryptoline structure (Table 4-
6). This characteristic loss from (M+H) could be utilized in the MS/MS
neutral loss mode to screen for other possible tryptolines and compounds
with a similar derivatized amine structure. In addition, other, less
abundant daughter ions were present and were useful structurally. Thus,
a loss of the entire HFB group from the (M+H) ions of the mono-HFB
derivatives resulted in daughter ions of low abundance corresponding to
the parent tryptoline structures at (P-IS?)*. Daughter ions reflecting
the R' and R" substituents also resulted with HTLN-HFB and HMTLN-HFB
losing H2O from their (M+H) ions, while the mono-HFB derivatives of
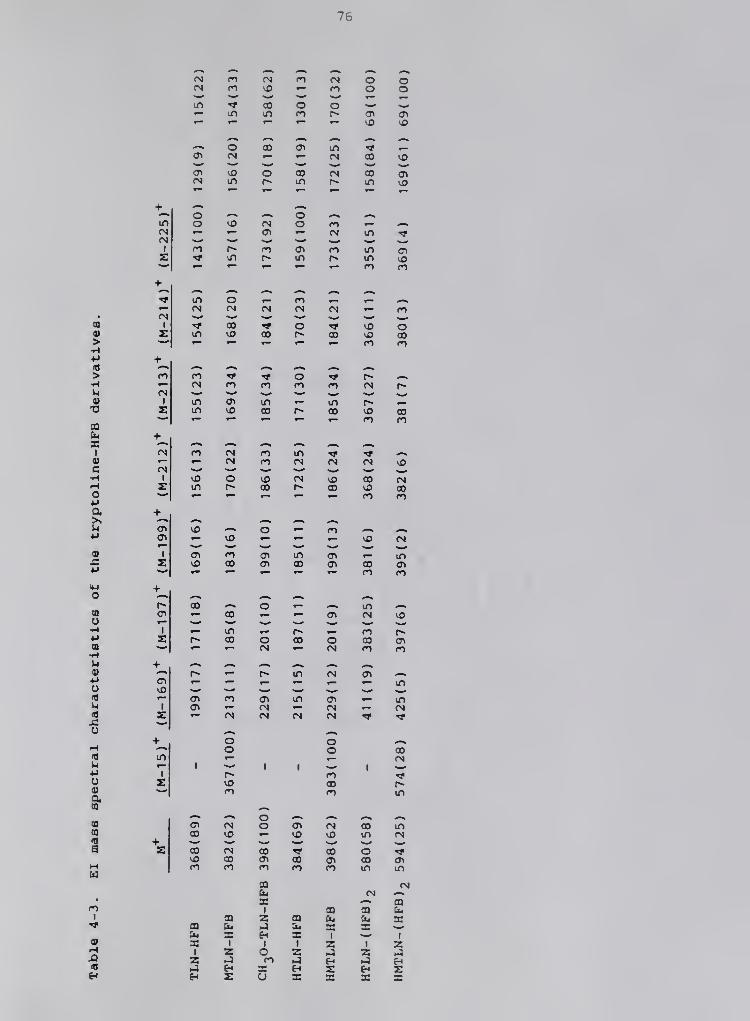
76
<N fO <N n (N o ofN m vo •- ro o Oin ^ CO o o ^' ^^»- in in m r*- o\ o\t- ^ ^ ^ ^ lO vO
'— o CO <Ti in ^ ^0^ <N ^ ^ (N 00 vO
a< \D o 00 <N 00 a\<N in r^ in r~ in vo
+ -^
SI
M
s
O4J
O
u4J
4ios
3o
I
-^

77
CQ
>•H4-)
«>•H
-o
09
aI
<o
c
o
a,
9)
5<4-l
(Q
+
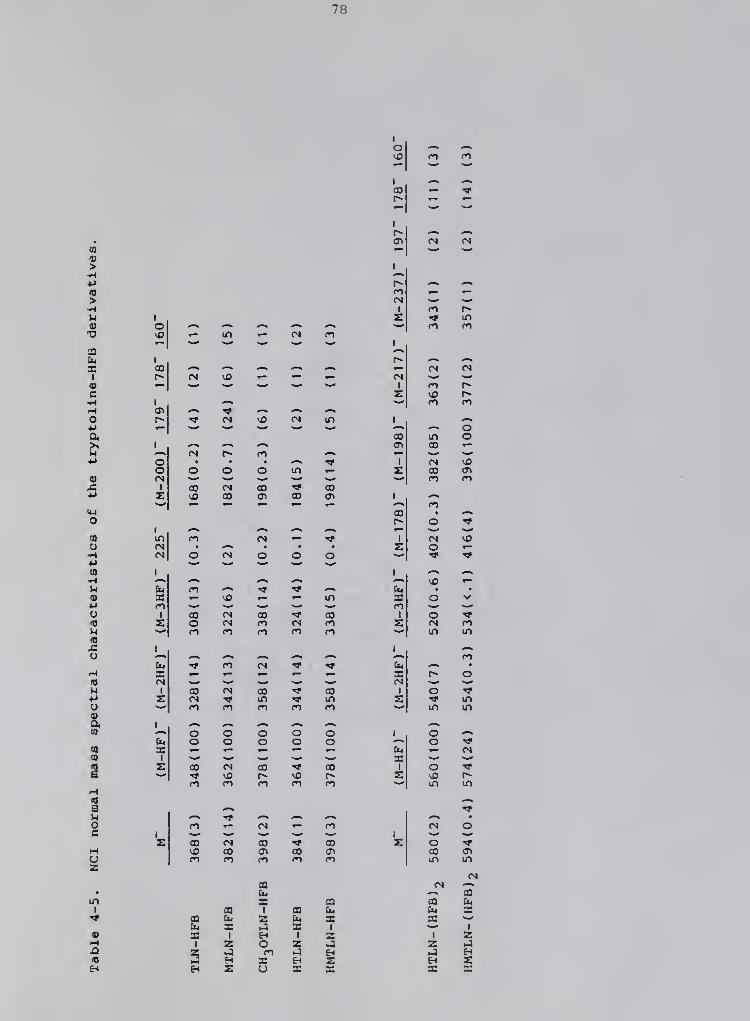
78
I
om fo
CO
t
U•8
e»«
o44Oi
I%*o
ao
oS
(N (N
3
I
a
o

79
MTLN, CH3O-TLN, and HMTLN all show loss of CH from their (M+H)"^ ions
and their [(M+H)-213] ions. The (M+H)"*" ions of the nonhydroxy- and 5-
hydroxytryptoline derivatives fragment by loss of of R"CH=NCOC,F_ to
yield daughter ions at m/z 144 and m/z 160, respectively. The daughter
ion at m/z 173 in the CH2O-TLN-HFB spectrum may also correspond to such
a loss.
NCI-CAD daughter mass spectra . The NCI-CAD daughter spectrum of
each M~ ion is dominated by the daughter ion at m/z 225, (CH NCOC F_)"
(Table 4-7). This ion corresponds to the prominent neutral fragment
loss from the molecular ions in the EI mass spectra to yield the ions at
(M-225)'^ (Table 4-3). This NCI-CAD daughter ion could be used in the
MS/MS parent scan mode to screen for other compounds in the brain ex-
tract having a derivatized CH^-NH substructure. The mono-HFB deriva-
tives of HTLN and HMTLN yield, in addition to the m/z 225 ion, prominent
(P-200) daughter ions which could result from the combined loss of HF
and ^'^2^6^2^^^ from the M~ parent ion. This is supported by the abun-
dant {P-iaO)~ daughter ions in the NCI-CAD of their (M-HF)~ fragment
ions (Table 4-8). The NCI-CAD daughter ion mass spectra of the (M-HF)~
ions of the non-hydroxytryptoline-HFB derivatives are dominated by the
ion at m/z 179 corresponding to the (C FgOH)~ fragment of the deriva-
tizing group (Table 4-8). Even though this ion is of low mass and low
diagnostic value per se , selectivity is maintained in the MS/MS-SRM
experiments due to the genetic relationship to the (M-HF)~ ions.
Although the (M-HF)~ ions of HTLN-HFB and HMTLN-HFB yield abundant 179~
daughter ions, the most abundant daughter ions, (P-180)~, are presumably
due to the loss of (C^F^H_CO). The (M-HF)" ions of HTLN-(HFB)-, and
HMTLN-(HFB)2 yield, in addition to the abundant 179" ion, two prominent

80
inin
N
§
+
s
5
O
•U•H*ta
M•
O
s
mMU
a
o

81
o
09
Co
CO
in •- *(N •- »-
(N ~ «-'
(0
o
(Q
U
VO ro ro
«
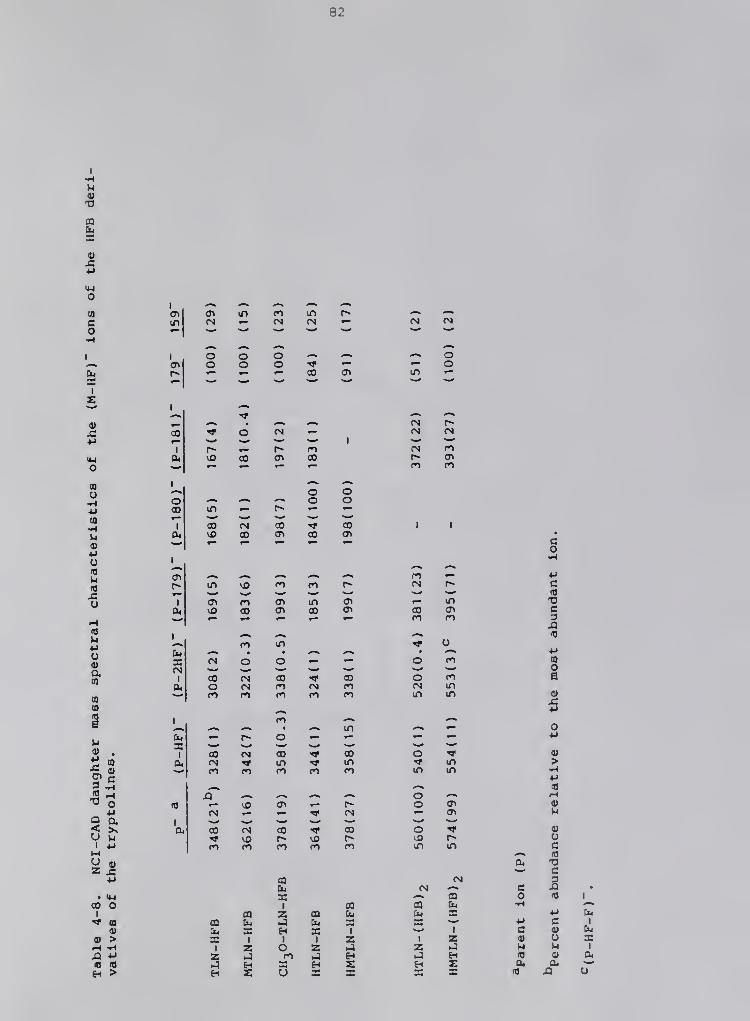
82
I
u•8
I
aCN — (N
in(N <N
I
X
o
u
o
s
u
mu4*o
a
1

83
daughter ions, (P-179)" and (P-181)~, presumably due to the loss of
C^F^HCO and C^F^HCHOH , respectively. The HFB-derivatives of HTLN and
HMTLN are apparently more stable than the nonhydroxytryptolines as
evidenced by the lower yield of daughter ions under the same CAD condi-
tions. This can be attributed to the ability of the phenolic oxygen to
stabilize the negative charge. This stabilizing effect also explains
the large abundance of the (P-180)~ daughter and the (P-179 )~ and (P-
181 )~ daughter ions of their mono- and di-HFB derivatives, respectively.
For the determination of tryptolines in biological extracts by
selected reaction monitoring, maximum sensitivity is obtained by moni-
toring the most abundant daughter ion from the most abundant and charac-
teristic CI parent ion (Table 4-2). Although the 179~ ions are not the
most abundant daughter ions for all of the HFB derivatives of the
hydroxytryptolines, it was chosen for convenience purposes. This would
allow the possibility of using the parent scan of 179~, instead of
several different selected reactions, for screening purposes. The yield
of several daughter ions of high abundances can be exploited by multiple
reaction monitoring (MRM). MRM would improve the selectivity, and thus,
the reliability, of determining the tryptolines without much loss in
sensitivity. In the NCI of HMTLN- (HFB) , the abundance of the (M-HF)"
ion is only about one- fourth that of the most abundant (M-198)~ ion.
However, under NCI-CAD, the most abvindant daughter ion of the (M-198)~
ion represents only ca. 2 percent of the parent ion's abundance, while
the 179~ daughter ion represents ca. 30 percent of the parent (M-HF)~
ion. Thus, for increased sensitivity, the more characteristic, and more
selective (M-HF)~ ion fragmenting to the 179~ ion was chosen for SRM of
HMTLN- ( HFB)2 • Because the derivatives behave in a similar fashion under

84
CI -CAD conditions, and because of our particular interest in the natural
occurrence of tryptollne in mammalian tissues, efforts were concentrated
on this compound.
Optimization of Experimental Parameters
Source tempe ra ture . The relative intensities of the NCI molecular
and fragment ions of TLN-HFB were greatly influenced by the ion source
temperature (Figure 4-1), At a source temperature of 80 "C, the NCI
spectrum was dominated by an intense (M-HF)~ ion with relatively small
contribution from the other ions. As the source temperature was
increased, the amount of fragmentation in the NCI mass spectrum
increased dramatically. In particular, the (M-HF)~ ion decreased from
approximately 67 percent of the reconstructed ion current at 80 "C to
only 9 percent at 190 "C. This would represent a significant loss in
sensitivity in the SIM and SRM techniques (selecting (M-HF)~). This
susceptibility of the fragmentation of these types of derivatives to
experimental conditions in the ion source has been noted previously
(102). In contrast, the PCI mass spectra showed little variability with
source temperature (Figure 4-1). Because it was difficult to repro-
ducibly maintain the ion source temperature below 100 'C and because
contamination of the ion source occurs more rapidly at such low tem-
peratures, subsequent analyses were run with an ion source temperature
of 100 "C.
CAD conditions . In the collisionally activated dissociation pro-
cess, the yield of the daughter ions is very much dependent upon the
collision energy and the pressure of the collision gas, as was demon-
strated in Chapter 3. With NCI-SRM (at a collision gas pressure of 1.7

85
mtorr N2) the GC peak area from injections of TLN-HFB showed a maximum
at a collision energy of ca. 20 eV (Figure 4-2a). At a collision energy
of 18 eV, a maximum GC peak area was observed at a collision gas pres-
sure of ca. 1.0 mtorr N2 (Figure 4-2b) . The decrease in signal after
the maxima is due largely to an increase in the yield of other daughter
ions. With PCI-SRM, the GC peak area showed a general increase in
intensity with higher collision energy (Figure 4-2a) and with increased
collision gas pressure (Figure 4-2b). These results, in conjunction
with those of the ion source temperature study and the characteristics
of the CI spectra, suggest that the PCI ions are much more stable than
are the NCI ions. From Figure 4-2, collision energies of 20 eV and 26
eV and collision gas pressures of 1.0 mtorr and 2.8 mtorr N_ were chosen
as optimum for the negative and positive CI-SRM techniques , respec-
tively.
Quantitative Studies
Standard calibration curves . To compare the sensitivities and
limits of detection of the different techniques, calibration curves were
obtained from analysis of standard TLN-HFB solutions (Figure 4-3). The
calibration curves for all the techniques are summarized in Table 4-9.
The limits of detection were calculated from the calibration data and
corresponded to the amounts of TLN-HFB which would give GC peak areas
three times greater than those obtained with solvent blank. The blank
gave a visible response, presumably due to adsorption on the column and
septum and subsequent desorption by the next injection (59). By fre-
quent replacement of the septum and several injections of solvent
between concentration series, this problem was reduced to a manageable

86
X.
<
c2
OXZ)o(/I
Dia 7o
I
c
u
co
c
<u
c
u34JiQ
lU
E •
<S) m*J c
o
U -u
U -H3 -O
C0)
u
I-,
uu u(U (U
14-i CU 3
IT0)
9

87
<
<
<Ui0.
Li>
^
30.0
COLLISION ENERGY (eV)
100
<UJq:<
UJ 300.
0.0 1.0 2.0
COLLISION GAS PRESSURE (mlorr r4.
i
30
Figure 4-2. Effect of collision energy (a) and collision gaspressvire (b) upon the tryptoline-HFB GC peak areas.

88
degree. The limits of detection thus defined are in the linear portion
of the calibration curves {Figure 4-3). Figure 4-4 illustrates the
method utilized with the short, packed GC column for determination of
the noise and signal levels for the assay of the TLN-HFB standards.
After monitoring the background for approximately 50 s, the filament was
turned off and, simultaneously, 1.0 yL of a standard was injected.
Approximately 10 s later, following elution of most of the solvent, the
filament was turned on again, and monitoring continued. The signal or
GC peak area of the TLN-HFB was determined by integrating the ion cur-
rent above an estimated baseline threshold for a given number of scans,
as shown in Figure 4-4. The noise was determined by a similar integra-
tion over the same number of scans (or a number of scans multiplied by
an appropriate factor to equal the same number of scans) in the back-
ground-monitoring region of the chromatogram prior to injection of TLN-
HFB (Figure 4-4). With the capillary column, the electron multiplier
and filament remained off until approximately 90 s prior to elution of
TLN-HFB. The signal or GC peak area of TLN-HFB and the noise level were
determined as above in the regions of the chromatograms indicated in
Figure 4-5. The signal-to-noise ratio (S/N) of all the limits of detec-
tion ranged from 2 to 6 with the exception of the packed column PCI-SRM
limit of detection which had a S/N of 11 due to a high solvent blank
response. All the calibration curves showed good linearity above their
respective limits of detection for the range of concentrations
studied. The linear portion of the log- log calibration curves of all
the techniques had a mean slope of 1.0 + 5%.
NCI is observed to give significantly better sensitivity and limits
of detection than does PCI for these heptafluorobutyryl derivatives

89
(Table 4-9). This is readily explained by the highly electrophilic
nature of the perfluorinated portion of the derivative and the under-
lying process of electron-capture NCI (94,95). The limits of detection
obtainable with the NCI-SIM and NCI-SRI-l techniques are similar, despite
the significantly greater sensitivity of the SIM technique. The lower
sensitivity of the SRM technique is expected because of the ineffi-
ciencies of the CAD conversion of the parent ion to the daughter ion of
interest and the daughter ion's subsequent mass analysis. However, the
selectivity gained by this parent-daughter reaction reduces the chemical
noise to a greater extent than the analytical signal and compensates to
some extent for the lost sensitivity. This reduction in chemical noise
is apparent in the relative heights of the chromatogram baselines in the
NCI-SIM and NCI-SRM capillary column chromatograms (Figure 4-5). With
the packed GC column, the reduction in chemical noise with PCI-SRM
resulted in it having a limit of detection 13 times lower than that of
the corresponding PCI-SIM (Figure 4-4). The difference in the limits of
detection between the packed column GC techniques and those of the
capillary column techniques may be due to ion optics tuning, conditions
of the injection port and GC columns, and cleanliness of the ion source,
lenses, and quadrupole rods. It was found that the LOD ' s of the tech-
niques could vary by as much as a factor of 10 when obtained on diffe-
rent days. The above should represent what can be expected after
cleaning the instrument and optimal tuning.
The reproducibility of the GC peak areas obtained with the packed
column NCI-SRM for triplicate injections varied from +31 % relative
standard deviation (RSD) near the limit of detection to ±4.5 % RSD at
levels well above the LOD. In a limited study with capillary column

90
2.M

91
00
'3'
XeuB-ps in [buSts

92
3644 tNCISE -E"K ARE-i
9=00 9^20
TIME
9^40 iO^CO
Figure 4-5. Chromatograms showing the method of determining the TLN-HFB
peak areas and noise levels. Injections of TLN-HFB (0.2 pg above) were
made onto an 18 m bonded-phase fused silica capillary column under NCI
conditions. The signals (GC peak areas) were determined by integrating
the ion current above the indicated thresholds over the scans indicated
by the arrows. The noise levels were evaluated similarly for the same
nvunber of scans, as indicated, just prior to the sample peak. (a)
GC/NCI-SIM. (b) GC/NCI-SRM.

93
I
coo
-ou(0
73cig
+j
m
«^o
m
>u
eo
to
ui3
U
4J
OQ
"a•^ Ji
So
P J?
"•3
a• c
a\ oI -H
n« M
« «
3r-t
O
a
•^ 3
oao
aa
Ou
ca3rHou
«
o(0
*^ c•^ 3
CO
a(0
w
ou
ino o
X
o
X(N
O
X
o

94
NCI-SRM, the precision of the GC peak areas for 6 replicate injections
was slightly better, with +10.2 % RSD near the limit of detection and +8
% RSD at a level ca. 10 times higher than the LOD . The use of internal
standards should substantially improve the precision of quantitation.
With regard to speed of analysis, the packed column techniques
offer a definite advantage: with isothermal operation, TLN-HFB has a
retention time of ca. 45 s. With background monitoring prior to injec-
tion, it is possible to meike injections every 2 min. However, with the
capillary column GC techniques, not only does TLN-HFB have a much longer
retention time (ca. 9 min 30 s) but the column must be cooled in order
to start the temperature programming necessary for the splitless injec-
tion technique. Thus, the cycle time between injections is on the order
of 20 rain.
Analyses of derivatized crude brain extracts. The use of a short
packed GC column coupled with selected reaction monitoring was evaluated
for rapid analyses of crude brain extract for trace quantities of the
tryptoline-HFB derivatives. Injections of derivatized brain extracts
(1.0 uL, corresponding to 10 mg of tissue), with emd without TLN-HFB,
were made successively after the return to baseline of the signal due to
TLN-HFB (Table 4-10). The NCI-SRM signal from the extract with 2.5 ng
TLN-HFB is approximately six times less than that for a 2.5 ng stan-
dard. There are undoubtedly a large number of derivatized components in
the brain extract in relatively large quantities. In the CI source
there is a limited pool of thermal electrons which are available for
electron capture (95). Because there is little separation with the
short GC column, the co-elution of electrophilic substances creates a
competition for and a depletion of these thermal electrons by the

95
constituents having a greater electrophilicity and/or are present in
larger quantities- Thus, the signal due to the relatively small amounts
of TLN-HFB is quenched in the NCI techniques, making this approach
unsuitable for analyses with the short GC column.
In contrast, PCI-SRM shows an enhancement of the signal from the
crude brain extract with 2.5 ng of TLN-HFB by a factor of 23 in compar-
ison to the signal due to 2.5 ng of the standard (Table 4-10). This can
be rationalized by the equilibrium which exists in the ion source
between the TLN-HFB molecules, the (M+H)'*' ions (from reaction with
CH '*'), and the M~ ions (from the captxire of thermal electrons). As the
formation of the negative ions is decreased due to the quenching effect,
there are presumably more of the neutral TLN-HFB molecules available for
the formation of positive ions. This enhancement effect may offer a
method of improving the limits of detection of PCI techniques in gen-
eral, especially with the enhanced selectivity of PCI-SRM. By continu-
ously introducing into the ion source a perfluorinated reagent gas, the
negative sample ions can be quenched and the positive sample ions
enhanced. A preliminary study with the mass calibration compound per-
fluoro-tri-N-butylamine has shown a reduction in the packed column
GC/PCI-SRM limit of detection for TLN-HFB standards by a factor of 10.
This is, however, still above the limits of detection necessary for the
determination of TLN-HFB at the sub-ppb level in crude brain extract.
Further analyses were performed with a 18 meter fused silica capil-
lary GC column using a 15 minute temperature program. In t.he positive
and negative CI-SIM analyses of brain extract containing TLN-HFB numer-
ous GC peaks were detected (Figures 4-6a and 4-7a, respectively). With
SRM the number of GC peaks detected has been reduced essentially to that

96
due to TLN-HFB (Figures 4-6b and 4-7b, respectively). These figxires
show that the improved chromatographic separation was not necessary for
increased chemical selectivity, in that essentially the only responses
in the SRM chromatograms were due to TLN-HFB. Rather, the chromato-
graphic separation was necessary in order to reduce the number of elec-
trophilic substances in the ion source during the elution of TLN-HFB,
and thus, to prevent the quenching of the TLN-HFB NCI-SRM signal as was
seen to occur in the packed column work above. The advantage of
GC/MS/MS is more dramatically demonstrated in the NCI determinations of
MTLN-HFB added to derivatized crude brain extract (Figure 4-8). In the
NCI-SIM chromatogram the MTLN-HFB peak is a small shoulder on a much
larger peak (Figure 4-8a). Identification and subsequent quantitation
of MTLN-HFB would be difficult at best. However, with the increased
chemical selectivity of NCI-SRM, identification and quantitation of
MTLN-HFB would be straightforward (Figure 4-8b).
With the reduction of the chemical interferences in the PCI anal-
yses provided by the chromatographic separation of the capillary column
(Figure 4-7a) and the greater sensitivity of SIM over SRM (Table 4-9),
the former would be preferable for the determination of tryptolines in
heptafluorobutyryl derivatized crude brain extracts with methane PCI.
However, even with its decreased limit of detection with the capillary
column (Table 4-9), PCI-SIM does not have the sensitivity to detect the
low picogram amounts of tryptolines which have been found in crude brain
extracts.
Analyses of a derivatized crude brain extract on the capillary
column by NCI-SIM and NCI-SRM showed there to be a GC peak corresponding
to TLN-HFB with peak areas significantly above those of the solvent

97
e
«> 01
a
5
a
m
\u
MO
VO
o4iO
X«
01c
in
U
in
I
2 i" 3
N ^«^5 o
o
O +J
(0 js
iM ta
o oI

98
blank (sample to solvent peak area ratio of 6 and 19 for NCI-SIM and
NCI-SRM, respectively) (Figure 4-9 and Table 4-11). Due to the greater
complexity of the NCI-SIM chromatogram and the high background levels of
the m/z 348~ signal during its elution (as noted in Fig\ire 4-9a), it was
more difficult to discern and quantitate the TLN-HFB peak. The NCI-SRM
analysis, on the other hand, had a relatively low background level for
the 348" to 179~ signal (see Figure 4-9b) and the TLN-HFB peak was
easily discerned and quantitated. Thus, NCI-SRM gives a more reliable
determination of trace amounts of TLN-HFB in crude brain extracts. By
comparing the TLN-HFB peeik area of the crude brain extract with the peak
area of another crude brain extract with 1.4 pg of TLN-HFB and teiking
into account the response of the solvent blank (Table 4-11), it was
estimated that the amount of TLN-HFB detected in the former sample is
approximately 0.4 picogram. This amount would correspond to approxi-
mately 40 pg of TLN per gram of rat brain tissue. In order to obtain a
more reliable determination of the tryptolines present in brain tissue,
further work with internal standards was necessary and is presented in
Chapter 5
.
This is a preliminary determination and serves to demonstrate the
capability of GC/MS/MS to determine femtogram levels of heptafluoro-
butyryl derivatives of the tryptolines in derivatized crude brain ex-
tracts. The controversy over the possibility of artefactual formation
mentioned in the introduction has not been addressed in this study and
must be borne in mind. The work (Chapter 5) with isotopically- labelled
tryptoline precursors will shed more light on this aspect of the tryp-
toline controversy.

99
1300470
n
19584 -I
IQCO 4CC0 SOOO 30CC
SCAN
Figure 4-6. Comparison of (a) GC/NCI-SIM (348) and (b) GC/NCI-SRM(348 -* 179) of derivatized crude rat brain extract with 1.4 pg ofTLN-HFB (indicated by the arrow at a retention time of 9 min 28 s) ^

100
'7056
lOCO •iCCC 6CC0 3CC0 iOCCO
SCAN
Figure 4-7. Comparison of (a) GC/PCI-3IM (369) and (b) GC/PCI-SRM
(369 -» 156) of derivatized crude rat brain extract with 2.5 ng of
TLN-HFB (indicated by the arrow at a retention time of 9 min 28 s)
.

101
o
rs
o.os
oo'OIf)
ooin
oo
oatfO(0CM
"IVN9IS CD
lOlOCM
IVNOIS
4J4-1
>-H
-a
o
co•H-Mc0)p<u
10
m
2 ^
S (U
2 ^en -u
I
M >.U XIzU (U
(0^ uXI -H— T3
CT3 -HC ~-(0
CQ
I
2— iJ£h
S 2MCO M-J
I
MU CP2 O,\u ^u •
fO-' x:
+j4-1 -H
3
c -uc u01 03
•H Vj
U +J
(0 ;<
eo co
<o en
uXi CO
e
I -p^ 03
P 01
3 T3 tTi
CP 3H S-( U-l
t, O

102
500224 -,
<zuM
2512 -,
<2OM
b)
^.->A^*'*4li^
1000 2000 3000 4000SCAN
5000 6000 7000
Figure 4-9. Comparison of (a) GC/NCI-SIM (348) and (b) GC/NCI-SRM(348 -• 179) for the determination of TLN in HFB-derivatized cruderat brain extract.

103
Table 4-11. NCI Analyses of derivatized crude brain extract for thedetermination of tryptoline-HFB .
Technique
NCI-SIM
NCI-SRM
Tryptoline-HFB GC Peak Area (counts)^
Solvent blank Extract
,53.9 X 10"
4.3 X 10"
2.3 X 10
8.3 X 10
1 .4 pg + extract
7.1 X 10^
53.1 X 10"
1.0 uL injections (equivalent to ca. 10 mg brain tissue) were made ofeach sample on a DB-5 fused silica capillary column.
bThe peak areas of the SIM analyses are for single injections of eachsample and those of the SRM analyses are the mean of duplicate injec-tions. The SRM and SIM analyses were conducted on separate days withdifferent electron multipliers and therefore the peak areas are notcomparable.

104
Conclusion
The NCI-SRM technique, with capillary column chromatographic sepa-
ration to prevent the quenching of the NCI signal, appears to be the
method of choice for determining trace levels of tryptolines in hepta-
fluorobutyryl-derivatized crude extracts of rat brain. With this tech-
nique, a preliminary determination of tryptoline in crude extract of a
rat brain at a level of ca. 40 pg tryptoline per gram of brain tissue is
reported. Although the PCI-SRM technique would allow rapid analysis
with minimal chromatographic separation (on a short packed column), it
lacks the sensitivity necessary to detect trace levels of the trypto-
lines.

CHAPTER 5
THE USE OF TANDEM MASS SPECTROMETRY FOR THE IDENTIFICATION AND
QUANTITATION OF TRYPTOLINES IN RAT BRAIN EXTRACTS
In Chapter 4, a GC/MS/MS technique was developed which enabled the
determination of HFB-derivatives of tryptoline standards at the sub-
parts-per-billion level ( femtograms injected). With this technique a
very crude estimation was made of the amount of endogenous TLN in rat
brains. In this chapter, with the use of deuterium-labelled TLN as an
internal standard, TLN is more accurately quantitated in several indivi-
dual rat brains. With the addition of deuterium-labelled tryptamine
(d>-TA) , the presumed precursor of TLN, to two brain samples, an assess-
ment is made of the possibility of artefactual formation of tryptoline
during the sample clean-up procedure. In addition, the capillary column
GC/NCI-SRM technique is extended to GCACI-multiple reaction monitoring
(MRM). In this technique, instead of monitoring a single reaction, Q1
and Q3 are "jumped" between the parent ion and daughter ion, respec-
tively, of the selected reactions characteristic of the analytes. Thus,
the simultaneous screening and semi-quantitation of six compounds (four
tryptolines and their presumed precursor indoleamines. Figure 5-1 and
Table 5-1) are demonstrated in the derivatized extracts of individual
rat brains. This permitted the relative amounts of these compounds to
be studied.
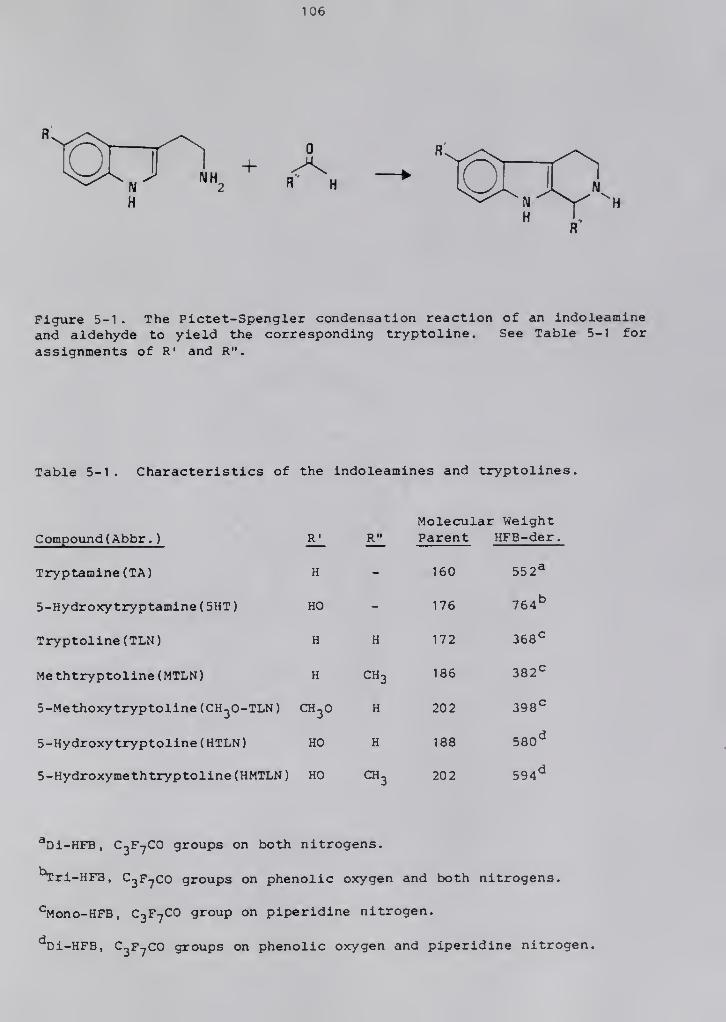
106
-h
H
Figure 5-1 . The Pictet-Spengler condensation reaction of an indoleamineand aldehyde to yield the corresponding tryptoline. See Table 5-1 for
assignments of R' and R".
Table 5-1. Characteristics of the indoleamines and tryptolines.
Compound ( Abbr .
)
Tryptamine(TA)
5-Hydroxytryptamine ( 5HT
]
Tryptoline (TLN)
Methtryptoline(MTLN)
R'
H
HO
H
H
R"
5-Methoxytryptoline(CH30-TLN) CH^O
5-Hydroxytryptoline(HTLN) HO
5-Hydroxymethtryptoline(HMTLN) HO
CH3
H
H
CH,
Molecula

107
Experimental
Materials and Methods
Chemicals and reagents . All chemicals and reagents were of the
highest purity available. Aqueous solutions were prepared in doubly-
distilled, deionized water. Tryptamine (TA) and 5-hydroxytryptamine (5-
HT) were purchased commercially (Sigma Chemical Co., St. Louis, MO, and
Regis Chemical Co, Morton Grove, XL, respectively). Deuterated 5-
hydroxytryptamine was kindly supplied by colleagues at the NIH (to Dr.
Faull) (103). Deuterated tryptamine was purchased commercially (Merck,
Sharp, and Dohme, Canada). The standards of the tryptoline- and in-
doleamine-HFB derivatives were synthesized and kindly supplied by Olof
Beck, Ph.D., Kym F. Faull, Ph.D., and Jack D. Barchas, M.D. (Department
of Psychiatry and Behavioral Sciences, Stanford Medical Center,
Stanford, CA) and their synthesis is detailed elsewhere (59). The
preparation of the extracts of rat brains was also carried out at
Stanford. Ultra-high purity methane (Matheson, Morrow, GA) and zero
grade nitrogen (Airco Industrial Gases, Research Triangle Park, NC) were
used as CI reagent/GC carrier and collision gases, respectively.
Synthesis of standards . Tetradeuterated analogues of tryptoline,
me thtryptoline, 5 -hydroxytryptoline, and 5 -hydroxymethtryptoline were
2prepared from the corresponding (a,a, 3 ,
B- H^) -indoleamines (59). Syn-
thesis of the deuterated tryptolines was carried out on a small scale
(ca. 100 mg starting material), which precluded recrystallizatlon of the
final products. Identity of the deuterated tryptolines was confirmed by
GC/MS of their PFP and HFB derivatives.

108
Preparation of brain extracts . Male rats (Sprague-Dawley.
Simonson
Labs. CA) were sacrificed by decapitation. The brains were rapidly
removed, weighed, and homogenized in ice-cold perchloric acid (0.4 M. 5
mL/g tissue) containing either 1.94 ng of («. a. 8 .B-^H^) -tryptamine (d^-
TA). 229 pg of (2.2.3.3.2h4)-TLH (d,-TLN). or 1140 pg of d^-XLN (Table
5-2). For two rat brains, either 1.94 ng d^-TA or 1140 pg d,-TLN were
added separately after the Sep-Pa)c separation (Samples 8 and 9. Table 5-
2). After centrifugation (15000 g. 20 min) the supernatant was adjusted
to pH 3 with 1 N NaOH and passed through a C-18 reverse phase Sep-Pak
cartridge (Waters Associates. Milford. MA) which had been previously
washed with acetonitrile (2 x 5 mL) and water (2 x 5 mL). The cartridge
was then washed with water (2 x 500 uD and eluted with acetonitrile (3
X 500 uU. The solvent was removed from the eluate in a stream of
nitrogen and the residue was washed to the bottom of the collection
tubes by the addition of acetonitrile (100 yL) which was also removed in
a stream of nitrogen. The samples were then ready for chemical deriva-
tization. The Sep-Pak clean-up procedure gives recoveries of added
tryptolines of between 65 and 97 percent (59).
rh.n,ical derivatization . The authentic compounds (HCl salts) and
dried extracts were treated with heptafluorobutyryl imidazole in benzene
(Regis Chemical Co.. Morton Grove. IL; 50 percent solution in benzene.
100 uL. 85 -C. 60 min) after which methylene chloride was added (3
„i). The solutions were then extracted with water (4 x 2 mL) using
centrifugation to separate the phases. The aqueous layers were dis-
carded and the methylene chloride was evaporated in a stream of ni-
trogen. The dried residues were redissolved in ethyl acetate just prior
to analysis.

109
Table 5-2. Treatment of the individual rat brains.
Brain wet Compound added during
Rat weight (g) sample clean-up
229 pg d^-TLN, during homogenization
229 pg d.-TLN, during homogenization
229 pg d.-TLN, during homogenization
1140 pg d,-TLN, during homogenization
1140 pg d.-TLN, during homogenization
1140 pg d.-TLN, during homogenization
1140 pg d -TLN, after Sep-Pak®
1 .94 ng d.-TA, during homogenization
1 .94 ng d^-TA, after Sep-Pak®
1

110
Gas Chromatography/Tandem Mass Spectrometry (GC/MS/MS)
Data were collected with a Finnigan MAT (San Jose, CA) triple stage
quadrupole GC/MS/MS equipped with a 4500 series ion source, pulsed
positive and negative chemical ionization, INCOS data system, and a
Finnigan 9610 gas chromatograph equipped with a Grob-type splitless
capillary column injector.
Gas chromatographic separations were achieved using an 1 1 m DB-5
bonded-phase fused silica capillary column (compliments of J S W
Scientific, Rancho Cordova, CA) inserted directly into the ion source,
with methane as a carrier gas at an average linear velocity of 63 cm/s,
measured at 275 *C . Injections of 1.0 yL samples were made with a
carrier gas split of 28 raL/min and a septiim sweep of 5 mL/min, with both
closed for 1 minute following injection. For the quantitation of TLN in
the extracts, the GC oven was held at 100 "C for 1 minute following
injection, then increased linearly at a rate of 20 "C/min to a maximum
of 275 "C. Following the reproducibility studies, the assay of the
brain extracts for other tryptolines was conducted with an initial GC
oven temperature of 60 "C. The injection port and interface were main-
tained at 275 'C. These latter conditions resulted in the retention
times shown in Table 5-3.
All mass spectral data were acquired under methane electron- capture
NCI conditions: source temperature of 100 "C, electron energy of 100
eV , emission current of 0.3 mA, and reagent gas of ca. 1.0 torr CH . •
The NCI mass spectra of the standards were acquired in the Q3 normal MS
mode. Daughter spectra of the (M-HF)~ ions of each of the standards
were obtained at the previously optimized CAD conditions (Chapter 4):
collision gas pressure of ca. 1.0 mtorr N2 and collision energy of 20 eV

Ill
Table 5-3. Retention times and selected reactions monitored for theHFB-derivatives of the indoleamines and tryptolines in rat brain extractassays.
Selected ReactionsCompoxind (min: s) Monitored^
dQ-TA-(HFB)2 7:21 532" — > 307
d^-TA-(HFB)2 7:21 536" --> 309"
dQ-S-HT-CHFB)^ 7:19 744" — > 519"
dQ-TLN-HFB 9:06 348~ — > 179"
d^-TLN-HFB 9:06 352" — > 179"
Retention time

1 12
(Q2 offset). The ion optics were tuned to maximize the 169 daughter
ion from the NCI-CAD of 452" of perf luoro-tri-N-butylamine (PFTBA). The
mass spectra acquired during the elution of each GC peak were averaged
and background subtracted to yield a representative mass spectrum of
each standard. For the quantitative assays, the resolution of Q1 and Q3
was adjusted to give approximately a 50% valley of the m/z 220 peak of
the 219/220 pair in the EX-MS of PFTBA. All SIM experiments were con-
ducted with Q3 and monitored the (M-HF)" ions. The SRM experiments were
conducted in the daughter scan mode and monitored the selected reactions
listed in Table 5-3. The SIM ions and the SRM daughter ions were
scanned over a 1 u wide window at ca. 18 Hz. In the assays of brain
extracts, the GC peak areas of the tryptolines' HFB-derivatlves were
determined using the data system and are reported in units of data
system counts (1 count is ca. 1 ion detected, 1800 V on the electron
— 8multiplier with a preamp sensitivity of 10 A/V).
Results and Discussion
Mass Spectral Characteristics
Indoleamines . Derivatization of tryptamine and 5-hydroxy tryptamine
by heptafluorobutyryl imidazole yielded the di- and tri-HFB derivatives,
respectively (Table 5-1 and Figure 5-1). The electron-capture NCI mass
spectra of these compounds are dominated by the (M-HF) ions and ions at
m/z 225 and m/z 178, presumably due to (CH2='NC0C^F^ )" and iC^^Q^'^'^'
.
respectively, with only very weak molecular ions (Table 5-4). The
characteristic (M-HF)~ ions fragment under CAD conditions to yield
several prominent daughter ions (Table 5-5). The most abundant daughter

113
ion of each compound is due to the characteristic loss of 225 u, presum-
ably CH =NCOC^Fy, from the parent ion to yield the ions at m/z 307 and
m/z 519 for tryptamine-{HFB)2 and 5-hydroxytryptamine-(HFB)2 •respec-
tively. In order to achieve the maximum sensitivity and selectivity in
the SRM assays of derivatized rat brain extracts, the fragmentation of
the (M-HF)~ ion to the most abundant daughter ion, (M-HF-225)~, of each
indoleamine derivative was monitored (Table 5-3).
Tryptolines . Heptafluorobutyryl imidazole was employed to convert
the non-hydroxytryptolines to mono-HFB derivatives (with the HFB group
replacing the hydrogen on the piperidine nitrogen) and the hydroxytryp-
tolines to di-HFB derivatives (with the HFB groups replacing the hydro-
gens on the phenolic oxygen and the piperidine nitrogen) (Table 5-1 and
Figure 5-1 ) . The NCI mass spectra of the non-hydroxytryptoline HFB-
derivatives are dominated by the (M-HF)~ ions, with the molecular ions
being present but of low relative abundance (Table 5-4). Although the
(M-HF)~ ions are prominent in the NCI mass spectra of the di-HFB deriva-
tives of the hydroxytryptolines, the most abundant ions correspond to
the (M-198)~ ions, presumably due to the loss of C F_C0H from the phe-
nolic portion of the molecular ions.
The NCI-CAD daughter spectra of the (M-HF)" ions of all the tryp-
tolines are dominated by the daughter ion at m/z 179, presumably
(C^F.HCO)" (Table 5-5). The (M-HF)" ions of the hydroxytryptolines also
yield prominent daughter ions due to loss of 179 and 181 (presumably
r F HCO and C F HCHOH, respectively) from the parent ion. In the assay3 6 3 6
of the brain extracts the selected reactions (M-HF) — > 179 were
monitored (Table 5-3). Although the (M-19a)~ ions are the most
abundant ions in the NCI mass spectra of the hydroxytryptolines' di-HFB
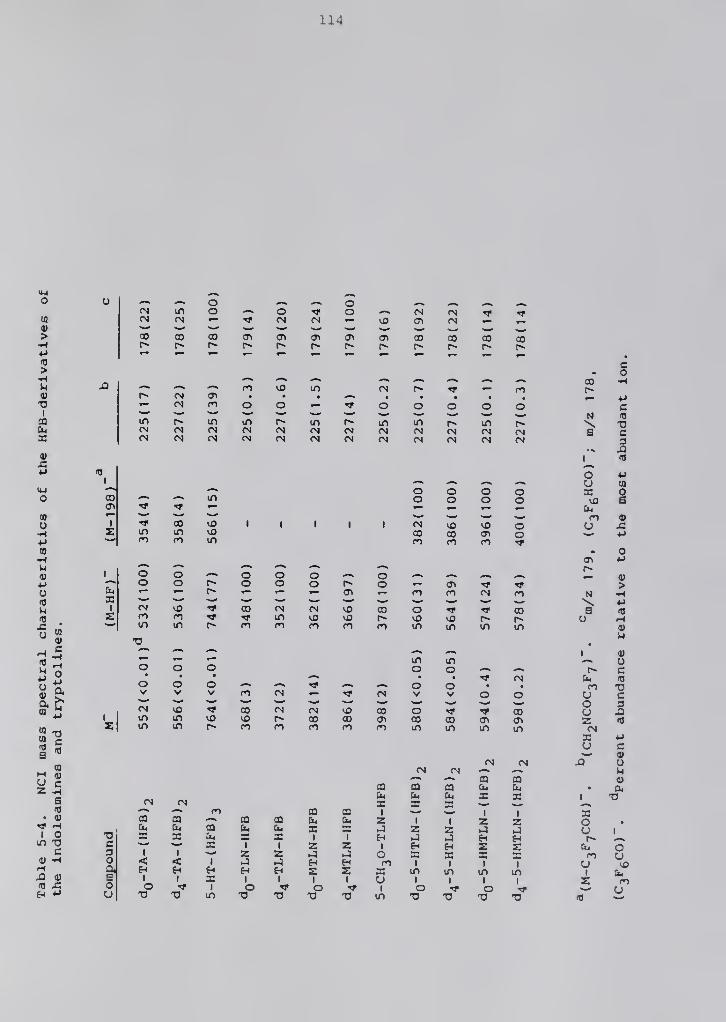
114
<N ino-^0'«i'0-^(N(N'«s'^fl0CO00CTl(TiCT>O^O>00CD0000
'-<Nnoo«— ^ooooo<N<N<NCN<N<N(N(NtN04(Ncs<N<N(NfN<N(N<N<N<N(N(N(N
9

115
v-i ^ —. ooooooooor»n-^ooooooooo8
5

116
derivatives, they did not have a good yield of daughter ions under the
NCI-CAD conditions used here. As the more characteristic (M-HF)" ions
of these derivatives did give good yields of the 179' daughter ion,
these selected reactions were more sensitive and also more selective due
to their higher m/z parent ions.
It is noteworthy that the characteristic fragmentation of the (M-
HF)" ions of the tryptoline-HFB derivatives to the 179' daughter ion
could be advantageously used to screen HFB-derivatized tissue extracts
in the parent scan mode for the presence of unreported tryptolines in
the manner of Perchalski, Yost, and Wilder (104). In the parent scan
MS/MS mode, Ql is scanned over a specific mass range, allowing parent
ions of varying m/z to undergo CAD in Q2 while Q3 transmits only a
specific daughter ion of interest, i.e. 179". Thus, only parent ions
yielding a 179* daughter ion would give a response at the detector.
Identification of these parent ions could then be made from a complete
daughter mass spectrum of each parent ion. Such experiments are cur-
rently underway in this laboratory.
Assay of Derivatized Rat Brain Extracts
With chromatographic separation of the heptafluorobutyryl deriva-
tives of the tryptolines on a fused silica capillary column, it was
possible to obtain limits of detection for TLN-HFB of 500 and 450 femto-
grams injected for NCI-SIM and NCI-SRM, respectively (Chapter 4).
Although both of these techniques have the sensitivity necessary to
detect the trace levels of tryptolines, the added selectivity of MS/MS
increases the reliability of Identification and quantitation of these
trace compounds in brain extracts. Although there is a GC peak at the

117
retention time of authentic TLN-HFB in the NCI-SIM chromatogram of HFB-
derivatized crude extract of a rat brain (Figvire 5-2a), interference
from other unresolved components would lead to difficulty in obtaining
reliable identification and quantitation. However, NCI-SRM was trans-
parent to the interfering components and the well-defined GC peak due to
TLN-HFB resulted in reliable identification and quantitation (Figure 5-
2b). In addition, because of the complexity of the chromatograms which
are obtained in conventional GC/MS, even with SIM, the analyte peak may
be completely obscured by other, coeluting substances. This is dra-
matically demonstrated by the lack of a discernible GC peak for MTLN-HFB
with NCI-SIM (Figure 5-3a). This lack of selectivity in GC/MS may be
one reason why MTLN has not been reported in brain extracts by other
researchers. With NCI-SRM, however, the selectivity was greatly
enhanced and produced a clean chromatogram with an intense GC peeik at
the retention time of authentic MTLN-HFB (Figure 5-3b)
.
Arte factual tryptoline formation . In order to determine if arte-
factual formation of TLN is occurring during the sample clean-up pro-
cedure, 1.94 ng of d^-TA was added to two brain extracts either dviring
the brain homogenization step or after the Sep-Pak extraction (Samples 8
and 9, Table 5-2). With NCI-SRM, the HFB-derivatized extracts of the 2
rat brains were analyzed for the presence of the d^- and d^-isomers of
TA-(HFB)2 and TLN-HFB. In the d -TLN-HFB NCI-SRM chromatograms, there
were very small peaks at the retention time of authentic d -ILN-HFB
(Figure 5-4c and Table 5-6). The presence of d^-TLN-HFB indicates the
possibility of artefactual formation of tryptoline from the condensation
of tryptamine with formaldehyde during the sample clean-up procedure.
However, even though the level of added d^-TA was up to 6 times greater

118
T3<U
N
>••1
u0)
-^ 33
f^
u
a:
U> 2
0) -'
C13
Z CO
C £c t;C I
•« MJJ um zc
Eu
QUS
in
0)
Li
u(a
Xt
cr (0— u

119

120
14259
Figure 5-4. GC peaks from GC/NCI-MRM of the HFB-derivatized brain extractof rats 8 and 9. 1.94 ng of d.-TA was added to extract 8 during the homo-genization step and to extract 9 after the Sep-Pak extraction. B denotesinjection of a solvent blank. See the text for more details.

121
Table 5-6. Assay of HFB-derivatized brain extracts 8 and 9 for artefac-tual formation of TLN-HFB (see Figure 5-4).

122
than the endogeneous cIq-TA levels (Figures 5-4a and 5-4b and Table 5-6),
the d -TLaN detected was much less than the dQ-TLH levels. In analyzing
the commercial d.-TA standards, relatively small amounts of d -TLN were
also observed and may be the source of the d.-TLN detected above.
Extract 9 (Table 5-2) was also analyzed for the presence of the d^-
labeled MTLN-HFB, HTLN-(HFB)2, and HMTLN-(HFB) 2 . No evidence was found
for any artefactual formation of these tryptolines from the added d.-
TA. Based on the above evidence, it appears that the sample clean-up
procedure used in these studies results in little, if any, artefactual
tryptoline formation. However, this does not preclude artefactual
tryptoline formation occurring during the interval following the death
of the rat but prior to the clean-up procedure. Research is ongoing to
determine if this may be a possible source of the tryptolines identified
in these studies.
Quantitation of endogenous TLN . With NCI-multiple reaction moni-
toring (MRM) analysis of each of the derivatized extracts from 6 rat
brains, dQ-TA-(HFB) , d -TLN-HFB, and d -TLN-HFB were identified and
their GC pea)c areas determined (Figure 5-5). From similar analyses of
standard solutions containing dg- and d -TLN, calibration curves were
obtained which allowed the endogenous levels of TLN to be calculated in
individual rat brain extracts (Figure 5-6 and Table 5-7). The levels of
endogenous TLN were higher than expected, and, as a result, the area
ratios d-,-TLN to d -TLN (A^/A ) of the brain extracts are not within the\J 4 4
range used to obtain the calibration curve. It was assumed that the
calibration curve extended linearly to these area ratios. Although this
may lead to inaccurate calculations of the endogenous TLN levels, the
results should be more reliable than those obtained in Chapter 4, where

123
46400 -, a) d -TA-(HFB)
^ ^1140 pg
82432
10
c•HCO

124
(NOoo+ CM
( V/0 ) 07:;bh bs^^V

125
Table 5-7. Determination of endogenous TLN levels in individual ratbrains (see Figure 5-5).
d b cBrain wet d^-TLN added Area Ratios Endogenous TLN
Rat weight (g) (pmoles) ^n^^A (ng/g wet tissue)
1

126
comparisons were made between two unrelated brain extracts in order to
estimate the endogenous level of TLN. With this assumption in mind and
with extrapolation of the least squares equations of the calibration
curves to the d_-TLN to d.-TLN area ratios of extracts 1-6, the mean
level of endogenous TLN in whole rat brain was calculated to be 19.2 ±
3.6 ng/g wet brain tissue. The analysis of extract 7 was not used in
determining the mean, as the d.-TLN was added after the Sep-Pak extrac-
tion and consistently gave the lowest d-.-TLN levels. Also, the contri-
bution of d^-TLN from the d -TLN internal standard was negligible as the
analyses of the standard solutions of d,-TLN revealed A„/A. ratios less4 4
than 0.007, which are much less than the Aq/A^ ratios found in the
extracts. Although these TLN levels are in the same range as those
reported by other researchers (Table 5-8), previous work by others
suggests these are abnormally high. Although Barker's group has
reported similar levels of TLN (17.5 +4.86 ng/g tissue) in whole rat
brain (54), they feel the levels of TLN have been elevated by conditions
of animal housing and other stressors (56). They suggest that a more
normal TLN level would be below the 2 ng/g tissue levels. Similarly, in
discussions with Drs. Kym Faull and Olof Beck, and in light of their
previous findings (59) and the finding of Chapter 4, we feel that the
levels we report here are possibly elevated, also. Due to an unexpected
delay (ca. 30 min) in the preparation of the brains following decapi-
tation, there may have been artefactual formation of tryptolines during
the enzymatic breakdown of tissues. Experiments are currently underway
to investigate this possibility.
Reproducibility of the TLN-HFB quantitation . Eight replicate
analyses of the brain extract #6 were performed in order to determine

127
au«uM
«
s
U9JS*io
•a
•o«
u
a«
a
I
s
c
o
o
«>oH«
«
eH
00I
in
H
OOc
«-(
a:
co
c
3
o
•ao
z

128
the ireproduclbllity o£ the peak area measurements and peak area ratios
(Figure 5-7 and Table 5-9). From Figure 5-7, it can be seen that the
peak shapes varied considerably. injections 2, 3, 7, and 8 show a
shoulder on the TLN-HFB peak which is lacking in the other injections.
This had been noted in the brain extract assays above, especially in the
repetitive injections of the extracts used in determing the possiblity
of artefactual formation (Figure 5-4). This effect was not seen to
occur to any great extent with the TA-(HFB)_ peaks (Figures 5-4a and 5-
4b) or with the analysis of TLN-HFB standards (Figure 5-8). The shoul-
der was initially attributed to an interfering compound, possibly a
positional isomer, in the brain extract. However, as the peak shape of
the d^-TLN-HFB mimicked that of the dQ-XLN-HFB, and as the peak shaped
varied with the injection technique, the shoulder was attributed to TLN-
HFB and was probably the result of the injection technique. By
decreasing the speed of the injection from < 1 s (injections 1-3) to 3-5
s (injections 4-7), a general improvement in peak shape was obtained.
Apparently, the volatilization of sample in the splitless mode is a much
more complex phenomenon when introducing a complex mixture into the
injection port, than when introducing the relatively simple TLN-HFB
standard solutions. The latter consistently yielded "normal" peak
shapes lacking any evidence of shoulders (Figure 5-8). The TLN-HFB GC
peak of injection 8 resulted from a relatively "slow" injection at an
initial GC oven temperature of 60 'C instead of the 100 "C used
previously. Although there is a small shoulder, it is reduced in size
compared to injections 2, 3, and 7, and the overall TLN-HFB peak area
has been increased. This was attributed to the better thermal focusing
which occurs at the lower GC oven temperature. Therefore, the assays

129
enI
LD
rH
0)
XI
Hu2\Uo
o«J
»^4J
»<0)
tfl
u
c
(0
o
ft(1)
in
0)
X4
[^ubTS
H

130
Table 5-9. Reproducibility of GC peak areas and area ratios of the HFB-derivatives of dg-TA, d^-TLN, and d^-TLN from the repetitive analyses ofextract 6 (See Figure 5-7).
GC Peak Areas {/10 counts) dQ-TLN <^Q-'^'^^
Injection

131
below were conducted with an initial GC oven temperature of 60 "C , with
the other conditions remaining the same. This oven temperature consis-
tently gave improved peak shape with little or no shoulder formation
(Figure 5-9).
The variability in the GC peak shapes is reflected in the low
precision, ±30% relative standard deviation (RSD), of the GC peak areas
of TLN-HFB for injections 1-7 (the shoulders were not included in the
peak area measurements) (Table 5-9). If TA-(HFB)2 is used as an inter-
nal standard, the precision of quantitation of TLN with the use of the
area ratios TLN/TA (+32 % RSD) was not improved. However, with the
isotopically- labelled internal standard, the precision of quantitation
of TLN-HFB with the area ratios (d -TLN)/(d -TLN) was increased to +5%
RSD. This dramatically increased precision can be directly attributed
to the chemical similarity and to the elution at approximately the same
time of the analyte and the isotopically-labelled form of the analyte
used as the internal standard. Therefore, they are volatilized, chro-
matographlcally separated, ionized and detected under the same experi-
mental conditions. As demonstrated above, the use of other compoiinds as
internal standards may not adequately compensate for the variation in
the experimental techniques and parameters. In addition, isotopically-
labeled standards become even more important in trace analysis, as they
can compensate for the varying recoveries and may act as "carriers".
Assay for other tryptollnes . In the assay of nine rat brain ex-
tracts (Table 5-2) by NCI-MRM, the following compounds were simulta-
neously identified and their peak areas determined: tryptamine, 5-
hydroxytryptamine, tryptoline, methtryptoline, 5 -hydroxytryptoline, and
5-hydroxymethtryptoline (Table 5-10 and Figure 5-9). Methtryptoline and

132
52608 _ a) d -TLN-HFB4
(0
c
5176
c•i-i
Figure 5-8. GC/NCI-MRM analyses of standard mixtures containing
(a) d -TLN-HFB and (b) d.-TLN-HFB
.
4

133
5-hydroxymethtryptoline have not been previously reported in rat brain,
while HMTLN has only been detected but not quantitated (52). Although
5-methoxytryptoline has been reported by others (50,54), no evidence for
the presence of 5-methoxytryptoline was obtained in these assays. This
agrees with the findings of others (49,59).
No accurate quantitation of these compounds was possible due to the
absence of internal standards in the experiments described here. How-
ever, the normalized GC peak areas permitted estimation of relative
amounts of each of the tryptolines and indoleamines detected (Table 5-
10). There was a large degree of variability in the normalized peak
areas of each of the components. From the results of 7 replicative
analyses of the same extract, the peak areas of tryptoline-HFB had a
relative standard deviation of +30% (Table 5-9). This was largely
attributed to the variability of the splitless injection technique, and
accounts for much of the variability of the brain extract assays. The
remainder of the variability in the rat brain assays is probably due to
the variability between animals. The sensitivities for tryptoline and
methtryptoline can be assumed to be comparable due to the similarity of
their mass spectral features, as can those for 5-hydroxytryptoline and
5-hydroxymethtryptoline. On this basis, tryptoline appears to have been
present at levels greater than those of methtryptoline, while the levels
of the two hydroxytryptolines were nearly the same. Comparison of the
levels of the non-hydroxy- and hydroxy-compounds must be made more
cautiously due to the dissimilarity in their mass spectra. However, it
does seem that the non-hydroxytryotolines are present at levels much
greater than those of the hydroxytryptolines, while 5-hydroxytryptamine
levels are greater than those of tryptamine. The latter trend agrees

134
(0
c
•H
17408 1
224000 1
399360
75008J - '\ lii^^ il (IM ii
d) I 1
i \ \
> 1 ;'
\ i :1 il
5048
5440KAK^L^\i.
Rat 12 345 67 89
Figure 5-9. GC peaks from the GC/NCI-MRM analyses of HFB-derivatized
extracts from individual rat brains. (a) TA-(HFB)2- (b) 5-HT-(HFB)^.
(c) TLN-HFB. (d) MTLN-HFB. (e) 5-HTLN- (HFB) 2- (f) 5-HMTLN- (HFB) ^
•

135
Table 5-10. Normalized GC peak areas of the HFB derivatives of theindoleamines and tryptolines detected in the assay of rat brain extracts(see Figure 5-9) .
NORMALIZED GC PEAK AREAS^
Rat

136
well with the finding that 5-hydroxytryptamine may be present in the
brain at levels up to 1000 times those of tryptamine (13). In addition,
other researchers have shown that 5-hydroxytryptamine has in vitro
reactivities with formaldehyde and acetaldehyde similar to or slightly
greater than tryptamine (7,105). If the tryptolines are formed by
simple, non-enzymatic condensation reactions between indoleamines and
aldehydes, it would be expected that the relative levels of the non-
hydroxy- and hydroxy-condensation products would reflect the relative
levels and reactivities of their precursor indoleamines. However, just
the opposite is found to occur. This difference in the relative levels
of indoleamines and the relative levels of their condensation products
may point to the presence of a specific enzymatic process which is
selective for tryptamine, for which some evidence has previously been
shown (56). Other explanations for this discrepancy could include the
possible existence of mechanisms which protect 5-hydroxytryptamine from
condensation with aldehydes and the possibility that the hydroxytryp-
tolines, once formed, are more readily metabolized than are the non-
hydroxytryptolines.
Conclusion
In conclusion, the increased selectivity of GC/MS/MS over GC/MS has
been shown to increase the reliability of identification and quantita-
tion of the HFB-derivatives of the tryptolines in crude brain
extracts. The following tryptolines have been tentatively identified in
the assay of rat brain extracts using electron-capture NCI-SRM: tryp-
toline, me thtryptoline, 5-hydroxytryptoline, and 5-hydroxymethtrypto-
line. Results suggest that the first two compounds are present in much

137
greater abundance, with tryptoline being present at an average level of
19.2 ng/g wet brain tissue. Future work, will involve careful quanti-
tation of these compounds, using a deuterated internal standard for each
compound, and experiments to assess the possibility of artefactual
tryptoline formation during the interval following the death of the rat
but prior to the sample workup.
CHAPTER 6
CONCLUSIONS AND SUGGESTIONS FOR FUTURE WORK
Tandem mass spectrometry has been shown to offer several advantages
over the more conventional methods for determination of trace quantities
of tryptolines. In Chapter 3, it was shown that MS/MS with solids probe
sample introduction could detect underivatized methtryptoline and tryp-
toline standards in the 10-20 ng range. This would enable the analysis
of brain homogenate pooled from several rats. Research into the use of
other CI reagent gases (e.g. ammonia) may lower these limits of detec-
tion, such that analysis of indiviual rat brain extracts would be fea-
sible. The use of solids probe PCI-SRM would minimize the sample clean-
up and preparation procedures, and thus the possibility of artefactual
tryptoline formation. Actual evaluation of this method with crude brain
extracts is necessary in order to determine if these limits of detection
apply in "real" Scunples.
It has also been demonstrated throughout the dissertation, that
MS/MS provides an added dimension to structure elucidation of
compounds. Specifically, in Chapter 3, it was demonstrated that a
"genetic tree" can be generated by systematically obtaining the daughter
spectrum of each of the fragment ions resulting from the EI ionization
of a compound. The completeness of the structural information contained
in such a "genetic tree" should be well suited to computerized structure
elucidation of an unknown compound. Reserch is proceeding along these
lines in this and other laboratories.

139
In Chapter 4, the limit of detection of short, packed column
GC/NCI-SRM for TLN-HFB standards was in the low femtogram range. How-
ever, quenching of TLN-HFB 's signal by other components in the deriva-
tized brain extract prevented the use of this method. Research with
real negative chemical ionization, as opposed to electron-capture NCI,
might overcome this quenching problem and allow use of this rapid sample
introduction method. Research is also continuing in order to determine
the exact nature of the enhancing effect of perfluoro-tri-N-butylamine
on the PCI signal of the tryptoline-HFB derivatives. A better under-
standing of this effect may lead to its exploitation as a general method
to increase the PCI sensitivity for these and other compounds.
In order to prevent the quenching problem observed in the short,
packed colvimn GC/NCI techniques, separation of the components of the
brain extracts was accomplished with capillary column GC. The limits of
detection for GC/NCI-SRM were still in the femtogram region. In Chapter
5, with capillary coliomn GC/NCI-MRM, tryptoline, methtryptoline, 5-
hydroxytrptoline , and 5-hydroxymethtryptoline were tentatively iden-
tified in 9 individual rat brain extracts. The in vivo presence of the
methtryptoline and 5-hydroxymethtryptoline had previously been unre-
ported. Comparison of the GC/NCI-SRM analysis to the GC/NCI-SIM
analysis of the same extracts revealed that the most likely explanation
was the lack of selectivity with the more conventional GC/MS
technique. Results so far suggest that tryptoline and methtryptoline
are present in much greater abundance that the hydroxytryptolines, with
tryptoline being present at an average level of 19.2 ng/g wet brain
tissue. Future work will involve accurate quantitation of these trypto-
lines with the use of deuterated internal standards and experiments to

140
assess the possibility of artefactual tryptoline formation during the
interval following the death of the rat but prior to the sample workup.

BIBLIOGRAPHY
1. Mclsaac, W. M. Biochlm . Biophys . Acta . 1961, 52,607-609.
2. Johnson, J. V.; Yost, R. A.; Faull, K. F. Anal . Chem .
1984.56,1655-1661 .
3. Johnson, J. V.; Yost, R. A.; Beck, O.; Faull, K. F.; In "AldehydeAdducts in Alcoholism"; Alan R. Liss, Inc.: New York. In press.
4. Whaley, W. M.; Govindachari, T. R. Org . React . 1951, 6, 151-190.
5. Hahn, G.; Ludewig, H. Chem . Gesell B 1934, 67, 2031-2035.
6. Bjorklund, A.; Falck, G.; Lindvall, 0. In "Methods in BrainResearch"; John Wiley & Sons: New York, 1975; pp 249-294.
7. Wyatt, R. J.; Erdelyi, E.; Domaral, J. R.; Elliott, G. R.; Renson,J; Barchas, J. D. Science 1975, 187, 853-855.
8. Lauwers, W.; Leysen, J.; Verhoeven, H.; Laduron, P.; Claeys, M.
Biomed . Mass Spectrom . 1975, 2, 15-22.
9. Mandel, L. R.; Rosegay, A.; Walker, R. W.; VandenHeuvel, W. J. A.;
Rokach, J. Science 1974, 186, 741-743.
10. Meller, E.; Rosengarten, H.; Friedhoff, A. J.; Stebbins, R. D.;
Silber, R. Science 1975, 187, 171-173.
11. Pearson, A. G. M.; Turner, A. J. Nature (London) 1975, 258, 173-
174.
12. Stebbins, R. D.; Meller, E.; Rosengarten, H.; Friedhoff, A.;
Silber, R. Arch. Biochem . Biophys . 1976, 173, 673-679.
13. Artlgas, F.; Gelpi, E. Anal . Biochem . 1979, 92, 233-242.
14. Cattabeni, F.; Koslow, S.H.; Costa, E. Science 1972, 178, 166-
168.
15. Markey, S. P.; Colburn, R. W.; Johannessen, J. N. Biomed . MassSpectrom . 1981, 8, 301-304.
16. Beck, 0.; Jonsson, G.; Lundman, A. Naiinyn-Schmiedeberg' s Arch .
Pharmacol. 1981, 318, 49-55.

142
17. Heck, H. d'A.; White, E. L.; Casanova-Schmitz , M. Biomed . Mass
Spectrom . 1982, 9, 347-353.
18. Mclsaac, W. M.; Estevez, V. Biochem . Pharmacol . 1966, 15, 1625-
1627.
19. Glover, V.; Liebowitz, J.; Armando, I.; Sandler, M. J^. Neiiral .
Transm . 1982, 54, 209-218.
20. Buckholtz, N. S. Naunyn-Schmiedeberg ' s Arch . Pharmacol . 1980,
314, 215-221.
21. Holman, R. B. In "Beta-Carbolines and Tetrahydroisoquinolines";Alan R. Liss, Inc.: New York, 1982; pp 167-181.
22. Rommelspacher, H.; Strauss, S . ; Cohnitz, C.H. Naunyn-Schmledeberg's Arch . Pharmacol . 1978, 303, 229-233.
23. Tuomisto, L.; Tuomisto, J. Naunyn-Schmledeberg' s Arch .
Pharmacol . 1973, 279, 371-380.
24. Komulainen, H.; Tuomisto, J.; Airaksinen, M. M.; Kari, I; Peura,
P.; Pollari, L. Acta . Pharmacol . Toxicol . 1980, 46, 299-307.
25. Friedman, E.; Meller, E.; Hallock, M. _J_. Neurochem . 1981, 36,
931-937.
26. Krassner, M. B. Chem . Eng . News 1983 (Aug. 29), 22-33.
27. Mclsaac, W. M. Postgrad . Med. 1961, 30, 111-118.
28. Elliott, G. R.; Holman, R. B. In "Neuroregulators and PsychiatricDisorders"; Usdin, E.; Hamburg, D. A.; Barchas, J. D. , Eds.;
Oxford University Press: New York, 1977; p 220.
29. Buckholtz, N. S. Life Science 1980, 27, 893-903.
30. Holman, R. B.; Elliott, G.R.; Faull, K. F.; Barchas, J. D. In
"Psychopharmacology of Alcohol"; Sandler, M. , Ed.; Raven Press:New York, 1980; p 155.
31. Westcott, J. Y.; Weiner, H.; Schultz, J.; Myers, R. D. Biochem .
Pharmacol . 1980, 29, 411-417.
32. Tabakoff, B.; Anderson, R. A.; Ritzmann, R. F. Biochem .
Pharmacol . 1976, 25, 1305-1309.
33. Peura, P.; Kari, I.; Airaksinen, M. M. Biomed . Mass Spectrom .
1980, 7, 553-555.
34. Rommelspacher, H.; Strauss, S.; Lindemann , J. FEBS Lett . 1980,
109, 209.

143
35. Beck, 0.; Bosin, T. R.; Lundman, A.; Borg, S. Biochem . Pharmacol .
1982, 31, 2517.
36. Beck, O.; Bosin, T. R.; Holmstedt, B.; Landman, A. In "Beta-
Carbolines and Tetrahydroisoquinolines"; Alan R. Liss, Inc.: New
York, 1982; pp 29-40.
37. Myers, R. D.; Oblinger, M. M. Drug Alcohol Depend . 1977, 2, 469-
483.
38. Deitrich, R.; Erwin, V. Ann . Rev . Pharmacol . Toxicol . 1980, 20,
55-80.
39. Squires, R. F.; Braestrup, C. Nature (London) 1977, 266, 733-734.
40. Braestrup, C; Albrechsten, R.; Squires, R. F. Nature (London)
1977, 269, 702-704.
41. Hamon, M.; Soubrie, P. Neurochem . Intemat . 1983, 5, 663-672.
42. Marangos, P. J.; Paul, S. M.; Goodwin, F. K. Life Sci. 1979, 25,
1093-1102.
43. Braestrup, C; Nielsen, M.; Olsen, C. E. Proc. Natl . Acad. Sci .
USA 1980, 77, 2288-2292.
44. Rommelspacher, H.; Nanz, C; Borbe, H. 0.; Fehske, K. J.; Muller,
W. E.; Wollert, 0. Naunyn-Schmiedeberg 's Arch . Pharmacol . 1980,
314, 97-100.
45. White, F. J.; Nielsen, E. B.; Appel, J. B. Adv . Biochem .
Psychopharmacol . 1982, 34 (Serotonin Biol. Psychiatry), 322-323.
46. Nielsen, E. B.; White, F. J.; Holohean, A. M.; Callahan, P. M.;
Appel, J. B. Life Sci . 1982, 31, 2433-2439.
47. Airaksinen, M. M.; Mikkonen, E. Naunyn-Schmiedeberg '
s
Arch.
Pharmacol . 1980, 313, R34.
48. Panchenko, L. F.; Brusov, 0. S.; Balashov, A. M.; Grinevich, V.
P.; Ostrovskii, Yu. M. Vopr . Med . Khim. 1982, 28, 88-92.
49. Honecker, H.; Rommelspacher, H. Naunyn-Schmiedeberg'
s
Arch.
Pharmacol . 1978, 305, 125-141.
50. Shoemaker, D. W.; Cummins, J. T.; Bidden, T. G. Neuroscience
1978, 3, 233-239.
51. Rommelspacher, H.; Barbey, M.; Strauss, S.; Greiner, 3.;
Fahndrich, E. In "Beta-Carbolines and Tetrahydroisoquinolines";
Alan R. Liss, Inc.: New York, 1982; pp 41-55.
52. Rommelspacher, H; Honecker, H.; Barbey, M.; Meinke, B. Naunyn-
Schmiedeberg 's Arch. Pharmacol . 1979, 310, 35-41.
144
53. Barker, S. A.; Harrison, R. E.; Brown, G. B.; Christian, S. T.
Biochem . Biophys . Res . Commun . 1979, 87, 146-154.
54. Barker, S. A.; Harrison, R. E. W.; Monti, J. A.; Brown, G. B.;
Christian, T. Biochem . Pharm . 1981, 30, 9-17.
55. Kari, I.; Peura, P.; Airaksinen, M. M. Biomed . Mass Spectrom .
1980, 7, 549-552.
56. Barker, S. A. In "Beta-Carbolines and Tetrahydroisoquinolines";Alan R. Liss, Inc.: New York, 1982; pp 113-124.
57. Allen, J. R. F.; Beck, 0.; Borg, S.; Skroder, R. Eur . J_. Mass
Spectrom . Biochem . Med . Environm . Res . 1980, 1, 171-177.
58. Bosin, T. R.; Holmstedt, B.; Lundman, A.; Beck, 0. In "Beta-
Carbolines and Tetrahydroisoquinolines"; Alan R. Liss, Inc.: NewYork, 1982; pp 15-27.
59. Faull, K. P.; Holman, R. B.; Elliott, G. R.; Barchas, J. D. In
"Beta-Carbolines and Tetrahydroisoquinolines"; Alan R. Liss,
Inc.: New York, 1982; pp 135-154.
60. Holmes, J. C; Morrell, F. A. Appl . Spectrosc . 1957, 11, 86-87.
61. McFadden, W. H. "Techniques of Combined Gas Chromatography/MassSpectrometry: Applications in Organic Analysis"; J. Wiley & Sons,
Inc. : New York, 1973.
62. Arpino, P. J.; Guiochon, G. Anal . Chem . 1979, 51, 682A-701A.
63. Franklin, J. L.; Ed. "Ion Molecule Reactions"; Plenum: New York,
1972.
64. Vestal, M. L.; Futrell, J. H. Chem . Phys . Lett . 1974, 28, 559-
561.
65. McGilvery, D. C; Morrison, J. D. Int . J^. Mass Spectrom . IonPhys . 1978, 28, 81-92.
66. Beynon, J. H.; Caprioli, R. M.; Ast, T. Org . Mass Spectrom . 1971,
5, 229.
67. Beynon, J. H.; Cooks, R. G.; Amy, J. W.; Baitinger, W. E.; Ridley,
T. Y. Anal. Chem. 1973, 45, 1023A-1031A.
68. Cooks, R. G.; Beynon, J. H.; Caprioli, R. M.; Lester, G. R.
"Metastable Ions"; Elsevier: Amsterdam, 1973.
69. Kruger, T. L.; Litton, J. F.; Kondrat, R. W.; Cooks, R. G. Anal .
Chem . 1976, 48, 2113-2119.
70. Kondrat, R. W.; Cooks, R. G. Anal. Chem. 1978, 50, 81A-92A.

145
71. McLafferty, F. W. ; Bockhoff, F. M. Anal . Chem . 1978, 50, 69-76.
72. Yost, R. A.; Enke, C. G. Anal . Chem . 1979, 51, 1251A-1264A.
73. Yost, R. A.; Fetterolf, D. D. Mass Spectrom . Rev . 1983, 2, 1-45.
74. Henion, J. D.; Thomson, B. A.; Dawson, P. H. Anal . Chem . 1982,
54, 451-456.
75. Endele, R.; Senn, M. Int . J_. Mass Spectrom . Ion Phys . 1983, 48,
81-84.
76. Cheng, M. T.; Kruppa, G. H.; McLafferty, F. W. Anal . Chem. 1982,
54, 2204-2207.
77. Glish, G. L.; Shaddock, V. M.; Harmon, K.; Cooks, R. G. Anal .
Chem . 1980, 52, 165-167.
78. Brotherton, H. O.; Yost, R. A. Anal. Chem. 1983, 55, 549-553.
79. McLafferty, F. W. , Ed. "Tandem Mass Spectrometry"; John Wiley &
Sons, Inc.: New York, 1983.
80. Cooks, R. G.; Glish, G. L. Chem . Eng . News 1981 (Nov. 30), 40-52.
81. McLafferty, F. W. Science 1981, 214, 280-287.
82. McLafferty, F. W. Biomed . Mass Spectrom . 1981, 8, 446-448.
83. Cooks, R. G.; Busch, K. L. J_. Chem. Educ. 1982, 59, 926-933.
84. Penzer, G. R. In "An Introduction to Spectroscopy for
Biochemists"; Brown, S. B., Ed.; Academic Press: New York, 1980;
pp 70-114.
85. Yost, R. A.; Fetterolf, D. D.; Hass, J. R.; Harvan, D. J.; Weston,
A. F.; Skotnicki, P. A.; Simon, N. M. Anal . Chem. 1984, 56, 2223-
2228.
86. Kondrat, R. W.; McClusky, G. A.; Cooks, R. G. Anal . Chem. 1978,
50, 2017-2021.
87. Levsen, K.; Schwartz, H. Mass Spectrom . Rev. 1983, 2, 77-148.
88. Levsen, K. In "Tandem Mass Spectrometry"; McLafferty, F. W., Ed.;
John Wiley & Sons, Inc.: New York, 1983; pp 41-66.
89. McLafferty, F. W. "Interpretation of Mass Spectra," 3rd Ed.;
University Science Books: Mill Valley, CA, 1980.
90. Budzikiewicz, H.; Djerassi, C; Williams, D. H. "Mass Spectra of
Organic Compounds"; Holden-Day: San Francisco, 1967.
146
91. Slayback, J. R. B.; Story, M. S. Ind . Res . Dev . 1981 (Feb.), 128-
133.
92. Coutts, R. T.; Locock, R. A.; Slywka, G. W. Org . Mass Spectrom .
1970, 3, 879-889.
93. Johnson, J. V.; Yost, R. A. Presented at the 6 International
Conference on Computers in Chemical Research and Education,
Washington, DC, July 11-16, 1982. Abstract No. 25. In "Computer
Applications in Chemistry"; Heller, S. R.; Potenzone, Jr., R.,
Eds.; Elsevier: Amsterdam, 1983; pp 326-327.
94. Dougherty, R. C. Anal . Chem . 1981, 53, 625A-636A.
95. Hunt, D. F.; Crow, F. W. Anal . Chem . 1978, 50, 1781-1784.
96. Bush, K. L.; Parker, C. E.; Harvan, D. J.; Bursey, M. M.; Mass, J.
R. Appl . Spectrosc . 1981, 35, 85-88.
97. Gamett, J. L.; Gregor, I. K.; Guilhaus, M.; Pakternieks, D. R.
Inorganica Chimica . Acta . 1980, 44, L121-L124.
98. Yinon, J.; Harvan, D. J.; Hass, J. R. Org . Mass Spectrom . 1982,
17, 321-326.
99. Garland, W. A.; Miwa, B. J. Biomed . Mass Spectrom . 1983, 10, 126-
129.
100. Stbckl, D.; Budzikiewikz, H. Org . Mass Spectrom . 1982, 17, 470-
474.
101. Faull, K. F.; Barchas, J. D. In "Methods of Biochemical
Analysis," Vol- 29; Click, D., Ed.; John Wiley & Sons, Inc.: New
York, 1982; pp 325-383.
102. Wood, P. L. Biomed . Mass Spectrom . 1982, 9, 302-306.
103. Shaw, G. J.; Wright, G. J.; Milne, G. W. A. Biomed . Mass
Spectrom . 1976, 3, 146-148.
104. Perchalskl, R. J.; Yost, R. A.; Wilder, B. J. Anal. Chem . 1982,
54, 1466-1471.
105. Davis, V. E.; Cashaw, J. L.; McMurtney, K. D.; Ruchirawat, S;
Nimit, Y. In "Beta-Carbolines and Tetrahydroisoquinolines"; AlanR. Liss, Inc.: New York, 1982; pp 99-111.
106. Beck, 0.; Lundman, A. Biochem. Pharmacol. 1983, 32, 1507-1510.
BIOGRAPHICAL SKETCH
Jodie Vincent Johnson was bom November 16, 1954, at Ft. McClellan,
Alabama, as the second of eventually six children. As his father was an
Army officer, he attended different schools every 2 to 3 years. He
attended Reid Ross Senior High School in Fayetteville, North Carolina,
graduating as the class valedictorian in 1972. While in North Carolina,
he earned his Eagle Scout award.
While attending Florida State University, he was in the Honors
Program, was a member of the FSU Flying High Circus, joined the Phi
Kappa Phi and Phi Beta Kappa honorary societies, and received the
American Chemical Society Undergraduate Analytical Chemistry Award in
1977. He graduated Magna Cum Laude in June, 1977, with a B.S. in
biology and chemistry.
In October, 1977, Jodie was married and moved to the Jacksonville,
Florida, area where he obtained employment with SCM Organic Chemicals in
July, 1978. Working in their R&D analytical support laboratory, he
acquired experience and a "love" for the analytical applications of gas
chromatography/mass spectrometry. Although happy with his position, in
1980 he decided to further his education and entered the University of
Florida, where he studied under the direction of Dr. Richard A. Yost.
Upon graduation in 1984, he will remain with Dr. Yost for a period of
time to continue MS/MS research as a Postdoctoral Associate.

I certify that I have read this study and that in my opinion itconforms to acceptable standards of scholarly presentation and is fullyadequate, in scope and quality, as a dissertation for the degree ofDoctor of Philosophy.
Richard A. Yos^/ChairmanAssociate Professor of Chemistry
I certify that I have read this study and that in my opinion itconforms to acceptable standards of scholarly presentation and is fullyadequate, in scope and quality, as a dissertation for the degree ofDoctor of Philosophy.
3l©G. Dorsey
A'saietant Professor of ChVmifetry
I certify that I have read this study and that in ray opinion itconforms to acceptable standards of scholarly presentation and is fullyadequate, in scope and quality, as a dissertation for the degree ofDoctor of Philosophy.
Gerhard M. SchmidAssociate Professor of Chemistry
I certify that I have read this study and that in my opinion itconforms to acceptable standards of scholarly presentation and is fullyadequate, in scope and quality, as a dissertation for the degree ofDoctor of Philosophy.
7^/6,^:. ^ iAf..Martin T. ValaProfessor of Chemistry
I certify that I have read this study and that in my opinion itconforms to acceptable standards of scholarly presentation and is fullyadequate, in scope and quality, as a dissertation for the degree ofDoctor of Philosophy.
Clyde M.'^ WilliamsProfessor of Radiology

This dissertation was submitted to the Graduate Faculty of the
Department of Chemistry in the College of Liberal Arts and Sciences and
to the Graduate School, and was accepted as partial fulfillment of the
requirements for the degree of Doctor of Philosophy.
December, 1984Dean for Graduate Studies andResearch


<^vY