tams pavements 3 - utah ltap pavements 3.x users manual utah ltap center contact: ... additionally,...
TRANSCRIPT

TAMS Pavements 3.x
User’s Manual
Utah LTAP Center Contact: Utah LTAP 4111 Old Main Hill
Logan, UT. 84322-4111
(800) 822-8878 [email protected] www.utahltap.org

i
Table of Contents
Introduction 1
Initializing the program .............................................................................................................................. 2
Data Needed to Begin ................................................................................................................................ 2
Beginning Screen Components................................................................................................................... 3
Pavement Management Module 9 Data Needed to Begin .............................................................................................................................. 56
Opening the Database .............................................................................................................................. 56
The Map Feature ...................................................................................................................................... 57
Summary of Main Menu Components (Pavement) .................................................................................. 59
LTAP Center – Provides information about the Utah LTAP Center Initial Road Inventory ....................... 60
Initial Road Inventory ............................................................................................................................... 61
Editing Information................................................................................................................................... 64
Distress Information ................................................................................................................................. 65
Editing Segments Alternative Method ..................................................................................................... 65
Adding Segments (without map information) .......................................................................................... 66
Documenting Comments, Viewing Pictures, Entering Treatments, and Viewing History ........................ 67
Pavement Performance ............................................................................................................................ 68
Storing Pictures ........................................................................................................................................ 69
Reporting Functions ................................................................................................................................. 70
Inventory Report ...................................................................................................................................... 70
Condition Report ...................................................................................................................................... 71
Recommended Treatment Report ........................................................................................................... 72
Budgeting and Network Analysis .............................................................................................................. 73
Need for Network and Budgeting Analysis ............................................................................................... 73
Applying a Treatment Strategy to the Budget Analysis ............................................................................ 75
Saving the Analysis ................................................................................................................................... 79
Printing the Analysis Results..................................................................................................................... 79
Printing the Allocation Results ................................................................................................................. 81
Viewing Graphical Yearly Distribution ...................................................................................................... 82
Modifying Treatment Costs ...................................................................................................................... 84
Updating Distress Relationships ............................................................................................................... 85
Define The Recordset ............................................................................................................................... 86
Signs and Sign Support Module 87 Data Needed to Begin .............................................................................................................................. 87

ii
Beginning Screen Components................................................................................................................. 87
Opening the Database .............................................................................................................................. 88
Summary of Main Menu Components (Signs) .......................................................................................... 88
Initial Support/Sign Inventory .................................................................................................................. 89
Editing Information................................................................................................................................... 91
Editing Supports and/or Signs Alternative Method .................................................................................. 92
Adding Supports (without map information) ........................................................................................... 92
Documenting Comments, Viewing Pictures, Entering Treatments, and Viewing History ........................ 93
Storing Pictures ........................................................................................................................................ 93
Reporting Functions ................................................................................................................................. 93
Pavement Markings Module 95 Accident Analysis Module 96 Culverts Module 97 Cattle Guards Module 98 Bridges Module 99 Work Order Module 100

iii
Table 1. Year 2000 Distribution ................................................................................................................... 73
Figure 1. Starting Screen ................................................................................................................................ 3 Figure 2. Beginning screen after new database is opened. ......................................................................... 57 Figure 3. Map Feature and Component Information .................................................................................. 58 Figure 4. Add New Record Information Box ................................................................................................ 61 Figure 5. Add Information about Road Segment Form ............................................................................... 62 Figure 6. Location Information Missing Dialog Box ..................................................................................... 62 Figure 7. Distress Information Missing Dialog Box ...................................................................................... 63 Figure 8. Distress Information Out-of-Range Dialog Box ............................................................................. 63 Figure 9. Database Updated Dialog Box ...................................................................................................... 63 Figure 10. Edit Inventory Form .................................................................................................................... 64 Figure 11. Update Location Confirmation Dialog Box ................................................................................. 64 Figure 12. Edit Inventory Alternative Form ................................................................................................. 65 Figure 13. Edit Inventory Information Form ................................................................................................ 68 Figure 14. Pavement Performance Curve .................................................................................................... 69 Figure 15. Inventory Report ......................................................................................................................... 70 Figure 16. Condition Report ........................................................................................................................ 71 Figure 17. Recommended Treatment Report .............................................................................................. 72 Figure 18. Analysis Setup Form ................................................................................................................... 74 Figure 19. Allocation of Single Chip Seal Applications ................................................................................. 75 Figure 20. Allocation of Single Chip Seal (Allocation 100% in 10-12 RSL) .................................................... 76 Figure 21. Analysis Setup Form ................................................................................................................... 77 Figure 22. Analysis of Road System ............................................................................................................. 78 Figure 23. Save Allocation Scheme Form .................................................................................................... 79 Figure 24. Analysis Report ........................................................................................................................... 80 Figure 25. Allocation Report ........................................................................................................................ 81 Figure 26. Distribution of RSL Form ............................................................................................................. 82 Figure 27. Distribution of RSL (2001) ........................................................................................................... 83 Figure 28. Edit Costs Form ........................................................................................................................... 84 Figure 29. Distress Tables Form ................................................................................................................... 85 Figure 30. Fatigue Cracking Distress Table .................................................................................................. 85 Figure 31. Starting Screen ............................................................................................................................ 87 Figure 32. Add New Record Information Box .............................................................................................. 89 Figure 33. Sign Support and Sign Inventory Form ....................................................................................... 90 Figure 34. Information Missing Dialog Box .................................................................................................. 90 Figure 35. Database Updated Dialog Box .................................................................................................... 91 Figure 36. Sign Input Form........................................................................................................................... 91 Figure 37. Confirmation Dialog Box ............................................................................................................. 92 Figure 38. Edit Inventory Information Form ................................................................................................ 93

1
Introduction
The Transportation Asset Management System (TAMS) software application was developed at Utah State University by the Utah Local Technical Assistance Program (LTAP) Center under the direction of Doyt Bolling. The goal of the TAMS program is to serve as a tool for cities and counties to effectively manage their Transportation systems. The program enables managers to perform both individual project level analysis and network level analyses to determine the best use of resources. The program uses a Geographic Information Systems (GIS) interface that allows the user to “point and click” on a map to select individual transportation asset features such as street segments, signs, bridges, etc. for inventory, condition rating, analysis, and treatment tracking purposes. The program also has a work order module to assist managers in tracking, recording, and completing work order requests. The TAMS Pavement module is related to the Safety Software Suite which contains modules related to asset management and safety: Sign Management Road Safety Audits Crash and Intersection Analysis ADA Ramps Road Cuts Other tools for Asset Management are available in the Feature Data Collection Plug-in or other stand alone plug-ins: Culverts, Cattle Guards and many more… Railroad Crossings Sidewalks The TAMS Pavement Plug-in, Safety Software Suite and Feature Data Collection Plug-in are all proprietary software of Utah State University and the Utah LTAP Center. The TAMS Pavement Module allows field and office entry and data storage covering inventory, condition assessments, analysis, and cost tracking. It also provides the user with several useful reports and the ability to write custom queries and maps. This manual is a “step-by-step” guide covering various features and functions of the program.

2
Part I – The Basics – Installation and Setup Installation – To install the program: The TAMS Pavement Module is a plug-in that runs in MapWindow GIS. MapWindow is an open source GIS program designed for custom applications. To download MapWindow or to find more information visit www.mapwindow.org.
The installation requires two parts: First, the MapWindow GIS application and second the TAMS Pavement plug-in. Both installations files can be found on the CD media or by downloading from www.utahltap.org via a specific link which would have been emailed to you. Installation steps:
Insert the CD Media into the CD – ROM installation disk drive
Through Windows Explorer, navigate to the installation/setup files folder
Double click on the file mapwindowSetup.exe file first
Follow instructions to install program with all given defaults and click finish
Double click the TAMSPavementsSetup.exe file
Follow instructions to install program with all given defaults and click finish
Required Data Digital Maps – TAMS is most effective when an accurate GIS Map of the different transportation systems is used. Normally, the Utah LTAP Center uses a Trimble GPS unit to map the transportation features and create an ESRI shapefile. For Utah agencies, a digital map (shapefiles) may also be downloaded from the Utah Automated Geographic Reference Center (AGRC). Their website is http://gis.utah.gov/agrc Additionally, the MapWindow Shapefile Editor Tool can be used in conjunction with an aerial photo to “draw” in the necessary streets, thus creating a digital map that can be used in the Pavements Module. Finally, the program may be used without any map at all. This is done by managing the street segments with a unique record number. More information on this method can be found starting on page XX.
Databases – A standard Microsoft Access database is used in the program. A separate database is needed for each module. These databases can be created with the necessary tables using the program. The steps for creating the database are explained later in this manual. The

3
Pavements database is password protected. This will prevent accidental changes that can cause the program to not function properly. For special modifications, problems or questions about any of the above items, please contact the LTAP Center at (800) 822-8878, [email protected], or www.utahltap.org.
Beginning Screen Components To initialize the program click on the TAMS icon created during installation. An icon will be created on the desktop as well as in the start menu. Figure 1 below shows the starting screen of TAMS that will appear when the program is initialized.
Figure 1. Starting Screen
The above figure shows the opening screen after starting MapWindow GIS. Notice the “Plugins” and “TAMS Pavements” menu items in the top left part of the figure.
Menu Bar
Tool Bar

4
Figure 2a. The Menu bar and Toolbar
Figure 2 shows a list of plug-ins that can be installed. Notice the check marks next to “Signs” and “TAMS Pavements.” This means that these two modules are activated and their respective menu’s are on the toolbar.
Figure 2. List of available Plug-ins

5
Figure 3 shows the menu items for the TAMS Pavements Plug-in. All functions for the Pavements Plug-in are accessed from this menu.
Figure 3. Menu Items for TAMS Pavements
To start a new Pavements project click on “TAMS Pavements” in the Menu bar and select Pavement Database New pavements. The Database Chooser window in figure 4 will
appear next. This window can also be accessed by clicking on the pavement icon in the MapWindow Toolbar. This is illustrated in figure 5.
Figure 4. Database Chooser - Open or Create new Database

6
Figure 5. Access the Database Chooser window
The user can select one of three options as shown on the tabs: Open an existing database, recent database or create a new database. To create a new database, click on the “Create New Database” tab and then click on the yellow folder icon on the right-hand side to browse to the location where you would like to save the file. Type in a name for the database and click on “Save” and then “Create.” Next, the user will get a message stating the database was created successfully and the Project Details window be shown. The Project Details window is shown in figure 6 below.
Figure 6. Project Details
This step may be skipped at the user’s discretion. Otherwise enter the necessary information in the 9 boxes and click on “Save Details.” Figure 7 shows the Shapefile and Database Connection Manager. This screen is used to link the database and map file (shapefile). The first step is to click on the link named “Open another shapefile” on the left-hand side of the screen. This will allow the user to browse for the
Pavement Icon

7
location of the shapefile. Once located and loaded into the window, the “Field Map” can be edited.
Figure 7. Shapefile and Database Connection Manager
Figure 8 shows the shapefile loaded with additional options. The next two steps will configure TAMS Pavements so it knows what fields will create a link between the shapefile layer and database. Two templates are provided to ease the configuration process: Default Municipal and Custom Municipal. Those templates are shown in the “Field Map” drop down box in the right-hand corner of the window.
Figure 8. Shapefile and Database Connection Manager with shapefile layer added

8
The Default Municipal template will map the fields based on the default settings from TAMS 2.1 and 2.2.7 versions. That means the TAMS Pavements program will pull the unique number, street name and length from the shapefile based on the field map shown in figure 9.
Figure 9. Shapefile Field Map Setup
If using this template, the shapefile must have fields with the same name as those shown under the “Shapefile Field” column in figure 9. Usually, this will not be the case. By selecting the “Custom Municipal” template, the user can make the necessary adjustments. To access the “Custom Municipal” template, click on the “Edit Field maps…” link as shown in figure 8. When using the “Custom Municipal” template, first select the shapefile that will be used by clicking on the drop down arrow in the center-right-hand side of the window in figure 10. This will give you the shapefile that was already loaded on the previous step and show its contents of the shapefile attribute table in the middle window. Alternatively, the user can click on the blue link titled “Browse for shapefile…” to view the contents of another shapefile. The screen will now look similar to figure 10.

9
Figure 10. Custom Municipal Template with Contents of Shapefile displayed Figure 10 shows the custom fields that are mapped to UNIQUE_ID, S_NAME and LENGTH. These fields are mapped to SegmentID, Road Name and Segment Length in the TAMS Database. Notice that if the shapefile does contain data for Road Width or City, this can be mapped and automatically imported if desired. Additional fields can be added as well by selecting the drop down arrow next to the desired field. Once the fields have been linked, click Apply. Before proceeding, make sure the “Custom Municipal” field map is selected from the drop down box in the upper right-hand corner of the window shown in figure 8. Click the “Open” button to continue.
Figure 11 shows the shapefile loaded into MapWindow.

10
Figure 11. Shapefile/Map Layer loaded into MapWindow To save the project click on File -> Save and browse to the desired location, type in the name and click save. This will save the Field Maps and database to shapefile link so the above steps do not have to be repeated every time the project is opened. To re load the project, use Windows explorer to navigate to the saved project file and double click on the project name with the MapWindow Icon. i.e. Figure 12 shows the Menu and Tool Bar. The Menu Bar is used to access specific functions of the MapWindow program and activated Plug-ins. Figure 12 shows common

11
menu items such as File, Edit, View and Help. Additionally, menu items for Plug-ins, Support/Signs Tools and TAMS Pavements are shown. The Plug-in drop down menu displays a list of available plug-ins that can be turned on by placing a check mark next to the name as shown in figure 2.
Figure 12. Menu and Tool Bar
Explanation of the each item on the Toolbar is given on figure 14. To access the functions of the TAMS Pavement Plug-in, click on the TAMS Pavements drop down menu. Figure 13 shows the list of these functions. A summary of this menu and related sub menus can be found on page 13 and 14.
Figure 13. List of TAMS Functions
To access the Shapefile and Database Connection Manager, go to TAMS Pavements Pavement Database Manage Shapefiles. This is the same window shown in figures 7 and 8.

12
Figure 14 gives an explanation for the Toolbar. The tools with the green background are default tools loaded to the Toolbar by the MapWindow program. They are used to interact with the active shapefile/layer. The most useful tools to the TAMS Pavements user will be the ones denoted with an asterisk (*).
Figure 14. Tool Bar Explained

13
Summary of TAMS Pavements Menu
Pavement Database 1. New Database – Create new TAMS 3.1 database 2. Open Database – Open existing TAMS 3.1 database 3. Manage Shapefiles – Access the Shapefile and Database Connection Manager
Inventory/Condition Survey 1. Edit Inventory for Cities – Opens the Main Inventory Form 2. Set Defaults – Enter default values for street attributes (initial data entry only) 3. View Distress Rating Sheets - View and print rating sheets
a. Asphalt/Surface Treated b. Gravel/Native c. PCCP/RCP/PCP
Reports 1. Pie Charts – Percentage comparison of Class v Area, RSL v Area & Distress v Area 2. Governing Distress – Summary Report of total area, miles, segments and Gov.Dis 3. Asphalt – Select Report type: condition, Inventory, Recommended an Yearly 4. Concrete – Same as asphalt 5. Unpaved – same as asphalt
Analysis (Optimization) 1. Asphalt – Budget and treatment performance optimization 2. Concrete – Same as asphalt 3. Unpaved – Same as asphalt
Tools 1. Query Select – Write custom queries, export data, color segments based on
attributes 2. Go To – Jump to street segment based on ID number or street name 3. Table View – View street segment attributes based on click and drag (needs
work) 4. Batch Update from TAMS 2.2.7 – Migrates data from old TAMS version to new 5. Batch Update from Shapefile Attributes – Updates TAMS database from
shapefile attributes: length, width and area 6. Merge Slave and Master Database – Merges two TAMS 3.1 databases 7. Report with Contact Info – (needs work) 8. Create Color Scheme on… - Create maps with segments colored based on
attribute type

14
Street Maintenance
1. Work Order – Create project estimates, enter work done, print work orders 2. Run Check for Pending Maintenance – Check for project due dates , apply
pending work
Settings 1. Customize Distress, Treatment and other tables and attributes – Customize drop
down menus, distress types, rating and treatment tables, costs and RSL 2. Governing Distress Method
About LTAP 1. Short blurb about the LTAP Center and link to utahltap.org

15
PART II – Data Entry
The TAMS Pavement Plug-in allows for two methods of data entry; via point and click on the shapefile/map layer or by manually entering data by a unique record number. The shapefile method is recommended because this gives the user a more organized approach to asset management. This “point and click” method facilitates simple navigation and ease of street selection for entering work done or figuring costs for future and past projects. To start entering data using the point and click method, start by making sure the proper layer is activated in the MapWindow Legend. In order to interact with the street layer, it needs to be selected as shown in figure 15. The line/box around the layer name indicates which layer is “active.” Also, notice that in figure 15 there are three layers loaded in the Legend. Two are point shapefiles and one is a line shapefile. This is denoted by the symbols on the right-hand side of the layer name. The checkmark in the box means the layer is visible on the map.
Figure 15. Proper layer selection
Once the desired layer is made active, click on the select tool, from the toolbar and then either click on the desired street segment or draw a box on top of it. The “Main Inventory Form” will appear as shown in figure 16.

16
Figure 16. Main Inventory Form.

17
If more than one segment is selected, a summary of each selected street segment will be shown in a message window as shown in figure 17.
Figure 17. Summary of selected segments.
The Main Inventory Form is made up of six parts: Location, Roadway, Roadway Classification, Calculation, Commands and Menu. Location information (Figure 18) can be filled on each segment or established using the “Set Defaults” tool by clicking on TAMS Pavements Inventory/Condition Survey Set Default. Figure 19 shows how the proper state, county, city and contact information can be entered for the entire system so that it will not have to be entered for each segment.
Figure 18. Location Information

18
Figure 19. Set Default Values.
Additionally, the set Default Values form allows the user to setup default values to be populated in the Roadway Classification part of the Main Inventory Form. Roadway information is populated in two ways. The first way is from the shapefile and the second is manual entry. If the shapefile contains data for any of the seven fields under the Roadway area of the form, the TAMS Pavement Plug-in will pull that information in.

19
Figure 20. Roadway Area of Main Inventory Form.
The program is already setup to pull in the SEGMENT Number (required), ROAD NAME, FROM ADDRESS, TO ADDRESS, and SEGMENT LENGTH (feet). If the shapefile contains the NUMBER OF LANES and ROAD WIDTH, the user can have these fields mapped using the Shapefile and Database Connection Manager shown in figures 9 and 10. Roadway Classification data mostly consists of drop down menus. Each of these can be setup to populate with default values as described on the previous page.
Figure 21. Roadway Classification Area of Main Inventory Form.

20
Additionally, each drop down can be customized by clicking on TAMS Pavements Settings Customize Distress, Treatment and Other Tables and Attributes. Figure 22 shows the “Update Tables” form where the “Other Tables” tab is selected.
Figure 22. Update Tables form with the Other Tables tab is selected.
By selecting the desired table from the drop down menu, a new attribute can then be added by typing its name in the box on the left-hand side and then clicking on “Insert.” To change an existing entry, select it from the list loaded in the middle of the form and then make the change in the box to the right of the list. Then click on “Save Update.” Other adjustments to the settings of the TAMS Pavement Plug-in will be discussed in section XX, page XX. The Photo number field is automatically incremented by one from the previous photo number. This is to help the user who is in the field collecting data throughout the day. This value can be changed by the user. The previous Photo Number box is for display only. The Cross Section, Shoulder Type, AADT, and % Trucks fields are not required. The Cross Section drop down menu and Edit Cross Section button are under construction at this time. Their purpose will be to add specific information regarding the use of the entire right-of-way. Number and width of lanes, on street parking, plant strip and sidewalk type and width are an example of the data types. The Inventory Date is automatically populated with today’s date when entering data for a new segment.

21
The Calculation box shows a summary of the distress information that can be accessed and edited by clicking on the “Distress Rating” button. The summary shows the current RSL (Remaining Service Life), Governing Distress, Suggested Treatment and Most Recent Maintenance. The situation of figure 22 shown below has the Governing Distress field showing “No Distress” and the Suggested Treatment showing “No Maintenance” because the most recent activity for this segment has been an applied treatment. This is shown under the Most Recent Maintenance. Once a treatment has been applied to a segment, a new distress survey needs to be done in order to more accurately reflect the Governing Distress and Suggested Treatment. The new RSL value, however, is estimated based on the treatment performance and current RSL. More on this to be covered in Section XX page XX. Had the most recent activity been only a distress survey, the Calculation Summary area would look like figure 23.
Figure 22. Calculation Area of Main
Inventory Form.
Figure 23. Calculation Area of Main
Inventory Form.

22
The Commands area of the Main Inventory Form allows the user to add distress ratings for a street segment, Enter Comments, Enter Work Done, View the History and Save changes.
Figure 24. Commands area of the Main Inventory Form.
The Distress Rating button brings the user to the form in figure 25. Distress ratings are determined by identifying and classifying the cracks observed in the pavement. TAMS recognizes nine types of distress: Fatigue (Alligator), Longitudinal, Transverse, Block, Potholes/Utility Cuts, Edge, Rutting, Roughness and Drainage. The first six distress types will allow a numerical input value between 0 and 9. The value is determined by a visual inspection in which the cracks are objectively measured and categorized according to the guidelines in figure 26. The last three distress types, rutting, roughness and drainage, allow a numerical input value between 0 and 3. This value is determined subjectively through a visual inspection and the apparent “ride” of the road. Distress identification follows the Federal Highway Administrations “Distress Identification Manual for the Long-Term Performance Program” (FHWA-RD-03-031). This manual can be downloaded from: http://www.fhwa.dot.gov/Pavement/ pub_details.cfm?id=91 . Additionally, a more detailed explanation of pavement distress is found on page XX section XX.

23
Figure 25. Distress Rating Input via the TAMS program.
The “calculate” button allows the user to see the resulting RSL and Optimal Treatment before saving the data. This way the user can directly see how each distress type and corresponding extent and severity rating effects the RSL and Optimal Treatment. Once the desired values are entered for each distress type, the user should click on “Add Distress” to save the data. The TAMS program allows the user to select an alternate treatment titled “Suggested Treatment.” This is done by selecting one of the treatments listed in the Suggested Treatment drop-down menu. This is to be used when the user feels the Optimal Treatment is not financially or otherwise appropriate. Once the Suggested treatment is changed, it will be the treatment displayed and used in all other areas of the program.

24
Figure 26 shows a summary of each distress type and the specifications for identifying distress. To print the pavement distress rating sheets navigate to TAMS Pavements Inventory/Condition Survey View Distress Rating Sheets Asphalt.
Figure 26. Distress Rating Sheet

25
The Enter Comment button is used when additional information needs to be added that pertains to the street segment in question. Figure 27 shows the comment window. The user can choose a “Comment Category” from the drop-down box and enter any applicable notes in the comment field box.
Figure 27. Comment Entry window
The Enter Work Done button is used to track maintenance for the individual street segment. To enter work done on multiple segments at one time, see section on “Work Order Form.” The Enter Work Done form is shown in figure 28. The user needs to enter the date the work was completed and select the type of treatment that was performed. Once the work/maintenance has been added, the program will update the RSL, Optimal Treatment and individual distress values for the segment. This maintenance record will be shown in the History table which is explained next. From the History Table, the maintenance record can be deleted if necessary. After maintenance has been applied to a segment, the RSL is updated based on the Treatment/Maintenance Performance Chart. More on this Chart can be found in section XXX. Additionally, all distress values are returned to zero and the optimal treatment is set to “No Maintenance.” This is because once maintenance has been applied, it is necessary to conduct a field survey using the TAMS program to again identify distress that has taken place since the treatment was applied. Field surveys are based on a visual surface inspection and typically distress cracks are not visible after a treatment is applied. Therefore, distress values are returned to zero and no maintenance is recommended until a survey is again completed.

26
Figure 28. Enter Work Done.
The Show History button is used to access all the historical information related to a street segment. This form is shown in figure 29. From here the user can delete any of the entries listed. When a entry is deleted, the program will select the record with the most current date as the current information for the street segment. Also, if a maintenance record is deleted, the RSL will be adjusted as if the maintenance had not happened.
Figure 29. Street Segment History form.

27
Figure 29 displays 4 history records for one street segment. It can be seen that two of those records have the Governing Distress as “No Distress.” This is because they are maintenance records or the segment was surveyed and received zero for each distress value. By navigating to the Enter Work form, the user can view the entries for maintenance.
Figure 30. Extended view of the History form.
Figure 30 is an extended display of the 4 history records shown above. Here the distress values for each distress type are shown. The Save button is used to save updated information from the Location, Roadway and Roadway Classification areas of the Main Inventory Form. Distress information is saved when clicking on the “Add Distress” button on the Distress Rating form. The “Menu” drop down menu found in the upper left-hand corner of the Inventory form gives access to various options as shown in figure 31.
Figure 31. Drop Down “Menu” of Main Inventory Form.
28
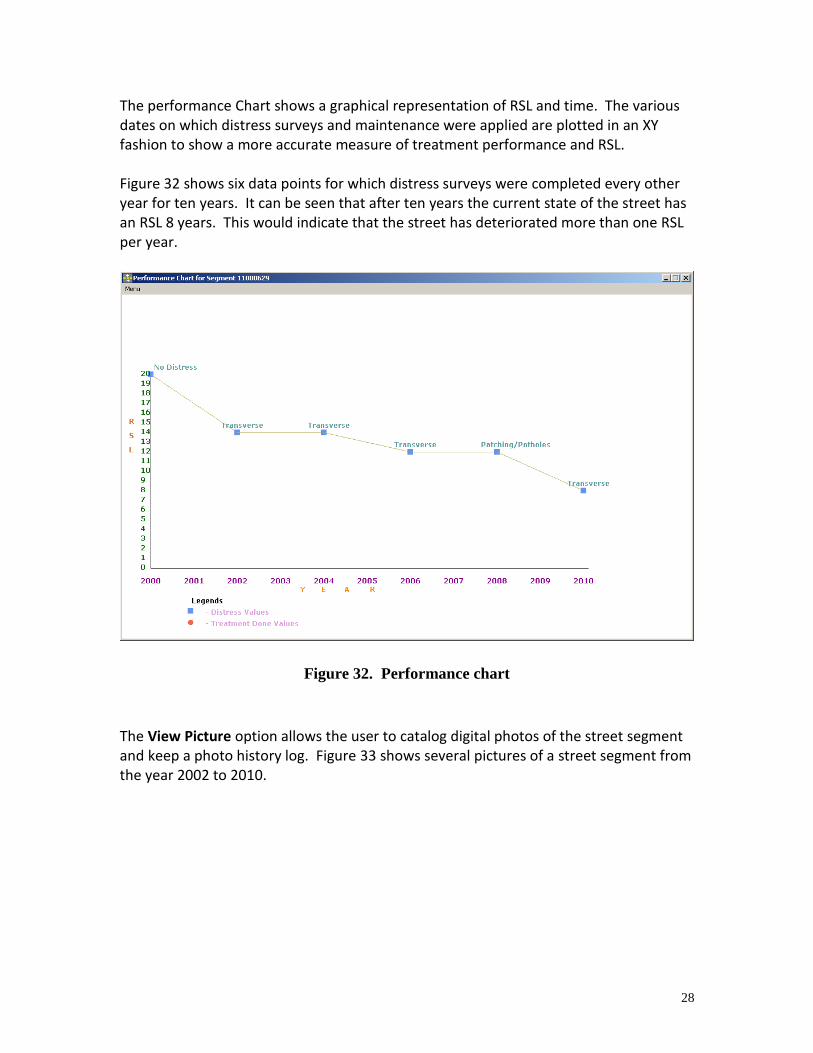
The performance Chart shows a graphical representation of RSL and time. The various dates on which distress surveys and maintenance were applied are plotted in an XY fashion to show a more accurate measure of treatment performance and RSL. Figure 32 shows six data points for which distress surveys were completed every other year for ten years. It can be seen that after ten years the current state of the street has an RSL 8 years. This would indicate that the street has deteriorated more than one RSL per year.
Figure 32. Performance chart
The View Picture option allows the user to catalog digital photos of the street segment and keep a photo history log. Figure 33 shows several pictures of a street segment from the year 2002 to 2010.

29
Figure 33. Picture view of digital photos.
The Delete Entries for This Segment option will delete the information related to the Main Inventory Form. It will not delete information from the shapefile. * Note: Once this action has taken place, the changes cannot be undone! The Add New Segment option gives the user the ability to add data to a segment that is not shown on the map. This action does not modify the shapefile. It creates a record for a given street that is not related to the shapefile, i.e. not related to a segment on the map. To create a new segment, click on Menu Add new Segment from the upper left-hand corner of the Main Inventory Form. The last or greatest value for the Segment ID will be shown and a box is given to enter the desired Segment ID for the new segment as shown in figure 34.

30
Figure 34. Add new Segment Information.
To start entering data without a shapefile/map file, click on TAMS Pavements Inventory/Condition Survey Edit Inventory for Cities. This will bring up the Main Inventory Form. The user must then choose a Segment number to start with and enter it into the Segment Box. Then the user will continue filling out the fields as explained above. Once all the data has been entered for that segment, click save and continue to the Distress ratings. To create a new segment, click on Menu Add new Segment from the upper left-hand corner of the Main Inventory Form. The last or greatest value for the Segment ID will be shown and a box is given to enter the desired Segment ID for the new segment as shown in figure 34. After clicking on Add Segment, click the Cancel/Exit button to return to the Main Inventory Form. To start entering data for the new segment, select the segment number from the “Choose Segment” drop down box. Now the appropriate data can be entered in for that segment.

31
Work Order/Maintenance Tracker The TAMS Work Order form can be accessed via TAMS Pavements Street Maintenance Work Order. The Work Order form is designed to manage work orders and apply maintenance to many segments at once. The Work Order Tool can also be used to estimate costs and materials for project planning. A work order is created by entering a project name and then clicking on the “Add” button below the box in the upper right-hand side of the window. Now that project can be selected from the “Project Name” drop-down box as shown in figure 35.
Figure 34. Work Order form
The next step in using the Work Order Form is to select the streets that will be part of the project. This can be done in three ways; by Road Name, Selecting from Map or by Custom Query. The first is to select by Road Name. This is done by clicking on the Road Name drop down box and selecting the desired street. Then a list of Segment Id’s will

32
be shown below the label “Segment ID’s.” Each Segment ID represents an individual street segment and a given Street can have one or many segments that comprise the entire street. The user needs to select the segments of the street that are to be included in the Work Order. To add a single segment to the Work Order, click on a
segment number and then click on the button to add it to the Work List. To add all
the segments for a given street name at one time, click on the button. To remove a
segment id from the Work list, click on or respectively. Once the desired segments are added to the Work List, the user should then select a treatment from the Treatment Drop-Down Menu. After the treatment is selected, a summary is given which displays the total estimated cost and the area of pavement to be treated. This Work Order can be saved (or printed) for a future project or applied to a past project as work done. If the work done is applied to a project where the date of completion is the current day’s date or earlier, the program will apply the treatment to the respective segments and update the corresponding RSL’s accordingly. If the date of completion is a future date, the RSL’s will not be updated until the user runs the check Pending Maintenance Tool and applies the Work Order from there. Select from Map. To add segments to the Work List from the map, click on the “Select on Map” button in the Work Order Form Window. This will bring the user back to the map view. Click on a single segment or click and drag the mouse over multiple segments. After clicking on a segment, the user is brought back to the Work Order Form window with the list of selected segments under the “Segment ID’s” label. To continue adding segments from the map, click on the “Select on Map” button again until all the desired segments are added. From here the treatment can be selected, the summary calculated and completion date selected. Custom Query. The custom Query Tool is accessed by navigating to TAMS Pavements Tools Query Select. The Query Tool is shown in figure 35 below. Figure 35 shows an example query that will show all the streets where the RSL is 4 years.

33
Figure 35. Query Tool form.
The next step is to click on the “Table View” button to be taken to the Query Output window as shown in figure 36. To add all the streets in the system where the RSL is 4 years, click on the “Create Work Order” button.
Figure 36. Query Tool Output form.

34
This will load the segments from the query output to the Segment ID list. Click on the
button to add them to the work list. Any of these three methods may be used in combination to add streets to the work list.

35
Part III – Reporting
Reports To access the reporting features navigate to TAMS Pavements Reports. The options for creating reports are listed below:
1. Pie Charts – Percentage comparison of Class v Area, RSL v Area & Distress v Area 2. Governing Distress – Summary Report of total area, miles, segments and Gov.Dis 3. Asphalt – Select Report type: condition, Inventory, Recommended an Yearly 4. Concrete – Same as asphalt 5. Unpaved – same as asphalt
The TAMS Pie Charts simply show a graphical comparison of surface type area to RSL, functional class and distress type. Figure 37 shows an example of the RSL vs Area pie chart. Each color represents a percentage of total surface area. To select between chart types, click on the desired surface type and then click on the chart type, i.e. Class vs Area, RSL vs Area, Distress vs Area. To change colors, just select the chart type again. Note that for large databases, this may take several minutes.
Figure 37. Reporting Pie Chart shows the percentage of asphalt in RSL categories.

36
The Governing Distress report is shown below in figure 38. This report gives a summary of the pavement distress breakdown. It shows the number of street segments in each distress category, the centerline miles and area with the corresponding governing distress. At the bottom of the form, a summary of totals is given.
Figure 38. Governing Distress Report.
For each surface type there are four reports that can be displayed and exported to PDF or Excel. These reports are Condition, Inventory, Recommended Treatment and Yearly Treatment. To run these reports navigate to TAMS Pavements Reports Asphalt.

37
Once a report is generated, the user can sort the report from a list of given fields. These fields are Segment ID, Road Name, Class and RSL as shown in figure 39.
Figure 39. Inventory report sorted by Segment ID.
Use the toolbar below the sort buttons to export the report to various formats such as PDF, Excel (.xls), Word (.doc) and Rich Text (.RTF).
Figure 40. Report navigation and export and print tools.
Other toolbar functions include printing, page navigation and searching. Another option for creating reports is to export the relevant street data to Microsoft (MS) Excel where the user can have full control over the data. The user has the option of exporting all street segments or creating a custom query for selected segments. This is done by using the Query Tool, TAMS Pavements Tools Query Select.

38
Figure 41. Query Tool to export data to Excel.
Figure 41 shows the form that comes up after selecting Query Select. Notice the query that appears by default in the Query Box, “Inventory.SegmentID > 0.” This default query selects all street segments that have been inventoried. The next step is to click on the “Table View” button to get what is shown in figure 42.
Figure 42. Query Output Form.
Click on the “Export” button to save the file as an MS Excel or Text file.

39
Part IV – Data Analysis and Budgeting
Analysis The TAMS Analysis/Optimization is designed to assist the user in creating a pavement maintenance strategy that optimizes an agency’s budgetary constraints by applying the right treatment at the right time. To access the Analysis tools navigate to TAMS Pavements Analysis/Optimization [Surface Type] This section focuses on a budgeting tool that will maximize service level with a yearly budget. An effective maintenance strategy is optimized by obtaining the highest average network RSL and keeping the RSL Category of “0” to less than 3%. Figure 43 shows the TAMS optimization form. The first area outlined in red shows the four maintenance categories with a corresponding drop down menu. By clicking on the drop down menus and selecting the desired treatment, it is added to the list below as shown in the figure 43. In this example Crack Seal, Slurry Seal, Thin Hot Mix Overlay (<2in) and Rotomill & Thick Overlay (3in) have been selected and can be virtually applied to the system.
Figure 43 – TAMS Analysis form

40
The next area outlined in red shows the year in which the last survey was completed and the percentage of asphalt area in each RSL category. In figure 43 the eight RSL categories show the following percentage distributions: 0.13% of the street network is in the RSL category of 0 years; 0.13% of the street network is in the RSL category of 1-3 years; 7.63% of the street network is in the RSL category of 4-6 years and so on. The additional years listed show the estimated percentage distributions without applying any maintenance. These are calculated based on each street losing a year of service per year. For example, if no treatments are applied to the system, then you could estimate that in 2013, 9.06% of the total area would be in the 0 (failed) category. Streets in the 0 and 1-3 RSL Category will require some type of reconstruction maintenance. Streets in the 4-6 and 7-9 will require some type of Rehabilitation maintenance. Streets in the 10-12 and 13-15 RSL category can be maintained with various preventive maintenance treatments such as seal coats that include slurry and chip seals. Routine maintenance treatments such as crack sealing, patching and fog seals can be applied throughout the pavement’s life cycle.
The next step in the analysis is to input the percentage of the system that will be treated with each treatment and to allocate each treatment into the proper RSL categories.
Figure 44 –Percent of System distribution
Figure 44 shows the percent of the system that will receive maintenance in the “% System” Column. In the example above, 10% of the total area will be treated with Slurry Seal; 6% will be treated with a Thin Hot Mix Overlay (2in); and 0.17% will be treated with Rotomill & Thick Overlay (3in). In this scenario, 16.17% of the total asphalt area will receive maintenance.

41
Figure 45 – Maintenance allocation
Figure 45 shows how each treatment is allocated into the RSL Categories. The performance of each treatment is dependent on the condition of the street at the time of application (See Treatment Cost and Performance sheet, page 44). Routine maintenance is most effective on streets with an RSL of 16 and greater. Preventive maintenance (Seal Coats) is most effective on streets with an RSL of 10 or greater. Rehabilitation maintenance expensive and is best used in the RSL categories of 4-6 and 7-9. Reconstruction maintenance is the most costly and is most effective in the RSL categories of 0 and 1-3. In the example above, all of the slurry seal work will be applied to streets who’s RSL is between 10 and 12 years. According to the “Treatment Cost and Performance” sheet on page 44, slurry seal is most effective on these streets. Allocating 100% in the 10-12 year RSL category means 100% of the slurry seals performed will be on roads with an RSL of 10-12 years. The analysis program will automatically add 5 years to the streets treated with a slurry seal in the 10-12 RSL category. The program also recognizes that if slurry seals are applied in the less optimal 4-6 RSL category, the added life will only be 2-3 years. The “50” in the 4-6 and the “50” in the 7-9 categories indicates that 50% of the thin hot mix overlay is applied to the 4-6 and the other 50% is applied to the 7-9 categories. The same is true for the rotomill & thick overlay. Alternatively, the slurry seal could be adjusted so that 70% goes to 10-12 and 30% to 13-15. This may be more effective since 36.52% of the asphalt area is in the 10-12 and only 14.36% is in the 13-15 categories. Another option might be to allocate the thin hot mix overlay into three categories including 20% into the 1-3, 30% into the 4-6 and 50% into the 7-9 categories. However the allocation is divided up, the sum must equal 100% After entering the percent of system and treatment allocations, click on the “Run Optimization” button to view the resulting table. The table is the result of applying the strategy shown above each year. The dollar amount calculated is the cost per year.

42
Figure 46 – Resulting network performance
Notice that in the year 2013, the percentage of area in the “0” category is 2.78% and the average RSL is 13.35 years. Referring back to figure 43, the percentage of area in the “0” category is 9.06% and the average RSL is 8.01 years. This is a big improvement in the overall network condition. The idea of the analysis tool is to apply the right treatment at the right time. This maximizes the effectiveness of each treatment resulting in a higher average RSL and lowering the number of streets that require reconstruction. Save and Print the Allocation To save the allocation so that it may be used later, click on File Save Allocation in the Analysis window and then browse to the location where you want to save it. The information is saved in a text file. To open this allocation and view the result at a later time, click on File Open Allocation and browse to the location of the text file. To print the allocation, click on File Print Allocation and then click on the “View Allocation Report” button to view the allocation. Then click on the printer icon found on the tool bar. Print the Analysis Table To print the analysis table, click on File Print Analysis and then click on the “View Asphalt Report” button to view the analysis table. Then click on the printer icon found on the tool bar. Note that the numbers calculated under the 4 maint. Categories are not correct. It has put all 13.15% under preventive.

43
Figure 47 – TAMS Treatment Cost and Performance

44
Analysis Tools Menu The analysis tools menu is used to edit treatment costs and performance criteria, change the current year, reset treatments and view the yearly distribution charts. Treatment costs and performance Treatment costs can be edited in two ways. The first is to click on Tools Edit Cost Table or click on Tools Treatment RSL Performance. The first option brings up a simple window displaying each treatment and the respective cost per square yard of asphalt. The second option brings up figure 48 shown below. In this form, the cost and performance (added RSL) can be adjusted. To adjust a cost or performance criteria, simply click in the box and type in the desired number. In figure 48 below, the number ‘5’ shown in the red box is the number of years that will be added to a street segment that receives a chip seal treatment and that has a current RSL of 10, 11 or 12.
Figure 48 – Analysis tools Tams Treatment Cost and Performance

45
Change the Current Year This is used to change the analysis starting year to today’s current year. In some cases the most up-to-date information in TAMS is for a year in the past. In this case the current year should be changed to today’s year before running the optimization. If the analysis form displays a year that is earlier than the current year, use this option to bring the analysis table up-to-date. Change the Optimization Year This is used when conducting a two-step optimization scenario. For example the first step would include the years 2008 to 2013 and in the second step the years 2014 to 2018. This would be done so that a different strategy could be used in each step. To change the year that the second step starts, simply click in the check box next to the year. The next time the Run Optimization button is clicked, it will start on 2014 View Yearly Distribution Charts The distribution chart is a graphical representation of the yearly percentage distribution found in figure 43. Use the Previous Year and Next Year buttons to display the charts for other years.
Figure 49 – Yearly Distribution Chart
Help Menu The help menu will pull up the TAMS 3.1 user manual.

46
Part V – Tools and Settings
Tools The Tools menu is accessed via TAMS Pavements Tools. The following options are
available in this menu:
Query Select
Go To
Table View
Batch Update from TAMS 2.2.7
Batch Update from Shapefile Attributes
Merge Slave and Master databases
Create Color Scheme on…
Tools Query Select
The Query Select tool is designed so the user can create custom queries and export that
data to MS Excel or display it on a map. When opening the Query Select window, the
default query, “Inventory.SegmentID > 0” is displayed as shown in figure 50. This query
automatically selects all the streets for which data has been inventoried. By clicking on
the “Table View” button the data can be viewed.
Figure 50 – Query Select tool form
The Query Output in the Table Form is shown in figure 51. The buttons across the top allow the user to create a Work Order, color the segments on a map or export the selected segments to MS Excel. Additionally, a summary of data for the selected segments is given in the bottom left-hand corner of the form.

47
Figure 51 – Query Output Form.
Tools Go To
The Go To tool allows the user to jump to a particular street segment by entering its unique id number or street name. Figure 52 below shows a screen shot of the form.
Figure 10 – Go To segment form
By selecting a street name from the drop down menu a list of all the segment id’s with that road name will be shown. After selecting the segment id, the map will zoom to the location of that segment. By selecting the “Enter” button, the main inventory form will be brought up.

48
Tools Table View
The Table View tool displays data for segments that have been selected on the map
using the MapWindow select tool. The table view form that is brought up is the same as the query output table form shown in figure 51.
Tools Batch Update from TAMS 2.2.7
The Batch update tool from TAMS 2.2.7 is used to convert a database that has the TAMS 2.2.7 format to the new 3.0 format as significant changes have been made. In order for the batch update to run properly, there are many checks that should be made on the 2.2.7 database so that all pertinent data is converted. It is highly recommended that a technical assistant from Utah LTAP run this process.
Tools Batch update from shapefile attributes The Batch Update from Shapefile Attributes tool is used to update the TAMS 3.0 database with newer or more correct information that is available in the street centerline shapefile (.dbf file). Figure 53 below shows the form in which the functions may be performed. This tool can be used to update the Road Name, Segment Length, Road Width and the City. It will also calculate the area for each segment based on the updated length.
Figure 53 – Batch Update from Shapefile form
Tools Merge Slave and Master The Merge Slave and Master tool is used to join two databases that are in the 3.0 format. It will simply update any changes that have occurred in the slave database so that they are reflected or added to the Master database.

49
Tools Color Scheme tool The Color Scheme tool is used to apply a color to a street segment based the following attributes: road name, speed limit, surface type, owner, functional classification, district, drainage type, importance, governing distress, optimal treatment, suggested treatment and RSL. Figure 54 below shows the Color Scheme tool form. To color the street segments click on the desired attribute on the left side of the form, review the color ramp that is applied to the individual attribute values and then click on the Apply button. To change a color, click on the colored box, select the desired color and click the Apply button again. To print a map of the colored segments, see Create a Map using MapWindow.
Figure 54 – Color Scheme Tool

50
Settings Governing Distress Method TAMS 3.0 offers two methods for determining governing distress.
Figure 55 – Governing distress selection
The first (New) method listed in the figure selects a governing distress based on something… The second (Old) method holds to the same manner as TAMS 2.2.7. The chart shown below shows the decision table and the distress priority list. TAMS 2.2.7 looks at the resulting RSL for each distress type index number and whichever RSL is lowest is selected as the governing distress. Where the RSL values are the same, the program selects a governing distress based on a priority list that cannot be changed. That list is shown below in table XX. Distress Tables The distress tables are accessed via TAMS Pavements Settings Customize Distress, Treatment and other tables and attributes.

51
Figure 56 – Distress rating tables
Distress rating tables can be adjusted to reflect the specific situation from those having the proper experience in pavement distress identification. The distress rating tables effect how RSL is calculated and treatments are recommended. In the example above, the distress type Fatigue has been selected from the Distress Type drop down menu and the index values are shown along with their corresponding RSL and treatment values. The index value of 1 corresponds to a rating of “Low, Low” meaning Low Extent and Low severity. Figure 26 shows the distress rating matrix for each distress type. To make a change, first select the index number from the drop down menu. To change the RSL value, enter the desired value in the RSL box and click on Save. To change the treatment, select the desired treatment from the drop down menu and click on Save. Explanation of RSL and Recommended Treatment is Determined Recommended treatment is determined by the distress that gives the lowest RSL value. In the case where the RSL values are the same, the TAMS program will choose the distress that is highest in priority. Generally speaking, where the RSL values are the same and fatigue is one of the distresses, fatigue will govern. Example - If fatigue cracking and transverse cracking both received a 1 in the distress rating form (figure 25), then fatigue would be the governing distress because the RSL of 10 for fatigue is less than the RSL of 14 for transverse. In the case where the distress values give the same RSL, the distress of fatigue would still govern because fatigue has a higher priority than transverse. Refer to the new sheet kirk came up with for distress priority.

52
Treatment Performance and cost table Other Table customization Create a Map using MapWindow To make and print a map, click on File Print to display the print settings form as shown in figure 55 below.

53
Figure 115 – MapWindow print settings
This form gives options to customize a map that includes titles, legends, scale bar and a north arrow. Need to show RSL Treatment selection tables
Part VI – Trouble Shooting Shapefile won’t load when using Shapefile and Database Connection Manager Sometimes a shapefile won’t load into the Shapefile and Database Connection Manager after another shapefile was removed. To work around this, go ahead and click on the Open button to begin using TAMS. Then go back into the Shapefile and Database Connection Manager via TAMS Pavements Pavement Database Manage Shapefiles and add the layer again. It should work now.

54

55

56
Pavement Management Module
Data Needed to Begin Importing Road Map – TAMS is most effective when an accurate GIS Map of the road system is used. Normally, the LTAP Center uses GPS to map the street network and create an ESRI shapefile. When this is not possible, the LTAP Center assists in making a variety of formats, including ESRI coverages and AutoCad drawings, compatible with TAMS.
Database – A standard database (usually Microsoft Access) is used in the program. Any changes made to this database may cause problems. Please call the Utah LTAP Center before making changes.
Opening the Database In order to begin using the pavement management module, a database containing street network data must be specified. If no database exists (you are starting from scratch) you can use the program to create one with all of the necessary tables. First click on the Roads module button, then click on the File Menu, then New, then Database Then Pavements. A Save As dialog box will appear asking the user to name the database and specify its location. Once this is done click save and the user will be returned to the starting screen where maps can be added and the data collection process can begin. When a new database is created in TAMS, a table is created in the database that “tells” the program it is for the pavement management module. If a database already exists, click on the File Menu, then Open, then Database. An Open File dialog box will appear asking the user to specify the database. When the database is selected and the “Open” button clicked, the user will be returned to the starting screen to load maps and view information. If a database is being opened for the first time the screen will appear as is shown in Figure 12.

57
Figure 12. Beginning screen after new database is opened.
The Map Feature As previously stated, TAMS uses a map interface to inventory and survey the condition of the road system. This requires a GIS-based road map to begin the inventory process as outlined in the section “Data Needed to Begin.” To load the GIS map, first select the Roads module button, then go to File, Open, Layer and choose the shapefile from the open file form. This opens the selected shapefile in the program and saves the path to the directory in the database so that the next time the database is opened the shapefile will open automatically. If the roads module button is not selected before opening the layer it will be associated with the wrong module and warning message box will appear indicating that required fields are not found in the shapefile. With a base map in place, the map feature becomes the data-collection and editing tool for the information stored in the database. Figure 13 shows the map feature and outlines the basic components.

58
Figure 13. Map Feature and Component Information
If a layer needs to be removed, go to File, New, Map. The map will be cleared and the correct layers can be added.
Zoom-in button –
zoom in on map
Pan button –
pan through
map
Zoom –
see full extent
of map
Identify button –
must be active in
order to select
features on map Label button –
displays form
that allows
customizing
labels
Alternate
method for
selecting –
type in
segment id of
feature
Color button –
specify color of
active layer
Map
refresh
New Layer
button – add
additional
layers to map
Module Buttons

59
Summary of Main Menu Components (Pavement)
File Menu New
- Database – Creates a new database for the module selected with all of the necessary tables needed to collect data using TAMS
- Map – Clears the current map - Layer – Adds a layer to the existing map -
Open - Database – Specifies a database to use
Exit Program – Shuts down the program Inventory/Condition Survey Menu
- Edit Inventory – Allows editing independent of the map; uses a search mechanism to find the road name
- Set Inventory Defaults –Sets default values to speed up the inventory and condition survey processes
- View Rating Sheets – Allows viewing of the rating sheets for Asphalt, Concrete, and Unpaved roads used during the condition survey
Analysis/Reports Menu
Define The Recordset – allows the user to analyze and create reports on defined subsets of the total system.
Analysis – allows the user to analyze treatment strategies and view the governing distress distributions of the road network.
o Run Analysis – Runs the budget optimization portion of the program - Asphalt – Runs the budget optimization portion of the program for
asphalt pavement - Concrete – Runs the budget optimization portion of the program for
concrete pavement - Unpaved – Runs the budget optimization portion of the program for
unpaved roads o Governing Distresses – Gives the following information of governing
distresses affecting the asphalt, concrete, and unpaved pavement systems:
number of segments affected by each distress
percent of total area affected by each distress
percent of total area affected by smoothness
drainage problems

60
Reports – (the following reports are available for Asphalt, Concrete, and Unpaved roads) - Condition Report – Produces a report for each segment of the road, gives
the remaining service life (RSL) and information for each distress identified
- Inventory Report – Produces a report of Road Name, From Address, To Address, RSL, Area, and Percent Area
- Recommended Treatment Report – Produces a report with the recommended treatment for each segment
- Yearly Treatment report – Produces a report of treatments done in any given year
- Report Designer – Allows the user to custom design a report with the desired title and field data. In this report the data for all pavement types is included. For all other reports either asphalt, concrete, or unpaved must be selected and only the records for that pavement type will be listed.
Table Menu Edit Distress Tables – Provides a screen to change distress criteria requirements
for Asphalt, Unpaved, and Concrete roads. About LTAP Menu
LTAP Center – Provides information about the Utah LTAP Center

61
Initial Road Inventory There are two ways to enter data for a new segment: 1. Use the map to identify features on which to add information: select the identify
button on the toolbar and select the segment on the map 2. Type in the segment id number in the box at the top of the map and press Enter When the segment selected is a new inventory, the Information box shown in Figure 14 appears.
Figure 14. Add New Record Information Box
The Information box indicates the segment selected has no information stored in the database. The Add Inventory form appears, as shown in Figure 15. The left side of the form is to add categorical information pertaining to the road’s location. The right side of the form contains the distress-rating entry. The distresses in the road are rated according to the SHRP Distress Manual. The Utah LTAP Center has developed a field-rating sheet based on the SHRP Distress Manual. This field-rating sheet is shown in Appendix A as well as in the Inventory/Condition Survey pull-down Menu under “view rating sheets”.

62
Figure 15. Add Information about Road Segment Form
Once the information has been entered in form, press the “Save Record” button. The RSL is calculated and a recommended treatment is determined and stored in the database. The figures below show the possible errors that may be given while trying to save the new segment information. If all of the Location (left-side) information is not entered, the dialog box in Figure 16 appears. If all of the Distress (right-side) information is not entered, the dialog box in Figure 17 appears. If the data for the distress information is out of the correct range, the dialog box in Figure 18 appears.
Figure 16. Location Information Missing Dialog Box

63
Figure 17. Distress Information Missing Dialog Box
Figure 18. Distress Information Out-of-Range Dialog Box
If the information is formatted correctly, the dialog box in Figure 19 appears, indicating the database was updated with the new information. Repeat the process for another new segment. To edit the information, click on the segment again. For information on editing, proceed to the next section.
Figure 19. Database Updated Dialog Box

64
Editing Information To add or edit information, click the “identify” button on the mapping toolbar shown in Figure 13. This allows the user to select features on the map. When the segment selected has not been inventoried, the Information box shown in Figure 14 appears. If the segment has information already stored for it, the Edit Inventory form appears, as shown in Figure 20.
Figure 20. Edit Inventory Form
This form allows the user to change location information or add new distress information about the road segment. To modify information on the left side of the form, make the desired changes and click the “Update Location Information” button. The confirmation dialog box shown in Figure 21 appears.
Figure 21. Update Location Confirmation Dialog Box

65
Distress Information To update distress information, a further step is required. First, click on the “Add New Distress Information” button. A message box appears asking, “Are you sure you want to add new distress information?” The reason for this extra precaution is another record will be added to the database when this information is saved. To proceed, click the “Yes” button; a new button appears on the Edit Inventory form. Change the distress information as needed, then press the “Save New Distress Information” button. The information is added to the history table for that segment.
Editing Segments Alternative Method In addition to utilizing the map to edit previously inventoried segments, the following method is available:
1. From the starting screen go to the Inventory\Condition Survey Menu and click “Edit Inventory.” The form (shown in Figure 22) appears.
2. The “Find” button results in another window, allowing the road name to be entered. The road name needs to match exactly in order for the records to appear.
3. Once the road name is entered, press the “Go Find” button and the program returns to Figure 13 showing only those segments for the road name entered.
Use the navigation tool in the Edit Inventory Alternative form to scroll through the records until the desired record is found. Then press the “Go To Segment” button, and the Edit Inventory Information form (shown in Figure 22) appears, allowing segments to be edited or segment information to be viewed.
Figure 22. Edit Inventory Alternative Form

66
Adding Segments (without map information) Adding Segments (without using the map) can be done in the map feature. By entering a unique segment ID and pressing Enter, the program will proceed to the Add Inventory form. Note: Record these additional segment ID’s. They will not be tied to the map until the segments are mapped and added to the base map. It will be necessary to use the same segment ID number when mapping the segments as was used to inventory the segment in the program. Otherwise the inventoried data will not be linked to the correct feature on the map.

67
Documenting Comments, Viewing Pictures, Entering Treatments, and Viewing History
Once the Edit Inventory Information form is open (as shown in Figure 23. Edit
Inventory Information Form
), the buttons at the bottom allow for tracking of treatments, entering comments, and viewing a picture and distress history. The forms and viewing tools are shown in the figure.

68
Figure 23. Edit Inventory Information Form
Pavement Performance The pavement performance curve for the segment is another feature available from the Edit Inventory form. This feature allows the user to view the performance of the pavement with respect to RSL vs. time. Figure 24 shows an example of this feature.

69
Figure 24. Pavement Performance Curve
Storing Pictures Pictures are stored in the TAMS directory as the application in a folder named “Picts.” In order for the program to recognize the link, the pictures must be JPEG type files. Pictures can be stored in the database by using the picture form accessed through the Edit Inventory form.

70
Reporting Functions Inventory Report The Inventory Report gives the detailed location information, classification, percent area, and RSL for each of the road segments. To access the Inventory Report, select the report menu (from the main screen), select the desired surface type (asphalt, concrete or unpaved), and click the “Inventory Report” button. This information is critical in determining an engineer’s estimate for a future project. Figure 25 shows an example of the Inventory Report.
Figure 25. Inventory Report

71
Condition Report The Condition Report reports the severity, extent, and RSL for each segment of road in the management system. To access the Condition Report, select the report menu (from the main screen), select the desired surface type (asphalt, concrete, or unpaved) and click the “Condition Report” button. This information is critical in determining the appropriate treatment for a given road system. Figure 26 shows an example of the Condition Report.
Figure 26. Condition Report

72
Recommended Treatment Report The Recommended Treatment Report can be utilized to determine what projects could become a priority. A manager could look at all the roads recommended for crack sealing and determine which should be done for this particular year. This limits the number of sections a pavement manager must read to make good engineering judgments about the road system. To access the Recommended Treatment Report, select the report menu (from the main screen), select the desired surface type (asphalt, concrete, or unpaved) and click the “Recommended Treatment Report” button. This information is critical in determining the appropriate treatment for a given road system. Figure 27 shows an example of the Recommended Treatment Report.
Figure 27. Recommended Treatment Report

73
Budgeting and Network Analysis
Need for Network and Budgeting Analysis An effective pavement management program allows the user to accomplish 3 things: Provide an accurate inventory Manage segments separately Maximize service level with a yearly budget Until now, we have focused on the first two elements. This section focuses on the final element of providing a budgeting tool that will maximize service level with a yearly budget. To run the analysis tool from the starting screen, select the analysis menu and click “Run Analysis.” The analysis tool appears, as shown in Figure 28. Looking at the output portion of the tool, notice that in the year 2000 the distribution is as shown in Table 1. This is the current RSL distribution for the street network. The goal of the analysis it to obtain the highest average network RSL within budget constraints. The other information shows the percentage that falls within the cited RSL categories. For example, 26.37% of the road system is in the RSL category of 4-6 years. Roads in this category typically require some form of rehabilitation. This is also true for the segments in the 7-9 RSL category. Roads falling in the 0 and the 1-3 RSL categories will require reconstruction, while roads in the 10-12 category are good candidates for preventative maintenance. Routine maintenance treatments can be applied throughout the pavement’s life cycle. Understanding what information this table exhibits is critical in conducting a network condition and budget analysis of the system. The next section deals with information on how treatments are simulated in this analysis program.
Table 1. Year 2000 Distribution
Year 0 1-3 4-6 7-9 10-12 13-15 16-18 19-21 Avg. RSL
2000 .88 4.06 26.37 14.01 18.08 8.66 22.05 5.89 10.69

74
Figure 28. Analysis Setup Form

75
Applying a Treatment Strategy to the Budget Analysis On the average, each road will lose serviceability at the rate of 1 RSL per year. Treatments can be applied to a certain RSL category to deter the deterioration of roads that come into it. For instance, one could apply chip seals to the 10-12 RSL category by clicking the “Single Chip Seal” button in the analysis form. Figure 29 shows the form that appears:
Figure 29. Allocation of Single Chip Seal Applications
This form allows the user to select the RSL categories in which to apply chip seal applications. Chip seals are most effective if done in the 10-12 RSL category. The program will automatically add 5 years to the roads treated with a chip seal in the 10-12 RSL category. The program also recognizes that if chip seals are applied in the less optimal 4-6 RSL category, the added life will only be 2-3 years.

76
To apply chip seal applications first allocate what percentage of chip seals will be applied to each category. A good starting point is allocating 100% in the 10-12 RSL category as shown in Figure 30. Allocating 100% in the 10-12 year RSL category means 100% of the chip seals performed will be on roads with an RSL of 10-12 years.
Figure 30. Allocation of Single Chip Seal (Allocation 100% in 10-12 RSL)

77
The next step is to allocate a percentage of the system to treat with chip seals. After clicking the “Apply” button, the program will return to the Analysis Setup form. In this form, change the number in the chip seal category from 0 to 10 as shown in Figure 31.
Figure 31. Analysis Setup Form
Changed from 0 to 10

78
As can be seen, the number of roads in the 10-12 year RSL category has decreased substantially. The road system is beginning to improve, but further treatments will be required. It is suggested to continue with analysis, allocating 4 percent to thin hot mix overlays, broken into 50% in the 4-6 and 50% in the 7-9 RSL categories. Then, allocating 1.7% to base replacement and pavement replacement with 100% in the 0 RSL category, as well as, allocating 1.5 percent to Thick Overlays (>2”) broken into 50% in the 0 and 50% in the 1-3 RSL categories. Figure 32 shows the results of this analysis.
Figure 32. Analysis of Road System
As can be seen from Figure 22, the Average RSL has begun to increase. The objectives to use in determining an effective preservation strategy are:
1. Average RSL >12 years 2. Less than 3% of the system falls into the 0 and 1 – 3 RSL categories 3. Normal distribution with the mean falling at about 12 years RSL
For this model, all the criteria were met except for the fact that more than 5% of the system is in the 0 RSL category.

79
Saving the Analysis To save the analysis information, select the file menu and click the “Save Allocation” menu. Figure 33 shows the form that opens.
Figure 33. Save Allocation Scheme Form
Type a name that represents the analysis conducted, such as “2000 Road Budget.” Then click the “Save” button. The next time the analysis tool is opened, the “Open Allocation” menu in the File menu of the Analysis Setup form can be selected. By selecting a previously saved allocation scheme, the allocation will be applied to the system even if the system distribution has changed since the last analysis.
Printing the Analysis Results The analysis shows how the network is changing over the analysis period. The analysis is shown in the white section of the “Analysis SetUp” form. To print the analysis, select the “File” menu button and click the “Print Analysis” button in the “Analysis SetUp” form. Figure 34 shows the Analysis Report.

80
Figure 34. Analysis Report

81
Printing the Allocation Results The network allocation is critical in showing what affects the network analysis. The allocation shows what treatments were used and when they were applied. The allocation is behind the scenes in the “Analysis SetUp” form. To print the allocation, select the “File” menu button and click the “Print Allocation” button in the “Analysis SetUp” form. Figure 35 shows the Allocation Report.
Figure 35. Allocation Report

82
Viewing Graphical Yearly Distribution Another feature of the program is the Graphical Yearly Distribution Charts. To utilize this feature in the “Analysis SetUp” form, select the “Tools” menu button and click the “View Yearly Distribution Chart” button. The form Distribution of Remaining Service Life appears, as shown in Figure 36. Enter in the first year of the analysis to view the distribution.
Figure 36. Distribution of RSL Form
Figure 37 shows the distribution of the system in 2001. This is the current RSL Distribution of the road network. To observe the effects of the analysis click the “Previous Year” or “Next Year” button. The respective distribution for those years is shown.

83
Figure 37. Distribution of RSL (2001)

84
Modifying Treatment Costs The program allows the pavement manager to account for changes in treatment costs. To access this option from the Analysis Setup form, select the “Tools” menu button and click the “Edit Cost Tables” button. Figure 38 shows the Edit Costs of Treatment form below. To make changes, enter the change in the respective cell and click the “Update Changes” button. A confirmation verifying, “The changes you requested will be updated in the database,” appears. Click “OK” and the value will be updated. Using inaccurate costs can have a drastic effect on the results of the analysis.
Figure 38. Edit Costs Form

85
Updating Distress Relationships This program is based on an accurate distress survey. All of the information used for reporting and analysis is linked to a table including a distress rating, RSL, and a recommended treatment. To access these tables, select the Tables menu from the programs start page and click the “Edit Distress Tables” button. By clicking the appropriate button, the Distress Tables form that appears, shown in Figure 39, will access the distress table for each distress type. Figure 40 shows the distress table for fatigue cracking. The program calculates the RSL and a recommended treatment by analyzing each distress and determining a governing distress.
Figure 39. Distress Tables Form
Figure 40. Fatigue Cracking Distress Table
This form allows the user to update the distress tables by changing the RSL or selecting a new Recommended Treatment for each distress rating and then clicking the “Update Changes” button. A confirmation appears and the changes will be made to the database. This same operation can be done for all 8 distress types shown in Figure 39. Note: This will not affect the roads that have already been inventoried, but it will affect those re-inventoried or added to the system later.
Pull-Down Menu-
Change Recommended
Treatment Change the RSL for the
given Distress

86
Define The Recordset TAMS also allows the user to analyze groups of roads smaller than the entire road system. By selecting the Define the Recordset from the Analysis/Reports menu the user can specify the group of roads to analyze based on Functional Classification, Jurisdiction, District, etc.

87
Signs and Sign Support Module
Data Needed to Begin Importing Sign Support Map – TAMS is most effective when an accurate GIS Map of the transportation system is used. Normally, the LTAP Center uses GPS to map the sign network and create an ESRI shapefile. When this is not possible, the LTAP Center assists in making a variety of formats, including ESRI coverages and AutoCad drawings, compatible with TAMS.
Database – A standard database (usually Microsoft Access) is used in the program. Any changes made to this database may cause problems. Please call the Utah LTAP Center before making changes.
Beginning Screen Components
Figure 41 shows the starting screen of TAMS.
Figure 41. Starting Screen

88
Opening the Database In order to begin using the signs module, a database containing sign and sign support data must be specified: click on the File Menu, then Open, then Database. An Open File dialog box will appear asking the user to specify the database. When the database is selected and the “Open” button clicked, the user will be returned to the starting screen to load maps and view information. If an existing database is not available (you are starting from scratch), click on File Menu, then New, then Database, then Signs. A Save As dialog box will appear asking the user to specify where the database is to be saved. When the save button is clicked, a database with the required tables is created and opened for use. The Map Feature As previously stated, TAMS uses a map interface to inventory and survey the transportation system. For signs, this requires a GIS-based map of the support locations to begin the inventory process as outlined in the section “Data Needed to Begin.” In the Signs Module only the Sign Supports are mapped. To load the GIS map for the Sign Supports, first select the Signs module button, then go to File, Open, Layer and choose the shapefile from the open file form. This will open the selected shapefile in the program and save the path to the directory in the database so that the next time the database is opened the shapefile will open automatically. With a base map in place, the map feature becomes the data-collection and editing tool for the information stored in the database. Figure 13 from the Pavements section shows the map feature and outlines the basic components.
Summary of Main Menu Components (Signs)
File Menu New
- Database – Creates a new Signs database with all of the necessary tables needed to collect data using TAMS
- Map – Clears the current map - Layer – Adds a layer to the existing map
Open - Database – Specifies a database to use
Exit Program – Shuts down the program Inventory/Condition Survey Menu
- Edit Sign Inventory – Allows editing independent of the map; uses a search mechanism to find the road name

89
- Set Inventory Defaults – Sets default values to speed up the inventory process.
Reports Menu
- Support Report – Creates a report containing the condition of supports and their associated signs
- Report Designer – Allows the user to custom design a report with the desired title and field data.
About LTAP Menu
- LTAP Center – Provides information about the Utah LTAP Center
Initial Support/Sign Inventory There are three ways to enter data for a new Support and its associated signs:
1. Use the map to identify features on which to add information: select the identify button on the toolbar and select the support on the map
2. Type in the Support ID number in the box at the top of the map and press Enter 3. Go to the Inventory/Condition Survey Menu and select Edit Sign Inventory
If options 1 or 2 are selected, the resulting form will only display the support and
associated signs selected. If option 3 is selected, a listing of all supports and associated signs will be displayed.
When a support is selected that has not been inventoried previously, the message box
shown in Figure 42 will appear.
Figure 42. Add New Record Information Box
The Information box indicates the support selected has no information stored in the database. Click OK, and the Sign Input form appears, as shown in Figure 43. The top section of the form is to add information pertaining to the sign support. The bottom section of the form contains the information for the individual signs attached to that support.

90
Figure 43. Sign Support and Sign Inventory Form
For an explanation of the individual fields on the sign inventory form see Appendix B. To save information for a sign support and its signs, enter the required information in the support section and click save. Once the information has been saved, press the “Add Sign” button to add information to for a sign and click on save when the information is entered. To add additional signs click on the add sign button again and repeat the process described previously.
The figure below shows a possible error that may be given while trying to save the sign
or support information. If all of the Support or Sign information is not entered, the dialog box in Figure 44 appears.
Figure 44. Information Missing Dialog Box

91
If the information is formatted correctly, the dialog box in Figure 45 appears, indicating the database was updated with the new information. To edit the information, click on the support again. For information on editing, proceed to the next section.
Figure 45. Database Updated Dialog Box
Editing Information To edit information about a specific support and/or its signs, click the “identify” button on the mapping toolbar shown in Figure 13. This allows the user to select features on the map. If the support has information already stored for it, the Sign Input form appears, as shown in Figure 46.
Figure 46. Sign Input Form

92
This form allows the user to change or add information for the Support or Sign. Note that in order to display the information for a sign it must first be selected in the sign window (R1-1 for Figure 46). To modify information on the left side of the form, make the desired changes and click the “Save” button. The confirmation dialog box shown in Figure 47 appears.
Figure 47. Confirmation Dialog Box
Editing Supports and/or Signs Alternative Method In addition to utilizing the map to edit previously inventoried supports and/or signs, the following method is available:
1. From the starting screen go to the Inventory\Condition Survey Menu and click “Edit Sign Inventory.” The Sign Input form (shown in Figure 43) appears.
2. In the Sign Input form a list of all of the previously inventoried supports (in ascending order) will be shown in the supports window. The user can scroll through the supports and click on one to view its information
3. Once the support number is selected, the signs associated with that support will be listed in the sign section. To view the information for a particular sign the user must click on the sign and the information will appear.
Adding Supports (without map information) Adding supports (without using the map) can be done in the map feature. By entering a unique support ID and pressing Enter, the program will proceed to the Add Inventory form. Note: Record these additional support ID’s. They will not be tied to the map until the supports are mapped and added to the base map. It will be necessary to use the same support ID number when mapping the supports as was used to inventory the support in the program. If this is not done the inventoried data will not be linked to the correct feature on the map.

93
Documenting Comments, Viewing Pictures, Entering Treatments, and Viewing History
Once the Edit Inventory Information form is open (as shown in Figure 48), the buttons on the form allow for tracking of installation dates, entering comments, and viewing pictures. The forms and viewing tools are shown in the figure.
Figure 48. Edit Inventory Information Form
Storing Pictures Pictures must be stored in a directory on a PC or a server that can be accessed from the computer on which TAMS is installed. In order to link the pictures to the correct features a table must be built in the database that links Location ID to the picture number. In order for the program to recognize the link, the pictures must be JPEG type files. Pictures can be stored in the database by using the picture form accessed through the Sign Input form. This will create the table needed for TAMS to link the pictures to the correct features. However, building the table this way can only be done one picture at a time, which is very time consuming if there are a number of pictures to be linked. For help on linking large numbers of pictures contact the Utah LTAP Center.
Reporting Functions
Support Report The Support Report reports the following information: Support ID Road Name Address Support Type Support Rating Signs (MUTCD) on the Support Condition of signs
Report Designer The Report Designer allows customization of a report for at least four fields (such as MUTCD, ID number, condition, visibility, etc.). Fields for both signs and supports can be selected. Figure 49 shows the sign input form along with many of the support functions previously discussed

94
Figure 49. Edit Sign Inventory Form and Support Functions

95
Pavement Markings Module

96
Accident Analysis Module

97
Culverts Module

98
Cattle Guards Module

99
Bridges Module

100
Work Order Module

101
Appendix A Field Distress Rating Sheet for Asphalt Roads