taming text: an introduction to text mining cas 2006 ratemaking seminar
DESCRIPTION
Taming Text: An Introduction to Text Mining CAS 2006 Ratemaking Seminar. Prepared by Louise Francis Francis Analytics and Actuarial Data Mining, Inc. April 1, 2006 [email protected] www.data-mines.com. Objectives. Present a new data mining technology - PowerPoint PPT PresentationTRANSCRIPT
Taming Text: An Introduction to Text MiningCAS 2006 Ratemaking Seminar
Prepared byLouise Francis
Francis Analytics and Actuarial Data Mining, Inc.April 1, 2006
Objectives
• Present a new data mining technology• Show how the technology uses a
combination of• String processing functions• Common multivariate procedures available in
statistical most statistical software
• Present a simple example of text mining
• Discuss practical issues for implementing the
methods

Actuarial Rocket Science Sophisticated predictive modeling
methods are gaining acceptance for pricing, fraud detection and other applications
The methods are typically applied to large, complex databases
One of the newest of these is text mining

Major Kinds of Modeling Supervised learning
Most common situation
A dependent variable Frequency Loss ratio Fraud/no fraud
Some methods Regression CART Some neural
networks
Unsupervised learning No dependent variable Group like records together
A group of claims with similar characteristics might be more likely to be fraudulent
Ex: Territory assignment, Text Mining
Some methods Association rules K-means clustering Kohonen neural
networks

Text Mining: Uses Growing in Many Areas
ECHELON Program

Lots of Information, but no Data

Example: Claim Description Field
INJURY DESCRIPTION BROKEN ANKLE AND SPRAINED WRIST FOOT CONTUSION UNKNOWN MOUTH AND KNEE HEAD, ARM LACERATIONS FOOT PUNCTURE LOWER BACK AND LEGS BACK STRAIN KNEE

Objective
Create a new variable from free form text Use words in injury description to create an
injury code New injury code can be used in a predictive
model or in other analysis
A Two - Step Process
Use string manipulation functions to parse the text Search for blanks, commas, periods and other
word separators Use the separators to extract words Eliminate stopwords
Use multivariate techniques to cluster like terms together into the same injury code Cluster analysis Factor and Principal Components analysis

Parsing a Claim Description Field With Microsoft Excel String Functions
Full Description Total
Length
Location of Next Blank First Word
Remainder Length 1
(1) (2) (3) (4) (5)
BROKEN ANKLE AND SPRAINED WRIST 31 7 BROKEN 24
Remainder 1 2nd
Blank 2nd Word Remainder Length 2
(6) (7) (8) (9)
ANKLE AND SPRAINED WRIST 6 ANKLE 18
Remainder 2 3rd
Blank 3rd Word Remainder Length 3
(10) (11) (12) (13) AND SPRAINED WRIST 4 AND 14
Remainder 3 4th
Blank 4th Word Remainder Length 4
(14) (15) (16) (17) SPRAINED WRIST 9 SPRAINED 5
Remainder 4 5th
Blank 5th Word (18) (19) (20)
WRIST 0 WRIST

Extraction Creates Binary Indicator Variables
INJURY
DESCRIPTION
BROKEN
ANKLE
AND
SPRAINED
WRIST
FOOT
CONTU-SION
UNKNOWN
NECK
BACK
STRAIN
BROKEN ANKLE AND SPRAINED WRIST
1 1 1 1 1 0 0 0 0 0 0
FOOT CONTUSION
0 0 0 0 0 1 1 0 0 0 0
UNKNOWN 0 0 0 0 0 0 0 1 0 0 0 NECK AND BACK STRAIN
0 0 1 0 0 0 0 0 1 1 1

Eliminate Stopwords
Common words with no meaningful content
Stopwords A And Able About Above Across Aforementioned After Again

Stemming: Identify Synonyms and Words with Common Stem
Parsed Words HEAD INJURY LACERATION NONE KNEE BRUISED UNKNOWN TWISTED L LOWER LEG BROKEN ARM FRACTURE R FINGER FOOT INJURIES HAND LIP ANKLE RIGHT HIP KNEES SHOULDER FACE LEFT FX CUT SIDE WRIST PAIN NECK INJURED

Dimension Reduction

The Two Major Categories of Dimension Reduction
Variable reduction Factor Analysis Principal Components Analysis
Record reduction Clustering
Other methods tend to be developments on these

Correlated Dimensions
Ultimate Loss (000s)6005004003002001000
Ultimate Loss &
ALAE (000s)600 500 400 300 200
100
Ult
imat
e A
LA
E (
000s
)
100
80
60
40
20
0
0
-100
ClusteringClustering
Common Method: k-means and hierarchical clustering
No dependent variable – records are grouped into classes with similar values on the variable
Start with a measure of similarity or dissimilarity
Maximize dissimilarity between members of different clusters

Dissimilarity (Distance) Measure – Dissimilarity (Distance) Measure – Continuous VariablesContinuous Variables
Euclidian Distance
Manhattan Distance
1/ 22
1( ) i, j = records k=variable
mij ik jkkd x x
1
mij ik jkkd x x
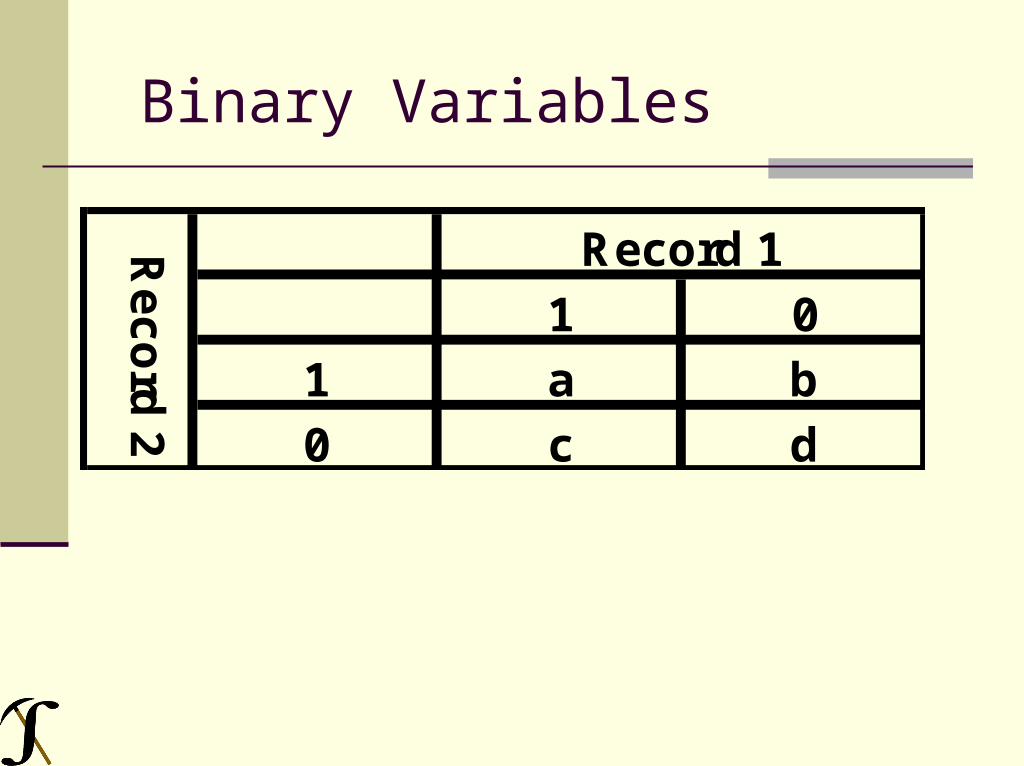
Binary Variables
Record 11 0
1 a b0 c d
Re
co
rd 2

Binary Variables Sample Matching
Rogers and Tanimoto
b cd
a b c d
2( )( ) 2( )
b cd
a d b c

K-Means Clustering Determine ahead of time how many clusters or
groups you want Use dissimilarity measure to assign all records
to one of the clusters
Cluster Number back contusion head knee strain unknown laceration
1 0.00 0.15 0.12 0.13 0.05 0.13 0.17 2 1.00 0.04 0.11 0.05 0.40 0.00 0.00

Hierarchical Clustering
A stepwise procedure At beginning, each records is its own cluster Combine the most similar records into a single
cluster Repeat process until there is only one cluster
with every record in it

Hierarchical Clustering Example
Dendogram for 10 Terms Rescaled Distance Cluster Combine C A S E 0 5 10 15 20 25 Label Num +---------+---------+---------+---------+---------+ arm 9 foot 10 leg 8 laceration 7 contusion 2 head 3 knee 4 unknown 6 back 1 strain 5
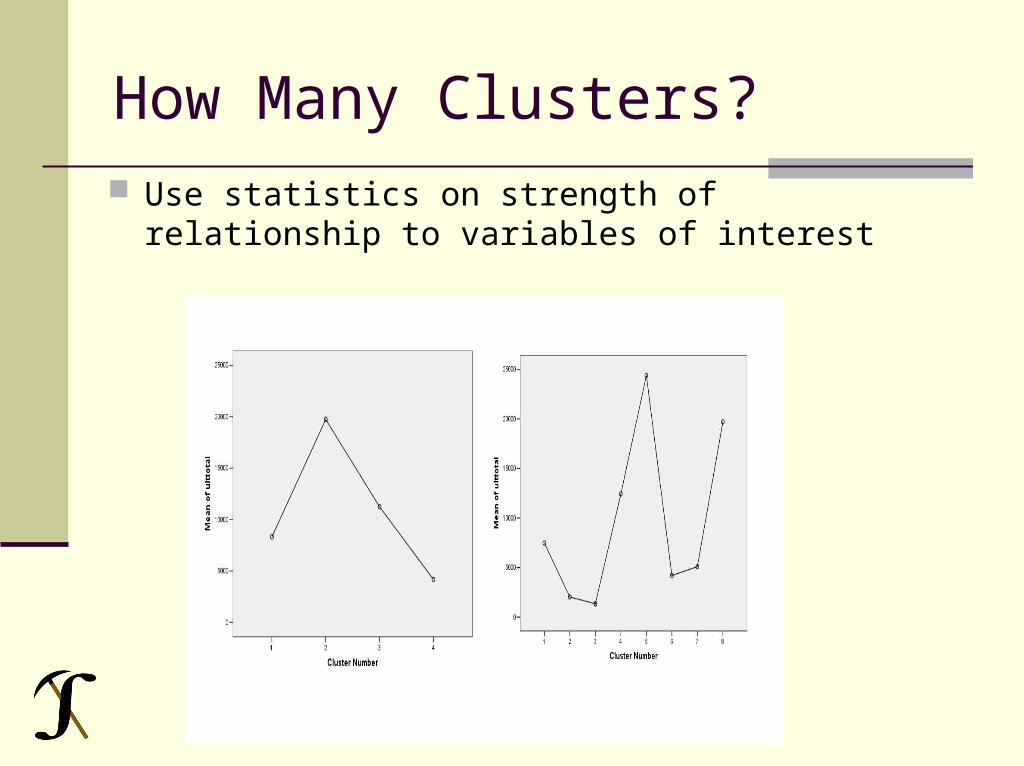
How Many Clusters? Use statistics on strength of relationship to
variables of interest

A Statistical Test for Number of Clusters Swartz Bayesian
Information Criterion
~ ( ) NX μ, Σ (2.8) where is a vector of random variables is the centroid (mean) of the data and
is the variance-covariance matrix
X μ
Σ
1
log ( , ) p*log(N)2
BIC L X M (2.9)
where log(L(X,M)) is the logliklihood function for a model, p is the number of parameters, N the number of records, is a penalty parameter, often equal to 1

Final Cluster Selection
Cluster Back Contusion head knee strain unknown laceration Leg
1 0.000 0.000 0.000 0.095 0.000 0.277 0.000 0.000 2 0.022 1.000 0.261 0.239 0.000 0.000 0.022 0.087 3 0.000 0.000 0.162 0.054 0.000 0.000 1.000 0.135 4 1.000 0.000 0.000 0.043 1.000 0.000 0.000 0.000 5 0.000 0.000 0.065 0.258 0.065 0.000 0.000 0.032 6 0.681 0.021 0.447 0.043 0.000 0.000 0.000 0.000 7 0.034 0.000 0.034 0.103 0.483 0.000 0.000 0.655 Weighted Average 0.163 0.134 0.120 0.114 0.114 0.108 0.109 0.083

Use New Injury Code in a Logistic Regression to Predict Serious Claims
GroupInjuryBAttorneyBBY _210
Y = Claim Severity > $10,000
Mean Probability of Serious Claim vs. Actual Value
Actual Value
1 0 Avg
Pro
b 0.31 0.01

Software for Text Mining-Commercial Software Most major software companies, as well as some
specialists sell text mining software These products tend to be for large complicated
applications, such as classifying academic papers They also tend to be expensive
One inexpensive product reviewed by American Statistician had disappointing performance

Software for Text Mining – Free Software A free product, TMSK, was used for much of the
paper’s analysis Parts of the analysis were done in widely
available software packages, SPSS and S-Plus (R )
Many of the text manipulation functions can be performed in Perl (www.perl.com) and Python (www.python.org)
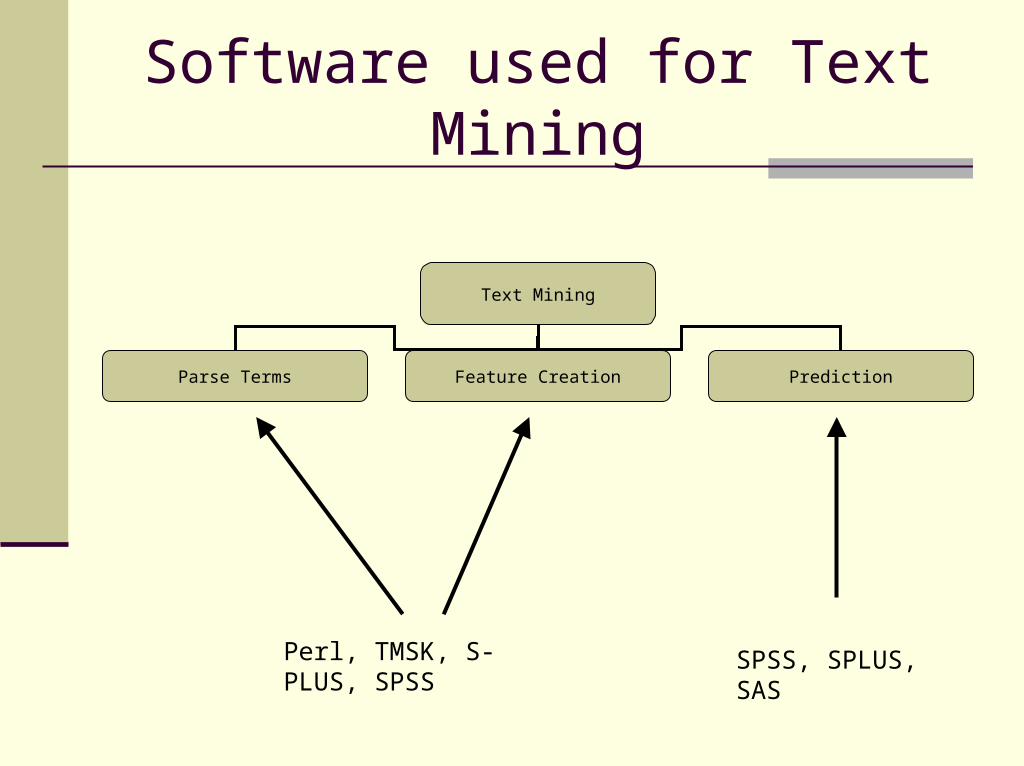
Software used for Text Mining
Text Mining
Parse Terms Feature Creation Prediction
Perl, TMSK, S-PLUS, SPSS
SPSS, SPLUS, SAS
Perl
Free open source programming language www.perl.org Used a lot for text processing Perl for Dummies gives a good introduction

Perl Functions for Parsing $TheFile ="GLClaims.txt"; $Linelength=length($TheFile); open(INFILE, $TheFile) or die "File not found"; # Initialize variables $Linecount=0; @alllines=(); while(<INFILE>){ $Theline=$_; chomp($Theline); $Linecount = $Linecount+1; $Linelength=length($Theline); @Newitems = split(/ /,$Theline); print "@Newitems \n"; push(@alllines, [@Newitems]); } # end while

References
Hoffman, P, Perl for Dummies, Wiley, 2003 Weiss, Shalom, Indurkhya, Nitin, Zhang,
Tong and Damerau, Fred, Text Mining, Springer, 2005

Questions?