takafumi tsukasaki apa proofs
TRANSCRIPT
APA
PRO
OFS
Democracy Under Uncertainty: The Wisdom of Crowds and theFree-Rider Problem in Group Decision Making
Tatsuya KamedaStanford University
Takafumi TsukasakiHokkaido University
Reid HastieUniversity of Chicago
Nathan BergUniversity of Texas at Dallas
We introduce a game theory model of individual decisions to cooperate by contributing personalresources to group decisions versus by free riding on the contributions of other members. In contrast tomost public-goods games that assume group returns are linear in individual contributions, the presentmodel assumes decreasing marginal group production as a function of aggregate individual contributions.This diminishing marginal returns assumption is more realistic and generates starkly different predictionscompared to the linear model. One important implication is that, under most conditions, there existequilibria where some, but not all, members of a group contribute, even with completely self-interestedmotives. An agent-based simulation confirmed the individual and group advantages of the equilibria inwhich behavioral asymmetry emerges from a game structure that is a priori perfectly symmetric for allagents (all agents have the same payoff function and action space but take different actions in equilibria).A behavioral experiment demonstrated that cooperators and free riders coexist in a stable manner ingroups performing with the nonlinear production function. A collateral result demonstrated that, com-pared to a dictatorial decision scheme guided by the best member in a group, the majority/pluralitydecision rules can pool information effectively and produce greater individual net welfare at equilibrium,even if free riding is not sanctioned. This is an original proof that cooperation in ad hoc decision-makinggroups can be understood in terms of self-interested motivations and that, despite the free-rider problem,majority/plurality decision rules can function robustly as simple, efficient social decision heuristics.
Keywords: group decision making under uncertainty, free-rider problem, majority/plurality rules,marginally diminishing group returns, evolutionary games, behavioral experiment
Every human society relies on groups to make important deci-sions because, among other advantages, groups have moreproblem-solving resources than any individual member (e.g., Kerr& Tindale, 2004). Indeed, there are many tasks that can beachieved only by a group effort and that could never be accom-plished by one individual or by many individuals working sepa-rately. For example, groups of geologists, engineers, demogra-phers, and business executives have complementary skill sets that
could allow them to make much more precise decisions aboutwhere to locate a large construction project than any one of theindividuals in these groups could alone. Similarly, in a primitivesetting, five tribesmen could cooperate to decide where to foragefor prey much more effectively than if all worked independently.
Despite such a potential for collective wisdom, there is a funda-mental trade-off between selfish, individualistic goals and the moregeneral social welfare. Participation in a group activity is often de-scribed as a sacrifice of personal utility. Who has not ponderedwhether to blow off preparation for a group assignment (e.g., not tostudy the candidates’ resumes before a hiring committee meeting, toshirk one’s homework before a joint study committee meeting, etc.)and to free ride on the efforts of those who have fulfilled their socialobligation? Many theoretical analyses of small-group cooperationconceptualize group enterprises as social dilemmas and treat cooper-ative behavior as a puzzle (Dawes, 1980). In social dilemma situa-tions, the personal payoff to an individual group member is alwaysless when she or he cooperates in the group enterprise than it wouldbe if she or he acted as a free rider, even though the overall groupwelfare is larger when all members cooperate than when nobodycooperates. Consistent with the sacrifice theme, most behavioral ex-periments on social dilemmas show that average contributions topublic goods deteriorate significantly after a few iterations if nopunishment opportunity exists (e.g., Fehr & Gachter, 2002; Herr-mann, Thöni, & Gachter, 2008; for reviews, see Camerer, 2003; Fehr
Tatsuya Kameda, Center for Advanced Study in the Behavioral Sci-ences, Stanford University; Takafumi Tsukasaki, Department of Behav-ioral Science, Hokkaido University, Sapporo, Japan; Reid Hastie, Centerfor Decision Research, Booth School of Business, University of Chicago;Nathan Berg, School of Economic, Political and Policy Sciences, Univer-sity of Texas at Dallas.
This study was supported by Grant-in-Aid for Scientific Research17330133 from the Ministry of Education, Culture, Sports, Science andTechnology of Japan to Tatsuya Kameda. This article was prepared whileTatsuya Kameda was a residential fellow of the Center for Advanced Studyin the Behavioral Sciences at Stanford University, 2008–2009. TakafumiTsukasaki died on January 23, 2005, at age 25.
Correspondence concerning this article should be addressed to TatsuyaKameda, Department of Behavioral Science, Hokkaido University, Bun-gakubu, N10 W7 Kita-ku, Sapporo 060-0810, Japan. E-mail: [email protected]
Psychological Review2010, Vol. ●●, No. ●, 000–000
© 2011 American Psychological Association 0033-295X/10/$12.00 DOI: 10.1037/a0020699
1
AQ: 1
tapraid5/z2q-psycho/z2q-psycho/z2q00410/z2q2224d10z xppws S�1 7/23/10 8:24 Art: 2010-0021
APA
PRO
OFS
& Fischbacher, 2003; Ledyard, 1995). Even with an alternativepublic-goods game featuring a preliminary binding commitmentround, which produces more theoretical and empirical support for atleast some players to make social contributions, the prevailing inter-pretation holds that cooperation is difficult to sustain (Cason, Saijo, &Yamato, 2002; Cason, Saijo, Yamato, & Yokotani, 2004; Saijo &Yamato, 1999). In conventional group-production and problem-solving tasks, social psychological research has provided considerableevidence of social loafing (Latane, Williams, & Harkins, 1979; seealso Kerr & Tindale, 2004; Williams, Harkins, & Karau, 2003, forreviews). If members of small decision-making groups (e.g., juries,panels, committees) are playing such a game, the theory predicts thatcooperation is hard to sustain without enforcement mechanisms. Thisframing of group enterprises as social dilemmas leads to a pessimisticview of groups as problem solvers or decision makers and implies thatpublic goods requiring group cooperation will be severely undersup-plied.
The above sketch illustrates a fundamental gap between the twoimages of group decision mechanisms—a highly intelligent devicethat can achieve collective wisdom versus a defective social pro-cess that degrades toward suboptimal performance (Janis, 1972).How can one reconcile the two contrasting images? The centralpuzzle is as follows: How can the “wisdom of crowds” (Sur-owiecki, 2004) be sustained in face of the free-rider problem? Dogroups require some policing mechanism that enforces members’contributions toward group enterprises to yield collective wisdom?
Is Group Decision Making Necessarily a Social Dilemma?
To defend the viability of group decision processes, some socialchoice theorists have argued that people may feel good, experiencingexpressive benefits (Brennan & Lomasky, 1993), when they contrib-ute to the functioning of a group (Downs, 1957) or when they fulfillcivic duties (Meehl, 1997; Riker & Ordeshook, 1973). Survey datafrom large-scale elections provide modest support for this view, whileidentifying other social psychological factors as well, including socialnorms (Knack, 1992) and cognitive biases (Opp, 2001). Applying thisview to small-group decision making, we would expect some peopleto be cooperative—for example, turning out for group meetings,engaging in costly information search prior to meetings—driven bythese prosocial motives.
Although prosocial motives underlie some contributions to groupenterprises, such an account begs questions concerning the ultimatesources of these motives (see Posner, 2000). The present articleproposes an alternative theoretical framework in which to interpretpositive contributions to group enterprises without invoking prosocialmotives. After all, there must be some personal advantage to individ-ual members in cases where no collection of individuals acting inde-pendently could achieve even part of the group product that can beachieved by the collective. Even in tasks where contributions areincremental, we argue that contrary to the social dilemma interpreta-tion, cooperation can in many real-world and theoretical contexts (i.e.,with diminishing marginal group returns to individual contributions)be both self-interested and beneficial to the group. Such an analysiswould explain the widespread cooperation in human societies as afunction of the benefits of individual cooperation without adding anynew prosocial motives. Our argument draws on a diverse sample ofempirical and theoretical literatures, ranging from theoretical biologyto experimental economics. We first analyze structures of various
group tasks in natural settings, in terms of functional relations be-tween members’ inputs and group productivity (McGrath, 1984;Steiner, 1972). We then discuss the implications of this analysis forcooperation in group decision making.
The Ubiquity of the Marginally Diminishing ReturnsGroup-Production Function in NaturallyOccurring Tasks
When a group of people collaborates to make a decision or toproduce some other tangible good (e.g., investment committee, stra-tegic planning staff, production line), productivity usually increasesmonotonically with increases in group size, at least over some range.Yet the relationship often falls short of linearity. Although we cannotconduct a census of all group-production tasks in society, we areconfident that the almost universal relationship between group sizeand productivity is monotonically increasing but with marginallydiminishing returns over an appropriately specified range in groupsize. This can be observed in many natural settings.
The behavioral ecology literature studying animal behavior pro-vides a useful starting point to see why this is the case. Marginallydiminishing returns are common in many systems of the animalkingdom, including social vertebrates and social insects (Foster,2004). For example, sentinel behavior of many mammals and birdsis a collective endeavor with marginally diminishing returns (Bed-nekoff, 1997; Trivers, 1971). Think of it this way: If one iscamping with a group of 10 people, there are much larger benefitsfrom the first and perhaps second person staying awake to warn theother campers about approaching bears than there are from theninth and 10th campers, whose contributions generate virtuallyzero marginal benefits, staying awake.
To illustrate, let us denote the average probability of a singlesentinel detecting an approaching predator as p. Assuming thatthere is no process loss (Steiner, 1972), the probability that a groupwith n individuals being on watch detects the danger successfullyis then approximated by 1 � (1 � p)n (Laughlin, 1980; Lorge &Solomon, 1955). This means that the group success in vigilanceincreases monotonically but diminishes at the margin, with anincrease in the number of sentinels, n, in the group. Social forag-ing, another key survival task, shares this structure. When a flockof birds is searching for food, discovery of a rich food patch by asingle bird results in other birds joining to forage in the same patch(Giraldeau & Caraco, 2000). The group success in locating a rich foodpatch is thus approximated by the identical function, 1 � (1 � p)n,where p denotes the average probability of a single bird encounteringa rich patch and n refers to the flock size (Barnard & Sibly, 1981; seeFoster, 2004, for other examples in the animal kingdom).
Although many core everyday group-production tasks for hu-mans also revolve around foraging and risk monitoring (seeKameda & Tindale, 2006, for review), groups in these animalexamples are surely nothing more than collections of individuals,where no substantial coordination activities exist. Birds do notdeliberately orchestrate their sentinel or food-searching behavior,and group performance is best described as a probabilistic aggre-gation of individual outputs rather than the product of a systematicgroup design (e.g., group decision making), which is more typicalof human social coordination.
Interestingly, however, explicit coordination efforts do not nec-essarily eliminate the marginally diminishing nature of group
2 KAMEDA, TSUKASAKI, HASTIE, AND BERG
tapraid5/z2q-psycho/z2q-psycho/z2q00410/z2q2224d10z xppws S�1 7/23/10 8:24 Art: 2010-0021

APA
PRO
OFS
production for the following reasons. First, difficulties in coordi-nation among members multiply with group size, and interpersonalconflicts are also likelier to occur, among other production-cuttingsocial factors (see Steiner, 1972; Thompson, 2004, especiallyChapter 2, for comprehensive reviews). Second and more impor-tant, the fundamental structure of many natural tasks mandatesdiminishing returns in productivity from later contributions. Wheninformation is redundant or task-relevant skills overlap from mem-ber to member, diminishing returns are inevitable even with per-fect coordination (Clemen & Winkler, 1999; Makradakis & Win-kler, 1983), and when any task is not perfectly divisible intoindependent subtasks, individual performances must be somewhatredundant, producing diminishing productivity as more individualsare added to the collective enterprise.
For example, consider group judgments that rely on informationaggregation, which represents an essential subtask in group per-formance (McGrath, 1984). Members collectively estimate a quan-tity, such as the future price of a stock. Let us presume that thegroup estimate is approximated by the arithmetic mean, or simpleaverage, of the individual estimates, which is a valid description ofmany behavioral judgment aggregation processes (see Clemen &Winkler, 1999; Hastie, 1986; Kerr, MacCoun, & Kramer, 1996, forreviews). Furthermore, if individual estimates have equal signal-to-noise ratios and vary around the true value of the stock pricewith uncorrelated random errors, the arithmetic mean is a statisti-cally optimal aggregation rule (Larrick & Soll, 2006; Surowiecki,2004). For an average computed from a randomly drawn sample,the law of large numbers tells us the group estimate shouldconverge on the true value, and well-known calculations of thevariance of the arithmetic mean show explicitly that the precisionof this group estimate improves with each additional observation(i.e., an individual’s judgment in the present example). The reduc-tion in expected squared error by adding one more member to ann-person group,
�2
n�n � 1�� � �2
n � 1�
�2
n � ,
is greater than zero, where �2 is the variance of the individualestimates. However, note that the marginal improvements in theaggregate estimate (in terms of smaller random deviations from thetrue value) diminish with increasing group size, n (see Condorcet,1785/1994, for an analogous proof when the judgment is categor-ical, e.g., between political candidates).
Indeed, if we turn to classic analyses of group performance andproductivity in social psychology (McGrath, 1982; Steiner, 1972),we find that many abstract task types imply that group perfor-mance indices (amount of goods produced, time to produce, ac-curacy of estimates) will be related to group size with a monoton-ically increasing but marginally diminishing returns function. Thisincludes decisions based on unanimous, majority, and truth-winsgroup decision rules (see Condorcet, 1785/1994; Smoke & Zajonc,1962); disjunctive tasks (Steiner, 1972) where a success of onlyone member is sufficient to achieve a collective goal (e.g., riskmonitoring, resource finding, and other eureka problems; seeKameda & Tamura, 2007; Laughlin, 1980; Lorge & Solomon,1955; Taylor & Faust, 1952); and additive tasks (Steiner, 1972)where members’ inputs are summed to determine an overall groupperformance (e.g., group estimation by averaging, physical tasks
as exemplified by a tug of war; see Hastie, 1986; Ingham, Lev-inger, Graves, & Peckham, 1974; Kravitz & Martin 1986). Theonly clear exceptions to this generalization are conjunctive tasks(Steiner, 1972), where the weakest link member determines theoverall group performance and more members mean poorer per-formance, and synergistic tasks, where the group-production func-tion would be positively accelerated. We know of no examples ofthe deliberate use of groups to solve conjunctive tasks (unlessinstitutional or situational constraints impose conjunctive task de-mands), and we know of very few examples of verified synergisticgroup performances in the scientific literature (see Larson, 2009,for a recent comprehensive review).
In summary, a marginally diminishing group-production func-tion seems to apply in many group performance domains in naturalsettings. Perhaps because of the mathematical convenience of thelinear group-production function, this widespread diminishingmarginal returns feature is conspicuously missing from most of thegroup performance and public-goods literatures (see also Kerr,1983, for one of early attempts to link group performance withsocial dilemmas). The linear public-goods model assumes thateach individual’s contribution yields a constant return for thegroup and that the return, which is shared evenly by all members,is less than the individual cost of cooperation, regardless of thenumber of other contributors. This implies the overly pessimisticprediction that one should almost never expect to see contributorsto public goods because, at all levels of inputs in the group-production function, defection is the dominant strategy (Ledyard,1995; but see Laury & Holt, 2008).1
1 Laury and Holt (2008) provided a survey of the economics literatureregarding nonlinear public-goods games. To understand the motivation thathas led economists to study nonlinear public-goods games, which is verydifferent from the present study’s motivation, it is helpful to recall that thestandard linear public-goods game most frequently studied in laboratoryexperiments has a unique Nash equilibrium in which all group memberscontribute zero. Thus, the theoretical model upon which most public-goodsexperiments are based predicts universal and absolute free riding. Incontrast to this theoretical prediction, participants in experiments usuallycontribute significantly more than zero. These contributions typically de-cline with repeated trials, but contributions remain well above zero evenafter as many as 60 rounds. Interpreting this frequently replicated findingof greater than zero contributions in linear public-goods games remainsdifficult, however, because of the statistical difficulty of measuring close-ness to a boundary in any action space (in this case, the zero-contributionNash equilibrium). At a boundary point in participants’ action space,deviations can occur only in one direction; random error of any kind willpush empirical averages away from their true value, and the law of largenumbers no longer holds. Faced with this statistical problem of measuringdeviations from an equilibrium located at the boundary of the range ofindividual contributions, economists turned to nonlinear public-goodsgames as a mechanism for generating incentive structures with Nashequilibria located on the strict interior (0 � equilibrium frequency � groupsize) of the range of possible contributions. This is the primary motivationfor most of the existing experimental economics literature on nonlinearpublic goods (see Laury & Holt, 2008). In contrast, this article reconsidersnonlinear public-goods incentive structures as a widespread empiricalregularity and investigates what insights they have to offer to psychologyand the neighboring social science literatures dealing with social dilemmas,information acquisition, and voting behavior, concerning the commonplaceobservation of heterogeneous groups consisting of both cooperators andfree riders.
3DEMOCRACY UNDER UNCERTAINTY
AQ: 2
Fn1
tapraid5/z2q-psycho/z2q-psycho/z2q00410/z2q2224d10z xppws S�1 7/23/10 8:24 Art: 2010-0021

APA
PRO
OFS
Emergence of a Mixed Equilibrium
Given a marginally diminishing production function, is defec-tion still the dominant strategy? The answer turns out to be notnecessarily. A theoretical biologist, Motro (1991), concerned withabstract foraging problems provided a general powerful frame-work in which to analyze this question. Let us suppose that wehave a six-person group and that the group-production function(e.g., mapping the number of contributors who search for foodonto the expected quantity of food available for each member ofthe group, humans, nonhuman animals, robots, etc.) takes a mar-ginally diminishing form as shown in Figure 1. As in socialdilemmas, we assume that the group-production benefit is sharedequally by all group members but that production costs are borneby each producing or contributing member individually (Dawes,1980; Kameda, Takezawa, & Hastie, 2003). The x-axis representsthe number of cooperators, while the y-axis represents the expectedgross return to each member of the group (group gross return/6).Gross refers to the fact that the costs of contributing are not yetrepresented in Figure 1. The production function’s concave in-creasing form generates marginal returns to individual contribu-tions to the group, labeled �n, when the number of cooperatorsincreases from n to n � 1, that are indeed diminishing as moreindividuals contribute.
Motro (1991) analytically identified an evolutionarily stablestrategy (ESS) in this situation: Cooperate as long as the incre-ment, �, exceeds individual cost (denoted c), but switch to defec-tion otherwise.2 In other words, keep cooperating while the con-tribution yields an individually positive expected net return. Notethat, even when the increment � representing the marginal indi-vidual return to contributing is too small to justify the cost tocontribute for an individual, additional contribution by the indi-vidual may still be beneficial to the entire group (i.e., while themarginal individual return, �m, by joining m other cooperators inthe group is less than individual cost, c, aggregate group return,6 �m, may still be greater than the individual cost). This meansthat, as in linear social dilemmas (Dawes, 1980), each individual’srational action may lead to the inefficient level of contributions atthe group level (Pareto inefficient). However, in the nonlinear case
depicted in Figure 1, � is not constant but is a function of thenumber of cooperators. As long as c � �n for some small n, themodel predicts that some members in the group will contribute/cooperate; in other words, the important implication of diminish-ing returns in this empirically more realistic group-productionfunction is that defection is no longer a universally (i.e., over theentire range of number of cooperators) dominant strategy. Thus,many naturally occurring tasks with marginally diminishing returncurves do not necessarily constitute social dilemmas.
Figure 2 reexpresses the production function from Figure 1 as anet (individual gross return � cost) payoff function for a cooper-ator (solid curve) and as a net payoff function for a defector(dashed curve), both expressed as functions of the number of othergroup members who contribute (individual cooperation cost wasfixed at 0.7 in Figure 2). Note that the two curves intersect at anequilibrium, specifying the number that is predicted by the theoryof Nash equilibrium of rationally self-interested cooperators in thegroup. As can be seen in the figure, an individual is personallybetter off cooperating when there are few cooperators and betteroff defecting when there are already several cooperators among theother group members. The net benefits of cooperating or defectingdepend on the frequency of the alternative strategy within thegroup; neither strategy is dominant (Laury & Holt, 2008). Toomany players opting for one strategy reduces its relative profit-ability while increasing the profitability of its alternative, provid-ing an incentive for individuals to switch. Since the two strategiesare mutually constrained in terms of relative profitability, weexpect a mixed equilibrium to emerge (Gintis, 2000; MaynardSmith, 1982). At equilibrium, the group reaches a stable state inwhich complementary proportions of cooperators and defectorscoexist, achieving an average frequency of cooperators given bythe point at which the two individual net payoff curves intersect. InFigure 2, the two curves intersect when the number of othercooperators is between one and two, which predicts two cooper-ators and four defectors on average in the group with the illustra-tive costs and benefits of cooperation in this example.
Group Decision Making Under Uncertainty
Motro’s (1991) model provides a powerful theoretical bench-mark to reconsider realistic cooperation levels in group perfor-mance and public-goods provision (Kerr, 1983; Laury & Holt,2008). We apply this model to a stylized group decision situation,which constitutes a core group-production task in everyday life.We have two goals in this article: (a) to examine the degree towhich Motro’s framework captures members’ cooperation for thegroup enterprise and (b) to examine the effects of various voting
2 In game theory, an ESS is a strategy that, if adopted by all players ina population, cannot be invaded (outperformed) by any competing alter-native strategy (Gintis, 2000; Maynard Smith, 1982). Suppose a situationin which a group is composed only of individuals with the focal strategy x.Now a question arises concerning if such an all-x group is robust enoughto block a small number of individuals with another strategy (y) fromintruding into the group. Does Strategy x outperform Strategy y in terms ofaverage profit? If Strategy x actually outperforms Strategy y, it can blocky’s intrusion into the group, analogous to biological competition for anecological niche. If Strategy x is dominant in this sense over all otherstrategies in the game, then Strategy x is called an ESS.
0
0.5
1
1.5
2
2.5
3
3.5
4
0 1 2 3 4 5 6
Expe
cted
gro
ss re
turn
to e
ach
grou
p m
embe
r
Number of cooperators in a group
δ0
δ1
δ2
δ3 δ4
δ5If c <δ, cooperate for
group production.
If c >δ, defect.
Figure 1. An illustration of a marginally diminishing return curve (unithere is arbitrary) as a function of number of cooperators. The y-axis hasbeen adjusted to expected gross return to each individual (group grossreturn/6). An evolutionarily stable strategy is defined as follows (Motro,1991): Cooperate as long as the marginal increment (�) exceeds individualcost (c), but switch to defection beyond that.
4 KAMEDA, TSUKASAKI, HASTIE, AND BERG
F1
Fn2
F2
tapraid5/z2q-psycho/z2q-psycho/z2q00410/z2q2224d10z xppws S�1 7/23/10 8:24 Art: 2010-0021

APA
PRO
OFS
rules (e.g., majority/plurality, best member rule) on the quality ofgroup decision outcomes when free riding is possible.
Applicability of Motro’s Model to GroupDecision Making
Suppose that a group of six members needs to select a singlelocation in which they will search together for food. Each memberdecides whether to cooperate (produce) by seeking decision-relevant information, an activity with some personal costs, or tofree ride (defect, scrounge) on the decisions of the other members.Obviously, if no member decides to seek information, the groupdecision will be uninformed and far from optimal. Yet it is alsotrue that, if all members seek information, there will be redun-dancy and a loss of potential production value. Motro (1991)proved that it is wasteful for all individuals to seek informationprecisely because of the diminishing marginal returns of the group-production function. We apply this logic to group decision makingunder uncertainty, where the objective value of a choice alterna-tive, or truth (Laughlin, 1980), must be inferred through imperfectstochastic information. We predict that group decision makingunder uncertainty, which forms the core of modern committeemeetings as well as primordial team foraging, would yield a mixedequilibrium in which cooperators and free riders coexist, ratherthan the all-defect equilibrium in social dilemmas (with the unre-alistic linear-additive production function; see also Footnote 1,above). An equilibrium mixture of cooperators and defectors willbe determined by the Motro function.
Robustness of Majority/Plurality Group Decision Rule
Although the argument so far has depicted group decisionmaking as if it were a uniform concept, each group decision setting
entails specific design features. Even if we limit our focus toconsensual decision making (e.g., juries, committees, panels),there are numerous variations about how to implement the groupdecision system. This includes choices of quorum rules, pollingprocedures, aggregation rules, and so on (e.g., Hastie, Penrod, &Pennington, 1983; Kameda, Tindale, & Davis, 2003; Regenwetter,Grofman, Marley, & Tsetlin, 2006). How do these design featuresaffect members’ cooperation levels and consequently determinethe quality of final group decision outcomes? In this article, we testwhether the majority/plurality rule, whereby the option in thegroup’s choice set with the most votes becomes the group’s finalchoice, can sustain members’ cooperation and serve as a robusttruth-seeking decision procedure in uncertain environments(Hastie & Kameda, 2005; Sorkin, Hays, & West, 2001).
Using computer simulations and a behavioral experiment,Hastie and Kameda (2005) evaluated various group decision rulesbased on their adaptive accuracy in choosing the mutually mostbeneficial alternative in an uncertain, simulated test bed environ-ment. These aggregation rules included averaging, the best mem-ber rule, Condorcet majority, majority/plurality, and so on (seeHastie & Kameda, 2005, for details). When the adaptive successstandard is applied to evaluate the rules (Gigerenzer, Todd, & theABC Research Group, 1999; Hammond & Stewart, 2001; Hastie,1986), the majority/plurality rule fares quite well, performing atlevels comparable to much more cognitively taxing rules such asthe averaging rule. The majority/plurality rule also matches thecomputationally demanding Condorcet majority winner that is thecommon standard in evaluations of preferential choice rules(Arrow, 1951; Mueller, 2003; Regenwetter, Ho, & Tsetlin, 2007).These results indicate that, despite its computational simplicity, themajority/plurality rule can achieve surprisingly high levels ofperformance under uncertainty.
In these previous studies, however, it was assumed that every-body would cooperate to support the group enterprise (Hastie &Kameda, 2005; Sorkin et al., 2001). Thus, it is an open questionwhether the majority/plurality rule would be theoretically andbehaviorally successful when there is a personal cost to be aninformed voter. Several key questions in the present researchconcern the performance of the majority/plurality rule under morerealistic assumptions about the group-production function andindividual cooperation costs. If a mixed equilibrium holds (Motro,1991), how efficient is the productivity at the equilibrium underthe majority/plurality group decision rule? Does the majority/plurality rule degrade into a universal free-riding tragedy of thecommons situation where decisions are made by uninformed vot-ers (Downs, 1957; Mueller, 2003)? How does it compare with thegroup outcome guided by the best and brightest benevolent dicta-tor in a group—a logically coherent decision system that has beenpitted against democratic rules in the social choice literature(Arrow, 1951; Laughlin, 2006) and a solution that is selected insome naturally occurring human groups?
In the following, we first report on an evolutionary computersimulation (Kameda et al., 2003; Kenrick, Li, & Butner, 2003;Smith & Conrey, 2007) to determine if there would be a mixedequilibrium in a group-foraging task with significant and stablelevels of cooperation under different group decision rules and thencompare adaptive success of the different decision rules at respec-tive equilibria. Next, we report a behavioral experiment that im-plemented a group-foraging task under uncertainty in an interac-
0
0.5
1
1.5
2
2.5
3
3.5
4
0 1 2 3 4 5
Exp
ecte
d in
divi
dual
net
pay
offs
Number of other cooperators in a group
Cooperator
Defector
Figure 2. Expected individual net payoffs (individual gross return �cost) for a cooperator (solid curve) and a defector (dashed curve), as afunction of the number of other members who cooperate (derived from thegross return curve in Figure 1 with individual cooperation cost fixed at0.7).
5DEMOCRACY UNDER UNCERTAINTY
AQ: 3
tapraid5/z2q-psycho/z2q-psycho/z2q00410/z2q2224d10z xppws S�1 7/23/10 8:24 Art: 2010-0021

APA
PRO
OFS
tive laboratory setup. In both cases, individuals (computer agentsin the simulation study and human participants in the behavioralexperiment) were required to decide whether to cooperate or defectbefore voting on a foraging location.
Evolutionary Computer Simulation
Overview
We relied on an evolutionary simulation model based on Dar-winian logic to explore the implications of the diminishing groupreturns model and to evaluate the theoretical viability of a major-ity/plurality group decision rule when informed participation in thedecision is individually costly. In the evolutionary simulation, wefirst specified a set of behavioral strategies and then let theminteract in the same population (e.g., Axelrod, 1984; Gintis, 2000;Kameda et al., 2003). The strategies were defined in terms of thebasic cooperate (at personal cost) versus defect (at no personalcost) distinction. The Darwinian logic dictates that more successfulstrategies in the current population reproduce at higher rates for thenext generation, analogous to biological evolution in an ecologicalniche. In social scientific applications, such changes are not nec-essarily evolutionary but may reflect, most notably, social imita-tive learning of successful strategies in a group (Gintis, 2000). Weobserved whether such a change in the population structure wouldlead to a stable collective state where the population was domi-nated by a set of strategies (or a strategy) and no further changeswould occur. Such a stable end state is called an evolutionaryequilibrium (Gintis, 2000; Maynard Smith, 1982).
In the following simulations, we formulated four behavioralstrategies in terms of the basic distinction between cooperating (ata personal cost) versus defecting (at no personal cost): (a) whetherto pay a cost to acquire the information needed to make well-informed individual judgments and (b) whether to pay a cost tovote. Individual cooperation (information search and voting) canincrease the quality of group decisions and thus enhance overallgroup return, but it entails a personal cost as well, which presentsa dilemma for the agent in deciding at what level to take part incollective action.
Given such a dilemma, it seems that uncooperative members areunilaterally better off than cooperative members, and we mightexpect them eventually to dominate the population, which wouldyield an all-defect equilibrium. On the basis of Motro’s (1991)model, we posited that a mixed equilibrium would emerge, whereboth cooperative and uncooperative individuals would coexist inthe population. We tested this prediction in two populations gov-erned by contrasting decision rules: the majority/plurality rule(based on the winner with the most votes in a one-member–one-vote election) versus the best member rule (where the memberwith the best long-term ability/accuracy dictates the choice). As abenchmark, we also examined a population operating with therandom member rule (where a randomly chosen member dictatesthe choice to the other members), as in Hastie and Kameda (2005).
If a mixed equilibrium did indeed emerge for each population aspredicted by the model, we would consider our second question:Does the majority/plurality rule produce better outcomes in termsof individual net benefit than the best member rule at the respec-tive equilibrium in each population? Is the wisdom of crowdssustained over time, or does the majority/plurality rule unravel intoa free-riding world in which decisions are made predominantly byuninformed voters?
Simulation Method
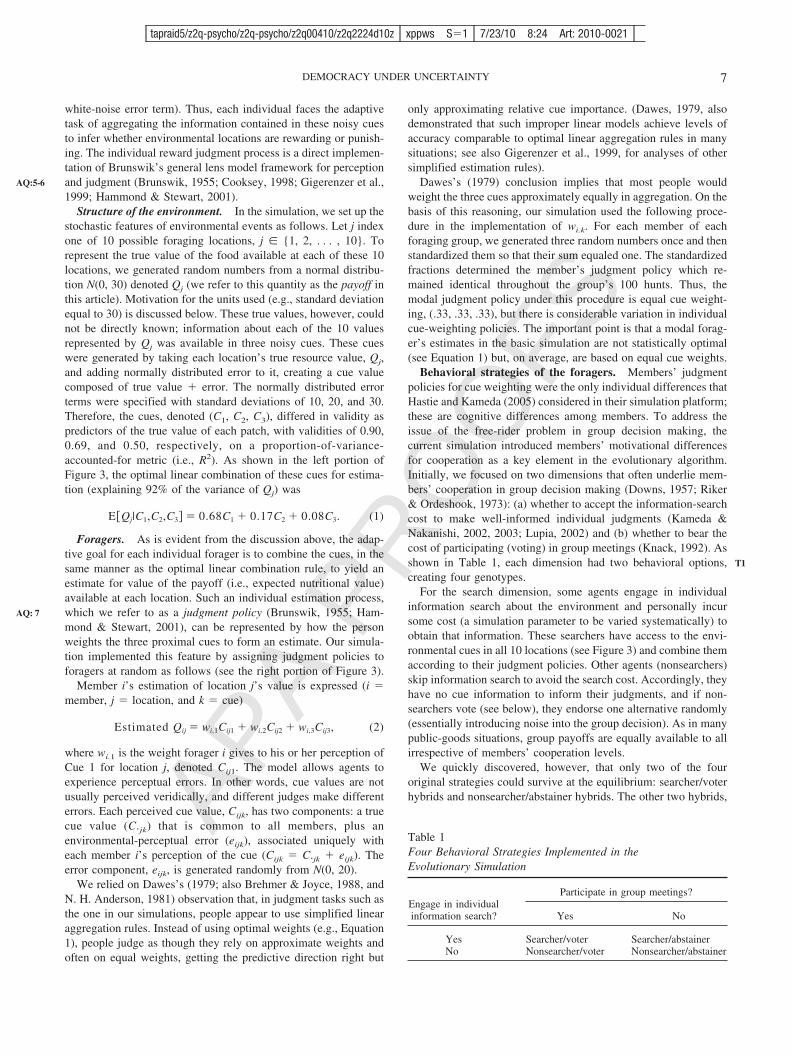
Simulation platform. To illustrate the basic features of oursimulation, we rely on the metaphor of a primitive forager seekingresources at locations in an uncertain physical environment (seeHastie & Kameda, 2005, for more details on the procedure). Thistask represents the essential features of a general decision problemfaced by any organism: which option among a set of alternatives tochoose, given noisy information about the payoff contingent onchoosing each option. The simulation world has two major com-ponents, environmental events, namely, the amounts of reward(gain or loss) available at various locations, and foragers, whosefitness depends on accurate judgments of the environmental events(see Figure 3). The state of an environmental event (reward avail-able) is known probabilistically to foragers through proximal,partially valid cues (i.e., a noisy cue is the true value plus a
Foragers Environmental Events
location j’s value,
Qj
forager i’s estimate of location j’s value,
)
.68
.17
.08
Wi.1
Wi.2
Wi.3
Cij1
Cij2
Cij3
Proximal Cues
Figure 3. Structure of the simulated judgment environment.
6 KAMEDA, TSUKASAKI, HASTIE, AND BERG
AQ: 4
F3
tapraid5/z2q-psycho/z2q-psycho/z2q00410/z2q2224d10z xppws S�1 7/23/10 8:24 Art: 2010-0021
APA
PRO
OFS
white-noise error term). Thus, each individual faces the adaptivetask of aggregating the information contained in these noisy cuesto infer whether environmental locations are rewarding or punish-ing. The individual reward judgment process is a direct implemen-tation of Brunswik’s general lens model framework for perceptionand judgment (Brunswik, 1955; Cooksey, 1998; Gigerenzer et al.,1999; Hammond & Stewart, 2001).
Structure of the environment. In the simulation, we set up thestochastic features of environmental events as follows. Let j indexone of 10 possible foraging locations, j � {1, 2, . . . , 10}. Torepresent the true value of the food available at each of these 10locations, we generated random numbers from a normal distribu-tion N(0, 30) denoted Qj (we refer to this quantity as the payoff inthis article). Motivation for the units used (e.g., standard deviationequal to 30) is discussed below. These true values, however, couldnot be directly known; information about each of the 10 valuesrepresented by Qj was available in three noisy cues. These cueswere generated by taking each location’s true resource value, Qj,and adding normally distributed error to it, creating a cue valuecomposed of true value � error. The normally distributed errorterms were specified with standard deviations of 10, 20, and 30.Therefore, the cues, denoted (C1, C2, C3), differed in validity aspredictors of the true value of each patch, with validities of 0.90,0.69, and 0.50, respectively, on a proportion-of-variance-accounted-for metric (i.e., R2). As shown in the left portion ofFigure 3, the optimal linear combination of these cues for estima-tion (explaining 92% of the variance of Qj) was
EQj|C1,C2,C3� � 0.68C1 � 0.17C2 � 0.08C3. (1)
Foragers. As is evident from the discussion above, the adap-tive goal for each individual forager is to combine the cues, in thesame manner as the optimal linear combination rule, to yield anestimate for value of the payoff (i.e., expected nutritional value)available at each location. Such an individual estimation process,which we refer to as a judgment policy (Brunswik, 1955; Ham-mond & Stewart, 2001), can be represented by how the personweights the three proximal cues to form an estimate. Our simula-tion implemented this feature by assigning judgment policies toforagers at random as follows (see the right portion of Figure 3).
Member i’s estimation of location j’s value is expressed (i �member, j � location, and k � cue)
Estimated Qij � wi,1Cij1 � wi,2Cij2 � wi,3Cij3, (2)
where wi.1 is the weight forager i gives to his or her perception ofCue 1 for location j, denoted Cij1. The model allows agents toexperience perceptual errors. In other words, cue values are notusually perceived veridically, and different judges make differenterrors. Each perceived cue value, Cijk, has two components: a truecue value (C.jk) that is common to all members, plus anenvironmental-perceptual error (eijk), associated uniquely witheach member i’s perception of the cue (Cijk � C.jk � eijk). Theerror component, eijk, is generated randomly from N(0, 20).
We relied on Dawes’s (1979; also Brehmer & Joyce, 1988, andN. H. Anderson, 1981) observation that, in judgment tasks such asthe one in our simulations, people appear to use simplified linearaggregation rules. Instead of using optimal weights (e.g., Equation1), people judge as though they rely on approximate weights andoften on equal weights, getting the predictive direction right but
only approximating relative cue importance. (Dawes, 1979, alsodemonstrated that such improper linear models achieve levels ofaccuracy comparable to optimal linear aggregation rules in manysituations; see also Gigerenzer et al., 1999, for analyses of othersimplified estimation rules).
Dawes’s (1979) conclusion implies that most people wouldweight the three cues approximately equally in aggregation. On thebasis of this reasoning, our simulation used the following proce-dure in the implementation of wi.k. For each member of eachforaging group, we generated three random numbers once and thenstandardized them so that their sum equaled one. The standardizedfractions determined the member’s judgment policy which re-mained identical throughout the group’s 100 hunts. Thus, themodal judgment policy under this procedure is equal cue weight-ing, (.33, .33, .33), but there is considerable variation in individualcue-weighting policies. The important point is that a modal forag-er’s estimates in the basic simulation are not statistically optimal(see Equation 1) but, on average, are based on equal cue weights.
Behavioral strategies of the foragers. Members’ judgmentpolicies for cue weighting were the only individual differences thatHastie and Kameda (2005) considered in their simulation platform;these are cognitive differences among members. To address theissue of the free-rider problem in group decision making, thecurrent simulation introduced members’ motivational differencesfor cooperation as a key element in the evolutionary algorithm.Initially, we focused on two dimensions that often underlie mem-bers’ cooperation in group decision making (Downs, 1957; Riker& Ordeshook, 1973): (a) whether to accept the information-searchcost to make well-informed individual judgments (Kameda &Nakanishi, 2002, 2003; Lupia, 2002) and (b) whether to bear thecost of participating (voting) in group meetings (Knack, 1992). Asshown in Table 1, each dimension had two behavioral options,creating four genotypes.
For the search dimension, some agents engage in individualinformation search about the environment and personally incursome cost (a simulation parameter to be varied systematically) toobtain that information. These searchers have access to the envi-ronmental cues in all 10 locations (see Figure 3) and combine themaccording to their judgment policies. Other agents (nonsearchers)skip information search to avoid the search cost. Accordingly, theyhave no cue information to inform their judgments, and if non-searchers vote (see below), they endorse one alternative randomly(essentially introducing noise into the group decision). As in manypublic-goods situations, group payoffs are equally available to allirrespective of members’ cooperation levels.
We quickly discovered, however, that only two of the fouroriginal strategies could survive at the equilibrium: searcher/voterhybrids and nonsearcher/abstainer hybrids. The other two hybrids,
Table 1Four Behavioral Strategies Implemented in theEvolutionary Simulation
Engage in individualinformation search?
Participate in group meetings?
Yes No
Yes Searcher/voter Searcher/abstainerNo Nonsearcher/voter Nonsearcher/abstainer
7DEMOCRACY UNDER UNCERTAINTY
AQ:5-6
AQ: 7
T1
tapraid5/z2q-psycho/z2q-psycho/z2q00410/z2q2224d10z xppws S�1 7/23/10 8:24 Art: 2010-0021
APA
PRO
OFS
searcher/abstainer and nonsearcher/voter, disappeared in thecourse of Darwinian selection. These two hybrids are evolution-arily irrational behavioral choices in this model in that they cannotsustain themselves (searchers who abstain from voting harm them-selves by wasting resources expended on information search, whilenonsearchers who vote also harm themselves by degrading theaccuracy of group decisions in terms of average payoff). Thus, wecollapsed the 2 2 system of genotypes into a dichotomouscooperator (producer) versus defector (scrounger) classification,which we use from now on in reporting the results of the simula-tion study. (In the behavioral experiment to be reported subse-quently, it remained an empirical question what frequencies ofthese four behavioral genotypes would be observed.)
These strategies were subject to evolutionary selection in thesimulation in that the prevalence of each genotype in the popula-tion was adjusted over time based on the behavioral payoffs thatthey received in the past; more successful strategies reproduced ata higher rate in later generations.3
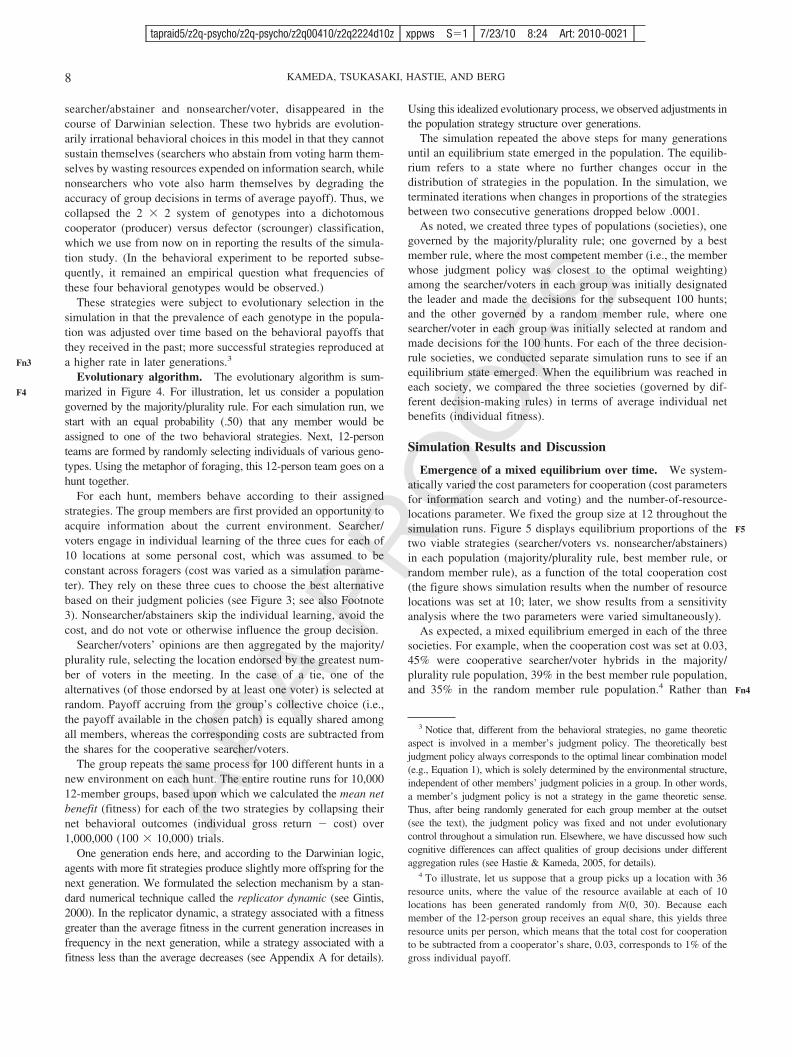
Evolutionary algorithm. The evolutionary algorithm is sum-marized in Figure 4. For illustration, let us consider a populationgoverned by the majority/plurality rule. For each simulation run, westart with an equal probability (.50) that any member would beassigned to one of the two behavioral strategies. Next, 12-personteams are formed by randomly selecting individuals of various geno-types. Using the metaphor of foraging, this 12-person team goes on ahunt together.
For each hunt, members behave according to their assignedstrategies. The group members are first provided an opportunity toacquire information about the current environment. Searcher/voters engage in individual learning of the three cues for each of10 locations at some personal cost, which was assumed to beconstant across foragers (cost was varied as a simulation parame-ter). They rely on these three cues to choose the best alternativebased on their judgment policies (see Figure 3; see also Footnote3). Nonsearcher/abstainers skip the individual learning, avoid thecost, and do not vote or otherwise influence the group decision.
Searcher/voters’ opinions are then aggregated by the majority/plurality rule, selecting the location endorsed by the greatest num-ber of voters in the meeting. In the case of a tie, one of thealternatives (of those endorsed by at least one voter) is selected atrandom. Payoff accruing from the group’s collective choice (i.e.,the payoff available in the chosen patch) is equally shared amongall members, whereas the corresponding costs are subtracted fromthe shares for the cooperative searcher/voters.
The group repeats the same process for 100 different hunts in anew environment on each hunt. The entire routine runs for 10,00012-member groups, based upon which we calculated the mean netbenefit (fitness) for each of the two strategies by collapsing theirnet behavioral outcomes (individual gross return � cost) over1,000,000 (100 10,000) trials.
One generation ends here, and according to the Darwinian logic,agents with more fit strategies produce slightly more offspring for thenext generation. We formulated the selection mechanism by a stan-dard numerical technique called the replicator dynamic (see Gintis,2000). In the replicator dynamic, a strategy associated with a fitnessgreater than the average fitness in the current generation increases infrequency in the next generation, while a strategy associated with afitness less than the average decreases (see Appendix A for details).
Using this idealized evolutionary process, we observed adjustments inthe population strategy structure over generations.
The simulation repeated the above steps for many generationsuntil an equilibrium state emerged in the population. The equilib-rium refers to a state where no further changes occur in thedistribution of strategies in the population. In the simulation, weterminated iterations when changes in proportions of the strategiesbetween two consecutive generations dropped below .0001.
As noted, we created three types of populations (societies), onegoverned by the majority/plurality rule; one governed by a bestmember rule, where the most competent member (i.e., the memberwhose judgment policy was closest to the optimal weighting)among the searcher/voters in each group was initially designatedthe leader and made the decisions for the subsequent 100 hunts;and the other governed by a random member rule, where onesearcher/voter in each group was initially selected at random andmade decisions for the 100 hunts. For each of the three decision-rule societies, we conducted separate simulation runs to see if anequilibrium state emerged. When the equilibrium was reached ineach society, we compared the three societies (governed by dif-ferent decision-making rules) in terms of average individual netbenefits (individual fitness).
Simulation Results and Discussion
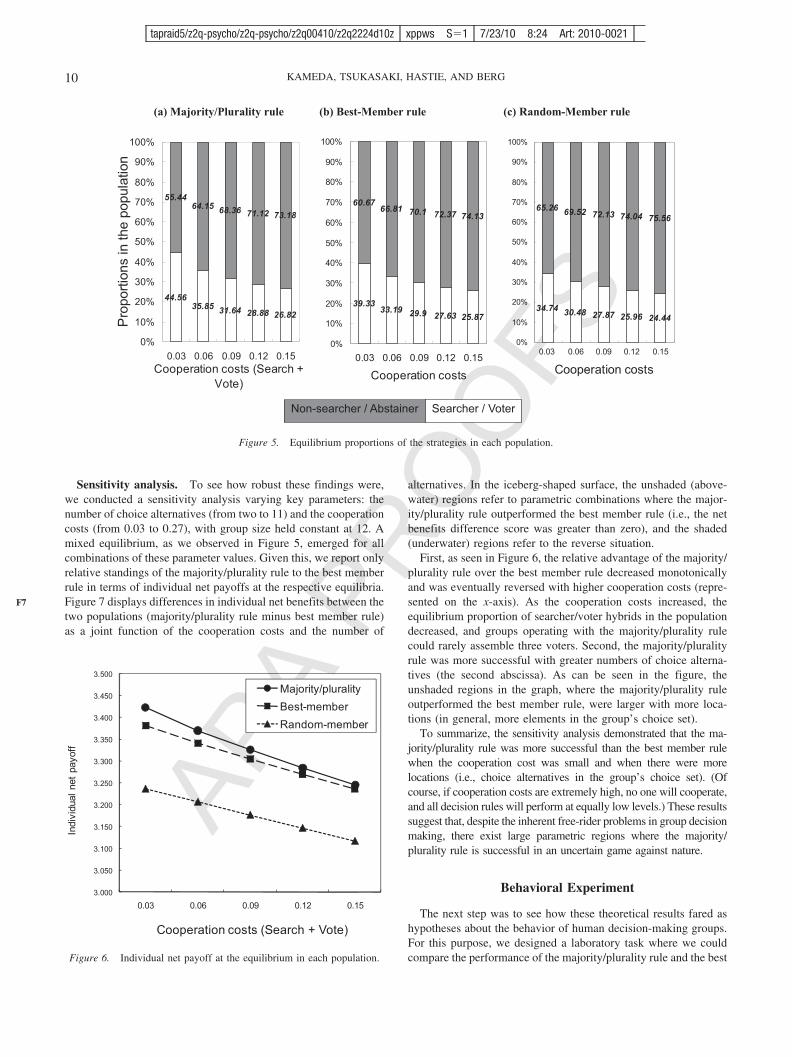
Emergence of a mixed equilibrium over time. We system-atically varied the cost parameters for cooperation (cost parametersfor information search and voting) and the number-of-resource-locations parameter. We fixed the group size at 12 throughout thesimulation runs. Figure 5 displays equilibrium proportions of thetwo viable strategies (searcher/voters vs. nonsearcher/abstainers)in each population (majority/plurality rule, best member rule, orrandom member rule), as a function of the total cooperation cost(the figure shows simulation results when the number of resourcelocations was set at 10; later, we show results from a sensitivityanalysis where the two parameters were varied simultaneously).
As expected, a mixed equilibrium emerged in each of the threesocieties. For example, when the cooperation cost was set at 0.03,45% were cooperative searcher/voter hybrids in the majority/plurality rule population, 39% in the best member rule population,and 35% in the random member rule population.4 Rather than
3 Notice that, different from the behavioral strategies, no game theoreticaspect is involved in a member’s judgment policy. The theoretically bestjudgment policy always corresponds to the optimal linear combination model(e.g., Equation 1), which is solely determined by the environmental structure,independent of other members’ judgment policies in a group. In other words,a member’s judgment policy is not a strategy in the game theoretic sense.Thus, after being randomly generated for each group member at the outset(see the text), the judgment policy was fixed and not under evolutionarycontrol throughout a simulation run. Elsewhere, we have discussed how suchcognitive differences can affect qualities of group decisions under differentaggregation rules (see Hastie & Kameda, 2005, for details).
4 To illustrate, let us suppose that a group picks up a location with 36resource units, where the value of the resource available at each of 10locations has been generated randomly from N(0, 30). Because eachmember of the 12-person group receives an equal share, this yields threeresource units per person, which means that the total cost for cooperationto be subtracted from a cooperator’s share, 0.03, corresponds to 1% of thegross individual payoff.
8 KAMEDA, TSUKASAKI, HASTIE, AND BERG
Fn3
F4
F5
Fn4
tapraid5/z2q-psycho/z2q-psycho/z2q00410/z2q2224d10z xppws S�1 7/23/10 8:24 Art: 2010-0021

APA
PRO
OFS
being dominated solely by the free-riding nonsearcher/abstainerhybrids, the cooperative searcher/voter hybrids sustained them-selves in a stable manner. These results support our hypothesis thatcooperation in group decision making under uncertainty can beconceptualized as a game where a mixed equilibrium exists (Laury& Holt, 2008; Motro, 1991).
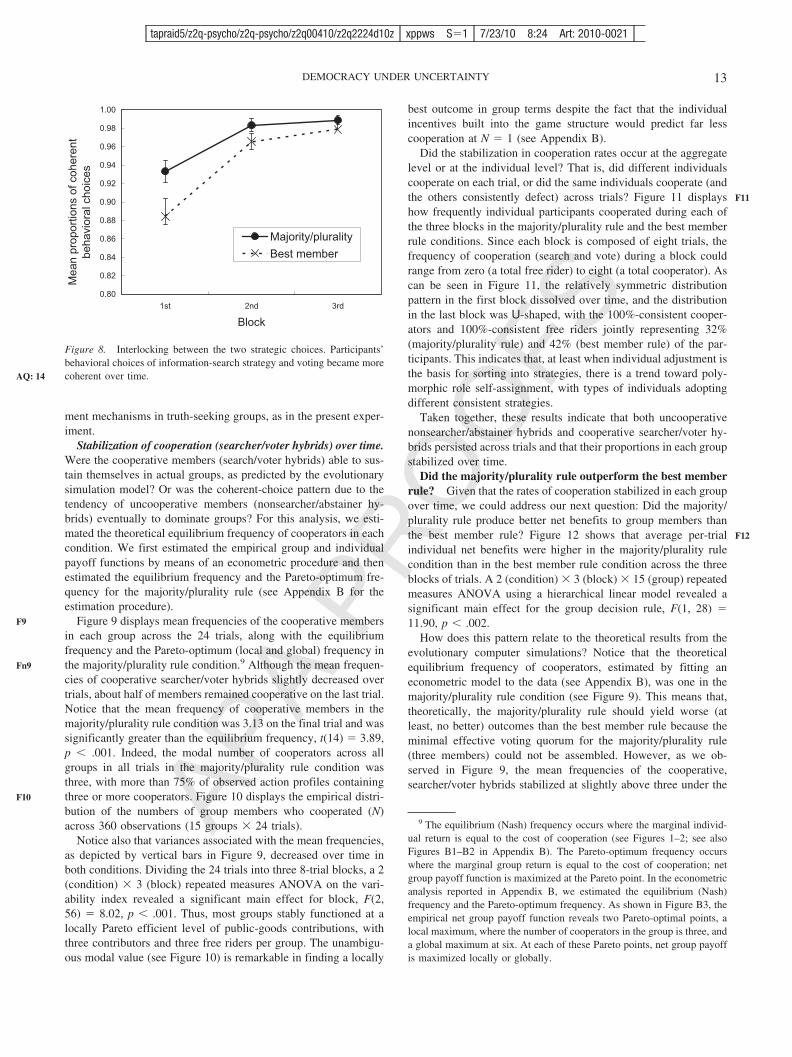
Individual net benefits. Given the emergence of the mixedequilibrium, we could address our next question: Does the major-ity/plurality rule produce better results for individuals in terms ofaverage net benefits than the best member rule when incentives forfree riding exist? Figure 6 displays individual net benefits (indi-vidual gross return � cost) at the respective equilibria in the threesocieties, as a function of total cooperation cost.
Individuals in the majority/plurality rule population were betteroff than those in the best member rule population, who weresubstantially better off than the random member rule population,for the parameter range displayed in Figure 6. However, noticealso that the difference in net benefits between the two keypopulations decreased as the cooperation costs increased. Thissuggests that the superiority of the majority/plurality rule over thebest member rule may be eliminated and even reversed whencooperation costs are high. Indeed, this was the case in all thesimulations we ran. When the cooperation cost was 0.27 or higher
(see Footnote 4), the relative standings of the two rules werereversed (these points are not displayed in Figure 6 to simplify thegraphic representation).
How can we interpret these patterns? A close inspection of theequilibrium proportions of cooperative and defecting individualsin the population (see Figure 5) provides some insights. Figure 5shows that the proportions of searcher/voter hybrids decreasedmonotonically with a higher cooperation cost. For example, in themajority/plurality rule population, the proportion of the coopera-tive individuals dropped to 27% when the cost was 0.15 (on theright side of the diagram). This implies that, with the increase incooperation cost, the average frequency of searcher/voter hybrids(cooperators) in each 12-person group could eventually fall belowthree (� 12 0.27). Notice that three is the minimum number ofvoters for the majority/plurality rule to be meaningfully comparedwith the best member rule and other group decision processes, asif the frequency of voters is less than three, no majority/pluralitycan be defined among the voters, except for the theoretically trivialcase of perfect agreement. In other words, when the cooperationcost is high, searcher/voter hybrids become so rare that mostdecision-making groups fail to assemble the critical voter quorum(three). In these circumstances, the best member rule beats theindecisive majority/plurality rule.
At the start of each simulation run (generation 1), the prevalence of the two behavioral strategies, searcher/voters and non-searcher/abstainers (Table 1), in the (infinite) population was set equal, 50% each.
A twelve-person “hunting team” is composed by random sampling.
Only searcher/voters engage in individual learning about the environment for some personal cost. They can access to the three environmental cues (Figure 3) and make judgments according to their policies.
Depending on a given aggregation rule (majority/plurality, best member, or random member), the group picks up one alternative for hunting. The resource in the chosen patch is shared equally among all members. For the cooperative searcher/voters, however, the respective costs are subtracted from their shares.
Mean outcome (fitness) for each of the two strategies is calculated by
collapsing their net outcomes (benefit – cost) over 1,000,000 (=100x10,000) trials.
Depending on their mean outcomes (fitness), the two strategies are selected using a replicator dynamic, with the greater fit strategy yielding slightly more offspring for next generation.
Population at generation t
Sampling of a twelve-person group from the population
Opportunity for information search about the environment
Go to next generation t+1
Voting and group aggregation
100 “hunts”in new env i ronm
ents
Calculating mean outcomes
Selection
Replication for 10, 000 groups
Figure 4. Outline of the evolutionary simulation platform.
9DEMOCRACY UNDER UNCERTAINTY
F6
tapraid5/z2q-psycho/z2q-psycho/z2q00410/z2q2224d10z xppws S�1 7/23/10 8:24 Art: 2010-0021
APA
PRO
OFS
Sensitivity analysis. To see how robust these findings were,we conducted a sensitivity analysis varying key parameters: thenumber of choice alternatives (from two to 11) and the cooperationcosts (from 0.03 to 0.27), with group size held constant at 12. Amixed equilibrium, as we observed in Figure 5, emerged for allcombinations of these parameter values. Given this, we report onlyrelative standings of the majority/plurality rule to the best memberrule in terms of individual net payoffs at the respective equilibria.Figure 7 displays differences in individual net benefits between thetwo populations (majority/plurality rule minus best member rule)as a joint function of the cooperation costs and the number of
alternatives. In the iceberg-shaped surface, the unshaded (above-water) regions refer to parametric combinations where the major-ity/plurality rule outperformed the best member rule (i.e., the netbenefits difference score was greater than zero), and the shaded(underwater) regions refer to the reverse situation.
First, as seen in Figure 6, the relative advantage of the majority/plurality rule over the best member rule decreased monotonicallyand was eventually reversed with higher cooperation costs (repre-sented on the x-axis). As the cooperation costs increased, theequilibrium proportion of searcher/voter hybrids in the populationdecreased, and groups operating with the majority/plurality rulecould rarely assemble three voters. Second, the majority/pluralityrule was more successful with greater numbers of choice alterna-tives (the second abscissa). As can be seen in the figure, theunshaded regions in the graph, where the majority/plurality ruleoutperformed the best member rule, were larger with more loca-tions (in general, more elements in the group’s choice set).
To summarize, the sensitivity analysis demonstrated that the ma-jority/plurality rule was more successful than the best member rulewhen the cooperation cost was small and when there were morelocations (i.e., choice alternatives in the group’s choice set). (Ofcourse, if cooperation costs are extremely high, no one will cooperate,and all decision rules will perform at equally low levels.) These resultssuggest that, despite the inherent free-rider problems in group decisionmaking, there exist large parametric regions where the majority/plurality rule is successful in an uncertain game against nature.
Behavioral Experiment
The next step was to see how these theoretical results fared ashypotheses about the behavior of human decision-making groups.For this purpose, we designed a laboratory task where we couldcompare the performance of the majority/plurality rule and the best
Non-searcher / Abstainer Searcher / Voter
(a) Majority/Plurality rule (c) Random-Member rule
34.74 30.48 27.87 25.96 24.44
65.26 69.52 72.13 74.04 75.56
0%
10%
20%
30%
40%
50%
60%
70%
80%
90%
100%
0.03 0.06 0.09 0.12 0.15
Cooperation costs
(b) Best-Member rule
39.3333.19 29.9 27.63 25.87
60.6766.81 70.1 72.37 74.13
0%
10%
20%
30%
40%
50%
60%
70%
80%
90%
100%
0.03 0.06 0.09 0.12 0.15
Cooperation costs
44.5635.85 31.64 28.88 26.82
55.4464.15 68.36 71.12 73.18
0%
10%
20%
30%
40%
50%
60%
70%
80%
90%
100%
0.03 0.06 0.09 0.12 0.15Cooperation costs (Search +
Vote)
Pro
porti
ons
in th
e po
pula
tion
Figure 5. Equilibrium proportions of the strategies in each population.
3.000
3.050
3.100
3.150
3.200
3.250
3.300
3.350
3.400
3.450
3.500
0.03 0.06 0.09 0.12 0.15
Indi
vidu
al n
et p
ayof
f
Cooperation costs (Search + Vote)
Majority/pluralityBest-memberRandom-member
Figure 6. Individual net payoff at the equilibrium in each population.
10 KAMEDA, TSUKASAKI, HASTIE, AND BERG
F7
tapraid5/z2q-psycho/z2q-psycho/z2q00410/z2q2224d10z xppws S�1 7/23/10 8:24 Art: 2010-0021

APA
PRO
OFS
member rule, while measuring each member’s cooperation duringthe decision-making process. On the basis of the simulation re-sults, we predicted (a) that participants would be divided into oneof the two behavioral types, searcher/voter hybrids (cooperators)or nonsearcher/abstainer (defectors) hybrids, and (b) that the pro-portions of these two types of members would stabilize over time,consistent with the expectation of a mixed equilibrium. We alsopredicted (c) that groups governed by the majority/plurality rulewould be better off than those governed by the best member rulein terms of individual net payoffs. Of course, the simulation modelsuggests that this prediction is parameter dependent (see Figure 7);our aim was to provide an empirical demonstration (or an exis-tence proof) of one case where majoritarian decision rule workswell under uncertainty in face of the free-rider problem.
Method
Participants. Participants were 180 undergraduate students(127 males and 53 females) enrolled in introductory psychologyclasses at Hokkaido University (Sapporo, Japan).
Group decision task. We implemented a hunting-under-uncertainty task through a local area network in a behavioral labora-tory. We told participants that they were members of six-person teamsthat must choose one of 10 locations in which to hunt (instead of the12-person groups assumed in the simulation, we used six-persongroups in the experiment due to practical constraints). Resource levels(e.g., prey values) in each location were generated randomly from anormal distribution N(80, 30) (unit � 1 yen). The resource levelscould be estimated only on the basis of three stochastic cues thatdiffered in predictive validity and perceptual errors, analogous to the
model in the previous section. The parametric setups for the cuestructure and the perception errors were identical to those used in thesimulation reported above in Figure 3.5
The group decision task was to select the most profitable location,using either the majority/plurality rule or the best member rule. Theserules were assigned to each group at the outset. Participants’ rewardswere made contingent upon their performance in the hunts. Specifi-cally, resources in the chosen patch were divided evenly among all sixmembers, although cooperative members (who engaged in informa-
5 N(80, 30) was used to generate resource levels in each location in theexperiment instead of N(0, 30), as in the simulation; the change in mean value didnot affect uncertainty level in the foraging task because the standard deviation ofthe distribution was held identical. The only exception was that both the trueresource value (Qj) and the true cue value (C.jk) in each of 72 hunts during theexperiment were held to be common across all groups in the experiment. Thesecommon seeds had been generated randomly from the respective normal distri-butions (identical to those used in the simulation), for once, prior to the experiment.This procedure was different from the simulation, where the true resource value(Qj) and the true cue value (C.jk) were generated randomly for each hunt by eachgroup. Given the much smaller sample size in the experiment (n � 3 hunts 15groups per trial as compared to n � 100 hunts 10,000 groups per generation inthe simulation), making the value-generation procedure exactly parallel to that ofthe simulation would have introduced too much random noise. Because thischange was theoretically trivial, we chose the current procedure for the experiment.For each hunt by each group, however, we newly added individual perception errorterms (eijk) to generate perceived cue values (Cijk), as in the simulation. Thus, thecue values that participants actually observed in each hunt could be different fromperson to person.
2
6
10
-0.02
-0.01
0
0.01
0.02
0.03
0.04
0.05
0.03 0.06 0.09 0.12 0.15 0.18 0.21 0.24 0.27
Number ofalternatives(patches)
Differences in individual net
payoffs (majority/pluarity
- best)
Cooperation costs (search + vote)
Majority/plurality > Best
Best > Majority/plurality
Figure 7. Sensitivity analysis about the superiority of the majority/plurality rule to the best member rule inindividual net payoff.
11DEMOCRACY UNDER UNCERTAINTY
Fn5
tapraid5/z2q-psycho/z2q-psycho/z2q00410/z2q2224d10z xppws S�1 7/23/10 8:24 Art: 2010-0021

APA
PRO
OFS
tion search and/or voting) incurred personal costs, which were sub-tracted from their individual accounts.
Procedure. Six participants were randomly assigned to one oftwo decision-rule conditions (majority/plurality or best member) inexperimental sessions lasting approximately 1 hr. There were 15groups (90 participants) in each condition. Upon arrival, eachparticipant was seated in a private cubicle and received instruc-tions individually via computer displays. After the hunting-under-uncertainty task was explained, participants were provided anopportunity to familiarize themselves about how to use the threestochastic cues (see Figure 3 for the cue structure) displayed on thescreen for each of the 10 locations. For 20 practice trials, eachparticipant made personal judgments as to the most profitablelocation out of 10 alternatives. On each of the 20 practice trials,participants received feedback about their choice success, in termsof the discrepancy in resource levels between the chosen locationand the most profitable one (the most profitable location was alsoidentified on the screen). Because this was a practice session, allthe judgments in this phase were individual, without reward.
Majority/plurality rule versus best member rule. After prac-ticing the cue-based judgment-under-uncertainty task, participantswere told they were members of a six-person hunting team seekingthe most profitable location out of 10. They were told that theirrewards in the experiment would be contingent on the success oftheir group decisions. Participants in the majority/plurality rulecondition were told that the location endorsed by the greatestnumber of voters would be designated as their collective choice bythe computer. Participants in the best member rule condition weretold that the best individual (who was most accurate in the practicesession) among the voters on each hunt would be automaticallyselected by the computer (anonymously) and that that participant’schoice would be designated the group choice.
Costs for cooperation. Costs (incentives for free riding) wereintroduced as follows: First, members who chose to collect envi-ronmental information when forming individual judgments had topay 3 yen. Second, voters who chose to participate in a groupmeeting to express their preferences had to pay another 3 yen.However, the payoff from the selected location was to be equallyshared among all six members whether they incurred costs or not.The experiment consisted of 24 trials with three new hunts in eachtrial. Before each of the 24 trials, each participant was askedwhether he or she wanted to pay 3 yen for information search andwhether to pay 3 yen to vote on the trial (these decisions weremade independently).6 Only individuals who had paid theinformation-search cost could access the environmental cues whenforming individual judgments, while those who had not paid thesearch cost could not access the cue information in the three huntsduring that trial. Only individuals who had paid the voting costwere able to express their preferences during that trial. For eachhunt, the group decision was reached by aggregating these voters’preferences via either the majority/plurality rule or the best mem-ber rule (the aggregation was conducted by the computer).
Outcome feedback. After each of the 24 trials, participantswere provided private feedback. The feedback consisted of theirpersonal net benefit earned during the trial (i.e., evenly split shareof the sum of group outcomes from the three hunts minus anindividual’s own cooperation costs) and the number of groupmembers who voted during the trial.7 Through the summary feed-back, participants could learn how well they had performed on the
trial and adjust their cooperation levels on the next trial. Unlike thepractice session, no specific feedback was provided as to personalaccuracy.
Results and Discussion
Emergence of stable cooperation over time. Our evolution-ary simulation model suggested that group decision making underuncertainty would eventually yield a mixed equilibrium, wherecooperative and uncooperative individuals would coexist in astable manner. Specifically, we predicted that participants wouldbe divided into one of the two behavioral types, searcher/voterhybrids versus nonsearcher/abstainer hybrids, over time and thatproportions of these two types of members would stabilize.8
Interlocked information-search strategies and the voting strat-egies. We examined how frequently each participant showed thebehavioral linkage between the choices of information-searchstrategy and voting that we observed in the simulation. For thisanalysis, we divided the 24 trials into three 8-trial blocks. Figure 8shows mean proportions of the trials in each block, where partic-ipants’ strategic choices were coherent, that is, either totally co-operative (searcher/voter hybrid) or totally uncooperative (non-searcher/abstainer hybrid).
Consistent with the simulation, mean proportions of the coher-ent choices (searcher/voter hybrids and nonsearcher/abstainer hy-brids) increased over time, reaching nearly 100% coherence in thelast block. A 2 (condition) 3 (block) 15 (group) analysis ofvariance (ANOVA), using a hierarchical linear model, yielded amain effect for block, F(2, 52) � 36.52, p � .001. This means that,if an individual voted in the last block of the experiment, she or he,with probability very close to one, had also engaged in costlyindividual information search. Voting by ignorant members intruth-seeking situations (e.g., group foraging) would be self-defeating in terms of individual net payoff because it woulddegrade the overall quality of group decisions while exacting apersonal voting cost (Lupia, 1994). If members are aware of thesecost issues, a behavioral linkage between information-search strat-egy and voting should emerge voluntarily without social enforce-
6 The total cost for cooperation (information search � voting) imple-mented in the experiment (6 yen per trial) may seem small. Yet this was notthe case because, as described below, it actually corresponded to about10% of the average gross payoff to each individual in the trial.
7 Our own experience tells us that it is hard to determine whether othermembers have actually prepared for committee meetings (e.g., engaged incostly information search); thus, the number of searchers during the trialwas not included in the outcome feedback.
8 It is important to note that the simulation and the behavioral tests involveddifferent manifestations of what we think are the same basic principles of func-tional adaptation. In the simulation, an evolutionary algorithm determined thesurviving strategies over thousands of generations using a replicator dynamic.However, in the behavioral experiment, individual learning and inference pro-cesses composed the mechanism through which an adaptive equilibrium wasdiscovered. We believe that both routes, population cross-generational and indi-vidual learning, yield adaptive behavioral strategies, but we do not want to obscurethe differences between the two mechanisms (but see Campbell, 1988).
12 KAMEDA, TSUKASAKI, HASTIE, AND BERG
Fn6
Fn7
Fn8
F8
AQ: 8
tapraid5/z2q-psycho/z2q-psycho/z2q00410/z2q2224d10z xppws S�1 7/23/10 8:24 Art: 2010-0021
APA
PRO
OFS
ment mechanisms in truth-seeking groups, as in the present exper-iment.
Stabilization of cooperation (searcher/voter hybrids) over time.Were the cooperative members (search/voter hybrids) able to sus-tain themselves in actual groups, as predicted by the evolutionarysimulation model? Or was the coherent-choice pattern due to thetendency of uncooperative members (nonsearcher/abstainer hy-brids) eventually to dominate groups? For this analysis, we esti-mated the theoretical equilibrium frequency of cooperators in eachcondition. We first estimated the empirical group and individualpayoff functions by means of an econometric procedure and thenestimated the equilibrium frequency and the Pareto-optimum fre-quency for the majority/plurality rule (see Appendix B for theestimation procedure).
Figure 9 displays mean frequencies of the cooperative membersin each group across the 24 trials, along with the equilibriumfrequency and the Pareto-optimum (local and global) frequency inthe majority/plurality rule condition.9 Although the mean frequen-cies of cooperative searcher/voter hybrids slightly decreased overtrials, about half of members remained cooperative on the last trial.Notice that the mean frequency of cooperative members in themajority/plurality rule condition was 3.13 on the final trial and wassignificantly greater than the equilibrium frequency, t(14) � 3.89,p � .001. Indeed, the modal number of cooperators across allgroups in all trials in the majority/plurality rule condition wasthree, with more than 75% of observed action profiles containingthree or more cooperators. Figure 10 displays the empirical distri-bution of the numbers of group members who cooperated (N)across 360 observations (15 groups 24 trials).
Notice also that variances associated with the mean frequencies,as depicted by vertical bars in Figure 9, decreased over time inboth conditions. Dividing the 24 trials into three 8-trial blocks, a 2(condition) 3 (block) repeated measures ANOVA on the vari-ability index revealed a significant main effect for block, F(2,56) � 8.02, p � .001. Thus, most groups stably functioned at alocally Pareto efficient level of public-goods contributions, withthree contributors and three free riders per group. The unambigu-ous modal value (see Figure 10) is remarkable in finding a locally
best outcome in group terms despite the fact that the individualincentives built into the game structure would predict far lesscooperation at N � 1 (see Appendix B).
Did the stabilization in cooperation rates occur at the aggregatelevel or at the individual level? That is, did different individualscooperate on each trial, or did the same individuals cooperate (andthe others consistently defect) across trials? Figure 11 displayshow frequently individual participants cooperated during each ofthe three blocks in the majority/plurality rule and the best memberrule conditions. Since each block is composed of eight trials, thefrequency of cooperation (search and vote) during a block couldrange from zero (a total free rider) to eight (a total cooperator). Ascan be seen in Figure 11, the relatively symmetric distributionpattern in the first block dissolved over time, and the distributionin the last block was U-shaped, with the 100%-consistent cooper-ators and 100%-consistent free riders jointly representing 32%(majority/plurality rule) and 42% (best member rule) of the par-ticipants. This indicates that, at least when individual adjustment isthe basis for sorting into strategies, there is a trend toward poly-morphic role self-assignment, with types of individuals adoptingdifferent consistent strategies.
Taken together, these results indicate that both uncooperativenonsearcher/abstainer hybrids and cooperative searcher/voter hy-brids persisted across trials and that their proportions in each groupstabilized over time.
Did the majority/plurality rule outperform the best memberrule? Given that the rates of cooperation stabilized in each groupover time, we could address our next question: Did the majority/plurality rule produce better net benefits to group members thanthe best member rule? Figure 12 shows that average per-trialindividual net benefits were higher in the majority/plurality rulecondition than in the best member rule condition across the threeblocks of trials. A 2 (condition) 3 (block) 15 (group) repeatedmeasures ANOVA using a hierarchical linear model revealed asignificant main effect for the group decision rule, F(1, 28) �11.90, p � .002.
How does this pattern relate to the theoretical results from theevolutionary computer simulations? Notice that the theoreticalequilibrium frequency of cooperators, estimated by fitting aneconometric model to the data (see Appendix B), was one in themajority/plurality rule condition (see Figure 9). This means that,theoretically, the majority/plurality rule should yield worse (atleast, no better) outcomes than the best member rule because theminimal effective voting quorum for the majority/plurality rule(three members) could not be assembled. However, as we ob-served in Figure 9, the mean frequencies of the cooperative,searcher/voter hybrids stabilized at slightly above three under the
9 The equilibrium (Nash) frequency occurs where the marginal individ-ual return is equal to the cost of cooperation (see Figures 1–2; see alsoFigures B1–B2 in Appendix B). The Pareto-optimum frequency occurswhere the marginal group return is equal to the cost of cooperation; netgroup payoff function is maximized at the Pareto point. In the econometricanalysis reported in Appendix B, we estimated the equilibrium (Nash)frequency and the Pareto-optimum frequency. As shown in Figure B3, theempirical net group payoff function reveals two Pareto-optimal points, alocal maximum, where the number of cooperators in the group is three, anda global maximum at six. At each of these Pareto points, net group payoffis maximized locally or globally.
0.80
0.82
0.84
0.86
0.88
0.90
0.92
0.94
0.96
0.98
1.00
1st 2nd 3rd
Block
Mea
n pr
opor
tions
of c
oher
ent
beha
vior
al c
hoic
es
Majority/pluralityBest member
Figure 8. Interlocking between the two strategic choices. Participants’behavioral choices of information-search strategy and voting became morecoherent over time.
13DEMOCRACY UNDER UNCERTAINTY
F9
Fn9
F10
AQ: 14
F11
F12
tapraid5/z2q-psycho/z2q-psycho/z2q00410/z2q2224d10z xppws S�1 7/23/10 8:24 Art: 2010-0021

APA
PRO
OFS
majority/plurality rule. The minimal quorum (three searcher/voterhybrids) persisted in the experiment, and consequently, the major-ity/plurality rule yielded higher individual net payoffs than the bestmember rule (shown in Figure 12). These results imply that be-haviorally—although not predicted by theory—the parametricrange where the majority/plurality rule outperforms the best mem-ber rule may be much wider than that predicted by theory (shownin Figure 7). Even in cases where individual cooperation cost wastheoretically too high to secure the minimal quorum (three) for themajority/plurality rule, observed frequencies of cooperators ineach group often surpassed the quorum (Laury, Walker, & Wil-liams, 1999; Sefton & Steinberg, 1996).
General Discussion
The present research develops an explanation for the fact thathuman groups that engage in production often contain a share of
highly cooperative individuals who contribute to public enterprisesat a cost to themselves, such as those who prepare well forcommittee meetings, devote substantive time and energy writing ajoint grant proposal, or stay on the lookout to protect their villagefrom enemies/predators. It provides a principled alternative to theovergeneralized prediction of the linear model that the only ratio-nal choice is to free ride. Recall that the group-production functionin the linear model is often set arbitrarily by researchers. Forexample, it is common practice in public-goods game experimentsto multiply an individual’s contribution by some arbitrary numberand then divide it by group size to determine a (constant) personalreturn from the contribution, and this personal return is set to beless than the individual cooperation cost, regardless of the numberof contributors in the group (Ledyard, 1995). Although such alinear model is a useful device for considering some theoreticalproblems concerning cooperation (e.g., effects of punishment;Fehr & Gachter, 2000), it is a serious misconception to assume thatmost natural group-production tasks fall into this category. Theanalysis of the cooperate-or-free-ride, produce-or-scrounge decisionsin terms of the Motro framework, with its plausible assumptions of amarginally diminishing returns group-production function is concep-tually compelling, realistic, and supported by theoretical simulationsand a behavioral experiment. Our conceptual framework, based on theubiquity of the marginally diminishing returns group-production func-tion common in natural settings, provides a useful benchmark ex-planation for realistic levels of cooperation in broad range ofsmall-group activities (McGrath, 1984; Steiner, 1972). It alsoseems more convincing than alternate, somewhat contrived expla-nations that posit special sources of indirect utility satisfactionsuch as expressive functions and utility derived from fulfillingcivic duty, though these prosocial motives may be important insome cases (Brennan & Lomasky, 1993).
0
1
2
3
4
5
6
1 2 3 4 5 6 7 8 9 10 11 12 13 14 15 16 17 18 19 20 21 22 23 24Mea
n fr
eque
ncie
s of
coo
pera
tive
mem
bers
Trial
Majority/pluralityBest member
global Pareto point
Equilibrium point
local Pareto point
Figure 9. Mean frequencies of cooperative members (searcher/voter hybrids) across the 24 trials. Vertical linesindicate one standard error (solid line for the majority/plurality rule condition, dotted line for the best memberrule condition). Empirically estimated Nash point in the majority/plurality rule condition was one, whereasPareto-optimal points were three (local Pareto-optimal) and six (global Pareto-optimal). See Appendix B fordetails of the estimation procedure.
0
20
40
60
80
100
120
140
0 1 2 3 4 5 6
Obs
erve
d fr
eque
ncy
Total number of cooperators in a group (N)
Figure 10. Frequency distribution of number of cooperators (searcher/voter hybrids) in groups in the majority/plurality rule condition across 360observations (15 groups in 24 trials).
14 KAMEDA, TSUKASAKI, HASTIE, AND BERG
tapraid5/z2q-psycho/z2q-psycho/z2q00410/z2q2224d10z xppws S�1 7/23/10 8:24 Art: 2010-0021

APA
PRO
OFSThe insight that guides the present research is that group per-
formance is not necessarily a strict social dilemma if group pro-duction is a marginally diminishing function of the number ofproductive members (as it usually is) and if personal productioncosts add up (as they usually do). If the marginal individual returnto contributing is greater than its cost for some members (i.e., c ��m for some m between zero and group size), the equilibrium is amixture of cooperation and free riding. In simpler terms, in mostgroups, it is to the individual member’s personal advantage toproduce (contribute), unless an equilibrium number of other mem-bers is already contributing. We believe that group decision-making tasks and many other group tasks in natural settings are ofthis type. Perhaps most surprising of all, we found that experimen-tal human decision-making groups yielded a stable behavioralequilibrium at a locally Pareto efficient level of public-goodscontributions, with three contributors and three free riders pergroup. Finally, we found that majoritarian group decision ruleshave an adaptive value under uncertainty, and this result mayexplain why majority/plurality rules are popular across the fullspectrum of human groups from hunter-gatherer or tribal societies(Boehm, 1996; Boyd & Richerson, 1985; Wilson, 1994) to modern
industrial democracies (Hastie et al., 1983; Kameda et al., 2003;Mueller, 2003).
Our results are conceptually relevant to the long-term puzzle inpolitical science about why citizens invest resources to becomewell informed and to vote (e.g., Mueller, 2003; Riker & Orde-shook, 1973). In an election, the cost associated with voting ispersonal and seems to outweigh any individual benefit that the actof voting can possibly yield. Why would rational individualsbother to spend time and resources to become well informed andgo to the polls if the chance of having an impact on the outcomeof the election is virtually zero (the voter’s paradox; Downs,1957)?
We should emphasize that there are several key differencesbetween small-group decision making and elections. First, there isthe obvious difference in the size of electorate, implying that eachvote is much more consequential in small-group decision makingthan in a large-scale election. Second, most theoretical analyses ofsmall-group decision making, including our own, have posited thatcommon values (Feddersen & Pesendorfer, 1996) or truth (Con-dorcet, 1785/1994) underlie group decisions; members seek themutually most beneficial outcome via group decisions (e.g., find-ing the most valuable investment, finding the truth in a criminaljury trial). In contrast, a large-scale election is a competitionamong several factions (e.g., parties) with disparate ideologies andpreferences. This difference is important because, in the politicaldomain, two motives operate when each individual decideswhether to vote or to not—free riding and competition (Dhillon &Peralta, 2002; Palfrey & Rosenthal, 1983). Within each faction(e.g., supporters of Candidate A) sharing the same preference, eachindividual is personally better off free riding if a sufficient numberof individuals are already voting for the alternative. However, inthe political domain, competition is also a motive. For one’s partyto win the election, one must assemble more voters than the otherparties. This competition factor is absent in our group decision-making situation where members collectively play a game againstnature (Bornstein, 2003).
In this sense, it remains to be seen how exactly the two decisionsituations relate to each other, both theoretically and behaviorally.One possible extension of our group decision-making paradigmmight be to have two teams of hunters compete for the sameresource. The team with the more accurate group decision monop-olizes the resource and distributes it evenly among members on the
Majority/Plurarity Rule condition
0
5
10
15
20
25
1st 2nd 3rdBlock
Obs
erve
d fre
quen
cies
0 8 0 0 8 8
Best Member Rule condition
0
5
10
15
20
25
1st 2nd 3rdBlock
Obs
erve
d fre
quen
cies
8 8 8 0 0 0
Figure 11. Observed frequencies of individual strategies in the majority/plurality rule condition and the bestmember rule condition. Individual strategies could range from full defection (zero) to full cooperation (eight) ineach block of trials.
0
10
20
30
40
50
60
70
80
1st 2nd 3rd
Block
Mea
n pe
r-tri
al in
divi
dual
net
pay
off (
in Y
en)
Majority/plurality
Best member
Figure 12. Mean per-trial individual net payoffs (in yen) in the majority/plurality rule condition and the best member rule condition.
15DEMOCRACY UNDER UNCERTAINTY
AQ: 9
AQ: 10
tapraid5/z2q-psycho/z2q-psycho/z2q00410/z2q2224d10z xppws S�1 7/23/10 8:24 Art: 2010-0021

APA
PRO
OFS
winning team, as found in some political domains. How cooper-ative will members be in situations where the competitive andfree-riding motives conflict? Will a stable equilibrium emerge overtime? Is the majority/plurality rule better in those settings than thebest member rule? These questions are important and provideanother test of the adaptive robustness of majoritarian decisionmaking under uncertainty.
There are several limitations on the conclusions of this article.Perhaps most obvious is the assumption that group membersdevelop individual judgments independent from each other. Al-though this assumption has been common in the previous theoret-ical work (Hastie & Kameda, 2005; Sorkin et al., 2001), futurework should relax this condition to see its impact on group deci-sions. Indeed, if members conform (Asch, 1956) or mimic (Hung& Plott, 2001) each other when forming individual judgments,majoritarian aggregation could be subject to herding effects, whereerroneous information cascades across individuals to yield defec-tive outcomes (e.g., L. R. Anderson & Holt, 1997; Banerjee, 1992;Bikhchandani, Hirshleifer, & Welch, 1992; Kameda & Tamura,2007). Because the majority/plurality rule works under uncertaintyvia its error-cancellation function (Hastie & Kameda, 2005; Hung& Plott, 2001), independence among members is a key contributorto its success (Surowiecki, 2004). One possible extension to ad-dress this question is to provide each individual (computer agent orhuman participant) an option to mimic another’s judgments (i.e.,free riders who skip information search can mimic other membersrather than deciding randomly, as assumed in the current model)and to examine the performance of the majoritarian aggregationwhen social learning is possible (Henrich & Boyd, 1999; Kameda& Nakanishi, 2002, 2003).
Second, our results are obviously contingent on the distributionof competence among group members. In the simulation, groupmembers’ modal judgment policies were not statistically optimal(see Equation 1) but were based on the suboptimal equal cueweighting (Dawes, 1979) with substantive variation; members’preferences were thus affected not only by random error in cueperception but also by the systematic biases built into their judg-ment policies. However, if these modal members had even moredeviating judgment policies while the most competent member hada near-perfect judgment policy, then the parametric range wherethe majority/plurality rule outperforms the best member rule wouldnecessarily become much narrower (Kerr et al., 1996). It remainsto be seen how and under what conditions the accuracy of modalgroup members’ preferences, relative to that of the brightest mem-ber, can be guaranteed in naturally occurring settings (Surowiecki,2004).
Third, in our simulation and experiment, group members had nodirect opportunities to coordinate their actions ex ante. However, ifmembers are allowed to coordinate their behaviors in advance,they may eventually develop some social norms to produce moreequitable outcomes within a group, rather than allowing somemembers to free ride on others unilaterally (see Figure 11). Forexample, such social norms may take the form of turn taking tobear the cost of cooperation equally among all members. Given thecentral importance of inequity aversion in human cooperation(Fehr & Schmidt, 1999), it will be interesting to see how suchegalitarian norms and mutual expectations (Fehr & Fischbacher,2004; Kameda, Takezawa, Ohtsubo, & Hastie, 2010; Kerr, 1983)
may develop in groups working on tasks with marginally dimin-ishing return curves.
Last, the model we have developed in this article is anevolutionary/population-level model whereby ultimate causes(Tinbergen, 1963) for cooperation in group decision making areconsidered. It still remains to be seen how each individual actuallycomputes costs and benefits of his or her cooperation in a grouptask with a marginally diminishing return curve and especiallyhow individuals coordinate their behaviors. Behavioral ecologistsstudying group decision making by nonhuman animals have begunto address these questions to understand computational algorithmsfor collective nest search by honey bees, collective navigation bybaboons, and so on (see the recent special issue of the Philosoph-ical Transactions of the Royal Society of London, Series B: Bio-logical Sciences [Conradt & List, 2009]). Given the robustness ofthe marginally diminishing returns group-production function innature (Foster, 2004), cross-fertilization between human and non-human animal researchers will be useful to delineate proximatemechanisms underlying cooperation and coordination in groupendeavors.
We hope our methodology, starting with a description of thesituation in game theory terms, followed by computer simulationexplorations and then behavioral experiments, is appealing to otherresearchers. We also hope that the virtues of this eclectic approachare self-evident. Social behavior is often more adaptive and morerational than it sometimes appears at first glance. Thinking aboutfunctional, adaptive, and rational properties of a system will oftenreveal a deeper structure that is not apparent to a superficialdescriptive analysis (Barkow, Cosmides, & Tooby, 1992; Giger-enzer et al., 1999; Schelling, 1978). The wisdom of crowds canarise from fundamental laws of social ecology that emerge fromindividually adaptive strategies (Surowiecki, 2004).
References
Aldrich, J. A. (1997). When is it rational to vote? In D. Mueller (Ed.),Perspectives on public choice: A handbook (pp. 379–390). Cambridge,England: Cambridge University Press.
Anderson, L. R., & Holt, C. A. (1997). Information cascades in thelaboratory. American Economic Review, 87, 847–862.
Anderson, N. H. (1981). Foundations of information integration theory.New York, NY: Academic Press.
Arrow, K. J. (1951). Social choice and individual values (1st ed.). NewHaven, CT: Yale University Press.
Asch, S. E. (1956). Studies of independence and conformity: A minority ofone against a unanimous majority. Psychological Monographs,70(Whole No. 416).
Axelrod, R. (1984). The evolution of cooperation. New York, NY: BasicBooks.
Banerjee, A. V. (1992). A simple model of herd behavior. QuarterlyJournal of Economics, 107, 797–817.
Barkow, J. H., Cosmides, L., & Tooby, J. (Eds.). (1992). The adaptedmind: Evolutionary psychology and the generation of culture. Oxford,England: Oxford University Press.
Barnard, C. J., & Sibly, R. M. (1981). Producers and scroungers: A generalmodel and its application to captive flocks of house sparrows. AnimalBehaviour, 29, 543–555.
Bednekoff, P. (1997). Mutualism among safe, selfish sentinels: A dynamicgame. American Naturalist, 150, 373–392.
Bikhchandani, S., Hirshleifer, D., & Welch, I. (1992). A theory of fads,fashion, custom, and cultural change as informational cascades. Journalof Political Economy, 100, 992–1026.
16 KAMEDA, TSUKASAKI, HASTIE, AND BERG
AQ: 11
AQ: 12
tapraid5/z2q-psycho/z2q-psycho/z2q00410/z2q2224d10z xppws S�1 7/23/10 8:24 Art: 2010-0021

APA
PRO
OFS
Boehm, C. (1996). Emergency decisions, cultural-selection mechanics, andgroup selection. Current Anthropology, 37, 763–793.
Bornstein, G. (2003). Intergroup conflict: Individual, group, and collectiveinterests. Personality and Social Psychology Review, 7, 129–145.
Boyd, R., & Richerson, P. J. (1985). Culture and the evolutionary process.Chicago, IL: University of Chicago Press.
Brehmer, B., & Joyce, C. R. B. (Eds.). (1988). Human judgment: The SJTview. Amsterdam, the Netherlands: North-Holland.
Brennan, G., & Lomasky, N. (1993). The pure theory of electoral prefer-ence. Cambridge, England: Cambridge University Press.
Brunswik, E. (1956). Perception and the representative design of psycho-logical experiments (2nd ed.). Berkley, CA: University of CaliforniaPress.
Camerer, C. F. (2003). Behavioral game theory. Princeton, NJ: PrincetonUniversity Press.
Campbell, D. T. (1988). A general “selection theory,” as implemented inbiological evolution and social belief-transmission-with-modification inscience. Biology and Philosophy, 3, 171–177.
Cason, T. N., Saijo, T., & Yamato, T. (2002). Voluntary participation andspite in public good provision experiments: An international compari-son. Experimental Economics, 5, 133–153.
Cason, T. N., Saijo, T., Yamato, T., & Yokotani, K. (2004). Non-excludable public goods experiments. Games and Economic Behavior,49, 81–102.
Clemen, R. T., & Winkler, R. L. (1999). Combining probability distribu-tions from experts in risk analysis. Risk Analysis, 19, 187–203.
Condorcet, M. (1994). Essay on the application of probability analyses todecisions returned by a plurality of people. In I. McLean & F. Hewitt(Eds. & Trans.), Condorcet: Foundations of social choice and politicaltheory (pp. 11–36). Brookfield, VT: Edward Elgar. (Original workpublished 1785)
Conradt, L., & List, C. (Eds.). (2009). Group decision making in humansand animals [Special issue]. Philosophical Transactions of the RoyalSociety of London, Series B: Biological Sciences, 364(1518).
Cooksey, R. W. (1996). Judgment analysis: Theory, methods, and appli-cations. San Diego, CA: Academic Press.
Dawes, R. M. (1979). The robust beauty of improper linear models.American Psychologist, 34, 571–582.
Dawes, R. M. (1980). Social dilemmas. Annual Review of Psychology, 31,169–193.
Dhillon, A., & Peralta, S. (2002). Economic theories of voter turnout.Economic Journal, 112, 332–352.
Downs, A. (1957). An economic theory of democracy. New York, NY:Harper & Row.
Feddersen, T., & Pesendorfer, W. (1998). Convicting the innocent: Theinferiority of unanimous jury verdicts under strategic voting. AmericanPolitical Science Review, 92, 23–36.
Fehr, E., & Fischbacher, U. (2003, October 23). The nature of humanaltruism. Nature, 425, 785–791.
Fehr, E., & Fischbacher, U. (2004). Social norms and human cooperation.Trends in Cognitive Sciences, 8, 185–190.
Fehr, E., & Gachter, S. (2000). Cooperation and punishment in publicgoods experiments. American Economic Review, 90, 984–994.
Fehr, E., & Gachter, S. (2002, January 10). Altruistic punishment inhumans. Nature, 415, 137–140.
Fehr, E., & Schmidt, K. M. (1999). A theory of fairness, competition, andcooperation. Quarterly Journal of Economics, 114, 817–868.
Foster, K. R. (2004). Diminishing returns in social evolution: The not-so-tragic commons. Journal of Evolutionary Biology, 17, 1058–1072.
Gigerenzer, G., Todd, P. M., & the ABC Research Group. (1999). Simpleheuristics that make us smart. New York, NY: Oxford University Press.
Gintis, H. (2000). Game theory evolving. Princeton, NJ: Princeton Univer-sity Press.
Gintis, H. (2007). A framework for the unification of the behavioralsciences. Behavioral and Brain Sciences, 30, 1–61.
Giraldeau, L.-A., & Caraco, T. (2000). Social foraging theory. Princeton,NJ: Princeton University Press.
Hammond, K. R., & Stewart, T. R. (2001). The essential Brunswik:Beginnings, explications, and applications. New York, NY: OxfordUniversity Press.
Hastie, R. (1986). Review essay: Experimental evidence on group accu-racy. In B. Grofman & G. Owen (Eds.), Information pooling and groupdecision making (Vol. 2, pp. 129–157). Greenwich, CT: JAI Press.
Hastie, R., & Kameda, T. (2005). The robust beauty of majority rules ingroup decisions. Psychological Review, 112, 494–508.
Hastie, R., Penrod, S. D., & Pennington, N. (1983). Inside the jury.Cambridge, MA: Harvard University Press.
Henrich, J., & Boyd, R. (1998). The evolution of conformist transmissionand the emergence of between-group differences. Evolution and HumanBehavior, 19, 215–241.
Herrmann, B., Thöni, C., & Gachter, S. (2008, March 7). Antisocialpunishment across societies. Science, 319, 1362–1367.
Hung, A. A., & Plott, C. R. (2001). Information cascades: Replication andan extension to majority rule and conformity-rewarding institutions.American Economic Review, 91, 1508–1520.
Ingham, A. G., Levinger, G., Graves, J., & Peckham, V. (1974). TheRingelmann effect: Studies of group size and group performance. Jour-nal of Experimental Social Psychology, 10, 371–384.
Janis, I. L. (1972). Victims of groupthink. Boston, MA: Houghton Mifflin.Kameda, T., & Nakanishi, D. (2002). Cost-benefit analysis of social/
cultural learning in a non-stationary uncertain environment: An evolu-tionary simulation and an experiment with human subjects. Evolutionand Human Behavior, 23, 373–393.
Kameda, T., & Nakanishi, D. (2003). Does social/cultural learning increasehuman adaptability? Rogers’s question revisited. Evolution and HumanBehavior, 24, 242–260.
Kameda, T., Takezawa, M., & Hastie, R. (2003). The logic of socialsharing: An evolutionary game analysis of adaptive norm development.Personality and Social Psychology Review, 7, 2–19.
Kameda, T., Takezawa, M., Ohtsubo, Y., & Hastie, R. (2010). Are ourminds fundamentally egalitarian? Adaptive bases of different sociocul-tural models about distributive justice. In M. Schaller, A. Norenzyan,S. J. Heine, T. Yamagishi, & T. Kameda (Eds.), Evolution, culture, andthe human mind (pp. 151–163). New York, NY: Psychology Press.
Kameda, T., & Tamura, R. (2007). “To eat or not to be eaten?” Collectiverisk-monitoring in groups. Journal of Experimental Social Psychology,43, 168–179.
Kameda, T., & Tindale, R. S. (2006). Groups as adaptive devices: Humandocility and group aggregation mechanisms in evolutionary context. InM. Schaller, J. Simpson, & D. Kenrick (Eds.), Evolution and socialpsychology (pp. 317–341). New York, NY: Psychology Press.
Kameda, T., Tindale, R. S., & Davis, J. H. (2003). Cognitions, preferences,and social sharedness: Past, present, and future directions in groupdecision making. In S. L. Schneider & J. Shanteau (Eds.), Emergingperspectives on judgment and decision research (pp. 215–240). Cam-bridge, England: Cambridge University Press.
Kenrick, D. T., Li, N. L., & Butner, J. (2003). Dynamical evolutionarypsychology: Individual decision rules and emergent social norms. Psy-chological Review, 110, 3–28.
Kerr, N. L. (1983). Motivation losses in small groups: A social dilemmaanalysis. Journal of Personality and Social Psychology, 45, 819–828.
Kerr, N. L., MacCoun, R., & Kramer, G. P. (1996). Bias in judgment:Comparing individuals and groups. Psychological Review, 103, 687–719.
Kerr, N. L., & Tindale, R. S. (2004). Group performance and decisionmaking. Annual Review of Psychology, 55, 623–655.
17DEMOCRACY UNDER UNCERTAINTY
AQ: 13
tapraid5/z2q-psycho/z2q-psycho/z2q00410/z2q2224d10z xppws S�1 7/23/10 8:24 Art: 2010-0021
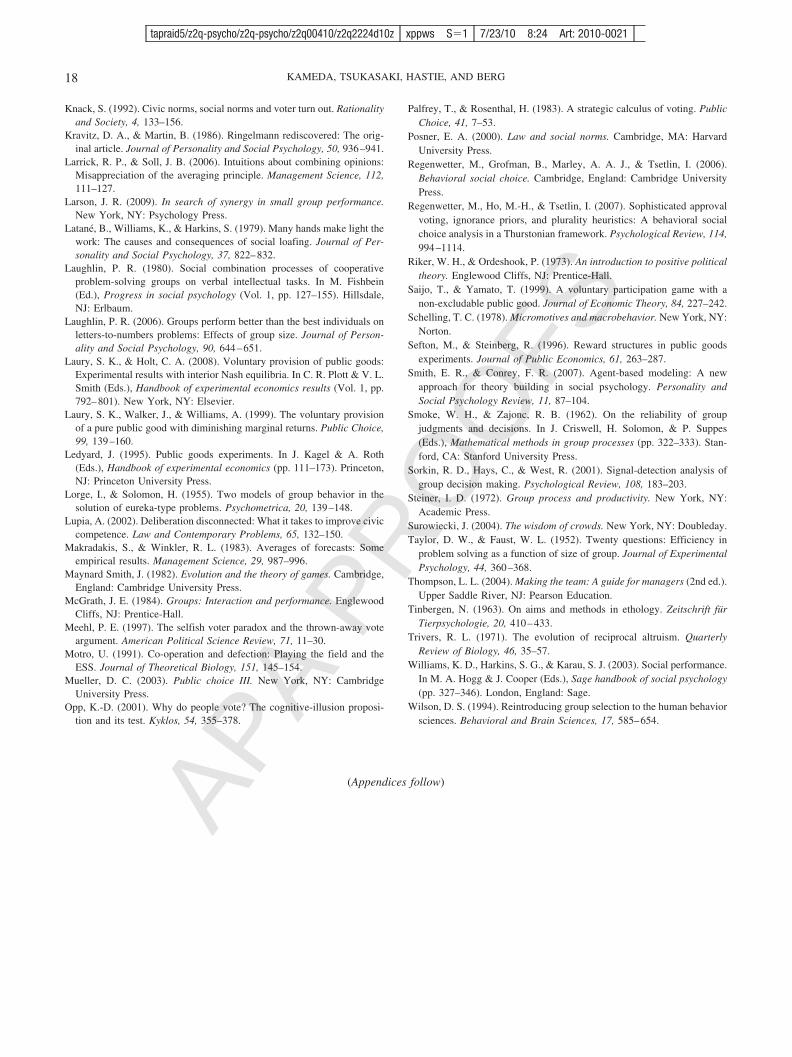
APA
PRO
OFS
Knack, S. (1992). Civic norms, social norms and voter turn out. Rationalityand Society, 4, 133–156.
Kravitz, D. A., & Martin, B. (1986). Ringelmann rediscovered: The orig-inal article. Journal of Personality and Social Psychology, 50, 936–941.
Larrick, R. P., & Soll, J. B. (2006). Intuitions about combining opinions:Misappreciation of the averaging principle. Management Science, 112,111–127.
Larson, J. R. (2009). In search of synergy in small group performance.New York, NY: Psychology Press.
Latane, B., Williams, K., & Harkins, S. (1979). Many hands make light thework: The causes and consequences of social loafing. Journal of Per-sonality and Social Psychology, 37, 822–832.
Laughlin, P. R. (1980). Social combination processes of cooperativeproblem-solving groups on verbal intellectual tasks. In M. Fishbein(Ed.), Progress in social psychology (Vol. 1, pp. 127–155). Hillsdale,NJ: Erlbaum.
Laughlin, P. R. (2006). Groups perform better than the best individuals onletters-to-numbers problems: Effects of group size. Journal of Person-ality and Social Psychology, 90, 644–651.
Laury, S. K., & Holt, C. A. (2008). Voluntary provision of public goods:Experimental results with interior Nash equilibria. In C. R. Plott & V. L.Smith (Eds.), Handbook of experimental economics results (Vol. 1, pp.792–801). New York, NY: Elsevier.
Laury, S. K., Walker, J., & Williams, A. (1999). The voluntary provisionof a pure public good with diminishing marginal returns. Public Choice,99, 139–160.
Ledyard, J. (1995). Public goods experiments. In J. Kagel & A. Roth(Eds.), Handbook of experimental economics (pp. 111–173). Princeton,NJ: Princeton University Press.
Lorge, I., & Solomon, H. (1955). Two models of group behavior in thesolution of eureka-type problems. Psychometrica, 20, 139–148.
Lupia, A. (2002). Deliberation disconnected: What it takes to improve civiccompetence. Law and Contemporary Problems, 65, 132–150.
Makradakis, S., & Winkler, R. L. (1983). Averages of forecasts: Someempirical results. Management Science, 29, 987–996.
Maynard Smith, J. (1982). Evolution and the theory of games. Cambridge,England: Cambridge University Press.
McGrath, J. E. (1984). Groups: Interaction and performance. EnglewoodCliffs, NJ: Prentice-Hall.
Meehl, P. E. (1997). The selfish voter paradox and the thrown-away voteargument. American Political Science Review, 71, 11–30.
Motro, U. (1991). Co-operation and defection: Playing the field and theESS. Journal of Theoretical Biology, 151, 145–154.
Mueller, D. C. (2003). Public choice III. New York, NY: CambridgeUniversity Press.
Opp, K.-D. (2001). Why do people vote? The cognitive-illusion proposi-tion and its test. Kyklos, 54, 355–378.
Palfrey, T., & Rosenthal, H. (1983). A strategic calculus of voting. PublicChoice, 41, 7–53.
Posner, E. A. (2000). Law and social norms. Cambridge, MA: HarvardUniversity Press.
Regenwetter, M., Grofman, B., Marley, A. A. J., & Tsetlin, I. (2006).Behavioral social choice. Cambridge, England: Cambridge UniversityPress.
Regenwetter, M., Ho, M.-H., & Tsetlin, I. (2007). Sophisticated approvalvoting, ignorance priors, and plurality heuristics: A behavioral socialchoice analysis in a Thurstonian framework. Psychological Review, 114,994–1114.
Riker, W. H., & Ordeshook, P. (1973). An introduction to positive politicaltheory. Englewood Cliffs, NJ: Prentice-Hall.
Saijo, T., & Yamato, T. (1999). A voluntary participation game with anon-excludable public good. Journal of Economic Theory, 84, 227–242.
Schelling, T. C. (1978). Micromotives and macrobehavior. New York, NY:Norton.
Sefton, M., & Steinberg, R. (1996). Reward structures in public goodsexperiments. Journal of Public Economics, 61, 263–287.
Smith, E. R., & Conrey, F. R. (2007). Agent-based modeling: A newapproach for theory building in social psychology. Personality andSocial Psychology Review, 11, 87–104.
Smoke, W. H., & Zajonc, R. B. (1962). On the reliability of groupjudgments and decisions. In J. Criswell, H. Solomon, & P. Suppes(Eds.), Mathematical methods in group processes (pp. 322–333). Stan-ford, CA: Stanford University Press.
Sorkin, R. D., Hays, C., & West, R. (2001). Signal-detection analysis ofgroup decision making. Psychological Review, 108, 183–203.
Steiner, I. D. (1972). Group process and productivity. New York, NY:Academic Press.
Surowiecki, J. (2004). The wisdom of crowds. New York, NY: Doubleday.Taylor, D. W., & Faust, W. L. (1952). Twenty questions: Efficiency in
problem solving as a function of size of group. Journal of ExperimentalPsychology, 44, 360–368.
Thompson, L. L. (2004). Making the team: A guide for managers (2nd ed.).Upper Saddle River, NJ: Pearson Education.
Tinbergen, N. (1963). On aims and methods in ethology. Zeitschrift furTierpsychologie, 20, 410–433.
Trivers, R. L. (1971). The evolution of reciprocal altruism. QuarterlyReview of Biology, 46, 35–57.
Williams, K. D., Harkins, S. G., & Karau, S. J. (2003). Social performance.In M. A. Hogg & J. Cooper (Eds.), Sage handbook of social psychology(pp. 327–346). London, England: Sage.
Wilson, D. S. (1994). Reintroducing group selection to the human behaviorsciences. Behavioral and Brain Sciences, 17, 585–654.
(Appendices follow)
18 KAMEDA, TSUKASAKI, HASTIE, AND BERG
tapraid5/z2q-psycho/z2q-psycho/z2q00410/z2q2224d10z xppws S�1 7/23/10 8:24 Art: 2010-0021

APA
PRO
OFS
Appendix A
Implementation of the Replicator Dynamic in the Evolutionary Computer Simulation
We used the following formula to represent the selection process(Henrich & Boyd, 1998). Let us denote proportion of strategy i (� 1or 2) in the population at generation t as pi
t and its fitness outcome asOi
t. Then, its proportion in the population at generation t � 1 is
pit�1 �
pit�W � Oi
t�
Wt
,
where W is the baseline-fitness constant common to all strategies(we set W � 30 in the current simulation) and Wt is the averagefitness outcome:
Wt � �i
pit�W � Oi
t�.
Appendix B
Estimation of the Empirical Group and Individual Payoff Functions
We describe a simple model in which the group’s aggregatepayoff as a function of the number of group members who con-tribute information has diminishing marginal returns. For analytictractability, we make standard assumptions that result in an objec-tive function that rewards predictive accuracy by providing a fixedreward from which the squared error of the group’s prediction isdeducted. Accurate predictions have smaller squared errors and,consequently, higher payoffs according to this objective function.A priori, errors can be expected but are not known until ex postvalues of all random variables are realized. It is straightforward toshow that the resulting expected payoff function is increasing inthe quantity of information but concave, implying diminishingmarginal returns to information.
Consider a group trying to predict the unknown outcome x.Denote its forecast m. The group receives (in the aggregate) a fixedpayoff B if its forecast is perfectly accurate (i.e., m � x). Thegroup’s payoff, however, decreases as the group’s squared predic-tion error grows larger. Denoting the scaling of squared errors intothe units used in the payoff function as , we can assemble thesymbols defined above to form the group’s (aggregate) grosspayoff function:
Gross group payoff � B � �m � x�2.
Let N denote the number of noisy pieces of information that thegroup forecast depends on, so that the functional notation m(N)describes the mapping from quantity of information into groupforecasts. Denoting the cost of information as p per unit, then thenet group payoff function becomes
Net group payoff � B � �m�N� � x�2 � pN.
In general, the best use of N noisy signals, (x � ε1), . . . , (x � εN),is to construct the forecast m(N) as the conditional expectation ofx, which is very often assumed to take a linear form:
Ex|ε1, . . . , εN� � � � �1�x � ε1� � . . . � �N �x � εN�.
A simpler and more robust approach (in the absence of enoughstability in the environment to estimate the parameters in theregression) would be the simple average
m�N� � �i�1
N
�x � εi�/N � x � �ε1 � ε2 � . . . � εN�/N.
We now compute the expected value of the net group payofffunction:
EB � (m � x�2 � pN] �
B � E�ε1 � ε2 � . . . � εN�2�/N � pN
� B � �ε2/N � pN.
Applying this function as the group’s expected net payoff func-tion, we can examine the individual-level incentives for a singlemember of this group who is facing a binary decision of whetherto pay p and provide one more noisy signal to be included in thegroup’s forecast or to free ride on the information acquisition ofothers. We assume, as everywhere else in this article, that grossgroup payoffs are divided evenly among all group members (co-operators and free riders alike) but that the costs of information areborne individually. Thus, if there are n other group memberscooperating in a group with M members in total, after netting outcosts for the cooperator, the individual’s expected net payoff is
Expected net individual payoff for a cooperator
� �1/M��B � �ε2/�n � 1�� � p,
Expected net individual payoff for a free rider
� �1/M��B � �ε2/n�.
(Appendices continue)
19DEMOCRACY UNDER UNCERTAINTY
tapraid5/z2q-psycho/z2q-psycho/z2q00410/z2q2224d10z xppws S�1 7/23/10 8:24 Art: 2010-0021

APA
PRO
OFS
The point at which the individual payoff curves intersect definesthe so-called Nash point (see Footnote 10 in the main text):
n* � �0.5 � 0.5[1 � 4 �ε2/( pM)]0.5.
At integer values to the left of n*, the strategy of cooperationmaximizes individual payoffs even though some other membersare free riding. At integer values to the right of n*, free ridingmaximizes individual payoffs. As intuition would suggest, n* is adecreasing function of the price of information, p, holding all elseequal. Also, n* is increasing in because higher penalties forforecasting error increase the individual rationale for contributinginformation. Similarly, n* is increasing in �ε
2 because, when eachsingle piece of information is lower in quality (i.e., less precise),the marginal returns from additional units of information diminishless rapidly, implying a rightward shift in the cooperator–free-ridercrossover point. Finally, holding all else equal, n* is decreasing ingroup size. The incentive to cooperate is present for fewer groupmembers, the larger the group is.
Recall that the expected aggregate net payoff function for thegroup is
Expected aggregate net payoff � B � �ε2/N � pN.
We refer to the total number of cooperators N that maximizes theexpected aggregate net payoff as the Pareto point and denote thisspecial value of N as N* (see Footnote 10 in the main text):
N* � � �ε2/p�0.5.
Notice that the Pareto point is independent from the parameters Band M. It depends positively on the penalty for forecast error andon the imprecision of private information and is decreasing in theprice of information.
This model is used to estimate the empirical group and individ-ual payoff functions in the body of the article. The estimationprocedure is as follows. First, we estimate the gross individualpayoff conditional on the reciprocal of the total number of coop-erators in each group, 1/N. The notation introduced here usessubscripts g to index groups and t to index experimental trials.Because gross payoffs (before netting out the cost of individualinformation acquisition) are the same for all group members, thenotation here does not index individuals’ identities, although thiswould be straightforward to add. Using the definitions from above,any individual in group g receives an individual gross payoff intrial t given by the following expression,
Individual’s gross payoff � Eygt�1/Ngt�
� �1/M��B � �ε2/Ngt�,
where g ranges from one to 15 and t ranges from one to 72, for atotal of 15 72 � 1,080 observations that are obviously notstatistically independent. Because the same group is observed 72times, the statistical model allows for within-group correlation ofthe 72 error terms in the regression model, which affects the size
of estimated standard errors but not the estimated coefficients.There were only three observations in which N � 0. The model isvalid only when N � 0, and therefore, the regression coefficientswere estimated using the 1,077 observations for which N rangedbetween one and six. This produced statistically significant regres-sion coefficients and the following estimated regression line wherecoefficients are rounded to the nearest integer:
Ey|1/N� � a � b�1/N� � 60 � 9/N.
This regression line is plotted in Figure B1 together with meanvalues of y at each value of N, the total number of cooperators inthe group. It is straightforward to estimate expected individual netpayoff for a cooperator and for a free rider as a function of n, thenumber of other group members who cooperate, from Figure B1.For a free rider, there are no costs to net out, and the grossindividual payoff in Figure B1 is identical to the net payoff, plottedas a dashed line in Figure B2. For a free rider, the total number ofcooperators in the group is equal to the number of other groupmembers cooperating: N � n. For a cooperator, however, the totalnumber of cooperators includes the others plus him or herself, andtherefore, N � n � 1, plotted in Figure B2 as the solid line aftersubtracting 6 yen for the cost of contributing to the public good.The figure shows that the two payoff curves cross strictly to theleft of n � 1, where n represents the number of other groupmembers who cooperate. This implies that cooperation maximizesindividual payoffs when no other group members cooperate (atn � 0) and that free riding maximizes individual payoffs as soonas there is at least one other group member cooperating (when n �0). Thus, any Nash equilibrium is a profile of binary actions inwhich there is one cooperator and five free riders.
(Appendices continue)
40
45
50
55
60
65
0 1 2 3 4 5 6
Mea
n in
divi
dual
gro
ss p
ayof
fs
Total number of group members who contribute (N)
Figure B1. Fitted regression line for individual gross payoffs (and ob-served means) as a function of N, the total number of cooperators in thegroup. The regression model is E[individual gross payoff|1/N] � a �b(1/N) � 60 � 9/N, for 1 � N � 6. The mean of three payoff observationsfor N � 0 is plotted in the figure as well, although it is not derived fromthe regression model with the restricted range of N. The model was fit with1,077 observations, and the coefficients were statistically significant at the5% level.
20 KAMEDA, TSUKASAKI, HASTIE, AND BERG
FB1
FB2
tapraid5/z2q-psycho/z2q-psycho/z2q00410/z2q2224d10z xppws S�1 7/23/10 8:24 Art: 2010-0021

APA
PRO
OFS
Figure B3 shows the empirical net aggregate payoff for groupsas a function of the total number of cooperators. The points on thiscurve are empirical averages over 1,080 observations of grouppayoffs and numbers of cooperators. The curve has a local maxi-mum at three and a global maximum at six. Thus, three is a localPareto point, although a benevolent dictator aiming to maximizeaggregate payoffs would choose the global Pareto point, six.
In linear public-goods games, the dominant strategy is usually tocontribute zero and, if not zero, then the other boundary point ofthe action space (i.e., contributing the maximum amount). Incontrast, nonlinear public-goods payoff structures can generateNash equilibria on the strict interior of the agents’ action spaces.Our model’s Nash equilibrium requires one contributor per group,which falls short of the socially efficient Pareto points of three(local) and six (global) contributors per group. As shown in Fig-ure 10 in the main text, the data revealed a pronounced mode atthree and showed that the groups we observed regularly achieved
larger aggregate payoffs than the Nash equilibrium would predict.We found that groups stably functioned at a locally Pareto efficientlevel of public-goods contributions, with three contributors andthree free riders per group. The unambiguous modal value isremarkable, in that subjects found a locally best social outcome asa group that required asymmetric action profiles among groupmembers, without any mechanism to coordinate action. The sub-jects in our study earned more by cooperating more than is pre-dicted from the individual incentives built into the game structure.
Received January 25, 2010Revision received June 8, 2010
Accepted June 14, 2010 �
4042444648505254565860
0 1 2 3 4 5
Expe
cted
net
indi
vidu
al p
ayof
fs
Number of other group members who cooperate (n)
Cooperator
Free-rider
Figure B2. Estimated net individual payoffs for cooperators (solid line)and free riders (dotted line) as a function of the number of other cooper-ators in the group.
250
260
270
280
290
300
310
320
330
340
0 1 2 3 4 5 6
Empi
rical
net
agg
rega
te p
ayof
fs
Total number of group members who contribute (N)
Figure B3. Empirical net aggregate payoff for groups as a function of N,the total number of cooperators in the group (summing over six groupmembers’ individual payoffs after netting out costs for cooperation). Thecurve has a local maximum at three and a global maximum at six. Thus,three is a local Pareto point, although a benevolent dictator aiming tomaximize aggregate payoffs would choose the global Pareto point, six.
21DEMOCRACY UNDER UNCERTAINTY
FB3
tapraid5/z2q-psycho/z2q-psycho/z2q00410/z2q2224d10z xppws S�1 7/23/10 8:24 Art: 2010-0021

JOBNAME: AUTHOR QUERIES PAGE: 1 SESS: 3 OUTPUT: Fri Jul 23 08:32:03 2010/tapraid5/z2q�psycho/z2q�psycho/z2q00410/z2q2224d10z
AQ1: Author: APA has an upper limit of 5 keywords or brief key phrases. You’ve provided 6 andso need to indicate which one can be deleted.
AQ2: Author: McGrath (1982) is not on your reference list. Do you mean McGrath (1984), which ison the reference list? If not, please provide a complete reference-list entry for McGrath (1982).
AQ3: Author: Which Kameda et al. (2003) do you mean here? There are two on your reference list:Kameda, Takezawa, & Hastie (2003) and Kameda, Tindale, & Davis (2003).
AQ4: Author: Which Kameda et al. (2003) do you mean here? There are two on your reference list:Kameda, Takezawa, & Hastie (2003) and Kameda, Tindale, & Davis (2003).
AQ5: Author: Brunswik is dated 1956 on your reference list. Which year is correct?
AQ6: Author: Cooksey is dated 1996 on your reference list. Which year is correct?
AQ7: Author: Brunswik is dated 1956 on your reference list. Which year is correct?
AQ8: Author: Lupia is dated 2002 on your reference list. Which year is correct?
AQ9: Author: Which Kameda et al. (2003) do you mean here? There are two on your reference list:Kameda, Takezawa, & Hastie (2003) and Kameda, Tindale, & Davis (2003).
AQ10: Author: Feddersen & Pesendorfer is dated 1998 on your reference list. Which year iscorrect?
AQ11: Author: Heinrich & Boyd is dated 1998 on your reference list. Which year is correct?
AQ12: Author: Aldrich (1997) is not cited in the text. Please cite or delete it.
AQ13: Author: Gintis (2007) is not cited in the text. Please cite or delete it.
AQ14: Author: What do the error bars in Figure 8 indicate?
AUTHOR QUERIES
AUTHOR PLEASE ANSWER ALL QUERIES 1