taiwan’s looming banking crisis
TRANSCRIPT
Taiwan’s looming banking crisis
Heather Montgomery*
The Asian Development Bank Institute, Kasumigaseki Building 8F, 3-2-5 Kasumigaseki,
Chiyoda-ku, Tokyo 100-6008, Japan
Received 3 December 2002; received in revised form 1 July 2003; accepted 7 July 2003
Abstract
Although it is unlikely that an economy such as Taiwan would face a balance of payments crisis of
the type that hit Asia in 1997, institutional analysis suggests that the banking sector may be vulnerable
to an internally driven crisis.
This study applies the threshold indicators approach of Kaminsky and Reinhart [Am. Econ. Rev.
89 (1999) 473] to evaluate the likelihood of a banking crisis in Taiwan. Seventy percent of the
macroeconomic indicators signal a banking crisis. This percentage is close to that of Korea in late
1996 and is higher than that of Japan just before Japan’s banking crisis erupted in the Fall of 1997.
# 2003 Elsevier Inc. All rights reserved.
JEL classification: F31
Keywords: Early warning; Banking crisis; Taiwan
1. Introduction
Is Taiwan headed for a banking crisis? The economy weathered the Asian Financial
crisis of 1997 remarkably well. While many other Asian economies slipped into recession
in 1998, Taipei, China maintained a moderate growth rate of 4.83%1 (Ding, Ko, Liu, &
Yeh, 2001). Taiwan’s liberalization of cross border capital flows is considered to have been
more cautious and gradual than that of other Asian countries.2 The current account balance
Journal of Asian Economics 14 (2003) 645–667
* Tel.: þ81-3-3593-5524; fax: þ81-3-3593-4270.
E-mail address: [email protected] (H. Montgomery).1 In the 5 years prior to the 1997 crisis, Taiwan had average growth rate of 6.3% (Asian Development Bank,
1998).2 For example, see Thurbon (2001) for an analysis of Taiwan’s external financial liberalization as compared
with South Korea.
1049-0078/$ – see front matter # 2003 Elsevier Inc. All rights reserved.
doi:10.1016/S1049-0078(03)00100-3
remained positive and the central bank maintained ample foreign reserves.3 Although the
new Taiwan dollar has lost some strength since 1999, the currency faced nothing like the
devaluations experienced in crisis hit Asian countries.
However, while the economy of Taipei, China remains well insulated from the type of
external shocks that caused the Asian crisis of 1997, the economy is currently facing an
internal crisis in its banking system. The non-performing loan ratio of Taiwanese banks
have reached an all-time high and measures of bank performance such as return on equity
and return on assets have been declining steadily since 1997.
The domestic nature of the problems faced by Taiwan’s banking sector has led to
comparisons with Japan (Cavey and Hou, 2002; Montgomery, 2002). This study examines
the banking problems in Taipei, China, drawing relevant comparisons with Japan’s banking
crisis of 1997. Section 2 examines the health of the Taiwanese banking sector. Section 3
analyzes the major causes of the banking sector problems and Section 4 reviews the
similarities between the experiences of Taiwan and Japan. Section 5 uses a threshold
indicators approach to evaluate the likelihood of a banking crisis in Taiwan, providing
comparisons with Japan and Korea prior to the 1997 crisis. Section 6 concludes.
2. Early warning signs of a banking crisis?
Why are there fears of a banking crisis in Taipei, China? The return on assets (ROA)
and return on equity (ROE) of Taiwan’s major banks have been declining since 1997
(see Table 1). In addition, the non-performing loan ratio of Taiwan’s major banks has
been steadily increasing over the past decade and is now at an all-time high.4 The most
current figure of 7.79% is underestimated since new non-performing loan definitions,
following current global standards, will be implemented at the close of this fiscal
Table 1
Taiwan: performance of major banks 1991–2000
Year ROA (%) ROE (%) NPL/loans (%)
1993 0.97 8.76 1.14
1994 1.16 9.31 1.82
1995 0.93 7.81 2.85
1996 0.99 9.15 3.68
1997 1.09 10.21 3.70
1998 0.75 5.69 4.36
1999 0.59 4.55 4.88
2000 0.38 2.28 5.34
3 I thank an anonymous referee for pointing out that Taiwan’s reserve position in both foreign exchange and
gold did deteriorate significantly when China conducted naval exercises in the Taiwan Strait, but recovered with
intervention by US warships. This sensitivity of economic indicators to political events has been compared to the
experience of Mexico prior to the Tequilla Crisis in 1994.4 Kwack (2000) shows that the non-performing loan rates of banks are a major determinant of financial crises
in Asia.
646 H. Montgomery / Journal of Asian Economics 14 (2003) 645–667
year. Current estimates of the non-performing loan ratio under the new definition are
11.53%.
The non-performing loan problem, although serious for all banks in Taipei, China, is
much more pronounced at smaller financial institutions such as the credit cooperatives and
credit departments of farmers’ and Fishermen’s associations5 (see Table 2). Even before the
non-performing loan problem had grown to such proportions, there were a string of
arranged mergers between troubled credit cooperatives and healthier banks in the late
1990s.6 When the problems in the banking sector began to surface after 1997, there were
also runs on several financial institutions.7 These were also resolved, in many cases, via
arranged mergers with healthier institutions.
As the banking sector problems grew, the government finally allocated a special
Financial Reconstruction Fund to deal with troubled institutions and this was first activated
in August of 2001 when 36 institutions, mostly agricultural cooperatives, were placed
under state management. Although some public funds were used in this process, eventually
the troubled financial institutions were again pushed off on to healthier banks. In October of
the same year, the fund took over the management of Chung Shing Bank, a mid-sized bank
which had been under government supervision since April of 2000. The government has
attempted to get rid of the bank in three separate auctions, all of which have failed to result
in a sale. In January of 2002, the reconstruction fund took over the Medium Business Bank
of Kaosiung, another mid-sized bank.
3. Causes of the banking sector problems
This section discusses two principle causes of the banking sector problems in
Taiwan: macroeconomic conditions, in particular the extremely volative movement
in asset markets, and financial liberalization of both capital markets and the banking
sector.
Table 2
Taiwan: non-performing loans of financial institutions 1993–2001
1993
(%)
1994
(%)
1995
(%)
1996
(%)
1997
(%)
1998
(%)
1999
(%)
2000
(%)
2001
(%)
Domestic Banks 1.17 1.85 2.92 3.68 3.70 4.36 4.88 5.34 8.26
Foreign Banks 0.38 0.45 0.82 0.97 1.00 1.60 3.20 3.22 3.59
Credit Cooperatives 1.17 2.15 3.14 6.11 6.44 7.58 10.44 12.44 11.89
Credit Departments of
Farmers’ Associations
1.70 2.87 5.24 8.46 10.83 13.18 16.10 17.97 19.44
Credit Departments of
Fishermens’ Associations
2.90 2.55 5.02 6.21 9.21 11.32 12.99 14.11 15.19
5 Yu (2000) shows that bank size is one of the main determinants of capital ratios of Taiwanese banks and that
small and medium sized banks may be undercapitalized.6 In just 2 years between 1997 and 1998, there were 15 arranged mergers for troubled credit cooperatives
(Lee, 2001).7 At least 10 reported bank runs since November 1998 (Lee, 2001).
H. Montgomery / Journal of Asian Economics 14 (2003) 645–667 647
3.1. Macroeconomic conditions
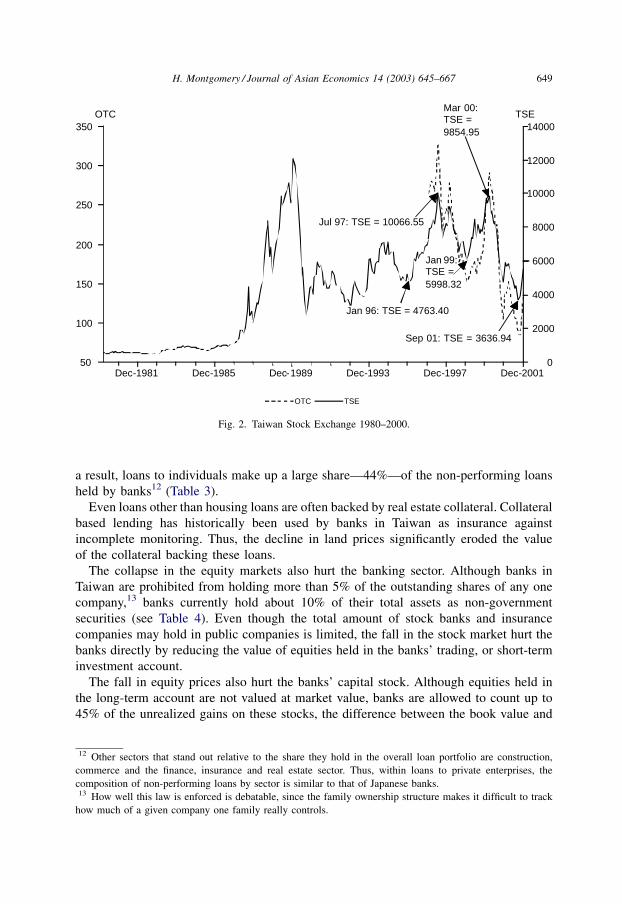
Asset prices skyrocketed in Taipei, China in the late 1980s.8 Housing prices more than
quadrupled between 1987 and 19909 (see Fig. 1). During the same period, the Taiwan Stock
Exchange (TAIEX) soared from 637 points in July 1985 to 12,054 points in January 1990.
After peaking in January 1990, the TAIEX began to fall, and hit as low as 2705 in
September 1990. Since this initial fall, the market has been extremely volatile, rising and
crashing again in 1997 and again 2000 (see Fig. 2).
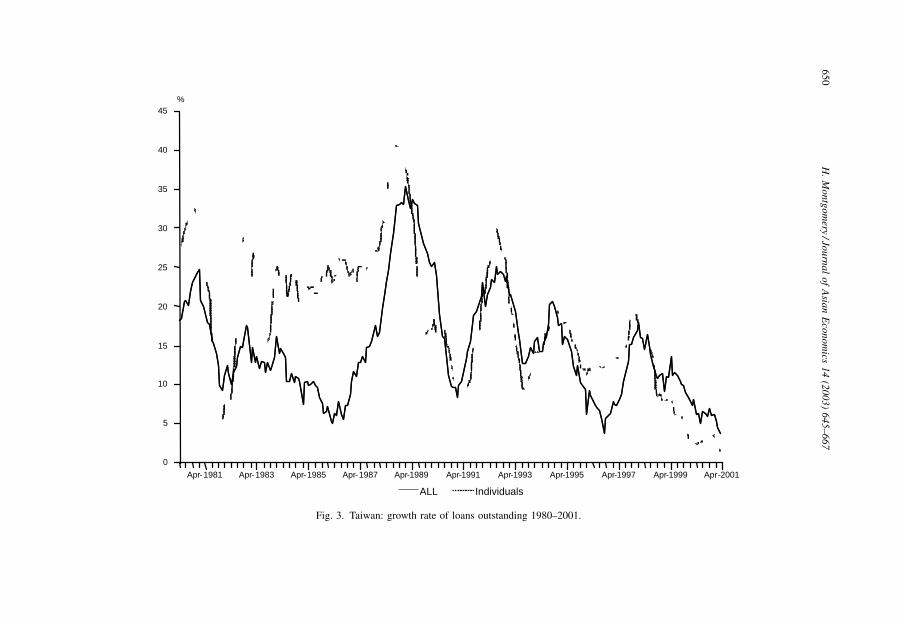
The decline in equity and real estate prices greatly affected the banking sector. As the
housing market boomed in the 1980s, bank loans to individuals drew double digit loan
growth rates (Fig. 3). In March 1980 20% of total bank lending was to individuals.10 By
March 1990, the share of lending going to individuals had more than doubled11 (Fig. 4). As
0
20
40
60
80
100
120
140
1982
Q1
1982
Q3
1983
Q1
1983
Q3
1984
Q1
1984
Q3
1985
Q1
1985
Q3
1986
Q1
1986
Q3
1987
Q1
1987
Q3
1988
Q1
1988
Q3
1989
Q1
1989
Q3
199Q
Q1
199Q
Q3
1991
Q1
1991
Q3
1992
Q1
1992
Q3
1993
Q1
1993
Q3
1994
Q1
1994
Q3
1995
Q1
1995
Q3
1996
Q1
1996
Q3
1997
Q1
1997
Q3
1998
Q1
1998
Q3
1999
Q1
1999
Q3
2000
Q1
2000
Q3
Fig. 1. Taiwan: housing price index 1982–2000.
8 Yin (2001) provides a description of how financial regulation and macroeconomic policies contributed to the
asset bubble in Taipei, China.9 Real estate prices in Taiwan have not collapsed as yet, partially due to government intervention in the
market. However, the effectiveness of these so-called ‘‘hot air’’ policies is declining and real estate prices in
certain areas have seen significant drops. For example, Yin (2001) reports that real estate prices in south and
central Taipei, China are now 50–60% of their peak.10 Lending to individuals is not entirely housing loans. The category includes real estate, movable properties,
business investments and current operations. However, most loans to individuals (64.45%) are made to finance
real estate.11 Overall, including loans to individuals and various industrial sectors, 36.2% of loans are made to finance real
estate deals. Since real estate loans to individuals make up 25.4% (64:45 � 39:42%), the remaining 10.79%
(36:2 � 25:4%) are lending to private or government enterprises in order to finance real estate.
648 H. Montgomery / Journal of Asian Economics 14 (2003) 645–667
a result, loans to individuals make up a large share—44%—of the non-performing loans
held by banks12 (Table 3).
Even loans other than housing loans are often backed by real estate collateral. Collateral
based lending has historically been used by banks in Taiwan as insurance against
incomplete monitoring. Thus, the decline in land prices significantly eroded the value
of the collateral backing these loans.
The collapse in the equity markets also hurt the banking sector. Although banks in
Taiwan are prohibited from holding more than 5% of the outstanding shares of any one
company,13 banks currently hold about 10% of their total assets as non-government
securities (see Table 4). Even though the total amount of stock banks and insurance
companies may hold in public companies is limited, the fall in the stock market hurt the
banks directly by reducing the value of equities held in the banks’ trading, or short-term
investment account.
The fall in equity prices also hurt the banks’ capital stock. Although equities held in
the long-term account are not valued at market value, banks are allowed to count up to
45% of the unrealized gains on these stocks, the difference between the book value and
Dec-1981 Dec-1985 Dec-1989 Dec-1993 Dec-1997 Dec-2001
350
300
250
200
150
100
50
OTC14000
12000
10000
8000
6000
4000
2000
0
TSE
OTC TSE
Jul 97: TSE = 10066.55
Jan 99:TSE =5998.32
Mar 00:TSE =9854.95
Sep 01: TSE = 3636.94
Jan 96: TSE = 4763.40
Fig. 2. Taiwan Stock Exchange 1980–2000.
12 Other sectors that stand out relative to the share they hold in the overall loan portfolio are construction,
commerce and the finance, insurance and real estate sector. Thus, within loans to private enterprises, the
composition of non-performing loans by sector is similar to that of Japanese banks.13 How well this law is enforced is debatable, since the family ownership structure makes it difficult to track
how much of a given company one family really controls.
H. Montgomery / Journal of Asian Economics 14 (2003) 645–667 649
Apr-1981 Apr-1983 Apr-1985 Apr-1987 Apr-1989 Apr-1991 Apr-1993 Apr-1995 Apr-1997 Apr-1999 Apr-2001
45
40
35
30
25
20
15
10
5
0
%
ALL Individuals
Fig. 3. Taiwan: growth rate of loans outstanding 1980–2001.
65
0H
.M
on
tgo
mery
/Jou
rna
lo
fA
sian
Eco
no
mics
14
(20
03
)6
45
–6
67
market value, as Tier II capital. Thus, the fall in equity prices reduced the banks’ capital to
asset ratios, contributing to a ‘‘capital crunch’’ which reduced aggregate lending.
There is one additional way in which the equity markets affect the health of the banking
sector. In Taiwan, so called ‘‘leveraged stock purchases’’ are common, meaning that
companies use bank loans to speculate in stocks. Thus the level of the equity market is
directly related to the asset quality of the banking sector even for loans that are not going
directly to finance property deals.
40.84
20.10
9.68 7.64
21.95
41.08
54.35
0% 10% 20% 30% 40% 50% 60% 70% 80% 90% 100%
Individual
Non-Profit Institutions(1.23)
Government Agencies (2.37)
GovernmentEnterprises
Private Enterprises
0.76
1990Mar
1980Mar
Fig. 4. Taiwan: outstanding loans-share by sector 1980 and 1990.
Table 3
Taiwan: composition of NPL by sector (as percent of total as of end 2001)
Private enterprises 55.40%
Agriculture, Forestry, Fishing and Animal Husbandry 0.45%
Mining and Quarrying 0.11%
Manufacturing 20.52%
Electricity, Gas and Water Supply 0.04%
Construction 7.23%
Commerce 14.08%
Transport, Storage and Communication 0.59%
Finance, Insurance and Real Estate 9.49%
Other 2.89%
Government enterprises 0.10%
Non-profit institutions 0.07%
Individuals 43.48%
Financial institutions 0.41%
Other 0.54%
H. Montgomery / Journal of Asian Economics 14 (2003) 645–667 651
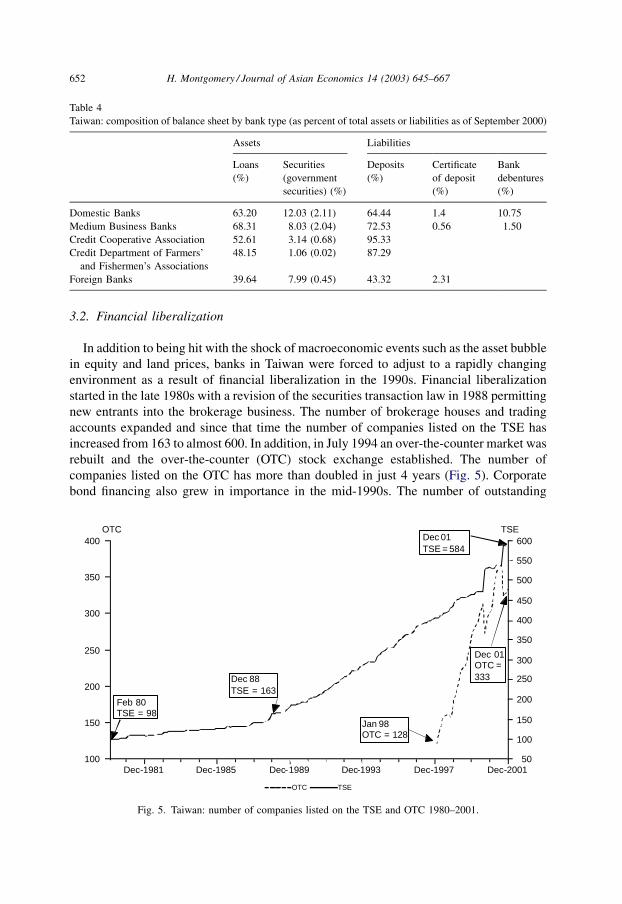
3.2. Financial liberalization
In addition to being hit with the shock of macroeconomic events such as the asset bubble
in equity and land prices, banks in Taiwan were forced to adjust to a rapidly changing
environment as a result of financial liberalization in the 1990s. Financial liberalization
started in the late 1980s with a revision of the securities transaction law in 1988 permitting
new entrants into the brokerage business. The number of brokerage houses and trading
accounts expanded and since that time the number of companies listed on the TSE has
increased from 163 to almost 600. In addition, in July 1994 an over-the-counter market was
rebuilt and the over-the-counter (OTC) stock exchange established. The number of
companies listed on the OTC has more than doubled in just 4 years (Fig. 5). Corporate
bond financing also grew in importance in the mid-1990s. The number of outstanding
Table 4
Taiwan: composition of balance sheet by bank type (as percent of total assets or liabilities as of September 2000)
Assets Liabilities
Loans
(%)
Securities
(government
securities) (%)
Deposits
(%)
Certificate
of deposit
(%)
Bank
debentures
(%)
Domestic Banks 63.20 12.03 (2.11) 64.44 1.4 10.75
Medium Business Banks 68.31 8.03 (2.04) 72.53 0.56 1.50
Credit Cooperative Association 52.61 3.14 (0.68) 95.33
Credit Department of Farmers’
and Fishermen’s Associations
48.15 1.06 (0.02) 87.29
Foreign Banks 39.64 7.99 (0.45) 43.32 2.31
Dec-1981 Dec-1985 Dec-1989 Dec-1993 Dec-1997 Dec-2001
400
350
300
250
200
150
100
OTC600
550
500
450
400
350
300
250
200
150
100
50
TSE
OTC TSE
Feb 80TSE = 98
Dec 88TSE = 163
Dec 01TSE = 584
Dec 01OTC =333
Jan 98OTC = 128
Fig. 5. Taiwan: number of companies listed on the TSE and OTC 1980–2001.
652 H. Montgomery / Journal of Asian Economics 14 (2003) 645–667
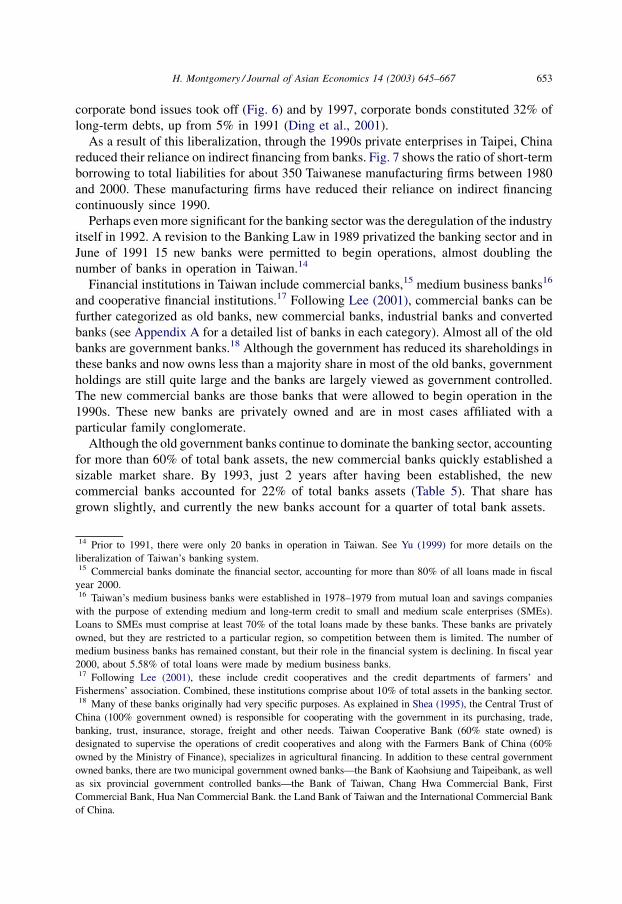
corporate bond issues took off (Fig. 6) and by 1997, corporate bonds constituted 32% of
long-term debts, up from 5% in 1991 (Ding et al., 2001).
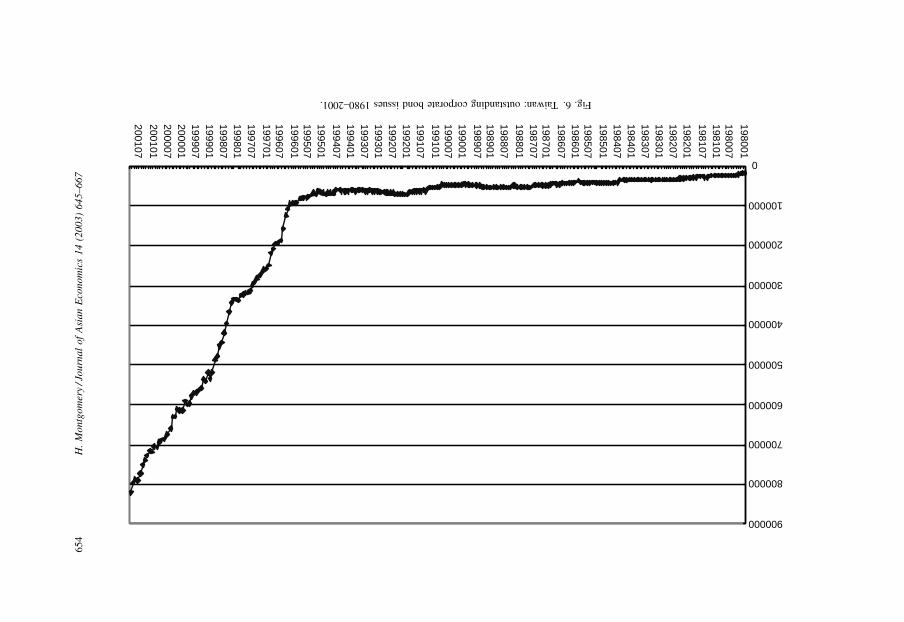
As a result of this liberalization, through the 1990s private enterprises in Taipei, China
reduced their reliance on indirect financing from banks. Fig. 7 shows the ratio of short-term
borrowing to total liabilities for about 350 Taiwanese manufacturing firms between 1980
and 2000. These manufacturing firms have reduced their reliance on indirect financing
continuously since 1990.
Perhaps even more significant for the banking sector was the deregulation of the industry
itself in 1992. A revision to the Banking Law in 1989 privatized the banking sector and in
June of 1991 15 new banks were permitted to begin operations, almost doubling the
number of banks in operation in Taiwan.14
Financial institutions in Taiwan include commercial banks,15 medium business banks16
and cooperative financial institutions.17 Following Lee (2001), commercial banks can be
further categorized as old banks, new commercial banks, industrial banks and converted
banks (see Appendix A for a detailed list of banks in each category). Almost all of the old
banks are government banks.18 Although the government has reduced its shareholdings in
these banks and now owns less than a majority share in most of the old banks, government
holdings are still quite large and the banks are largely viewed as government controlled.
The new commercial banks are those banks that were allowed to begin operation in the
1990s. These new banks are privately owned and are in most cases affiliated with a
particular family conglomerate.
Although the old government banks continue to dominate the banking sector, accounting
for more than 60% of total bank assets, the new commercial banks quickly established a
sizable market share. By 1993, just 2 years after having been established, the new
commercial banks accounted for 22% of total banks assets (Table 5). That share has
grown slightly, and currently the new banks account for a quarter of total bank assets.
14 Prior to 1991, there were only 20 banks in operation in Taiwan. See Yu (1999) for more details on the
liberalization of Taiwan’s banking system.15 Commercial banks dominate the financial sector, accounting for more than 80% of all loans made in fiscal
year 2000.16 Taiwan’s medium business banks were established in 1978–1979 from mutual loan and savings companies
with the purpose of extending medium and long-term credit to small and medium scale enterprises (SMEs).
Loans to SMEs must comprise at least 70% of the total loans made by these banks. These banks are privately
owned, but they are restricted to a particular region, so competition between them is limited. The number of
medium business banks has remained constant, but their role in the financial system is declining. In fiscal year
2000, about 5.58% of total loans were made by medium business banks.17 Following Lee (2001), these include credit cooperatives and the credit departments of farmers’ and
Fishermens’ association. Combined, these institutions comprise about 10% of total assets in the banking sector.18 Many of these banks originally had very specific purposes. As explained in Shea (1995), the Central Trust of
China (100% government owned) is responsible for cooperating with the government in its purchasing, trade,
banking, trust, insurance, storage, freight and other needs. Taiwan Cooperative Bank (60% state owned) is
designated to supervise the operations of credit cooperatives and along with the Farmers Bank of China (60%
owned by the Ministry of Finance), specializes in agricultural financing. In addition to these central government
owned banks, there are two municipal government owned banks—the Bank of Kaohsiung and Taipeibank, as well
as six provincial government controlled banks—the Bank of Taiwan, Chang Hwa Commercial Bank, First
Commercial Bank, Hua Nan Commercial Bank. the Land Bank of Taiwan and the International Commercial Bank
of China.
H. Montgomery / Journal of Asian Economics 14 (2003) 645–667 653
0
100000
200000
300000
400000
500000
600000
700000
800000
900000
198001
198007198101198107
198201198207198301198307198401198407198501
198507198601198607
198701198707198801
198807198901198907
199001199007199101
199107199201199207199301199307199401199407
199501199507199601
199607199701
199707199801199807199901199907200001200007200101
200107
Fig.6.Taiwan:outstandingcorporatebondissues1980–2001.
65
4H
.M
on
tgo
mer
y/J
ou
rna
lo
fA
sia
nE
con
om
ics
14
(20
03
)6
45
–6
67
1986q3 1987q3 1988q3 1989q3 1990q3 1991q3 1992q3 1993q3 1994q3 1995q3 1996q3 1997q3 1998q3 1999q3 2000q3
15
16
17
18
19
20
21
22
23
24
25
26
27
28
29
30
31
32
33
34
35
Fig. 7. Taiwan: borrowing/total liabilities manufacturing firms 1980–2000.
H.
Mo
ntg
om
ery/Jo
urn
al
of
Asia
nE
con
om
ics1
4(2
00
3)
64
5–
66
76
55
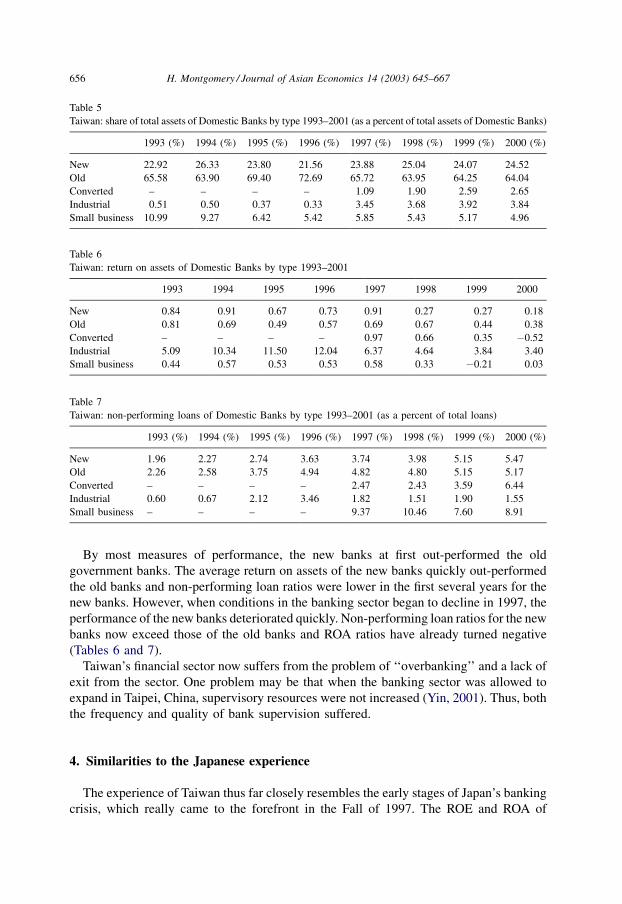
By most measures of performance, the new banks at first out-performed the old
government banks. The average return on assets of the new banks quickly out-performed
the old banks and non-performing loan ratios were lower in the first several years for the
new banks. However, when conditions in the banking sector began to decline in 1997, the
performance of the new banks deteriorated quickly. Non-performing loan ratios for the new
banks now exceed those of the old banks and ROA ratios have already turned negative
(Tables 6 and 7).
Taiwan’s financial sector now suffers from the problem of ‘‘overbanking’’ and a lack of
exit from the sector. One problem may be that when the banking sector was allowed to
expand in Taipei, China, supervisory resources were not increased (Yin, 2001). Thus, both
the frequency and quality of bank supervision suffered.
4. Similarities to the Japanese experience
The experience of Taiwan thus far closely resembles the early stages of Japan’s banking
crisis, which really came to the forefront in the Fall of 1997. The ROE and ROA of
Table 5
Taiwan: share of total assets of Domestic Banks by type 1993–2001 (as a percent of total assets of Domestic Banks)
1993 (%) 1994 (%) 1995 (%) 1996 (%) 1997 (%) 1998 (%) 1999 (%) 2000 (%)
New 22.92 26.33 23.80 21.56 23.88 25.04 24.07 24.52
Old 65.58 63.90 69.40 72.69 65.72 63.95 64.25 64.04
Converted – – – – 1.09 1.90 2.59 2.65
Industrial 0.51 0.50 0.37 0.33 3.45 3.68 3.92 3.84
Small business 10.99 9.27 6.42 5.42 5.85 5.43 5.17 4.96
Table 6
Taiwan: return on assets of Domestic Banks by type 1993–2001
1993 1994 1995 1996 1997 1998 1999 2000
New 0.84 0.91 0.67 0.73 0.91 0.27 0.27 0.18
Old 0.81 0.69 0.49 0.57 0.69 0.67 0.44 0.38
Converted – – – – 0.97 0.66 0.35 �0.52
Industrial 5.09 10.34 11.50 12.04 6.37 4.64 3.84 3.40
Small business 0.44 0.57 0.53 0.53 0.58 0.33 �0.21 0.03
Table 7
Taiwan: non-performing loans of Domestic Banks by type 1993–2001 (as a percent of total loans)
1993 (%) 1994 (%) 1995 (%) 1996 (%) 1997 (%) 1998 (%) 1999 (%) 2000 (%)
New 1.96 2.27 2.74 3.63 3.74 3.98 5.15 5.47
Old 2.26 2.58 3.75 4.94 4.82 4.80 5.15 5.17
Converted – – – – 2.47 2.43 3.59 6.44
Industrial 0.60 0.67 2.12 3.46 1.82 1.51 1.90 1.55
Small business – – – – 9.37 10.46 7.60 8.91
656 H. Montgomery / Journal of Asian Economics 14 (2003) 645–667
Japanese banks began to decline in 1990 and are now in the negative (Hoshi & Kashyap,
1999). Although non-performing loan levels in Japan never reached the level that they are
now in Taiwan, that is only because of the massive amount of write-offs banks have been
forced to realize in the 1990s. As in Taiwan, the weakness in Japan’s banking sector was
first evident in the smaller financial institutions such as credit cooperatives, which even
now have much higher non-performing loan ratios than the major banks. As in Taiwan, the
problems in the smaller financial institutions were handled by the ‘‘convoy’’ system:
arranged mergers with healthier banks.
The causes of the banking sector problems in Taiwan are also similar to those in Japan.
Japan’s ‘‘bubble economy’’ of the 1980s and its subsequent collapse in the early 1990s, are
well known. As in Taiwan, bank performance in Japan was closely tied to the performance
of the equity and real estate market. And as in Taiwan, Japanese banks were also forced to
adjust to very different business environment due to financial liberalization. Liberalization
of capital markets gave the banks traditional clients—large manufacturing firms—easy
access to direct financing, reducing their reliance on bank loans. Japanese banks turned
increasingly to new clients: small and medium sized firms, particularly those in the
construction, real estate or non-bank finance industries. Although the banking sector itself
was not liberalized in Japan as it was in Taiwan in the 1990s, there is little doubt that due to
capital market liberalization Japan faced ‘‘overbanking’’.
In 1997, the weakness in Japan’s financial sector erupted into a full-blown banking
crisis: among other smaller failures, 1997–1998 witnessed the collapse of one of the top
four securities houses and three of the top 20 banks, all of which had previously been
considered ‘‘too big to fail’’. The next section examines empirically whether this is the
route for which Taiwan is headed.
5. Statistical indicators of a banking crisis
This section uses the threshold indicators approach of Kaminsky and Reinhart (1999) to
identify the likelihood of a banking crisis in Taiwan.
In their original study, Kaminsky and Reinhart (1999) examine 26 banking crises and 76
currency crises that occurred in 20 countries between 1970 and 1995. Four Asian crises of
1997—Indonesia, Malaysia, Philippines and Thailand—were also examined out of sample.
The authors ‘‘examine the behavior of macroeconomic indicators that have been stressed in
the theoretical literature . . . and shed light on the extent to which the crises were
predictable’’.
This paper looks at three countries not included in the Kaminsky and Reinhart (1999)
study: Korea, Japan and Taiwan. Since all three countries have flexible exchange rate
regimes, they are not appropriate case studies for examining the behavior of macro-
economic indicators around the time of currency crises,19 but the theoretical considerations
guiding the selection of variables are still relevant for examining the characteristics of
19 Korea was of course one of the countries affected by the Asian Crisis, but Korea was not included in the 1999
study because the authors chose to examine countries that were ‘‘small open economies, with a fixed exchange
rate, crawling peg, or band through portions of the sample’’.
H. Montgomery / Journal of Asian Economics 14 (2003) 645–667 657
banking crises. Kaminsky and Reinhart (1999) note that banking crises are often preceded
by slowing economic activity, often following a boom, and financial liberalization. Based
upon the analytical analysis above, it is clear that this observation holds for the case of
Japan and Taiwan.
The methodology of the Kaminsky and Reinhart (1999) study is followed as closely as
possible. Following the original study, a banking crisis is identified as ‘‘the closure,
merging, takeover, or large-scale government assistance of an important financial institu-
tion that marks the start of a string of similar outcomes for other financial institutions’’.
Following this criteria, Japan’s banking crisis can be dated as beginning in November 1997
when Hokkaido Takushoku Bank, one of the top 20 banks, failed.
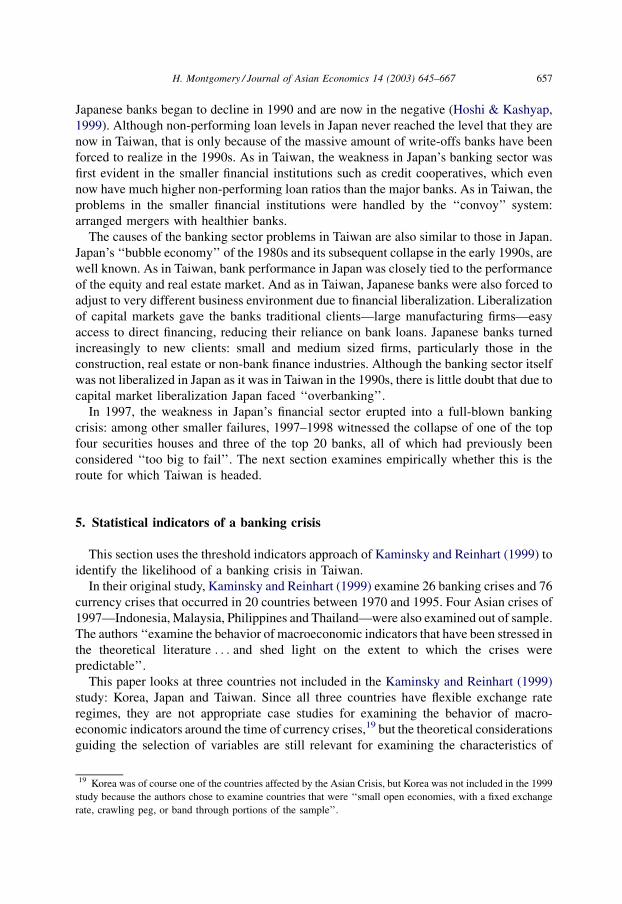
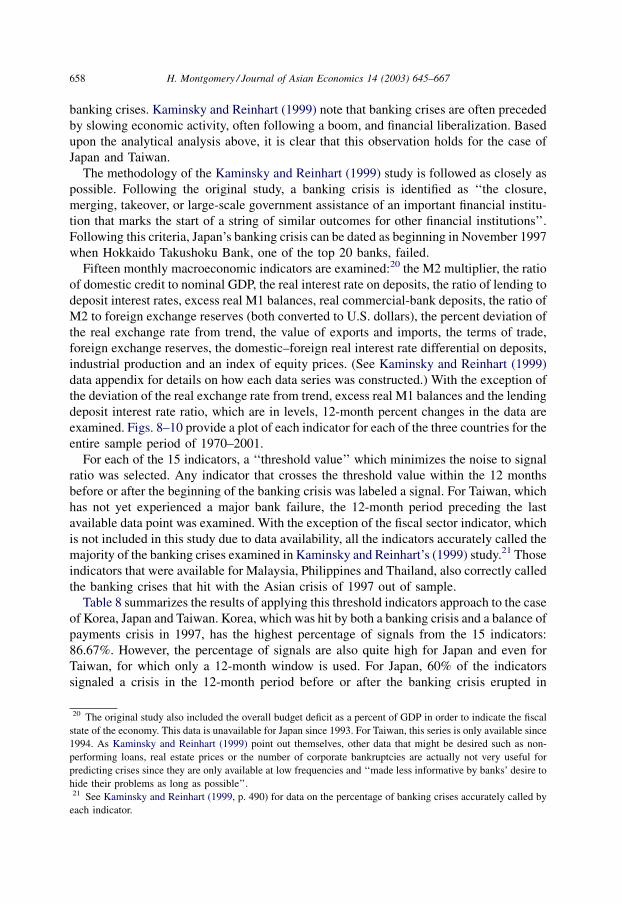
Fifteen monthly macroeconomic indicators are examined:20 the M2 multiplier, the ratio
of domestic credit to nominal GDP, the real interest rate on deposits, the ratio of lending to
deposit interest rates, excess real M1 balances, real commercial-bank deposits, the ratio of
M2 to foreign exchange reserves (both converted to U.S. dollars), the percent deviation of
the real exchange rate from trend, the value of exports and imports, the terms of trade,
foreign exchange reserves, the domestic–foreign real interest rate differential on deposits,
industrial production and an index of equity prices. (See Kaminsky and Reinhart (1999)
data appendix for details on how each data series was constructed.) With the exception of
the deviation of the real exchange rate from trend, excess real M1 balances and the lending
deposit interest rate ratio, which are in levels, 12-month percent changes in the data are
examined. Figs. 8–10 provide a plot of each indicator for each of the three countries for the
entire sample period of 1970–2001.
For each of the 15 indicators, a ‘‘threshold value’’ which minimizes the noise to signal
ratio was selected. Any indicator that crosses the threshold value within the 12 months
before or after the beginning of the banking crisis was labeled a signal. For Taiwan, which
has not yet experienced a major bank failure, the 12-month period preceding the last
available data point was examined. With the exception of the fiscal sector indicator, which
is not included in this study due to data availability, all the indicators accurately called the
majority of the banking crises examined in Kaminsky and Reinhart’s (1999) study.21 Those
indicators that were available for Malaysia, Philippines and Thailand, also correctly called
the banking crises that hit with the Asian crisis of 1997 out of sample.
Table 8 summarizes the results of applying this threshold indicators approach to the case
of Korea, Japan and Taiwan. Korea, which was hit by both a banking crisis and a balance of
payments crisis in 1997, has the highest percentage of signals from the 15 indicators:
86.67%. However, the percentage of signals are also quite high for Japan and even for
Taiwan, for which only a 12-month window is used. For Japan, 60% of the indicators
signaled a crisis in the 12-month period before or after the banking crisis erupted in
20 The original study also included the overall budget deficit as a percent of GDP in order to indicate the fiscal
state of the economy. This data is unavailable for Japan since 1993. For Taiwan, this series is only available since
1994. As Kaminsky and Reinhart (1999) point out themselves, other data that might be desired such as non-
performing loans, real estate prices or the number of corporate bankruptcies are actually not very useful for
predicting crises since they are only available at low frequencies and ‘‘made less informative by banks’ desire to
hide their problems as long as possible’’.21 See Kaminsky and Reinhart (1999, p. 490) for data on the percentage of banking crises accurately called by
each indicator.
658 H. Montgomery / Journal of Asian Economics 14 (2003) 645–667
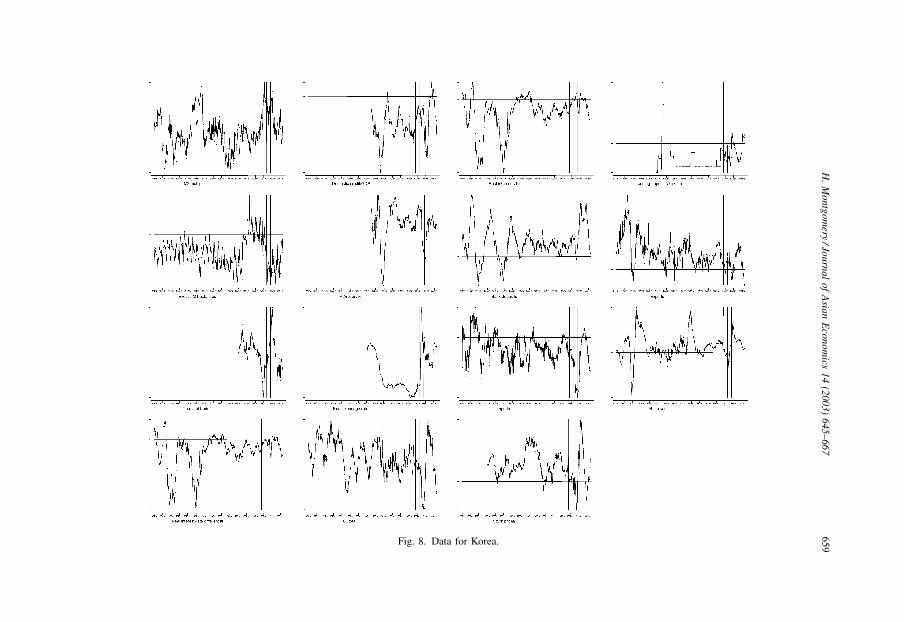
Fig. 8. Data for Korea.
H.
Mo
ntg
om
ery/Jo
urn
al
of
Asia
nE
con
om
ics1
4(2
00
3)
64
5–
66
76
59
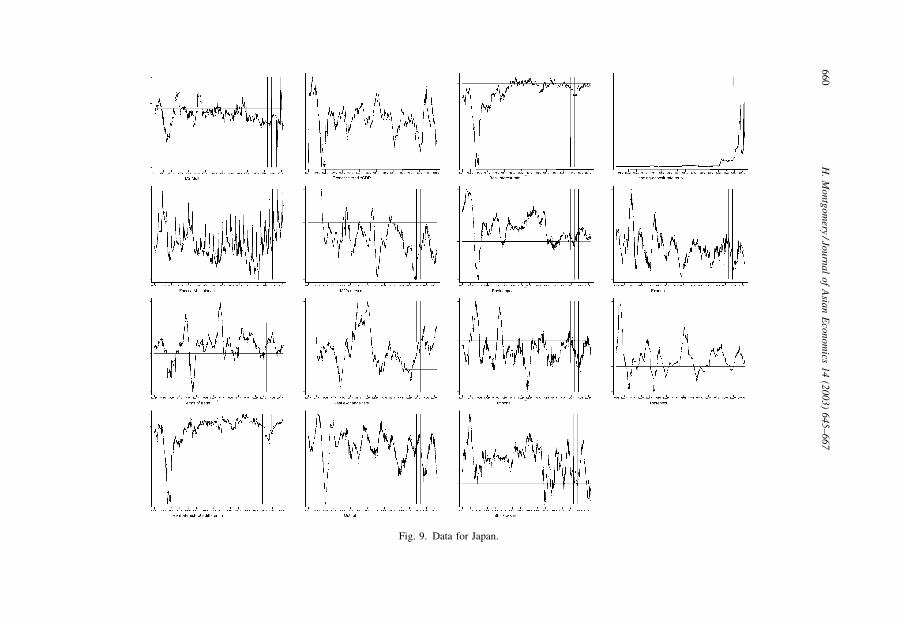
Fig. 9. Data for Japan.
66
0H
.M
on
tgo
mery
/Jou
rna
lo
fA
sian
Eco
no
mics
14
(20
03
)6
45
–6
67
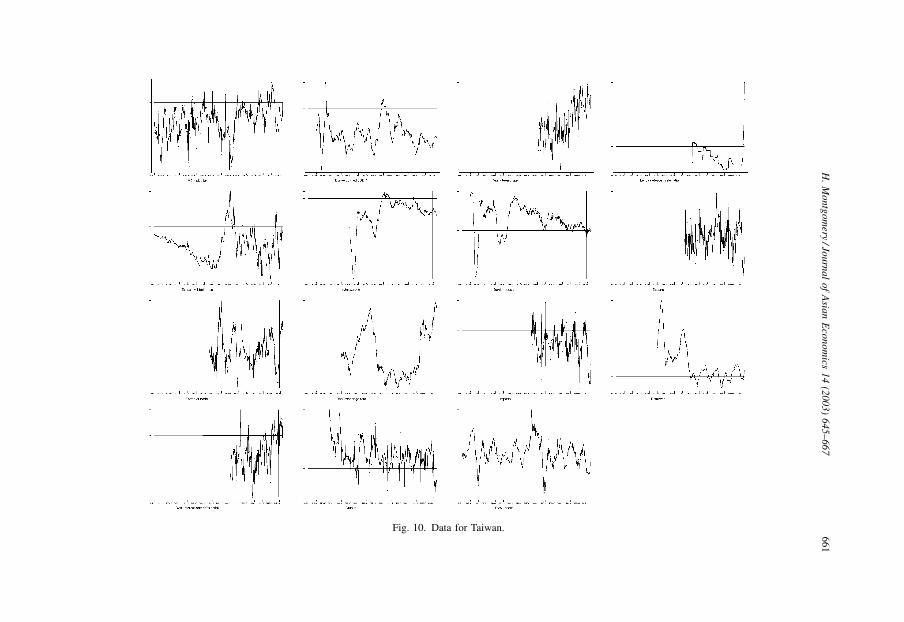
Fig. 10. Data for Taiwan.
H.
Mo
ntg
om
ery/Jo
urn
al
of
Asia
nE
con
om
ics1
4(2
00
3)
64
5–
66
76
61
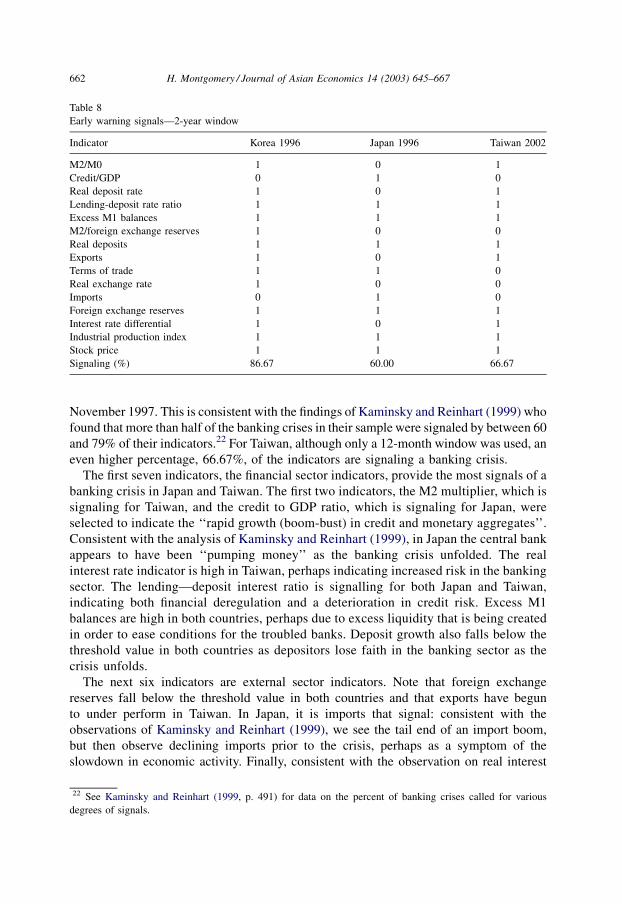
November 1997. This is consistent with the findings of Kaminsky and Reinhart (1999) who
found that more than half of the banking crises in their sample were signaled by between 60
and 79% of their indicators.22 For Taiwan, although only a 12-month window was used, an
even higher percentage, 66.67%, of the indicators are signaling a banking crisis.
The first seven indicators, the financial sector indicators, provide the most signals of a
banking crisis in Japan and Taiwan. The first two indicators, the M2 multiplier, which is
signaling for Taiwan, and the credit to GDP ratio, which is signaling for Japan, were
selected to indicate the ‘‘rapid growth (boom-bust) in credit and monetary aggregates’’.
Consistent with the analysis of Kaminsky and Reinhart (1999), in Japan the central bank
appears to have been ‘‘pumping money’’ as the banking crisis unfolded. The real
interest rate indicator is high in Taiwan, perhaps indicating increased risk in the banking
sector. The lending—deposit interest ratio is signalling for both Japan and Taiwan,
indicating both financial deregulation and a deterioration in credit risk. Excess M1
balances are high in both countries, perhaps due to excess liquidity that is being created
in order to ease conditions for the troubled banks. Deposit growth also falls below the
threshold value in both countries as depositors lose faith in the banking sector as the
crisis unfolds.
The next six indicators are external sector indicators. Note that foreign exchange
reserves fall below the threshold value in both countries and that exports have begun
to under perform in Taiwan. In Japan, it is imports that signal: consistent with the
observations of Kaminsky and Reinhart (1999), we see the tail end of an import boom,
but then observe declining imports prior to the crisis, perhaps as a symptom of the
slowdown in economic activity. Finally, consistent with the observation on real interest
Table 8
Early warning signals—2-year window
Indicator Korea 1996 Japan 1996 Taiwan 2002
M2/M0 1 0 1
Credit/GDP 0 1 0
Real deposit rate 1 0 1
Lending-deposit rate ratio 1 1 1
Excess M1 balances 1 1 1
M2/foreign exchange reserves 1 0 0
Real deposits 1 1 1
Exports 1 0 1
Terms of trade 1 1 0
Real exchange rate 1 0 0
Imports 0 1 0
Foreign exchange reserves 1 1 1
Interest rate differential 1 0 1
Industrial production index 1 1 1
Stock price 1 1 1
Signaling (%) 86.67 60.00 66.67
22 See Kaminsky and Reinhart (1999, p. 491) for data on the percent of banking crises called for various
degrees of signals.
662 H. Montgomery / Journal of Asian Economics 14 (2003) 645–667
rates above, the interest rate differential indicator is above the threshold value for Taiwan,
again, perhaps indicating increased risk.
The final two indicators capture the empirically observed fact that ‘‘recessions and the
burst of asset price bubbles precede financial crises’’. Consistent with the analysis above,
these indicators signal strongly for both Japan and Taiwan. In both economies, we see high
growth rates in industrial production up to a point, but then eventual contraction as the
banking crisis unfolds. Similarly, in both economies stock prices boom up to a point, but
then collapse as the economy moves into recession. Real estate prices were not included in
the Kaminsky and Reinhart (1999) study and are not suitable for inclusion here since they
are not reported monthly and are not available as a time series going back to 1970.
However, Kaminsky and Reinhart (1999) did note in their study that other asset markets,
such as real estate, also show a tendency to ‘‘burst’’ before banking crises, and we can note
from the analysis above that this certainly holds for the case of Japan and Taiwan.
6. Conclusions
The answer to the question posed in the introduction of this paper, ‘‘Is Taiwan headed for
a banking crisis?’’, appears to be in the affirmative. The nature of this crisis will be very
different than the infamous Asian crisis of 1997. Both the symptoms and causes of
Taiwan’s looming banking crisis are much more similar to that which hit the Japanese
banking sector in the Fall of 1997.
This paper has provided both analytic and empirical evidence to support this hypothesis.
First, consider the current state of the financial sector and recent events. Since the mid-
1990s, Taiwan’s banking sector has experienced declining performance and deteriorating
asset quality, much as Japan’s banking sector began to experience in the early 1990s. The
problems are much worse in the smaller financial institutions in Taiwan, and there have
been several banks runs and forced mergers of credit cooperatives with healthier banks.
This again is reminiscent of Japan in the early 1990s. Although Taiwan has yet to
experience a major bank failure, the problems in the banking sector have already claimed
two medium sized banks. The causes of the banking sector problems—the asset bubble in
equity and real estate prices combined with financial liberalization—also echo the
experience of Japan in the late 1980s and early 1990s.
Using the threshold indicators approach of Kaminsky and Reinhart (1999) to quantify
these observed similarities, an empirical analysis of Taiwan’s macroeconomy reveals that
almost 70% of the indicators examined signal the imminent occurrence of a banking crisis.
This percentage is close to that of Korea in late 1996, just before the Asian Crisis of 1997
hit, and is actually higher than that of Japan around the same time period, just before
Japan’s banking crisis erupted in the Fall of 1997.
Early warning models such as the one used in this study do not take into account reactive
government policy, which can of course be quite influential. In the case of Taiwan, the
government has taken several strong measures to improve the health of the banking sector.
In June 2002 a securitization law was passed allowing financial institutions to bundle
financial products including non-performing loans and issue them as new debt offerings. A
financial reform plan was enacted in the Fall of 2002, which among other things
H. Montgomery / Journal of Asian Economics 14 (2003) 645–667 663
encouraged the formation of asset management companies to sell of non-performing
assets, encourage bank mergers and expand Taiwan’s Resolution Trust Company (RTC).
Pushed by government authorities, Taiwan’s banks aggressively wrote off non-performing
loans in fiscal year 2002. All of Taiwan’s state-owned banks are to be privatized and the
government has banned banks that do not meet stringent capital adequacy and non-
performing loan requirements from opening offshore branches.
However, alongside these promising reforms, their have been setbacks as well. Most
recently, the parliament failed to approve a key component of the financial reform plan: an
expansion of the RTC, which now accounts for less than 2% of Taiwan’s GDP. Targets set
for reducing the number of non-performing loans and increasing banks’ capital adequacy
ratios will not be met.
Therefore, whether the steps taken thus far are on balance enough to prevent the looming
crisis remains to be seen. The empirical evidence presented here suggests that unless
authorities in Taiwan go well beyond measures taken in Japan, Taiwan may soon be facing
a banking crisis similar in type and scale to that faced in Japan in 1997–1998.
Acknowledgements
The opinions and conclusions expressed here are those of the author and should not be
attributed to ADB, ADB Institute, its board of directors, or the countries they represent.
While taking responsibility for any remaining errors, the author thanks participants in
presentations at the 2002 APFA/PACAP/FMA Annual Meeting in Tokyo, the Asian Crisis
IV Conference in Taipei and two anonymous referees for constructive comments.
Toshihiro Okada provided superb research assistance.
Appendix A. A list of financial institutions in Taipei, China23
1. Old Banks (15)
Bank of Taiwan24 (Provincial Government)
Export-Import Bank (Government)
Farmers Bank of Taiwan (Government)
Hua Nan Commercial Bank Ltd. (Provincial Government)
International Commercial Bank of China (Provincial Government)
Land Bank of Taiwan (Provincial Government)
Taiwan Co-operative Bank25 (Government)
Bank of Kaosiung (Municipal Government)
Central Trust of China (Government)
Chang Hwa Commercial Bank Ltd. (Provincial Government)
Overseas Chinese Bank (Overseas Chinese and Government)
23 Classifications as well as notes on ownership from Lee (2001).24 Proposed merger between Bank of Taiwan, Land Bank of Taiwan and Central Trust of China.25 Proposed merger between Taiwan Co-operative Bank and Chinfon Bank.
664 H. Montgomery / Journal of Asian Economics 14 (2003) 645–667
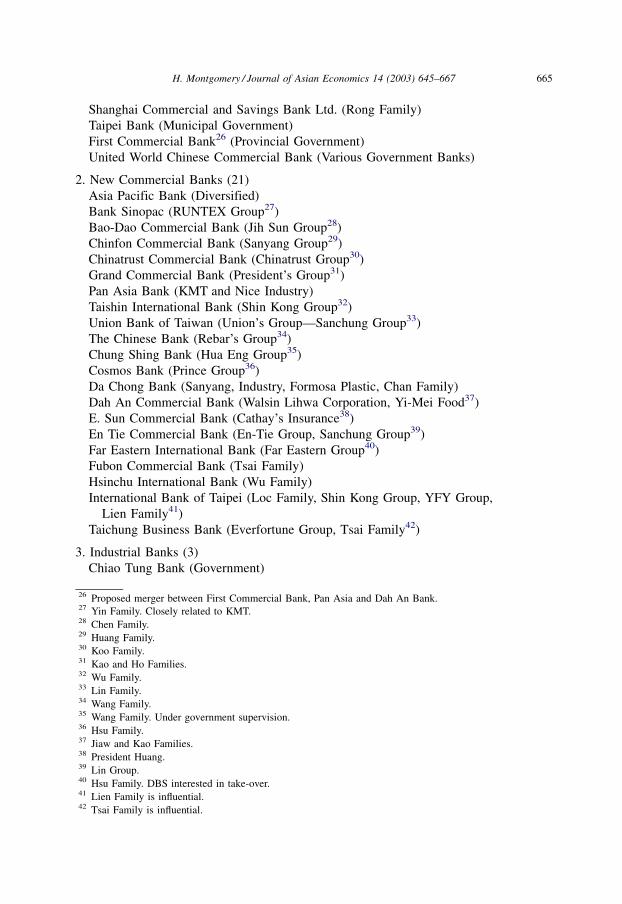
Shanghai Commercial and Savings Bank Ltd. (Rong Family)
Taipei Bank (Municipal Government)
First Commercial Bank26 (Provincial Government)
United World Chinese Commercial Bank (Various Government Banks)
2. New Commercial Banks (21)
Asia Pacific Bank (Diversified)
Bank Sinopac (RUNTEX Group27)
Bao-Dao Commercial Bank (Jih Sun Group28)
Chinfon Commercial Bank (Sanyang Group29)
Chinatrust Commercial Bank (Chinatrust Group30)
Grand Commercial Bank (President’s Group31)
Pan Asia Bank (KMT and Nice Industry)
Taishin International Bank (Shin Kong Group32)
Union Bank of Taiwan (Union’s Group—Sanchung Group33)
The Chinese Bank (Rebar’s Group34)
Chung Shing Bank (Hua Eng Group35)
Cosmos Bank (Prince Group36)
Da Chong Bank (Sanyang, Industry, Formosa Plastic, Chan Family)
Dah An Commercial Bank (Walsin Lihwa Corporation, Yi-Mei Food37)
E. Sun Commercial Bank (Cathay’s Insurance38)
En Tie Commercial Bank (En-Tie Group, Sanchung Group39)
Far Eastern International Bank (Far Eastern Group40)
Fubon Commercial Bank (Tsai Family)
Hsinchu International Bank (Wu Family)
International Bank of Taipei (Loc Family, Shin Kong Group, YFY Group,
Lien Family41)
Taichung Business Bank (Everfortune Group, Tsai Family42)
3. Industrial Banks (3)
Chiao Tung Bank (Government)
26 Proposed merger between First Commercial Bank, Pan Asia and Dah An Bank.27 Yin Family. Closely related to KMT.28 Chen Family.29 Huang Family.30 Koo Family.31 Kao and Ho Families.32 Wu Family.33 Lin Family.34 Wang Family.35 Wang Family. Under government supervision.36 Hsu Family.37 Jiaw and Kao Families.38 President Huang.39 Lin Group.40 Hsu Family. DBS interested in take-over.41 Lien Family is influential.42 Tsai Family is influential.
H. Montgomery / Journal of Asian Economics 14 (2003) 645–667 665
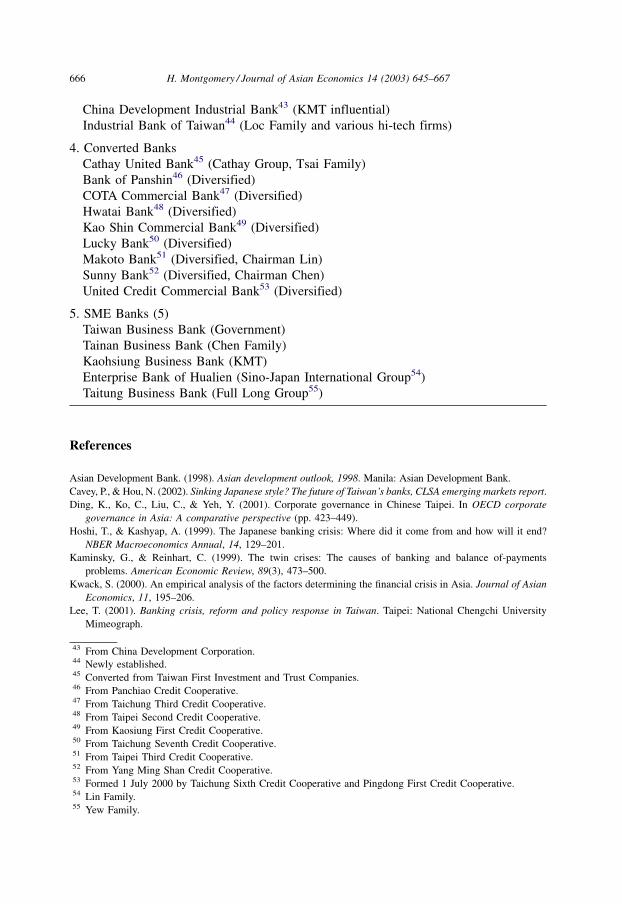
China Development Industrial Bank43 (KMT influential)
Industrial Bank of Taiwan44 (Loc Family and various hi-tech firms)
4. Converted Banks
Cathay United Bank45 (Cathay Group, Tsai Family)
Bank of Panshin46 (Diversified)
COTA Commercial Bank47 (Diversified)
Hwatai Bank48 (Diversified)
Kao Shin Commercial Bank49 (Diversified)
Lucky Bank50 (Diversified)
Makoto Bank51 (Diversified, Chairman Lin)
Sunny Bank52 (Diversified, Chairman Chen)
United Credit Commercial Bank53 (Diversified)
5. SME Banks (5)
Taiwan Business Bank (Government)
Tainan Business Bank (Chen Family)
Kaohsiung Business Bank (KMT)
Enterprise Bank of Hualien (Sino-Japan International Group54)
Taitung Business Bank (Full Long Group55)
References
Asian Development Bank. (1998). Asian development outlook, 1998. Manila: Asian Development Bank.
Cavey, P., & Hou, N. (2002). Sinking Japanese style? The future of Taiwan’s banks, CLSA emerging markets report.
Ding, K., Ko, C., Liu, C., & Yeh, Y. (2001). Corporate governance in Chinese Taipei. In OECD corporate
governance in Asia: A comparative perspective (pp. 423–449).
Hoshi, T., & Kashyap, A. (1999). The Japanese banking crisis: Where did it come from and how will it end?
NBER Macroeconomics Annual, 14, 129–201.
Kaminsky, G., & Reinhart, C. (1999). The twin crises: The causes of banking and balance of-payments
problems. American Economic Review, 89(3), 473–500.
Kwack, S. (2000). An empirical analysis of the factors determining the financial crisis in Asia. Journal of Asian
Economics, 11, 195–206.
Lee, T. (2001). Banking crisis, reform and policy response in Taiwan. Taipei: National Chengchi University
Mimeograph.
43 From China Development Corporation.44 Newly established.45 Converted from Taiwan First Investment and Trust Companies.46 From Panchiao Credit Cooperative.47 From Taichung Third Credit Cooperative.48 From Taipei Second Credit Cooperative.49 From Kaosiung First Credit Cooperative.50 From Taichung Seventh Credit Cooperative.51 From Taipei Third Credit Cooperative.52 From Yang Ming Shan Credit Cooperative.53 Formed 1 July 2000 by Taichung Sixth Credit Cooperative and Pingdong First Credit Cooperative.54 Lin Family.55 Yew Family.
666 H. Montgomery / Journal of Asian Economics 14 (2003) 645–667
Montgomery, H. (2002). Taipei, China’s banking problems: Lessons from the Japanese experience. ADB
Institute Research Paper, No. 42.
Shea, J. (1995). Financial development and policies in Taipei, China. In S. Zahid (Ed.), Financial sector
development in Asia (pp. 81–161). Hong Kong: Oxford University Press for the Asian Development Bank.
Thurbon, E. (2001). Two paths to financial liberalization: South Korea and Taiwan. The Pacific Review, 14(2),
241–267.
Yin, N. (2001). Taiwan financial crisis? Taipei: National Chengchi University Mimeograph.
Yu, T. (1999). The evolution of commercial banking and financial markets in Taiwan. Journal of Asian
Economics, 10, 291–307.
Yu, H. (2000). Banks’ capital structure and the liquid assets: Policy implication of Taiwan. Pacific Economic
Review, 5(1), 109–114.
H. Montgomery / Journal of Asian Economics 14 (2003) 645–667 667