taita taveta county 2020 long rains food and …
TRANSCRIPT

TAITA TAVETA COUNTY
2020 LONG RAINS FOOD AND NUTRITION SECURITY ASSESSMENT REPORT
A Joint Report by the Kenya Food Security Steering Group (KFSSG)1 and
Taita Taveta County Steering Group (CSG)
July, 2020
1 Beatrice Tuei (State Department of Livestock)) and Emmanuel Ashitiva (National Drought Management
Authority)

Page 2 of 30
EXECUTIVE SUMMARY
The long rains food security assessment was carried out in the county through the support of Kenya
Food Security Steering Group (KFSSG) in conjunction with the Taita Taveta county steering group
(CSG). The assessment is bi-annual and mainly covers the Mixed Farming: Food Crops and
Livestock, Mixed Farming: Horticulture and Dairy and Mixed Farming: Irrigated Crop and
Livestock livelihood zones. The overall objective of the assessment was to develop an objective,
evidence-based and transparent food security situation analysis following the long rains (March-
April-May) season of 2020 taking into account the cumulative effect of the previous seasons; as
well as provide recommendations for possible response options based on the situation analysis
upon building consensus. The specific objective was to review existing data on the current situation
analysis as provided by the sectors and determine the food security trends from previous seasons.
The situation analysis was done using quantitative and qualitative methods. Current factors affecting
food security include good rainfall performance which supported crops to full maturity,
regeneration and growth of good quality pasture and browse and recharged water facilities to 100
percent. Livestock body condition was good in all livelihood zones. Food crops and milk were
available at the household level. The other factors affecting food security were COVID-19
pandemic, which impacted negatively on all sectors, for instance, the County’s predominant
market for livestock and farm produce is Mombasa County which was put under a travel ban by
the Ministry of Health to curb the spread of COVID-19. Rainfall performance was above normal
resulting in increased crop yields hence enhanced availability of food at the household level, stocks
held by traders which stabilized market food prices. Availability of high-quality forages and water
increased livestock productivity resulted in good body condition and improved milk production
and availability at the household level. The situation improved the nutrition status of the under-
fives. Domestic water consumption was 15-40 litres per person per day and normal in all the
livelihood zones. Market operations were not normal due to by the Ministry of Health mitigating
measures put in place to curb the spread of COVID-19. The County’s predominant market for farm
products is Kongowea in Mombasa County which was put under the travel ban. The terms of trade
(ToT) recorded in January 2020 were favourable for all the livelihood zones and above the long
term average by 12 percent. All households remained in the acceptable (100%) food consumption
score (FCS) due to the availability and accessibility of food at the household level. Sampled
households indicated that 84 percent were still holding food stocks from the previous season.
Compared to a similar period in 2019 when 83 and 17 percent posted acceptable and borderline
FCS respectively. The average milk consumption per household per day remained stable at 1.2
litres as posted in the previous month and below the long term mean by eight percent. There were
no consumption-based coping strategies (rCSI) employed from households interviewed in the
month under review since households relied on previous season harvests (84 percent HHs holding
stocks) and prices were lower. Cases of URTI and diarrhoea decreased from March by 50 percent
compared with last year same season due to high levels of hygiene and sanitation. The proportion
of fully immunized children (FIC) between January and June 2020 increased to 91 percent
compared to 77 percent posted in a similar period in 2019. Vitamin A supplementation surpassed
the national target of 80 percent for the FIC. There were no cases of children at risk of malnutrition
compared to 0.2 percent posted in June 2019. Supplementary Feeding Program (SFP) and
Outpatient Therapeutic Program (OTP) admission dropped by 29.3 percent and eight percent
respectively. The county is classified under Minimal (IPC Phase I) food security phase
classification, implying 80 percent of the households can meet their food needs without employing
severe coping strategies.

Page 3 of 30
TABLE OF CONTENTS
EXECUTIVE SUMMARY .........................................................................................................2
1.1 County background ............................................................................................................5
1.2 Methodology and approach ................................................................................................5
2.0 DRIVERS OF FOOD AND NUTRITION SECURITY IN THE COUNTY ...........................6
2.1 Rainfall Performance .........................................................................................................6
2.2 COVID 19 Pandemic .........................................................................................................6
2.3 Other shocks and hazards ...................................................................................................7
3.0 IMPACTS OF DRIVERS ON FOOD AND NUTRITION SECURITY .................................7
3.1 Availability ...........................................................................................................................7
3.1.1Crops Production ..........................................................................................................7
3.1.2Cereals stock-Maize .....................................................................................................8
3.1.3 Livestock Production ...................................................................................................9
3.1.4 Impact on availability ................................................................................................ 11
3.2 Access ............................................................................................................................. 12
3.2.1 Market operations ...................................................................................................... 12
3.2.2 Terms of trade ........................................................................................................... 13
3.2.3 Income sources .......................................................................................................... 14
3.2.4 Water access and availability ........................................................................................ 14
3.2.5 Food Consumption .................................................................................................... 15
3.2.6 Coping strategy ......................................................................................................... 16
3.3 Utilization ........................................................................................................................ 16
3.3.1Morbidity and mortality patterns ................................................................................ 16
3.3.2 Immunization and Vitamin A supplementation .......................................................... 17
3.3.3 Nutritional status and dietary diversity....................................................................... 17
3.3.4 Health and Nutrition Sector in COVID-19 ................................................................. 17
3.3.5 Public interventions, risk communication and community-level actions ..................... 18
3.3.6 Coordination and leadership in COVID-19 pandemic preparedness and response ...... 19
3.3.7 Sanitation and Hygiene .............................................................................................. 19

Page 4 of 30
3.4 Trends of key food security indicators.............................................................................. 20
3.5 Education......................................................................................................................... 20
3.5.1 Enrolment ................................................................................................................. 20
3.5.2 Effects of Long rains on schools ................................................................................ 20
3.5.3 School Feeding ............................................................................................................. 21
3.5.4 Inter Sectoral links where available ........................................................................... 21
4.0 Food Security Prognosis ...................................................................................................... 22
4.1 Prognosis Assumptions .................................................................................................... 22
4.2 Food security Outlook for the next 6 months .................................................................... 22
4.2.1 Food security Outcome (August, September, October) .............................................. 22
4.2.2 Food security Outlook (November, December, January) ............................................ 22
5.0 CONCLUSION AND INTERVENTIONS ......................................................................... 23
5.1 Conclusion ....................................................................................................................... 23
5.1.1 Phase classification.................................................................................................... 23
5.1.2 Summary of Findings ................................................................................................ 23
5.1.3 Sub-county ranking ................................................................................................... 23
5.2 Ongoing Interventions ..................................................................................................... 24
5.2.1 Non Food Interventions ............................................................................................. 24
5.3 Recommended Interventions ............................................................................................ 26

Page 5 of 30
1.0 INTRODUCTION
1.1 County background
Taita Taveta County covers an approximate
area of 17,128.3 km2 consisting of 62 percent
Tsavo East and Tsavo West National Park,
24 percent rangeland and 12 percent land
suitable for rain fed agriculture.
Administratively, the county is divided into
four Sub-counties namely; Taita, Voi,
Mwatate and Taveta. The county has a
population of 340,674 persons according to
the Kenya National Bureau of Statistics
(KNBS, 2019) census and is divided into
three major livelihood zones namely; Mixed
Farming: Food Crops and Livestock (34 percent), Mixed Farming: Horticulture and Dairy (21
percent), Mixed Farming: Irrigated Crop and Livestock (11 percent), others (34 percent) as shown
in Figure 1.
1.2 Methodology and approach
Quantitative and qualitative methods were used during the assessment. Primary data was obtained
from sector checklists, key informant interviews and field observations. Secondary data was
obtained from the National Drought Management Authority (NDMA) Early Warning System
database, drought monthly bulletins, Kenya Meteorological Department (KMD) rainfall data and
satellite data for rainfall. The assessment methodology employed included an initial County status
briefing which was conducted on Monday 20th July 2020, presentation of sectoral checklists from
agriculture, livestock, and water, education, health and nutrition sectors. In an attempt to have a
quick assessment of field situation as well as ground truth the performance of the season, transect
drives were organized and conducted for 2 days by two teams that were grouped thus: Team one
visited the Wundanyi (highlands), Mghambonyi, Paranga, Kishushe and Voi (Lowlands of Taita
sub count; while Team two visited Kungu, Mwatate, Buguta and Marungu in Mwatate and Voi
sub-counties and Taveta Sub-county; sampled al the county livelihood zones. During the transect
drives, the teams collected sector-wide food security data using, community and household
interviews, key informant interviews and visited selected markets to observe their operations and
prices of key food commodities. The review and analysis of primary and secondary data were
analyzed by Sub-County and livelihood zones. The pair-wise ranking was also used to group the
sub-counties according to their levels of need in terms of food and non-food assistance.
Quantitative and qualitative methods were used during the assessment. Secondary data was
obtained from the National Drought Management Authority (NDMA) Early Warning System
database, drought monthly bulletins, Kenya Meteorological Department (KMD) rainfall data and
satellite data for rainfall. Further analysis was conducted using the integrated food security Phase
Classification (IPC). The specific objective was to review existing data on the current situation
analysis as provided by the sectors and determine the food security trends from previous seasons.
A mission’s findings draft report on the current County food security situation was compiled on
day four in readiness for dissemination during the final de-briefing in the County steering group
(CSG) meeting on the Friday 25th of July 2020. Deliberations during the final CSG informed the
development of the County Food Security report for Long Rains Assessment of 2020.

Page 6 of 30
2.0 DRIVERS OF FOOD AND NUTRITION SECURITY IN THE COUNTY
2.1 Rainfall Performance
The county experiences bimodal rainfall patterns,
characterized by two seasons of long and short
rains. The long rains are the most significant to the
county. According to the Meteorology Department
based at Voi town, Taita Taveta County received 95
percent of total expected long rains precipitation.
The county experienced off-season rains in January
and February that extended into March. The onset
of the long rains in the county was early during the
first week of March instead of the normal third
week. Total rainfall amounts ranged from 141 to
200 percent of the long term average except in parts
of Taita Sub County where it ranged from 126 – 140
percent of normal as shown in Figure 2. The rains
were characterized by good temporal distribution
and even spatial distribution across all livelihood zones. Cessation was normal in the third week
of May 2020.
2.2 COVID 19 Pandemic
The COVID-19 pandemic impacted negatively on all sectors, for instance, the County’s
predominant market for both livestock and farm products is Mombasa County which was put under
a travel ban by the Ministry of Health to curb the spread of COVID-19. Although transportation
of food was an essential service closure of main markets like Taveta and Voi forced buyers to incur
unprecedented overhead costs in getting these products from the farmers. Closure of markets also
resulted in small scale herders being unable to sell their animals and middlemen have taken
advantage of the situation and are purchasing live animals at lower prices and this ultimately led
to decrease in livestock prices in the long run. Large scale poultry farmers were forced to shut
down due to high cost of production after the closure of eateries, restaurants and tourism hotels in
the county. Service delivery was also disrupted (e.g. agricultural extension services) especially due
to suspension of mass vaccination activities that increase chances of livestock epidemics that cause
major livestock losses. Provision of handwashing stations at all key public places (markets, entry
points, bus parks and offices) and ensured that there was a continuous supply of water either
through piping or water trucking. On the contrary COVID-19 pandemic era resulted in the
improved provision of service delivery in the water and health sectors since new water facilities
have been developed, health facilities equipped and high expectation of schools expansion and
also the public adaptation of high standards of hygiene reduced body contact that is expected to
reduce cases of infectious diseases.
Figure 1:Performance of Long rains

Page 7 of 30
2.3 Other shocks and hazards
2.3.1 Fall Army Worms
Fall Army Worms (FAW) infestation was reported in all livelihoods zones but due to the
sensitization barazas and on-farm demonstrations, the pest was successfully managed.
3.0 IMPACTS OF DRIVERS ON FOOD AND NUTRITION SECURITY
3.1 Availability
Food availability in Taita Taveta County is related to crop and livestock production across all
livelihood zones. Key considerations under crop production include the number of hectares put
under rain-fed or irrigated cropping as well as the total yield for the season. In livestock production,
livestock ownership, milk availability, forage and body conditions. The pillar thus takes in to
account the available food stocks at the household level and supply of food commodities in the
market.
3.1.1 Crops Production
Crop production contributes 5, 13 and 10 percent to mixed farming, crops and livestock; mixed
farming, horticulture and dairy and mixed farming, irrigated crops and livestock to income for
food respectively. The county is depended on the long rains season as the main cropping season in
Taveta Sub County (Mixed farming/Irrigation/livestock and food crop livelihood zone) while the
short rains are the most significant season in Mwatate, Taita and Voi sub-counties.
a. Rain-fed cropping
Maize, beans and green grams are the major crops grown. The area under maize, beans and green
grams slightly increased by 5, 1 and 3.4 percent compared with the LTA respectively. The
increment in area was attributed to the intensified provision of timely weather information and
agricultural advisories about a normal to above normal rainfall season, farmers heeding the advice
to grow crops that could withstand such weather condition and the concomitant good performance
of the rains. The crop yield improved by 16, 2, and 4 percent of LTA for maize, beans and green
grams respectively (Table 1). The increment was attributed to the above-normal rainfall of good
distribution in terms of space and time, resulting in enhanced crop yields. Thus improved the
household food availability and access and hence impacting positively on food consumption for
all the livelihood zones. Table 1: Rainfed Crop Production
Crop Area planted
during 2020
Long Rains
season
(Ha)
Long Term
Average
area planted
during the Long
Rains season
(Ha)
Long Rains season
production 2020
(90 kg bags)
Projected/Actual
Long Term
Average
production
during the Long
Rains season
(90 kg bags)
1.Maize 6,385 6080
24604
21280
2.Beans 1501 1490 7600
7450
3.Green grams 1070 1034 9120
8790
Page 8 of 30
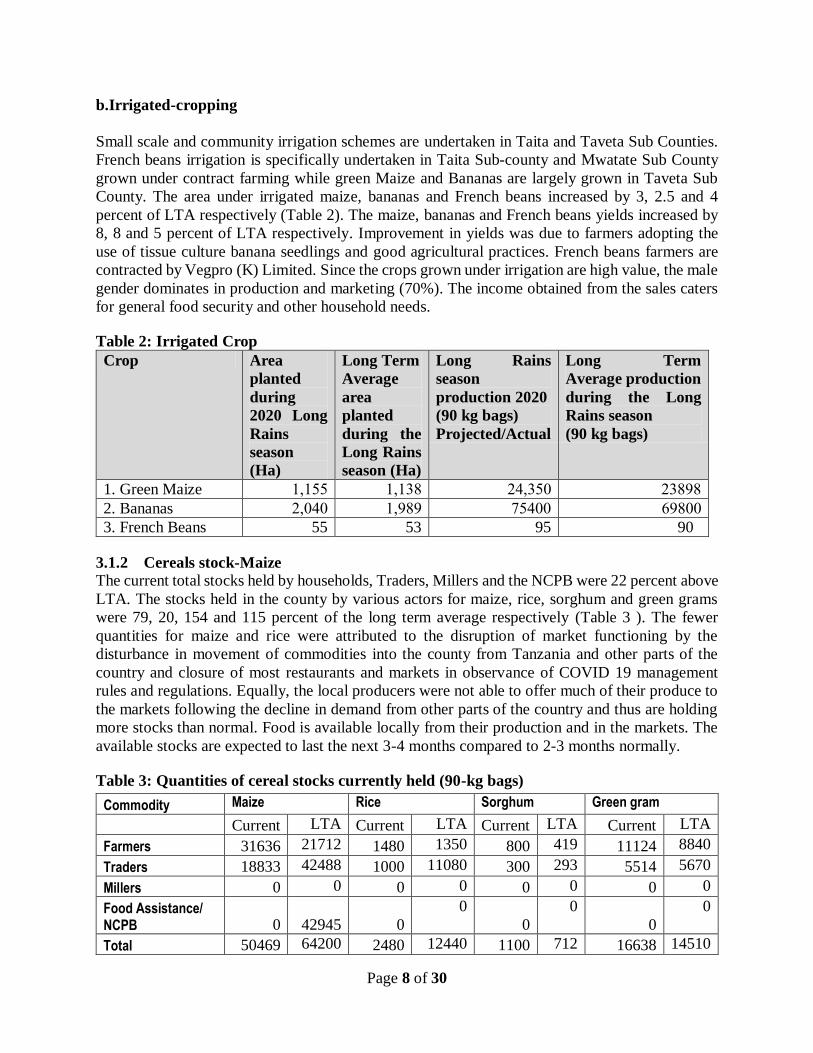
b.Irrigated-cropping
Small scale and community irrigation schemes are undertaken in Taita and Taveta Sub Counties.
French beans irrigation is specifically undertaken in Taita Sub-county and Mwatate Sub County
grown under contract farming while green Maize and Bananas are largely grown in Taveta Sub
County. The area under irrigated maize, bananas and French beans increased by 3, 2.5 and 4
percent of LTA respectively (Table 2). The maize, bananas and French beans yields increased by
8, 8 and 5 percent of LTA respectively. Improvement in yields was due to farmers adopting the
use of tissue culture banana seedlings and good agricultural practices. French beans farmers are
contracted by Vegpro (K) Limited. Since the crops grown under irrigation are high value, the male
gender dominates in production and marketing (70%). The income obtained from the sales caters
for general food security and other household needs.
Table 2: Irrigated Crop
Crop Area
planted
during
2020 Long
Rains
season
(Ha)
Long Term
Average
area
planted
during the
Long Rains
season (Ha)
Long Rains
season
production 2020
(90 kg bags)
Projected/Actual
Long Term
Average production
during the Long
Rains season
(90 kg bags)
1. Green Maize 1,155 1,138 24,350 23898
2. Bananas 2,040 1,989 75400 69800
3. French Beans 55 53 95 90
3.1.2 Cereals stock-Maize
The current total stocks held by households, Traders, Millers and the NCPB were 22 percent above
LTA. The stocks held in the county by various actors for maize, rice, sorghum and green grams
were 79, 20, 154 and 115 percent of the long term average respectively (Table 3 ). The fewer
quantities for maize and rice were attributed to the disruption of market functioning by the
disturbance in movement of commodities into the county from Tanzania and other parts of the
country and closure of most restaurants and markets in observance of COVID 19 management
rules and regulations. Equally, the local producers were not able to offer much of their produce to
the markets following the decline in demand from other parts of the country and thus are holding
more stocks than normal. Food is available locally from their production and in the markets. The
available stocks are expected to last the next 3-4 months compared to 2-3 months normally.
Table 3: Quantities of cereal stocks currently held (90-kg bags)
Commodity Maize Rice Sorghum Green gram
Current LTA Current LTA Current LTA Current LTA
Farmers 31636 21712 1480 1350 800 419 11124 8840
Traders 18833 42488 1000 11080 300 293 5514 5670
Millers 0 0 0 0 0 0 0 0
Food Assistance/ NCPB 0
42945 0
0
0
0
0
0
Total 50469 64200 2480 12440 1100 712 16638 14510

Page 9 of 30
3.1.3 Livestock Production
The main livestock kept in the county include; exotic beef cattle, dairy cattle, indigenous cattle,
goats, sheep and poultry and contribute 33 percent to cash incomes in mixed farming (food crops
and livestock livelihood zone and 20 percent in the mixed farming (horticulture and dairy) and
mixed farming (irrigation and livestock) livelihood zones. Goats account for 30 and 25 percent of
cash incomes in the mixed farming (food crops/ livestock and mixed farming (irrigation/ livestock)
livelihood zones respectively. The sector was impacted positively by the season following the
above rainfall that resulted in enhanced regeneration and growth of pasture and browses.
Availability of high-quality forages increased livestock productivity resulting in good body
condition and improved milk production and availability at the household level.
Pasture and browse situation
Pastures and browse condition was good across all livelihood zones which is normal for the season
as shown in table 4. The rains experienced in the county were sufficient to nature forage to maturity
and the available quantities are expected to last up to the next season in October. Pasture and
browse were accessible across the county and the available quantities will be supplemented by
crop residues form the ongoing harvest.
Table 4: Pasture and Browse Condition
Pasture Browse
Livelihoo
d zone
Condition How long to last
(Months)
Factors
Limitin
g
access
Condition How long to last
(Months)
Factors
Limitin
g
access
Curre
nt
Norm
al
Curre
nt
Norm
al
Curre
nt
Norm
al
Curre
nt
Norm
al
Mixed
Farming:
Food Crop/
Livestock
Good Good 3 3 None Good Good 3 3 None
MF:
Horticultur
e/ Dairy
Good Good 3 3 None Good Good 3 3 None
MF:
Irrigated/
Livestock
Good Good 2 2 None Good Good 2 3 None
Livestock Productivity
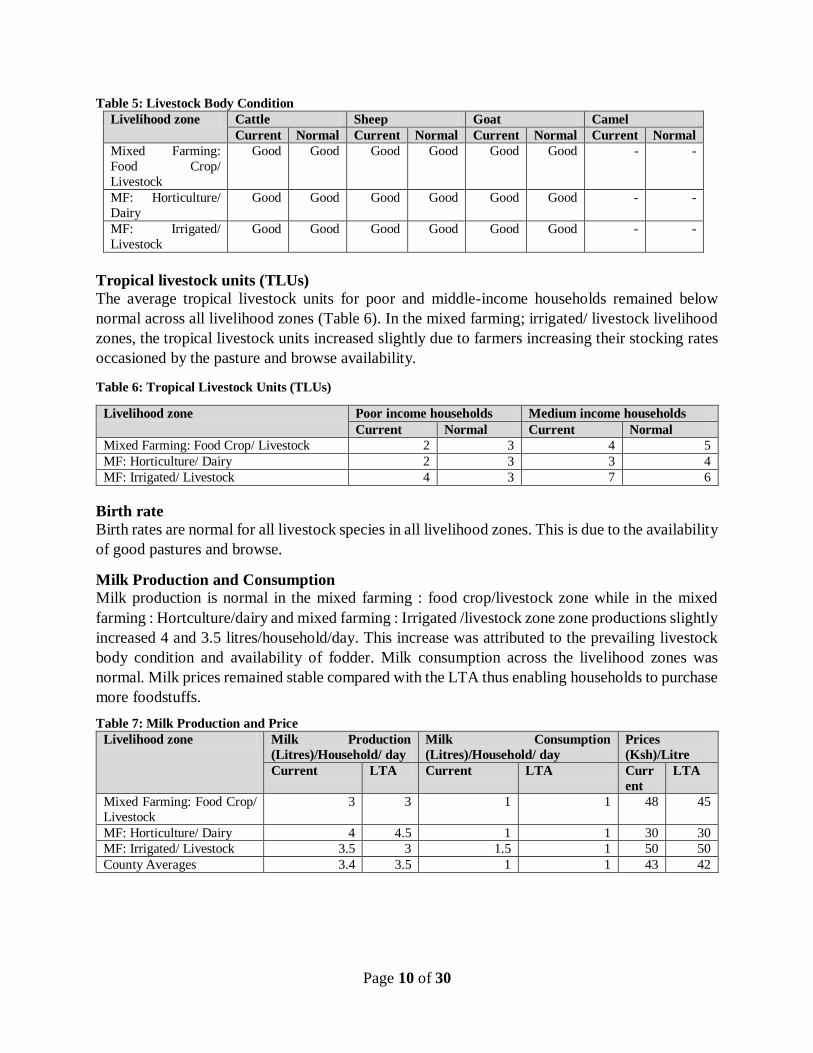
Livestock body condition
Livestock body condition was good across all the livelihood zones due to the availability of
pastures and browse as shown in table 5. The body condition for all livestock species in all
livelihood zones is projected to remain good for the next two to three months due to availability
of forages and water at shorter distances. It is expected that the improved body conditions will lead
to increased milk production improving food security situation. The good livestock body condition
is expected to enable farmers to sell livestock at good prices and hence purchase more foodstuffs
thus improving food security household at the household level.
Page 10 of 30
Table 5: Livestock Body Condition
Livelihood zone Cattle Sheep Goat Camel
Current Normal Current Normal Current Normal Current Normal
Mixed Farming:
Food Crop/
Livestock
Good Good Good Good Good Good - -
MF: Horticulture/
Dairy
Good Good Good Good Good Good - -
MF: Irrigated/
Livestock
Good Good Good Good Good Good - -
Tropical livestock units (TLUs)
The average tropical livestock units for poor and middle-income households remained below
normal across all livelihood zones (Table 6). In the mixed farming; irrigated/ livestock livelihood
zones, the tropical livestock units increased slightly due to farmers increasing their stocking rates
occasioned by the pasture and browse availability.
Table 6: Tropical Livestock Units (TLUs)
Livelihood zone Poor income households Medium income households
Current Normal Current Normal
Mixed Farming: Food Crop/ Livestock 2 3 4 5
MF: Horticulture/ Dairy 2 3 3 4
MF: Irrigated/ Livestock 4 3 7 6
Birth rate
Birth rates are normal for all livestock species in all livelihood zones. This is due to the availability
of good pastures and browse.
Milk Production and Consumption
Milk production is normal in the mixed farming : food crop/livestock zone while in the mixed
farming : Hortculture/dairy and mixed farming : Irrigated /livestock zone zone productions slightly
increased 4 and 3.5 litres/household/day. This increase was attributed to the prevailing livestock
body condition and availability of fodder. Milk consumption across the livelihood zones was
normal. Milk prices remained stable compared with the LTA thus enabling households to purchase
more foodstuffs.
Table 7: Milk Production and Price
Livelihood zone Milk Production
(Litres)/Household/ day
Milk Consumption
(Litres)/Household/ day
Prices
(Ksh)/Litre
Current LTA Current LTA Curr
ent
LTA
Mixed Farming: Food Crop/
Livestock
3 3 1 1 48 45
MF: Horticulture/ Dairy 4 4.5 1 1 30 30
MF: Irrigated/ Livestock 3.5 3 1.5 1 50 50
County Averages 3.4 3.5 1 1 43 42

Page 11 of 30
Livestock Migration There were no cases of in or out-migration that were reported which is normal at this time of the
year.
Livestock Diseases and Mortalities
Cases of photosensitivity were reported in the mixed farming: food crop/livestock livelihood zone
farmers , of that had affected cattle mainly in areas of Mwachabo location, Mwatate Sub County.
Water for Livestock
The main water sources for livestock include; boreholes, farm ponds, earth dam, piped water
systems, shallow wells, streams, river beds and drainage canals. The average livestock trekking
return distances from grazing areas to main water sources are normal and ranged from one
kilometre in Mixed Farming( Horticulture /dairy) livelihood zone to 2-3 km in mixed farming
(food crop &livestock) livelihood zone. Watering frequency remained normal with the livestock
being watered at least once per day across all livelihood zones. The available water sources are
expected to cater for livestock for the next 2 – 3 months as shown in table 9.
Livelihood
zone
Return average
distances (km)
Expected duration to
last (months)
Watering frequency
Current Normal Current Normal Current Normal
MF: Food Crop/
Livestock
2 – 3 2 – 3 3 3 7 7
MF:
Horticulture/
Dairy
1 1 3 3 7 7
MF: Irrigated/
Livestock
1 1 3 3 7 7
3.1.4 Impact on availability
Following the good performance of the rains in the current season, cropping under rain-fed and
irrigated cropping expanded in acreage and increased in yields hence increased availability of food
at the household level, stocks held by thus stabilizing market food prices. The sector was impacted
positively by the season following the above rainfall that resulted in enhanced regeneration and
growth of pasture and browses. Availability of high-quality forages increased livestock
productivity resulting in good body condition and hence increased milk production and availability
at the household level.

Page 12 of 30
3.2 Access
3.2.1 Market operations
Market operations were disrupted when the Ministry of Health put in place measures to decongest
markets and curb the spread of COVID-19. The County’s predominant market for most farm
products is Kongowea market in Mombasa County which was put under a travel ban and although
the transportation of food was an essential service closure of main markets like Taveta and Voi
forced buyers to incur unprecedented overhead costs in getting these products from the farmers.
The volumes of livestock traded across all livelihood zones are expected to decrease due to reduced
demand for livestock that will lead to a fall in prices. Market supply sources for livestock were
mainly individual farmers, ranchers and private farms. Types of buyers for the different livestock
species produce and products were mainly butchers, livestock traders and individual farmers.
Covid-19 has led to the closure of markets as a mitigating measure against its spread. With the
limited access to markets and slaughterhouses or processing plants, farmers were left with no
choice but to keep their stocks and livestock products longer accruing high production costs.
Market Prices
Maize price
The price of a kilogram of maize in march
2020 declined from Kshs 40 to 36 July 2020
The current price is eight percent below the
LTA as indicated in Figure 3. Prices below
long term average are due to harvests
experienced during the short rains of 2019
together with the current season harvest that
is ongoing. Price variations were observed
across the markets with Taveta town in the
Mixed Farming: irrigated cropping/ livestock
zone reporting Ksh. 30 per kilogram.
Markets in both Mixed Farming; food crops/
livestock and Mixed Farming: Horticulture
and Dairy zones markets in Ghazi, Ndome,
Rukanga, Mwatate and Kishamba recorded
Ksh. 38 per kilogram. These prices are likely to increase in the next 3 months as Maize stock are
expected to go down cousing shortage.

Page 13 of 30
Goat price
The average price of goats deccreased from
Kshs 4,700 in March 2020 to Kshs Kshs
4,500 posted in July 2020 and above the long
term average (LTA) by six percent as shown
in Figure 4. The increase in price was due to
shortage in supply after the closure of
livestock markets and economic effects
emanating from movement restriction
measures put in place to curb the spread of
COVID-19. The highest prices were reported
in the mixed farming: horticulture/ dairy
livelihood zone of Kshs 5,300 where farmers
keep a few animals for special events while
lower prices of Kshs 4,600 and Kshs 4,300
were reported in mixed farming: food crop/ livestock livelihood zone and mixed farming:
irrigated/livestock livelihood zone. Owing to the availability of food commodities and the
prevailing good body conditions, the price is expected to remain stable and favourable.
3.2.2 Terms of trade
The terms of trade (ToT) recorded in
March, April and May 2020 were
favourable and above the long term
average by 15 percent compared to the
current 126kg recorded in the month of
July. The current price are 14 percent
above the long term average as shown in
Figure 5. With the sale of a goat, one could
purchase 128.2 kilograms of maize in the
Mixed farming: horticulture/ dairy
livelihood zone and Mixed Farming: food
crops/livestock livelihood zones, a
household would purchase 178 and 118
Kgs of maize with the sale of a goat
respectively. However, households in
Mixed Farming: irrigated cropping/livestock livelihood zone could purchase 114 Kgs of maize
with the sale of a goat. Favourable ToT will prevail due to anticipated harvests of maize that will
result to drop in maize prices against prevailing good body condition for goats and resumption of
interrupted livestock markets due to ongoing interventions put in by the veterinary department.

Page 14 of 30
3.2.3 Income sources
The main source of households’ income in
January 2020 was casual labour as shown in
Figure 6. Other main sources in order of
priority were the sale of crops, employment,
trade and sale of livestock products. Sale of
livestock products and crops were on an
upward trend compared to previous months.
Casual labour opportunities were available in
the sisal and banana plantations, irrigation
schemes, mining sector, herding, ranches,
building sites, bush clearing on road reserves
and town centres.
3.2.4 Water access and availability
Major water sources
The major sources of water for domestic use
in the county were piped water system,
rivers, springs and boreholes and were
depended upon by 40, 23, 21 and 9 percent
of the population respectively (Figure 7).
Other sources included shallow wells, pans
and dams. The enhanced short rains and off-
season rains in January and February 2020
have fully recharged water sources. The
main water sources in all livelihood zones
are expected to last for the next three to four
months. Water sources remained the same to
those used normally at this time of the year in exception of those harvesting roof water at household
level which is not normal at this time since it’s usually last for a short duration during the dry
period. Currently, there are forty-seven operational boreholes and thirteen that are non-operational
due to breakdown of pumping systems, low recharge and poor water quality. During field visits,
no high concentration of human at water points was observed in areas of Kishushe, Mlilo,
Kamtonga, Godoma and Kwa Mnengwa as usual due to recharge of the surrounding open water
sources and piped water developments undertaken by the County Government of Taita/Taveta in
collaboration with different stakeholders.
Distance to water sources
The average return distance was two kilometres and below the long term average by 31 percent.
In the mixed farming: food crop/livestock zone recorded three kilometres while in the mixed
farming: irrigation/livestock zones and mixed farming: horticulture/dairy zone distances were
below one kilometre which was normal
Figure 6: Income sources in Taita Taveta County
Figure 7: Sources of water

Page 15 of 30
Waiting time at the source
The average waiting time is 20 minutes, within normal ranges. There were no cases of
concentration in most of the visited water collection points because some new water facilities were
contracted and operational i.e. Dighai, Manoa and Iriwenyi boreholes
Cost of water
The cost of water per 20 litres Jerry can was normal and ranged between Ksh. 2-5 across all
livelihood zones at the water sources.
Water consumption
Water consumption was 15-40 litres per person per day and normal at this time of the year in all
the livelihood zones. This was attributed to the operationalization of the aforementioned newly
constructed water facilities.
3.2.5 Food Consumption
All households remained in the
acceptable food consumption score
(FCS) (Figure 8) due to the
availability and accessibility of food
at the household level. Sampled
households indicated that 84 percent
were still holding food stocks from
the previous season. Compared to a
similar period in 2019 where
prevalence was at 83 and 17 percent
for acceptable and borderline FCS
respectively, household consumption
for the month under review was
much better given that all households were in the acceptable food consumption category. The
current mean food consumption score depicted a stable trend at 75, the same as the previous month.
The mean FCS score was high in the mixed farming: irrigated cropping/ livestock livelihood zone
recorded at 88 followed by mixed farming: horticulture/dairy livelihood zone at 77 and mixed
farming; food crop/livestock livelihood zone at 61. In all the zones, households consumed three
food groups i.e. maize, pulses and vegetables and also 67 percent of the households interviewed
consumed meat (fish/beef) at least once during the seven days recall period. Fish was served for
three to five days in a week in households of Mboghoni and Challa wards in Taveta Sub County
due to fishing activities in both Lake Challa and Lake Jipe. Other foods consumed were fruits and
milk.
Milk consumption
The average milk consumption per household per day remained stable at 1.2 litres as posted in the
previous month and below the long term mean by eight percent. Milk consumption per household

Page 16 of 30
per day regarding livelihood zones; mixed farming: food crops/livestock (1.2 litres), mixed
farming: horticulture/ dairy (1.3 litres) and mixed farming: irrigated cropping/livestock (one litre).
3.2.6 Coping strategy
There were no consumption-based coping strategies employed from households interviewed in the
month under review since households relied
on previous season harvests (84 percent HHs
holding stocks) and also prices were lower at
the household level. The current Coping
Strategy Index (CSI) indicates that the
situation is much better compared to a
similar month last year were (Figure 9).
3.3 Utilization
3.3.1Morbidity and mortality patterns
Upper respiratory tract infections (URTI), diarrhoea and malaria were reported as the three most
prevalent diseases in the county respectively between January to June 2020 among under-fives and
the general population (Figure 10)
Cases of URTI and diarrhoea decreased from March by 50 percent compared to last year same
season due to high levels of hygiene and sanitation for instance use of face masks, constant hand
washing, reduced movement and less body contact through avoidance of handshaking and
maintenance of social distancing put in place by the Ministry of Health to curb the spread of
COVID-19. Also, the COVID-19 pandemic created a sense of fear among the general public in
visiting hospitals. Malaria cases for both the under-fives and the general population remained
stable due to introduction of the Malaria Program that promotes treating of confirmed cases only
and by and large issuing of nets to under ones and Pregnant and lactating mothers. An average
0
5000
10000
15000
URTI
Diarrhoea
Malaria0
1000
2000
3000
4000
5000
6000
Jan
uar
y
Feb
ruary
Mar
ch
Ap
ril
May
Jun
e
URTI
Diarrhoe
a
Malaria
URTI
Figure 10: Morbidity Trends for Under Fives and General Population
Figure 9: Coping strategy index trends in Taita Taveta
County

Page 17 of 30
return distance to reach the nearest health facility was approximately four kilometres for most
households.
3.3.2 Immunization and Vitamin A supplementation
The proportion of fully immunized children (FIC) in Taita Taveta County between January and
June 2020 increased to 91 percent compared to 77 percent posted in a similar period in 2019 and
was attributed to new strategies implemented to promote courteous services to mothers/ caregivers
of under ones for instance no queuing and faster services to protect them from infectious diseases
especially COVID-19. Vitamin A supplementation surpassed the national target of 80 percent for
the FIC. Vitamin A supplementation (VAS) for children aged between 6 and 11 months was
recorded at 98.1 percent compared 77.6 percent recorded in a similar period last year. The increase
was due to Malezi Bora program in May where each ward was supported to do community
supplementation either at household level/ village level and accelerated outreaches through use of
Beyond Zero facility to be preventative and curatives closer to the community. VAS for children
aged between 12 and 59 months in January to June 2020 increased marginally to 69.4 percent
compared to 68.4% posted in a similar period in 2019.
3.3.3 Nutritional status and dietary diversity
There were no cases of children at risk of
malnutrition compared to 0.2 percent posted in
June 2019 (Figure 11). Supplementary Feeding
Program (SFP) and Outpatient Therapeutic
Program (OTP) admission dropped by 29.3
percent and eight percent respectively and
notably, the trend had a normal curve until
March 2020 where a drop was registered
attributed to low utilization of the health
facilities when the country first registered new
cases of COVID-19, but in June both SFP and
OTP admissions were on an upward trend when movement restriction was lifted and the public
felt relieved. Across all livelihood zones, the nutrition status of children below five years remained
good. CHANIS (underweight) for January to June 2020 dropped by 32% compared to a similar
period in 2019 due to availability of food at the household level and improved hygiene and
mother/caregiver child care practice since most of them are at home during this period of COVID-
19 pandemic.3.3.4 Health and Nutrition Sector in COVID -19
3.3.4 Health and Nutrition Sector in COVID-19
Health seeking behaviour of members of the public was reversed by the COVID-19 pandemic and
almost all facilities recorded fewer numbers of those who walked in to seek health and nutrition
services. There was a complete shift to COVID-19 activities hence there was no growth monitoring
and malnutrition assessment activities carried out and this led to low uptake of nutrition services.
Outreach services were put on halt for some time and this also affected uptake of immunization
services especially from children in hard to reach areas. Growth monitoring and assessment for
malnutrition by community health volunteers (CHVs) were adversely affected since it involves
Figure 11: Children Nutrition statues

Page 18 of 30
interaction through close contact and touching which is one of the risks associated with the spread
of COVID-19. Currently, health services are ongoing accompanied with outreaches being
undertaken using Beyond Zero where continuous sensitization on COVID-19 pandemic is being
disseminated to the communities.
The main cause of the disruption was safety for the users. Hospitals were considered not to be safe
and citizens were advised to avoid the hospital and its environs. Only emergencies were attended
to during the first month of the pandemic. Established triaging points at the main entrance of all
hospitals and all primary health care facilities and also identified quarantine and holding rooms in
all healthcare facilities. Official communication was done to the public to inform them on the
resumption of all essential services, and reassurance to the public that the hospital environment
was safe to visit and measures observe as they access services. Intensive community sensitization
on COVID-19 pandemic through community health structures, local radio FMs, radio shows and
roadside campaigns.
Intensive training on health care workers on COVID-19 pandemic, triaging, case management,
infection prevention, sample collection and testing for COVID-19, occupational health and safety,
Contact tracing, prevention and control, home care for COVID-19 patients, social stigma,
discrimination and risk communication, Psychosocial support and set up handwashing facilities
and sanitizers at strategic points in all hospitals and level 2 and 3 facilities.
The Community Health Volunteers (CHV) is involved in various activities including distribution
of masks to the communities, championing hand washing facilities at the household level, Vitamin
A supplementation and referrals to health facilities. Also, CHVs were involved in piloting of
family MUAC which is mother/caregiver friendly in NDMA EWS seven sentinel sites.
Movement restriction measures and night curfew resulted in health services being reported at a
slower rate compared to when the ban was lifted in June. Health commodities were out of stock
from March 2020 however supplies have resumed and are currently being distributed countywide
by KEMSA.
3.3.5 Public interventions, risk communication and community-level actions
Sensitization on COVID-19 preventive measures i.e. hand washing sensitization, maintaining
social distance and wearing of face mask all the time and to seek medical care in case they suspect
a case or someone presents with COVID-19 related signs and symptoms. Distribution of masks
and sanitizers is not equitable. Not all cohorts are reached especially the most vulnerable
population e.g. the elderly. Regarding handwashing facilities, almost 85 percent of all household
in the county have basic handwashing facilities with running water and soap except a few
vulnerable and poor households in the county.
Enhanced community engagement is through the following; risk communication messaging on
COVID-19, social stigma and discrimination, contact tracing and psychosocial support.
Adherence to directives has been a major challenge, for instance, the practice of mask-wearing
especially in major towns, market places (public places) people prefer chin masking which is also
a threat to other infections. In rural areas, people are seen walking at close range without putting

Page 19 of 30
on masks. Social distancing is a major challenge in working places and communities. People are
seen walking at a very close range and decongesting of working places has been a great challenge
because of infrastructural adjustment that has some cost implications.
A few elements in the community do not believe that Coronavirus exists hence do not take COVID-
19 measures seriously and about putting on a mask are associated with demonic spirits and some
people says once you start putting it on you will never stop.
3.3.6 Coordination and leadership in COVID-19 pandemic preparedness and response
The county has put in place functional structures to deal with COVID-19 pandemic. The County
Coordination Rapid Response Team to undertake all issues related to COVID-19 pandemic
regarding all resources (staff, finances, logistics and infrastructure development) provides
backstopping to coordination teams at both Sub County and Ward level. The Ward Committee is
mainly for contact tracing and sensitization on COVID-19 pandemic. Also, the County Health and
Nutrition Technical Forum is functional and hold a routine quarterly meeting to discuss the
progress of various nutrition program achievements and challenges faced during implementation.
Nutrition department in the county also engages with different actors and stakeholders who play a
major role in supporting the implementation of nutrition and health programs across all levels of
care. Health and Nutrition team is engaged to give technical support and guidance on meal
balancing (at least 4 or 5 food groups daily) to strengthen the immune system, maintain good health
and speed up recovery by fighting the disease among the COVID-19 positive patients. To curb the
spread of COVID-19, roadblocks were erected to man borders at Manyani, Njukini and Miasenyi
where screening of all passengers entering the county was mandatory and those from Nairobi and
Mombasa were put on quarantine for fourteen days.
3.3.7 Sanitation and Hygiene
The main sources of water currently in use by both human beings and livestock were piped water
systems, springs, rivers, pans and dams, shallow wells and boreholes and in all livelihood zones
water from the main sources is expected to cater for households for the next two to three months.
An estimated 70 percent of the households across the livelihood zone treat water before drinking.
Boiling was the most preferred method of water treatment by most households. Approximately 40
percent of the households in the county are supplied water by Taita Taveta and Voi Water
Company (TAVEVO) which is treated at the source. The average latrine coverage in the county
stood at 95.4 percent. Latrine coverage in all sub-counties was above 90 percent. The major method
used for waste disposal is compost pits.
Page 20 of 30
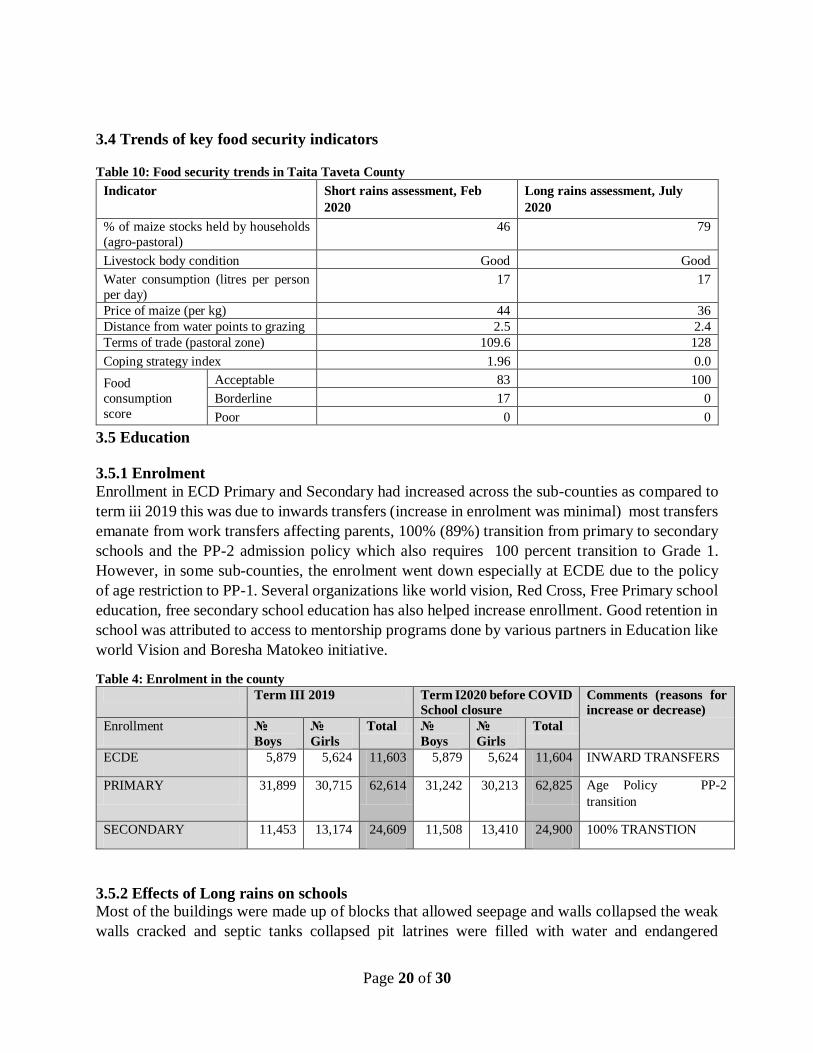
3.4 Trends of key food security indicators
Table 10: Food security trends in Taita Taveta County
Indicator Short rains assessment, Feb
2020
Long rains assessment, July
2020
% of maize stocks held by households
(agro-pastoral)
46 79
Livestock body condition Good Good
Water consumption (litres per person
per day)
17 17
Price of maize (per kg) 44 36
Distance from water points to grazing 2.5 2.4
Terms of trade (pastoral zone) 109.6 128
Coping strategy index 1.96 0.0
Food
consumption
score
Acceptable 83 100
Borderline 17 0
Poor 0 0
3.5 Education
3.5.1 Enrolment
Enrollment in ECD Primary and Secondary had increased across the sub-counties as compared to
term iii 2019 this was due to inwards transfers (increase in enrolment was minimal) most transfers
emanate from work transfers affecting parents, 100% (89%) transition from primary to secondary
schools and the PP-2 admission policy which also requires 100 percent transition to Grade 1.
However, in some sub-counties, the enrolment went down especially at ECDE due to the policy
of age restriction to PP-1. Several organizations like world vision, Red Cross, Free Primary school
education, free secondary school education has also helped increase enrollment. Good retention in
school was attributed to access to mentorship programs done by various partners in Education like
world Vision and Boresha Matokeo initiative.
Table 4: Enrolment in the county
Term III 2019 Term I2020 before COVID
School closure
Comments (reasons for
increase or decrease)
Enrollment №
Boys
№
Girls
Total №
Boys
№
Girls
Total
ECDE 5,879 5,624 11,603 5,879 5,624 11,604 INWARD TRANSFERS
PRIMARY 31,899 30,715 62,614 31,242 30,213 62,825 Age Policy PP-2
transition
SECONDARY 11,453 13,174 24,609 11,508 13,410 24,900 100% TRANSTION
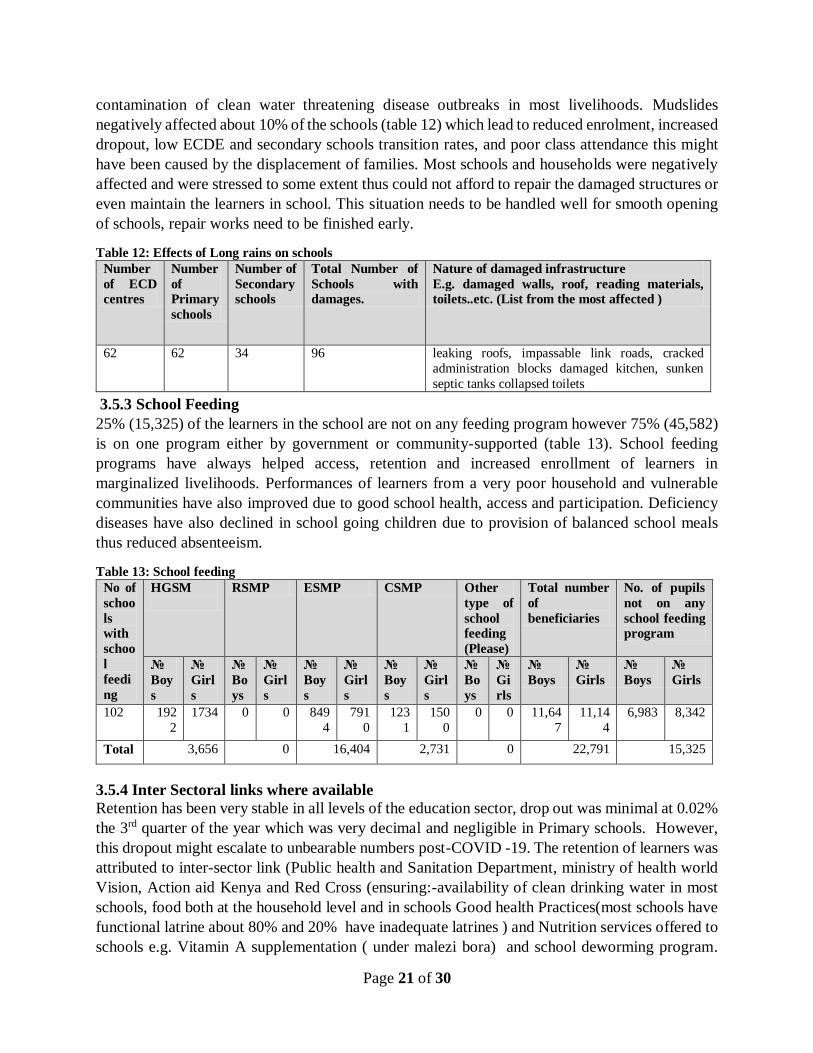
3.5.2 Effects of Long rains on schools
Most of the buildings were made up of blocks that allowed seepage and walls collapsed the weak
walls cracked and septic tanks collapsed pit latrines were filled with water and endangered
Page 21 of 30
contamination of clean water threatening disease outbreaks in most livelihoods. Mudslides
negatively affected about 10% of the schools (table 12) which lead to reduced enrolment, increased
dropout, low ECDE and secondary schools transition rates, and poor class attendance this might
have been caused by the displacement of families. Most schools and households were negatively
affected and were stressed to some extent thus could not afford to repair the damaged structures or
even maintain the learners in school. This situation needs to be handled well for smooth opening
of schools, repair works need to be finished early.
Table 12: Effects of Long rains on schools
Number
of ECD
centres
Number
of
Primary
schools
Number of
Secondary
schools
Total Number of
Schools with
damages.
Nature of damaged infrastructure
E.g. damaged walls, roof, reading materials,
toilets..etc. (List from the most affected )
62 62 34 96 leaking roofs, impassable link roads, cracked
administration blocks damaged kitchen, sunken
septic tanks collapsed toilets
3.5.3 School Feeding
25% (15,325) of the learners in the school are not on any feeding program however 75% (45,582)
is on one program either by government or community-supported (table 13). School feeding
programs have always helped access, retention and increased enrollment of learners in
marginalized livelihoods. Performances of learners from a very poor household and vulnerable
communities have also improved due to good school health, access and participation. Deficiency
diseases have also declined in school going children due to provision of balanced school meals
thus reduced absenteeism.
Table 13: School feeding
No of
schoo
ls
with
schoo
l
feedi
ng
HGSM
RSMP ESMP CSMP Other
type of
school
feeding
(Please)
Total number
of
beneficiaries
No. of pupils
not on any
school feeding
program
№
Boy
s
№
Girl
s
№
Bo
ys
№
Girl
s
№
Boy
s
№
Girl
s
№
Boy
s
№
Girl
s
№
Bo
ys
№
Gi
rls
№
Boys
№
Girls
№
Boys
№
Girls
102 192
2
1734 0 0 849
4
791
0
123
1
150
0
0 0 11,64
7
11,14
4
6,983 8,342
Total 3,656 0 16,404 2,731 0 22,791 15,325
3.5.4 Inter Sectoral links where available
Retention has been very stable in all levels of the education sector, drop out was minimal at 0.02%
the 3rd quarter of the year which was very decimal and negligible in Primary schools. However,
this dropout might escalate to unbearable numbers post-COVID -19. The retention of learners was
attributed to inter-sector link (Public health and Sanitation Department, ministry of health world
Vision, Action aid Kenya and Red Cross (ensuring:-availability of clean drinking water in most
schools, food both at the household level and in schools Good health Practices(most schools have
functional latrine about 80% and 20% have inadequate latrines ) and Nutrition services offered to
schools e.g. Vitamin A supplementation ( under malezi bora) and school deworming program.

Page 22 of 30
Prevention programs on communicable diseases, for instance, TB, HIV and AIDs. Good water,
hygiene and sanitation situation in schools only 25% of schools lack proper hygiene and sanitation.
School going children are protected from violence and sexual molestation especially vulnerable
households in Kishushe and Paranga under Action Aid and Taveta areas under World vision.
Absenteeism was curbed by the provision of sanitary towels for girls by the Government and
enforcement of the child labour by the ministry of interior and national coordination. Public health
and sanitation have always endeavoured to ensure a good living environment is maintained in
schools and making school free from open defecation. Red Cross and the office of Taita Taveta
first lady have been very active in sanitary towel distribution and shoes for the prevention of
jiggers. However sanitary distribution was disrupted by schools closure.
4.0 Food Security Prognosis
4.1 Prognosis Assumptions
Taita Taveta County food security prognosis for the next six months is based on the following
assumptions:
Weather outlook for the period July-August-September when the county is expected to
remain dry and experience strong winds coupled with cold weather conditions.
Prices of food especially maize are expected to be on an upward trend due to market
disruption and closure of border trade with Tanzania at Taveta border point while prices of
livestock are expected to decline due to closure of markets.
Forage condition is expected to cater for livestock until the onset of short rains in October
due to favourable cold weather conditions.
Food is available at household and market-level due to good harvest from two consecutive
seasons.
Increase in positive cases of COVID-19 due to community transmission in the country.
4.2 Food security Outlook for the next 6 months
4.2.1 Food security Outcome (August, September, October)
Based on the above assumptions, the food security situation is expected to remain stable and
sustained by the expected harvest from the long rains season. Majority of the population are likely
to have borderline and acceptable food consumption scores and employ normal food-based coping
strategies. Nutrition status will remain stable and no mortalities as a result of food insecurity are
expected. However, due to COVID-19 community transmission phase deaths (mainly the
vulnerable group) are expected if communities do not adhere to containment measures put in place
by the Ministry of Health. The current situation in the county is likely to be classified under
Minimal (IPC Phase I) implying that most households will be able to meet their food needs without
employing severe coping strategies.
4.2.2 Food security Outlook (November, December, January)
The food security situation for November to January is projected to remain stable due to the onset
of short rains that will result in the availability of short term maturing crops and livestock products.
Water situation, forage and livestock body conditions are expected to be good due to short rains,
food security outcome indicators are expected to be stable. Most households are likely to have
borderline and acceptable food consumption score and are expected to employ moderate food-
Page 23 of 30
based coping strategies. Nutritional status for children under five years is anticipated to remain
stable. The projected normal food security situation in the county is probably going to be classified
under minimal phase(IPC Phase 1).
5.0 CONCLUSION AND INTERVENTIONS
5.1 Conclusion
5.1.1 Phase classification
The county is classified under Minimal (IPC Phase I) food security phase classification, implying
80 percent of the households can meet their food needs without employing severe coping
strategies. Food is available and is expected to cater for households over the next three months.
5.1.2 Summary of Findings
The long rains were good in amount and well distributed in time and space. The onset was early
and cessation was timely in the third week of May. The rains managed to support crop to full
maturity, sufficiently nurtured regeneration of pasture and browse to maturity and recharged water
facilities to 100 percent. Livestock body condition was good in all livelihood zones. Food
Consumption Scores were in the acceptable category, nutrition status for the under-five was within
the normal range and mortality rates and the crude mortality rate was normal and below the
emergency threshold.
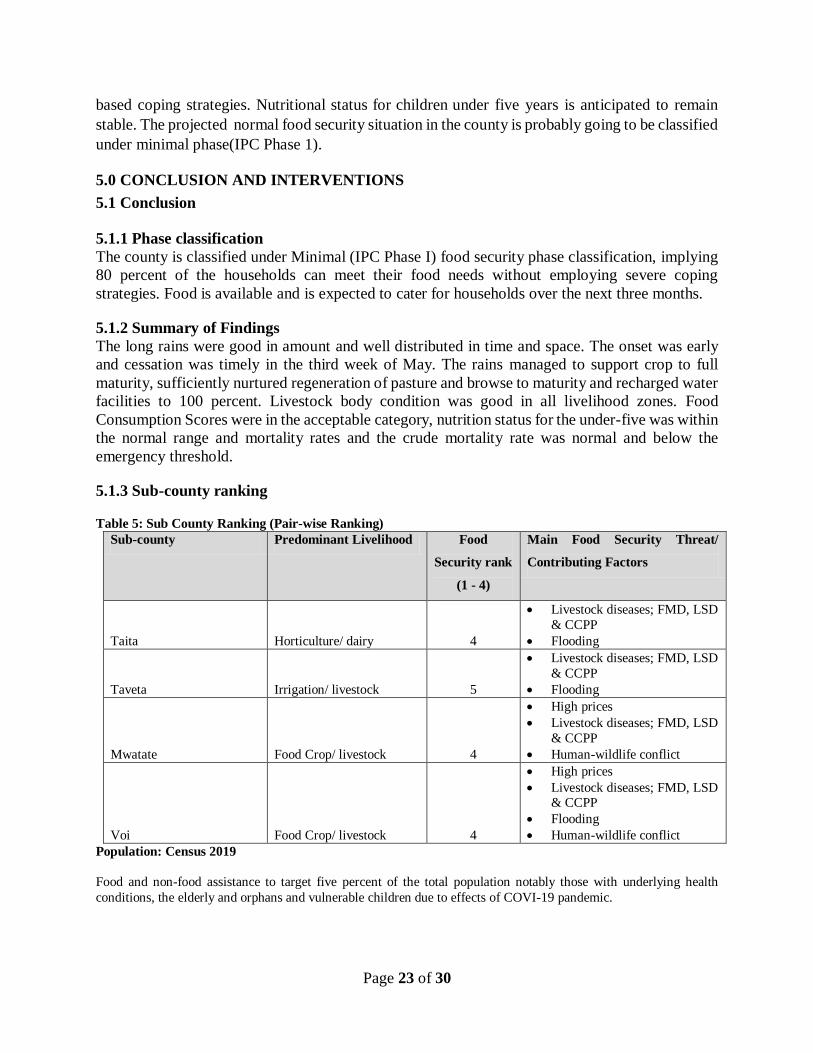
5.1.3 Sub-county ranking
Table 5: Sub County Ranking (Pair-wise Ranking)
Sub-county Predominant Livelihood Food
Security rank
(1 - 4)
Main Food Security Threat/
Contributing Factors
Taita Horticulture/ dairy 4
Livestock diseases; FMD, LSD
& CCPP
Flooding
Taveta Irrigation/ livestock 5
Livestock diseases; FMD, LSD
& CCPP
Flooding
Mwatate Food Crop/ livestock 4
High prices
Livestock diseases; FMD, LSD
& CCPP
Human-wildlife conflict
Voi Food Crop/ livestock 4
High prices
Livestock diseases; FMD, LSD & CCPP
Flooding
Human-wildlife conflict
Population: Census 2019
Food and non-food assistance to target five percent of the total population notably those with underlying health
conditions, the elderly and orphans and vulnerable children due to effects of COVI-19 pandemic.
Page 24 of 30
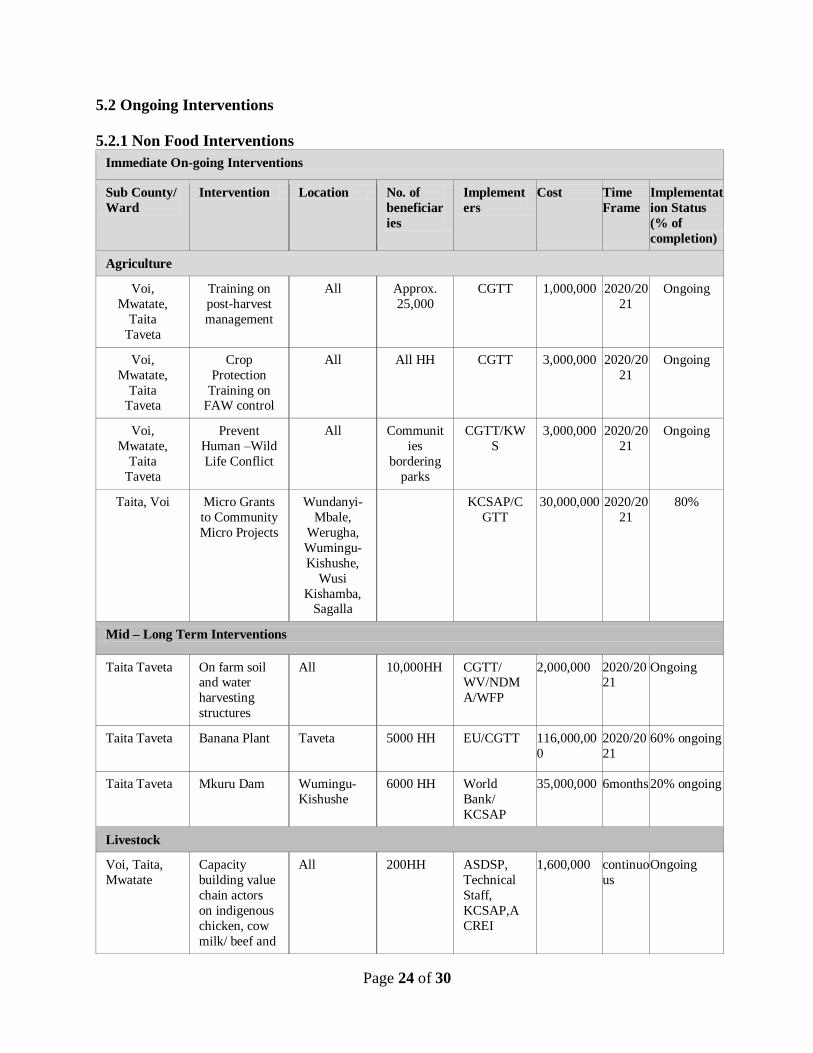
5.2 Ongoing Interventions
5.2.1 Non Food Interventions
Immediate On-going Interventions
Sub County/
Ward
Intervention Location No. of
beneficiar
ies
Implement
ers
Cost Time
Frame
Implementat
ion Status
(% of
completion)
Agriculture
Voi,
Mwatate,
Taita
Taveta
Training on
post-harvest
management
All Approx.
25,000
CGTT 1,000,000 2020/20
21
Ongoing
Voi,
Mwatate,
Taita Taveta
Crop
Protection
Training on FAW control
All All HH CGTT 3,000,000 2020/20
21
Ongoing
Voi,
Mwatate,
Taita
Taveta
Prevent
Human –Wild
Life Conflict
All Communit
ies
bordering
parks
CGTT/KW
S
3,000,000 2020/20
21
Ongoing
Taita, Voi Micro Grants
to Community
Micro Projects
Wundanyi-
Mbale,
Werugha,
Wumingu-
Kishushe,
Wusi
Kishamba, Sagalla
KCSAP/C
GTT
30,000,000 2020/20
21
80%
Mid – Long Term Interventions
Taita Taveta On farm soil and water
harvesting
structures
All 10,000HH CGTT/ WV/NDM
A/WFP
2,000,000 2020/2021
Ongoing
Taita Taveta Banana Plant Taveta 5000 HH EU/CGTT 116,000,00
0
2020/20
21
60% ongoing
Taita Taveta Mkuru Dam Wumingu-
Kishushe
6000 HH World
Bank/
KCSAP
35,000,000 6months 20% ongoing
Livestock
Voi, Taita,
Mwatate
Capacity
building value
chain actors
on indigenous
chicken, cow
milk/ beef and
All 200HH ASDSP,
Technical
Staff,
KCSAP,A
CREI
1,600,000 continuo
us
Ongoing

Page 25 of 30
on improved
production,
disease control
and marketing.
Voi Promotion of
improved
poultry production and
beekeeping.
Sagalla 40HH NDMA,
Technical
staff, STE, CGTT
4,000,000 1 year Starting
Water
Immediate Interventions
All wards Water trucking
& Provision of
handwashing
stations at all
key public
places
(Markets,
entry points,
bus parks
All key
public
places
Over
20000
CGTT/Part
ners
8,000,000 2
months
Ongoing
Mid – Long Term Intervention
Sagalla Extension of
KIMWA
pipeline
Kirumbi/
Kajire
5000 CGTT &
NDMA
15,000,000 36mont
h
At the
planning
stage
Challa Legalization
of water
abstraction
requirements
Challa,
Njukini and
Mahoo
3000 WRMA continuo
us
Ongoing
Mwatate sub-
county
Borehole
drilling and
development
Dighai,
Manoa,
Iriwenyi
About
2000
CGTT 15,000,000 1 year Completed
Wumingu/Ki
shushe
Mlilo -
Kishushe water project
Kishushe 3,000 CWSB/CG
TT
50,000,000 3 years Ongoing
Health and Nutrition
Voi,
Mwatate,
Taita
Taveta
Vitamin A
Supplementati
on
All Sub
Counties
40,846 CGTT
UNICEF
670,000 May and
Novemb
er
Continuous
Voi,
Mwatate,
Taita
Taveta
Zinc
Supplementati
on
All health
Facilities
All
diarrhoea
cases were
seen for
under-
fives
CGTT
IMCI
Continuous

Page 26 of 30
Voi,
Mwatate,
Taita
Taveta
Management
of Acute
Malnutrition
(IMAM)
All health
facilities
2841 CGTT
UNICEF
KEMSA
Continuous
Voi,
Mwatate,
Taita Taveta
IYCN
Interventions
(EBF and Timely Intro
of
complementar
y Foods)
All Health
Facilities
4599 CGTT
KEMSA
Continuous
Voi,
Mwatate,
Taita
Taveta
Iron Folate
Supplementati
on among
Pregnant
Women
All Health
Facilities
15,102 CGTT
KEMSA
Continuous
Voi,
Mwatate,
Taita
Taveta
Deworming All health
Facilities
52,308 CGTT
KEMSA
Continuous
Voi,
Mwatate,
Taita
Taveta
Food
Fortification
County 393,292 National
Govt
Continuous
5.3 Recommended Interventions
Immediate recommended Interventions (Including Interventions in response to COVID-19 pandemic)
Sub County/
Ward
Intervention Location No. of
beneficiari
es
Proposed
Implement
ers
Require
d
Resourc
es
Availabl
e
Resourc
es
Time
Frame
Agriculture
Voi,
Mwatate,
Taita & Taveta
Crop insurance
scheme for all
farmers
All 12,984 FF CGTT/NG
/DP
Funds
Personn
el
2020
Voi,
Mwatate,
Taita
Taveta
Post-harvest
management
training
All 3,000 FF CGTT/DP 500,000 2020
Voi,
Mwatate,
Taita
Taveta
Subsidized
farm inputs for
farmers
All 1,000 FF CGTT/NG
/DP
5,000,0
00 2020/19
Voi,
Mwatate,
Taita
Taveta
Revival of
tractor services
All 500FF CGTT 1,000,0
00 2020/19

Page 27 of 30
Mid – Long Term
Voi,
Mwatate,
Taita &
Taveta
Establishment
of grain
aggregation
canters
All 5000HH CGTT/NG
/DP
2,000,0
00 2020/19
Voi,
Mwatate,
Taita & Taveta
Procurement of
Conservation
Agriculture Compliant
Machineries
All 11000HH CGTT/NG
/DP
35,000,
000 2020/2021
Livestock
Voi,
Mwatate,
Taita &
Taveta
Intensification
of capacity
building on
pasture and
fodder
conservation
All
locations
1200 HHs CGTT 800,000 200,000 1 month
Taita, Voi,
Mwatate
Intensified
Disease
Surveillance
(LSD, FMD)
All
locations
1000HH CGTT 1,000,0
00
300,000 1 month
Taita, Voi,
Mwatate
Vaccination
and Treatment
against LSD
and FMD
All
locations
1000HH CGTT 1,000,0
00
500,000 1 month
Water
Immediate recommended Interventions (Including Interventions in response to COVID-19 pandemic)
Kasigau Construction of
Jora-Ingire
water project
Makwasi
nyi
2000 CGTT 5M 1.5M 3months
Taita Sub
County
Rehabilitation
and
Augmentation
of existing water facilities
due to COVID-
19 pandemic
All
wards
Over 5000 CGTT/Part
ners
50M 20M 3month
Medium and Long Term recommended Interventions
Kasigau De-saline
Ngambenyi
borehole
Ngamben
yi
500 CGTT/DO
NORS
5M Nill -
Mgange/Mwa
nda
Desilting of
Mwataru dam
Mwaroko 3000 CGTT 5M - 3months
Mgange/Mwa
nda
Drilling of
Marungu
borehole
Marungu Over 1000 CGTT 5M 3month

Page 28 of 30
Health and Nutrition
Voi,
Mwatate, Taita &
Taveta
Sensitization
/Training on Family MUAC
to CHVs and
Caregivers
All
Locations
1000 UNICEF
KRCS County
Governme
nt
864,000 - By
September 2020
Voi,
Mwatate,
Taita &
Taveta
Procurement of
Family MUAC
Tapes
All
Location
s
200 ‘’ 200,000 - By
September
2020
Voi,
Mwatate,
Taita &
Taveta
Sensitization on
e- MIYCN
All
Location
s
35
Communit
y Units
‘’ 1,742,0
00
- By June
2021
Voi,
Mwatate, Taita &
Taveta
County and Sub
County Nutrition
Technical
Forums
5
20
Meetings
THS 300,000 Quarterly
Voi,
Mwatate,
Taita &
Taveta
End-user
monitoring of
Nutrition
Commodities
4 Sub
Counties
16 Visits THS 300,000 Quarterly
Voi,
Mwatate,
Taita &
Taveta
Biannually
VAS to all
under-fives.
4 Sub
Counties
41,846 THS 670,000 May and
November
yearly.
Voi,
Mwatate, Taita &
Taveta
Integrated
outreaches to hard to reach
areas
24 393,292 THS 3,579,0
00
Voi,
Mwatate,
Taita &
Taveta
Accelerate
WASH
activities
All
Location
s
393,292 County
Governme
nt
KRCS
1,253,2
00
Voi,
Mwatate,
Taita &
Taveta
Procurement
and distribution
of PPE
70
Health
Facilities
County
Governme
nt
2,000,0
00
Voi,
Mwatate,
Taita & Taveta
Conduct
Quarterly
surveillance committee
meetings
4 Sub
Counties
County
Governme
nt
300,000 - Quarterly
Voi,
Mwatate,
Taita &
Taveta
Active case
finding
4 Sub
Counties
399,292 County
Governme
nt
1,000,0
00
-

Page 29 of 30
Education
Taita Supply of food
ratio to schools
48(PRI)
All the
locations
in Taita
sub-
county 21(SEC)
9,612
6,732
KEPSHA/
KESSHA
WUNDA
NYI
CONSTIT
UENCY COVID
RESPONS
E
COMMIT
TEE,TTC
G
50,000,
000
528,840 6month
Mwatate School meals
program
to all schools
65
schools
All
locations
in
Mwatate sub-
county
29,535 WFP,
BOM,
parent
NGO’s
25,000,
000
Nil 6Months
Voi School meals
program
108
All
schools
in the
sub
county
39,535 WFP,
BOM,
parents
NGOs,
TTCG
60,000,
000
NIL 9 MONTHS
Taveta Supply of food
Ratio and clean
water
40
All the
schools
16,410 BOM,
Head
Teachers,
Parents
and communit
y, MoE,
TTCG
30,000,
000
NIL 9 months
Voi,
Mwatate,
Taita &
Taveta
Empowering
Girl Child on
sex and
sexuality
218
schools
All Girls
of above
12 years
of age
15000
girls
MOE,
TTCG,
CDF,
WORLD
VISION,
KESSHA/
KEPSHA
lunches
and
Allowa
nces
500,000
/-
Nil 1 year
Voi,
Mwatate, Taita &
Taveta
ICT Training 218
All teachers
to be
trained
on
ICT use
in
teaching
3,894
Teacher
MOE,
TTCG, NGOs
770 per
teacher Total
Ksh
3,000,0
00
Nil 1 year

Page 30 of 30
(virtual
teaching
)
Voi,
Mwatate,
Taita &
Taveta
Repair of
Toilets
All
schools
with
sunken Toilets
6865
learners
MoE.,
CDF,
BOM,
TTCG
20,000,
000
Nil
6 months