table ronde performance 06 septembre 2016
TRANSCRIPT
Evènement PerformanceMARDI 6 SEPTEMBRE 2016
WEB PERF: NOUVELLES APPROCHES, NOUVEAUX ENJEUX

PARTIE 1: ETATS DES LIEUX ET ENJEUX

live.cedexis.com
7 BILLION MEASUREMENTS
PER DAY
GATHERED FROM 600M+END-USER SESSIONS,
FROM 50’000NETWORKS AROUND THE WORLD
THROUGHPUT
RANGING FROM 1 TO
10 ON A SINGLE
PROVIDER ALONG THE
DAY
1000 OUTAGE PER CDN
PER DAY.
Internet is built for failure
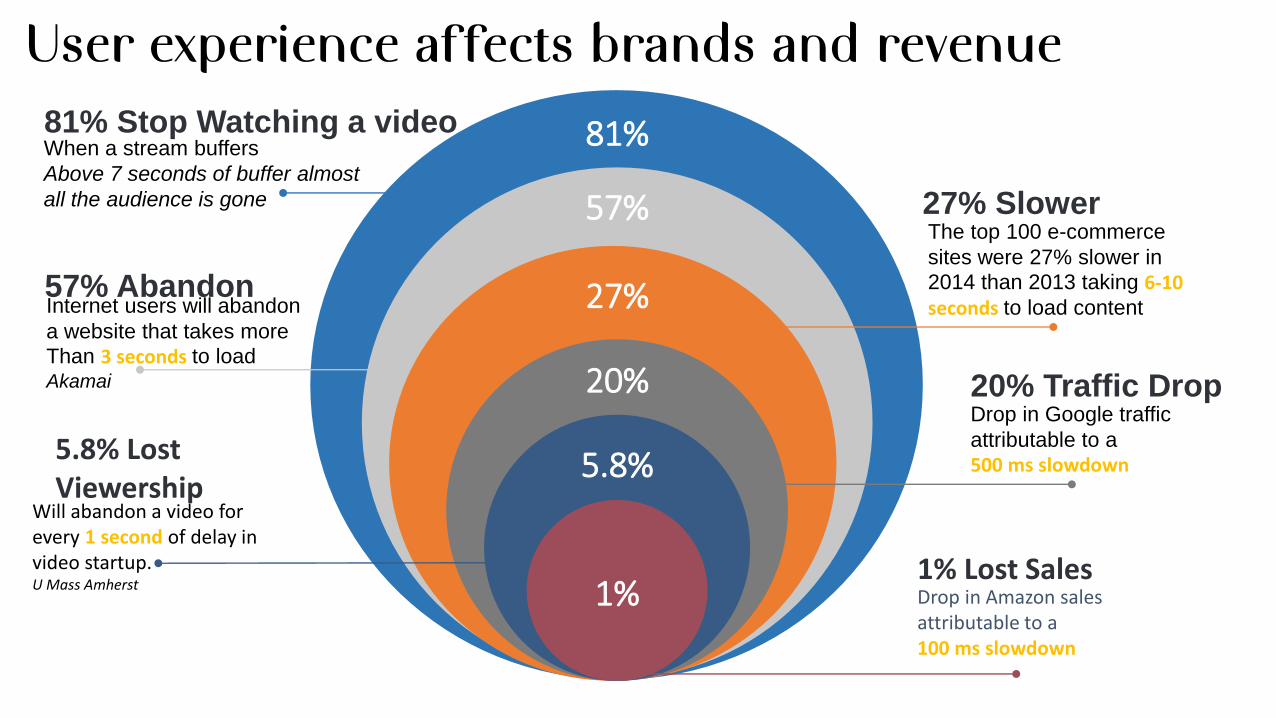
57%
20%
5.8%
Drop in Amazon salesattributable to a 100 ms slowdown
Will abandon a video for every 1 second of delay in video startup.U Mass Amherst
Drop in Google traffic
attributable to a 500 ms slowdown
5.8% Lost Viewership
20% Traffic Drop
1% Lost Sales1%
User experience affects brands and revenue
27%Internet users will abandon
a website that takes more
Than 3 seconds to load Akamai
57% Abandon
The top 100 e-commerce
sites were 27% slower in
2014 than 2013 taking 6-10 seconds to load content
27% Slower
81%81% Stop Watching a videoWhen a stream buffers
Above 7 seconds of buffer almost
all the audience is gone

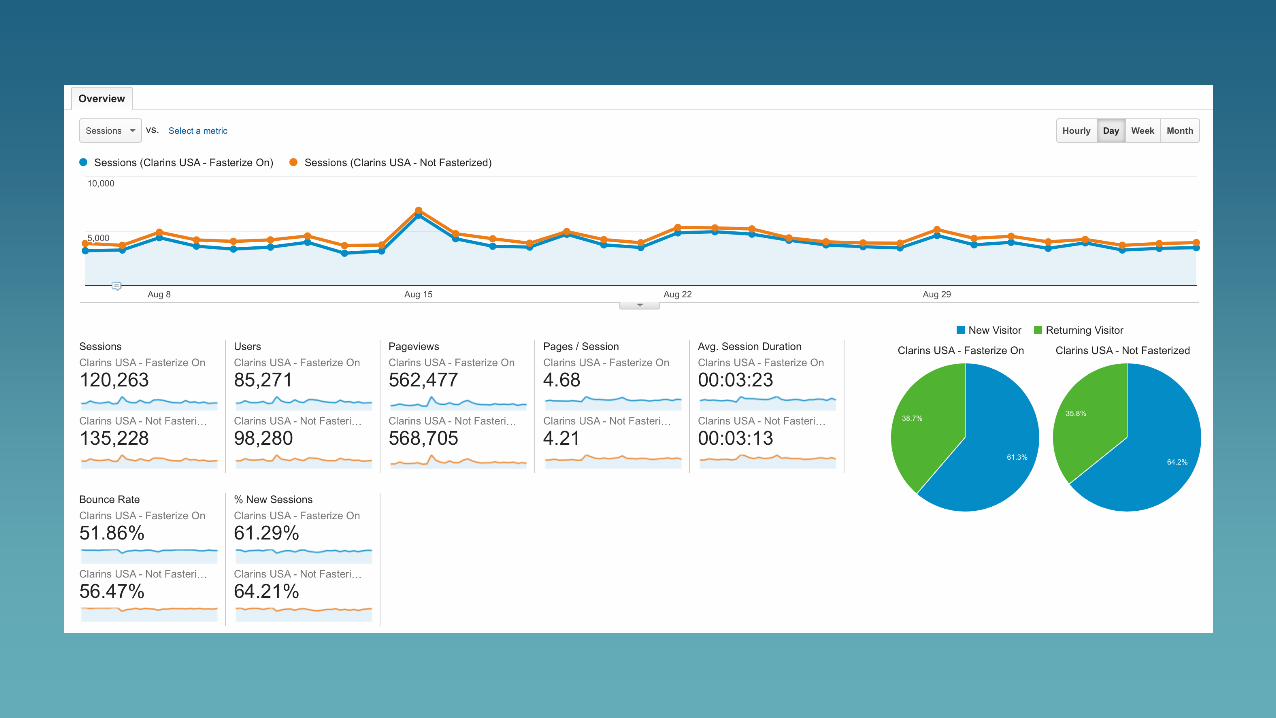
Taux de conversion par secteurs

PARTIE 2: KPI CLIENTS, METRIQUES CLES

Speed Index
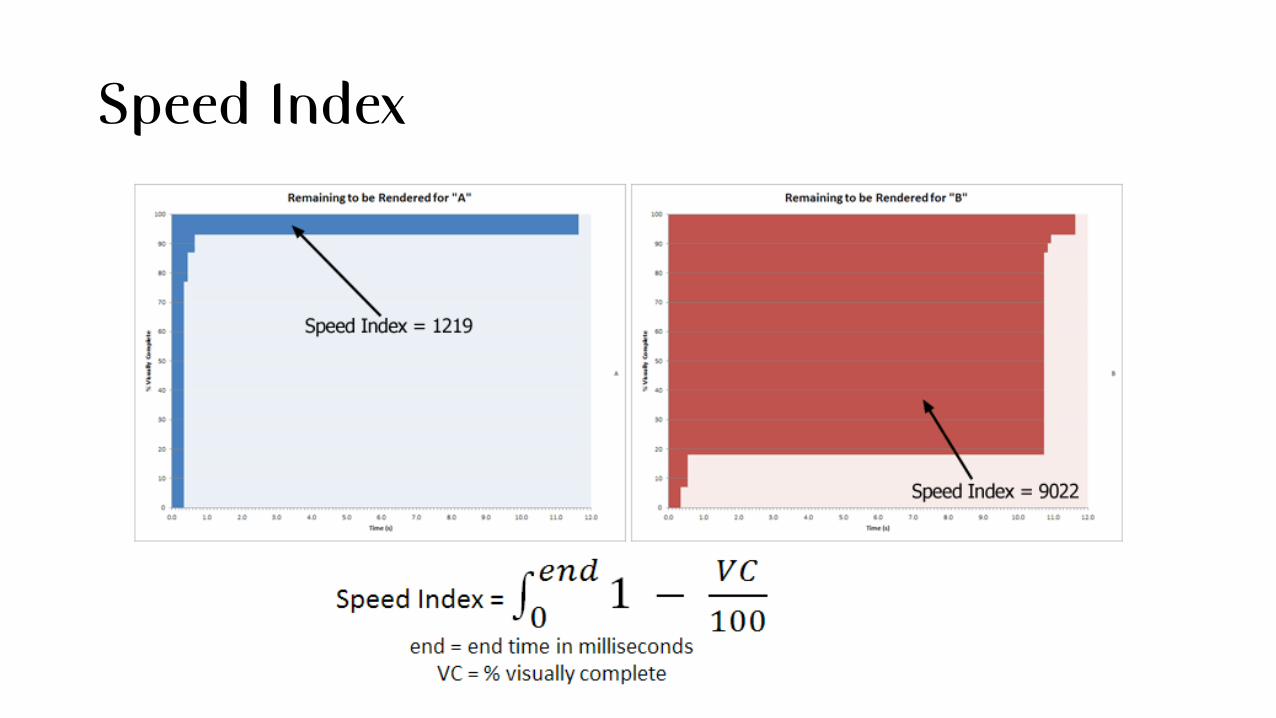
Speed Index

How does performance of my site vary around the world during a given time period?
Impact
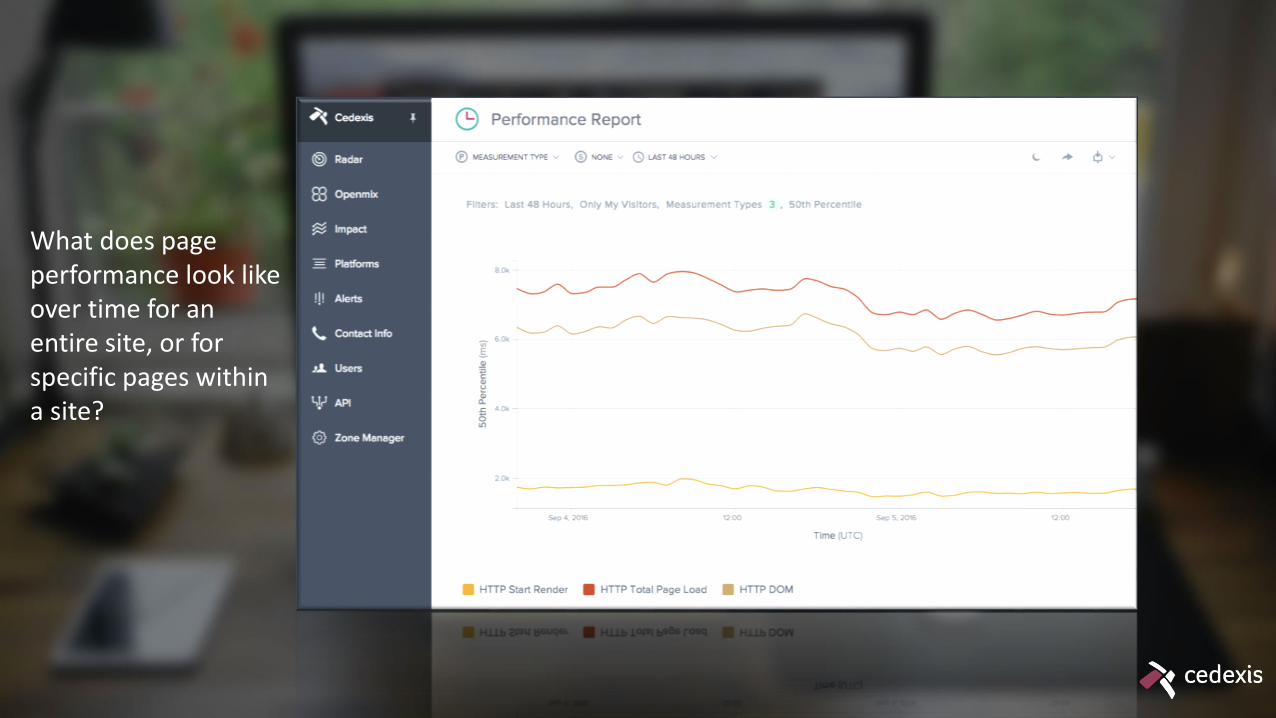
What does page performance look like over time for an entire site, or for specific pages within a site?
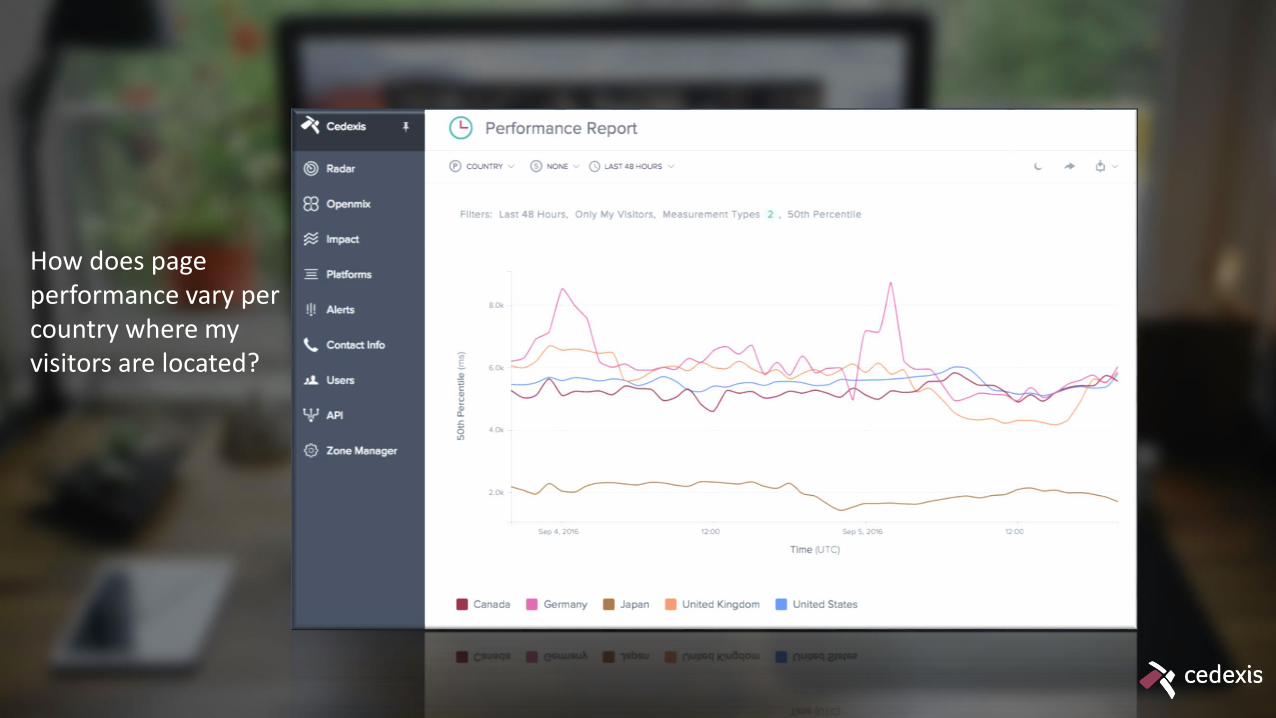
How does page performance vary per country where my visitors are located?
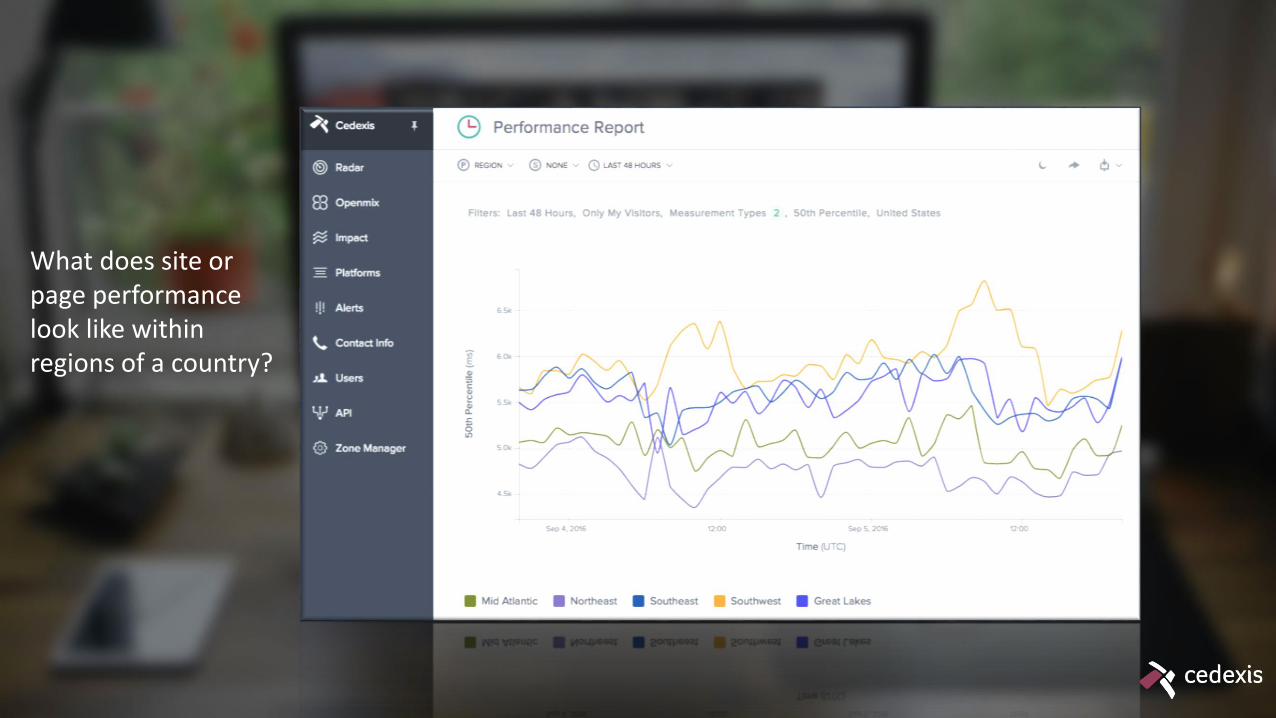
What does site or page performance look like within regions of a country?
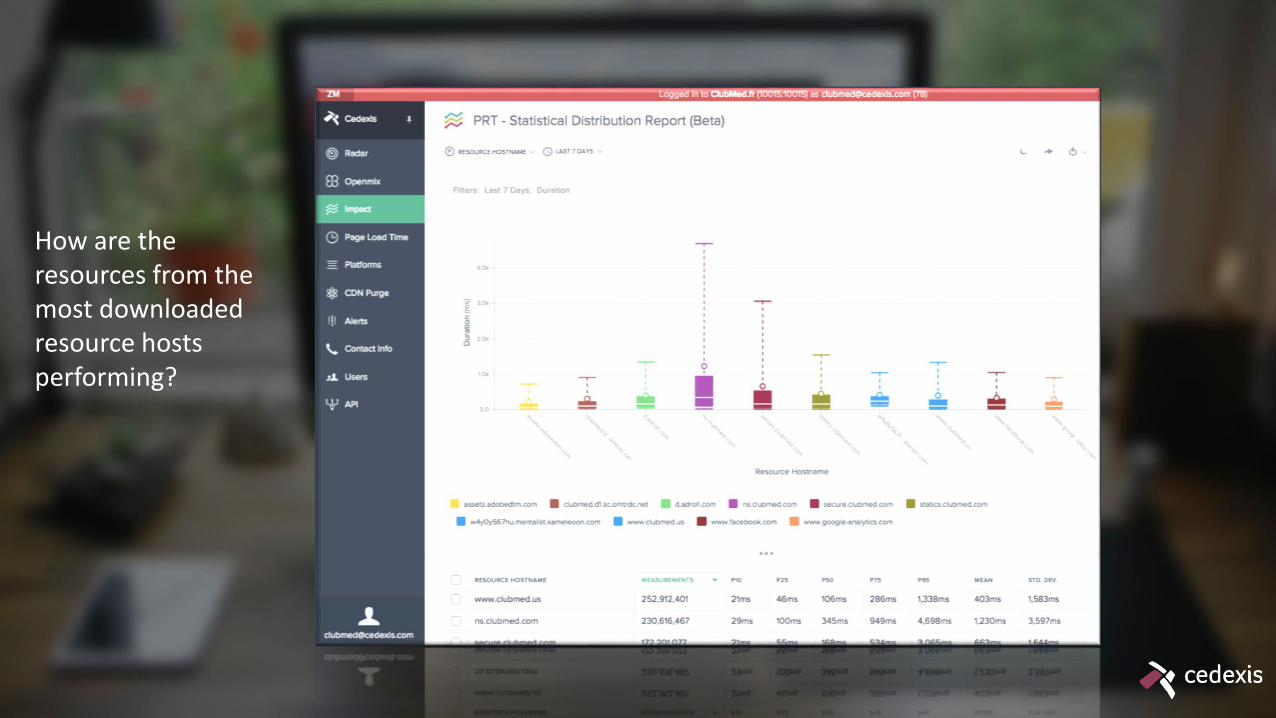
How are the resources from the most downloaded resource hosts performing?

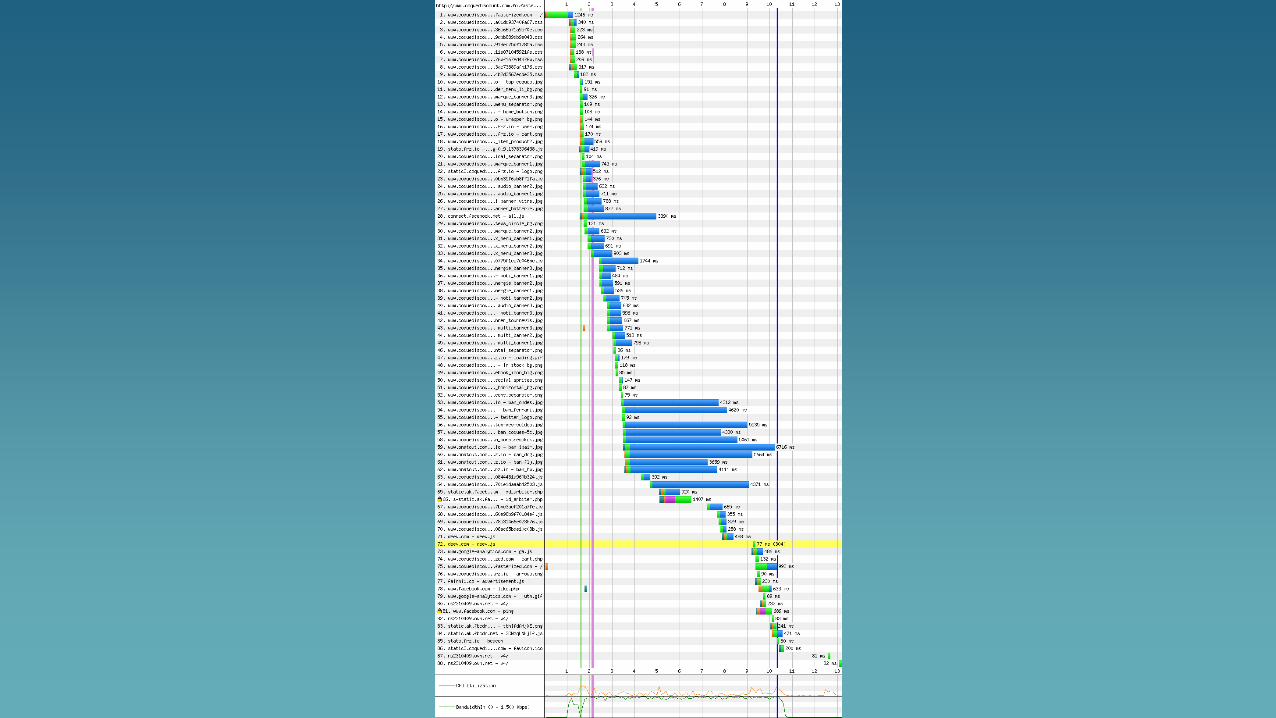
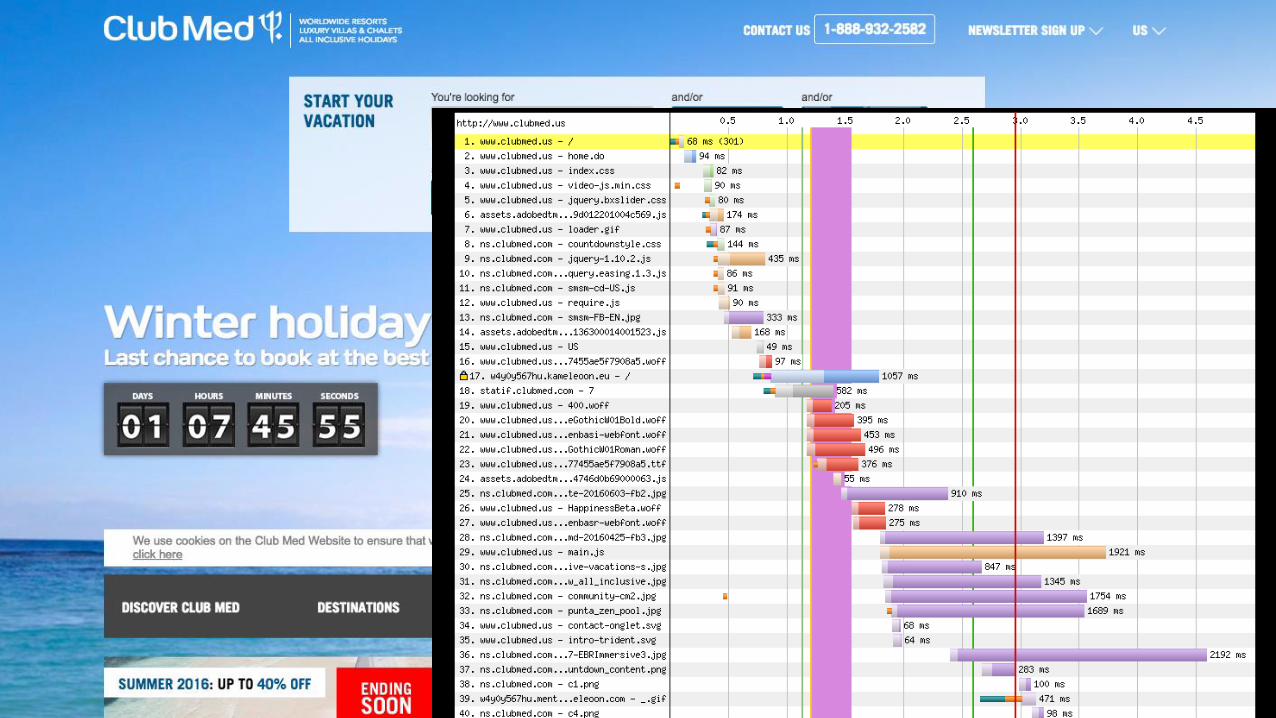
Ressource Timing
18
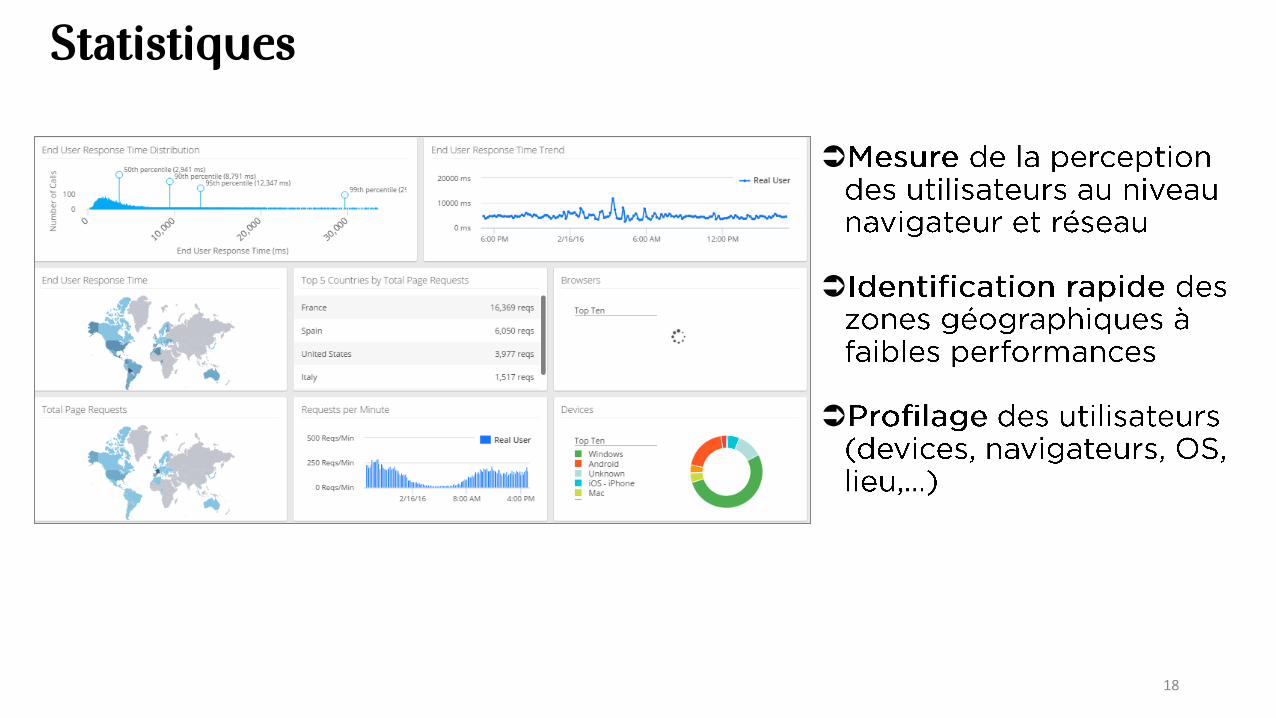
Statistiques
19
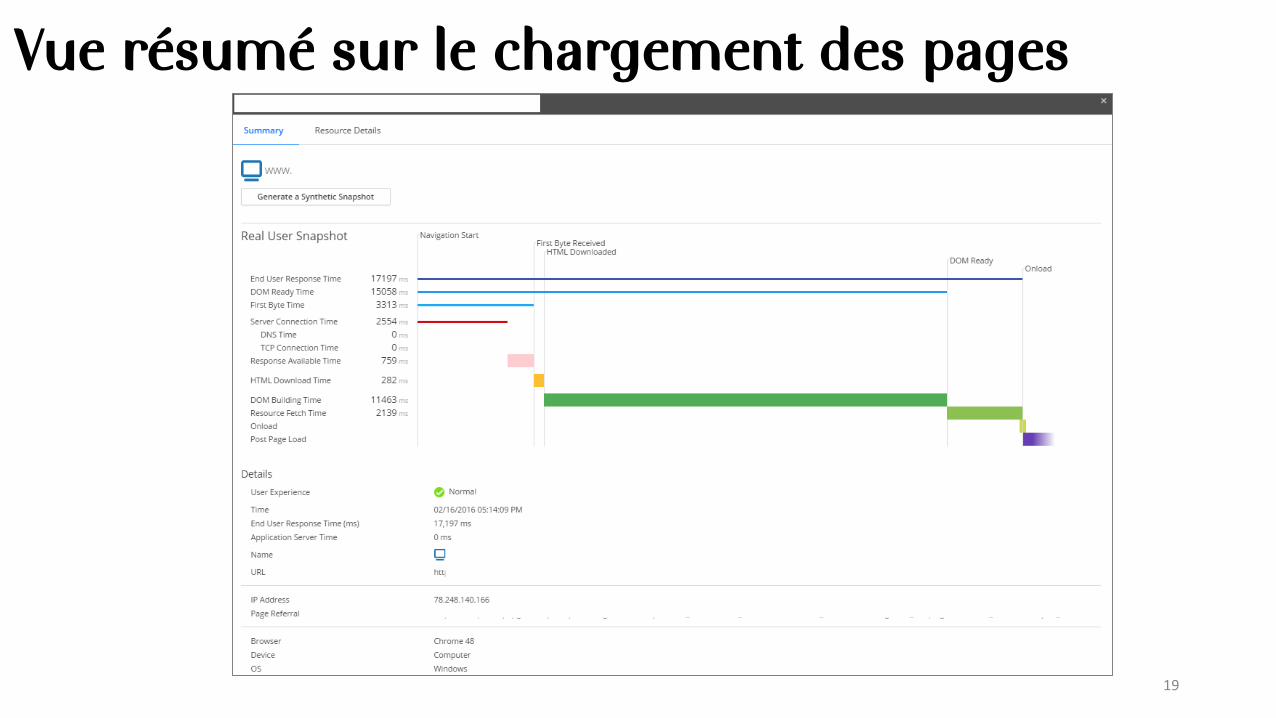
Vue résumé sur le chargement des pages
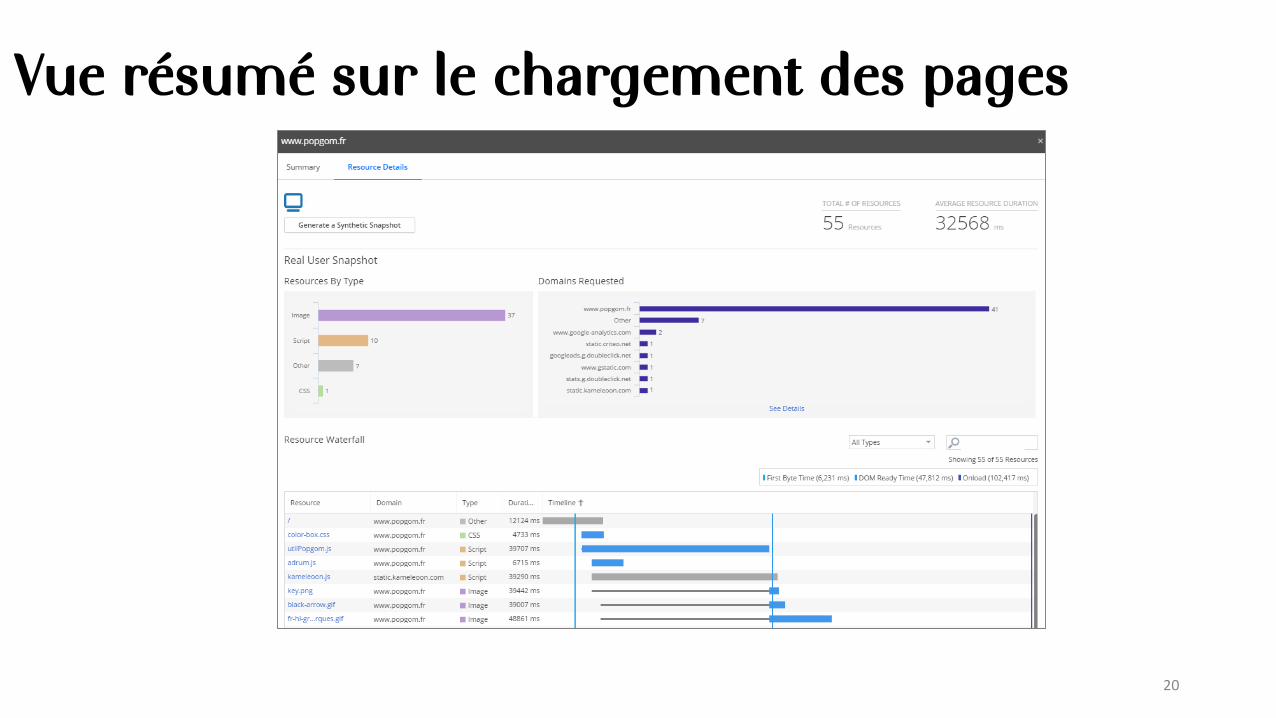
20
Vue résumé sur le chargement des pages
21
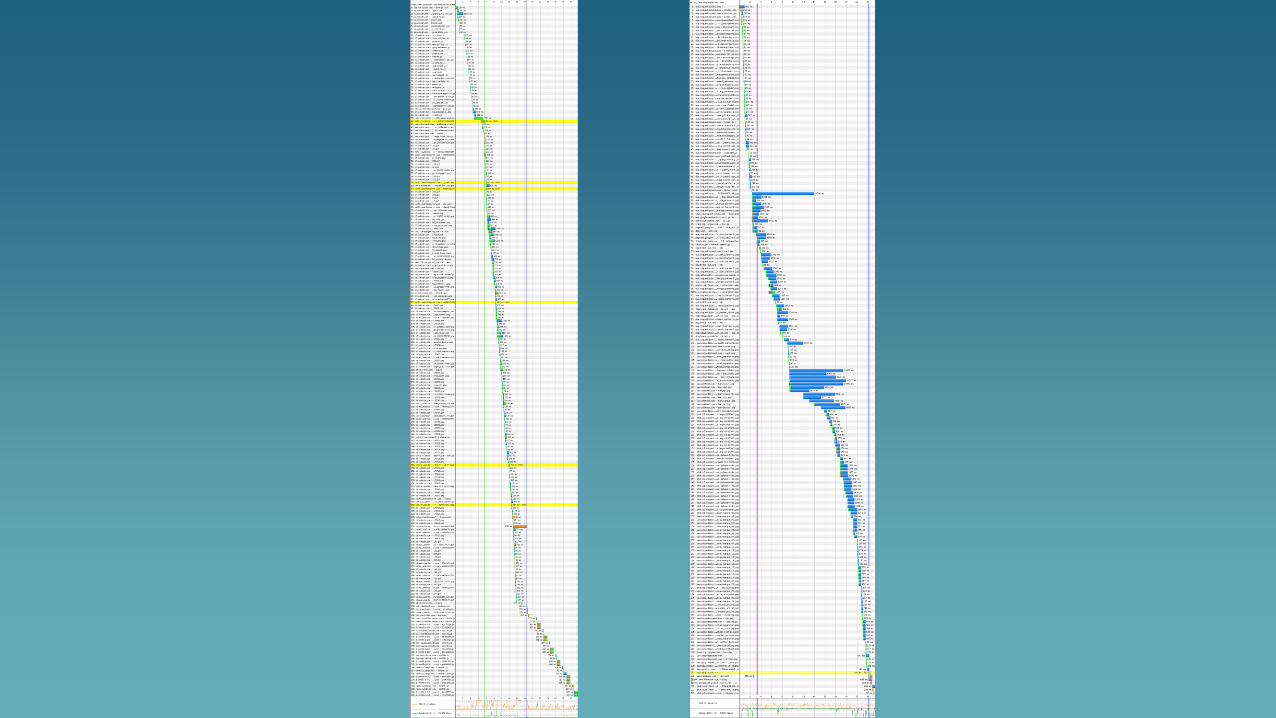
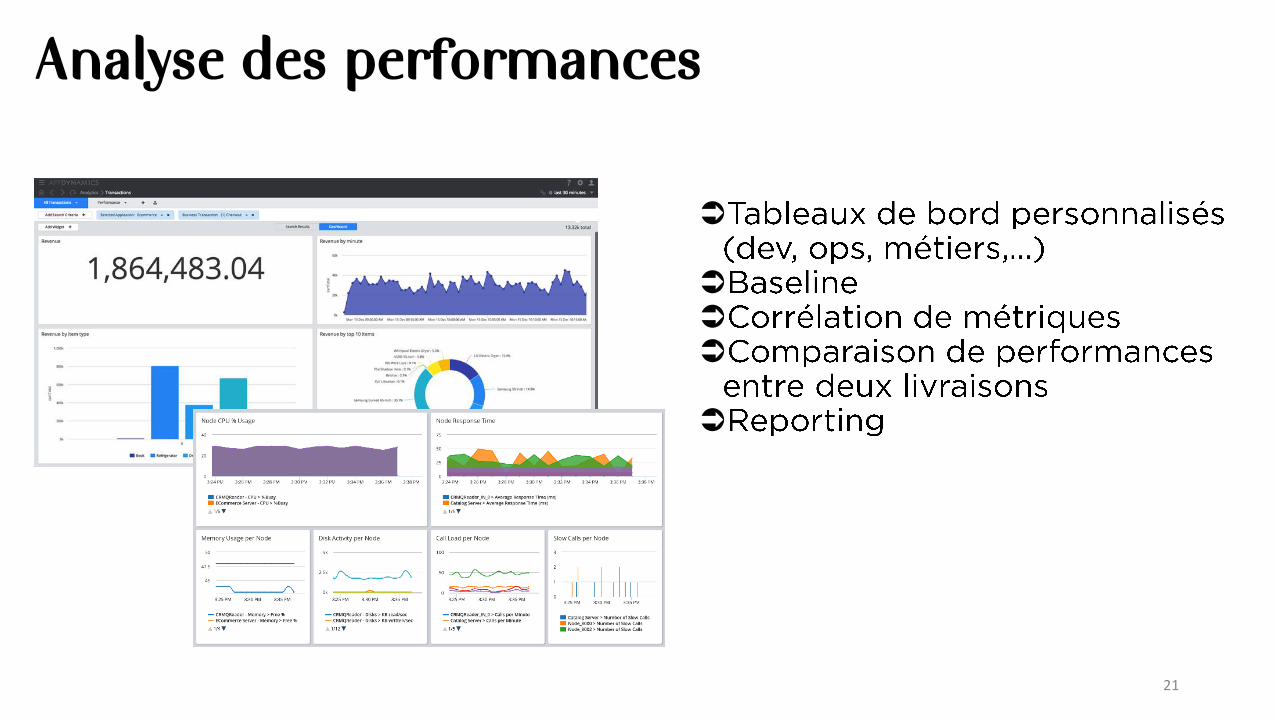
Analyse des performances

PARTIE 3: CORRELATION PERFORMANCE IT/BUSINESS
•
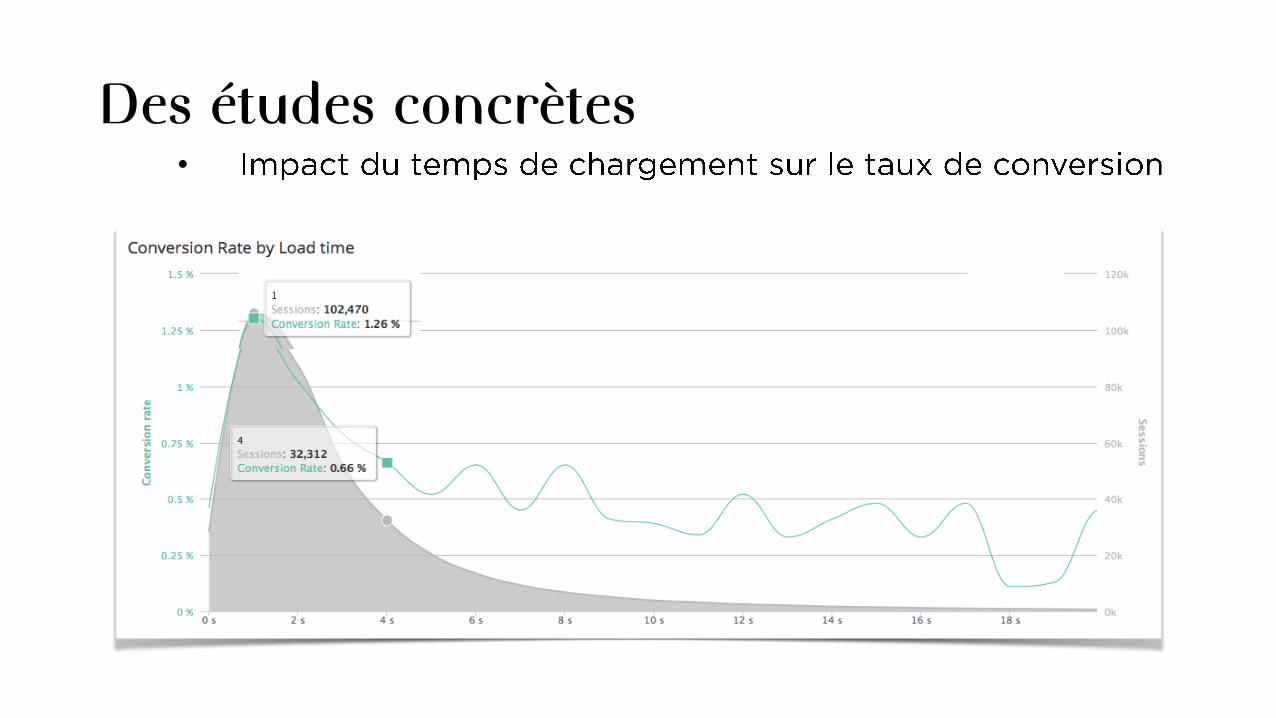
Des études concrètes

•
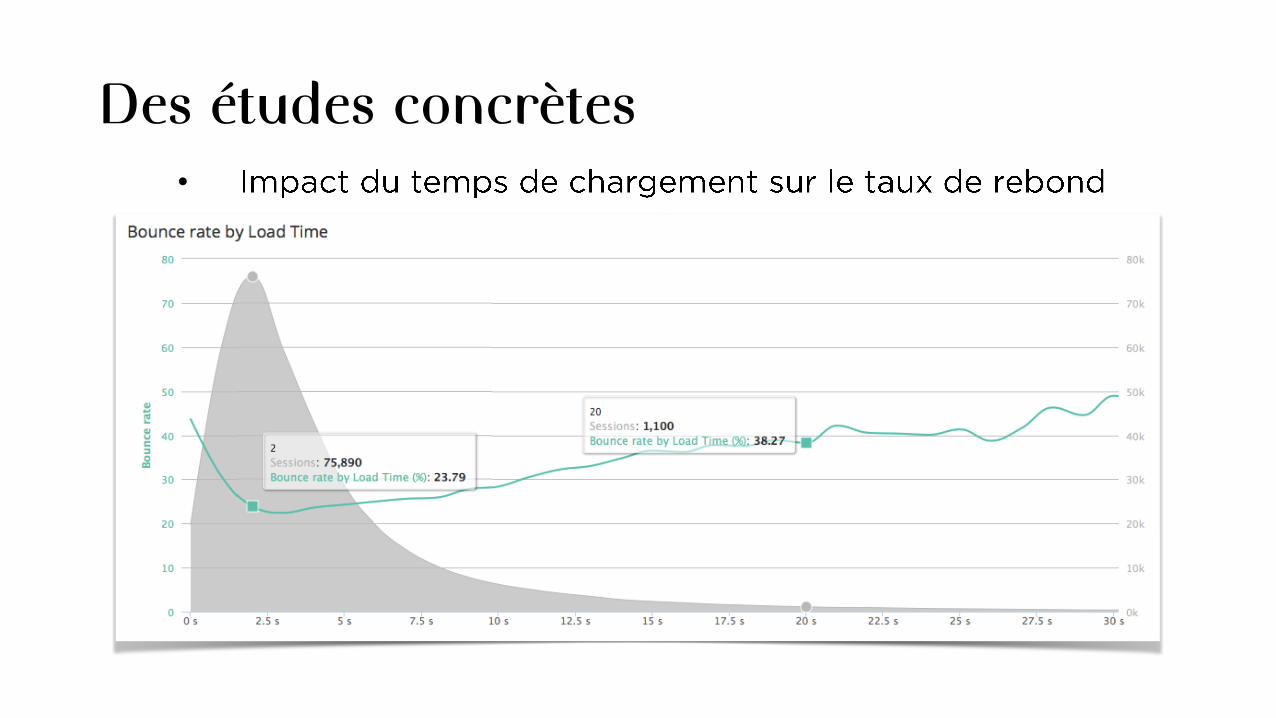
Des études concrètes
•
Des études concrètes
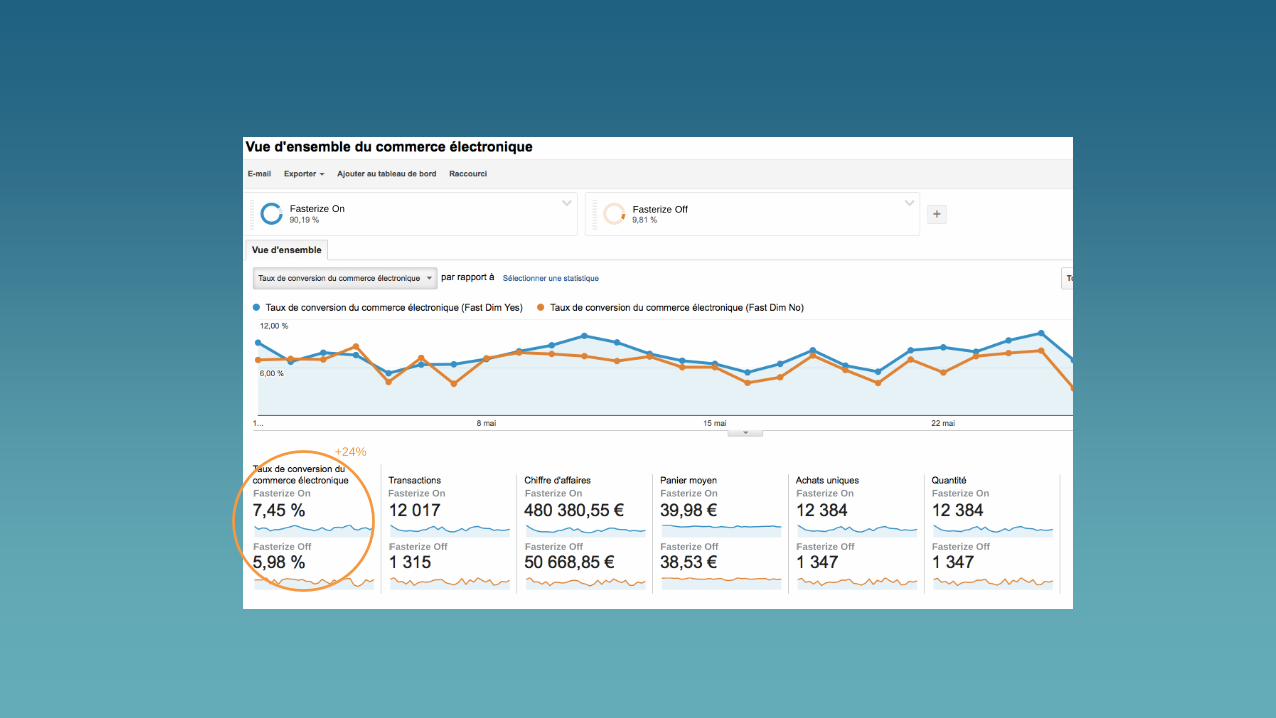
+24%
Fasterize On Fasterize Off
Fasterize On Fasterize On Fasterize On Fasterize On
Fasterize Off Fasterize Off Fasterize Off Fasterize Off
Fasterize On
Fasterize Off
Fasterize On
Fasterize Off
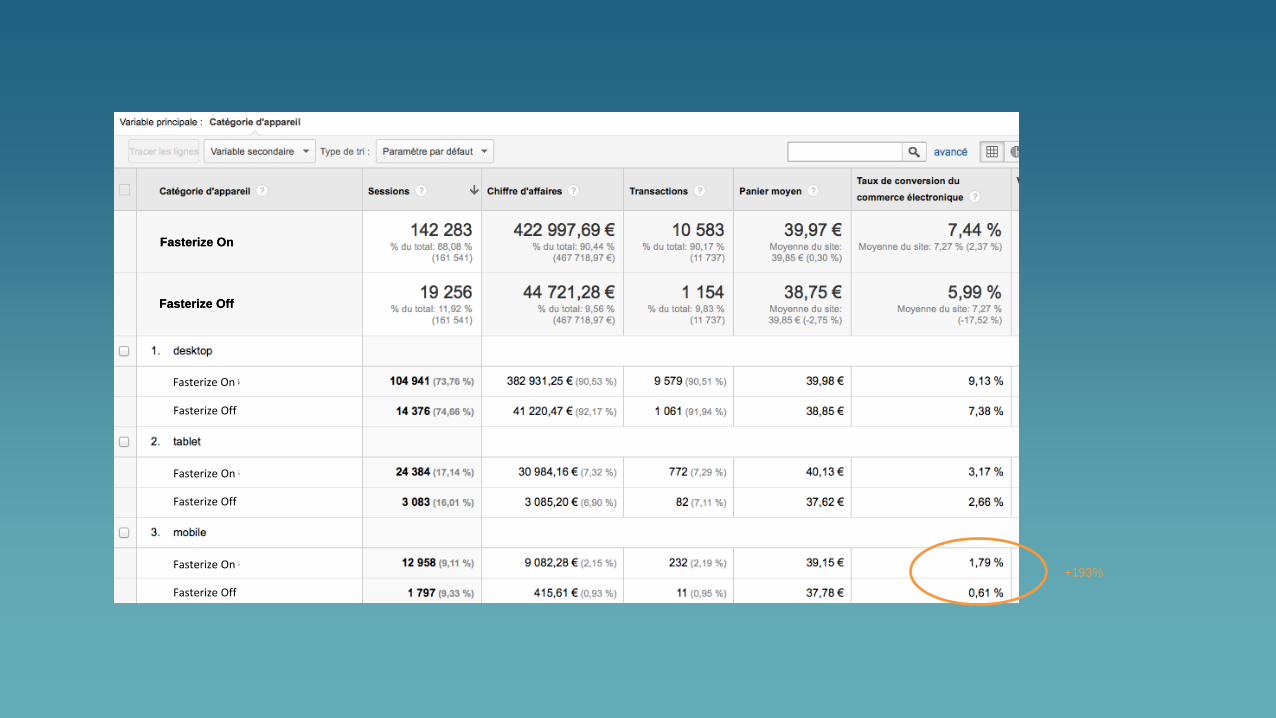
+193%
Fasterize On
Fasterize Off
Fasterize On
Fasterize Off
Fasterize On
Fasterize Off
Fasterize On
Fasterize Off

Test du Khi2

Cedexis Impact compares Page Load Time with any KPI
• Conversion Rate
• Page Views per Session
• Time on Site
• Exit/Abandon Rate
• Cart Amount (€, $, £,…)
• Cart Size (Number of items)
• Any other Custom KPI
Impact
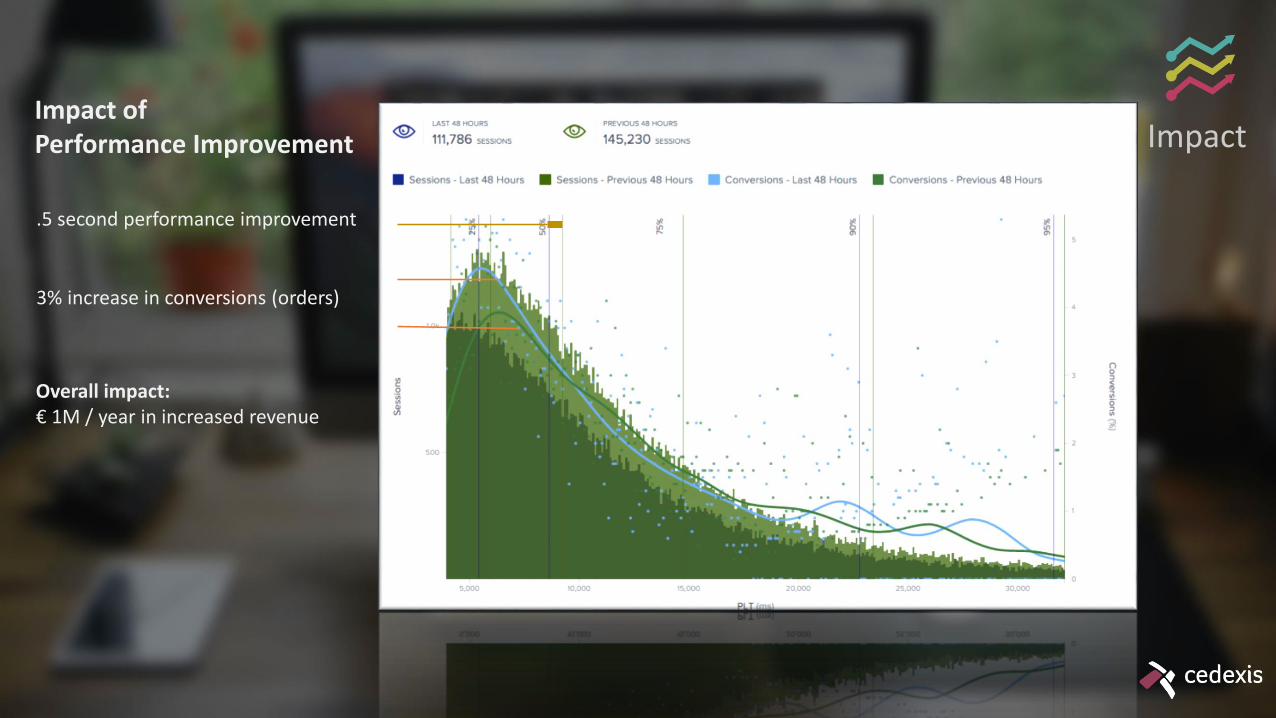
.5 second performance improvement
3% increase in conversions (orders)
Overall impact:€ 1M / year in increased revenue
Impact of Performance Improvement Impact
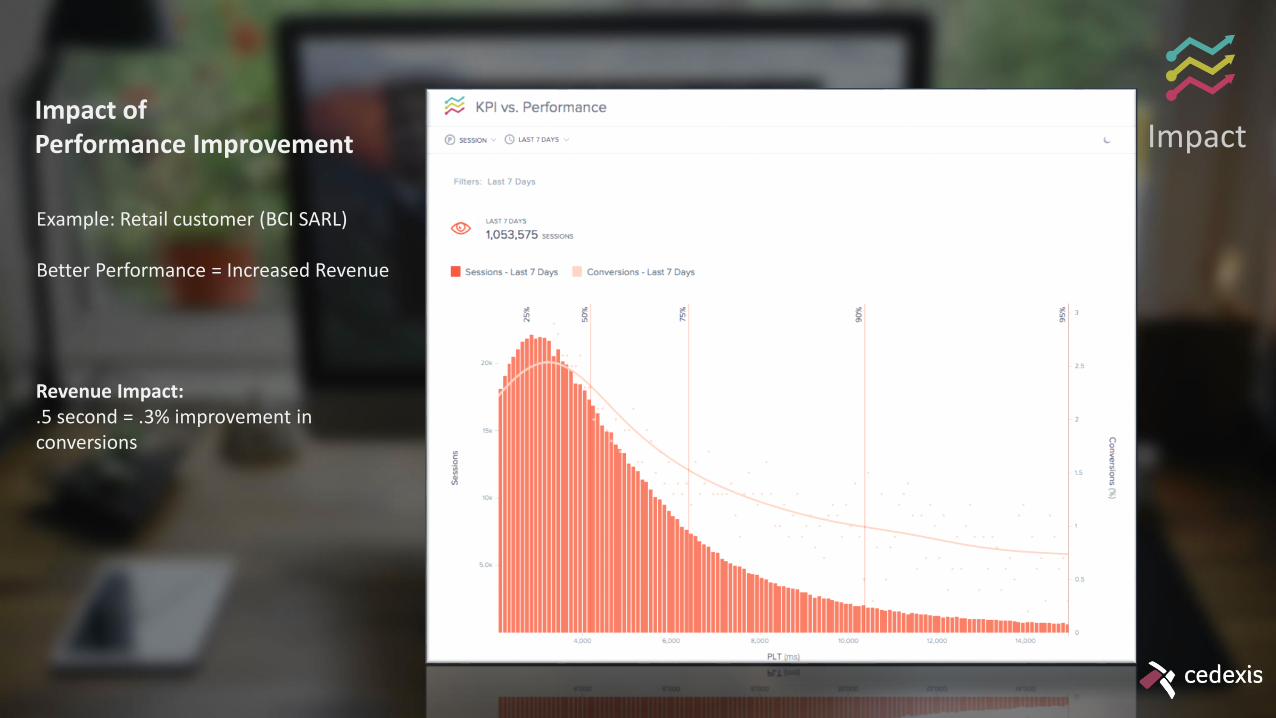
Example: Retail customer (BCI SARL)
Better Performance = Increased Revenue
Revenue Impact:.5 second = .3% improvement in conversions
Impact of Performance Improvement Impact

Example: Media customer (Le Monde)
Better Performance = Increased Conversions (5 minute sessions)
Business Impact:.5 second = 1% improvement in conversions
Impact of Performance Improvement Impact
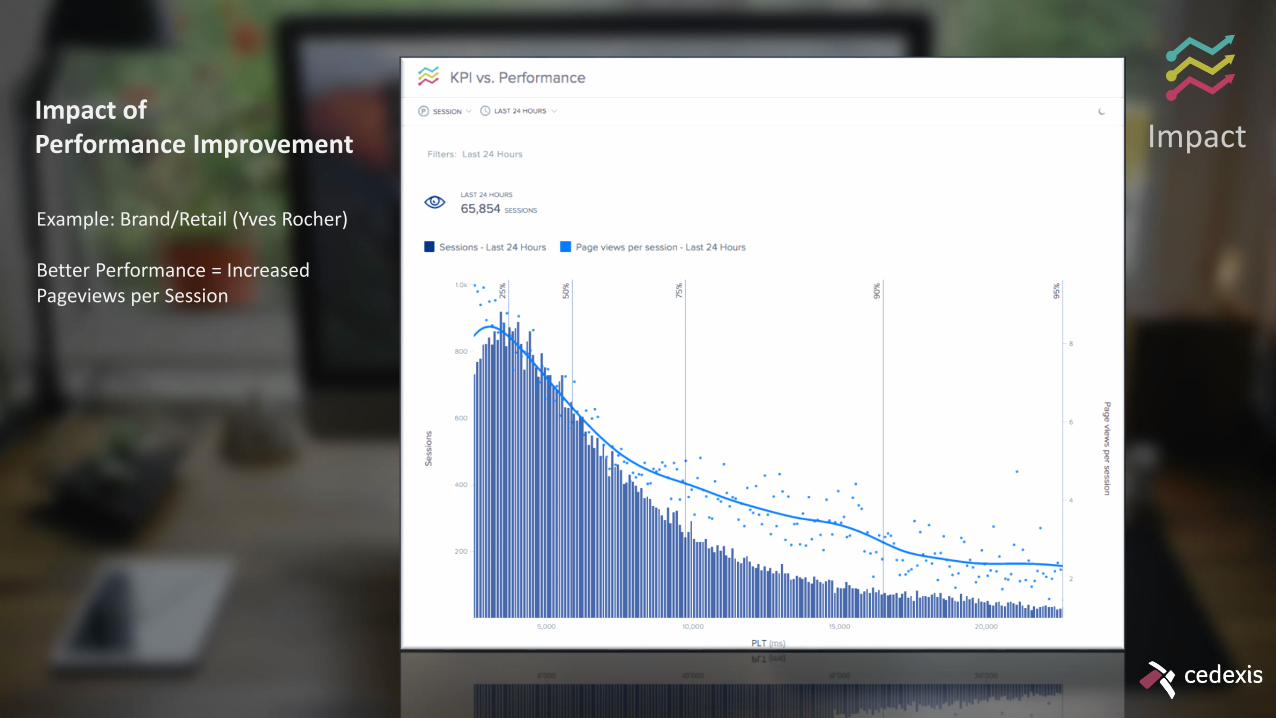
Example: Brand/Retail (Yves Rocher)
Better Performance = Increased Pageviews per Session
Impact of Performance Improvement Impact

Example: Brand/Retail (Yves Rocher)
Better Performance = Lower Bounce Rate
Impact of Performance Improvement Impact
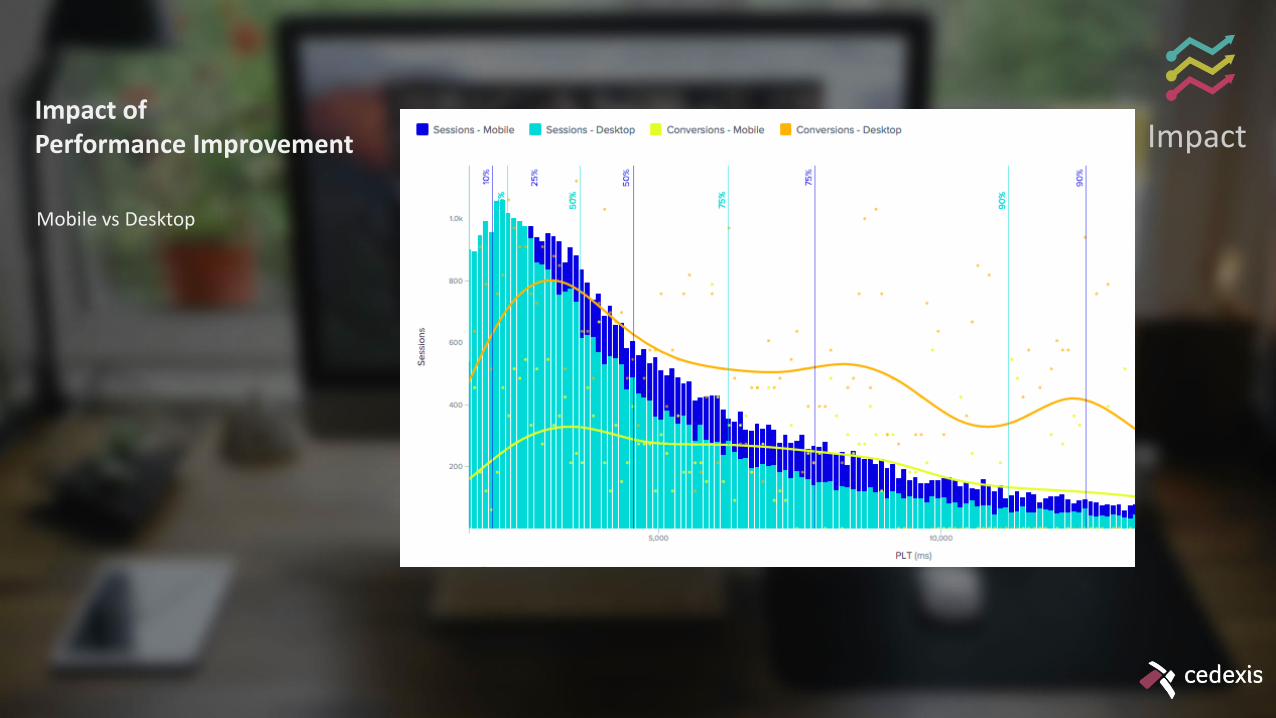
Mobile vs Desktop
Impact of Performance Improvement Impact
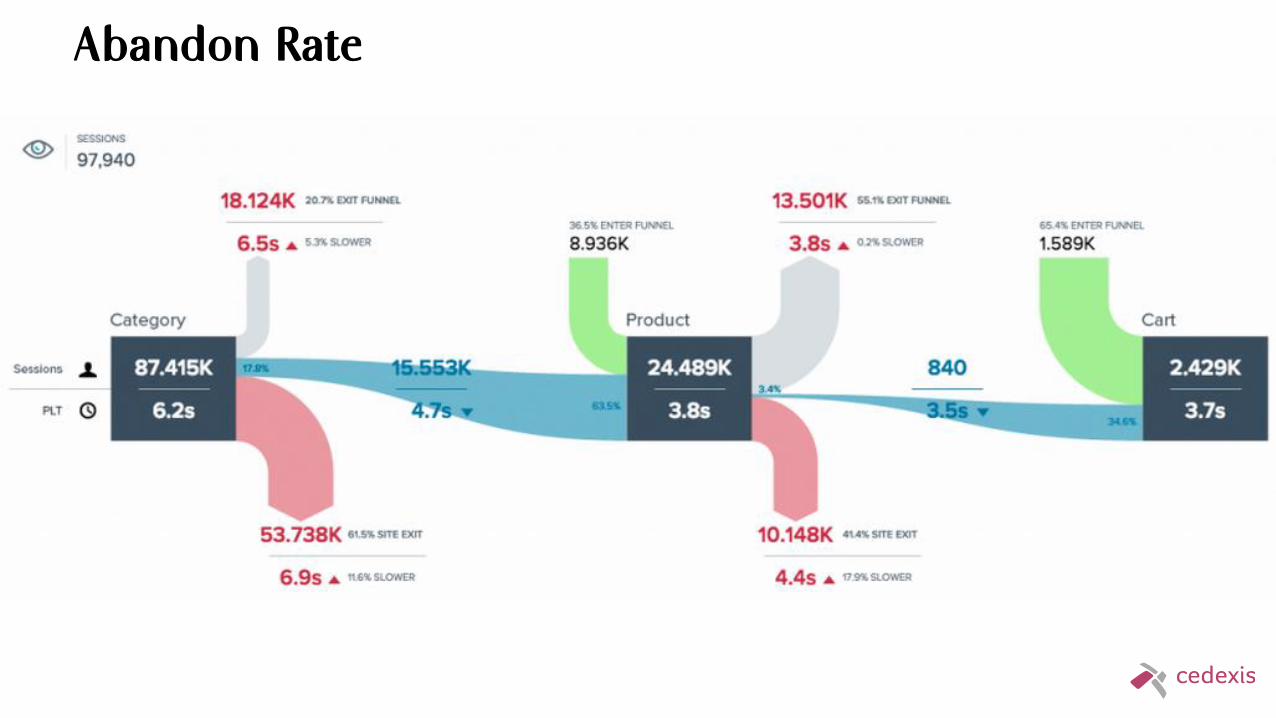
Abandon Rate

CONCLUSION

Comment accélérer ?

En résumé
•
••
••
••
•
••
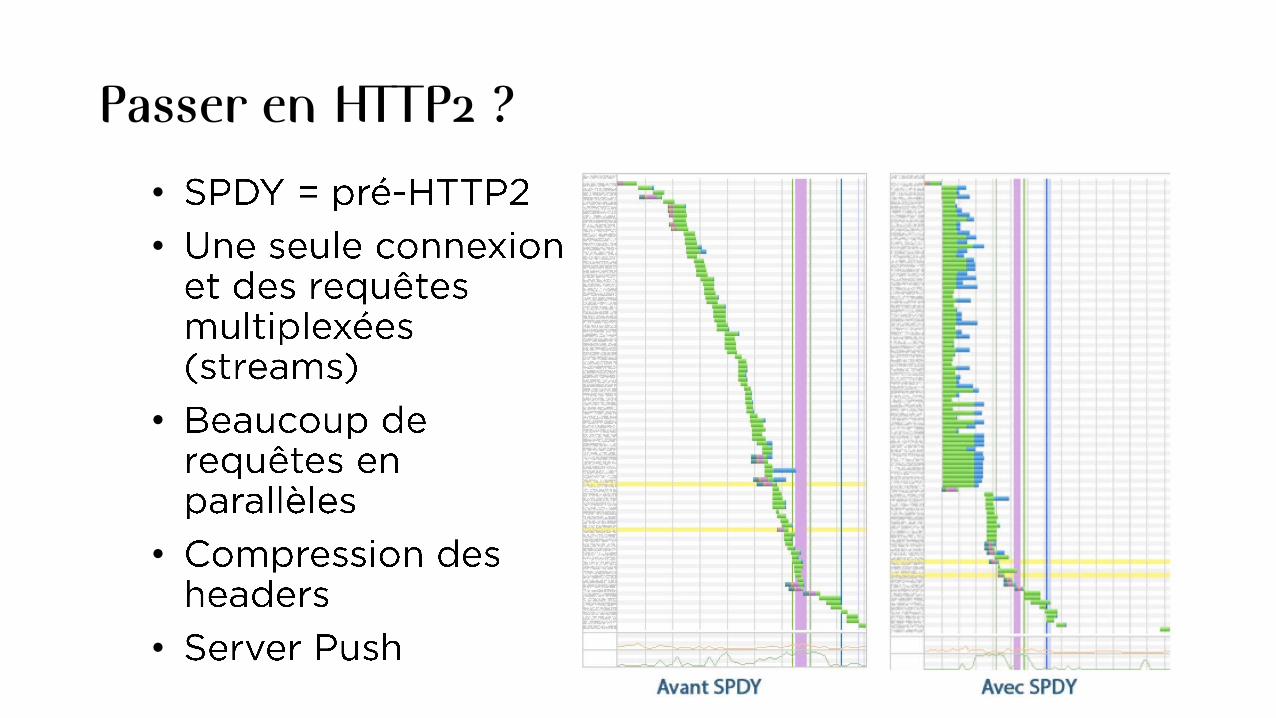
Passer en HTTP2 ?
•
•
•
•
•
44
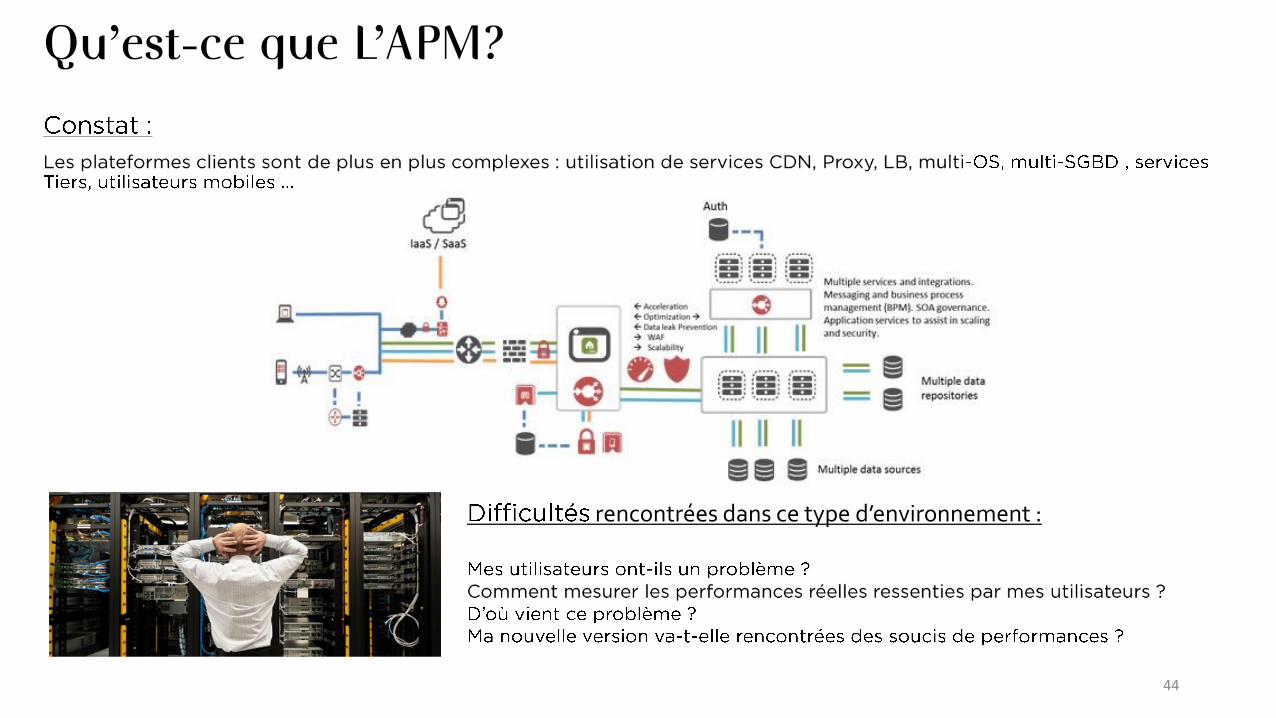
rencontrées dans ce type d’environnement :
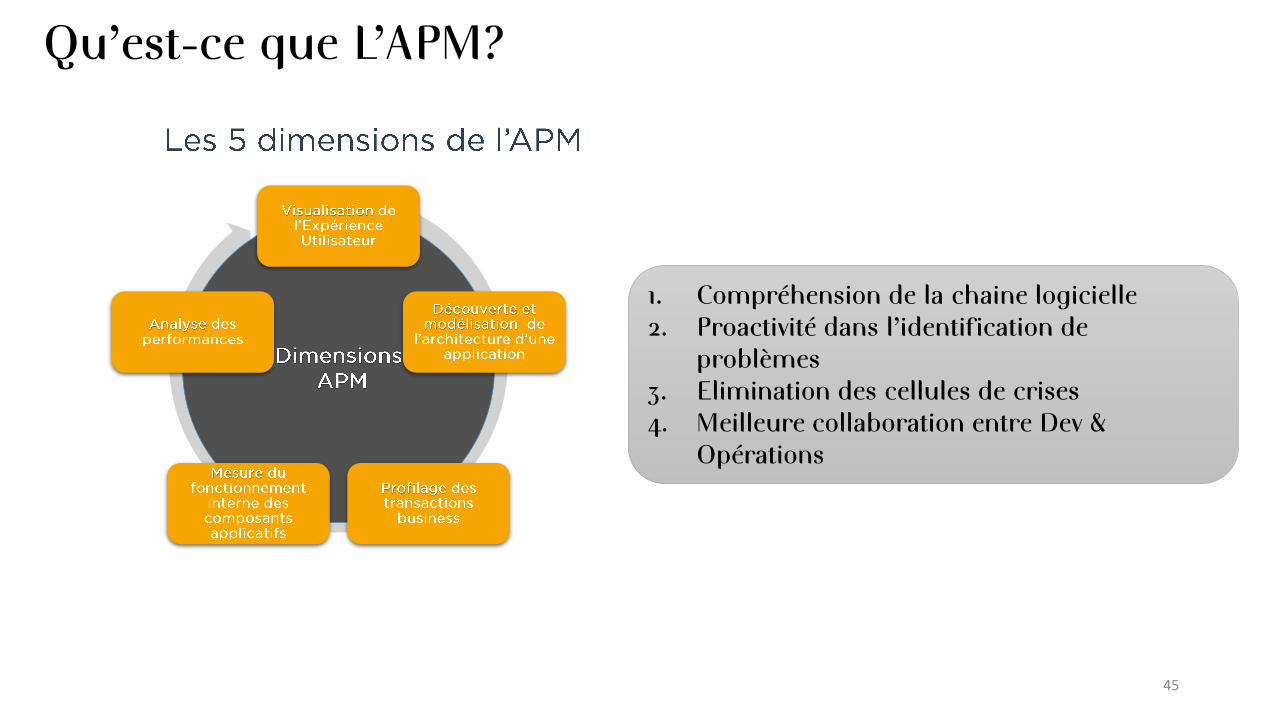
Qu’est-ce que L’APM?
45
1. Compréhension de la chaine logicielle2. Proactivité dans l’identification de
problèmes3. Elimination des cellules de crises4. Meilleure collaboration entre Dev &
Opérations
Qu’est-ce que L’APM?
46
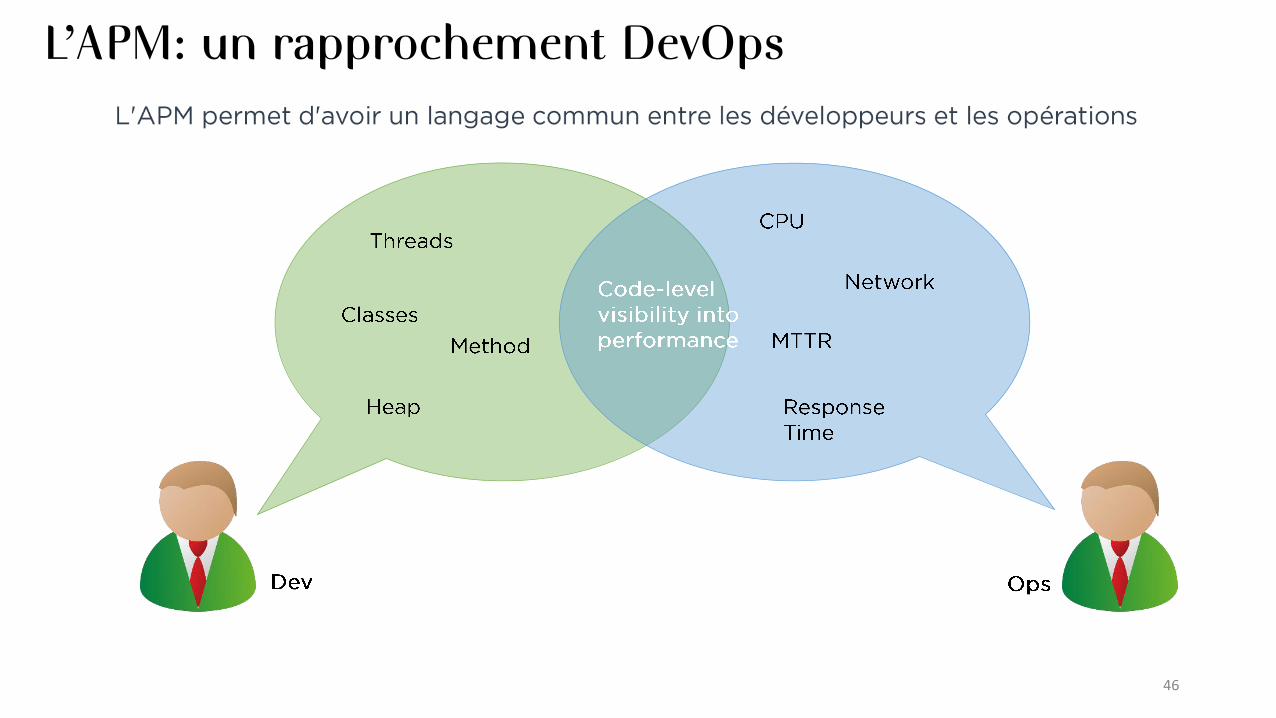
L’APM: un rapprochement DevOps

ANNEXES