table of contentstable of contents table q1 page 1 …table of contentstable of contents table q1...
TRANSCRIPT

Investor's Business Daily/TIPP PollInvestor's Business Daily/TIPP PollInvestor's Business Daily/TIPP PollInvestor's Business Daily/TIPP Poll---- December 2018, Field 11/26 to 12/2 , Sample December 2018, Field 11/26 to 12/2 , Sample December 2018, Field 11/26 to 12/2 , Sample December 2018, Field 11/26 to 12/2 , Sample ---- 823 adults, MOE +/823 adults, MOE +/823 adults, MOE +/823 adults, MOE +/----3.3 pts, Traditional phone with live interviewers 3.3 pts, Traditional phone with live interviewers 3.3 pts, Traditional phone with live interviewers 3.3 pts, Traditional phone with live interviewers TABLE OF CONTENTSTABLE OF CONTENTSTABLE OF CONTENTSTABLE OF CONTENTS Table Q1 Page 1 Q1Table Q1 Page 1 Q1Table Q1 Page 1 Q1Table Q1 Page 1 Q1 IN GENERAL, how SATISFIED are you with the DIRECTION that the country is going in at this time?IN GENERAL, how SATISFIED are you with the DIRECTION that the country is going in at this time?IN GENERAL, how SATISFIED are you with the DIRECTION that the country is going in at this time?IN GENERAL, how SATISFIED are you with the DIRECTION that the country is going in at this time? Table Q1 Page 2 Q1Table Q1 Page 2 Q1Table Q1 Page 2 Q1Table Q1 Page 2 Q1 IN GENERAL, how SATISFIED are you with the DIRECTION that the countryIN GENERAL, how SATISFIED are you with the DIRECTION that the countryIN GENERAL, how SATISFIED are you with the DIRECTION that the countryIN GENERAL, how SATISFIED are you with the DIRECTION that the country is going in at this time?is going in at this time?is going in at this time?is going in at this time? Table Q2 Page 3 Q2Table Q2 Page 3 Q2Table Q2 Page 3 Q2Table Q2 Page 3 Q2 How SATISFIED are you with the direction that the country is going in at this time in terms of MORALS How SATISFIED are you with the direction that the country is going in at this time in terms of MORALS How SATISFIED are you with the direction that the country is going in at this time in terms of MORALS How SATISFIED are you with the direction that the country is going in at this time in terms of MORALS AND ETHICS?AND ETHICS?AND ETHICS?AND ETHICS? Table Q2 PageTable Q2 PageTable Q2 PageTable Q2 Page 4 Q24 Q24 Q24 Q2 How SATISFIED are you with the direction that the country is going in at this time in terms of MORALS How SATISFIED are you with the direction that the country is going in at this time in terms of MORALS How SATISFIED are you with the direction that the country is going in at this time in terms of MORALS How SATISFIED are you with the direction that the country is going in at this time in terms of MORALS AND ETHICS?AND ETHICS?AND ETHICS?AND ETHICS? Table Q3 Page 5 Q3Table Q3 Page 5 Q3Table Q3 Page 5 Q3Table Q3 Page 5 Q3 How about tHow about tHow about tHow about the COUNTRY'S STANDING IN THE WORLD? Generally speaking, OVER THE NEXT 6 MONTHS, do you he COUNTRY'S STANDING IN THE WORLD? Generally speaking, OVER THE NEXT 6 MONTHS, do you he COUNTRY'S STANDING IN THE WORLD? Generally speaking, OVER THE NEXT 6 MONTHS, do you he COUNTRY'S STANDING IN THE WORLD? Generally speaking, OVER THE NEXT 6 MONTHS, do you think that the position of the United States as a WORLD LEADER will be BETTER, WORSE, or ABOUT THE think that the position of the United States as a WORLD LEADER will be BETTER, WORSE, or ABOUT THE think that the position of the United States as a WORLD LEADER will be BETTER, WORSE, or ABOUT THE think that the position of the United States as a WORLD LEADER will be BETTER, WORSE, or ABOUT THE SAME as nSAME as nSAME as nSAME as now?ow?ow?ow? Table Q3 Page 6 Q3Table Q3 Page 6 Q3Table Q3 Page 6 Q3Table Q3 Page 6 Q3 How about the COUNTRY'S STANDING IN THE WORLD? Generally speaking, OVER THE NEXT 6 MONTHS, do you How about the COUNTRY'S STANDING IN THE WORLD? Generally speaking, OVER THE NEXT 6 MONTHS, do you How about the COUNTRY'S STANDING IN THE WORLD? Generally speaking, OVER THE NEXT 6 MONTHS, do you How about the COUNTRY'S STANDING IN THE WORLD? Generally speaking, OVER THE NEXT 6 MONTHS, do you think that the position of the United States as a WORLD LEADER will be BETTER, WORSE, or ABOUT THE think that the position of the United States as a WORLD LEADER will be BETTER, WORSE, or ABOUT THE think that the position of the United States as a WORLD LEADER will be BETTER, WORSE, or ABOUT THE think that the position of the United States as a WORLD LEADER will be BETTER, WORSE, or ABOUT THE SAME as now?SAME as now?SAME as now?SAME as now? Table Q4 Page 7 Q4Table Q4 Page 7 Q4Table Q4 Page 7 Q4Table Q4 Page 7 Q4 How about YOUR QUALITYHow about YOUR QUALITYHow about YOUR QUALITYHow about YOUR QUALITY OF LIFE? In the NEXT 6 MONTHS, do you think that YOUR QUALITY OF LIFE will be OF LIFE? In the NEXT 6 MONTHS, do you think that YOUR QUALITY OF LIFE will be OF LIFE? In the NEXT 6 MONTHS, do you think that YOUR QUALITY OF LIFE will be OF LIFE? In the NEXT 6 MONTHS, do you think that YOUR QUALITY OF LIFE will be better,worse, or about the same as now?better,worse, or about the same as now?better,worse, or about the same as now?better,worse, or about the same as now? Table Q4 Page 8 Q4Table Q4 Page 8 Q4Table Q4 Page 8 Q4Table Q4 Page 8 Q4 How about YOUR QUALITY OF LIFE? In the NEXT 6How about YOUR QUALITY OF LIFE? In the NEXT 6How about YOUR QUALITY OF LIFE? In the NEXT 6How about YOUR QUALITY OF LIFE? In the NEXT 6 MONTHS, do you think that YOUR QUALITY OF LIFE will be MONTHS, do you think that YOUR QUALITY OF LIFE will be MONTHS, do you think that YOUR QUALITY OF LIFE will be MONTHS, do you think that YOUR QUALITY OF LIFE will be better,worse, or about the same as now?better,worse, or about the same as now?better,worse, or about the same as now?better,worse, or about the same as now? Table Q5 Page 9 Q5Table Q5 Page 9 Q5Table Q5 Page 9 Q5Table Q5 Page 9 Q5 In the NEXT 6 MONTHS, do you think that ECONOMIC CONDITIONS in the cIn the NEXT 6 MONTHS, do you think that ECONOMIC CONDITIONS in the cIn the NEXT 6 MONTHS, do you think that ECONOMIC CONDITIONS in the cIn the NEXT 6 MONTHS, do you think that ECONOMIC CONDITIONS in the country will be better, worse, or ountry will be better, worse, or ountry will be better, worse, or ountry will be better, worse, or about the same as now?about the same as now?about the same as now?about the same as now? Table Q5 Page 10 Q5Table Q5 Page 10 Q5Table Q5 Page 10 Q5Table Q5 Page 10 Q5 In the NEXT 6 MONTHS, do you think that ECONOMIC CONDITIONS in the country will be better, worse, or In the NEXT 6 MONTHS, do you think that ECONOMIC CONDITIONS in the country will be better, worse, or In the NEXT 6 MONTHS, do you think that ECONOMIC CONDITIONS in the country will be better, worse, or In the NEXT 6 MONTHS, do you think that ECONOMIC CONDITIONS in the country will be better, worse, or about the same as now?about the same as now?about the same as now?about the same as now? Table Q6 Page 11 Q6Table Q6 Page 11 Q6Table Q6 Page 11 Q6Table Q6 Page 11 Q6 In the NEXT 6 MONTHS, do you think that YOUR PERSONAL FINANCIAL SITUATION will be better, worse, or In the NEXT 6 MONTHS, do you think that YOUR PERSONAL FINANCIAL SITUATION will be better, worse, or In the NEXT 6 MONTHS, do you think that YOUR PERSONAL FINANCIAL SITUATION will be better, worse, or In the NEXT 6 MONTHS, do you think that YOUR PERSONAL FINANCIAL SITUATION will be better, worse, or about the same as about the same as about the same as about the same as now?now?now?now? Table Q6 Page 12 Q6Table Q6 Page 12 Q6Table Q6 Page 12 Q6Table Q6 Page 12 Q6 In the NEXT 6 MONTHS, do you think that YOUR PERSONAL FINANCIAL SITUATION will be better, worse, or In the NEXT 6 MONTHS, do you think that YOUR PERSONAL FINANCIAL SITUATION will be better, worse, or In the NEXT 6 MONTHS, do you think that YOUR PERSONAL FINANCIAL SITUATION will be better, worse, or In the NEXT 6 MONTHS, do you think that YOUR PERSONAL FINANCIAL SITUATION will be better, worse, or about the same as now?about the same as now?about the same as now?about the same as now? Table Q7 Page 13 Q7Table Q7 Page 13 Q7Table Q7 Page 13 Q7Table Q7 Page 13 Q7 How SATISFIED are you with the current FEDERAL ECONOMIC POLICIES meant to keep the economy going in How SATISFIED are you with the current FEDERAL ECONOMIC POLICIES meant to keep the economy going in How SATISFIED are you with the current FEDERAL ECONOMIC POLICIES meant to keep the economy going in How SATISFIED are you with the current FEDERAL ECONOMIC POLICIES meant to keep the economy going in the right direction?the right direction?the right direction?the right direction?

Investor's Business Daily/TIPP PollInvestor's Business Daily/TIPP PollInvestor's Business Daily/TIPP PollInvestor's Business Daily/TIPP Poll---- December 2018, Field 11/26 to 12/2 ,December 2018, Field 11/26 to 12/2 ,December 2018, Field 11/26 to 12/2 ,December 2018, Field 11/26 to 12/2 , Sample Sample Sample Sample ---- 823 adults, MOE +/823 adults, MOE +/823 adults, MOE +/823 adults, MOE +/----3.3 pts, Traditional phone with live interviewers 3.3 pts, Traditional phone with live interviewers 3.3 pts, Traditional phone with live interviewers 3.3 pts, Traditional phone with live interviewers TABLE OF CONTENTSTABLE OF CONTENTSTABLE OF CONTENTSTABLE OF CONTENTS Table Q7 Page 14 Q7Table Q7 Page 14 Q7Table Q7 Page 14 Q7Table Q7 Page 14 Q7 How SATISFIED are you with the current FEDERAL ECONOMIC POLICIES meant to keep the economy goHow SATISFIED are you with the current FEDERAL ECONOMIC POLICIES meant to keep the economy goHow SATISFIED are you with the current FEDERAL ECONOMIC POLICIES meant to keep the economy goHow SATISFIED are you with the current FEDERAL ECONOMIC POLICIES meant to keep the economy going in ing in ing in ing in the right direction?the right direction?the right direction?the right direction? Table Q8 Page 15 Q8Table Q8 Page 15 Q8Table Q8 Page 15 Q8Table Q8 Page 15 Q8 Now moving on to the topic of PRESIDENTIAL LEADERSHIP. Overall, is your opinion of Donald Trump Now moving on to the topic of PRESIDENTIAL LEADERSHIP. Overall, is your opinion of Donald Trump Now moving on to the topic of PRESIDENTIAL LEADERSHIP. Overall, is your opinion of Donald Trump Now moving on to the topic of PRESIDENTIAL LEADERSHIP. Overall, is your opinion of Donald Trump generally generally generally generally FAVORABLE, generally UNFAVORABLE, or are you NOT FAMILIAR ENOUGH to say one way or the other?FAVORABLE, generally UNFAVORABLE, or are you NOT FAMILIAR ENOUGH to say one way or the other?FAVORABLE, generally UNFAVORABLE, or are you NOT FAMILIAR ENOUGH to say one way or the other?FAVORABLE, generally UNFAVORABLE, or are you NOT FAMILIAR ENOUGH to say one way or the other? Table Q8 Page 16 Q8Table Q8 Page 16 Q8Table Q8 Page 16 Q8Table Q8 Page 16 Q8 Now moving on to the topic of PRESIDENTIAL LEADERSHIP. Overall, is your opinion of Donald Trump Now moving on to the topic of PRESIDENTIAL LEADERSHIP. Overall, is your opinion of Donald Trump Now moving on to the topic of PRESIDENTIAL LEADERSHIP. Overall, is your opinion of Donald Trump Now moving on to the topic of PRESIDENTIAL LEADERSHIP. Overall, is your opinion of Donald Trump generally FAVORABLE, generally UNFAVORABLE, or are you NOT FAMILIAR ENOUGH to say one way or the other?generally FAVORABLE, generally UNFAVORABLE, or are you NOT FAMILIAR ENOUGH to say one way or the other?generally FAVORABLE, generally UNFAVORABLE, or are you NOT FAMILIAR ENOUGH to say one way or the other?generally FAVORABLE, generally UNFAVORABLE, or are you NOT FAMILIAR ENOUGH to say one way or the other? Table Q9 Page 17 Q9Table Q9 Page 17 Q9Table Q9 Page 17 Q9Table Q9 Page 17 Q9 In general, do you APPROVE or DISAPPROVE of the way Donald TrumpIn general, do you APPROVE or DISAPPROVE of the way Donald TrumpIn general, do you APPROVE or DISAPPROVE of the way Donald TrumpIn general, do you APPROVE or DISAPPROVE of the way Donald Trump is handling his job as president, or is handling his job as president, or is handling his job as president, or is handling his job as president, or are you not familiar enough to say one way or the other?are you not familiar enough to say one way or the other?are you not familiar enough to say one way or the other?are you not familiar enough to say one way or the other? Table Q9 Page 18 Q9Table Q9 Page 18 Q9Table Q9 Page 18 Q9Table Q9 Page 18 Q9 In general, do you APPROVE or DISAPPROVE of the way Donald Trump is hIn general, do you APPROVE or DISAPPROVE of the way Donald Trump is hIn general, do you APPROVE or DISAPPROVE of the way Donald Trump is hIn general, do you APPROVE or DISAPPROVE of the way Donald Trump is handling his job as president, or andling his job as president, or andling his job as president, or andling his job as president, or are you not familiar enough to say one way or the other?are you not familiar enough to say one way or the other?are you not familiar enough to say one way or the other?are you not familiar enough to say one way or the other? Table Q10 Page 19 Q10Table Q10 Page 19 Q10Table Q10 Page 19 Q10Table Q10 Page 19 Q10 How would you describe the LEADERSHIP that President Trump is providing for the country? How would you describe the LEADERSHIP that President Trump is providing for the country? How would you describe the LEADERSHIP that President Trump is providing for the country? How would you describe the LEADERSHIP that President Trump is providing for the country? Table Q10 Page 20 Q10Table Q10 Page 20 Q10Table Q10 Page 20 Q10Table Q10 Page 20 Q10 How would you describe the LEADERSHIP that President Trump is providing foHow would you describe the LEADERSHIP that President Trump is providing foHow would you describe the LEADERSHIP that President Trump is providing foHow would you describe the LEADERSHIP that President Trump is providing for the country? r the country? r the country? r the country? Table Q11 Page 21 Q11Table Q11 Page 21 Q11Table Q11 Page 21 Q11Table Q11 Page 21 Q11 Thinking of your personal finances, compared to the past three months, do you feel MORE stressed these Thinking of your personal finances, compared to the past three months, do you feel MORE stressed these Thinking of your personal finances, compared to the past three months, do you feel MORE stressed these Thinking of your personal finances, compared to the past three months, do you feel MORE stressed these days, LESS stressed these days, or feel the days, LESS stressed these days, or feel the days, LESS stressed these days, or feel the days, LESS stressed these days, or feel the same level of stress?same level of stress?same level of stress?same level of stress? Table Q11 Page 22 Q11Table Q11 Page 22 Q11Table Q11 Page 22 Q11Table Q11 Page 22 Q11 Thinking of your personal finances, compared to the past three months, do you feel MORE stressed these Thinking of your personal finances, compared to the past three months, do you feel MORE stressed these Thinking of your personal finances, compared to the past three months, do you feel MORE stressed these Thinking of your personal finances, compared to the past three months, do you feel MORE stressed these days, LESS stressed these days, or feedays, LESS stressed these days, or feedays, LESS stressed these days, or feedays, LESS stressed these days, or feel the same level of stress?l the same level of stress?l the same level of stress?l the same level of stress? Table Rx Page 23 RXTable Rx Page 23 RXTable Rx Page 23 RXTable Rx Page 23 RX How would you grade his performance: SUMMARY (EXCELLENT OR GOOD)How would you grade his performance: SUMMARY (EXCELLENT OR GOOD)How would you grade his performance: SUMMARY (EXCELLENT OR GOOD)How would you grade his performance: SUMMARY (EXCELLENT OR GOOD) Table Rx Page 24 RXTable Rx Page 24 RXTable Rx Page 24 RXTable Rx Page 24 RX How would you grade his performance: SUHow would you grade his performance: SUHow would you grade his performance: SUHow would you grade his performance: SUMMARY (EXCELLENT OR GOOD)MMARY (EXCELLENT OR GOOD)MMARY (EXCELLENT OR GOOD)MMARY (EXCELLENT OR GOOD) Table R2 Page 25 R2Table R2 Page 25 R2Table R2 Page 25 R2Table R2 Page 25 R2 How would you grade his performance: HANDLING OF THE ECONOMYHow would you grade his performance: HANDLING OF THE ECONOMYHow would you grade his performance: HANDLING OF THE ECONOMYHow would you grade his performance: HANDLING OF THE ECONOMY Table R2 Page 27 R2Table R2 Page 27 R2Table R2 Page 27 R2Table R2 Page 27 R2 How would you grade his performance: HANDLIHow would you grade his performance: HANDLIHow would you grade his performance: HANDLIHow would you grade his performance: HANDLING OF THE ECONOMYNG OF THE ECONOMYNG OF THE ECONOMYNG OF THE ECONOMY Table R17 Page 29 R17Table R17 Page 29 R17Table R17 Page 29 R17Table R17 Page 29 R17 How would you grade his performance: HANDLING THE SITUATION AT THE SOUTHERN BORDERHow would you grade his performance: HANDLING THE SITUATION AT THE SOUTHERN BORDERHow would you grade his performance: HANDLING THE SITUATION AT THE SOUTHERN BORDERHow would you grade his performance: HANDLING THE SITUATION AT THE SOUTHERN BORDER Table R17 Page 31 R17Table R17 Page 31 R17Table R17 Page 31 R17Table R17 Page 31 R17 How would you grade his performance: HANDLING THE SITUATION AT THE SOUTHERN BORDERHow would you grade his performance: HANDLING THE SITUATION AT THE SOUTHERN BORDERHow would you grade his performance: HANDLING THE SITUATION AT THE SOUTHERN BORDERHow would you grade his performance: HANDLING THE SITUATION AT THE SOUTHERN BORDER

Investor's Business Daily/TIPP PollInvestor's Business Daily/TIPP PollInvestor's Business Daily/TIPP PollInvestor's Business Daily/TIPP Poll---- December 2018, Field 11/26 to 12/2 , Sample December 2018, Field 11/26 to 12/2 , Sample December 2018, Field 11/26 to 12/2 , Sample December 2018, Field 11/26 to 12/2 , Sample ---- 823 adults, MOE +/823 adults, MOE +/823 adults, MOE +/823 adults, MOE +/----3.3 pts, Traditional phone with live i3.3 pts, Traditional phone with live i3.3 pts, Traditional phone with live i3.3 pts, Traditional phone with live interviewers nterviewers nterviewers nterviewers TABLE OF CONTENTSTABLE OF CONTENTSTABLE OF CONTENTSTABLE OF CONTENTS Table R20 Page 33 R20Table R20 Page 33 R20Table R20 Page 33 R20Table R20 Page 33 R20 How would you grade his How would you grade his How would you grade his How would you grade his -------- OVERALL PERFORMANCE So FarOVERALL PERFORMANCE So FarOVERALL PERFORMANCE So FarOVERALL PERFORMANCE So Far Table R20 Page 35 R20Table R20 Page 35 R20Table R20 Page 35 R20Table R20 Page 35 R20 How would you grade his How would you grade his How would you grade his How would you grade his -------- OVERALL PERFORMOVERALL PERFORMOVERALL PERFORMOVERALL PERFORMANCE So FarANCE So FarANCE So FarANCE So Far Table E1 Page 37 E1Table E1 Page 37 E1Table E1 Page 37 E1Table E1 Page 37 E1 Do you think that the U.S. economy is currently in a recession or not?Do you think that the U.S. economy is currently in a recession or not?Do you think that the U.S. economy is currently in a recession or not?Do you think that the U.S. economy is currently in a recession or not? Table E1 Page 38 E1Table E1 Page 38 E1Table E1 Page 38 E1Table E1 Page 38 E1 Do you think that the U.S. economy is currently iDo you think that the U.S. economy is currently iDo you think that the U.S. economy is currently iDo you think that the U.S. economy is currently in a recession or not?n a recession or not?n a recession or not?n a recession or not? Table E2 Page 39 E2Table E2 Page 39 E2Table E2 Page 39 E2Table E2 Page 39 E2 Generally speaking do you think the U.S. economy is improving or not improving?Generally speaking do you think the U.S. economy is improving or not improving?Generally speaking do you think the U.S. economy is improving or not improving?Generally speaking do you think the U.S. economy is improving or not improving? Table E2 Page 40 E2Table E2 Page 40 E2Table E2 Page 40 E2Table E2 Page 40 E2 Generally speaking do you think the U.S. economy is improving or not improving?Generally speaking do you think the U.S. economy is improving or not improving?Generally speaking do you think the U.S. economy is improving or not improving?Generally speaking do you think the U.S. economy is improving or not improving? Table E3 Page 41 E3Table E3 Page 41 E3Table E3 Page 41 E3Table E3 Page 41 E3 How concerned are you that the economy will be able to maintain its current level of How concerned are you that the economy will be able to maintain its current level of How concerned are you that the economy will be able to maintain its current level of How concerned are you that the economy will be able to maintain its current level of performance in performance in performance in performance in the next six months? the next six months? the next six months? the next six months? Table E3 Page 42 E3Table E3 Page 42 E3Table E3 Page 42 E3Table E3 Page 42 E3 How concerned are you that the economy will be able to maintain its current level of performance in How concerned are you that the economy will be able to maintain its current level of performance in How concerned are you that the economy will be able to maintain its current level of performance in How concerned are you that the economy will be able to maintain its current level of performance in the next six months? the next six months? the next six months? the next six months? Table I1A Page 43 I1ATable I1A Page 43 I1ATable I1A Page 43 I1ATable I1A Page 43 I1A Which of the following issues should be given the HIGHEST priority by Congress in the new year?Which of the following issues should be given the HIGHEST priority by Congress in the new year?Which of the following issues should be given the HIGHEST priority by Congress in the new year?Which of the following issues should be given the HIGHEST priority by Congress in the new year? Table I1A Page 45 I1ATable I1A Page 45 I1ATable I1A Page 45 I1ATable I1A Page 45 I1A Which of Which of Which of Which of the following issues should be given the HIGHEST priority by Congress in the new year?the following issues should be given the HIGHEST priority by Congress in the new year?the following issues should be given the HIGHEST priority by Congress in the new year?the following issues should be given the HIGHEST priority by Congress in the new year? Table I1B Page 47 I1BTable I1B Page 47 I1BTable I1B Page 47 I1BTable I1B Page 47 I1B Which of these issues should be given the SECOND HIGHEST priority by Congress at the start of 2019?Which of these issues should be given the SECOND HIGHEST priority by Congress at the start of 2019?Which of these issues should be given the SECOND HIGHEST priority by Congress at the start of 2019?Which of these issues should be given the SECOND HIGHEST priority by Congress at the start of 2019? TableTableTableTable I1B Page 49 I1BI1B Page 49 I1BI1B Page 49 I1BI1B Page 49 I1B Which of these issues should be given the SECOND HIGHEST priority by Congress at the start of 2019?Which of these issues should be given the SECOND HIGHEST priority by Congress at the start of 2019?Which of these issues should be given the SECOND HIGHEST priority by Congress at the start of 2019?Which of these issues should be given the SECOND HIGHEST priority by Congress at the start of 2019? Table I1C Page 51 I1CTable I1C Page 51 I1CTable I1C Page 51 I1CTable I1C Page 51 I1C Which of these issues should be giveWhich of these issues should be giveWhich of these issues should be giveWhich of these issues should be given the SECOND HIGHEST priority by Congress at the start of 2019? n the SECOND HIGHEST priority by Congress at the start of 2019? n the SECOND HIGHEST priority by Congress at the start of 2019? n the SECOND HIGHEST priority by Congress at the start of 2019? (Combined)(Combined)(Combined)(Combined) Table I1C Page 53 I1CTable I1C Page 53 I1CTable I1C Page 53 I1CTable I1C Page 53 I1C Which of these issues should be given the SECOND HIGHEST priority by Congress at the start of 2019? Which of these issues should be given the SECOND HIGHEST priority by Congress at the start of 2019? Which of these issues should be given the SECOND HIGHEST priority by Congress at the start of 2019? Which of these issues should be given the SECOND HIGHEST priority by Congress at the start of 2019? (Combined)(Combined)(Combined)(Combined) Table T1 Page 55 T1Table T1 Page 55 T1Table T1 Page 55 T1Table T1 Page 55 T1 How likely is it that thHow likely is it that thHow likely is it that thHow likely is it that the U.S. and China will be able to reach a trade deal in the near future?e U.S. and China will be able to reach a trade deal in the near future?e U.S. and China will be able to reach a trade deal in the near future?e U.S. and China will be able to reach a trade deal in the near future? Table T1 Page 56 T1Table T1 Page 56 T1Table T1 Page 56 T1Table T1 Page 56 T1 How likely is it that the U.S. and China will be able to reach a trade deal in the near future?How likely is it that the U.S. and China will be able to reach a trade deal in the near future?How likely is it that the U.S. and China will be able to reach a trade deal in the near future?How likely is it that the U.S. and China will be able to reach a trade deal in the near future?
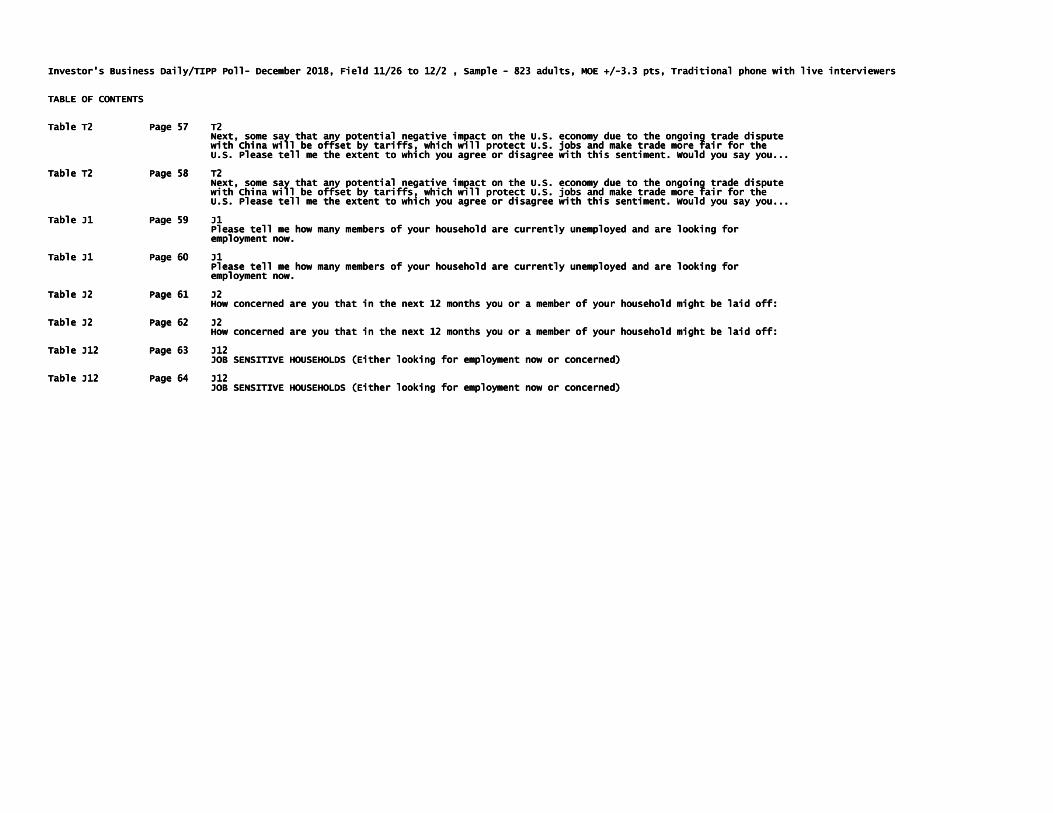
Investor's Business DaiInvestor's Business DaiInvestor's Business DaiInvestor's Business Daily/TIPP Pollly/TIPP Pollly/TIPP Pollly/TIPP Poll---- December 2018, Field 11/26 to 12/2 , Sample December 2018, Field 11/26 to 12/2 , Sample December 2018, Field 11/26 to 12/2 , Sample December 2018, Field 11/26 to 12/2 , Sample ---- 823 adults, MOE +/823 adults, MOE +/823 adults, MOE +/823 adults, MOE +/----3.3 pts, Traditional phone with live interviewers 3.3 pts, Traditional phone with live interviewers 3.3 pts, Traditional phone with live interviewers 3.3 pts, Traditional phone with live interviewers TABLE OF CONTENTSTABLE OF CONTENTSTABLE OF CONTENTSTABLE OF CONTENTS Table T2 Page 57 T2Table T2 Page 57 T2Table T2 Page 57 T2Table T2 Page 57 T2 Next, some say that any potential negative Next, some say that any potential negative Next, some say that any potential negative Next, some say that any potential negative impact on the U.S. economy due to the ongoing trade dispute impact on the U.S. economy due to the ongoing trade dispute impact on the U.S. economy due to the ongoing trade dispute impact on the U.S. economy due to the ongoing trade dispute with China will be offset by tariffs, which will protect U.S. jobs and make trade more fair for the with China will be offset by tariffs, which will protect U.S. jobs and make trade more fair for the with China will be offset by tariffs, which will protect U.S. jobs and make trade more fair for the with China will be offset by tariffs, which will protect U.S. jobs and make trade more fair for the U.S. Please tell me the extent to whU.S. Please tell me the extent to whU.S. Please tell me the extent to whU.S. Please tell me the extent to which you agree or disagree with this sentiment. Would you say you...ich you agree or disagree with this sentiment. Would you say you...ich you agree or disagree with this sentiment. Would you say you...ich you agree or disagree with this sentiment. Would you say you... Table T2 Page 58 T2Table T2 Page 58 T2Table T2 Page 58 T2Table T2 Page 58 T2 Next, some say that any potential negative impact on the U.S. economy due to the ongoing trade dispute Next, some say that any potential negative impact on the U.S. economy due to the ongoing trade dispute Next, some say that any potential negative impact on the U.S. economy due to the ongoing trade dispute Next, some say that any potential negative impact on the U.S. economy due to the ongoing trade dispute with China will be offset by tariffs, which will protect U.S. jobs and make trade more fair for the with China will be offset by tariffs, which will protect U.S. jobs and make trade more fair for the with China will be offset by tariffs, which will protect U.S. jobs and make trade more fair for the with China will be offset by tariffs, which will protect U.S. jobs and make trade more fair for the U.S. Please tell me the extent to which you agree or disagree with this sentiment. Would you say you...U.S. Please tell me the extent to which you agree or disagree with this sentiment. Would you say you...U.S. Please tell me the extent to which you agree or disagree with this sentiment. Would you say you...U.S. Please tell me the extent to which you agree or disagree with this sentiment. Would you say you... Table J1 Table J1 Table J1 Table J1 Page 59 J1Page 59 J1Page 59 J1Page 59 J1 Please tell me how many members of your household are currently unemployed and are looking for Please tell me how many members of your household are currently unemployed and are looking for Please tell me how many members of your household are currently unemployed and are looking for Please tell me how many members of your household are currently unemployed and are looking for employment now.employment now.employment now.employment now. Table J1 Page 60 J1Table J1 Page 60 J1Table J1 Page 60 J1Table J1 Page 60 J1 Please tell me how many members of your household are currently unemployed and are looking for Please tell me how many members of your household are currently unemployed and are looking for Please tell me how many members of your household are currently unemployed and are looking for Please tell me how many members of your household are currently unemployed and are looking for employment now.employment now.employment now.employment now. Table J2 Page 61 J2Table J2 Page 61 J2Table J2 Page 61 J2Table J2 Page 61 J2 How concerned are you thHow concerned are you thHow concerned are you thHow concerned are you that in the next 12 months you or a member of your household might be laid off:at in the next 12 months you or a member of your household might be laid off:at in the next 12 months you or a member of your household might be laid off:at in the next 12 months you or a member of your household might be laid off: Table J2 Page 62 J2Table J2 Page 62 J2Table J2 Page 62 J2Table J2 Page 62 J2 How concerned are you that in the next 12 months you or a member of your household might be laid off:How concerned are you that in the next 12 months you or a member of your household might be laid off:How concerned are you that in the next 12 months you or a member of your household might be laid off:How concerned are you that in the next 12 months you or a member of your household might be laid off: Table J12 Table J12 Table J12 Table J12 Page 63 J12Page 63 J12Page 63 J12Page 63 J12 JOB SENSITIVE HOUSEHOLDS (Either looking for employment now or concerned)JOB SENSITIVE HOUSEHOLDS (Either looking for employment now or concerned)JOB SENSITIVE HOUSEHOLDS (Either looking for employment now or concerned)JOB SENSITIVE HOUSEHOLDS (Either looking for employment now or concerned) Table J12 Page 64 J12Table J12 Page 64 J12Table J12 Page 64 J12Table J12 Page 64 J12 JOB SENSITIVE HOUSEHOLDS (Either looking for employment now or concernJOB SENSITIVE HOUSEHOLDS (Either looking for employment now or concernJOB SENSITIVE HOUSEHOLDS (Either looking for employment now or concernJOB SENSITIVE HOUSEHOLDS (Either looking for employment now or concerned)ed)ed)ed)

Table Q1 Page 1Table Q1 Page 1Table Q1 Page 1Table Q1 Page 1 Investor's Business Daily/TIPP PollInvestor's Business Daily/TIPP PollInvestor's Business Daily/TIPP PollInvestor's Business Daily/TIPP Poll---- December 2018, Field 11/26 to 12/2 , Sample December 2018, Field 11/26 to 12/2 , Sample December 2018, Field 11/26 to 12/2 , Sample December 2018, Field 11/26 to 12/2 , Sample ---- 823 adults, MOE +/823 adults, MOE +/823 adults, MOE +/823 adults, MOE +/----3.3 pts, Traditional phone with live interviewers 3.3 pts, Traditional phone with live interviewers 3.3 pts, Traditional phone with live interviewers 3.3 pts, Traditional phone with live interviewers Q1Q1Q1Q1 IN GENERAL, how SATISFIED are you with the DIRECTION that the country is goiIN GENERAL, how SATISFIED are you with the DIRECTION that the country is goiIN GENERAL, how SATISFIED are you with the DIRECTION that the country is goiIN GENERAL, how SATISFIED are you with the DIRECTION that the country is going in at this time?ng in at this time?ng in at this time?ng in at this time? ======= REGION ======== ========= AGE ========= ==GENDER== ===RACE === ======= INCOME ======= =====PARTY===== ==INVESTOR======== REGION ======== ========= AGE ========= ==GENDER== ===RACE === ======= INCOME ======= =====PARTY===== ==INVESTOR======== REGION ======== ========= AGE ========= ==GENDER== ===RACE === ======= INCOME ======= =====PARTY===== ==INVESTOR======== REGION ======== ========= AGE ========= ==GENDER== ===RACE === ======= INCOME ======= =====PARTY===== ==INVESTOR= TOTAL BLACK UND 30KTOTAL BLACK UND 30KTOTAL BLACK UND 30KTOTAL BLACK UND 30K---- 50K50K50K50K---- NE MW SOUTH WEST 18NE MW SOUTH WEST 18NE MW SOUTH WEST 18NE MW SOUTH WEST 18----24 2524 2524 2524 25----44 4544 4544 4544 45----64 65+ MALE FEM. WHITE 64 65+ MALE FEM. WHITE 64 65+ MALE FEM. WHITE 64 65+ MALE FEM. WHITE HISP 30K 50K 75K 75K+ DEM REP IND YES NO HISP 30K 50K 75K 75K+ DEM REP IND YES NO HISP 30K 50K 75K 75K+ DEM REP IND YES NO HISP 30K 50K 75K 75K+ DEM REP IND YES NO -------------------- -------------------- -------------------- -------------------- -------------------- -------------------- -------------------- -------------------- -------------------- -------------------- -------------------- -------------------- -------------------- -------------------- -------------------- -------------------- -------------------- -------------------- -------------------- -------------------- -------------------- -------------------- (A) (B) (A) (B) (A) (B) (A) (B) (C) (D) (E) (F) (G) (H) (I) (J) (K) (L) (M) (N) (O) (P) (Q) (R) (S) (T) (U) (V)(C) (D) (E) (F) (G) (H) (I) (J) (K) (L) (M) (N) (O) (P) (Q) (R) (S) (T) (U) (V)(C) (D) (E) (F) (G) (H) (I) (J) (K) (L) (M) (N) (O) (P) (Q) (R) (S) (T) (U) (V)(C) (D) (E) (F) (G) (H) (I) (J) (K) (L) (M) (N) (O) (P) (Q) (R) (S) (T) (U) (V) TOTAL 823 147 181 309 186 45 234 293 207 393 430 556 171 92 131 138 3TOTAL 823 147 181 309 186 45 234 293 207 393 430 556 171 92 131 138 3TOTAL 823 147 181 309 186 45 234 293 207 393 430 556 171 92 131 138 3TOTAL 823 147 181 309 186 45 234 293 207 393 430 556 171 92 131 138 363 286 63 286 63 286 63 286 237 283 447 309237 283 447 309237 283 447 309237 283 447 309 100% 100% 100% 100% 100% 100% 100% 100% 100% 100% 100% 100% 100% 100% 100% 100% 100% 100% 100% 100% 100% 100% 100% 100% 100% 100% 100% 100% 100% 100% 100% 100% 100% 100% 100% 100% 100% 100% 100% 100% 100% 100% 100% 100% 100% 100% 100% 100% 100% 100% 100% 100% 100% 100% 100% 100% 100% 100% 100% 100% 100% 100% 100% 100% 100% 100% 100% 100% 100% 100% 100% 100% 100% 100% 100% 100% 100% 100% 100% 100% 100% 100% 100% 100% 100%100%100%100% Unweighted Total 823 158 180 311 174 17 102 289 Unweighted Total 823 158 180 311 174 17 102 289 Unweighted Total 823 158 180 311 174 17 102 289 Unweighted Total 823 158 180 311 174 17 102 289 371 433 390 645 107 104 145 126 337 247 296 262 472 282371 433 390 645 107 104 145 126 337 247 296 262 472 282371 433 390 645 107 104 145 126 337 247 296 262 472 282371 433 390 645 107 104 145 126 337 247 296 262 472 282 Very Satisfied 166 29 42 67 27 2 37 64 47 84 82 130 16 20 25 22 Very Satisfied 166 29 42 67 27 2 37 64 47 84 82 130 16 20 25 22 Very Satisfied 166 29 42 67 27 2 37 64 47 84 82 130 16 20 25 22 Very Satisfied 166 29 42 67 27 2 37 64 47 84 82 130 16 20 25 22 76 6 110 45 99 5076 6 110 45 99 5076 6 110 45 99 5076 6 110 45 99 50 20% 20% 23% 22% 15% 4% 16% 22% 23% 21% 19% 23% 9% 21% 19% 16% 21% 2% 47% 16% 22% 20% 20% 23% 22% 15% 4% 16% 22% 23% 21% 19% 23% 9% 21% 19% 16% 21% 2% 47% 16% 22% 20% 20% 23% 22% 15% 4% 16% 22% 23% 21% 19% 23% 9% 21% 19% 16% 21% 2% 47% 16% 22% 20% 20% 23% 22% 15% 4% 16% 22% 23% 21% 19% 23% 9% 21% 19% 16% 21% 2% 47% 16% 22% 16%16%16%16% f F F M f F F M f F F M f F F M RT R RT R RT R RT R Somewhat Satisfied 199 39 34 81 45 13 49 80 49 109 90 146 33 18 27 50 Somewhat Satisfied 199 39 34 81 45 13 49 80 49 109 90 146 33 18 27 50 Somewhat Satisfied 199 39 34 81 45 13 49 80 49 109 90 146 33 18 27 50 Somewhat Satisfied 199 39 34 81 45 13 49 80 49 109 90 146 33 18 27 50 79 33 92 71 110 7579 33 92 71 110 7579 33 92 71 110 7579 33 92 71 110 75 24% 27% 19% 26% 24% 27% 19% 26% 24% 27% 19% 26% 24% 27% 19% 26% 24% 28% 21% 27% 24% 28% 21% 26% 19% 20% 21% 36% 22% 12% 39% 25% 24% 24%24% 28% 21% 27% 24% 28% 21% 26% 19% 20% 21% 36% 22% 12% 39% 25% 24% 24%24% 28% 21% 27% 24% 28% 21% 26% 19% 20% 21% 36% 22% 12% 39% 25% 24% 24%24% 28% 21% 27% 24% 28% 21% 26% 19% 20% 21% 36% 22% 12% 39% 25% 24% 24% k NOQ RT R k NOQ RT R k NOQ RT R k NOQ RT R Not Very Satisfied, 184 29 42 73 40 19 62 51 46 75 109 111 46 24 35 26 Not Very Satisfied, 184 29 42 73 40 19 62 51 46 75 109 111 46 24 35 26 Not Very Satisfied, 184 29 42 73 40 19 62 51 46 75 109 111 46 24 35 26 Not Very Satisfied, 184 29 42 73 40 19 62 51 46 75 109 111 46 24 35 26 86 86 23 73 98 7786 86 23 73 98 7786 86 23 73 98 7786 86 23 73 98 77 22% 20% 23% 24% 21% 43% 26% 17% 22% 19% 22% 20% 23% 24% 21% 43% 26% 17% 22% 19% 22% 20% 23% 24% 21% 43% 26% 17% 22% 19% 22% 20% 23% 24% 21% 43% 26% 17% 22% 19% 25% 20% 27% 26% 27% 19% 24% 30% 10% 26% 22% 25%25% 20% 27% 26% 27% 19% 24% 30% 10% 26% 22% 25%25% 20% 27% 26% 27% 19% 24% 30% 10% 26% 22% 25%25% 20% 27% 26% 27% 19% 24% 30% 10% 26% 22% 25% Hi h j S S Hi h j S S Hi h j S S Hi h j S S Not At All Satisfied Not At All Satisfied Not At All Satisfied Not At All Satisfied 266 49 62 83 72 11 87 94 61 122 144 165 74 31 43 40 120 160 7 93 138 266 49 62 83 72 11 87 94 61 122 144 165 74 31 43 40 120 160 7 93 138 266 49 62 83 72 11 87 94 61 122 144 165 74 31 43 40 120 160 7 93 138 266 49 62 83 72 11 87 94 61 122 144 165 74 31 43 40 120 160 7 93 138 101101101101 32% 33% 34% 27% 39% 25% 37% 32% 29% 31% 33% 30% 43% 33% 32% 29% 32% 33% 34% 27% 39% 25% 37% 32% 29% 31% 33% 30% 43% 33% 32% 29% 32% 33% 34% 27% 39% 25% 37% 32% 29% 31% 33% 30% 43% 33% 32% 29% 32% 33% 34% 27% 39% 25% 37% 32% 29% 31% 33% 30% 43% 33% 32% 29% 33% 56% 3% 33% 31% 33%33% 56% 3% 33% 31% 33%33% 56% 3% 33% 31% 33%33% 56% 3% 33% 31% 33% D L ST S D L ST S D L ST S D L ST S (Not sure/Refused) 8 1 0 5 2 (Not sure/Refused) 8 1 0 5 2 (Not sure/Refused) 8 1 0 5 2 (Not sure/Refused) 8 1 0 5 2 ---- ---- 4 3 3 5 4 3 4 3 3 5 4 3 4 3 3 5 4 3 4 3 3 5 4 3 ---- 1 1 1 1 ---- 3 3 3 3 ---- 5 2 2 65 2 2 65 2 2 65 2 2 6 1% 1% *% 2% 1% 1% 2% 1% 1% 1% 2% 1% 1% 2% 1% *% 1% 1% *% 2% 1% 1% 2% 1% 1% 1% 2% 1% 1% 2% 1% *% 1% 1% *% 2% 1% 1% 2% 1% 1% 1% 2% 1% 1% 2% 1% *% 1% 1% *% 2% 1% 1% 2% 1% 1% 1% 2% 1% 1% 2% 1% *% 2%2%2%2% SATISFIED 365 68 77 148 72 14 86 145 96 193 172 276 49 38 53 72 1SATISFIED 365 68 77 148 72 14 86 145 96 193 172 276 49 38 53 72 1SATISFIED 365 68 77 148 72 14 86 145 96 193 172 276 49 38 53 72 1SATISFIED 365 68 77 148 72 14 86 145 96 193 172 276 49 38 53 72 154 39 202 115 209 12554 39 202 115 209 12554 39 202 115 209 12554 39 202 115 209 125 44% 46% 42% 48% 39% 32% 37% 49% 46% 49% 40% 50% 44% 46% 42% 48% 39% 32% 37% 49% 46% 49% 40% 50% 44% 46% 42% 48% 39% 32% 37% 49% 46% 49% 40% 50% 44% 46% 42% 48% 39% 32% 37% 49% 46% 49% 40% 50% 28% 41% 40% 52% 42% 14% 85% 41% 47% 40%28% 41% 40% 52% 42% 14% 85% 41% 47% 40%28% 41% 40% 52% 42% 14% 85% 41% 47% 40%28% 41% 40% 52% 42% 14% 85% 41% 47% 40% G g K M RT R G g K M RT R G g K M RT R G g K M RT R NOT SATISFIED 450 78NOT SATISFIED 450 78NOT SATISFIED 450 78NOT SATISFIED 450 78 104 156 112 31 148 145 108 197 253 276 120 54 78 66 206 246 30 165 236 178104 156 112 31 148 145 108 197 253 276 120 54 78 66 206 246 30 165 236 178104 156 112 31 148 145 108 197 253 276 120 54 78 66 206 246 30 165 236 178104 156 112 31 148 145 108 197 253 276 120 54 78 66 206 246 30 165 236 178 55% 53% 57% 50% 60% 68% 63% 49% 52% 50% 59% 50% 70% 59% 59% 48% 57% 86% 55% 53% 57% 50% 60% 68% 63% 49% 52% 50% 59% 50% 70% 59% 59% 48% 57% 86% 55% 53% 57% 50% 60% 68% 63% 49% 52% 50% 59% 50% 70% 59% 59% 48% 57% 86% 55% 53% 57% 50% 60% 68% 63% 49% 52% 50% 59% 50% 70% 59% 59% 48% 57% 86% 13% 58% 53% 58%13% 58% 53% 58%13% 58% 53% 58%13% 58% 53% 58% d Hi J L ST S d Hi J L ST S d Hi J L ST S d Hi J L ST S Comparison Groups: BCDE/FGHI/JK/LM/NOPQ/RST/UVComparison Groups: BCDE/FGHI/JK/LM/NOPQ/RST/UVComparison Groups: BCDE/FGHI/JK/LM/NOPQ/RST/UVComparison Groups: BCDE/FGHI/JK/LM/NOPQ/RST/UV Independent ZIndependent ZIndependent ZIndependent Z----TesTesTesTest for Percentages (unpooled proportions)t for Percentages (unpooled proportions)t for Percentages (unpooled proportions)t for Percentages (unpooled proportions) Uppercase letters indicate significance at the 95% level.Uppercase letters indicate significance at the 95% level.Uppercase letters indicate significance at the 95% level.Uppercase letters indicate significance at the 95% level. Lowercase letters indicate significance at the 90% level.Lowercase letters indicate significance at the 90% level.Lowercase letters indicate significance at the 90% level.Lowercase letters indicate significance at the 90% level.

Table Q1 Page 2Table Q1 Page 2Table Q1 Page 2Table Q1 Page 2 Investor's Business Daily/TIPP PollInvestor's Business Daily/TIPP PollInvestor's Business Daily/TIPP PollInvestor's Business Daily/TIPP Poll---- December 2018, Field 11/26 to 12/2 , Sample December 2018, Field 11/26 to 12/2 , Sample December 2018, Field 11/26 to 12/2 , Sample December 2018, Field 11/26 to 12/2 , Sample ---- 823 adults, MOE +/823 adults, MOE +/823 adults, MOE +/823 adults, MOE +/----3.3 pts, Traditional phone with live interviewers 3.3 pts, Traditional phone with live interviewers 3.3 pts, Traditional phone with live interviewers 3.3 pts, Traditional phone with live interviewers Q1Q1Q1Q1 IN GENERAL, how SATISFIED are you with the DIRECTION that the country is going in at this time?IN GENERAL, how SATISFIED are you with the DIRECTION that the country is going in at this time?IN GENERAL, how SATISFIED are you with the DIRECTION that the country is going in at this time?IN GENERAL, how SATISFIED are you with the DIRECTION that the country is going in at this time? ====AREA TYPE==== ===WHITE=== ==BLK/HISP= ==MAR.STAT= ====EDUCATION==== ====IDEOLOOGY========AREA TYPE==== ===WHITE=== ==BLK/HISP= ==MAR.STAT= ====EDUCATION==== ====IDEOLOOGY========AREA TYPE==== ===WHITE=== ==BLK/HISP= ==MAR.STAT= ====EDUCATION==== ====IDEOLOOGY========AREA TYPE==== ===WHITE=== ==BLK/HISP= ==MAR.STAT= ====EDUCATION==== ====IDEOLOOGY==== SUBSUBSUBSUB---- WHITE SINGL MARR HIGH SOME WHITE SINGL MARR HIGH SOME WHITE SINGL MARR HIGH SOME WHITE SINGL MARR HIGH SOME TOTAL URBAN URBAN RURAL MEN WOMEN BLACK HIS. WOMEN WOM SCHL. COLL. COLL+ CONS. MOD. LIB.TOTAL URBAN URBAN RURAL MEN WOMEN BLACK HIS. WOMEN WOM SCHL. COLL. COLL+ CONS. MOD. LIB.TOTAL URBAN URBAN RURAL MEN WOMEN BLACK HIS. WOMEN WOM SCHL. COLL. COLL+ CONS. MOD. LIB.TOTAL URBAN URBAN RURAL MEN WOMEN BLACK HIS. WOMEN WOM SCHL. COLL. COLL+ CONS. MOD. LIB. -------------------- -------------------- -------------------- -------------------- -------------------- -------------------- -------------------- -------------------- -------------------- -------------------- -------------------- -------------------- -------------------- -------------------- -------------------- -------------------- (A) (B) (C) (D) (E) (F) (G) (H) (I) (J) (K) (L) (M) (N) (O) (P)(A) (B) (C) (D) (E) (F) (G) (H) (I) (J) (K) (L) (M) (N) (O) (P)(A) (B) (C) (D) (E) (F) (G) (H) (I) (J) (K) (L) (M) (N) (O) (P)(A) (B) (C) (D) (E) (F) (G) (H) (I) (J) (K) (L) (M) (N) (O) (P) TOTAL 823 192 400 211 267 290 118 55 182 241 157 216 430 328 247 214TOTAL 823 192 400 211 267 290 118 55 182 241 157 216 430 328 247 214TOTAL 823 192 400 211 267 290 118 55 182 241 157 216 430 328 247 214TOTAL 823 192 400 211 267 290 118 55 182 241 157 216 430 328 247 214 100% 10100% 10100% 10100% 100% 100% 100% 100% 100% 100% 100% 100% 100% 100% 100% 100% 100% 100% 100%0% 100% 100% 100% 100% 100% 100% 100% 100% 100% 100% 100% 100% 100% 100%0% 100% 100% 100% 100% 100% 100% 100% 100% 100% 100% 100% 100% 100% 100%0% 100% 100% 100% 100% 100% 100% 100% 100% 100% 100% 100% 100% 100% 100% Unweighted Total 823 172 385 244 340 305 73 35 178 205 161 222 417 395 233 162Unweighted Total 823 172 385 244 340 305 73 35 178 205 161 222 417 395 233 162Unweighted Total 823 172 385 244 340 305 73 35 178 205 161 222 417 395 233 162Unweighted Total 823 172 385 244 340 305 73 35 178 205 161 222 417 395 233 162 Very Satisfied 166 27 67 Very Satisfied 166 27 67 Very Satisfied 166 27 67 Very Satisfied 166 27 67 65 69 62 10 8 33 46 43 47 69 121 27 1065 69 62 10 8 33 46 43 47 69 121 27 1065 69 62 10 8 33 46 43 47 69 121 27 1065 69 62 10 8 33 46 43 47 69 121 27 10 20% 14% 17% 31% 26% 21% 8% 14% 18% 19% 27% 22% 16% 37% 11% 5%20% 14% 17% 31% 26% 21% 8% 14% 18% 19% 27% 22% 16% 37% 11% 5%20% 14% 17% 31% 26% 21% 8% 14% 18% 19% 27% 22% 16% 37% 11% 5%20% 14% 17% 31% 26% 21% 8% 14% 18% 19% 27% 22% 16% 37% 11% 5% BC BC BC BC M OP p M OP p M OP p M OP p Somewhat Satisfied 199 37 95 64 76 69 17 15 37 53 43 64 90 124 59 13Somewhat Satisfied 199 37 95 64 76 69 17 15 37 53 43 64 90 124 59 13Somewhat Satisfied 199 37 95 64 76 69 17 15 37 53 43 64 90 124 59 13Somewhat Satisfied 199 37 95 64 76 69 17 15 37 53 43 64 90 124 59 13 24% 19% 24% 31% 29% 24% 15% 24% 19% 24% 31% 29% 24% 15% 24% 19% 24% 31% 29% 24% 15% 24% 19% 24% 31% 29% 24% 15% 28% 20% 22% 28% 30% 21% 38% 24% 6%28% 20% 22% 28% 30% 21% 38% 24% 6%28% 20% 22% 28% 30% 21% 38% 24% 6%28% 20% 22% 28% 30% 21% 38% 24% 6% B m OP P B m OP P B m OP P B m OP P Not Very Satisfied, 184 55 91 35 45 66 37 9 46Not Very Satisfied, 184 55 91 35 45 66 37 9 46Not Very Satisfied, 184 55 91 35 45 66 37 9 46Not Very Satisfied, 184 55 91 35 45 66 37 9 46 61 31 51 99 48 71 5561 31 51 99 48 71 5561 31 51 99 48 71 5561 31 51 99 48 71 55 22% 29% 23% 17% 17% 23% 31% 16% 25% 25% 19% 24% 23% 15% 29% 26%22% 29% 23% 17% 17% 23% 31% 16% 25% 25% 19% 24% 23% 15% 29% 26%22% 29% 23% 17% 17% 23% 31% 16% 25% 25% 19% 24% 23% 15% 29% 26%22% 29% 23% 17% 17% 23% 31% 16% 25% 25% 19% 24% 23% 15% 29% 26% D h N ND h N ND h N ND h N N Not At All Satisfied 266 70 144 45 75 90 51 23 63 79 38 53 166 29 89 135Not At All Satisfied 266 70 144 45 75 90 51 23 63 79 38 53 166 29 89 135Not At All Satisfied 266 70 144 45 75 90 51 23 63 79 38 53 166 29 89 135Not At All Satisfied 266 70 144 45 75 90 51 23 63 79 38 53 166 29 89 135 32% 36% 36% 21% 28% 31% 43% 42% 34% 33% 24% 25% 39% 9% 36% 63%32% 36% 36% 21% 28% 31% 43% 42% 34% 33% 24% 25% 39% 9% 36% 63%32% 36% 36% 21% 28% 31% 43% 42% 34% 33% 24% 25% 39% 9% 36% 63%32% 36% 36% 21% 28% 31% 43% 42% 34% 33% 24% 25% 39% 9% 36% 63% D D KL N NOD D KL N NOD D KL N NOD D KL N NO (Not sure/Refused) (Not sure/Refused) (Not sure/Refused) (Not sure/Refused) 8 3 3 2 2 2 3 8 3 3 2 2 2 3 8 3 3 2 2 2 3 8 3 3 2 2 2 3 ---- 3 2 2 0 6 6 1 3 2 2 0 6 6 1 3 2 2 0 6 6 1 3 2 2 0 6 6 1 ---- 1% 1% 1% 1% 1% 1% 3% 2% 1% 1% *% 1% 2% *% 1% 1% 1% 1% 1% 1% 3% 2% 1% 1% *% 1% 2% *% 1% 1% 1% 1% 1% 1% 3% 2% 1% 1% *% 1% 2% *% 1% 1% 1% 1% 1% 1% 3% 2% 1% 1% *% 1% 2% *% SATISFIED 365 SATISFIED 365 SATISFIED 365 SATISFIED 365 65 162 129 145 131 27 23 70 99 86 111 159 244 86 2365 162 129 145 131 27 23 70 99 86 111 159 244 86 2365 162 129 145 131 27 23 70 99 86 111 159 244 86 2365 162 129 145 131 27 23 70 99 86 111 159 244 86 23 44% 34% 40% 61% 54% 45% 23% 41% 39% 41% 55% 51% 37% 75% 35% 11%44% 34% 40% 61% 54% 45% 23% 41% 39% 41% 55% 51% 37% 75% 35% 11%44% 34% 40% 61% 54% 45% 23% 41% 39% 41% 55% 51% 37% 75% 35% 11%44% 34% 40% 61% 54% 45% 23% 41% 39% 41% 55% 51% 37% 75% 35% 11% BC f g M M OP P BC f g M M OP P BC f g M M OP P BC f g M M OP P NOT SATISFIED 450 125 235 80 120 156 88 32 109 140 68 105 266 77 160 191NOT SATISFIED 450 125 235 80 120 156 88 32 109 140 68 105 266 77 160 191NOT SATISFIED 450 125 235 80 120 156 88 32 109 140 68 105 266 77 160 191NOT SATISFIED 450 125 235 80 120 156 88 32 109 140 68 105 266 77 160 191 55% 65% 59% 38% 45% 55% 65% 59% 38% 45% 55% 65% 59% 38% 45% 55% 65% 59% 38% 45% 54% 74% 59% 60% 58% 44% 49% 62% 24% 65% 89%54% 74% 59% 60% 58% 44% 49% 62% 24% 65% 89%54% 74% 59% 60% 58% 44% 49% 62% 24% 65% 89%54% 74% 59% 60% 58% 44% 49% 62% 24% 65% 89% D D e KL N NOD D e KL N NOD D e KL N NOD D e KL N NO Comparison Groups: BCD/EF/GH/IJ/KLM/NOPComparison Groups: BCD/EF/GH/IJ/KLM/NOPComparison Groups: BCD/EF/GH/IJ/KLM/NOPComparison Groups: BCD/EF/GH/IJ/KLM/NOP Independent ZIndependent ZIndependent ZIndependent Z----Test for Percentages (unpooled proportions)Test for Percentages (unpooled proportions)Test for Percentages (unpooled proportions)Test for Percentages (unpooled proportions) Uppercase letters indicate significance at the 95% level.Uppercase letters indicate significance at the 95% level.Uppercase letters indicate significance at the 95% level.Uppercase letters indicate significance at the 95% level. Lowercase letters indicate significance at the 90% level.Lowercase letters indicate significance at the 90% level.Lowercase letters indicate significance at the 90% level.Lowercase letters indicate significance at the 90% level.

Table Q2 Page 3Table Q2 Page 3Table Q2 Page 3Table Q2 Page 3 Investor's Business Daily/TIPP PollInvestor's Business Daily/TIPP PollInvestor's Business Daily/TIPP PollInvestor's Business Daily/TIPP Poll---- December 2018, Field 11/26 December 2018, Field 11/26 December 2018, Field 11/26 December 2018, Field 11/26 to 12/2 , Sample to 12/2 , Sample to 12/2 , Sample to 12/2 , Sample ---- 823 adults, MOE +/823 adults, MOE +/823 adults, MOE +/823 adults, MOE +/----3.3 pts, Traditional phone with live interviewers 3.3 pts, Traditional phone with live interviewers 3.3 pts, Traditional phone with live interviewers 3.3 pts, Traditional phone with live interviewers Q2Q2Q2Q2 How SATISFIED are you with the direction that the country is going in at this time in terms of MORALS AND ETHICS?How SATISFIED are you with the direction that the country is going in at this time in terms of MORALS AND ETHICS?How SATISFIED are you with the direction that the country is going in at this time in terms of MORALS AND ETHICS?How SATISFIED are you with the direction that the country is going in at this time in terms of MORALS AND ETHICS? ======= REGI======= REGI======= REGI======= REGION ======== ========= AGE ========= ==GENDER== ===RACE === ======= INCOME ======= =====PARTY===== ==INVESTOR=ON ======== ========= AGE ========= ==GENDER== ===RACE === ======= INCOME ======= =====PARTY===== ==INVESTOR=ON ======== ========= AGE ========= ==GENDER== ===RACE === ======= INCOME ======= =====PARTY===== ==INVESTOR=ON ======== ========= AGE ========= ==GENDER== ===RACE === ======= INCOME ======= =====PARTY===== ==INVESTOR= TOTAL BLACK UND 30KTOTAL BLACK UND 30KTOTAL BLACK UND 30KTOTAL BLACK UND 30K---- 50K50K50K50K---- NE MW SOUTH WEST 18NE MW SOUTH WEST 18NE MW SOUTH WEST 18NE MW SOUTH WEST 18----24 2524 2524 2524 25----44 4544 4544 4544 45----64 65+ MALE FEM. WHITE HISP 30K 50K 75K 75K+ DEM REP IND YES NO 64 65+ MALE FEM. WHITE HISP 30K 50K 75K 75K+ DEM REP IND YES NO 64 65+ MALE FEM. WHITE HISP 30K 50K 75K 75K+ DEM REP IND YES NO 64 65+ MALE FEM. WHITE HISP 30K 50K 75K 75K+ DEM REP IND YES NO -------------------- -------------------- -------------------- -------------------- -------------------- -------------------- -------------------- -------------------- -------------------- -------------------- -------------------- -------------------- -------------------- -------------------- -------------------- -------------------- -------------------- -------------------- -------------------- -------------------- -------------------- -------------------- (A) (B) (C) (D) (E) (F) (G) (H) (I) (J) (K) (L) (M) (N) (O) (P) (Q) (R) (S) (T) (U) (A) (B) (C) (D) (E) (F) (G) (H) (I) (J) (K) (L) (M) (N) (O) (P) (Q) (R) (S) (T) (U) (A) (B) (C) (D) (E) (F) (G) (H) (I) (J) (K) (L) (M) (N) (O) (P) (Q) (R) (S) (T) (U) (A) (B) (C) (D) (E) (F) (G) (H) (I) (J) (K) (L) (M) (N) (O) (P) (Q) (R) (S) (T) (U) (V)(V)(V)(V) TOTAL TOTAL TOTAL TOTAL 823 147 181 309 186 45 234 293 207 393 430 556 171 92 131 138 363 286 237 283 447 823 147 181 309 186 45 234 293 207 393 430 556 171 92 131 138 363 286 237 283 447 823 147 181 309 186 45 234 293 207 393 430 556 171 92 131 138 363 286 237 283 447 823 147 181 309 186 45 234 293 207 393 430 556 171 92 131 138 363 286 237 283 447 309309309309 100% 100% 100% 100% 100% 100% 100% 100% 100% 100% 100% 100% 100% 100% 100% 10100% 100% 100% 100% 100% 100% 100% 100% 100% 100% 100% 100% 100% 100% 100% 10100% 100% 100% 100% 100% 100% 100% 100% 100% 100% 100% 100% 100% 100% 100% 10100% 100% 100% 100% 100% 100% 100% 100% 100% 100% 100% 100% 100% 100% 100% 100% 100% 100% 100% 100% 100% 100%0% 100% 100% 100% 100% 100% 100%0% 100% 100% 100% 100% 100% 100%0% 100% 100% 100% 100% 100% 100% Unweighted Total 823 158 180 311 174 17 102 289 371 433 390 645 107 104 145 126 3Unweighted Total 823 158 180 311 174 17 102 289 371 433 390 645 107 104 145 126 3Unweighted Total 823 158 180 311 174 17 102 289 371 433 390 645 107 104 145 126 3Unweighted Total 823 158 180 311 174 17 102 289 371 433 390 645 107 104 145 126 337 247 296 262 472 28237 247 296 262 472 28237 247 296 262 472 28237 247 296 262 472 282 Very Satisfied 45 6 7 20 12 Very Satisfied 45 6 7 20 12 Very Satisfied 45 6 7 20 12 Very Satisfied 45 6 7 20 12 ---- 8 24 9 28 17 36 4 4 4 6 22 0 28 15 25 118 24 9 28 17 36 4 4 4 6 22 0 28 15 25 118 24 9 28 17 36 4 4 4 6 22 0 28 15 25 118 24 9 28 17 36 4 4 4 6 22 0 28 15 25 11 5% 4% 4% 6% 7% 3% 8% 4% 7% 4% 6% 3% 4% 3% 5% 6% *% 12% 5% 6% 5% 4% 4% 6% 7% 3% 8% 4% 7% 4% 6% 3% 4% 3% 5% 6% *% 12% 5% 6% 5% 4% 4% 6% 7% 3% 8% 4% 7% 4% 6% 3% 4% 3% 5% 6% *% 12% 5% 6% 5% 4% 4% 6% 7% 3% 8% 4% 7% 4% 6% 3% 4% 3% 5% 6% *% 12% 5% 6% 4%4%4%4% g m RT R g m RT R g m RT R g m RT R Somewhat Satisfied 143 27 30 53 32 8 28 56 44 76 67 99 27 14 22 21 Somewhat Satisfied 143 27 30 53 32 8 28 56 44 76 67 99 27 14 22 21 Somewhat Satisfied 143 27 30 53 32 8 28 56 44 76 67 99 27 14 22 21 Somewhat Satisfied 143 27 30 53 32 8 28 56 44 76 67 99 27 14 22 21 69 26 65 48 90 4469 26 65 48 90 4469 26 65 48 90 4469 26 65 48 90 44 17% 19% 17% 17% 17% 19% 12% 19% 21% 19% 16% 18% 17% 19% 17% 17% 17% 19% 12% 19% 21% 19% 16% 18% 17% 19% 17% 17% 17% 19% 12% 19% 21% 19% 16% 18% 17% 19% 17% 17% 17% 19% 12% 19% 21% 19% 16% 18% 16% 15% 17% 15% 19% 9% 28% 17% 20% 14%16% 15% 17% 15% 19% 9% 28% 17% 20% 14%16% 15% 17% 15% 19% 9% 28% 17% 20% 14%16% 15% 17% 15% 19% 9% 28% 17% 20% 14% G RT R G RT R G RT R G RT R Not Very Satisfied 252 40Not Very Satisfied 252 40Not Very Satisfied 252 40Not Very Satisfied 252 40 62 100 49 19 84 76 62 126 125 179 40 28 54 42 112 72 75 102 139 10062 100 49 19 84 76 62 126 125 179 40 28 54 42 112 72 75 102 139 10062 100 49 19 84 76 62 126 125 179 40 28 54 42 112 72 75 102 139 10062 100 49 19 84 76 62 126 125 179 40 28 54 42 112 72 75 102 139 100 31% 28% 34% 32% 27% 43% 36% 26% 30% 32% 29% 32% 23% 30% 41% 30% 31% 25% 31% 28% 34% 32% 27% 43% 36% 26% 30% 32% 29% 32% 23% 30% 41% 30% 31% 25% 31% 28% 34% 32% 27% 43% 36% 26% 30% 32% 29% 32% 23% 30% 41% 30% 31% 25% 31% 28% 34% 32% 27% 43% 36% 26% 30% 32% 29% 32% 23% 30% 41% 30% 31% 25% 32% 36% 31% 32%32% 36% 31% 32%32% 36% 31% 32%32% 36% 31% 32% h m q R h m q R h m q R h m q R Not At All Satisfied 366 70 73 134 89 17 108 131 Not At All Satisfied 366 70 73 134 89 17 108 131 Not At All Satisfied 366 70 73 134 89 17 108 131 Not At All Satisfied 366 70 73 134 89 17 108 131 89 152 214 231 97 46 49 67 153 182 61 113 186 14589 152 214 231 97 46 49 67 153 182 61 113 186 14589 152 214 231 97 46 49 67 153 182 61 113 186 14589 152 214 231 97 46 49 67 153 182 61 113 186 145 44% 48% 40% 43% 48% 39% 46% 45% 43% 39% 50% 41% 57% 50% 37% 48% 42% 64% 26% 40% 41% 44% 48% 40% 43% 48% 39% 46% 45% 43% 39% 50% 41% 57% 50% 37% 48% 42% 64% 26% 40% 41% 44% 48% 40% 43% 48% 39% 46% 45% 43% 39% 50% 41% 57% 50% 37% 48% 42% 64% 26% 40% 41% 44% 48% 40% 43% 48% 39% 46% 45% 43% 39% 50% 41% 57% 50% 37% 48% 42% 64% 26% 40% 41% 47%47%47%47% J L ST S J L ST S J L ST S J L ST S (Not sure/Refused) 18 3 9 3 3 (Not sure/Refused) 18 3 9 3 3 (Not sure/Refused) 18 3 9 3 3 (Not sure/Refused) 18 3 9 3 3 ---- 5 6 4 11 6 11 4 1 5 6 4 11 6 11 4 1 5 6 4 11 6 11 4 1 5 6 4 11 6 11 4 1 3 3 7 5 7 5 8 93 3 7 5 7 5 8 93 3 7 5 7 5 8 93 3 7 5 7 5 8 9 2% 2% 5% 1% 2% 2% 2% 2% 3% 1% 2% 2% 1% 2% 2% 2% 2% 3% 2% 2% 2% 2% 5% 1% 2% 2% 2% 2% 3% 1% 2% 2% 1% 2% 2% 2% 2% 3% 2% 2% 2% 2% 5% 1% 2% 2% 2% 2% 3% 1% 2% 2% 1% 2% 2% 2% 2% 3% 2% 2% 2% 2% 5% 1% 2% 2% 2% 2% 3% 1% 2% 2% 1% 2% 2% 2% 2% 3% 2% 2% 3%3%3%3% D D D D SATISFIED 188 33 37 72 45 8 36 79 52 104 84 135 31 18 26 27 SATISFIED 188 33 37 72 45 8 36 79 52 104 84 135 31 18 26 27 SATISFIED 188 33 37 72 45 8 36 79 52 104 84 135 31 18 26 27 SATISFIED 188 33 37 72 45 8 36 79 52 104 84 135 31 18 26 27 92 26 93 63 92 26 93 63 92 26 93 63 92 26 93 63 115 55115 55115 55115 55 23% 23% 21% 23% 24% 19% 15% 27% 25% 26% 20% 24% 18% 19% 20% 20% 25% 9% 39% 22% 26% 23% 23% 21% 23% 24% 19% 15% 27% 25% 26% 20% 24% 18% 19% 20% 20% 25% 9% 39% 22% 26% 23% 23% 21% 23% 24% 19% 15% 27% 25% 26% 20% 24% 18% 19% 20% 20% 25% 9% 39% 22% 26% 23% 23% 21% 23% 24% 19% 15% 27% 25% 26% 20% 24% 18% 19% 20% 20% 25% 9% 39% 22% 26% 18%18%18%18% G G k G G k G G k G G k RT R v RT R v RT R v RT R v NOT SATISFIED 617 111 135 234 138 36 192 208 151 278 339 410 137 73 103 108 2NOT SATISFIED 617 111 135 234 138 36 192 208 151 278 339 410 137 73 103 108 2NOT SATISFIED 617 111 135 234 138 36 192 208 151 278 339 410 137 73 103 108 2NOT SATISFIED 617 111 135 234 138 36 192 208 151 278 339 410 137 73 103 108 265 254 136 214 325 24565 254 136 214 325 24565 254 136 214 325 24565 254 136 214 325 245 75% 75% 74% 76% 74% 81% 82% 71% 73% 71% 79% 74% 80% 80% 78% 78% 73% 89% 57% 76% 73% 75% 75% 74% 76% 74% 81% 82% 71% 73% 71% 79% 74% 80% 80% 78% 78% 73% 89% 57% 76% 73% 75% 75% 74% 76% 74% 81% 82% 71% 73% 71% 79% 74% 80% 80% 78% 78% 73% 89% 57% 76% 73% 75% 75% 74% 76% 74% 81% 82% 71% 73% 71% 79% 74% 80% 80% 78% 78% 73% 89% 57% 76% 73% 79%79%79%79% Hi J Hi J Hi J Hi J ST S ST S ST S ST S Comparison Groups: BCDE/FGHI/JK/LM/NOPQ/RST/UVComparison Groups: BCDE/FGHI/JK/LM/NOPQ/RST/UVComparison Groups: BCDE/FGHI/JK/LM/NOPQ/RST/UVComparison Groups: BCDE/FGHI/JK/LM/NOPQ/RST/UV Independent ZIndependent ZIndependent ZIndependent Z----Test for Percentages (unpooled proportions)Test for Percentages (unpooled proportions)Test for Percentages (unpooled proportions)Test for Percentages (unpooled proportions) Uppercase letters indicate significance at the 95% level.Uppercase letters indicate significance at the 95% level.Uppercase letters indicate significance at the 95% level.Uppercase letters indicate significance at the 95% level. Lowercase letters indicate significance at the 90% level.Lowercase letters indicate significance at the 90% level.Lowercase letters indicate significance at the 90% level.Lowercase letters indicate significance at the 90% level.

Table Q2 Page 4Table Q2 Page 4Table Q2 Page 4Table Q2 Page 4 Investor's Business Daily/TIPP PollInvestor's Business Daily/TIPP PollInvestor's Business Daily/TIPP PollInvestor's Business Daily/TIPP Poll---- December 2018, Field 11/26 to 12/2 , Sample December 2018, Field 11/26 to 12/2 , Sample December 2018, Field 11/26 to 12/2 , Sample December 2018, Field 11/26 to 12/2 , Sample ---- 823 adults, MOE +/823 adults, MOE +/823 adults, MOE +/823 adults, MOE +/----3.3 pts, Traditional phone with live interviewers 3.3 pts, Traditional phone with live interviewers 3.3 pts, Traditional phone with live interviewers 3.3 pts, Traditional phone with live interviewers Q2Q2Q2Q2 How SATISFIED are you How SATISFIED are you How SATISFIED are you How SATISFIED are you with the direction that the country is going in at this time in terms of MORALS AND ETHICS?with the direction that the country is going in at this time in terms of MORALS AND ETHICS?with the direction that the country is going in at this time in terms of MORALS AND ETHICS?with the direction that the country is going in at this time in terms of MORALS AND ETHICS? ====AREA TYPE==== ===WHITE=== ==BLK/HISP= ==MAR.STAT= ====EDUCATION==== ====IDEOLOOGY========AREA TYPE==== ===WHITE=== ==BLK/HISP= ==MAR.STAT= ====EDUCATION==== ====IDEOLOOGY========AREA TYPE==== ===WHITE=== ==BLK/HISP= ==MAR.STAT= ====EDUCATION==== ====IDEOLOOGY========AREA TYPE==== ===WHITE=== ==BLK/HISP= ==MAR.STAT= ====EDUCATION==== ====IDEOLOOGY==== SUBSUBSUBSUB---- WHITE SINGL MARR HIGH SOME WHITE SINGL MARR HIGH SOME WHITE SINGL MARR HIGH SOME WHITE SINGL MARR HIGH SOME TOTAL URBAN URBAN RURAL MEN WOMEN BLACK HIS. WOMEN WOM SCHL. COLL. COLL+ CONS. MOD. LIB.TOTAL URBAN URBAN RURAL MEN WOMEN BLACK HIS. WOMEN WOM SCHL. COLL. COLL+ CONS. MOD. LIB.TOTAL URBAN URBAN RURAL MEN WOMEN BLACK HIS. WOMEN WOM SCHL. COLL. COLL+ CONS. MOD. LIB.TOTAL URBAN URBAN RURAL MEN WOMEN BLACK HIS. WOMEN WOM SCHL. COLL. COLL+ CONS. MOD. LIB. -------------------- -------------------- -------------------- -------------------- -------------------- -------------------- -------------------- -------------------- -------------------- -------------------- -------------------- -------------------- -------------------- -------------------- -------------------- -------------------- (A) (B) (C) (D) (E) (F) (G) (H) (I) (J) (K) (L) (M) (N) (O) (P)(A) (B) (C) (D) (E) (F) (G) (H) (I) (J) (K) (L) (M) (N) (O) (P)(A) (B) (C) (D) (E) (F) (G) (H) (I) (J) (K) (L) (M) (N) (O) (P)(A) (B) (C) (D) (E) (F) (G) (H) (I) (J) (K) (L) (M) (N) (O) (P) TOTAL 823 192 400 211 267 290TOTAL 823 192 400 211 267 290TOTAL 823 192 400 211 267 290TOTAL 823 192 400 211 267 290 118 55 182 241 157 216 430 328 247 214118 55 182 241 157 216 430 328 247 214118 55 182 241 157 216 430 328 247 214118 55 182 241 157 216 430 328 247 214 100% 100% 100% 100% 100% 100% 100% 100% 100% 100% 100% 100% 100% 100% 100% 100%100% 100% 100% 100% 100% 100% 100% 100% 100% 100% 100% 100% 100% 100% 100% 100%100% 100% 100% 100% 100% 100% 100% 100% 100% 100% 100% 100% 100% 100% 100% 100%100% 100% 100% 100% 100% 100% 100% 100% 100% 100% 100% 100% 100% 100% 100% 100% Unweighted Total 823 172 385 244 340 305 73 35 178 205 161 222 417 395 233 162Unweighted Total 823 172 385 244 340 305 73 35 178 205 161 222 417 395 233 162Unweighted Total 823 172 385 244 340 305 73 35 178 205 161 222 417 395 233 162Unweighted Total 823 172 385 244 340 305 73 35 178 205 161 222 417 395 233 162 Very Satisfied 45 4 23 15 24 11 4 1 9 8 14 14 14 33 10 1Very Satisfied 45 4 23 15 24 11 4 1 9 8 14 14 14 33 10 1Very Satisfied 45 4 23 15 24 11 4 1 9 8 14 14 14 33 10 1Very Satisfied 45 4 23 15 24 11 4 1 9 8 14 14 14 33 10 1 5% 2% 6% 7% 9% 4% 4% 2% 5% 3% 9% 7% 3% 10% 4% 1%5% 2% 6% 7% 9% 4% 4% 2% 5% 3% 9% 7% 3% 10% 4% 1%5% 2% 6% 7% 9% 4% 4% 2% 5% 3% 9% 7% 3% 10% 4% 1%5% 2% 6% 7% 9% 4% 4% 2% 5% 3% 9% 7% 3% 10% 4% 1% b f OP p b f OP p b f OP p b f OP p Somewhat Satisfied Somewhat Satisfied Somewhat Satisfied Somewhat Satisfied 143 27 70 42 49 50 17 10 32 33 29 46 64 80 34 25143 27 70 42 49 50 17 10 32 33 29 46 64 80 34 25143 27 70 42 49 50 17 10 32 33 29 46 64 80 34 25143 27 70 42 49 50 17 10 32 33 29 46 64 80 34 25 17% 14% 18% 20% 18% 17% 14% 18% 18% 14% 18% 21% 15% 24% 14% 11%17% 14% 18% 20% 18% 17% 14% 18% 18% 14% 18% 21% 15% 24% 14% 11%17% 14% 18% 20% 18% 17% 14% 18% 18% 14% 18% 21% 15% 24% 14% 11%17% 14% 18% 20% 18% 17% 14% 18% 18% 14% 18% 21% 15% 24% 14% 11% OP OP OP OP Not Very Satisfied 252 65 128 57 87 92 26 14 46 78 47 64 140 117 84 45Not Very Satisfied 252 65 128 57 87 92 26 14 46 78 47 64 140 117 84 45Not Very Satisfied 252 65 128 57 87 92 26 14 46 78 47 64 140 117 84 45Not Very Satisfied 252 65 128 57 87 92 26 14 46 78 47 64 140 117 84 45 31% 34% 32% 31% 34% 32% 31% 34% 32% 31% 34% 32% 27% 32% 32% 22% 26% 25% 32% 30% 29% 33% 36% 34% 21%27% 32% 32% 22% 26% 25% 32% 30% 29% 33% 36% 34% 21%27% 32% 32% 22% 26% 25% 32% 30% 29% 33% 36% 34% 21%27% 32% 32% 22% 26% 25% 32% 30% 29% 33% 36% 34% 21% P P P P P P P P Not At All Satisfied 366 94 169 92 97 Not At All Satisfied 366 94 169 92 97 Not At All Satisfied 366 94 169 92 97 Not At All Satisfied 366 94 169 92 97 134 71 26 93 118 63 86 204 90 117 138134 71 26 93 118 63 86 204 90 117 138134 71 26 93 118 63 86 204 90 117 138134 71 26 93 118 63 86 204 90 117 138 44% 49% 42% 43% 36% 46% 60% 47% 51% 49% 40% 40% 47% 28% 47% 65%44% 49% 42% 43% 36% 46% 60% 47% 51% 49% 40% 40% 47% 28% 47% 65%44% 49% 42% 43% 36% 46% 60% 47% 51% 49% 40% 40% 47% 28% 47% 65%44% 49% 42% 43% 36% 46% 60% 47% 51% 49% 40% 40% 47% 28% 47% 65% e e e e N NON NON NON NO (Not sure/Refused) 18 2 11 5 10 1 (Not sure/Refused) 18 2 11 5 10 1 (Not sure/Refused) 18 2 11 5 10 1 (Not sure/Refused) 18 2 11 5 10 1 ---- 4 2 5 4 5 8 7 3 44 2 5 4 5 8 7 3 44 2 5 4 5 8 7 3 44 2 5 4 5 8 7 3 4 2% 1% 3% 2% 4% 1% 7% 1%2% 1% 3% 2% 4% 1% 7% 1%2% 1% 3% 2% 4% 1% 7% 1%2% 1% 3% 2% 4% 1% 7% 1% 2% 2% 3% 2% 2% 1% 2%2% 2% 3% 2% 2% 1% 2%2% 2% 3% 2% 2% 1% 2%2% 2% 3% 2% 2% 1% 2% F F F F SATISFIED 188 31 93 58 73 62 21 11 42 40 4SATISFIED 188 31 93 58 73 62 21 11 42 40 4SATISFIED 188 31 93 58 73 62 21 11 42 40 4SATISFIED 188 31 93 58 73 62 21 11 42 40 42 60 77 114 44 262 60 77 114 44 262 60 77 114 44 262 60 77 114 44 26 23% 16% 23% 27% 28% 21% 18% 21% 23% 17% 27% 28% 18% 35% 18% 12%23% 16% 23% 27% 28% 21% 18% 21% 23% 17% 27% 28% 18% 35% 18% 12%23% 16% 23% 27% 28% 21% 18% 21% 23% 17% 27% 28% 18% 35% 18% 12%23% 16% 23% 27% 28% 21% 18% 21% 23% 17% 27% 28% 18% 35% 18% 12% B m M B m M B m M B m M OP OP OP OP NOT SATISFIED 617 159 297 149 183 226 97 40 139 196 111 150 345 207 201 184NOT SATISFIED 617 159 297 149 183 226 97 40 139 196 111 150 345 207 201 184NOT SATISFIED 617 159 297 149 183 226 97 40 139 196 111 150 345 207 201 184NOT SATISFIED 617 159 297 149 183 226 97 40 139 196 111 150 345 207 201 184 75% 83% 74% 71% 69% 78% 82% 73% 76% 81% 71% 70% 80% 63% 81% 86%75% 83% 74% 71% 69% 78% 82% 73% 76% 81% 71% 70% 80% 63% 81% 86%75% 83% 74% 71% 69% 78% 82% 73% 76% 81% 71% 70% 80% 63% 81% 86%75% 83% 74% 71% 69% 78% 82% 73% 76% 81% 71% 70% 80% 63% 81% 86% cD E kL N NcD E kL N NcD E kL N NcD E kL N N CoCoCoComparison Groups: BCD/EF/GH/IJ/KLM/NOPmparison Groups: BCD/EF/GH/IJ/KLM/NOPmparison Groups: BCD/EF/GH/IJ/KLM/NOPmparison Groups: BCD/EF/GH/IJ/KLM/NOP Independent ZIndependent ZIndependent ZIndependent Z----Test for Percentages (unpooled proportions)Test for Percentages (unpooled proportions)Test for Percentages (unpooled proportions)Test for Percentages (unpooled proportions) Uppercase letters indicate significance at the 95% level.Uppercase letters indicate significance at the 95% level.Uppercase letters indicate significance at the 95% level.Uppercase letters indicate significance at the 95% level. Lowercase letters indicate significance at the 90% level.Lowercase letters indicate significance at the 90% level.Lowercase letters indicate significance at the 90% level.Lowercase letters indicate significance at the 90% level.

Table Q3 Page 5Table Q3 Page 5Table Q3 Page 5Table Q3 Page 5 Investor's Business Daily/Investor's Business Daily/Investor's Business Daily/Investor's Business Daily/TIPP PollTIPP PollTIPP PollTIPP Poll---- December 2018, Field 11/26 to 12/2 , Sample December 2018, Field 11/26 to 12/2 , Sample December 2018, Field 11/26 to 12/2 , Sample December 2018, Field 11/26 to 12/2 , Sample ---- 823 adults, MOE +/823 adults, MOE +/823 adults, MOE +/823 adults, MOE +/----3.3 pts, Traditional phone with live interviewers 3.3 pts, Traditional phone with live interviewers 3.3 pts, Traditional phone with live interviewers 3.3 pts, Traditional phone with live interviewers Q3Q3Q3Q3 How about the COUNTRY'S STANDING IN THE WORLD? Generally speaking, OVER THE NEXT 6 MONTHS, do you think that the How about the COUNTRY'S STANDING IN THE WORLD? Generally speaking, OVER THE NEXT 6 MONTHS, do you think that the How about the COUNTRY'S STANDING IN THE WORLD? Generally speaking, OVER THE NEXT 6 MONTHS, do you think that the How about the COUNTRY'S STANDING IN THE WORLD? Generally speaking, OVER THE NEXT 6 MONTHS, do you think that the position position position position of the United States as a WORLD LEADER will be BETTER, WORSE, or ABOUT THE SAME as now?of the United States as a WORLD LEADER will be BETTER, WORSE, or ABOUT THE SAME as now?of the United States as a WORLD LEADER will be BETTER, WORSE, or ABOUT THE SAME as now?of the United States as a WORLD LEADER will be BETTER, WORSE, or ABOUT THE SAME as now? ======= REGION ======== ========= AGE ========= ==GENDER== ===RACE === ======= INCOME ======= =====PARTY===== ==INVESTOR======== REGION ======== ========= AGE ========= ==GENDER== ===RACE === ======= INCOME ======= =====PARTY===== ==INVESTOR======== REGION ======== ========= AGE ========= ==GENDER== ===RACE === ======= INCOME ======= =====PARTY===== ==INVESTOR======== REGION ======== ========= AGE ========= ==GENDER== ===RACE === ======= INCOME ======= =====PARTY===== ==INVESTOR= TOTAL BLACK UND 30KTOTAL BLACK UND 30KTOTAL BLACK UND 30KTOTAL BLACK UND 30K---- 50K50K50K50K---- NE MW SOUTH WEST 18NE MW SOUTH WEST 18NE MW SOUTH WEST 18NE MW SOUTH WEST 18----24 2524 2524 2524 25----44 4544 4544 4544 45----64 65+ MALE FEM. WHITE 64 65+ MALE FEM. WHITE 64 65+ MALE FEM. WHITE 64 65+ MALE FEM. WHITE HISP 30K 50K 75K 75K+ DEM REP IND YES NO HISP 30K 50K 75K 75K+ DEM REP IND YES NO HISP 30K 50K 75K 75K+ DEM REP IND YES NO HISP 30K 50K 75K 75K+ DEM REP IND YES NO -------------------- -------------------- -------------------- -------------------- -------------------- -------------------- -------------------- -------------------- -------------------- -------------------- -------------------- -------------------- -------------------- -------------------- -------------------- -------------------- -------------------- -------------------- -------------------- -------------------- -------------------- -------------------- (A) (B) (A) (B) (A) (B) (A) (B) (C) (D) (E) (F) (G) (H) (I) (J) (K) (L) (M) (N) (O) (P) (Q) (R) (S) (T) (U) (V)(C) (D) (E) (F) (G) (H) (I) (J) (K) (L) (M) (N) (O) (P) (Q) (R) (S) (T) (U) (V)(C) (D) (E) (F) (G) (H) (I) (J) (K) (L) (M) (N) (O) (P) (Q) (R) (S) (T) (U) (V)(C) (D) (E) (F) (G) (H) (I) (J) (K) (L) (M) (N) (O) (P) (Q) (R) (S) (T) (U) (V) TOTAL 823 147 181 309 186 45 234 293 207 393 430 556 171 92 131 138 3TOTAL 823 147 181 309 186 45 234 293 207 393 430 556 171 92 131 138 3TOTAL 823 147 181 309 186 45 234 293 207 393 430 556 171 92 131 138 3TOTAL 823 147 181 309 186 45 234 293 207 393 430 556 171 92 131 138 363 286 63 286 63 286 63 286 237 283 447 309237 283 447 309237 283 447 309237 283 447 309 100% 100% 100% 100% 100% 100% 100% 100% 100% 100% 100% 100% 100% 100% 100% 100% 100% 100% 100% 100% 100% 100% 100% 100% 100% 100% 100% 100% 100% 100% 100% 100% 100% 100% 100% 100% 100% 100% 100% 100% 100% 100% 100% 100% 100% 100% 100% 100% 100% 100% 100% 100% 100% 100% 100% 100% 100% 100% 100% 100% 100% 100% 100% 100% 100% 100% 100% 100% 100% 100% 100% 100% 100% 100% 100% 100% 100% 100% 100% 100% 100% 100% 100% 100% 100%100%100%100% Unweighted Total 823 158 180 311 174 17 102 289 Unweighted Total 823 158 180 311 174 17 102 289 Unweighted Total 823 158 180 311 174 17 102 289 Unweighted Total 823 158 180 311 174 17 102 289 371 433 390 645 107 104 145 126 337 247 296 262 472 282371 433 390 645 107 104 145 126 337 247 296 262 472 282371 433 390 645 107 104 145 126 337 247 296 262 472 282371 433 390 645 107 104 145 126 337 247 296 262 472 282 Better 218 39 48 85 46 4 39 91 64 111 107 171 23 28 26 29 Better 218 39 48 85 46 4 39 91 64 111 107 171 23 28 26 29 Better 218 39 48 85 46 4 39 91 64 111 107 171 23 28 26 29 Better 218 39 48 85 46 4 39 91 64 111 107 171 23 28 26 29 96 13 139 63 124 6996 13 139 63 124 6996 13 139 63 124 6996 13 139 63 124 69 26% 26% 27% 28% 25% 8% 17% 31% 31% 28% 25% 31% 13% 30% 20% 21% 27% 4% 59% 22% 28% 26% 26% 27% 28% 25% 8% 17% 31% 31% 28% 25% 31% 13% 30% 20% 21% 27% 4% 59% 22% 28% 26% 26% 27% 28% 25% 8% 17% 31% 31% 28% 25% 31% 13% 30% 20% 21% 27% 4% 59% 22% 28% 26% 26% 27% 28% 25% 8% 17% 31% 31% 28% 25% 31% 13% 30% 20% 21% 27% 4% 59% 22% 28% 22%22%22%22% FG FG M FG FG M FG FG M FG FG M RT R RT R RT R RT R Worse 324 67 77 100 80 13 100 115 82 152 172 201 88 33 45 56 1Worse 324 67 77 100 80 13 100 115 82 152 172 201 88 33 45 56 1Worse 324 67 77 100 80 13 100 115 82 152 172 201 88 33 45 56 1Worse 324 67 77 100 80 13 100 115 82 152 172 201 88 33 45 56 164 188 16 113 190 11464 188 16 113 190 11464 188 16 113 190 11464 188 16 113 190 114 39% 45% 43% 32% 39% 45% 43% 32% 39% 45% 43% 32% 39% 45% 43% 32% 43% 30% 43% 39% 39% 39% 40% 36% 52% 35% 34% 41% 45% 66% 7% 40% 42% 37%43% 30% 43% 39% 39% 39% 40% 36% 52% 35% 34% 41% 45% 66% 7% 40% 42% 37%43% 30% 43% 39% 39% 39% 40% 36% 52% 35% 34% 41% 45% 66% 7% 40% 42% 37%43% 30% 43% 39% 39% 39% 40% 36% 52% 35% 34% 41% 45% 66% 7% 40% 42% 37% D d d L o ST S D d d L o ST S D d d L o ST S D d d L o ST S Same 264 40 49 118 57 28 92 86 50 121 142 174 60 31 57 50 Same 264 40 49 118 57 28 92 86 50 121 142 174 60 31 57 50 Same 264 40 49 118 57 28 92 86 50 121 142 174 60 31 57 50 Same 264 40 49 118 57 28 92 86 50 121 142 174 60 31 57 50 97 80 73 104 126 11997 80 73 104 126 11997 80 73 104 126 11997 80 73 104 126 119 32% 27% 27% 38% 31% 62% 39% 29% 24% 31% 32% 27% 27% 38% 31% 62% 39% 29% 24% 31% 32% 27% 27% 38% 31% 62% 39% 29% 24% 31% 32% 27% 27% 38% 31% 62% 39% 29% 24% 31% 33% 31% 35% 34% 43% 36% 27% 28% 31% 37% 28% 39%33% 31% 35% 34% 43% 36% 27% 28% 31% 37% 28% 39%33% 31% 35% 34% 43% 36% 27% 28% 31% 37% 28% 39%33% 31% 35% 34% 43% 36% 27% 28% 31% 37% 28% 39% BC gHI hI Q r UBC gHI hI Q r UBC gHI hI Q r UBC gHI hI Q r U (Not sure) (Not sure) (Not sure) (Not sure) 17 2 7 6 2 17 2 7 6 2 17 2 7 6 2 17 2 7 6 2 ---- 3 1 12 8 9 10 3 1 12 8 9 10 3 1 12 8 9 10 3 1 12 8 9 10 ---- 1 4 3 6 5 9 3 8 61 4 3 6 5 9 3 8 61 4 3 6 5 9 3 8 61 4 3 6 5 9 3 8 6 2% 1% 4% 2% 1% 1% 1% 6% 2% 2% 2% 1% 3% 2% 2% 1% 4% 2% 1% 1% 1% 6% 2% 2% 2% 1% 3% 2% 2% 1% 4% 2% 1% 1% 1% 6% 2% 2% 2% 1% 3% 2% 2% 1% 4% 2% 1% 1% 1% 6% 2% 2% 2% 1% 3% 2% 2% 2% 4% 1% 2% 2%2% 2% 4% 1% 2% 2%2% 2% 4% 1% 2% 2%2% 2% 4% 1% 2% 2% GH GH GH GH Comparison Groups: BCDE/FGHI/JK/LM/NOPQ/RST/UVComparison Groups: BCDE/FGHI/JK/LM/NOPQ/RST/UVComparison Groups: BCDE/FGHI/JK/LM/NOPQ/RST/UVComparison Groups: BCDE/FGHI/JK/LM/NOPQ/RST/UV Independent ZIndependent ZIndependent ZIndependent Z----Test for Percentages (unpooled proportions)Test for Percentages (unpooled proportions)Test for Percentages (unpooled proportions)Test for Percentages (unpooled proportions) Uppercase letters indicate significance at the 95% level.Uppercase letters indicate significance at the 95% level.Uppercase letters indicate significance at the 95% level.Uppercase letters indicate significance at the 95% level. Lowercase letters indicate significance at the 90% level.Lowercase letters indicate significance at the 90% level.Lowercase letters indicate significance at the 90% level.Lowercase letters indicate significance at the 90% level.

Table Q3 Page 6Table Q3 Page 6Table Q3 Page 6Table Q3 Page 6 Investor's BusineInvestor's BusineInvestor's BusineInvestor's Business Daily/TIPP Pollss Daily/TIPP Pollss Daily/TIPP Pollss Daily/TIPP Poll---- December 2018, Field 11/26 to 12/2 , Sample December 2018, Field 11/26 to 12/2 , Sample December 2018, Field 11/26 to 12/2 , Sample December 2018, Field 11/26 to 12/2 , Sample ---- 823 adults, MOE +/823 adults, MOE +/823 adults, MOE +/823 adults, MOE +/----3.3 pts, Traditional phone with live interviewers 3.3 pts, Traditional phone with live interviewers 3.3 pts, Traditional phone with live interviewers 3.3 pts, Traditional phone with live interviewers Q3Q3Q3Q3 How about the COUNTRY'S STANDING IN THE WORLD? Generally speaking, OVER THE NEXT 6 MONTHS, do you think that the How about the COUNTRY'S STANDING IN THE WORLD? Generally speaking, OVER THE NEXT 6 MONTHS, do you think that the How about the COUNTRY'S STANDING IN THE WORLD? Generally speaking, OVER THE NEXT 6 MONTHS, do you think that the How about the COUNTRY'S STANDING IN THE WORLD? Generally speaking, OVER THE NEXT 6 MONTHS, do you think that the position of the United States as a WORLD LEADER will be BETTER, WORSE, or ABOUT THE SAME as now?position of the United States as a WORLD LEADER will be BETTER, WORSE, or ABOUT THE SAME as now?position of the United States as a WORLD LEADER will be BETTER, WORSE, or ABOUT THE SAME as now?position of the United States as a WORLD LEADER will be BETTER, WORSE, or ABOUT THE SAME as now? ====AREA TYPE==== ===WHITE=== ==BLK/HISP= ==MAR.STAT= ====EDUCATION==== ====IDEOLOOGY========AREA TYPE==== ===WHITE=== ==BLK/HISP= ==MAR.STAT= ====EDUCATION==== ====IDEOLOOGY========AREA TYPE==== ===WHITE=== ==BLK/HISP= ==MAR.STAT= ====EDUCATION==== ====IDEOLOOGY========AREA TYPE==== ===WHITE=== ==BLK/HISP= ==MAR.STAT= ====EDUCATION==== ====IDEOLOOGY==== SUBSUBSUBSUB---- WHITE SINGL MARR HIGH SOME WHITE SINGL MARR HIGH SOME WHITE SINGL MARR HIGH SOME WHITE SINGL MARR HIGH SOME TOTAL URBAN URBAN RURAL MEN WOMEN BLACK HIS. WOMEN WOM SCHL. COLL. COLL+ CONS. MOD. LIB.TOTAL URBAN URBAN RURAL MEN WOMEN BLACK HIS. WOMEN WOM SCHL. COLL. COLL+ CONS. MOD. LIB.TOTAL URBAN URBAN RURAL MEN WOMEN BLACK HIS. WOMEN WOM SCHL. COLL. COLL+ CONS. MOD. LIB.TOTAL URBAN URBAN RURAL MEN WOMEN BLACK HIS. WOMEN WOM SCHL. COLL. COLL+ CONS. MOD. LIB. -------------------- -------------------- -------------------- -------------------- -------------------- -------------------- -------------------- -------------------- -------------------- -------------------- -------------------- -------------------- -------------------- -------------------- -------------------- -------------------- (A) (B) (C) (D) (E) (F) (G) (H) (I) (J) (K) (L) (M) (N) (O) (P)(A) (B) (C) (D) (E) (F) (G) (H) (I) (J) (K) (L) (M) (N) (O) (P)(A) (B) (C) (D) (E) (F) (G) (H) (I) (J) (K) (L) (M) (N) (O) (P)(A) (B) (C) (D) (E) (F) (G) (H) (I) (J) (K) (L) (M) (N) (O) (P) TOTAL 823 192 400 211 267 TOTAL 823 192 400 211 267 TOTAL 823 192 400 211 267 TOTAL 823 192 400 211 267 290 118 55 182 241 157 216 430 328 247 214290 118 55 182 241 157 216 430 328 247 214290 118 55 182 241 157 216 430 328 247 214290 118 55 182 241 157 216 430 328 247 214 100% 100% 100% 100% 100% 100% 100% 100% 100% 100% 100% 100% 100% 100% 100% 100%100% 100% 100% 100% 100% 100% 100% 100% 100% 100% 100% 100% 100% 100% 100% 100%100% 100% 100% 100% 100% 100% 100% 100% 100% 100% 100% 100% 100% 100% 100% 100%100% 100% 100% 100% 100% 100% 100% 100% 100% 100% 100% 100% 100% 100% 100% 100% Unweighted Total 823 172 385 244 340 305 73Unweighted Total 823 172 385 244 340 305 73Unweighted Total 823 172 385 244 340 305 73Unweighted Total 823 172 385 244 340 305 73 35 178 205 161 222 417 395 233 16235 178 205 161 222 417 395 233 16235 178 205 161 222 417 395 233 16235 178 205 161 222 417 395 233 162 Better 218 42 89 78 89 82 11 13 34 69 47 68 93 160 41 10Better 218 42 89 78 89 82 11 13 34 69 47 68 93 160 41 10Better 218 42 89 78 89 82 11 13 34 69 47 68 93 160 41 10Better 218 42 89 78 89 82 11 13 34 69 47 68 93 160 41 10 26% 22% 22% 37% 33% 28% 10% 24% 1926% 22% 22% 37% 33% 28% 10% 24% 1926% 22% 22% 37% 33% 28% 10% 24% 1926% 22% 22% 37% 33% 28% 10% 24% 19% 28% 30% 31% 22% 49% 17% 4%% 28% 30% 31% 22% 49% 17% 4%% 28% 30% 31% 22% 49% 17% 4%% 28% 30% 31% 22% 49% 17% 4% BC g i M OP P BC g i M OP P BC g i M OP P BC g i M OP P Worse 324 84 168 65 92 109 64 24 66 104 Worse 324 84 168 65 92 109 64 24 66 104 Worse 324 84 168 65 92 109 64 24 66 104 Worse 324 84 168 65 92 109 64 24 66 104 40 68 207 46 120 14240 68 207 46 120 14240 68 207 46 120 14240 68 207 46 120 142 39% 44% 42% 31% 34% 38% 55% 44% 36% 43% 26% 31% 48% 14% 48% 66%39% 44% 42% 31% 34% 38% 55% 44% 36% 43% 26% 31% 48% 14% 48% 66%39% 44% 42% 31% 34% 38% 55% 44% 36% 43% 26% 31% 48% 14% 48% 66%39% 44% 42% 31% 34% 38% 55% 44% 36% 43% 26% 31% 48% 14% 48% 66% D D D D D D D D KL N NOKL N NOKL N NOKL N NO Same 264 66 132 65 80 94 42 18 77 66 65 73 125 116 77 62Same 264 66 132 65 80 94 42 18 77 66 65 73 125 116 77 62Same 264 66 132 65 80 94 42 18 77 66 65 73 125 116 77 62Same 264 66 132 65 80 94 42 18 77 66 65 73 125 116 77 62 32% 34% 33% 31% 30% 33% 36% 32% 42% 27% 41% 34% 29% 35% 31% 29%32% 34% 33% 31% 30% 33% 36% 32% 42% 27% 41% 34% 29% 35% 31% 29%32% 34% 33% 31% 30% 33% 36% 32% 42% 27% 41% 34% 29% 35% 31% 29%32% 34% 33% 31% 30% 33% 36% 32% 42% 27% 41% 34% 29% 35% 31% 29% J M J M J M J M (Not sure) (Not sure) (Not sure) (Not sure) 17 1 11 3 6 5 17 1 11 3 6 5 17 1 11 3 6 5 17 1 11 3 6 5 ---- ---- 5 3 5 7 5 6 9 15 3 5 7 5 6 9 15 3 5 7 5 6 9 15 3 5 7 5 6 9 1 2% *% 3% 2% 2% 2% 3% 1% 3% 3% 1% 2% 4% *%2% *% 3% 2% 2% 2% 3% 1% 3% 3% 1% 2% 4% *%2% *% 3% 2% 2% 2% 3% 1% 3% 3% 1% 2% 4% *%2% *% 3% 2% 2% 2% 3% 1% 3% 3% 1% 2% 4% *% p p p p Comparison Groups: BCD/EF/GH/IJ/KLM/NOPComparison Groups: BCD/EF/GH/IJ/KLM/NOPComparison Groups: BCD/EF/GH/IJ/KLM/NOPComparison Groups: BCD/EF/GH/IJ/KLM/NOP Independent ZIndependent ZIndependent ZIndependent Z----Test for Percentages (unpooled proportions)Test for Percentages (unpooled proportions)Test for Percentages (unpooled proportions)Test for Percentages (unpooled proportions) Uppercase letters indicate significance at the 95% level.Uppercase letters indicate significance at the 95% level.Uppercase letters indicate significance at the 95% level.Uppercase letters indicate significance at the 95% level. Lowercase letters indicate significance at the 90% level.Lowercase letters indicate significance at the 90% level.Lowercase letters indicate significance at the 90% level.Lowercase letters indicate significance at the 90% level.
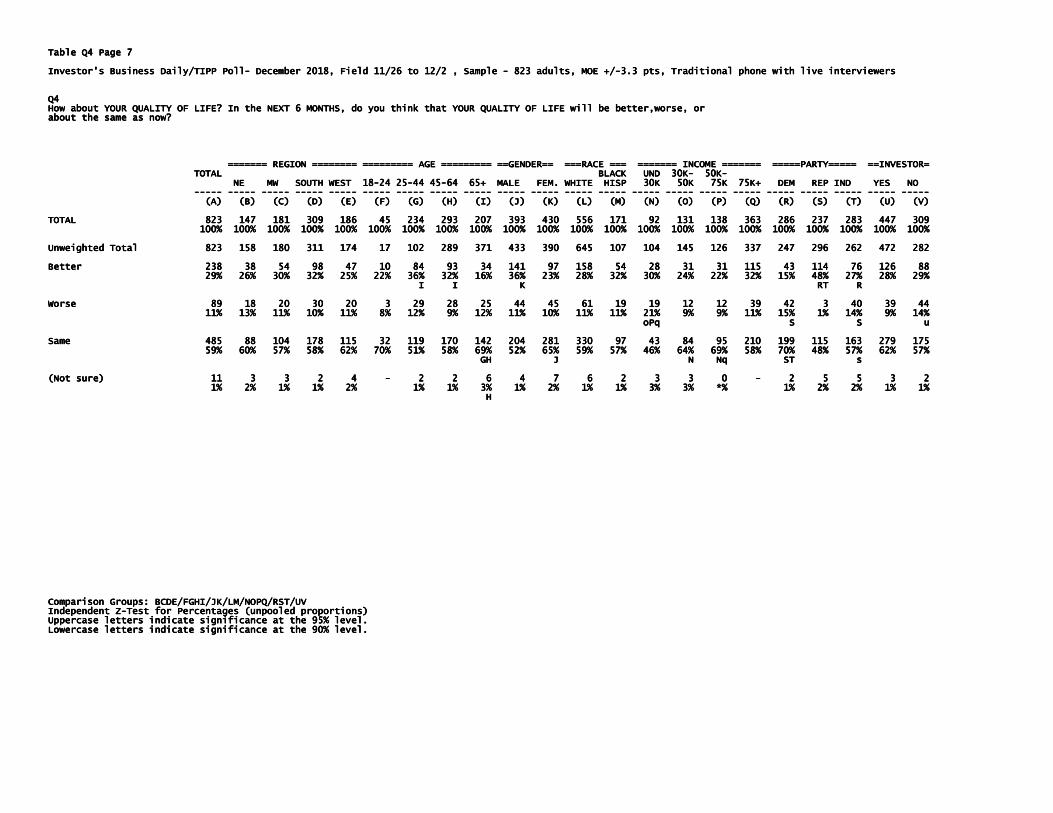
Table Q4 Page 7Table Q4 Page 7Table Q4 Page 7Table Q4 Page 7 Investor's Business Daily/TIPP PollInvestor's Business Daily/TIPP PollInvestor's Business Daily/TIPP PollInvestor's Business Daily/TIPP Poll---- December 2018, Field 11/26 to 12/2 , Sample December 2018, Field 11/26 to 12/2 , Sample December 2018, Field 11/26 to 12/2 , Sample December 2018, Field 11/26 to 12/2 , Sample ---- 823 adults, MOE +/823 adults, MOE +/823 adults, MOE +/823 adults, MOE +/----3.3 pts, Traditional3.3 pts, Traditional3.3 pts, Traditional3.3 pts, Traditional phone with live interviewers phone with live interviewers phone with live interviewers phone with live interviewers Q4Q4Q4Q4 How about YOUR QUALITY OF LIFE? In the NEXT 6 MONTHS, do you think that YOUR QUALITY OF LIFE will be better,worse, or How about YOUR QUALITY OF LIFE? In the NEXT 6 MONTHS, do you think that YOUR QUALITY OF LIFE will be better,worse, or How about YOUR QUALITY OF LIFE? In the NEXT 6 MONTHS, do you think that YOUR QUALITY OF LIFE will be better,worse, or How about YOUR QUALITY OF LIFE? In the NEXT 6 MONTHS, do you think that YOUR QUALITY OF LIFE will be better,worse, or about the same as now?about the same as now?about the same as now?about the same as now? ======= REGION ======== ========= AGE =========== REGION ======== ========= AGE =========== REGION ======== ========= AGE =========== REGION ======== ========= AGE ========= ==GENDER== ===RACE === ======= INCOME ======= =====PARTY===== ==INVESTOR====== ==GENDER== ===RACE === ======= INCOME ======= =====PARTY===== ==INVESTOR====== ==GENDER== ===RACE === ======= INCOME ======= =====PARTY===== ==INVESTOR====== ==GENDER== ===RACE === ======= INCOME ======= =====PARTY===== ==INVESTOR= TOTAL BLACK UND 30KTOTAL BLACK UND 30KTOTAL BLACK UND 30KTOTAL BLACK UND 30K---- 50K50K50K50K---- NE MW SOUTH WEST 18NE MW SOUTH WEST 18NE MW SOUTH WEST 18NE MW SOUTH WEST 18----24 2524 2524 2524 25----44 4544 4544 4544 45----64 65+ MALE FEM. WHITE HISP 30K 50K 75K 75K+ DEM REP IND YES NO 64 65+ MALE FEM. WHITE HISP 30K 50K 75K 75K+ DEM REP IND YES NO 64 65+ MALE FEM. WHITE HISP 30K 50K 75K 75K+ DEM REP IND YES NO 64 65+ MALE FEM. WHITE HISP 30K 50K 75K 75K+ DEM REP IND YES NO -------------------- -------------------- -------------------- -------------------- -------------------- -------------------- -------------------- -------------------- -------------------- -------------------- -------------------- -------------------- -------------------- -------------------- -------------------- -------------------- -------------------- -------------------- -------------------- -------------------- -------------------- -------------------- (A) (B) (C) (D) (E) (F) (G) (H) (I) (J) (K) (L) (M) (N) (O) (P) (Q) (R) (S) (T) (U) (A) (B) (C) (D) (E) (F) (G) (H) (I) (J) (K) (L) (M) (N) (O) (P) (Q) (R) (S) (T) (U) (A) (B) (C) (D) (E) (F) (G) (H) (I) (J) (K) (L) (M) (N) (O) (P) (Q) (R) (S) (T) (U) (A) (B) (C) (D) (E) (F) (G) (H) (I) (J) (K) (L) (M) (N) (O) (P) (Q) (R) (S) (T) (U) (V)(V)(V)(V) TOTAL 823 147 181 309 TOTAL 823 147 181 309 TOTAL 823 147 181 309 TOTAL 823 147 181 309 186 45 234 293 207 393 430 556 171 92 131 138 363 286 237 283 447 309186 45 234 293 207 393 430 556 171 92 131 138 363 286 237 283 447 309186 45 234 293 207 393 430 556 171 92 131 138 363 286 237 283 447 309186 45 234 293 207 393 430 556 171 92 131 138 363 286 237 283 447 309 100% 100% 100% 100% 100% 100% 100% 100% 100% 100% 100% 100% 100% 100% 100% 100% 100% 100% 100% 100% 10100% 100% 100% 100% 100% 100% 100% 100% 100% 100% 100% 100% 100% 100% 100% 100% 100% 100% 100% 100% 10100% 100% 100% 100% 100% 100% 100% 100% 100% 100% 100% 100% 100% 100% 100% 100% 100% 100% 100% 100% 10100% 100% 100% 100% 100% 100% 100% 100% 100% 100% 100% 100% 100% 100% 100% 100% 100% 100% 100% 100% 100% 100%0% 100%0% 100%0% 100% Unweighted Total 823 158 180 311 174 17 102 289 371 433 390 645 107 104 145 126 3Unweighted Total 823 158 180 311 174 17 102 289 371 433 390 645 107 104 145 126 3Unweighted Total 823 158 180 311 174 17 102 289 371 433 390 645 107 104 145 126 3Unweighted Total 823 158 180 311 174 17 102 289 371 433 390 645 107 104 145 126 337 247 296 262 472 28237 247 296 262 472 28237 247 296 262 472 28237 247 296 262 472 282 Better 238 38 54 98 47 10 84 93 34 141 Better 238 38 54 98 47 10 84 93 34 141 Better 238 38 54 98 47 10 84 93 34 141 Better 238 38 54 98 47 10 84 93 34 141 97 158 54 28 31 31 115 43 114 76 126 8897 158 54 28 31 31 115 43 114 76 126 8897 158 54 28 31 31 115 43 114 76 126 8897 158 54 28 31 31 115 43 114 76 126 88 29% 26% 30% 32% 25% 22% 36% 32% 16% 36% 23% 28% 32% 30% 24% 22% 32% 15% 48% 27% 28% 29% 26% 30% 32% 25% 22% 36% 32% 16% 36% 23% 28% 32% 30% 24% 22% 32% 15% 48% 27% 28% 29% 26% 30% 32% 25% 22% 36% 32% 16% 36% 23% 28% 32% 30% 24% 22% 32% 15% 48% 27% 28% 29% 26% 30% 32% 25% 22% 36% 32% 16% 36% 23% 28% 32% 30% 24% 22% 32% 15% 48% 27% 28% 29%29%29%29% I I K RT R I I K RT R I I K RT R I I K RT R Worse 89 18 20 30 20 3 29 28 25 44 45 61Worse 89 18 20 30 20 3 29 28 25 44 45 61Worse 89 18 20 30 20 3 29 28 25 44 45 61Worse 89 18 20 30 20 3 29 28 25 44 45 61 19 19 12 12 39 42 3 40 39 4419 19 12 12 39 42 3 40 39 4419 19 12 12 39 42 3 40 39 4419 19 12 12 39 42 3 40 39 44 11% 13% 11% 10% 11% 8% 12% 9% 12% 11% 10% 11% 11% 21% 9% 9% 11% 15% 1% 14% 9% 11% 13% 11% 10% 11% 8% 12% 9% 12% 11% 10% 11% 11% 21% 9% 9% 11% 15% 1% 14% 9% 11% 13% 11% 10% 11% 8% 12% 9% 12% 11% 10% 11% 11% 21% 9% 9% 11% 15% 1% 14% 9% 11% 13% 11% 10% 11% 8% 12% 9% 12% 11% 10% 11% 11% 21% 9% 9% 11% 15% 1% 14% 9% 14%14%14%14% oPq S S uoPq S S uoPq S S uoPq S S u Same 485 88 104 178 115 32 119 170 142 204 281 330 97 43 84 95 2Same 485 88 104 178 115 32 119 170 142 204 281 330 97 43 84 95 2Same 485 88 104 178 115 32 119 170 142 204 281 330 97 43 84 95 2Same 485 88 104 178 115 32 119 170 142 204 281 330 97 43 84 95 210 199 10 199 10 199 10 199 115 163 279 175115 163 279 175115 163 279 175115 163 279 175 59% 60% 57% 58% 62% 70% 51% 58% 69% 52% 65% 59% 57% 46% 64% 69% 58% 70% 48% 57% 62% 59% 60% 57% 58% 62% 70% 51% 58% 69% 52% 65% 59% 57% 46% 64% 69% 58% 70% 48% 57% 62% 59% 60% 57% 58% 62% 70% 51% 58% 69% 52% 65% 59% 57% 46% 64% 69% 58% 70% 48% 57% 62% 59% 60% 57% 58% 62% 70% 51% 58% 69% 52% 65% 59% 57% 46% 64% 69% 58% 70% 48% 57% 62% 57%57%57%57% GH J N Nq ST s GH J N Nq ST s GH J N Nq ST s GH J N Nq ST s (Not sure) 11 3 3 2 4 (Not sure) 11 3 3 2 4 (Not sure) 11 3 3 2 4 (Not sure) 11 3 3 2 4 ---- 2 2 6 4 7 6 2 3 3 0 2 2 6 4 7 6 2 3 3 0 2 2 6 4 7 6 2 3 3 0 2 2 6 4 7 6 2 3 3 0 ---- 2 5 5 3 22 5 5 3 22 5 5 3 22 5 5 3 2 1% 2% 1% 1% 2% 1% 1% 3% 1% 2% 1% 1% 3% 3% *% 1% 2% 2% 1% 1% 2% 1% 1% 2% 1% 1% 3% 1% 2% 1% 1% 3% 3% *% 1% 2% 2% 1% 1% 2% 1% 1% 2% 1% 1% 3% 1% 2% 1% 1% 3% 3% *% 1% 2% 2% 1% 1% 2% 1% 1% 2% 1% 1% 3% 1% 2% 1% 1% 3% 3% *% 1% 2% 2% 1% 1%1%1%1% H H H H Comparison Groups: BCDE/FGHI/JK/LM/NOPQ/RST/UVComparison Groups: BCDE/FGHI/JK/LM/NOPQ/RST/UVComparison Groups: BCDE/FGHI/JK/LM/NOPQ/RST/UVComparison Groups: BCDE/FGHI/JK/LM/NOPQ/RST/UV Independent ZIndependent ZIndependent ZIndependent Z----Test for Percentages (unpooled proportions)Test for Percentages (unpooled proportions)Test for Percentages (unpooled proportions)Test for Percentages (unpooled proportions) Uppercase letters indicate significance at the 95% level.Uppercase letters indicate significance at the 95% level.Uppercase letters indicate significance at the 95% level.Uppercase letters indicate significance at the 95% level. Lowercase letters indicate significance at the 90% level.Lowercase letters indicate significance at the 90% level.Lowercase letters indicate significance at the 90% level.Lowercase letters indicate significance at the 90% level.

Table Q4 Page 8Table Q4 Page 8Table Q4 Page 8Table Q4 Page 8 Investor's Business Daily/TIPP PollInvestor's Business Daily/TIPP PollInvestor's Business Daily/TIPP PollInvestor's Business Daily/TIPP Poll---- December 2018, Field 11/26 to 12/2 , Sample December 2018, Field 11/26 to 12/2 , Sample December 2018, Field 11/26 to 12/2 , Sample December 2018, Field 11/26 to 12/2 , Sample ---- 823 adults, MOE +/823 adults, MOE +/823 adults, MOE +/823 adults, MOE +/----3.3 pts, Traditional phone with live interviewers 3.3 pts, Traditional phone with live interviewers 3.3 pts, Traditional phone with live interviewers 3.3 pts, Traditional phone with live interviewers Q4Q4Q4Q4 How about YOUR QUALITYHow about YOUR QUALITYHow about YOUR QUALITYHow about YOUR QUALITY OF LIFE? In the NEXT 6 MONTHS, do you think that YOUR QUALITY OF LIFE will be better,worse, or OF LIFE? In the NEXT 6 MONTHS, do you think that YOUR QUALITY OF LIFE will be better,worse, or OF LIFE? In the NEXT 6 MONTHS, do you think that YOUR QUALITY OF LIFE will be better,worse, or OF LIFE? In the NEXT 6 MONTHS, do you think that YOUR QUALITY OF LIFE will be better,worse, or about the same as now?about the same as now?about the same as now?about the same as now? ====AREA TYPE==== ===WHITE=== ==BLK/HISP= ==MAR.STAT= ====EDUCATION==== ====IDEOLOOGY========AREA TYPE==== ===WHITE=== ==BLK/HISP= ==MAR.STAT= ====EDUCATION==== ====IDEOLOOGY========AREA TYPE==== ===WHITE=== ==BLK/HISP= ==MAR.STAT= ====EDUCATION==== ====IDEOLOOGY========AREA TYPE==== ===WHITE=== ==BLK/HISP= ==MAR.STAT= ====EDUCATION==== ====IDEOLOOGY==== SUBSUBSUBSUB---- WHITE SINGL MARR HIGH SOME WHITE SINGL MARR HIGH SOME WHITE SINGL MARR HIGH SOME WHITE SINGL MARR HIGH SOME TOTAL URBAN URBAN RURAL MEN WOMEN BLACK HIS. WOMEN WOM SCHL. COLL. COLL+ CONS. MOD. LIB.TOTAL URBAN URBAN RURAL MEN WOMEN BLACK HIS. WOMEN WOM SCHL. COLL. COLL+ CONS. MOD. LIB.TOTAL URBAN URBAN RURAL MEN WOMEN BLACK HIS. WOMEN WOM SCHL. COLL. COLL+ CONS. MOD. LIB.TOTAL URBAN URBAN RURAL MEN WOMEN BLACK HIS. WOMEN WOM SCHL. COLL. COLL+ CONS. MOD. LIB. -------------------- -------------------- -------------------- -------------------- -------------------- -------------------- -------------------- -------------------- -------------------- -------------------- -------------------- -------------------- -------------------- -------------------- -------------------- -------------------- (A) (B) (C) (D) (E) (F) (G) (H) (I) (J) (K) (L) (M) (N) (O) (P)(A) (B) (C) (D) (E) (F) (G) (H) (I) (J) (K) (L) (M) (N) (O) (P)(A) (B) (C) (D) (E) (F) (G) (H) (I) (J) (K) (L) (M) (N) (O) (P)(A) (B) (C) (D) (E) (F) (G) (H) (I) (J) (K) (L) (M) (N) (O) (P) TOTAL 823 192 400 211 267 290 118 55 182 241 157 216 430 328 247 214TOTAL 823 192 400 211 267 290 118 55 182 241 157 216 430 328 247 214TOTAL 823 192 400 211 267 290 118 55 182 241 157 216 430 328 247 214TOTAL 823 192 400 211 267 290 118 55 182 241 157 216 430 328 247 214 100% 100% 100% 100% 100% 100% 100% 100% 100% 100% 100% 100% 100% 100% 100% 100%100% 100% 100% 100% 100% 100% 100% 100% 100% 100% 100% 100% 100% 100% 100% 100%100% 100% 100% 100% 100% 100% 100% 100% 100% 100% 100% 100% 100% 100% 100% 100%100% 100% 100% 100% 100% 100% 100% 100% 100% 100% 100% 100% 100% 100% 100% 100% Unweighted Unweighted Unweighted Unweighted Total 823 172 385 244 340 305 73 35 178 205 161 222 417 395 233 162Total 823 172 385 244 340 305 73 35 178 205 161 222 417 395 233 162Total 823 172 385 244 340 305 73 35 178 205 161 222 417 395 233 162Total 823 172 385 244 340 305 73 35 178 205 161 222 417 395 233 162 Better 238 46 111 71 100 58 36 20 36 57 53 74 103 149 52 24Better 238 46 111 71 100 58 36 20 36 57 53 74 103 149 52 24Better 238 46 111 71 100 58 36 20 36 57 53 74 103 149 52 24Better 238 46 111 71 100 58 36 20 36 57 53 74 103 149 52 24 29% 24% 28% 34% 38% 20% 30% 36% 20% 24% 34% 34% 24% 45% 21% 11%29% 24% 28% 34% 38% 20% 30% 36% 20% 24% 34% 34% 24% 45% 21% 11%29% 24% 28% 34% 38% 20% 30% 36% 20% 24% 34% 34% 24% 45% 21% 11%29% 24% 28% 34% 38% 20% 30% 36% 20% 24% 34% 34% 24% 45% 21% 11% b F m M OP P b F m M OP P b F m M OP P b F m M OP P Worse 89 Worse 89 Worse 89 Worse 89 21 46 21 27 34 14 4 15 29 18 20 51 12 31 4421 46 21 27 34 14 4 15 29 18 20 51 12 31 4421 46 21 27 34 14 4 15 29 18 20 51 12 31 4421 46 21 27 34 14 4 15 29 18 20 51 12 31 44 11% 11% 11% 10% 10% 12% 12% 8% 8% 12% 11% 9% 12% 4% 12% 20%11% 11% 11% 10% 10% 12% 12% 8% 8% 12% 11% 9% 12% 4% 12% 20%11% 11% 11% 10% 10% 12% 12% 8% 8% 12% 11% 9% 12% 4% 12% 20%11% 11% 11% 10% 10% 12% 12% 8% 8% 12% 11% 9% 12% 4% 12% 20% N NoN NoN NoN No Same 485 123 238 117 136 194 66 31 126 152 85 117 272 164 160 144Same 485 123 238 117 136 194 66 31 126 152 85 117 272 164 160 144Same 485 123 238 117 136 194 66 31 126 152 85 117 272 164 160 144Same 485 123 238 117 136 194 66 31 126 152 85 117 272 164 160 144 59% 64% 59% 55% 51% 59% 64% 59% 55% 51% 59% 64% 59% 55% 51% 59% 64% 59% 55% 51% 67% 56% 56% 69% 63% 54% 54% 63% 50% 65% 67%67% 56% 56% 69% 63% 54% 54% 63% 50% 65% 67%67% 56% 56% 69% 63% 54% 54% 63% 50% 65% 67%67% 56% 56% 69% 63% 54% 54% 63% 50% 65% 67% E l N NE l N NE l N NE l N N (Not sure) 11 3 5 2 3 3 2(Not sure) 11 3 5 2 3 3 2(Not sure) 11 3 5 2 3 3 2(Not sure) 11 3 5 2 3 3 2 ---- 5 3 1 5 5 3 5 25 3 1 5 5 3 5 25 3 1 5 5 3 5 25 3 1 5 5 3 5 2 1% 1% 1% 1% 1% 1% 1% 3% 1% 1% 3% 1% 1% 2% 1%1% 1% 1% 1% 1% 1% 1% 3% 1% 1% 3% 1% 1% 2% 1%1% 1% 1% 1% 1% 1% 1% 3% 1% 1% 3% 1% 1% 2% 1%1% 1% 1% 1% 1% 1% 1% 3% 1% 1% 3% 1% 1% 2% 1% Comparison Groups: BCD/EF/GH/IJ/KLM/NOPComparison Groups: BCD/EF/GH/IJ/KLM/NOPComparison Groups: BCD/EF/GH/IJ/KLM/NOPComparison Groups: BCD/EF/GH/IJ/KLM/NOP Independent ZIndependent ZIndependent ZIndependent Z----Test for Percentages (unpooled proportions)Test for Percentages (unpooled proportions)Test for Percentages (unpooled proportions)Test for Percentages (unpooled proportions) Uppercase letters indicate significance at the 95% level.Uppercase letters indicate significance at the 95% level.Uppercase letters indicate significance at the 95% level.Uppercase letters indicate significance at the 95% level. Lowercase letters indicate significance at the 90% level.Lowercase letters indicate significance at the 90% level.Lowercase letters indicate significance at the 90% level.Lowercase letters indicate significance at the 90% level.

Table Q5 Page 9Table Q5 Page 9Table Q5 Page 9Table Q5 Page 9 Investor's Business Daily/TIPP PollInvestor's Business Daily/TIPP PollInvestor's Business Daily/TIPP PollInvestor's Business Daily/TIPP Poll---- December 2018, Field 11/26 December 2018, Field 11/26 December 2018, Field 11/26 December 2018, Field 11/26 to 12/2 , Sample to 12/2 , Sample to 12/2 , Sample to 12/2 , Sample ---- 823 adults, MOE +/823 adults, MOE +/823 adults, MOE +/823 adults, MOE +/----3.3 pts, Traditional phone with live interviewers 3.3 pts, Traditional phone with live interviewers 3.3 pts, Traditional phone with live interviewers 3.3 pts, Traditional phone with live interviewers Q5Q5Q5Q5 In the NEXT 6 MONTHS, do you think that ECONOMIC CONDITIONS in the country will be better, worse, or about the same as In the NEXT 6 MONTHS, do you think that ECONOMIC CONDITIONS in the country will be better, worse, or about the same as In the NEXT 6 MONTHS, do you think that ECONOMIC CONDITIONS in the country will be better, worse, or about the same as In the NEXT 6 MONTHS, do you think that ECONOMIC CONDITIONS in the country will be better, worse, or about the same as now?now?now?now? ======= REGION ======== ========= AGE ========= ==GENDER== ===RACE === ======= INCOME ======= =====PARTY===== ==INVESTOR======== REGION ======== ========= AGE ========= ==GENDER== ===RACE === ======= INCOME ======= =====PARTY===== ==INVESTOR======== REGION ======== ========= AGE ========= ==GENDER== ===RACE === ======= INCOME ======= =====PARTY===== ==INVESTOR======== REGION ======== ========= AGE ========= ==GENDER== ===RACE === ======= INCOME ======= =====PARTY===== ==INVESTOR= TOTAL TOTAL TOTAL TOTAL BLACK UND 30KBLACK UND 30KBLACK UND 30KBLACK UND 30K---- 50K50K50K50K---- NE MW SOUTH WEST 18NE MW SOUTH WEST 18NE MW SOUTH WEST 18NE MW SOUTH WEST 18----24 2524 2524 2524 25----44 4544 4544 4544 45----64 65+ MALE FEM. WHITE HISP 30K 50K 75K 75K+ DEM REP IND YES NO 64 65+ MALE FEM. WHITE HISP 30K 50K 75K 75K+ DEM REP IND YES NO 64 65+ MALE FEM. WHITE HISP 30K 50K 75K 75K+ DEM REP IND YES NO 64 65+ MALE FEM. WHITE HISP 30K 50K 75K 75K+ DEM REP IND YES NO -------------------- -------------------- -------------------- -------------------- -------------------- -------------------- -------------------- -------------------- -------------------- -------------------- -------------------- -------------------- -------------------- -------------------- -------------------- -------------------- -------------------- -------------------- -------------------- -------------------- -------------------- -------------------- (A) (B) (C) (D) (E) (F) (G) (H) (I) (J) (K) (L) (M) (N) (O) (P) (Q) (R) (A) (B) (C) (D) (E) (F) (G) (H) (I) (J) (K) (L) (M) (N) (O) (P) (Q) (R) (A) (B) (C) (D) (E) (F) (G) (H) (I) (J) (K) (L) (M) (N) (O) (P) (Q) (R) (A) (B) (C) (D) (E) (F) (G) (H) (I) (J) (K) (L) (M) (N) (O) (P) (Q) (R) (S) (T) (U) (V)(S) (T) (U) (V)(S) (T) (U) (V)(S) (T) (U) (V) TOTAL 823 147 181 309 186 45 234 293 207 393 430 556 171 92 131 138 3TOTAL 823 147 181 309 186 45 234 293 207 393 430 556 171 92 131 138 3TOTAL 823 147 181 309 186 45 234 293 207 393 430 556 171 92 131 138 3TOTAL 823 147 181 309 186 45 234 293 207 393 430 556 171 92 131 138 363 286 237 283 447 30963 286 237 283 447 30963 286 237 283 447 30963 286 237 283 447 309 100% 100% 100% 100% 100% 100% 100% 100% 100% 100% 100% 100% 100% 100% 100% 100% 100% 100% 100% 100% 100% 100% 100% 100% 100% 100% 100% 100% 100% 100% 100% 100% 100% 100% 100% 100% 100% 100% 100% 100% 100% 100% 100% 100% 100% 100%100% 100% 100% 100% 100% 100% 100% 100% 100% 100% 100% 100% 100% 100%100% 100% 100% 100% 100% 100% 100% 100% 100% 100% 100% 100% 100% 100%100% 100% 100% 100% 100% 100% 100% 100% 100% 100% 100% 100% 100% 100% Unweighted Total 823 158 180 311 174 17 102 289 371 433 390 645 107 104 145 126 3Unweighted Total 823 158 180 311 174 17 102 289 371 433 390 645 107 104 145 126 3Unweighted Total 823 158 180 311 174 17 102 289 371 433 390 645 107 104 145 126 3Unweighted Total 823 158 180 311 174 17 102 289 371 433 390 645 107 104 145 126 337 247 296 262 472 28237 247 296 262 472 28237 247 296 262 472 28237 247 296 262 472 282 Better Better Better Better 213 40 40 90 42 9 41 92 50 120 92 165 20 22 29 42 89 12 125 72 119 213 40 40 90 42 9 41 92 50 120 92 165 20 22 29 42 89 12 125 72 119 213 40 40 90 42 9 41 92 50 120 92 165 20 22 29 42 89 12 125 72 119 213 40 40 90 42 9 41 92 50 120 92 165 20 22 29 42 89 12 125 72 119 71717171 26% 28% 22% 29% 23% 19% 18% 31% 24% 31% 21% 30% 11% 24% 26% 28% 22% 29% 23% 19% 18% 31% 24% 31% 21% 30% 11% 24% 26% 28% 22% 29% 23% 19% 18% 31% 24% 31% 21% 30% 11% 24% 26% 28% 22% 29% 23% 19% 18% 31% 24% 31% 21% 30% 11% 24% 22% 30% 25% 4% 53% 25% 27% 23%22% 30% 25% 4% 53% 25% 27% 23%22% 30% 25% 4% 53% 25% 27% 23%22% 30% 25% 4% 53% 25% 27% 23% Gi K M RT R Gi K M RT R Gi K M RT R Gi K M RT R Worse 269 45 72 89 Worse 269 45 72 89 Worse 269 45 72 89 Worse 269 45 72 89 63 14 92 84 71 132 137 177 71 30 34 52 123 145 24 97 143 10063 14 92 84 71 132 137 177 71 30 34 52 123 145 24 97 143 10063 14 92 84 71 132 137 177 71 30 34 52 123 145 24 97 143 10063 14 92 84 71 132 137 177 71 30 34 52 123 145 24 97 143 100 33% 30% 40% 29% 34% 31% 39% 29% 34% 34% 32% 32% 42% 33% 26% 38% 34% 51% 10% 34% 33% 30% 40% 29% 34% 31% 39% 29% 34% 34% 32% 32% 42% 33% 26% 38% 34% 51% 10% 34% 33% 30% 40% 29% 34% 31% 39% 29% 34% 34% 32% 32% 42% 33% 26% 38% 34% 51% 10% 34% 33% 30% 40% 29% 34% 31% 39% 29% 34% 34% 32% 32% 42% 33% 26% 38% 34% 51% 10% 34% 32% 33%32% 33%32% 33%32% 33% D h l o ST S D h l o ST S D h l o ST S D h l o ST S Same 307 56 64 123 65 16 95 106 76 133 Same 307 56 64 123 65 16 95 106 76 133 Same 307 56 64 123 65 16 95 106 76 133 Same 307 56 64 123 65 16 95 106 76 133 174 187 79 36 63 42 131 114 82 104 166 124174 187 79 36 63 42 131 114 82 104 166 124174 187 79 36 63 42 131 114 82 104 166 124174 187 79 36 63 42 131 114 82 104 166 124 37% 38% 35% 40% 35% 35% 41% 36% 37% 34% 40% 34% 46% 39% 48% 30% 36% 40% 35% 37% 37% 37% 38% 35% 40% 35% 35% 41% 36% 37% 34% 40% 34% 46% 39% 48% 30% 36% 40% 35% 37% 37% 37% 38% 35% 40% 35% 35% 41% 36% 37% 34% 40% 34% 46% 39% 48% 30% 36% 40% 35% 37% 37% 37% 38% 35% 40% 35% 35% 41% 36% 37% 34% 40% 34% 46% 39% 48% 30% 36% 40% 35% 37% 37% 40%40%40%40% L PQ L PQ L PQ L PQ (Not sure) 34 6 6 7 15 7 5 11 10 7 27 27 2 4 5 2 (Not sure) 34 6 6 7 15 7 5 11 10 7 27 27 2 4 5 2 (Not sure) 34 6 6 7 15 7 5 11 10 7 27 27 2 4 5 2 (Not sure) 34 6 6 7 15 7 5 11 10 7 27 27 2 4 5 2 20 15 6 11 19 1320 15 6 11 19 1320 15 6 11 19 1320 15 6 11 19 13 4% 4% 3% 2% 8% 15% 2% 4% 5% 2% 6% 5% 1% 5% 4% 2% 5% 5% 3% 4% 4% 4% 4% 3% 2% 8% 15% 2% 4% 5% 2% 6% 5% 1% 5% 4% 2% 5% 5% 3% 4% 4% 4% 4% 3% 2% 8% 15% 2% 4% 5% 2% 6% 5% 1% 5% 4% 2% 5% 5% 3% 4% 4% 4% 4% 3% 2% 8% 15% 2% 4% 5% 2% 6% 5% 1% 5% 4% 2% 5% 5% 3% 4% 4% 4%4%4%4% cD cD cD cD J M J M J M J M Comparison Groups: BCDE/FGHI/JK/LM/NOPQ/RST/UVComparison Groups: BCDE/FGHI/JK/LM/NOPQ/RST/UVComparison Groups: BCDE/FGHI/JK/LM/NOPQ/RST/UVComparison Groups: BCDE/FGHI/JK/LM/NOPQ/RST/UV Independent ZIndependent ZIndependent ZIndependent Z----Test for Percentages (unpooled proportions)Test for Percentages (unpooled proportions)Test for Percentages (unpooled proportions)Test for Percentages (unpooled proportions) Uppercase letters indicate significance at the 95% level.Uppercase letters indicate significance at the 95% level.Uppercase letters indicate significance at the 95% level.Uppercase letters indicate significance at the 95% level. Lowercase letters indicate significance at the 90% level.Lowercase letters indicate significance at the 90% level.Lowercase letters indicate significance at the 90% level.Lowercase letters indicate significance at the 90% level.

Table Q5 Page 10Table Q5 Page 10Table Q5 Page 10Table Q5 Page 10 Investor's Business Daily/TIPP PollInvestor's Business Daily/TIPP PollInvestor's Business Daily/TIPP PollInvestor's Business Daily/TIPP Poll---- December 2018, Field 11/26 to 12/2 , Sample December 2018, Field 11/26 to 12/2 , Sample December 2018, Field 11/26 to 12/2 , Sample December 2018, Field 11/26 to 12/2 , Sample ---- 823 adults, MOE +/823 adults, MOE +/823 adults, MOE +/823 adults, MOE +/----3.3 pts, Traditiona3.3 pts, Traditiona3.3 pts, Traditiona3.3 pts, Traditional phone with live interviewers l phone with live interviewers l phone with live interviewers l phone with live interviewers Q5Q5Q5Q5 In the NEXT 6 MONTHS, do you think that ECONOMIC CONDITIONS in the country will be better, worse, or about the same as In the NEXT 6 MONTHS, do you think that ECONOMIC CONDITIONS in the country will be better, worse, or about the same as In the NEXT 6 MONTHS, do you think that ECONOMIC CONDITIONS in the country will be better, worse, or about the same as In the NEXT 6 MONTHS, do you think that ECONOMIC CONDITIONS in the country will be better, worse, or about the same as now?now?now?now? ====AREA TYPE==== ===WHITE=== ==BLK/HISP= ==MAR.STAT= ====EDUCATION==== ====IDEOLOOGY========AREA TYPE==== ===WHITE=== ==BLK/HISP= ==MAR.STAT= ====EDUCATION==== ====IDEOLOOGY========AREA TYPE==== ===WHITE=== ==BLK/HISP= ==MAR.STAT= ====EDUCATION==== ====IDEOLOOGY========AREA TYPE==== ===WHITE=== ==BLK/HISP= ==MAR.STAT= ====EDUCATION==== ====IDEOLOOGY==== SUBSUBSUBSUB---- WHITE SINGL MARR HIGH SOME WHITE SINGL MARR HIGH SOME WHITE SINGL MARR HIGH SOME WHITE SINGL MARR HIGH SOME TOTAL URBAN URBAN RURAL MEN WOMEN BLACK HIS. WOMEN WOM SCHL. COLL. COLL+ CONS. MOD. LIB.TOTAL URBAN URBAN RURAL MEN WOMEN BLACK HIS. WOMEN WOM SCHL. COLL. COLL+ CONS. MOD. LIB.TOTAL URBAN URBAN RURAL MEN WOMEN BLACK HIS. WOMEN WOM SCHL. COLL. COLL+ CONS. MOD. LIB.TOTAL URBAN URBAN RURAL MEN WOMEN BLACK HIS. WOMEN WOM SCHL. COLL. COLL+ CONS. MOD. LIB. -------------------- -------------------- -------------------- -------------------- -------------------- -------------------- -------------------- -------------------- -------------------- -------------------- -------------------- -------------------- -------------------- -------------------- -------------------- -------------------- (A) (B) (C) (D) (E) (F) (G) (H) (I) (J) (K) (L) (M) (N) (O) (P)(A) (B) (C) (D) (E) (F) (G) (H) (I) (J) (K) (L) (M) (N) (O) (P)(A) (B) (C) (D) (E) (F) (G) (H) (I) (J) (K) (L) (M) (N) (O) (P)(A) (B) (C) (D) (E) (F) (G) (H) (I) (J) (K) (L) (M) (N) (O) (P) TOTAL 823 192 400 211 267 290 118 55 182 241 157 216 430 328 247 214TOTAL 823 192 400 211 267 290 118 55 182 241 157 216 430 328 247 214TOTAL 823 192 400 211 267 290 118 55 182 241 157 216 430 328 247 214TOTAL 823 192 400 211 267 290 118 55 182 241 157 216 430 328 247 214 100% 10100% 10100% 10100% 100% 100% 100% 100% 100% 100% 100% 100% 100% 100% 100% 100% 100% 100% 100%0% 100% 100% 100% 100% 100% 100% 100% 100% 100% 100% 100% 100% 100% 100%0% 100% 100% 100% 100% 100% 100% 100% 100% 100% 100% 100% 100% 100% 100%0% 100% 100% 100% 100% 100% 100% 100% 100% 100% 100% 100% 100% 100% 100% Unweighted Total 823 172 385 244 340 305 73 35 178 205 161 222 417 395 233 162Unweighted Total 823 172 385 244 340 305 73 35 178 205 161 222 417 395 233 162Unweighted Total 823 172 385 244 340 305 73 35 178 205 161 222 417 395 233 162Unweighted Total 823 172 385 244 340 305 73 35 178 205 161 222 417 395 233 162 Better 213 36 92 Better 213 36 92 Better 213 36 92 Better 213 36 92 74 101 64 11 10 35 52 54 64 85 152 46 974 101 64 11 10 35 52 54 64 85 152 46 974 101 64 11 10 35 52 54 64 85 152 46 974 101 64 11 10 35 52 54 64 85 152 46 9 26% 19% 23% 35% 38% 22% 9% 18% 19% 22% 34% 30% 20% 46% 18% 4%26% 19% 23% 35% 38% 22% 9% 18% 19% 22% 34% 30% 20% 46% 18% 4%26% 19% 23% 35% 38% 22% 9% 18% 19% 22% 34% 30% 20% 46% 18% 4%26% 19% 23% 35% 38% 22% 9% 18% 19% 22% 34% 30% 20% 46% 18% 4% BC F BC F BC F BC F M M OP P M M OP P M M OP P M M OP P Worse 269 61 141 64 82 94 50 21 63 73 43 58 163 46 92 115Worse 269 61 141 64 82 94 50 21 63 73 43 58 163 46 92 115Worse 269 61 141 64 82 94 50 21 63 73 43 58 163 46 92 115Worse 269 61 141 64 82 94 50 21 63 73 43 58 163 46 92 115 33% 32% 35% 30% 31% 33% 43% 33% 32% 35% 30% 31% 33% 43% 33% 32% 35% 30% 31% 33% 43% 33% 32% 35% 30% 31% 33% 43% 38% 34% 30% 28% 27% 38% 14% 37% 54%38% 34% 30% 28% 27% 38% 14% 37% 54%38% 34% 30% 28% 27% 38% 14% 37% 54%38% 34% 30% 28% 27% 38% 14% 37% 54% KL N NOKL N NOKL N NOKL N NO Same 307 90 149 65 77 110 55 24 74Same 307 90 149 65 77 110 55 24 74Same 307 90 149 65 77 110 55 24 74Same 307 90 149 65 77 110 55 24 74 99 58 84 160 117 103 7799 58 84 160 117 103 7799 58 84 160 117 103 7799 58 84 160 117 103 77 37% 47% 37% 31% 29% 38% 47% 44% 40% 41% 37% 39% 37% 36% 42% 36%37% 47% 37% 31% 29% 38% 47% 44% 40% 41% 37% 39% 37% 36% 42% 36%37% 47% 37% 31% 29% 38% 47% 44% 40% 41% 37% 39% 37% 36% 42% 36%37% 47% 37% 31% 29% 38% 47% 44% 40% 41% 37% 39% 37% 36% 42% 36% cD e cD e cD e cD e (Not sure) 34 5 18 9 6 21 2 (Not sure) 34 5 18 9 6 21 2 (Not sure) 34 5 18 9 6 21 2 (Not sure) 34 5 18 9 6 21 2 ---- 11 16 2 9 23 13 6 1311 16 2 9 23 13 6 1311 16 2 9 23 13 6 1311 16 2 9 23 13 6 13 4% 3% 5% 4% 2% 7% 2% 6% 7% 1% 4% 5% 4% 3% 6%4% 3% 5% 4% 2% 7% 2% 6% 7% 1% 4% 5% 4% 3% 6%4% 3% 5% 4% 2% 7% 2% 6% 7% 1% 4% 5% 4% 3% 6%4% 3% 5% 4% 2% 7% 2% 6% 7% 1% 4% 5% 4% 3% 6% E K E K E K E K CoCoCoComparison Groups: BCD/EF/GH/IJ/KLM/NOPmparison Groups: BCD/EF/GH/IJ/KLM/NOPmparison Groups: BCD/EF/GH/IJ/KLM/NOPmparison Groups: BCD/EF/GH/IJ/KLM/NOP Independent ZIndependent ZIndependent ZIndependent Z----Test for Percentages (unpooled proportions)Test for Percentages (unpooled proportions)Test for Percentages (unpooled proportions)Test for Percentages (unpooled proportions) Uppercase letters indicate significance at the 95% level.Uppercase letters indicate significance at the 95% level.Uppercase letters indicate significance at the 95% level.Uppercase letters indicate significance at the 95% level. Lowercase letters indicate significance at the 90% level.Lowercase letters indicate significance at the 90% level.Lowercase letters indicate significance at the 90% level.Lowercase letters indicate significance at the 90% level.

Table Q6 Page 11Table Q6 Page 11Table Q6 Page 11Table Q6 Page 11 Investor's Business Daily/TIPP PollInvestor's Business Daily/TIPP PollInvestor's Business Daily/TIPP PollInvestor's Business Daily/TIPP Poll---- December 2018, Field 11/26 to 12/2 , Sample December 2018, Field 11/26 to 12/2 , Sample December 2018, Field 11/26 to 12/2 , Sample December 2018, Field 11/26 to 12/2 , Sample ---- 823 adults, MOE +/823 adults, MOE +/823 adults, MOE +/823 adults, MOE +/----3.3 pts, Traditional phone with live interviewers 3.3 pts, Traditional phone with live interviewers 3.3 pts, Traditional phone with live interviewers 3.3 pts, Traditional phone with live interviewers Q6Q6Q6Q6 In the NEXT 6 MONTHS, do you think that YOUR PERSONAL FINANCIAL SITUATION will be better, worse, oIn the NEXT 6 MONTHS, do you think that YOUR PERSONAL FINANCIAL SITUATION will be better, worse, oIn the NEXT 6 MONTHS, do you think that YOUR PERSONAL FINANCIAL SITUATION will be better, worse, oIn the NEXT 6 MONTHS, do you think that YOUR PERSONAL FINANCIAL SITUATION will be better, worse, or about the same as r about the same as r about the same as r about the same as now?now?now?now? ======= REGION ======== ========= AGE ========= ==GENDER== ===RACE === ======= INCOME ======= =====PARTY===== ==INVESTOR======== REGION ======== ========= AGE ========= ==GENDER== ===RACE === ======= INCOME ======= =====PARTY===== ==INVESTOR======== REGION ======== ========= AGE ========= ==GENDER== ===RACE === ======= INCOME ======= =====PARTY===== ==INVESTOR======== REGION ======== ========= AGE ========= ==GENDER== ===RACE === ======= INCOME ======= =====PARTY===== ==INVESTOR= TOTAL TOTAL TOTAL TOTAL BLACK UND 30KBLACK UND 30KBLACK UND 30KBLACK UND 30K---- 50K50K50K50K---- NE MW SOUTH WEST 18NE MW SOUTH WEST 18NE MW SOUTH WEST 18NE MW SOUTH WEST 18----24 2524 2524 2524 25----44 4544 4544 4544 45----64 65+ MALE FEM. WHITE HISP 30K 50K 75K 75K+ DEM REP IND YES NO 64 65+ MALE FEM. WHITE HISP 30K 50K 75K 75K+ DEM REP IND YES NO 64 65+ MALE FEM. WHITE HISP 30K 50K 75K 75K+ DEM REP IND YES NO 64 65+ MALE FEM. WHITE HISP 30K 50K 75K 75K+ DEM REP IND YES NO -------------------- -------------------- -------------------- -------------------- -------------------- -------------------- -------------------- -------------------- -------------------- -------------------- -------------------- -------------------- -------------------- -------------------- -------------------- -------------------- -------------------- -------------------- -------------------- -------------------- -------------------- -------------------- (A) (B) (C) (D) (E) (F) (G) (H) (I) (J) (K) (L) (M) (A) (B) (C) (D) (E) (F) (G) (H) (I) (J) (K) (L) (M) (A) (B) (C) (D) (E) (F) (G) (H) (I) (J) (K) (L) (M) (A) (B) (C) (D) (E) (F) (G) (H) (I) (J) (K) (L) (M) (N) (O) (P) (Q) (R) (S) (T) (U) (V)(N) (O) (P) (Q) (R) (S) (T) (U) (V)(N) (O) (P) (Q) (R) (S) (T) (U) (V)(N) (O) (P) (Q) (R) (S) (T) (U) (V) TOTAL 823 147 181 309 186 45 234 293 207 393 430 556 171 92 131 138 3TOTAL 823 147 181 309 186 45 234 293 207 393 430 556 171 92 131 138 3TOTAL 823 147 181 309 186 45 234 293 207 393 430 556 171 92 131 138 3TOTAL 823 147 181 309 186 45 234 293 207 393 430 556 171 92 131 138 363 286 237 283 447 30963 286 237 283 447 30963 286 237 283 447 30963 286 237 283 447 309 100% 100% 100% 100% 100% 100% 100% 100% 100% 100% 100% 100% 100% 100% 100% 100% 100% 100% 100% 100% 100% 100% 100% 100% 100% 100% 100% 100% 100% 100% 100%100% 100% 100% 100% 100% 100% 100% 100% 100% 100% 100% 100% 100% 100% 100% 100% 100% 100% 100%100% 100% 100% 100% 100% 100% 100% 100% 100% 100% 100% 100% 100% 100% 100% 100% 100% 100% 100%100% 100% 100% 100% 100% 100% 100% 100% 100% 100% 100% 100% 100% 100% 100% 100% 100% 100% 100% Unweighted Total 823 158 180 311 174 17 102 289 371 433 390 645 107 104 145 126 3Unweighted Total 823 158 180 311 174 17 102 289 371 433 390 645 107 104 145 126 3Unweighted Total 823 158 180 311 174 17 102 289 371 433 390 645 107 104 145 126 3Unweighted Total 823 158 180 311 174 17 102 289 371 433 390 645 107 104 145 126 337 247 296 37 247 296 37 247 296 37 247 296 262 472 282262 472 282262 472 282262 472 282 Better 271 47 60 115 50 20 106 97 37 145 126 186 56 26 36 43 1Better 271 47 60 115 50 20 106 97 37 145 126 186 56 26 36 43 1Better 271 47 60 115 50 20 106 97 37 145 126 186 56 26 36 43 1Better 271 47 60 115 50 20 106 97 37 145 126 186 56 26 36 43 139 64 115 91 154 9839 64 115 91 154 9839 64 115 91 154 9839 64 115 91 154 98 33% 32% 33% 37% 27% 44% 46% 33% 18% 33% 32% 33% 37% 27% 44% 46% 33% 18% 33% 32% 33% 37% 27% 44% 46% 33% 18% 33% 32% 33% 37% 27% 44% 46% 33% 18% 37% 29% 33% 33% 28% 27% 31% 38% 22% 48% 32% 34% 32%37% 29% 33% 33% 28% 27% 31% 38% 22% 48% 32% 34% 32%37% 29% 33% 33% 28% 27% 31% 38% 22% 48% 32% 34% 32%37% 29% 33% 33% 28% 27% 31% 38% 22% 48% 32% 34% 32% e I HI I K nO RT R e I HI I K nO RT R e I HI I K nO RT R e I HI I K nO RT R Worse 96 26 20 32 17 8 28 34 23 47 48 61 23 21 14 13 Worse 96 26 20 32 17 8 28 34 23 47 48 61 23 21 14 13 Worse 96 26 20 32 17 8 28 34 23 47 48 61 23 21 14 13 Worse 96 26 20 32 17 8 28 34 23 47 48 61 23 21 14 13 35 51 8 33 37 4635 51 8 33 37 4635 51 8 33 37 4635 51 8 33 37 46 12% 17% 11% 10% 9% 17% 12% 12% 11% 12% 11% 11% 12% 17% 11% 10% 9% 17% 12% 12% 11% 12% 11% 11% 12% 17% 11% 10% 9% 17% 12% 12% 11% 12% 11% 11% 12% 17% 11% 10% 9% 17% 12% 12% 11% 12% 11% 11% 13% 23% 11% 9% 10% 18% 3% 12% 8% 15%13% 23% 11% 9% 10% 18% 3% 12% 8% 15%13% 23% 11% 9% 10% 18% 3% 12% 8% 15%13% 23% 11% 9% 10% 18% 3% 12% 8% 15% de oPQ St S Ude oPQ St S Ude oPQ St S Ude oPQ St S U Same 448 73Same 448 73Same 448 73Same 448 73 99 161 116 17 100 159 145 200 249 305 92 45 81 82 187 168 111 158 253 16499 161 116 17 100 159 145 200 249 305 92 45 81 82 187 168 111 158 253 16499 161 116 17 100 159 145 200 249 305 92 45 81 82 187 168 111 158 253 16499 161 116 17 100 159 145 200 249 305 92 45 81 82 187 168 111 158 253 164 55% 50% 55% 52% 62% 39% 43% 54% 70% 51% 58% 55% 54% 49% 62% 60% 51% 59% 55% 50% 55% 52% 62% 39% 43% 54% 70% 51% 58% 55% 54% 49% 62% 60% 51% 59% 55% 50% 55% 52% 62% 39% 43% 54% 70% 51% 58% 55% 54% 49% 62% 60% 51% 59% 55% 50% 55% 52% 62% 39% 43% 54% 70% 51% 58% 55% 54% 49% 62% 60% 51% 59% 47% 56% 56% 53%47% 56% 56% 53%47% 56% 56% 53%47% 56% 56% 53% bd G FGH j nq S s bd G FGH j nq S s bd G FGH j nq S s bd G FGH j nq S s (Not sure) 7 2 2 1 2 (Not sure) 7 2 2 1 2 (Not sure) 7 2 2 1 2 (Not sure) 7 2 2 1 2 ---- ---- 2 2 2 2 3 1 6 4 3 1 6 4 3 1 6 4 3 1 6 4 ---- 0 0 0 0 0 0 0 0 ---- 3 2 3 2 4 13 2 3 2 4 13 2 3 2 4 13 2 3 2 4 1 1% 1% 1% *% 1% 1% 1% *% 1% 1% *% *% 1% 1% 1% 1% 1% 1% 1% 1% *% 1% 1% 1% *% 1% 1% *% *% 1% 1% 1% 1% 1% 1% 1% 1% *% 1% 1% 1% *% 1% 1% *% *% 1% 1% 1% 1% 1% 1% 1% 1% *% 1% 1% 1% *% 1% 1% *% *% 1% 1% 1% 1% 1% *%*%*%*% Comparison Groups: BCDE/FGHI/JK/LM/NOPQ/RST/UVComparison Groups: BCDE/FGHI/JK/LM/NOPQ/RST/UVComparison Groups: BCDE/FGHI/JK/LM/NOPQ/RST/UVComparison Groups: BCDE/FGHI/JK/LM/NOPQ/RST/UV Independent ZIndependent ZIndependent ZIndependent Z----Test for Percentages (unpooled proportions)Test for Percentages (unpooled proportions)Test for Percentages (unpooled proportions)Test for Percentages (unpooled proportions) Uppercase letters indicate significance at the 95% level.Uppercase letters indicate significance at the 95% level.Uppercase letters indicate significance at the 95% level.Uppercase letters indicate significance at the 95% level. Lowercase letters indicate significance at the 90% level.Lowercase letters indicate significance at the 90% level.Lowercase letters indicate significance at the 90% level.Lowercase letters indicate significance at the 90% level.

Table Q6 Page 12Table Q6 Page 12Table Q6 Page 12Table Q6 Page 12 Investor's Business Daily/TIPP PollInvestor's Business Daily/TIPP PollInvestor's Business Daily/TIPP PollInvestor's Business Daily/TIPP Poll---- December 2018, Field 11/26 to 12/2 , Sample December 2018, Field 11/26 to 12/2 , Sample December 2018, Field 11/26 to 12/2 , Sample December 2018, Field 11/26 to 12/2 , Sample ---- 823 adults, MOE +/823 adults, MOE +/823 adults, MOE +/823 adults, MOE +/----3.3 pts, Traditional phone with live interviewers 3.3 pts, Traditional phone with live interviewers 3.3 pts, Traditional phone with live interviewers 3.3 pts, Traditional phone with live interviewers Q6Q6Q6Q6 In the NEXT 6 MONTHS, do you think that YOUR PERSONAL FINANCIAL SITUATION will be better, worse, oIn the NEXT 6 MONTHS, do you think that YOUR PERSONAL FINANCIAL SITUATION will be better, worse, oIn the NEXT 6 MONTHS, do you think that YOUR PERSONAL FINANCIAL SITUATION will be better, worse, oIn the NEXT 6 MONTHS, do you think that YOUR PERSONAL FINANCIAL SITUATION will be better, worse, or about the same as r about the same as r about the same as r about the same as now?now?now?now? ====AREA TYPE==== ===WHITE=== ==BLK/HISP= ==MAR.STAT= ====EDUCATION==== ====IDEOLOOGY========AREA TYPE==== ===WHITE=== ==BLK/HISP= ==MAR.STAT= ====EDUCATION==== ====IDEOLOOGY========AREA TYPE==== ===WHITE=== ==BLK/HISP= ==MAR.STAT= ====EDUCATION==== ====IDEOLOOGY========AREA TYPE==== ===WHITE=== ==BLK/HISP= ==MAR.STAT= ====EDUCATION==== ====IDEOLOOGY==== SUBSUBSUBSUB---- WHITE SINGL MARR HIGH SOME WHITE SINGL MARR HIGH SOME WHITE SINGL MARR HIGH SOME WHITE SINGL MARR HIGH SOME TOTAL URBAN URBAN RURAL MEN WOMEN BLACK HIS. WOMEN WOM SCHL. COLL. COLL+ CONS. MOD. LIB.TOTAL URBAN URBAN RURAL MEN WOMEN BLACK HIS. WOMEN WOM SCHL. COLL. COLL+ CONS. MOD. LIB.TOTAL URBAN URBAN RURAL MEN WOMEN BLACK HIS. WOMEN WOM SCHL. COLL. COLL+ CONS. MOD. LIB.TOTAL URBAN URBAN RURAL MEN WOMEN BLACK HIS. WOMEN WOM SCHL. COLL. COLL+ CONS. MOD. LIB. -------------------- -------------------- -------------------- -------------------- -------------------- -------------------- -------------------- -------------------- -------------------- -------------------- -------------------- -------------------- -------------------- -------------------- -------------------- -------------------- (A) (B) (C) (D) (E) (F) (G) (H) (I) (J) (K) (L) (M) (N) (O) (P)(A) (B) (C) (D) (E) (F) (G) (H) (I) (J) (K) (L) (M) (N) (O) (P)(A) (B) (C) (D) (E) (F) (G) (H) (I) (J) (K) (L) (M) (N) (O) (P)(A) (B) (C) (D) (E) (F) (G) (H) (I) (J) (K) (L) (M) (N) (O) (P) TOTAL 823 192 400 211 267 290 118 55 182 241 157 216 430 328 247 214TOTAL 823 192 400 211 267 290 118 55 182 241 157 216 430 328 247 214TOTAL 823 192 400 211 267 290 118 55 182 241 157 216 430 328 247 214TOTAL 823 192 400 211 267 290 118 55 182 241 157 216 430 328 247 214 100% 100% 100% 100% 100% 100% 100% 100% 100% 100% 100% 100% 100% 100% 100% 100%100% 100% 100% 100% 100% 100% 100% 100% 100% 100% 100% 100% 100% 100% 100% 100%100% 100% 100% 100% 100% 100% 100% 100% 100% 100% 100% 100% 100% 100% 100% 100%100% 100% 100% 100% 100% 100% 100% 100% 100% 100% 100% 100% 100% 100% 100% 100% Unweighted Total 823 172 385 244 340 305 73 35 178 205 161 222 417 395 233 162Unweighted Total 823 172 385 244 340 305 73 35 178 205 161 222 417 395 233 162Unweighted Total 823 172 385 244 340 305 73 35 178 205 161 222 417 395 233 162Unweighted Total 823 172 385 244 340 305 73 35 178 205 161 222 417 395 233 162 Better Better Better Better 271 62 131 71 106 80 38 19 50 75 57 84 123 152 64 44271 62 131 71 106 80 38 19 50 75 57 84 123 152 64 44271 62 131 71 106 80 38 19 50 75 57 84 123 152 64 44271 62 131 71 106 80 38 19 50 75 57 84 123 152 64 44 33% 32% 33% 34% 40% 28% 32% 34% 27% 31% 37% 39% 29% 46% 26% 20%33% 32% 33% 34% 40% 28% 32% 34% 27% 31% 37% 39% 29% 46% 26% 20%33% 32% 33% 34% 40% 28% 32% 34% 27% 31% 37% 39% 29% 46% 26% 20%33% 32% 33% 34% 40% 28% 32% 34% 27% 31% 37% 39% 29% 46% 26% 20% F M OP F M OP F M OP F M OP Worse 96 28 46 20 26 34 19 5 27 21 18 19 58 19 23 47Worse 96 28 46 20 26 34 19 5 27 21 18 19 58 19 23 47Worse 96 28 46 20 26 34 19 5 27 21 18 19 58 19 23 47Worse 96 28 46 20 26 34 19 5 27 21 18 19 58 19 23 47 12% 12% 12% 12% 14% 12% 10% 10% 12% 16% 8% 15% 9% 12% 9% 13% 6% 9% 22%14% 12% 10% 10% 12% 16% 8% 15% 9% 12% 9% 13% 6% 9% 22%14% 12% 10% 10% 12% 16% 8% 15% 9% 12% 9% 13% 6% 9% 22%14% 12% 10% 10% 12% 16% 8% 15% 9% 12% 9% 13% 6% 9% 22% NONONONO Same 448 100 220 Same 448 100 220 Same 448 100 220 Same 448 100 220 118 134 171 62 32 105 139 81 112 244 155 157 121118 134 171 62 32 105 139 81 112 244 155 157 121118 134 171 62 32 105 139 81 112 244 155 157 121118 134 171 62 32 105 139 81 112 244 155 157 121 55% 52% 55% 56% 50% 59% 52% 58% 58% 57% 52% 52% 57% 47% 64% 57%55% 52% 55% 56% 50% 59% 52% 58% 58% 57% 52% 52% 57% 47% 64% 57%55% 52% 55% 56% 50% 59% 52% 58% 58% 57% 52% 52% 57% 47% 64% 57%55% 52% 55% 56% 50% 59% 52% 58% 58% 57% 52% 52% 57% 47% 64% 57% e N ne N ne N ne N n (Not sure) 7 2 2 2 1 4 (Not sure) 7 2 2 2 1 4 (Not sure) 7 2 2 2 1 4 (Not sure) 7 2 2 2 1 4 ---- ---- 0 6 0 1 5 3 3 20 6 0 1 5 3 3 20 6 0 1 5 3 3 20 6 0 1 5 3 3 2 1% 1% 1% 1% *% 1% 1% 1% 1% 1% *% 1% 1% 1% 1% 1% *% 1% 1% 1% 1% 1% *% 1% *% 2% *% 1% 1% 1% 1% 1%*% 2% *% 1% 1% 1% 1% 1%*% 2% *% 1% 1% 1% 1% 1%*% 2% *% 1% 1% 1% 1% 1% Comparison Groups: BCD/EF/GH/IJ/KLM/NOPComparison Groups: BCD/EF/GH/IJ/KLM/NOPComparison Groups: BCD/EF/GH/IJ/KLM/NOPComparison Groups: BCD/EF/GH/IJ/KLM/NOP Independent ZIndependent ZIndependent ZIndependent Z----Test for Percentages (unpooled proportions)Test for Percentages (unpooled proportions)Test for Percentages (unpooled proportions)Test for Percentages (unpooled proportions) Uppercase letters indicate significance at the 95% level.Uppercase letters indicate significance at the 95% level.Uppercase letters indicate significance at the 95% level.Uppercase letters indicate significance at the 95% level. Lowercase letters indicate significance at the 90% level.Lowercase letters indicate significance at the 90% level.Lowercase letters indicate significance at the 90% level.Lowercase letters indicate significance at the 90% level.
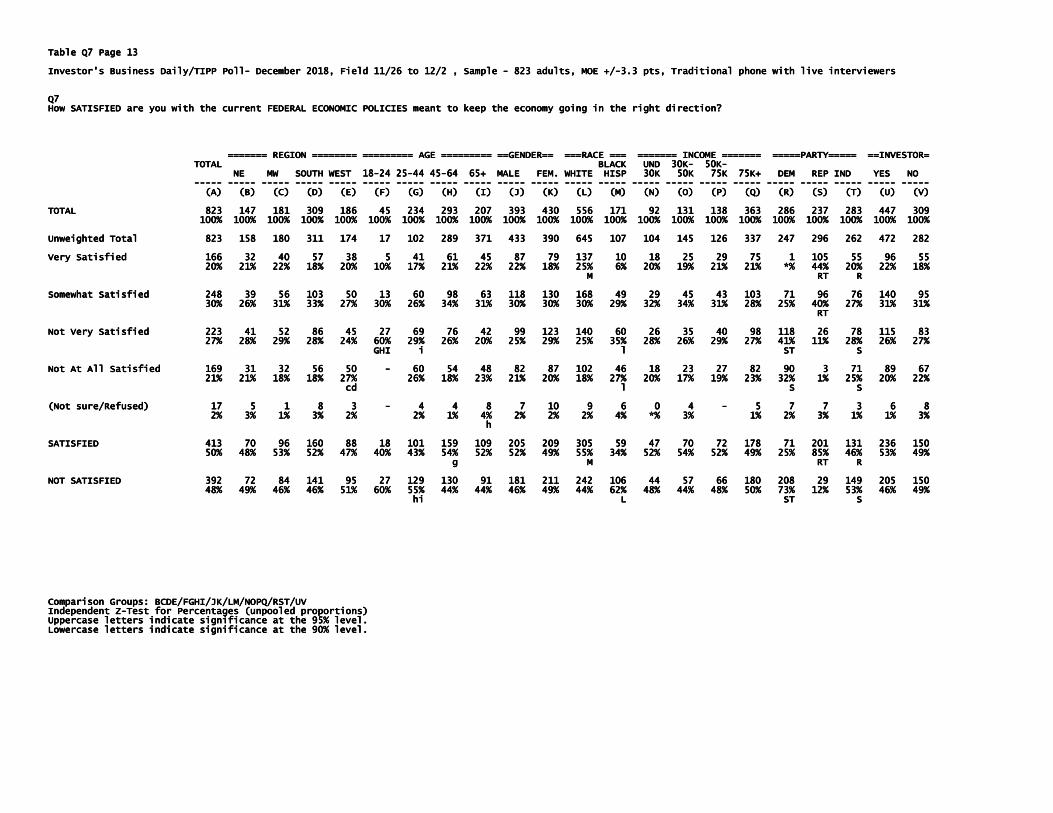
Table Q7 Page 13Table Q7 Page 13Table Q7 Page 13Table Q7 Page 13 Investor's Business Daily/TIPP PollInvestor's Business Daily/TIPP PollInvestor's Business Daily/TIPP PollInvestor's Business Daily/TIPP Poll---- December 2018, Field 11/26 to 12/2 , Sample December 2018, Field 11/26 to 12/2 , Sample December 2018, Field 11/26 to 12/2 , Sample December 2018, Field 11/26 to 12/2 , Sample ---- 823 adults, MOE +/823 adults, MOE +/823 adults, MOE +/823 adults, MOE +/----3.3 pts, Traditional phone with live interviewers 3.3 pts, Traditional phone with live interviewers 3.3 pts, Traditional phone with live interviewers 3.3 pts, Traditional phone with live interviewers Q7Q7Q7Q7 How SATISFIED are youHow SATISFIED are youHow SATISFIED are youHow SATISFIED are you with the current FEDERAL ECONOMIC POLICIES meant to keep the economy going in the right direction?with the current FEDERAL ECONOMIC POLICIES meant to keep the economy going in the right direction?with the current FEDERAL ECONOMIC POLICIES meant to keep the economy going in the right direction?with the current FEDERAL ECONOMIC POLICIES meant to keep the economy going in the right direction? ======= REGION ======== ========= AGE ========= ==GENDER== ===RACE === ======= INCOME ======= =====PARTY===== ==INVESTOR======== REGION ======== ========= AGE ========= ==GENDER== ===RACE === ======= INCOME ======= =====PARTY===== ==INVESTOR======== REGION ======== ========= AGE ========= ==GENDER== ===RACE === ======= INCOME ======= =====PARTY===== ==INVESTOR======== REGION ======== ========= AGE ========= ==GENDER== ===RACE === ======= INCOME ======= =====PARTY===== ==INVESTOR= TOTAL TOTAL TOTAL TOTAL BLACK UND 30KBLACK UND 30KBLACK UND 30KBLACK UND 30K---- 50K50K50K50K---- NE MW SOUTH WEST 18NE MW SOUTH WEST 18NE MW SOUTH WEST 18NE MW SOUTH WEST 18----24 2524 2524 2524 25----44 4544 4544 4544 45----64 65+ MALE FEM. WHITE HISP 30K 50K 75K 75K+ DEM REP IND YES NO 64 65+ MALE FEM. WHITE HISP 30K 50K 75K 75K+ DEM REP IND YES NO 64 65+ MALE FEM. WHITE HISP 30K 50K 75K 75K+ DEM REP IND YES NO 64 65+ MALE FEM. WHITE HISP 30K 50K 75K 75K+ DEM REP IND YES NO -------------------- -------------------- -------------------- -------------------- -------------------- -------------------- -------------------- -------------------- -------------------- -------------------- -------------------- -------------------- -------------------- -------------------- -------------------- -------------------- -------------------- -------------------- -------------------- -------------------- -------------------- -------------------- (A) (B) (C) (D) (E) (F) (G) (H) (I) (J) (K) (L) (M) (N) (O) (P) (Q) (R) (A) (B) (C) (D) (E) (F) (G) (H) (I) (J) (K) (L) (M) (N) (O) (P) (Q) (R) (A) (B) (C) (D) (E) (F) (G) (H) (I) (J) (K) (L) (M) (N) (O) (P) (Q) (R) (A) (B) (C) (D) (E) (F) (G) (H) (I) (J) (K) (L) (M) (N) (O) (P) (Q) (R) (S) (T) (U) (V)(S) (T) (U) (V)(S) (T) (U) (V)(S) (T) (U) (V) TOTAL 823 147 181 309 186 45 234 293 207 393 430 556 171 92 131 138 3TOTAL 823 147 181 309 186 45 234 293 207 393 430 556 171 92 131 138 3TOTAL 823 147 181 309 186 45 234 293 207 393 430 556 171 92 131 138 3TOTAL 823 147 181 309 186 45 234 293 207 393 430 556 171 92 131 138 363 286 237 283 447 30963 286 237 283 447 30963 286 237 283 447 30963 286 237 283 447 309 100% 100% 100% 100% 100% 100% 100% 100% 100% 100% 100% 100% 100% 100% 100% 100% 100% 100% 100% 100% 100% 100% 100% 100% 100% 100% 100% 100% 100% 100% 100% 100% 100% 100% 100% 100% 100% 100% 100% 100% 100% 100% 100% 100% 100% 100%100% 100% 100% 100% 100% 100% 100% 100% 100% 100% 100% 100% 100% 100%100% 100% 100% 100% 100% 100% 100% 100% 100% 100% 100% 100% 100% 100%100% 100% 100% 100% 100% 100% 100% 100% 100% 100% 100% 100% 100% 100% Unweighted Total 823 158 180 311 174 17 102 289 371 433 390 645 107 104 145 126 3Unweighted Total 823 158 180 311 174 17 102 289 371 433 390 645 107 104 145 126 3Unweighted Total 823 158 180 311 174 17 102 289 371 433 390 645 107 104 145 126 3Unweighted Total 823 158 180 311 174 17 102 289 371 433 390 645 107 104 145 126 337 247 296 262 472 28237 247 296 262 472 28237 247 296 262 472 28237 247 296 262 472 282 Very SatisfieVery SatisfieVery SatisfieVery Satisfied 166 32 40 57 38 5 41 61 45 87 79 137 10 18 25 29 75 1 10d 166 32 40 57 38 5 41 61 45 87 79 137 10 18 25 29 75 1 10d 166 32 40 57 38 5 41 61 45 87 79 137 10 18 25 29 75 1 10d 166 32 40 57 38 5 41 61 45 87 79 137 10 18 25 29 75 1 105 55 96 555 55 96 555 55 96 555 55 96 55 20% 21% 22% 18% 20% 10% 17% 21% 22% 22% 18% 25% 6% 20% 20% 21% 22% 18% 20% 10% 17% 21% 22% 22% 18% 25% 6% 20% 20% 21% 22% 18% 20% 10% 17% 21% 22% 22% 18% 25% 6% 20% 20% 21% 22% 18% 20% 10% 17% 21% 22% 22% 18% 25% 6% 20% 19% 21% 21% *% 44% 20% 22% 18%19% 21% 21% *% 44% 20% 22% 18%19% 21% 21% *% 44% 20% 22% 18%19% 21% 21% *% 44% 20% 22% 18% M RT R M RT R M RT R M RT R Somewhat Satisfied 248 39 56 103 Somewhat Satisfied 248 39 56 103 Somewhat Satisfied 248 39 56 103 Somewhat Satisfied 248 39 56 103 50 13 60 98 63 118 130 168 49 29 45 43 103 71 96 76 140 9550 13 60 98 63 118 130 168 49 29 45 43 103 71 96 76 140 9550 13 60 98 63 118 130 168 49 29 45 43 103 71 96 76 140 9550 13 60 98 63 118 130 168 49 29 45 43 103 71 96 76 140 95 30% 26% 31% 33% 27% 30% 26% 34% 31% 30% 30% 30% 29% 32% 34% 31% 28% 25% 40% 27% 30% 26% 31% 33% 27% 30% 26% 34% 31% 30% 30% 30% 29% 32% 34% 31% 28% 25% 40% 27% 30% 26% 31% 33% 27% 30% 26% 34% 31% 30% 30% 30% 29% 32% 34% 31% 28% 25% 40% 27% 30% 26% 31% 33% 27% 30% 26% 34% 31% 30% 30% 30% 29% 32% 34% 31% 28% 25% 40% 27% 31% 31%31% 31%31% 31%31% 31% RT RT RT RT Not Very Satisfied 223 41 52 86 45 27 69 76 42 99 Not Very Satisfied 223 41 52 86 45 27 69 76 42 99 Not Very Satisfied 223 41 52 86 45 27 69 76 42 99 Not Very Satisfied 223 41 52 86 45 27 69 76 42 99 123 140 60 26 35 40 98 118 26 78 115 83123 140 60 26 35 40 98 118 26 78 115 83123 140 60 26 35 40 98 118 26 78 115 83123 140 60 26 35 40 98 118 26 78 115 83 27% 28% 29% 28% 24% 60% 29% 26% 20% 25% 29% 25% 35% 28% 26% 29% 27% 41% 11% 28% 26% 27% 28% 29% 28% 24% 60% 29% 26% 20% 25% 29% 25% 35% 28% 26% 29% 27% 41% 11% 28% 26% 27% 28% 29% 28% 24% 60% 29% 26% 20% 25% 29% 25% 35% 28% 26% 29% 27% 41% 11% 28% 26% 27% 28% 29% 28% 24% 60% 29% 26% 20% 25% 29% 25% 35% 28% 26% 29% 27% 41% 11% 28% 26% 27%27%27%27% GHI i l ST S GHI i l ST S GHI i l ST S GHI i l ST S Not At All Satisfied 169 31 32 56 50 Not At All Satisfied 169 31 32 56 50 Not At All Satisfied 169 31 32 56 50 Not At All Satisfied 169 31 32 56 50 ---- 60 54 48 82 87 102 46 18 23 27 60 54 48 82 87 102 46 18 23 27 60 54 48 82 87 102 46 18 23 27 60 54 48 82 87 102 46 18 23 27 82 90 3 71 89 6782 90 3 71 89 6782 90 3 71 89 6782 90 3 71 89 67 21% 21% 18% 18% 27% 26% 18% 23% 21% 20% 18% 27% 20% 17% 19% 23% 32% 1% 25% 20% 21% 21% 18% 18% 27% 26% 18% 23% 21% 20% 18% 27% 20% 17% 19% 23% 32% 1% 25% 20% 21% 21% 18% 18% 27% 26% 18% 23% 21% 20% 18% 27% 20% 17% 19% 23% 32% 1% 25% 20% 21% 21% 18% 18% 27% 26% 18% 23% 21% 20% 18% 27% 20% 17% 19% 23% 32% 1% 25% 20% 22%22%22%22% cd cd cd cd l S S l S S l S S l S S (Not sure/Refused) 17 5 1 8 3 (Not sure/Refused) 17 5 1 8 3 (Not sure/Refused) 17 5 1 8 3 (Not sure/Refused) 17 5 1 8 3 ---- 4 4 8 7 10 9 6 0 4 4 4 8 7 10 9 6 0 4 4 4 8 7 10 9 6 0 4 4 4 8 7 10 9 6 0 4 ---- 5 7 7 3 6 85 7 7 3 6 85 7 7 3 6 85 7 7 3 6 8 2% 3% 1% 3% 2% 2% 1% 4% 2% 2% 2% 4% *% 3% 1% 2% 3% 1% 1% 2% 3% 1% 3% 2% 2% 1% 4% 2% 2% 2% 4% *% 3% 1% 2% 3% 1% 1% 2% 3% 1% 3% 2% 2% 1% 4% 2% 2% 2% 4% *% 3% 1% 2% 3% 1% 1% 2% 3% 1% 3% 2% 2% 1% 4% 2% 2% 2% 4% *% 3% 1% 2% 3% 1% 1% 3%3%3%3% h h h h SATISFIED 413 70 96 160 88 18 101 159 109 205 209 305 59 47 70 72 1SATISFIED 413 70 96 160 88 18 101 159 109 205 209 305 59 47 70 72 1SATISFIED 413 70 96 160 88 18 101 159 109 205 209 305 59 47 70 72 1SATISFIED 413 70 96 160 88 18 101 159 109 205 209 305 59 47 70 72 178 71 201 131 236 15078 71 201 131 236 15078 71 201 131 236 15078 71 201 131 236 150 50% 48%50% 48%50% 48%50% 48% 53% 52% 47% 40% 43% 54% 52% 52% 49% 55% 34% 52% 54% 52% 49% 25% 85% 46% 53% 49%53% 52% 47% 40% 43% 54% 52% 52% 49% 55% 34% 52% 54% 52% 49% 25% 85% 46% 53% 49%53% 52% 47% 40% 43% 54% 52% 52% 49% 55% 34% 52% 54% 52% 49% 25% 85% 46% 53% 49%53% 52% 47% 40% 43% 54% 52% 52% 49% 55% 34% 52% 54% 52% 49% 25% 85% 46% 53% 49% g M g M g M g M RT R RT R RT R RT R NOT SATISFIED 392 72 84 141 95 27 129 130 91 181 211 242 106 44 57 66 1NOT SATISFIED 392 72 84 141 95 27 129 130 91 181 211 242 106 44 57 66 1NOT SATISFIED 392 72 84 141 95 27 129 130 91 181 211 242 106 44 57 66 1NOT SATISFIED 392 72 84 141 95 27 129 130 91 181 211 242 106 44 57 66 180 208 29 149 205 15080 208 29 149 205 15080 208 29 149 205 15080 208 29 149 205 150 48% 49% 46% 46% 51% 60% 55% 44% 48% 49% 46% 46% 51% 60% 55% 44% 48% 49% 46% 46% 51% 60% 55% 44% 48% 49% 46% 46% 51% 60% 55% 44% 44% 46% 49% 44% 62% 48% 44% 48% 50% 73% 12% 53% 46% 49%44% 46% 49% 44% 62% 48% 44% 48% 50% 73% 12% 53% 46% 49%44% 46% 49% 44% 62% 48% 44% 48% 50% 73% 12% 53% 46% 49%44% 46% 49% 44% 62% 48% 44% 48% 50% 73% 12% 53% 46% 49% hi L ST S hi L ST S hi L ST S hi L ST S CompCompCompComparison Groups: BCDE/FGHI/JK/LM/NOPQ/RST/UVarison Groups: BCDE/FGHI/JK/LM/NOPQ/RST/UVarison Groups: BCDE/FGHI/JK/LM/NOPQ/RST/UVarison Groups: BCDE/FGHI/JK/LM/NOPQ/RST/UV Independent ZIndependent ZIndependent ZIndependent Z----Test for Percentages (unpooled proportions)Test for Percentages (unpooled proportions)Test for Percentages (unpooled proportions)Test for Percentages (unpooled proportions) Uppercase letters indicate significance at the 95% level.Uppercase letters indicate significance at the 95% level.Uppercase letters indicate significance at the 95% level.Uppercase letters indicate significance at the 95% level. Lowercase letters indicate significance at the 90% level.Lowercase letters indicate significance at the 90% level.Lowercase letters indicate significance at the 90% level.Lowercase letters indicate significance at the 90% level.
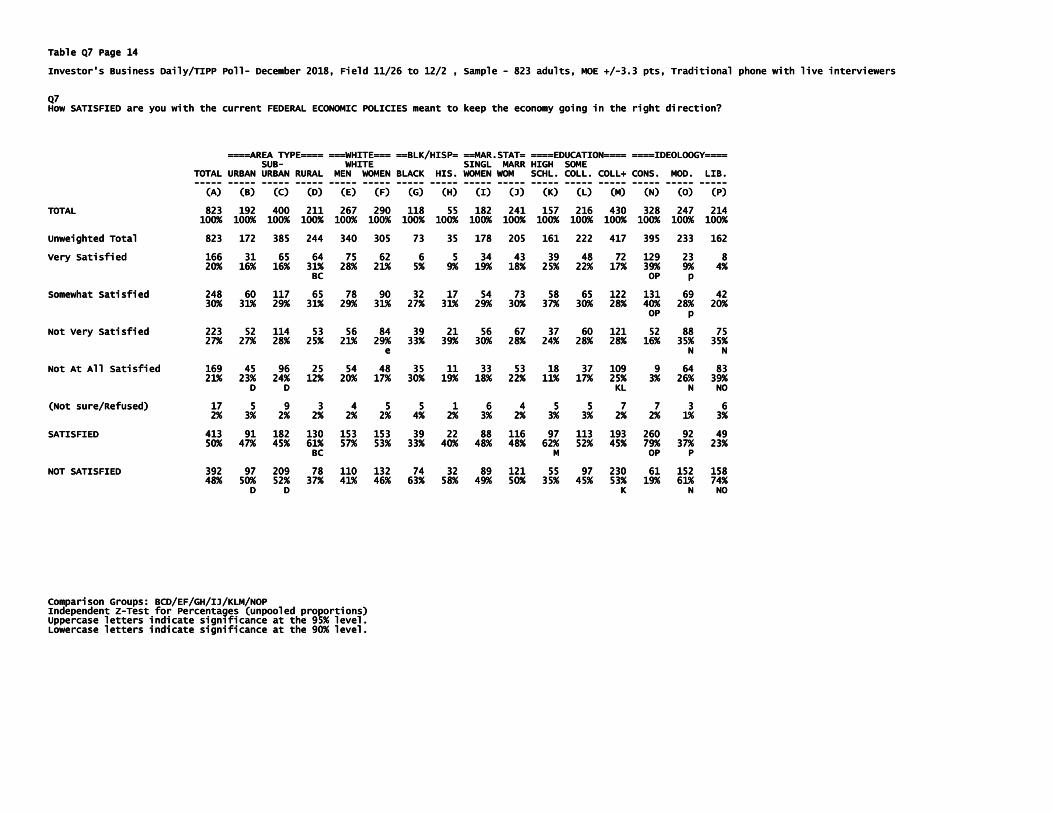
Table Q7 Page 14Table Q7 Page 14Table Q7 Page 14Table Q7 Page 14 Investor's Business Investor's Business Investor's Business Investor's Business Daily/TIPP PollDaily/TIPP PollDaily/TIPP PollDaily/TIPP Poll---- December 2018, Field 11/26 to 12/2 , Sample December 2018, Field 11/26 to 12/2 , Sample December 2018, Field 11/26 to 12/2 , Sample December 2018, Field 11/26 to 12/2 , Sample ---- 823 adults, MOE +/823 adults, MOE +/823 adults, MOE +/823 adults, MOE +/----3.3 pts, Traditional phone with live interviewers 3.3 pts, Traditional phone with live interviewers 3.3 pts, Traditional phone with live interviewers 3.3 pts, Traditional phone with live interviewers Q7Q7Q7Q7 How SATISFIED are you with the current FEDERAL ECONOMIC POLICIES meant to keep the economy going in the right direction?How SATISFIED are you with the current FEDERAL ECONOMIC POLICIES meant to keep the economy going in the right direction?How SATISFIED are you with the current FEDERAL ECONOMIC POLICIES meant to keep the economy going in the right direction?How SATISFIED are you with the current FEDERAL ECONOMIC POLICIES meant to keep the economy going in the right direction? ====AREA TYPE==== ===WHITE=== ==BLK/HISP= ==MAR.STAT= ====EDUCATION==== ====IDEOLOOGY========AREA TYPE==== ===WHITE=== ==BLK/HISP= ==MAR.STAT= ====EDUCATION==== ====IDEOLOOGY========AREA TYPE==== ===WHITE=== ==BLK/HISP= ==MAR.STAT= ====EDUCATION==== ====IDEOLOOGY========AREA TYPE==== ===WHITE=== ==BLK/HISP= ==MAR.STAT= ====EDUCATION==== ====IDEOLOOGY==== SUBSUBSUBSUB---- WHITE SINGL MARR HIGH SOME WHITE SINGL MARR HIGH SOME WHITE SINGL MARR HIGH SOME WHITE SINGL MARR HIGH SOME TOTAL URBAN URBAN RURAL MEN WOMEN BLACK HIS. WOMEN WOM SCHL. COLL. COLL+ CONS. MOD. LIB.TOTAL URBAN URBAN RURAL MEN WOMEN BLACK HIS. WOMEN WOM SCHL. COLL. COLL+ CONS. MOD. LIB.TOTAL URBAN URBAN RURAL MEN WOMEN BLACK HIS. WOMEN WOM SCHL. COLL. COLL+ CONS. MOD. LIB.TOTAL URBAN URBAN RURAL MEN WOMEN BLACK HIS. WOMEN WOM SCHL. COLL. COLL+ CONS. MOD. LIB. -------------------- -------------------- -------------------- -------------------- -------------------- -------------------- -------------------- -------------------- -------------------- -------------------- -------------------- -------------------- -------------------- -------------------- -------------------- -------------------- (A) (B) (C) (D) (E) (F) (G) (H) (I) (J) (K) (L) (M) (N) (O) (P)(A) (B) (C) (D) (E) (F) (G) (H) (I) (J) (K) (L) (M) (N) (O) (P)(A) (B) (C) (D) (E) (F) (G) (H) (I) (J) (K) (L) (M) (N) (O) (P)(A) (B) (C) (D) (E) (F) (G) (H) (I) (J) (K) (L) (M) (N) (O) (P) TOTAL 823 TOTAL 823 TOTAL 823 TOTAL 823 192 400 211 267 290 118 55 182 241 157 216 430 328 247 214192 400 211 267 290 118 55 182 241 157 216 430 328 247 214192 400 211 267 290 118 55 182 241 157 216 430 328 247 214192 400 211 267 290 118 55 182 241 157 216 430 328 247 214 100% 100% 100% 100% 100% 100% 100% 100% 100% 100% 100% 100% 100% 100% 100% 100%100% 100% 100% 100% 100% 100% 100% 100% 100% 100% 100% 100% 100% 100% 100% 100%100% 100% 100% 100% 100% 100% 100% 100% 100% 100% 100% 100% 100% 100% 100% 100%100% 100% 100% 100% 100% 100% 100% 100% 100% 100% 100% 100% 100% 100% 100% 100% Unweighted Total 823 172 385Unweighted Total 823 172 385Unweighted Total 823 172 385Unweighted Total 823 172 385 244 340 305 73 35 178 205 161 222 417 395 233 162244 340 305 73 35 178 205 161 222 417 395 233 162244 340 305 73 35 178 205 161 222 417 395 233 162244 340 305 73 35 178 205 161 222 417 395 233 162 Very Satisfied 166 31 65 64 75 62 6 5 34 43 39 48 72 129 23 8Very Satisfied 166 31 65 64 75 62 6 5 34 43 39 48 72 129 23 8Very Satisfied 166 31 65 64 75 62 6 5 34 43 39 48 72 129 23 8Very Satisfied 166 31 65 64 75 62 6 5 34 43 39 48 72 129 23 8 20% 16% 16% 31% 2820% 16% 16% 31% 2820% 16% 16% 31% 2820% 16% 16% 31% 28% 21% 5% 9% 19% 18% 25% 22% 17% 39% 9% 4%% 21% 5% 9% 19% 18% 25% 22% 17% 39% 9% 4%% 21% 5% 9% 19% 18% 25% 22% 17% 39% 9% 4%% 21% 5% 9% 19% 18% 25% 22% 17% 39% 9% 4% BC OP p BC OP p BC OP p BC OP p Somewhat Satisfied 248 60 117 65 78 90 Somewhat Satisfied 248 60 117 65 78 90 Somewhat Satisfied 248 60 117 65 78 90 Somewhat Satisfied 248 60 117 65 78 90 32 17 54 73 58 65 122 131 69 4232 17 54 73 58 65 122 131 69 4232 17 54 73 58 65 122 131 69 4232 17 54 73 58 65 122 131 69 42 30% 31% 29% 31% 29% 31% 27% 31% 29% 30% 37% 30% 28% 40% 28% 20%30% 31% 29% 31% 29% 31% 27% 31% 29% 30% 37% 30% 28% 40% 28% 20%30% 31% 29% 31% 29% 31% 27% 31% 29% 30% 37% 30% 28% 40% 28% 20%30% 31% 29% 31% 29% 31% 27% 31% 29% 30% 37% 30% 28% 40% 28% 20% OP p OP p OP p OP p Not Very Satisfied 223 52 114 53 56 84 39 21 56 67 37 60 121 52 88 75Not Very Satisfied 223 52 114 53 56 84 39 21 56 67 37 60 121 52 88 75Not Very Satisfied 223 52 114 53 56 84 39 21 56 67 37 60 121 52 88 75Not Very Satisfied 223 52 114 53 56 84 39 21 56 67 37 60 121 52 88 75 27% 27% 28% 25% 21% 29% 33% 39% 30% 28% 27% 27% 28% 25% 21% 29% 33% 39% 30% 28% 27% 27% 28% 25% 21% 29% 33% 39% 30% 28% 27% 27% 28% 25% 21% 29% 33% 39% 30% 28% 24% 28% 28% 16% 35% 35%24% 28% 28% 16% 35% 35%24% 28% 28% 16% 35% 35%24% 28% 28% 16% 35% 35% e N Ne N Ne N Ne N N Not At All Satisfied 169 45 96 25 54 48 35 11 33 53 18 37 109 9 64 83Not At All Satisfied 169 45 96 25 54 48 35 11 33 53 18 37 109 9 64 83Not At All Satisfied 169 45 96 25 54 48 35 11 33 53 18 37 109 9 64 83Not At All Satisfied 169 45 96 25 54 48 35 11 33 53 18 37 109 9 64 83 21% 23% 24% 12% 20% 17% 30% 19% 18% 22% 11% 17% 25% 3% 26% 39%21% 23% 24% 12% 20% 17% 30% 19% 18% 22% 11% 17% 25% 3% 26% 39%21% 23% 24% 12% 20% 17% 30% 19% 18% 22% 11% 17% 25% 3% 26% 39%21% 23% 24% 12% 20% 17% 30% 19% 18% 22% 11% 17% 25% 3% 26% 39% D D KL N NOD D KL N NOD D KL N NOD D KL N NO (Not sure/Refused) 17 5 9 3 4 5 5 1 6 4 5 5 7 7 3 6(Not sure/Refused) 17 5 9 3 4 5 5 1 6 4 5 5 7 7 3 6(Not sure/Refused) 17 5 9 3 4 5 5 1 6 4 5 5 7 7 3 6(Not sure/Refused) 17 5 9 3 4 5 5 1 6 4 5 5 7 7 3 6 2% 3% 2% 2% 2% 2% 4% 2% 3% 2% 3% 3% 2% 2% 1% 3%2% 3% 2% 2% 2% 2% 4% 2% 3% 2% 3% 3% 2% 2% 1% 3%2% 3% 2% 2% 2% 2% 4% 2% 3% 2% 3% 3% 2% 2% 1% 3%2% 3% 2% 2% 2% 2% 4% 2% 3% 2% 3% 3% 2% 2% 1% 3% SATISFIED 413 91 182 130 153 153 39 22 88 116 97 113 193 260 92 49SATISFIED 413 91 182 130 153 153 39 22 88 116 97 113 193 260 92 49SATISFIED 413 91 182 130 153 153 39 22 88 116 97 113 193 260 92 49SATISFIED 413 91 182 130 153 153 39 22 88 116 97 113 193 260 92 49 50% 50% 50% 50% 47% 45% 61% 57% 53% 33% 40% 48% 48% 62% 52% 45% 79% 37% 23%47% 45% 61% 57% 53% 33% 40% 48% 48% 62% 52% 45% 79% 37% 23%47% 45% 61% 57% 53% 33% 40% 48% 48% 62% 52% 45% 79% 37% 23%47% 45% 61% 57% 53% 33% 40% 48% 48% 62% 52% 45% 79% 37% 23% BC M OP P BC M OP P BC M OP P BC M OP P NOT SATISFIED 392 97 209 NOT SATISFIED 392 97 209 NOT SATISFIED 392 97 209 NOT SATISFIED 392 97 209 78 110 132 74 32 89 121 55 97 230 61 152 15878 110 132 74 32 89 121 55 97 230 61 152 15878 110 132 74 32 89 121 55 97 230 61 152 15878 110 132 74 32 89 121 55 97 230 61 152 158 48% 50% 52% 37% 41% 46% 63% 58% 49% 50% 35% 45% 53% 19% 61% 74%48% 50% 52% 37% 41% 46% 63% 58% 49% 50% 35% 45% 53% 19% 61% 74%48% 50% 52% 37% 41% 46% 63% 58% 49% 50% 35% 45% 53% 19% 61% 74%48% 50% 52% 37% 41% 46% 63% 58% 49% 50% 35% 45% 53% 19% 61% 74% D D D D D D D D K N NOK N NOK N NOK N NO Comparison Groups: BCD/EF/GH/IJ/KLM/NOPComparison Groups: BCD/EF/GH/IJ/KLM/NOPComparison Groups: BCD/EF/GH/IJ/KLM/NOPComparison Groups: BCD/EF/GH/IJ/KLM/NOP Independent ZIndependent ZIndependent ZIndependent Z----Test for Percentages (unpooled proportions)Test for Percentages (unpooled proportions)Test for Percentages (unpooled proportions)Test for Percentages (unpooled proportions) Uppercase letters indicate significance at the 95% level.Uppercase letters indicate significance at the 95% level.Uppercase letters indicate significance at the 95% level.Uppercase letters indicate significance at the 95% level. Lowercase letters indicate significance at the 90% level.Lowercase letters indicate significance at the 90% level.Lowercase letters indicate significance at the 90% level.Lowercase letters indicate significance at the 90% level.

Table Q8 Page 15Table Q8 Page 15Table Q8 Page 15Table Q8 Page 15 Investor's Business Daily/TIPP PollInvestor's Business Daily/TIPP PollInvestor's Business Daily/TIPP PollInvestor's Business Daily/TIPP Poll---- December 2018, Field 11/26 to 12/2 , Sample December 2018, Field 11/26 to 12/2 , Sample December 2018, Field 11/26 to 12/2 , Sample December 2018, Field 11/26 to 12/2 , Sample ---- 823 adults, MOE +/823 adults, MOE +/823 adults, MOE +/823 adults, MOE +/----3.3 pts, Traditional phone with live interviewers 3.3 pts, Traditional phone with live interviewers 3.3 pts, Traditional phone with live interviewers 3.3 pts, Traditional phone with live interviewers Q8Q8Q8Q8 Now moving on to the Now moving on to the Now moving on to the Now moving on to the topic of PRESIDENTIAL LEADERSHIP. Overall, is your opinion of Donald Trump generally FAVORABLE, topic of PRESIDENTIAL LEADERSHIP. Overall, is your opinion of Donald Trump generally FAVORABLE, topic of PRESIDENTIAL LEADERSHIP. Overall, is your opinion of Donald Trump generally FAVORABLE, topic of PRESIDENTIAL LEADERSHIP. Overall, is your opinion of Donald Trump generally FAVORABLE, generally UNFAVORABLE, or are you NOT FAMILIAR ENOUGH to say one way or the other?generally UNFAVORABLE, or are you NOT FAMILIAR ENOUGH to say one way or the other?generally UNFAVORABLE, or are you NOT FAMILIAR ENOUGH to say one way or the other?generally UNFAVORABLE, or are you NOT FAMILIAR ENOUGH to say one way or the other? ======= REGION ======== ========= AGE ========= REGION ======== ========= AGE ========= REGION ======== ========= AGE ========= REGION ======== ========= AGE ========= ==GENDER== ===RACE === ======= INCOME ======= =====PARTY===== ==INVESTOR======== ==GENDER== ===RACE === ======= INCOME ======= =====PARTY===== ==INVESTOR======== ==GENDER== ===RACE === ======= INCOME ======= =====PARTY===== ==INVESTOR======== ==GENDER== ===RACE === ======= INCOME ======= =====PARTY===== ==INVESTOR= TOTAL BLACK UND 30KTOTAL BLACK UND 30KTOTAL BLACK UND 30KTOTAL BLACK UND 30K---- 50K50K50K50K---- NE MW SOUTH WEST 18NE MW SOUTH WEST 18NE MW SOUTH WEST 18NE MW SOUTH WEST 18----24 2524 2524 2524 25----44 4544 4544 4544 45----64 65+ MALE FEM. WHITE HISP 30K 50K 75K 75K+ DEM REP IND YES NO 64 65+ MALE FEM. WHITE HISP 30K 50K 75K 75K+ DEM REP IND YES NO 64 65+ MALE FEM. WHITE HISP 30K 50K 75K 75K+ DEM REP IND YES NO 64 65+ MALE FEM. WHITE HISP 30K 50K 75K 75K+ DEM REP IND YES NO -------------------- -------------------- -------------------- -------------------- -------------------- -------------------- -------------------- -------------------- -------------------- -------------------- -------------------- -------------------- -------------------- -------------------- -------------------- -------------------- -------------------- -------------------- -------------------- -------------------- -------------------- -------------------- (A) (B) (C) (D) (E) (F) (G) (H) (I) (J) (K) (L) (M) (N) (O) (P) (Q) (R) (S) (T) (U) (A) (B) (C) (D) (E) (F) (G) (H) (I) (J) (K) (L) (M) (N) (O) (P) (Q) (R) (S) (T) (U) (A) (B) (C) (D) (E) (F) (G) (H) (I) (J) (K) (L) (M) (N) (O) (P) (Q) (R) (S) (T) (U) (A) (B) (C) (D) (E) (F) (G) (H) (I) (J) (K) (L) (M) (N) (O) (P) (Q) (R) (S) (T) (U) (V)(V)(V)(V) TOTAL 823 147 181 309TOTAL 823 147 181 309TOTAL 823 147 181 309TOTAL 823 147 181 309 186 45 234 293 207 393 430 556 171 92 131 138 363 286 237 283 447 309186 45 234 293 207 393 430 556 171 92 131 138 363 286 237 283 447 309186 45 234 293 207 393 430 556 171 92 131 138 363 286 237 283 447 309186 45 234 293 207 393 430 556 171 92 131 138 363 286 237 283 447 309 100% 100% 100% 100% 100% 100% 100% 100% 100% 100% 100% 100% 100% 100% 100% 100% 100% 100% 100% 100% 100% 100% 100% 100% 100% 100% 100% 100% 100% 100% 100% 100% 100% 100% 100% 100% 100% 100% 100% 100% 100% 100% 100% 100% 100% 100% 100% 100% 100% 100% 100% 100% 100% 100% 100% 100% 100% 100% 100% 100% 100% 100% 100% 100% 100% 100% 100% 100% 100% 100% 100% 100% 100% 100% 100% 100% 100% 100% 100% 100% 100% 100%100% 100%100% 100%100% 100% Unweighted Total 823 158 180 311 174 17 102 289 371 433 390 645 107 104 145 126 3Unweighted Total 823 158 180 311 174 17 102 289 371 433 390 645 107 104 145 126 3Unweighted Total 823 158 180 311 174 17 102 289 371 433 390 645 107 104 145 126 3Unweighted Total 823 158 180 311 174 17 102 289 371 433 390 645 107 104 145 126 337 247 296 262 472 28237 247 296 262 472 28237 247 296 262 472 28237 247 296 262 472 282 Favorable 325 56 68 133 68 3 76 132 88 162Favorable 325 56 68 133 68 3 76 132 88 162Favorable 325 56 68 133 68 3 76 132 88 162Favorable 325 56 68 133 68 3 76 132 88 162 163 262 25 36 42 67 139 15 209 95 191 105163 262 25 36 42 67 139 15 209 95 191 105163 262 25 36 42 67 139 15 209 95 191 105163 262 25 36 42 67 139 15 209 95 191 105 40% 38% 38% 43% 37% 7% 33% 45% 42% 41% 38% 47% 15% 39% 32% 48% 38% 5% 88% 33% 43% 40% 38% 38% 43% 37% 7% 33% 45% 42% 41% 38% 47% 15% 39% 32% 48% 38% 5% 88% 33% 43% 40% 38% 38% 43% 37% 7% 33% 45% 42% 41% 38% 47% 15% 39% 32% 48% 38% 5% 88% 33% 43% 40% 38% 38% 43% 37% 7% 33% 45% 42% 41% 38% 47% 15% 39% 32% 48% 38% 5% 88% 33% 43% 34%34%34%34% F FG Fg M O RT R v F FG Fg M O RT R v F FG Fg M O RT R v F FG Fg M O RT R v Unfavorable 439 83 95 151 110 33 137 147 106 201 238 265Unfavorable 439 83 95 151 110 33 137 147 106 201 238 265Unfavorable 439 83 95 151 110 33 137 147 106 201 238 265Unfavorable 439 83 95 151 110 33 137 147 106 201 238 265 125 49 73 67 207 256 12 164 233 173125 49 73 67 207 256 12 164 233 173125 49 73 67 207 256 12 164 233 173125 49 73 67 207 256 12 164 233 173 53% 57% 53% 49% 59% 75% 59% 50% 51% 51% 55% 48% 73% 53% 56% 49% 57% 90% 5% 58% 52% 53% 57% 53% 49% 59% 75% 59% 50% 51% 51% 55% 48% 73% 53% 56% 49% 57% 90% 5% 58% 52% 53% 57% 53% 49% 59% 75% 59% 50% 51% 51% 55% 48% 73% 53% 56% 49% 57% 90% 5% 58% 52% 53% 57% 53% 49% 59% 75% 59% 50% 51% 51% 55% 48% 73% 53% 56% 49% 57% 90% 5% 58% 52% 56%56%56%56% d Hi L ST S d Hi L ST S d Hi L ST S d Hi L ST S Not familiar enough to 40 4 15 19 2 5 19 7 6 19 21 22 11 5 11 3 Not familiar enough to 40 4 15 19 2 5 19 7 6 19 21 22 11 5 11 3 Not familiar enough to 40 4 15 19 2 5 19 7 6 19 21 22 11 5 11 3 Not familiar enough to 40 4 15 19 2 5 19 7 6 19 21 22 11 5 11 3 16 11 16 11 16 11 16 11 9 18 16 249 18 16 249 18 16 249 18 16 24 say 5% 3% 8% 6% 1% 12% 8% 2% 3% 5% 5% 4% 7% 5% 8% 3% say 5% 3% 8% 6% 1% 12% 8% 2% 3% 5% 5% 4% 7% 5% 8% 3% say 5% 3% 8% 6% 1% 12% 8% 2% 3% 5% 5% 4% 7% 5% 8% 3% say 5% 3% 8% 6% 1% 12% 8% 2% 3% 5% 5% 4% 7% 5% 8% 3% 4% 4% 4% 6% 3% 8%4% 4% 4% 6% 3% 8%4% 4% 4% 6% 3% 8%4% 4% 4% 6% 3% 8% BE bE Hi BE bE Hi BE bE Hi BE bE Hi P UP UP UP U (Not sure) 19 4 3 6 6 3 1 7 7 11 8 7 9 3 5 1 (Not sure) 19 4 3 6 6 3 1 7 7 11 8 7 9 3 5 1 (Not sure) 19 4 3 6 6 3 1 7 7 11 8 7 9 3 5 1 (Not sure) 19 4 3 6 6 3 1 7 7 11 8 7 9 3 5 1 1 4 7 6 8 71 4 7 6 8 71 4 7 6 8 71 4 7 6 8 7 2% 3% 2% 2% 3% 7% 1% 2% 3% 3% 2% 1% 5% 3% 4% *% *% 1% 3% 2% 2% 2% 3% 2% 2% 3% 7% 1% 2% 3% 3% 2% 1% 5% 3% 4% *% *% 1% 3% 2% 2% 2% 3% 2% 2% 3% 7% 1% 2% 3% 3% 2% 1% 5% 3% 4% *% *% 1% 3% 2% 2% 2% 3% 2% 2% 3% 7% 1% 2% 3% 3% 2% 1% 5% 3% 4% *% *% 1% 3% 2% 2% 2%2%2%2% G l G l G l G l q q q q Comparison Groups: BCDE/FGHI/JK/LM/NOPQ/RST/UVComparison Groups: BCDE/FGHI/JK/LM/NOPQ/RST/UVComparison Groups: BCDE/FGHI/JK/LM/NOPQ/RST/UVComparison Groups: BCDE/FGHI/JK/LM/NOPQ/RST/UV Independent ZIndependent ZIndependent ZIndependent Z----Test for Percentages (unpooled proportions)Test for Percentages (unpooled proportions)Test for Percentages (unpooled proportions)Test for Percentages (unpooled proportions) Uppercase letters indicate significance at the 95% level.Uppercase letters indicate significance at the 95% level.Uppercase letters indicate significance at the 95% level.Uppercase letters indicate significance at the 95% level. Lowercase letters indicate significance at the 90% level.Lowercase letters indicate significance at the 90% level.Lowercase letters indicate significance at the 90% level.Lowercase letters indicate significance at the 90% level.

Table Q8 Page 16Table Q8 Page 16Table Q8 Page 16Table Q8 Page 16 Investor's Business Daily/TIPP PollInvestor's Business Daily/TIPP PollInvestor's Business Daily/TIPP PollInvestor's Business Daily/TIPP Poll---- December 2018, Field 11/26 to 12/2 , Sample December 2018, Field 11/26 to 12/2 , Sample December 2018, Field 11/26 to 12/2 , Sample December 2018, Field 11/26 to 12/2 , Sample ---- 823 adults, MOE +/823 adults, MOE +/823 adults, MOE +/823 adults, MOE +/----3.3 pts, Traditional phone with live interviewers 3.3 pts, Traditional phone with live interviewers 3.3 pts, Traditional phone with live interviewers 3.3 pts, Traditional phone with live interviewers Q8Q8Q8Q8 Now moving on to the Now moving on to the Now moving on to the Now moving on to the topic of PRESIDENTIAL LEADERSHIP. Overall, is your opinion of Donald Trump generally FAVORABLE, topic of PRESIDENTIAL LEADERSHIP. Overall, is your opinion of Donald Trump generally FAVORABLE, topic of PRESIDENTIAL LEADERSHIP. Overall, is your opinion of Donald Trump generally FAVORABLE, topic of PRESIDENTIAL LEADERSHIP. Overall, is your opinion of Donald Trump generally FAVORABLE, generally UNFAVORABLE, or are you NOT FAMILIAR ENOUGH to say one way or the other?generally UNFAVORABLE, or are you NOT FAMILIAR ENOUGH to say one way or the other?generally UNFAVORABLE, or are you NOT FAMILIAR ENOUGH to say one way or the other?generally UNFAVORABLE, or are you NOT FAMILIAR ENOUGH to say one way or the other? ====AREA TYPE==== ===WHITE=== ==BLK/HISP====AREA TYPE==== ===WHITE=== ==BLK/HISP====AREA TYPE==== ===WHITE=== ==BLK/HISP====AREA TYPE==== ===WHITE=== ==BLK/HISP= ==MAR.STAT= ====EDUCATION==== ====IDEOLOOGY===== ==MAR.STAT= ====EDUCATION==== ====IDEOLOOGY===== ==MAR.STAT= ====EDUCATION==== ====IDEOLOOGY===== ==MAR.STAT= ====EDUCATION==== ====IDEOLOOGY==== SUBSUBSUBSUB---- WHITE SINGL MARR HIGH SOME WHITE SINGL MARR HIGH SOME WHITE SINGL MARR HIGH SOME WHITE SINGL MARR HIGH SOME TOTAL URBAN URBAN RURAL MEN WOMEN BLACK HIS. WOMEN WOM TOTAL URBAN URBAN RURAL MEN WOMEN BLACK HIS. WOMEN WOM TOTAL URBAN URBAN RURAL MEN WOMEN BLACK HIS. WOMEN WOM TOTAL URBAN URBAN RURAL MEN WOMEN BLACK HIS. WOMEN WOM SCHL. COLL. COLL+ CONS. MOD. LIB.SCHL. COLL. COLL+ CONS. MOD. LIB.SCHL. COLL. COLL+ CONS. MOD. LIB.SCHL. COLL. COLL+ CONS. MOD. LIB. -------------------- -------------------- -------------------- -------------------- -------------------- -------------------- -------------------- -------------------- -------------------- -------------------- -------------------- -------------------- -------------------- -------------------- -------------------- -------------------- (A) (B) (C) (D) (E) (F) (G) (H) (I) (J) (K) (L(A) (B) (C) (D) (E) (F) (G) (H) (I) (J) (K) (L(A) (B) (C) (D) (E) (F) (G) (H) (I) (J) (K) (L(A) (B) (C) (D) (E) (F) (G) (H) (I) (J) (K) (L) (M) (N) (O) (P)) (M) (N) (O) (P)) (M) (N) (O) (P)) (M) (N) (O) (P) TOTAL 823 192 400 211 267 290 118 55 182 241 157 216 430 328 247 214TOTAL 823 192 400 211 267 290 118 55 182 241 157 216 430 328 247 214TOTAL 823 192 400 211 267 290 118 55 182 241 157 216 430 328 247 214TOTAL 823 192 400 211 267 290 118 55 182 241 157 216 430 328 247 214 100% 100% 100% 100% 100% 100% 100% 100% 100% 100% 100% 100% 100% 100% 100% 100%100% 100% 100% 100% 100% 100% 100% 100% 100% 100% 100% 100% 100% 100% 100% 100%100% 100% 100% 100% 100% 100% 100% 100% 100% 100% 100% 100% 100% 100% 100% 100%100% 100% 100% 100% 100% 100% 100% 100% 100% 100% 100% 100% 100% 100% 100% 100% Unweighted Total 823 172 385 244 340 305 73 35 178 205 161 222 417 395 233 162Unweighted Total 823 172 385 244 340 305 73 35 178 205 161 222 417 395 233 162Unweighted Total 823 172 385 244 340 305 73 35 178 205 161 222 417 395 233 162Unweighted Total 823 172 385 244 340 305 73 35 178 205 161 222 417 395 233 162 Favorable Favorable Favorable Favorable 325 53 134 128 133 130 15 12 58 101 73 96 146 248 67 2325 53 134 128 133 130 15 12 58 101 73 96 146 248 67 2325 53 134 128 133 130 15 12 58 101 73 96 146 248 67 2325 53 134 128 133 130 15 12 58 101 73 96 146 248 67 2 40% 28% 34% 61% 50% 45% 13% 21% 32% 42% 46% 44% 34% 76% 27% 1%40% 28% 34% 61% 50% 45% 13% 21% 32% 42% 46% 44% 34% 76% 27% 1%40% 28% 34% 61% 50% 45% 13% 21% 32% 42% 46% 44% 34% 76% 27% 1%40% 28% 34% 61% 50% 45% 13% 21% 32% 42% 46% 44% 34% 76% 27% 1% BC M M OP P BC M M OP P BC M M OP P BC M M OP P Unfavorable 439 121 239 71 121 143 92 33 108 128 66 101 263 55 163 201Unfavorable 439 121 239 71 121 143 92 33 108 128 66 101 263 55 163 201Unfavorable 439 121 239 71 121 143 92 33 108 128 66 101 263 55 163 201Unfavorable 439 121 239 71 121 143 92 33 108 128 66 101 263 55 163 201 53% 53% 53% 53% 63% 60% 34% 45% 50% 78% 61% 59% 53% 42% 47% 61% 17% 66% 94%63% 60% 34% 45% 50% 78% 61% 59% 53% 42% 47% 61% 17% 66% 94%63% 60% 34% 45% 50% 78% 61% 59% 53% 42% 47% 61% 17% 66% 94%63% 60% 34% 45% 50% 78% 61% 59% 53% 42% 47% 61% 17% 66% 94% D D h KL N NOD D h KL N NOD D h KL N NOD D h KL N NO Not familiar enough to 40 13 18 Not familiar enough to 40 13 18 Not familiar enough to 40 13 18 Not familiar enough to 40 13 18 9 8 14 7 5 10 11 11 14 14 16 13 59 8 14 7 5 10 11 11 14 14 16 13 59 8 14 7 5 10 11 11 14 14 16 13 59 8 14 7 5 10 11 11 14 14 16 13 5 say 5% 7% 5% 4% 3% 5% 6% 9% 6% 4% 7% 7% 3% 5% 5% 2%say 5% 7% 5% 4% 3% 5% 6% 9% 6% 4% 7% 7% 3% 5% 5% 2%say 5% 7% 5% 4% 3% 5% 6% 9% 6% 4% 7% 7% 3% 5% 5% 2%say 5% 7% 5% 4% 3% 5% 6% 9% 6% 4% 7% 7% 3% 5% 5% 2% m m m m (Not sure) 19 5 9 3 5 2 4 5 6 1 7 5 6 9 5 5(Not sure) 19 5 9 3 5 2 4 5 6 1 7 5 6 9 5 5(Not sure) 19 5 9 3 5 2 4 5 6 1 7 5 6 9 5 5(Not sure) 19 5 9 3 5 2 4 5 6 1 7 5 6 9 5 5 2% 3% 2% 1% 2% 1% 4%2% 3% 2% 1% 2% 1% 4%2% 3% 2% 1% 2% 1% 4%2% 3% 2% 1% 2% 1% 4% 9% 3% 1% 4% 2% 1% 3% 2% 2%9% 3% 1% 4% 2% 1% 3% 2% 2%9% 3% 1% 4% 2% 1% 3% 2% 2%9% 3% 1% 4% 2% 1% 3% 2% 2% j j j j Comparison Groups: BCD/EF/GH/IJ/KLM/NOPComparison Groups: BCD/EF/GH/IJ/KLM/NOPComparison Groups: BCD/EF/GH/IJ/KLM/NOPComparison Groups: BCD/EF/GH/IJ/KLM/NOP Independent ZIndependent ZIndependent ZIndependent Z----Test for Percentages (unpooled proportions)Test for Percentages (unpooled proportions)Test for Percentages (unpooled proportions)Test for Percentages (unpooled proportions) Uppercase letters indicate significance at the 95% level.Uppercase letters indicate significance at the 95% level.Uppercase letters indicate significance at the 95% level.Uppercase letters indicate significance at the 95% level. Lowercase letters indicate significance at the 90% level.Lowercase letters indicate significance at the 90% level.Lowercase letters indicate significance at the 90% level.Lowercase letters indicate significance at the 90% level.

Table Q9 Page 17Table Q9 Page 17Table Q9 Page 17Table Q9 Page 17 Investor's Business Daily/TIPP PollInvestor's Business Daily/TIPP PollInvestor's Business Daily/TIPP PollInvestor's Business Daily/TIPP Poll---- December 2018, Field 11/26December 2018, Field 11/26December 2018, Field 11/26December 2018, Field 11/26 to 12/2 , Sample to 12/2 , Sample to 12/2 , Sample to 12/2 , Sample ---- 823 adults, MOE +/823 adults, MOE +/823 adults, MOE +/823 adults, MOE +/----3.3 pts, Traditional phone with live interviewers 3.3 pts, Traditional phone with live interviewers 3.3 pts, Traditional phone with live interviewers 3.3 pts, Traditional phone with live interviewers Q9Q9Q9Q9 In general, do you APPROVE or DISAPPROVE of the way Donald Trump is handling his job as president, or are you not In general, do you APPROVE or DISAPPROVE of the way Donald Trump is handling his job as president, or are you not In general, do you APPROVE or DISAPPROVE of the way Donald Trump is handling his job as president, or are you not In general, do you APPROVE or DISAPPROVE of the way Donald Trump is handling his job as president, or are you not familiar enough to say one way or the other?familiar enough to say one way or the other?familiar enough to say one way or the other?familiar enough to say one way or the other? ======= REGION ======== ========= AGE ========= ==GENDER== ===RACE === ======= INCOME ======= =====PARTY===== ==INVESTOR======== REGION ======== ========= AGE ========= ==GENDER== ===RACE === ======= INCOME ======= =====PARTY===== ==INVESTOR======== REGION ======== ========= AGE ========= ==GENDER== ===RACE === ======= INCOME ======= =====PARTY===== ==INVESTOR======== REGION ======== ========= AGE ========= ==GENDER== ===RACE === ======= INCOME ======= =====PARTY===== ==INVESTOR= TOTAL BLACK UND 30KTOTAL BLACK UND 30KTOTAL BLACK UND 30KTOTAL BLACK UND 30K---- 50K50K50K50K---- NE MW SOUTH WEST 18NE MW SOUTH WEST 18NE MW SOUTH WEST 18NE MW SOUTH WEST 18----24 2524 2524 2524 25----44 4544 4544 4544 45----64 65+ MALE FEM. WHITE 64 65+ MALE FEM. WHITE 64 65+ MALE FEM. WHITE 64 65+ MALE FEM. WHITE HISP 30K 50K 75K 75K+ DEM REP IND YES NO HISP 30K 50K 75K 75K+ DEM REP IND YES NO HISP 30K 50K 75K 75K+ DEM REP IND YES NO HISP 30K 50K 75K 75K+ DEM REP IND YES NO -------------------- -------------------- -------------------- -------------------- -------------------- -------------------- -------------------- -------------------- -------------------- -------------------- -------------------- -------------------- -------------------- -------------------- -------------------- -------------------- -------------------- -------------------- -------------------- -------------------- -------------------- -------------------- (A) (B) (A) (B) (A) (B) (A) (B) (C) (D) (E) (F) (G) (H) (I) (J) (K) (L) (M) (N) (O) (P) (Q) (R) (S) (T) (U) (V)(C) (D) (E) (F) (G) (H) (I) (J) (K) (L) (M) (N) (O) (P) (Q) (R) (S) (T) (U) (V)(C) (D) (E) (F) (G) (H) (I) (J) (K) (L) (M) (N) (O) (P) (Q) (R) (S) (T) (U) (V)(C) (D) (E) (F) (G) (H) (I) (J) (K) (L) (M) (N) (O) (P) (Q) (R) (S) (T) (U) (V) TOTAL 823 147 181 309 186 45 234 293 207 393 430 556 171 92 131 138 3TOTAL 823 147 181 309 186 45 234 293 207 393 430 556 171 92 131 138 3TOTAL 823 147 181 309 186 45 234 293 207 393 430 556 171 92 131 138 3TOTAL 823 147 181 309 186 45 234 293 207 393 430 556 171 92 131 138 363 286 63 286 63 286 63 286 237 283 447 309237 283 447 309237 283 447 309237 283 447 309 100% 100% 100% 100% 100% 100% 100% 100% 100% 100% 100% 100% 100% 100% 100% 100% 100% 100% 100% 100% 100% 100% 100% 100% 100% 100% 100% 100% 100% 100% 100% 100% 100% 100% 100% 100% 100% 100% 100% 100% 100% 100% 100% 100% 100% 100% 100% 100% 100% 100% 100% 100% 100% 100% 100% 100% 100% 100% 100% 100% 100% 100% 100% 100% 100% 100% 100% 100% 100% 100% 100% 100% 100% 100% 100% 100% 100% 100% 100% 100% 100% 100% 100% 100% 100%100%100%100% Unweighted Total 823 158 180 311 174 17 102 289 Unweighted Total 823 158 180 311 174 17 102 289 Unweighted Total 823 158 180 311 174 17 102 289 Unweighted Total 823 158 180 311 174 17 102 289 371 433 390 645 107 104 145 126 337 247 296 262 472 282371 433 390 645 107 104 145 126 337 247 296 262 472 282371 433 390 645 107 104 145 126 337 247 296 262 472 282371 433 390 645 107 104 145 126 337 247 296 262 472 282 Approve 320 51 70 130 68 2 69 135 91 163 156 258 26 34 40 59 1Approve 320 51 70 130 68 2 69 135 91 163 156 258 26 34 40 59 1Approve 320 51 70 130 68 2 69 135 91 163 156 258 26 34 40 59 1Approve 320 51 70 130 68 2 69 135 91 163 156 258 26 34 40 59 143 12 204 96 188 10343 12 204 96 188 10343 12 204 96 188 10343 12 204 96 188 103 39% 35% 39% 42% 37% 4% 29% 46% 44% 42% 36% 46% 15% 37% 31% 43% 39% 4% 86% 34% 42% 39% 35% 39% 42% 37% 4% 29% 46% 44% 42% 36% 46% 15% 37% 31% 43% 39% 4% 86% 34% 42% 39% 35% 39% 42% 37% 4% 29% 46% 44% 42% 36% 46% 15% 37% 31% 43% 39% 4% 86% 34% 42% 39% 35% 39% 42% 37% 4% 29% 46% 44% 42% 36% 46% 15% 37% 31% 43% 39% 4% 86% 34% 42% 33%33%33%33% F FG FG M F FG FG M F FG FG M F FG FG M RT R v RT R v RT R v RT R v Disapprove 452 83 95 162 112 33 146 149 107 206 246 270 131 49 81 67 2Disapprove 452 83 95 162 112 33 146 149 107 206 246 270 131 49 81 67 2Disapprove 452 83 95 162 112 33 146 149 107 206 246 270 131 49 81 67 2Disapprove 452 83 95 162 112 33 146 149 107 206 246 270 131 49 81 67 213 256 20 169 236 18413 256 20 169 236 18413 256 20 169 236 18413 256 20 169 236 184 55% 56% 53% 53% 55% 56% 53% 53% 55% 56% 53% 53% 55% 56% 53% 53% 60% 73% 63% 51% 52% 52% 57% 49% 76% 53% 61% 49% 59% 90% 9% 60% 53% 60%60% 73% 63% 51% 52% 52% 57% 49% 76% 53% 61% 49% 59% 90% 9% 60% 53% 60%60% 73% 63% 51% 52% 52% 57% 49% 76% 53% 61% 49% 59% 90% 9% 60% 53% 60%60% 73% 63% 51% 52% 52% 57% 49% 76% 53% 61% 49% 59% 90% 9% 60% 53% 60% hi Hi L p ST S hi Hi L p ST S hi Hi L p ST S hi Hi L p ST S Not familiar enough to 35 6 12 14 3 7 15 8 4 18 17 20 9 7 7 9 Not familiar enough to 35 6 12 14 3 7 15 8 4 18 17 20 9 7 7 9 Not familiar enough to 35 6 12 14 3 7 15 8 4 18 17 20 9 7 7 9 Not familiar enough to 35 6 12 14 3 7 15 8 4 18 17 20 9 7 7 9 7 13 10 10 13 197 13 10 10 13 197 13 10 10 13 197 13 10 10 13 19 say 4% 4% 7% 4% 2% 16% 6% 3% 2% 5% say 4% 4% 7% 4% 2% 16% 6% 3% 2% 5% say 4% 4% 7% 4% 2% 16% 6% 3% 2% 5% say 4% 4% 7% 4% 2% 16% 6% 3% 2% 5% 4% 4% 5% 8% 5% 6% 2% 5% 4% 4% 3% 6%4% 4% 5% 8% 5% 6% 2% 5% 4% 4% 3% 6%4% 4% 5% 8% 5% 6% 2% 5% 4% 4% 3% 6%4% 4% 5% 8% 5% 6% 2% 5% 4% 4% 3% 6% E q q uE q q uE q q uE q q u (Not sure) (Not sure) (Not sure) (Not sure) 16 7 3 3 3 3 4 2 5 6 10 8 6 2 3 3 0 5 3 8 10 16 7 3 3 3 3 4 2 5 6 10 8 6 2 3 3 0 5 3 8 10 16 7 3 3 3 3 4 2 5 6 10 8 6 2 3 3 0 5 3 8 10 16 7 3 3 3 3 4 2 5 6 10 8 6 2 3 3 0 5 3 8 10 3333 2% 5% 2% 1% 2% 7% 2% 1% 3% 1% 2% 1% 4% 2% 2% 2% 2% 5% 2% 1% 2% 7% 2% 1% 3% 1% 2% 1% 4% 2% 2% 2% 2% 5% 2% 1% 2% 7% 2% 1% 3% 1% 2% 1% 4% 2% 2% 2% 2% 5% 2% 1% 2% 7% 2% 1% 3% 1% 2% 1% 4% 2% 2% 2% *% 2% 1% 3% 2% 1%*% 2% 1% 3% 2% 1%*% 2% 1% 3% 2% 1%*% 2% 1% 3% 2% 1% De H Q De H Q De H Q De H Q Comparison Groups: BCDE/FGHI/JK/LM/NOPQ/RST/UVComparison Groups: BCDE/FGHI/JK/LM/NOPQ/RST/UVComparison Groups: BCDE/FGHI/JK/LM/NOPQ/RST/UVComparison Groups: BCDE/FGHI/JK/LM/NOPQ/RST/UV Independent ZIndependent ZIndependent ZIndependent Z----Test for Percentages (unpooled proportions)Test for Percentages (unpooled proportions)Test for Percentages (unpooled proportions)Test for Percentages (unpooled proportions) Uppercase letters indicate significance at the 95% level.Uppercase letters indicate significance at the 95% level.Uppercase letters indicate significance at the 95% level.Uppercase letters indicate significance at the 95% level. Lowercase letters indicate significance at the 90% level.Lowercase letters indicate significance at the 90% level.Lowercase letters indicate significance at the 90% level.Lowercase letters indicate significance at the 90% level.
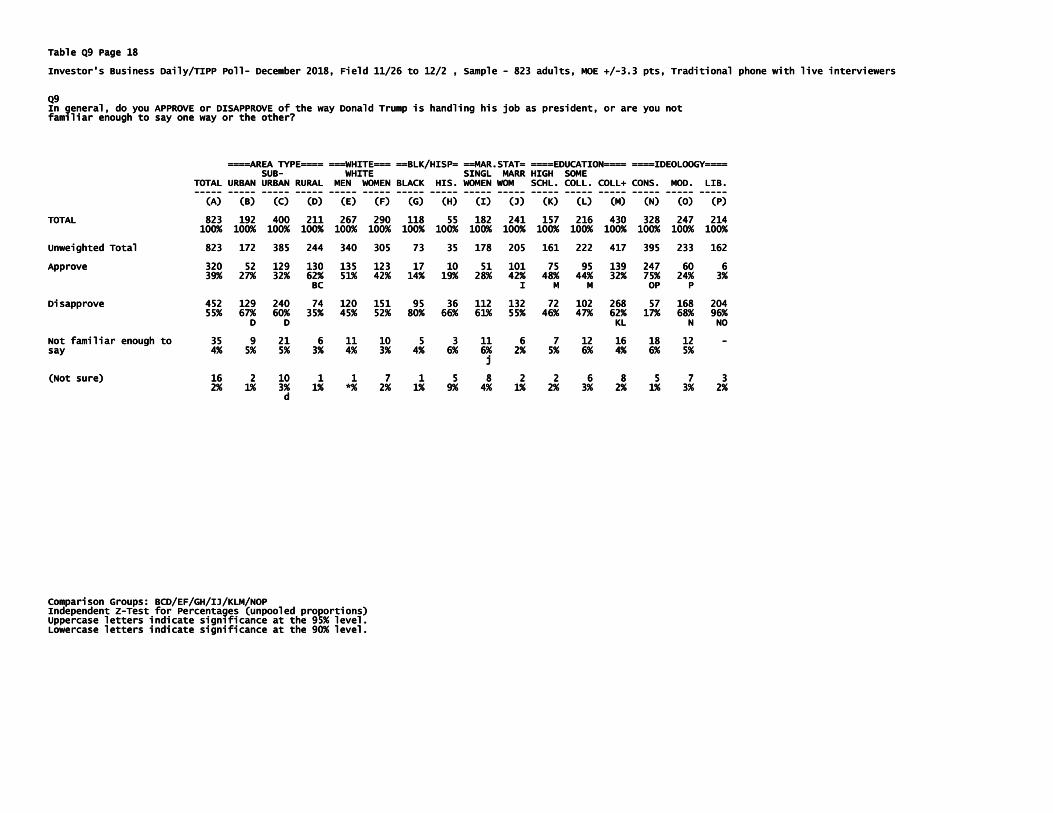
Table Q9 Page 18Table Q9 Page 18Table Q9 Page 18Table Q9 Page 18 Investor's BusinInvestor's BusinInvestor's BusinInvestor's Business Daily/TIPP Polless Daily/TIPP Polless Daily/TIPP Polless Daily/TIPP Poll---- December 2018, Field 11/26 to 12/2 , Sample December 2018, Field 11/26 to 12/2 , Sample December 2018, Field 11/26 to 12/2 , Sample December 2018, Field 11/26 to 12/2 , Sample ---- 823 adults, MOE +/823 adults, MOE +/823 adults, MOE +/823 adults, MOE +/----3.3 pts, Traditional phone with live interviewers 3.3 pts, Traditional phone with live interviewers 3.3 pts, Traditional phone with live interviewers 3.3 pts, Traditional phone with live interviewers Q9Q9Q9Q9 In general, do you APPROVE or DISAPPROVE of the way Donald Trump is handling his job as president, or are you not In general, do you APPROVE or DISAPPROVE of the way Donald Trump is handling his job as president, or are you not In general, do you APPROVE or DISAPPROVE of the way Donald Trump is handling his job as president, or are you not In general, do you APPROVE or DISAPPROVE of the way Donald Trump is handling his job as president, or are you not familiar enough to say one way or the other?familiar enough to say one way or the other?familiar enough to say one way or the other?familiar enough to say one way or the other? ====AREA TYPE==== ===WHITE=== ==BLK/HISP= ==MAR.STAT= ====EDUCATION==== ====IDEOLOOGY========AREA TYPE==== ===WHITE=== ==BLK/HISP= ==MAR.STAT= ====EDUCATION==== ====IDEOLOOGY========AREA TYPE==== ===WHITE=== ==BLK/HISP= ==MAR.STAT= ====EDUCATION==== ====IDEOLOOGY========AREA TYPE==== ===WHITE=== ==BLK/HISP= ==MAR.STAT= ====EDUCATION==== ====IDEOLOOGY==== SUBSUBSUBSUB---- WHITE SINGL MARWHITE SINGL MARWHITE SINGL MARWHITE SINGL MARR HIGH SOME R HIGH SOME R HIGH SOME R HIGH SOME TOTAL URBAN URBAN RURAL MEN WOMEN BLACK HIS. WOMEN WOM SCHL. COLL. COLL+ CONS. MOD. LIB.TOTAL URBAN URBAN RURAL MEN WOMEN BLACK HIS. WOMEN WOM SCHL. COLL. COLL+ CONS. MOD. LIB.TOTAL URBAN URBAN RURAL MEN WOMEN BLACK HIS. WOMEN WOM SCHL. COLL. COLL+ CONS. MOD. LIB.TOTAL URBAN URBAN RURAL MEN WOMEN BLACK HIS. WOMEN WOM SCHL. COLL. COLL+ CONS. MOD. LIB. -------------------- -------------------- -------------------- -------------------- -------------------- -------------------- -------------------- -------------------- -------------------- -------------------- -------------------- -------------------- -------------------- -------------------- -------------------- -------------------- (A) (B) (C) (D) (E) (F) (G) (H) (I) (J) (K) (L) (M) (N) (O) (P)(A) (B) (C) (D) (E) (F) (G) (H) (I) (J) (K) (L) (M) (N) (O) (P)(A) (B) (C) (D) (E) (F) (G) (H) (I) (J) (K) (L) (M) (N) (O) (P)(A) (B) (C) (D) (E) (F) (G) (H) (I) (J) (K) (L) (M) (N) (O) (P) TOTAL 823 192 400 211 267 290 118 55 182 241 157 216 430 3TOTAL 823 192 400 211 267 290 118 55 182 241 157 216 430 3TOTAL 823 192 400 211 267 290 118 55 182 241 157 216 430 3TOTAL 823 192 400 211 267 290 118 55 182 241 157 216 430 328 247 21428 247 21428 247 21428 247 214 100% 100% 100% 100% 100% 100% 100% 100% 100% 100% 100% 100% 100% 100% 100% 100%100% 100% 100% 100% 100% 100% 100% 100% 100% 100% 100% 100% 100% 100% 100% 100%100% 100% 100% 100% 100% 100% 100% 100% 100% 100% 100% 100% 100% 100% 100% 100%100% 100% 100% 100% 100% 100% 100% 100% 100% 100% 100% 100% 100% 100% 100% 100% Unweighted Total 823 172 385 244 340 305 73 35 178 205 161 222 417 395 233 Unweighted Total 823 172 385 244 340 305 73 35 178 205 161 222 417 395 233 Unweighted Total 823 172 385 244 340 305 73 35 178 205 161 222 417 395 233 Unweighted Total 823 172 385 244 340 305 73 35 178 205 161 222 417 395 233 162162162162 Approve 320 52 129 130 135 123 17 10 51 101 75 95 139 247 60 6Approve 320 52 129 130 135 123 17 10 51 101 75 95 139 247 60 6Approve 320 52 129 130 135 123 17 10 51 101 75 95 139 247 60 6Approve 320 52 129 130 135 123 17 10 51 101 75 95 139 247 60 6 39% 27% 32% 62% 51% 42% 14% 19% 28% 42% 48% 44% 32% 75% 24% 3%39% 27% 32% 62% 51% 42% 14% 19% 28% 42% 48% 44% 32% 75% 24% 3%39% 27% 32% 62% 51% 42% 14% 19% 28% 42% 48% 44% 32% 75% 24% 3%39% 27% 32% 62% 51% 42% 14% 19% 28% 42% 48% 44% 32% 75% 24% 3% BC I M M OP P BC I M M OP P BC I M M OP P BC I M M OP P Disapprove 452 129 240 74 120 151 95 36 112 132 72 102 268 57 168 204Disapprove 452 129 240 74 120 151 95 36 112 132 72 102 268 57 168 204Disapprove 452 129 240 74 120 151 95 36 112 132 72 102 268 57 168 204Disapprove 452 129 240 74 120 151 95 36 112 132 72 102 268 57 168 204 55% 67% 60% 35% 45% 52% 80% 66% 61% 55% 46% 47% 62% 17% 68% 96%55% 67% 60% 35% 45% 52% 80% 66% 61% 55% 46% 47% 62% 17% 68% 96%55% 67% 60% 35% 45% 52% 80% 66% 61% 55% 46% 47% 62% 17% 68% 96%55% 67% 60% 35% 45% 52% 80% 66% 61% 55% 46% 47% 62% 17% 68% 96% D D KL N NOD D KL N NOD D KL N NOD D KL N NO Not familiar enough to Not familiar enough to Not familiar enough to Not familiar enough to 35 9 21 6 11 10 5 3 11 6 7 12 16 18 12 35 9 21 6 11 10 5 3 11 6 7 12 16 18 12 35 9 21 6 11 10 5 3 11 6 7 12 16 18 12 35 9 21 6 11 10 5 3 11 6 7 12 16 18 12 ---- say 4% 5% 5% 3% 4% 3% 4% 6% 6% 2% 5% 6% 4% 6% 5% say 4% 5% 5% 3% 4% 3% 4% 6% 6% 2% 5% 6% 4% 6% 5% say 4% 5% 5% 3% 4% 3% 4% 6% 6% 2% 5% 6% 4% 6% 5% say 4% 5% 5% 3% 4% 3% 4% 6% 6% 2% 5% 6% 4% 6% 5% j j j j (Not sure) 16 2 10 1 1 7 1 5 8 2 2 6 8 5 7 3(Not sure) 16 2 10 1 1 7 1 5 8 2 2 6 8 5 7 3(Not sure) 16 2 10 1 1 7 1 5 8 2 2 6 8 5 7 3(Not sure) 16 2 10 1 1 7 1 5 8 2 2 6 8 5 7 3 2% 1% 3% 1% *% 2% 1% 9% 4% 1% 2% 3% 2% 1% 3% 2%2% 1% 3% 1% *% 2% 1% 9% 4% 1% 2% 3% 2% 1% 3% 2%2% 1% 3% 1% *% 2% 1% 9% 4% 1% 2% 3% 2% 1% 3% 2%2% 1% 3% 1% *% 2% 1% 9% 4% 1% 2% 3% 2% 1% 3% 2% d d d d CoCoCoComparison Groups: BCD/EF/GH/IJ/KLM/NOPmparison Groups: BCD/EF/GH/IJ/KLM/NOPmparison Groups: BCD/EF/GH/IJ/KLM/NOPmparison Groups: BCD/EF/GH/IJ/KLM/NOP Independent ZIndependent ZIndependent ZIndependent Z----Test for Percentages (unpooled proportions)Test for Percentages (unpooled proportions)Test for Percentages (unpooled proportions)Test for Percentages (unpooled proportions) Uppercase letters indicate significance at the 95% level.Uppercase letters indicate significance at the 95% level.Uppercase letters indicate significance at the 95% level.Uppercase letters indicate significance at the 95% level. Lowercase letters indicate significance at the 90% level.Lowercase letters indicate significance at the 90% level.Lowercase letters indicate significance at the 90% level.Lowercase letters indicate significance at the 90% level.

Table Q10 Page 19Table Q10 Page 19Table Q10 Page 19Table Q10 Page 19 Investor's Business Daily/TIPP PollInvestor's Business Daily/TIPP PollInvestor's Business Daily/TIPP PollInvestor's Business Daily/TIPP Poll---- December 2018, Field 11/26 to 12/2 , Sample December 2018, Field 11/26 to 12/2 , Sample December 2018, Field 11/26 to 12/2 , Sample December 2018, Field 11/26 to 12/2 , Sample ---- 823 adults, MOE +/823 adults, MOE +/823 adults, MOE +/823 adults, MOE +/----3.3 pts, Traditional phone with live interviewers 3.3 pts, Traditional phone with live interviewers 3.3 pts, Traditional phone with live interviewers 3.3 pts, Traditional phone with live interviewers Q10Q10Q10Q10 How would you describe the LEADERSHIP that President Trump is providing for the country? How would you describe the LEADERSHIP that President Trump is providing for the country? How would you describe the LEADERSHIP that President Trump is providing for the country? How would you describe the LEADERSHIP that President Trump is providing for the country? ======= REGION ======== ========= AGE ========= ==GENDER== ===RACE === ======= INCOME ======= =====PARTY===== ==INVESTOR======== REGION ======== ========= AGE ========= ==GENDER== ===RACE === ======= INCOME ======= =====PARTY===== ==INVESTOR======== REGION ======== ========= AGE ========= ==GENDER== ===RACE === ======= INCOME ======= =====PARTY===== ==INVESTOR======== REGION ======== ========= AGE ========= ==GENDER== ===RACE === ======= INCOME ======= =====PARTY===== ==INVESTOR= TOTAL BLATOTAL BLATOTAL BLATOTAL BLACK UND 30KCK UND 30KCK UND 30KCK UND 30K---- 50K50K50K50K---- NE MW SOUTH WEST 18NE MW SOUTH WEST 18NE MW SOUTH WEST 18NE MW SOUTH WEST 18----24 2524 2524 2524 25----44 4544 4544 4544 45----64 65+ MALE FEM. WHITE HISP 30K 50K 75K 75K+ DEM REP IND YES NO 64 65+ MALE FEM. WHITE HISP 30K 50K 75K 75K+ DEM REP IND YES NO 64 65+ MALE FEM. WHITE HISP 30K 50K 75K 75K+ DEM REP IND YES NO 64 65+ MALE FEM. WHITE HISP 30K 50K 75K 75K+ DEM REP IND YES NO -------------------- -------------------- -------------------- -------------------- -------------------- -------------------- -------------------- -------------------- -------------------- -------------------- -------------------- -------------------- -------------------- -------------------- -------------------- -------------------- -------------------- -------------------- -------------------- -------------------- -------------------- -------------------- (A) (B) (C) (D) (E) (F) (G) (H) (I) (J) (K) (L) (M) (N) (O) (P) (Q) (R) (S)(A) (B) (C) (D) (E) (F) (G) (H) (I) (J) (K) (L) (M) (N) (O) (P) (Q) (R) (S)(A) (B) (C) (D) (E) (F) (G) (H) (I) (J) (K) (L) (M) (N) (O) (P) (Q) (R) (S)(A) (B) (C) (D) (E) (F) (G) (H) (I) (J) (K) (L) (M) (N) (O) (P) (Q) (R) (S) (T) (U) (V)(T) (U) (V)(T) (U) (V)(T) (U) (V) TOTAL 823 147 181 309 186 45 234 293 207 393 430 556 171 92 131 138 3TOTAL 823 147 181 309 186 45 234 293 207 393 430 556 171 92 131 138 3TOTAL 823 147 181 309 186 45 234 293 207 393 430 556 171 92 131 138 3TOTAL 823 147 181 309 186 45 234 293 207 393 430 556 171 92 131 138 363 286 237 283 447 30963 286 237 283 447 30963 286 237 283 447 30963 286 237 283 447 309 100% 100% 100% 100% 100% 100% 100% 100% 100100% 100% 100% 100% 100% 100% 100% 100% 100100% 100% 100% 100% 100% 100% 100% 100% 100100% 100% 100% 100% 100% 100% 100% 100% 100% 100% 100% 100% 100% 100% 100% 100% 100% 100% 100% 100% 100% 100%% 100% 100% 100% 100% 100% 100% 100% 100% 100% 100% 100% 100% 100%% 100% 100% 100% 100% 100% 100% 100% 100% 100% 100% 100% 100% 100%% 100% 100% 100% 100% 100% 100% 100% 100% 100% 100% 100% 100% 100% Unweighted Total 823 158 180 311 174 17 102 289 371 433 390 645 107 104 145 126 3Unweighted Total 823 158 180 311 174 17 102 289 371 433 390 645 107 104 145 126 3Unweighted Total 823 158 180 311 174 17 102 289 371 433 390 645 107 104 145 126 3Unweighted Total 823 158 180 311 174 17 102 289 371 433 390 645 107 104 145 126 337 247 296 262 472 28237 247 296 262 472 28237 247 296 262 472 28237 247 296 262 472 282 Very strong Very strong Very strong Very strong 164 28 37 65 33 164 28 37 65 33 164 28 37 65 33 164 28 37 65 33 ---- 37 67 44 83 80 126 17 19 19 28 75 1 112 47 97 5137 67 44 83 80 126 17 19 19 28 75 1 112 47 97 5137 67 44 83 80 126 17 19 19 28 75 1 112 47 97 5137 67 44 83 80 126 17 19 19 28 75 1 112 47 97 51 20% 19% 20% 21% 18% 16% 23% 21% 21% 19% 23% 10% 21% 1420% 19% 20% 21% 18% 16% 23% 21% 21% 19% 23% 10% 21% 1420% 19% 20% 21% 18% 16% 23% 21% 21% 19% 23% 10% 21% 1420% 19% 20% 21% 18% 16% 23% 21% 21% 19% 23% 10% 21% 14% 20% 21% *% 47% 17% 22% 17%% 20% 21% *% 47% 17% 22% 17%% 20% 21% *% 47% 17% 22% 17%% 20% 21% *% 47% 17% 22% 17% M RT R M RT R M RT R M RT R Strong 149 21 26 74 27 5 43 57 37 74 75 128 14 20 23 26 Strong 149 21 26 74 27 5 43 57 37 74 75 128 14 20 23 26 Strong 149 21 26 74 27 5 43 57 37 74 75 128 14 20 23 26 Strong 149 21 26 74 27 5 43 57 37 74 75 128 14 20 23 26 63 14 85 47 85 5163 14 85 47 85 5163 14 85 47 85 5163 14 85 47 85 51 18% 15% 14% 24% 15% 11% 19% 19% 18% 19% 17% 23% 18% 15% 14% 24% 15% 11% 19% 19% 18% 19% 17% 23% 18% 15% 14% 24% 15% 11% 19% 19% 18% 19% 17% 23% 18% 15% 14% 24% 15% 11% 19% 19% 18% 19% 17% 23% 8% 22% 18% 19% 17% 5% 36% 17% 19% 17%8% 22% 18% 19% 17% 5% 36% 17% 19% 17%8% 22% 18% 19% 17% 5% 36% 17% 19% 17%8% 22% 18% 19% 17% 5% 36% 17% 19% 17% bCE M RT R bCE M RT R bCE M RT R bCE M RT R Moderate 105 18Moderate 105 18Moderate 105 18Moderate 105 18 24 42 22 12 31 36 20 58 47 60 29 10 17 27 35 37 29 36 48 4924 42 22 12 31 36 20 58 47 60 29 10 17 27 35 37 29 36 48 4924 42 22 12 31 36 20 58 47 60 29 10 17 27 35 37 29 36 48 4924 42 22 12 31 36 20 58 47 60 29 10 17 27 35 37 29 36 48 49 13% 12% 13% 14% 12% 26% 13% 12% 10% 15% 11% 11% 17% 11% 13% 20% 10% 13% 13% 12% 13% 14% 12% 26% 13% 12% 10% 15% 11% 11% 17% 11% 13% 20% 10% 13% 13% 12% 13% 14% 12% 26% 13% 12% 10% 15% 11% 11% 17% 11% 13% 20% 10% 13% 13% 12% 13% 14% 12% 26% 13% 12% 10% 15% 11% 11% 17% 11% 13% 20% 10% 13% 12% 13% 11% 16%12% 13% 11% 16%12% 13% 11% 16%12% 13% 11% 16% Q uQ uQ uQ u Weak 123 20 26 36 41 10 35 44 Weak 123 20 26 36 41 10 35 44 Weak 123 20 26 36 41 10 35 44 Weak 123 20 26 36 41 10 35 44 31 50 73 73 35 14 25 20 57 60 2 61 76 4231 50 73 73 35 14 25 20 57 60 2 61 76 4231 50 73 73 35 14 25 20 57 60 2 61 76 4231 50 73 73 35 14 25 20 57 60 2 61 76 42 15% 14% 14% 12% 22% 22% 15% 15% 15% 13% 17% 13% 21% 16% 19% 14% 16% 21% 1% 21% 17% 15% 14% 14% 12% 22% 22% 15% 15% 15% 13% 17% 13% 21% 16% 19% 14% 16% 21% 1% 21% 17% 15% 14% 14% 12% 22% 22% 15% 15% 15% 13% 17% 13% 21% 16% 19% 14% 16% 21% 1% 21% 17% 15% 14% 14% 12% 22% 22% 15% 15% 15% 13% 17% 13% 21% 16% 19% 14% 16% 21% 1% 21% 17% 14%14%14%14% D l S S D l S S D l S S D l S S Very weak 272 57 66 89 60 19 84 88 69 123 149 165 73 28 Very weak 272 57 66 89 60 19 84 88 69 123 149 165 73 28 Very weak 272 57 66 89 60 19 84 88 69 123 149 165 73 28 Very weak 272 57 66 89 60 19 84 88 69 123 149 165 73 28 46 38 129 171 7 88 136 11146 38 129 171 7 88 136 11146 38 129 171 7 88 136 11146 38 129 171 7 88 136 111 33% 39% 36% 29% 32% 42% 36% 30% 33% 31% 35% 30% 43% 30% 35% 27% 35% 60% 3% 31% 30% 33% 39% 36% 29% 32% 42% 36% 30% 33% 31% 35% 30% 43% 30% 35% 27% 35% 60% 3% 31% 30% 33% 39% 36% 29% 32% 42% 36% 30% 33% 31% 35% 30% 43% 30% 35% 27% 35% 60% 3% 31% 30% 33% 39% 36% 29% 32% 42% 36% 30% 33% 31% 35% 30% 43% 30% 35% 27% 35% 60% 3% 31% 30% 36%36%36%36% d d d d L ST S L ST S L ST S L ST S (Not sure) 9 2 3 2 3 (Not sure) 9 2 3 2 3 (Not sure) 9 2 3 2 3 (Not sure) 9 2 3 2 3 ---- 3 1 6 4 5 5 3 3 1 6 4 5 5 3 3 1 6 4 5 5 3 3 1 6 4 5 5 3 ---- 1 1 1 1 ---- 4 3 2 4 4 3 2 4 4 3 2 4 4 3 2 4 5 45 45 45 4 1% 1% 1% 1% 1% 1% *% 3% 1% 1% 1% 2% 1% 1% 1% 1% 1% 1% 1% 1% 1% 1% 1% 1% *% 3% 1% 1% 1% 2% 1% 1% 1% 1% 1% 1% 1% 1% 1% 1% 1% 1% *% 3% 1% 1% 1% 2% 1% 1% 1% 1% 1% 1% 1% 1% 1% 1% 1% 1% *% 3% 1% 1% 1% 2% 1% 1% 1% 1% 1% 1% 1%1%1%1% H H H H Comparison Groups: BCDE/FGHI/JK/LM/NOPQ/RST/UVComparison Groups: BCDE/FGHI/JK/LM/NOPQ/RST/UVComparison Groups: BCDE/FGHI/JK/LM/NOPQ/RST/UVComparison Groups: BCDE/FGHI/JK/LM/NOPQ/RST/UV Independent ZIndependent ZIndependent ZIndependent Z----Test for Percentages (unpooled proportions)Test for Percentages (unpooled proportions)Test for Percentages (unpooled proportions)Test for Percentages (unpooled proportions) Uppercase letters indicate significance at the 95% level.Uppercase letters indicate significance at the 95% level.Uppercase letters indicate significance at the 95% level.Uppercase letters indicate significance at the 95% level. Lowercase letters indicate significance at the 90% level.Lowercase letters indicate significance at the 90% level.Lowercase letters indicate significance at the 90% level.Lowercase letters indicate significance at the 90% level.
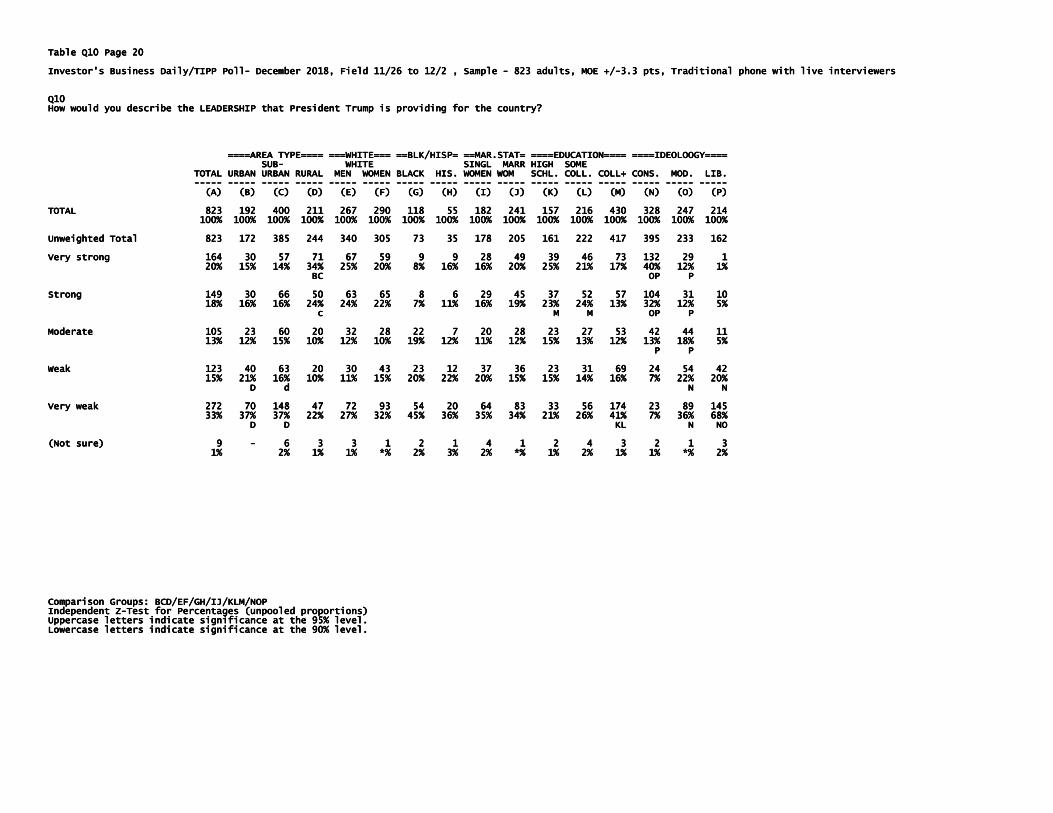
Table Q10 Page 20Table Q10 Page 20Table Q10 Page 20Table Q10 Page 20 Investor's Business Daily/TIPP PollInvestor's Business Daily/TIPP PollInvestor's Business Daily/TIPP PollInvestor's Business Daily/TIPP Poll---- December 2018, Field 11/26 to 12/2 , Sample December 2018, Field 11/26 to 12/2 , Sample December 2018, Field 11/26 to 12/2 , Sample December 2018, Field 11/26 to 12/2 , Sample ---- 823 adults, MOE +/823 adults, MOE +/823 adults, MOE +/823 adults, MOE +/----3.3 pts, Traditional phone with live interviewers 3.3 pts, Traditional phone with live interviewers 3.3 pts, Traditional phone with live interviewers 3.3 pts, Traditional phone with live interviewers Q10Q10Q10Q10 How would you descrHow would you descrHow would you descrHow would you describe the LEADERSHIP that President Trump is providing for the country? ibe the LEADERSHIP that President Trump is providing for the country? ibe the LEADERSHIP that President Trump is providing for the country? ibe the LEADERSHIP that President Trump is providing for the country? ====AREA TYPE==== ===WHITE=== ==BLK/HISP= ==MAR.STAT= ====EDUCATION==== ====IDEOLOOGY========AREA TYPE==== ===WHITE=== ==BLK/HISP= ==MAR.STAT= ====EDUCATION==== ====IDEOLOOGY========AREA TYPE==== ===WHITE=== ==BLK/HISP= ==MAR.STAT= ====EDUCATION==== ====IDEOLOOGY========AREA TYPE==== ===WHITE=== ==BLK/HISP= ==MAR.STAT= ====EDUCATION==== ====IDEOLOOGY==== SUBSUBSUBSUB---- WHITE WHITE WHITE WHITE SINGL MARR HIGH SOME SINGL MARR HIGH SOME SINGL MARR HIGH SOME SINGL MARR HIGH SOME TOTAL URBAN URBAN RURAL MEN WOMEN BLACK HIS. WOMEN WOM SCHL. COLL. COLL+ CONS. MOD. LIB.TOTAL URBAN URBAN RURAL MEN WOMEN BLACK HIS. WOMEN WOM SCHL. COLL. COLL+ CONS. MOD. LIB.TOTAL URBAN URBAN RURAL MEN WOMEN BLACK HIS. WOMEN WOM SCHL. COLL. COLL+ CONS. MOD. LIB.TOTAL URBAN URBAN RURAL MEN WOMEN BLACK HIS. WOMEN WOM SCHL. COLL. COLL+ CONS. MOD. LIB. -------------------- -------------------- -------------------- -------------------- -------------------- -------------------- -------------------- -------------------- -------------------- -------------------- -------------------- -------------------- -------------------- -------------------- -------------------- -------------------- (A) (B) (C) (D) (E) (F) (G) (H) (I) (J) (K) (L) (M) (N) (O) (P)(A) (B) (C) (D) (E) (F) (G) (H) (I) (J) (K) (L) (M) (N) (O) (P)(A) (B) (C) (D) (E) (F) (G) (H) (I) (J) (K) (L) (M) (N) (O) (P)(A) (B) (C) (D) (E) (F) (G) (H) (I) (J) (K) (L) (M) (N) (O) (P) TOTAL 823 192 400 211 267 290 118 55 182 TOTAL 823 192 400 211 267 290 118 55 182 TOTAL 823 192 400 211 267 290 118 55 182 TOTAL 823 192 400 211 267 290 118 55 182 241 157 216 430 328 247 214241 157 216 430 328 247 214241 157 216 430 328 247 214241 157 216 430 328 247 214 100% 100% 100% 100% 100% 100% 100% 100% 100% 100% 100% 100% 100% 100% 100% 100%100% 100% 100% 100% 100% 100% 100% 100% 100% 100% 100% 100% 100% 100% 100% 100%100% 100% 100% 100% 100% 100% 100% 100% 100% 100% 100% 100% 100% 100% 100% 100%100% 100% 100% 100% 100% 100% 100% 100% 100% 100% 100% 100% 100% 100% 100% 100% Unweighted Total 823 172 385 244 340 305 73 35 178 205 161 222 417 395 233 162Unweighted Total 823 172 385 244 340 305 73 35 178 205 161 222 417 395 233 162Unweighted Total 823 172 385 244 340 305 73 35 178 205 161 222 417 395 233 162Unweighted Total 823 172 385 244 340 305 73 35 178 205 161 222 417 395 233 162 Very strong 164 30 57 71 67 59 9 9 28 49 39 46 73 132 29 1Very strong 164 30 57 71 67 59 9 9 28 49 39 46 73 132 29 1Very strong 164 30 57 71 67 59 9 9 28 49 39 46 73 132 29 1Very strong 164 30 57 71 67 59 9 9 28 49 39 46 73 132 29 1 20% 15% 14% 34% 25% 20% 8% 16% 16% 20% 25% 21% 17% 40% 12% 1%20% 15% 14% 34% 25% 20% 8% 16% 16% 20% 25% 21% 17% 40% 12% 1%20% 15% 14% 34% 25% 20% 8% 16% 16% 20% 25% 21% 17% 40% 12% 1%20% 15% 14% 34% 25% 20% 8% 16% 16% 20% 25% 21% 17% 40% 12% 1% BC OP P BC OP P BC OP P BC OP P Strong Strong Strong Strong 149 30 66 50 63 65 8 6 29 45 37 52 57 104 31 10149 30 66 50 63 65 8 6 29 45 37 52 57 104 31 10149 30 66 50 63 65 8 6 29 45 37 52 57 104 31 10149 30 66 50 63 65 8 6 29 45 37 52 57 104 31 10 18% 16% 16% 24% 24% 22% 7% 11% 16% 19% 23% 24% 13% 32% 12% 5%18% 16% 16% 24% 24% 22% 7% 11% 16% 19% 23% 24% 13% 32% 12% 5%18% 16% 16% 24% 24% 22% 7% 11% 16% 19% 23% 24% 13% 32% 12% 5%18% 16% 16% 24% 24% 22% 7% 11% 16% 19% 23% 24% 13% 32% 12% 5% c M M OP P c M M OP P c M M OP P c M M OP P Moderate 105 23 60 20 32 28 22 7 20 28 23 27 53 42 44 11Moderate 105 23 60 20 32 28 22 7 20 28 23 27 53 42 44 11Moderate 105 23 60 20 32 28 22 7 20 28 23 27 53 42 44 11Moderate 105 23 60 20 32 28 22 7 20 28 23 27 53 42 44 11 13% 12% 15% 13% 12% 15% 13% 12% 15% 13% 12% 15% 10% 12% 10% 19% 12% 11% 12% 15% 13% 12% 13% 18% 5%10% 12% 10% 19% 12% 11% 12% 15% 13% 12% 13% 18% 5%10% 12% 10% 19% 12% 11% 12% 15% 13% 12% 13% 18% 5%10% 12% 10% 19% 12% 11% 12% 15% 13% 12% 13% 18% 5% P P P P P P P P Weak 123 40 63 20 30 Weak 123 40 63 20 30 Weak 123 40 63 20 30 Weak 123 40 63 20 30 43 23 12 37 36 23 31 69 24 54 4243 23 12 37 36 23 31 69 24 54 4243 23 12 37 36 23 31 69 24 54 4243 23 12 37 36 23 31 69 24 54 42 15% 21% 16% 10% 11% 15% 20% 22% 20% 15% 15% 14% 16% 7% 22% 20%15% 21% 16% 10% 11% 15% 20% 22% 20% 15% 15% 14% 16% 7% 22% 20%15% 21% 16% 10% 11% 15% 20% 22% 20% 15% 15% 14% 16% 7% 22% 20%15% 21% 16% 10% 11% 15% 20% 22% 20% 15% 15% 14% 16% 7% 22% 20% D d D d D d D d N NN NN NN N Very weak 272 70 148 47 72 93 54 20 64 83 33 56 174 23 89 145Very weak 272 70 148 47 72 93 54 20 64 83 33 56 174 23 89 145Very weak 272 70 148 47 72 93 54 20 64 83 33 56 174 23 89 145Very weak 272 70 148 47 72 93 54 20 64 83 33 56 174 23 89 145 33% 37% 37% 22% 27% 32% 45% 36% 35%33% 37% 37% 22% 27% 32% 45% 36% 35%33% 37% 37% 22% 27% 32% 45% 36% 35%33% 37% 37% 22% 27% 32% 45% 36% 35% 34% 21% 26% 41% 7% 36% 68%34% 21% 26% 41% 7% 36% 68%34% 21% 26% 41% 7% 36% 68%34% 21% 26% 41% 7% 36% 68% D D KL N NOD D KL N NOD D KL N NOD D KL N NO (Not sure) 9 (Not sure) 9 (Not sure) 9 (Not sure) 9 ---- 6 3 3 1 2 1 4 1 6 3 3 1 2 1 4 1 6 3 3 1 2 1 4 1 6 3 3 1 2 1 4 1 2 4 3 2 1 32 4 3 2 1 32 4 3 2 1 32 4 3 2 1 3 1% 2% 1% 1% *% 2% 3% 2% *% 1% 2% 1% 1% *% 2%1% 2% 1% 1% *% 2% 3% 2% *% 1% 2% 1% 1% *% 2%1% 2% 1% 1% *% 2% 3% 2% *% 1% 2% 1% 1% *% 2%1% 2% 1% 1% *% 2% 3% 2% *% 1% 2% 1% 1% *% 2% Comparison Groups: BCD/EF/GH/IJ/KLM/NOPComparison Groups: BCD/EF/GH/IJ/KLM/NOPComparison Groups: BCD/EF/GH/IJ/KLM/NOPComparison Groups: BCD/EF/GH/IJ/KLM/NOP Independent ZIndependent ZIndependent ZIndependent Z----Test for Percentages (unpooled proportions)Test for Percentages (unpooled proportions)Test for Percentages (unpooled proportions)Test for Percentages (unpooled proportions) Uppercase letters indicate significance at the 95% level.Uppercase letters indicate significance at the 95% level.Uppercase letters indicate significance at the 95% level.Uppercase letters indicate significance at the 95% level. Lowercase letters indicate significance at the 90% level.Lowercase letters indicate significance at the 90% level.Lowercase letters indicate significance at the 90% level.Lowercase letters indicate significance at the 90% level.
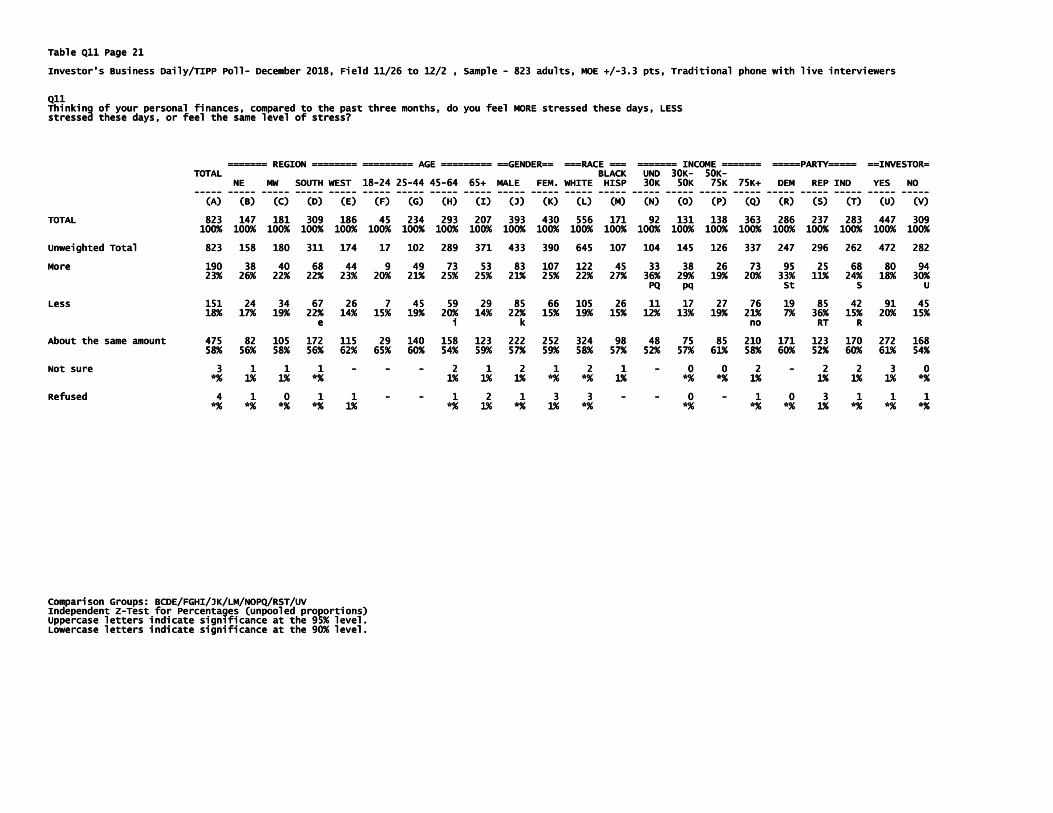
Table Q11 Page 21Table Q11 Page 21Table Q11 Page 21Table Q11 Page 21 Investor's Business Daily/TIPP PollInvestor's Business Daily/TIPP PollInvestor's Business Daily/TIPP PollInvestor's Business Daily/TIPP Poll---- December 2018, Field 11/2December 2018, Field 11/2December 2018, Field 11/2December 2018, Field 11/26 to 12/2 , Sample 6 to 12/2 , Sample 6 to 12/2 , Sample 6 to 12/2 , Sample ---- 823 adults, MOE +/823 adults, MOE +/823 adults, MOE +/823 adults, MOE +/----3.3 pts, Traditional phone with live interviewers 3.3 pts, Traditional phone with live interviewers 3.3 pts, Traditional phone with live interviewers 3.3 pts, Traditional phone with live interviewers Q11Q11Q11Q11 Thinking of your personal finances, compared to the past three months, do you feel MORE stressed these days, LESS Thinking of your personal finances, compared to the past three months, do you feel MORE stressed these days, LESS Thinking of your personal finances, compared to the past three months, do you feel MORE stressed these days, LESS Thinking of your personal finances, compared to the past three months, do you feel MORE stressed these days, LESS stressed these days, or feel the same level stressed these days, or feel the same level stressed these days, or feel the same level stressed these days, or feel the same level of stress?of stress?of stress?of stress? ======= REGION ======== ========= AGE ========= ==GENDER== ===RACE === ======= INCOME ======= =====PARTY===== ==INVESTOR======== REGION ======== ========= AGE ========= ==GENDER== ===RACE === ======= INCOME ======= =====PARTY===== ==INVESTOR======== REGION ======== ========= AGE ========= ==GENDER== ===RACE === ======= INCOME ======= =====PARTY===== ==INVESTOR======== REGION ======== ========= AGE ========= ==GENDER== ===RACE === ======= INCOME ======= =====PARTY===== ==INVESTOR= TOTAL TOTAL TOTAL TOTAL BLACK UND 30KBLACK UND 30KBLACK UND 30KBLACK UND 30K---- 50K50K50K50K---- NE MW SOUTH WEST 18NE MW SOUTH WEST 18NE MW SOUTH WEST 18NE MW SOUTH WEST 18----24 2524 2524 2524 25----44 4544 4544 4544 45----64 65+ MALE FEM. WHITE HISP 30K 50K 75K 75K+ DEM REP IND YES 64 65+ MALE FEM. WHITE HISP 30K 50K 75K 75K+ DEM REP IND YES 64 65+ MALE FEM. WHITE HISP 30K 50K 75K 75K+ DEM REP IND YES 64 65+ MALE FEM. WHITE HISP 30K 50K 75K 75K+ DEM REP IND YES NO NO NO NO -------------------- -------------------- -------------------- -------------------- -------------------- -------------------- -------------------- -------------------- -------------------- -------------------- -------------------- -------------------- -------------------- -------------------- -------------------- -------------------- -------------------- -------------------- -------------------- -------------------- -------------------- -------------------- (A) (B) (C) (D) (E) (F) (G) (H) (I) (J) (K) (A) (B) (C) (D) (E) (F) (G) (H) (I) (J) (K) (A) (B) (C) (D) (E) (F) (G) (H) (I) (J) (K) (A) (B) (C) (D) (E) (F) (G) (H) (I) (J) (K) (L) (M) (N) (O) (P) (Q) (R) (S) (T) (U) (V)(L) (M) (N) (O) (P) (Q) (R) (S) (T) (U) (V)(L) (M) (N) (O) (P) (Q) (R) (S) (T) (U) (V)(L) (M) (N) (O) (P) (Q) (R) (S) (T) (U) (V) TOTAL 823 147 181 309 186 45 234 293 207 393 430 556 171 92 131 138 3TOTAL 823 147 181 309 186 45 234 293 207 393 430 556 171 92 131 138 3TOTAL 823 147 181 309 186 45 234 293 207 393 430 556 171 92 131 138 3TOTAL 823 147 181 309 186 45 234 293 207 393 430 556 171 92 131 138 363 286 237 283 447 30963 286 237 283 447 30963 286 237 283 447 30963 286 237 283 447 309 100% 100% 100% 100% 100% 100% 100% 100% 100% 100% 100% 100% 100% 100% 100% 100% 100% 100% 100% 100% 100% 100% 100% 100% 100%100% 100% 100% 100% 100% 100% 100% 100% 100% 100% 100% 100% 100% 100% 100% 100% 100% 100% 100% 100% 100%100% 100% 100% 100% 100% 100% 100% 100% 100% 100% 100% 100% 100% 100% 100% 100% 100% 100% 100% 100% 100%100% 100% 100% 100% 100% 100% 100% 100% 100% 100% 100% 100% 100% 100% 100% 100% 100% 100% 100% 100% 100% Unweighted Total 823 158 180 311 174 17 102 289 371 433 390 645 107 104 145 126 3Unweighted Total 823 158 180 311 174 17 102 289 371 433 390 645 107 104 145 126 3Unweighted Total 823 158 180 311 174 17 102 289 371 433 390 645 107 104 145 126 3Unweighted Total 823 158 180 311 174 17 102 289 371 433 390 645 107 104 145 126 337 37 37 37 247 296 262 472 282247 296 262 472 282247 296 262 472 282247 296 262 472 282 More 190 38 40 68 44 9 49 73 53 83 107 122 45 33 38 26 More 190 38 40 68 44 9 49 73 53 83 107 122 45 33 38 26 More 190 38 40 68 44 9 49 73 53 83 107 122 45 33 38 26 More 190 38 40 68 44 9 49 73 53 83 107 122 45 33 38 26 73 95 25 68 80 9473 95 25 68 80 9473 95 25 68 80 9473 95 25 68 80 94 23% 26% 22% 22% 23% 20% 21% 23% 26% 22% 22% 23% 20% 21% 23% 26% 22% 22% 23% 20% 21% 23% 26% 22% 22% 23% 20% 21% 25% 25% 21% 25% 22% 27% 36% 29% 19% 20% 33% 11% 24% 18% 30%25% 25% 21% 25% 22% 27% 36% 29% 19% 20% 33% 11% 24% 18% 30%25% 25% 21% 25% 22% 27% 36% 29% 19% 20% 33% 11% 24% 18% 30%25% 25% 21% 25% 22% 27% 36% 29% 19% 20% 33% 11% 24% 18% 30% PQ pq St S UPQ pq St S UPQ pq St S UPQ pq St S U Less Less Less Less 151 24 34 67 26 7 45 59 29 85 66 105 26 11 17 27 76 19 85 42 91 151 24 34 67 26 7 45 59 29 85 66 105 26 11 17 27 76 19 85 42 91 151 24 34 67 26 7 45 59 29 85 66 105 26 11 17 27 76 19 85 42 91 151 24 34 67 26 7 45 59 29 85 66 105 26 11 17 27 76 19 85 42 91 45454545 18% 17% 19% 22% 14% 15% 19% 20% 14% 22% 15% 19% 15% 18% 17% 19% 22% 14% 15% 19% 20% 14% 22% 15% 19% 15% 18% 17% 19% 22% 14% 15% 19% 20% 14% 22% 15% 19% 15% 18% 17% 19% 22% 14% 15% 19% 20% 14% 22% 15% 19% 15% 12% 13% 19% 21% 7% 36% 15% 20% 15%12% 13% 19% 21% 7% 36% 15% 20% 15%12% 13% 19% 21% 7% 36% 15% 20% 15%12% 13% 19% 21% 7% 36% 15% 20% 15% e i k no RT R e i k no RT R e i k no RT R e i k no RT R About the same amount 475 82 105 About the same amount 475 82 105 About the same amount 475 82 105 About the same amount 475 82 105 172 115 29 140 158 123 222 252 324 98 48 75 85 210 171 123 170 272 168172 115 29 140 158 123 222 252 324 98 48 75 85 210 171 123 170 272 168172 115 29 140 158 123 222 252 324 98 48 75 85 210 171 123 170 272 168172 115 29 140 158 123 222 252 324 98 48 75 85 210 171 123 170 272 168 58% 56% 58% 56% 62% 65% 60% 54% 59% 57% 59% 58% 57% 52% 57% 61% 58% 60% 52% 58% 56% 58% 56% 62% 65% 60% 54% 59% 57% 59% 58% 57% 52% 57% 61% 58% 60% 52% 58% 56% 58% 56% 62% 65% 60% 54% 59% 57% 59% 58% 57% 52% 57% 61% 58% 60% 52% 58% 56% 58% 56% 62% 65% 60% 54% 59% 57% 59% 58% 57% 52% 57% 61% 58% 60% 52% 60% 61% 54%60% 61% 54%60% 61% 54%60% 61% 54% Not sure 3 1 1 1 Not sure 3 1 1 1 Not sure 3 1 1 1 Not sure 3 1 1 1 ---- ---- ---- 2 1 2 1 2 1 2 1 2 1 2 1 2 1 2 1 2 1 2 1 2 1 2 1 ---- 0 0 2 0 0 2 0 0 2 0 0 2 ---- 2 2 3 02 2 3 02 2 3 02 2 3 0 *% 1% 1% *% 1% 1% *% 1% 1% *% 1% 1% *% 1% 1% *% 1% 1% *% 1% 1% *% 1% 1% 1% *% *% 1% *% *% 1% 1% 1% 1% *%1% *% *% 1% *% *% 1% 1% 1% 1% *%1% *% *% 1% *% *% 1% 1% 1% 1% *%1% *% *% 1% *% *% 1% 1% 1% 1% *% Refused 4 1 0 1 1 Refused 4 1 0 1 1 Refused 4 1 0 1 1 Refused 4 1 0 1 1 ---- ---- 1 2 1 3 3 1 2 1 3 3 1 2 1 3 3 1 2 1 3 3 ---- ---- 0 0 0 0 ---- 1 0 3 1 1 11 0 3 1 1 11 0 3 1 1 11 0 3 1 1 1 *% *% *% *% 1% *% 1% *% 1% *% *% *% *% 1% *% *% *% *% *% *% 1% *% 1% *% 1% *% *% *% *% 1% *% *% *% *% *% *% 1% *% 1% *% 1% *% *% *% *% 1% *% *% *% *% *% *% 1% *% 1% *% 1% *% *% *% *% 1% *% *% *%*%*%*% Comparison Groups: BCDE/FGHI/JK/LM/NOPQ/RST/UVComparison Groups: BCDE/FGHI/JK/LM/NOPQ/RST/UVComparison Groups: BCDE/FGHI/JK/LM/NOPQ/RST/UVComparison Groups: BCDE/FGHI/JK/LM/NOPQ/RST/UV Independent ZIndependent ZIndependent ZIndependent Z----Test for Percentages (unpooled proportions)Test for Percentages (unpooled proportions)Test for Percentages (unpooled proportions)Test for Percentages (unpooled proportions) Uppercase letters indicate significance at the 95% level.Uppercase letters indicate significance at the 95% level.Uppercase letters indicate significance at the 95% level.Uppercase letters indicate significance at the 95% level. Lowercase letters indicate significance at the 90% level.Lowercase letters indicate significance at the 90% level.Lowercase letters indicate significance at the 90% level.Lowercase letters indicate significance at the 90% level.

Table Q11 Page 22Table Q11 Page 22Table Q11 Page 22Table Q11 Page 22 Investor's Business Daily/TIPP PollInvestor's Business Daily/TIPP PollInvestor's Business Daily/TIPP PollInvestor's Business Daily/TIPP Poll---- December 2018, Field 11/2December 2018, Field 11/2December 2018, Field 11/2December 2018, Field 11/26 to 12/2 , Sample 6 to 12/2 , Sample 6 to 12/2 , Sample 6 to 12/2 , Sample ---- 823 adults, MOE +/823 adults, MOE +/823 adults, MOE +/823 adults, MOE +/----3.3 pts, Traditional phone with live interviewers 3.3 pts, Traditional phone with live interviewers 3.3 pts, Traditional phone with live interviewers 3.3 pts, Traditional phone with live interviewers Q11Q11Q11Q11 Thinking of your personal finances, compared to the past three months, do you feel MORE stressed these days, LESS Thinking of your personal finances, compared to the past three months, do you feel MORE stressed these days, LESS Thinking of your personal finances, compared to the past three months, do you feel MORE stressed these days, LESS Thinking of your personal finances, compared to the past three months, do you feel MORE stressed these days, LESS stressed these days, or feel the same level of stress?stressed these days, or feel the same level of stress?stressed these days, or feel the same level of stress?stressed these days, or feel the same level of stress? ====AREA TYPE==== ===WHITE=== ==BLK/HISP= ==MAR.STAT= ====EDUCATION==== ====IDEOLOOGY========AREA TYPE==== ===WHITE=== ==BLK/HISP= ==MAR.STAT= ====EDUCATION==== ====IDEOLOOGY========AREA TYPE==== ===WHITE=== ==BLK/HISP= ==MAR.STAT= ====EDUCATION==== ====IDEOLOOGY========AREA TYPE==== ===WHITE=== ==BLK/HISP= ==MAR.STAT= ====EDUCATION==== ====IDEOLOOGY==== SUBSUBSUBSUB---- WHITE SWHITE SWHITE SWHITE SINGL MARR HIGH SOME INGL MARR HIGH SOME INGL MARR HIGH SOME INGL MARR HIGH SOME TOTAL URBAN URBAN RURAL MEN WOMEN BLACK HIS. WOMEN WOM SCHL. COLL. COLL+ CONS. MOD. LIB.TOTAL URBAN URBAN RURAL MEN WOMEN BLACK HIS. WOMEN WOM SCHL. COLL. COLL+ CONS. MOD. LIB.TOTAL URBAN URBAN RURAL MEN WOMEN BLACK HIS. WOMEN WOM SCHL. COLL. COLL+ CONS. MOD. LIB.TOTAL URBAN URBAN RURAL MEN WOMEN BLACK HIS. WOMEN WOM SCHL. COLL. COLL+ CONS. MOD. LIB. -------------------- -------------------- -------------------- -------------------- -------------------- -------------------- -------------------- -------------------- -------------------- -------------------- -------------------- -------------------- -------------------- -------------------- -------------------- -------------------- (A) (B) (C) (D) (E) (F) (G) (H) (I) (J) (K) (L) (M) (N) (O) (P)(A) (B) (C) (D) (E) (F) (G) (H) (I) (J) (K) (L) (M) (N) (O) (P)(A) (B) (C) (D) (E) (F) (G) (H) (I) (J) (K) (L) (M) (N) (O) (P)(A) (B) (C) (D) (E) (F) (G) (H) (I) (J) (K) (L) (M) (N) (O) (P) TOTAL 823 192 400 211 267 290 118 55 182 241 157 216 TOTAL 823 192 400 211 267 290 118 55 182 241 157 216 TOTAL 823 192 400 211 267 290 118 55 182 241 157 216 TOTAL 823 192 400 211 267 290 118 55 182 241 157 216 430 328 247 214430 328 247 214430 328 247 214430 328 247 214 100% 100% 100% 100% 100% 100% 100% 100% 100% 100% 100% 100% 100% 100% 100% 100%100% 100% 100% 100% 100% 100% 100% 100% 100% 100% 100% 100% 100% 100% 100% 100%100% 100% 100% 100% 100% 100% 100% 100% 100% 100% 100% 100% 100% 100% 100% 100%100% 100% 100% 100% 100% 100% 100% 100% 100% 100% 100% 100% 100% 100% 100% 100% Unweighted Total 823 172 385 244 340 305 73 35 178 205 161 222 417 395Unweighted Total 823 172 385 244 340 305 73 35 178 205 161 222 417 395Unweighted Total 823 172 385 244 340 305 73 35 178 205 161 222 417 395Unweighted Total 823 172 385 244 340 305 73 35 178 205 161 222 417 395 233 162233 162233 162233 162 More 190 50 105 32 50 72 36 10 52 55 34 54 97 44 72 69More 190 50 105 32 50 72 36 10 52 55 34 54 97 44 72 69More 190 50 105 32 50 72 36 10 52 55 34 54 97 44 72 69More 190 50 105 32 50 72 36 10 52 55 34 54 97 44 72 69 23% 26% 26% 15% 19% 25% 30% 18% 28% 23% 22% 25% 23% 13% 29% 3223% 26% 26% 15% 19% 25% 30% 18% 28% 23% 22% 25% 23% 13% 29% 3223% 26% 26% 15% 19% 25% 30% 18% 28% 23% 22% 25% 23% 13% 29% 3223% 26% 26% 15% 19% 25% 30% 18% 28% 23% 22% 25% 23% 13% 29% 32%%%% D D N ND D N ND D N ND D N N Less 151 19 60 65 62 43 11 15 25 40 31 45 70 110 25 11Less 151 19 60 65 62 43 11 15 25 40 31 45 70 110 25 11Less 151 19 60 65 62 43 11 15 25 40 31 45 70 110 25 11Less 151 19 60 65 62 43 11 15 25 40 31 45 70 110 25 11 18% 10% 15% 31% 23% 15% 10% 28% 14% 16% 19% 21% 16% 34% 10% 5%18% 10% 15% 31% 23% 15% 10% 28% 14% 16% 19% 21% 16% 34% 10% 5%18% 10% 15% 31% 23% 15% 10% 28% 14% 16% 19% 21% 16% 34% 10% 5%18% 10% 15% 31% 23% 15% 10% 28% 14% 16% 19% 21% 16% 34% 10% 5% BC F G OP p BC F G OP p BC F G OP p BC F G OP p About the same amounAbout the same amounAbout the same amounAbout the same amount 475 120 233 113 152 172 70 30 105 143 91 116 259 169 149 132t 475 120 233 113 152 172 70 30 105 143 91 116 259 169 149 132t 475 120 233 113 152 172 70 30 105 143 91 116 259 169 149 132t 475 120 233 113 152 172 70 30 105 143 91 116 259 169 149 132 58% 62% 58% 54% 57% 59% 59% 55% 58% 59% 58% 54% 60% 52% 60% 62%58% 62% 58% 54% 57% 59% 59% 55% 58% 59% 58% 54% 60% 52% 60% 62%58% 62% 58% 54% 57% 59% 59% 55% 58% 59% 58% 54% 60% 52% 60% 62%58% 62% 58% 54% 57% 59% 59% 55% 58% 59% 58% 54% 60% 52% 60% 62% n nn nn nn n Not sure 3 2 0 1 1 1 1 Not sure 3 2 0 1 1 1 1 Not sure 3 2 0 1 1 1 1 Not sure 3 2 0 1 1 1 1 ---- ---- 1 0 1 0 1 0 1 0 ---- 3 3 3 3 3 3 3 3 ---- 0000 *% 1% *% *% *% *% 1% *% *% 1% 1% *%*% 1% *% *% *% *% 1% *% *% 1% 1% *%*% 1% *% *% *% *% 1% *% *% 1% 1% *%*% 1% *% *% *% *% 1% *% *% 1% 1% *% Refused 4 1 2 Refused 4 1 2 Refused 4 1 2 Refused 4 1 2 ---- 1 2 1 2 1 2 1 2 ---- ---- 0 2 0 0 2 2 1 10 2 0 0 2 2 1 10 2 0 0 2 2 1 10 2 0 0 2 2 1 1 *% 1% *% *% 1% *% 1% *% *% *% *% *% *%*% 1% *% *% 1% *% 1% *% *% *% *% *% *%*% 1% *% *% 1% *% 1% *% *% *% *% *% *%*% 1% *% *% 1% *% 1% *% *% *% *% *% *% Comparison Groups: BCD/EF/GH/IJ/KLM/NOPComparison Groups: BCD/EF/GH/IJ/KLM/NOPComparison Groups: BCD/EF/GH/IJ/KLM/NOPComparison Groups: BCD/EF/GH/IJ/KLM/NOP Independent ZIndependent ZIndependent ZIndependent Z----Test for Percentages (unpooled proportions)Test for Percentages (unpooled proportions)Test for Percentages (unpooled proportions)Test for Percentages (unpooled proportions) Uppercase letters indicate significance at the 95% level.Uppercase letters indicate significance at the 95% level.Uppercase letters indicate significance at the 95% level.Uppercase letters indicate significance at the 95% level. Lowercase letters indicate significance at the 90% level.Lowercase letters indicate significance at the 90% level.Lowercase letters indicate significance at the 90% level.Lowercase letters indicate significance at the 90% level.
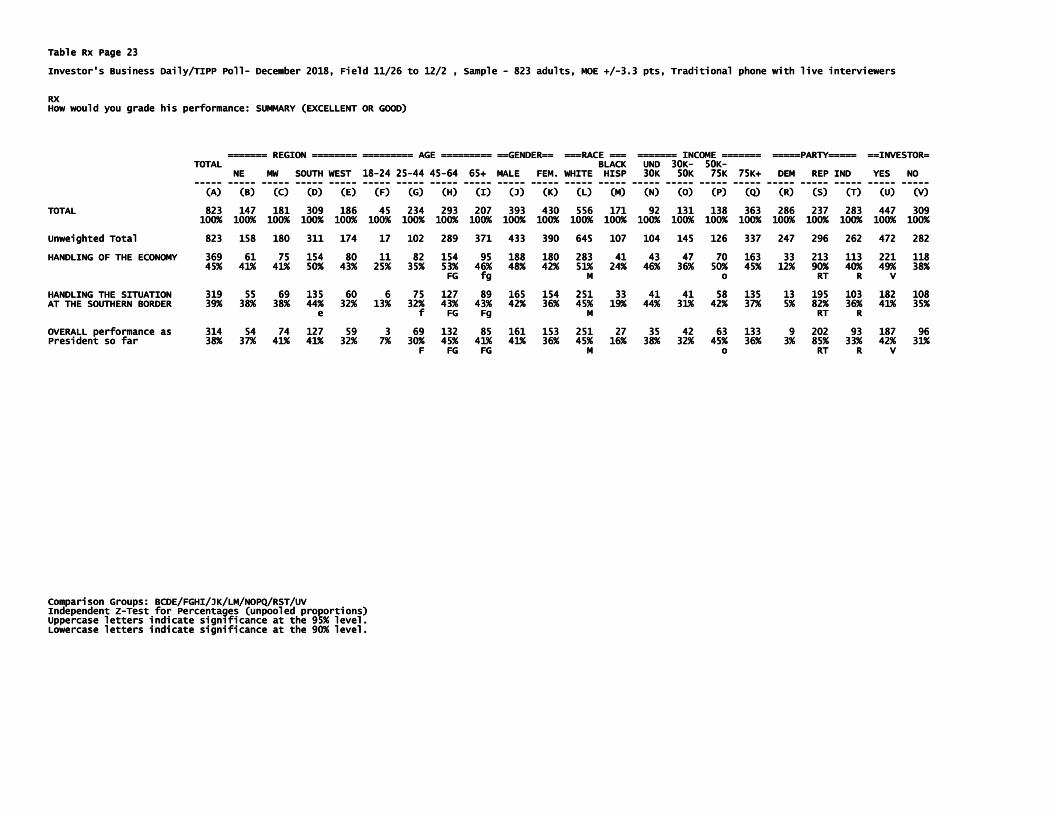
Table Rx Page 23Table Rx Page 23Table Rx Page 23Table Rx Page 23 Investor's Business Daily/TIPP PollInvestor's Business Daily/TIPP PollInvestor's Business Daily/TIPP PollInvestor's Business Daily/TIPP Poll---- December 2018, Field 11/26 to 12/2 , Sample December 2018, Field 11/26 to 12/2 , Sample December 2018, Field 11/26 to 12/2 , Sample December 2018, Field 11/26 to 12/2 , Sample ---- 823 adults, MOE +/823 adults, MOE +/823 adults, MOE +/823 adults, MOE +/----3.3 pts, Traditiona3.3 pts, Traditiona3.3 pts, Traditiona3.3 pts, Traditional phone with live interviewers l phone with live interviewers l phone with live interviewers l phone with live interviewers RXRXRXRX How would you grade his performance: SUMMARY (EXCELLENT OR GOOD)How would you grade his performance: SUMMARY (EXCELLENT OR GOOD)How would you grade his performance: SUMMARY (EXCELLENT OR GOOD)How would you grade his performance: SUMMARY (EXCELLENT OR GOOD) ======= REGION ======== ========= AGE ========= ==GENDER== ===RACE === ======= INCOME ======= =====PARTY===== ==IN======= REGION ======== ========= AGE ========= ==GENDER== ===RACE === ======= INCOME ======= =====PARTY===== ==IN======= REGION ======== ========= AGE ========= ==GENDER== ===RACE === ======= INCOME ======= =====PARTY===== ==IN======= REGION ======== ========= AGE ========= ==GENDER== ===RACE === ======= INCOME ======= =====PARTY===== ==INVESTOR=VESTOR=VESTOR=VESTOR= TOTAL BLACK UND 30KTOTAL BLACK UND 30KTOTAL BLACK UND 30KTOTAL BLACK UND 30K---- 50K50K50K50K---- NE MW SOUTH WEST 18NE MW SOUTH WEST 18NE MW SOUTH WEST 18NE MW SOUTH WEST 18----24 2524 2524 2524 25----44 4544 4544 4544 45----64 65+ MALE FEM64 65+ MALE FEM64 65+ MALE FEM64 65+ MALE FEM. WHITE HISP 30K 50K 75K 75K+ DEM REP IND YES NO . WHITE HISP 30K 50K 75K 75K+ DEM REP IND YES NO . WHITE HISP 30K 50K 75K 75K+ DEM REP IND YES NO . WHITE HISP 30K 50K 75K 75K+ DEM REP IND YES NO -------------------- -------------------- -------------------- -------------------- -------------------- -------------------- -------------------- -------------------- -------------------- -------------------- -------------------- -------------------- -------------------- -------------------- -------------------- -------------------- -------------------- -------------------- -------------------- -------------------- -------------------- -------------------- (A(A(A(A) (B) (C) (D) (E) (F) (G) (H) (I) (J) (K) (L) (M) (N) (O) (P) (Q) (R) (S) (T) (U) () (B) (C) (D) (E) (F) (G) (H) (I) (J) (K) (L) (M) (N) (O) (P) (Q) (R) (S) (T) (U) () (B) (C) (D) (E) (F) (G) (H) (I) (J) (K) (L) (M) (N) (O) (P) (Q) (R) (S) (T) (U) () (B) (C) (D) (E) (F) (G) (H) (I) (J) (K) (L) (M) (N) (O) (P) (Q) (R) (S) (T) (U) (V)V)V)V) TOTAL 823 147 181 309 186 45 234 293 207 393 430 556 171 92 131 138 3TOTAL 823 147 181 309 186 45 234 293 207 393 430 556 171 92 131 138 3TOTAL 823 147 181 309 186 45 234 293 207 393 430 556 171 92 131 138 3TOTAL 823 147 181 309 186 45 234 293 207 393 430 556 171 92 131 138 363636363 286 237 283 447 309286 237 283 447 309286 237 283 447 309286 237 283 447 309 100% 100% 100% 100% 100% 100% 100% 100% 100% 100% 100% 100% 100% 100% 100% 100% 100% 100% 100% 100% 100% 100% 100% 100% 100% 100% 100% 100% 100% 100% 100% 100% 100% 100% 100% 100% 100% 100% 100% 100% 100% 100% 100% 100% 100% 100% 100% 100% 100% 100% 100% 100% 100% 100% 100% 100% 100% 100% 100% 100% 100% 100% 100% 100% 100% 100% 100% 100% 100% 100% 100% 100% 100% 100% 100% 100% 100% 100% 100% 100% 100% 100% 100% 100% 100%100%100%100% Unweighted Total 823 158 180 311 174 17 10Unweighted Total 823 158 180 311 174 17 10Unweighted Total 823 158 180 311 174 17 10Unweighted Total 823 158 180 311 174 17 102 289 371 433 390 645 107 104 145 126 337 247 296 262 472 2822 289 371 433 390 645 107 104 145 126 337 247 296 262 472 2822 289 371 433 390 645 107 104 145 126 337 247 296 262 472 2822 289 371 433 390 645 107 104 145 126 337 247 296 262 472 282 HANDLING OF THE ECONOMY 369 61 75 154 80 11 82 154 95 188 180 283 41 43 47 70 1HANDLING OF THE ECONOMY 369 61 75 154 80 11 82 154 95 188 180 283 41 43 47 70 1HANDLING OF THE ECONOMY 369 61 75 154 80 11 82 154 95 188 180 283 41 43 47 70 1HANDLING OF THE ECONOMY 369 61 75 154 80 11 82 154 95 188 180 283 41 43 47 70 163 33 213 113 221 11863 33 213 113 221 11863 33 213 113 221 11863 33 213 113 221 118 45% 41% 41% 50% 43% 25% 35% 53% 46% 48% 42% 51% 24% 46% 36% 50% 45% 12% 90% 40% 49% 45% 41% 41% 50% 43% 25% 35% 53% 46% 48% 42% 51% 24% 46% 36% 50% 45% 12% 90% 40% 49% 45% 41% 41% 50% 43% 25% 35% 53% 46% 48% 42% 51% 24% 46% 36% 50% 45% 12% 90% 40% 49% 45% 41% 41% 50% 43% 25% 35% 53% 46% 48% 42% 51% 24% 46% 36% 50% 45% 12% 90% 40% 49% 38%38%38%38% FG fg M FG fg M FG fg M FG fg M o RT R V o RT R V o RT R V o RT R V HANDLING THE SITUATION 319 55 69 135 60 6 75 127 89 165 154 251 33 41 41 58 1HANDLING THE SITUATION 319 55 69 135 60 6 75 127 89 165 154 251 33 41 41 58 1HANDLING THE SITUATION 319 55 69 135 60 6 75 127 89 165 154 251 33 41 41 58 1HANDLING THE SITUATION 319 55 69 135 60 6 75 127 89 165 154 251 33 41 41 58 135 13 195 103 182 10835 13 195 103 182 10835 13 195 103 182 10835 13 195 103 182 108 AT THE SOUTHERN BORDER 39% 38% 38% 44% 32% 13% 32% 43% 43% 42% 36% 45% 19% 44% 31% 42% 3AT THE SOUTHERN BORDER 39% 38% 38% 44% 32% 13% 32% 43% 43% 42% 36% 45% 19% 44% 31% 42% 3AT THE SOUTHERN BORDER 39% 38% 38% 44% 32% 13% 32% 43% 43% 42% 36% 45% 19% 44% 31% 42% 3AT THE SOUTHERN BORDER 39% 38% 38% 44% 32% 13% 32% 43% 43% 42% 36% 45% 19% 44% 31% 42% 37% 5% 82% 36% 41% 35%7% 5% 82% 36% 41% 35%7% 5% 82% 36% 41% 35%7% 5% 82% 36% 41% 35% e f FG Fg M e f FG Fg M e f FG Fg M e f FG Fg M RT R RT R RT R RT R OVERALL performance as 314 54 74 127 59 3 69 132 85 161 153 251 27 35 42 63 1OVERALL performance as 314 54 74 127 59 3 69 132 85 161 153 251 27 35 42 63 1OVERALL performance as 314 54 74 127 59 3 69 132 85 161 153 251 27 35 42 63 1OVERALL performance as 314 54 74 127 59 3 69 132 85 161 153 251 27 35 42 63 133 9 202 93 187 9633 9 202 93 187 9633 9 202 93 187 9633 9 202 93 187 96 President so far 38% 37%President so far 38% 37%President so far 38% 37%President so far 38% 37% 41% 41% 32% 7% 30% 45% 41% 41% 36% 45% 16% 38% 32% 45% 36% 3% 85% 33% 42% 31%41% 41% 32% 7% 30% 45% 41% 41% 36% 45% 16% 38% 32% 45% 36% 3% 85% 33% 42% 31%41% 41% 32% 7% 30% 45% 41% 41% 36% 45% 16% 38% 32% 45% 36% 3% 85% 33% 42% 31%41% 41% 32% 7% 30% 45% 41% 41% 36% 45% 16% 38% 32% 45% 36% 3% 85% 33% 42% 31% F FG FG M o F FG FG M o F FG FG M o F FG FG M o RT R V RT R V RT R V RT R V Comparison Groups: BCDE/FGHI/JK/LM/NOPQ/RST/UVComparison Groups: BCDE/FGHI/JK/LM/NOPQ/RST/UVComparison Groups: BCDE/FGHI/JK/LM/NOPQ/RST/UVComparison Groups: BCDE/FGHI/JK/LM/NOPQ/RST/UV Independent ZIndependent ZIndependent ZIndependent Z----Test for Percentages (unpooled proportions)Test for Percentages (unpooled proportions)Test for Percentages (unpooled proportions)Test for Percentages (unpooled proportions) Uppercase letters indicate significance at the 95% level.Uppercase letters indicate significance at the 95% level.Uppercase letters indicate significance at the 95% level.Uppercase letters indicate significance at the 95% level. Lowercase letters indicate significance at the 90% level.Lowercase letters indicate significance at the 90% level.Lowercase letters indicate significance at the 90% level.Lowercase letters indicate significance at the 90% level.

Table Rx Page 24Table Rx Page 24Table Rx Page 24Table Rx Page 24 Investor's Business Daily/TIPP PollInvestor's Business Daily/TIPP PollInvestor's Business Daily/TIPP PollInvestor's Business Daily/TIPP Poll---- December 2018, Field 11/26 to 12/2 , Sample December 2018, Field 11/26 to 12/2 , Sample December 2018, Field 11/26 to 12/2 , Sample December 2018, Field 11/26 to 12/2 , Sample ---- 823 adults, MOE +/823 adults, MOE +/823 adults, MOE +/823 adults, MOE +/----3.3 pts, Traditional phone with live interviewers 3.3 pts, Traditional phone with live interviewers 3.3 pts, Traditional phone with live interviewers 3.3 pts, Traditional phone with live interviewers RXRXRXRX How would you grade hHow would you grade hHow would you grade hHow would you grade his performance: SUMMARY (EXCELLENT OR GOOD)is performance: SUMMARY (EXCELLENT OR GOOD)is performance: SUMMARY (EXCELLENT OR GOOD)is performance: SUMMARY (EXCELLENT OR GOOD) ====AREA TYPE==== ===WHITE=== ==BLK/HISP= ==MAR.STAT= ====EDUCATION==== ====IDEOLOOGY========AREA TYPE==== ===WHITE=== ==BLK/HISP= ==MAR.STAT= ====EDUCATION==== ====IDEOLOOGY========AREA TYPE==== ===WHITE=== ==BLK/HISP= ==MAR.STAT= ====EDUCATION==== ====IDEOLOOGY========AREA TYPE==== ===WHITE=== ==BLK/HISP= ==MAR.STAT= ====EDUCATION==== ====IDEOLOOGY==== SUBSUBSUBSUB---- WHITE SINGL MARR WHITE SINGL MARR WHITE SINGL MARR WHITE SINGL MARR HIGH SOME HIGH SOME HIGH SOME HIGH SOME TOTAL URBAN URBAN RURAL MEN WOMEN BLACK HIS. WOMEN WOM SCHL. COLL. COLL+ CONS. MOD. LIB.TOTAL URBAN URBAN RURAL MEN WOMEN BLACK HIS. WOMEN WOM SCHL. COLL. COLL+ CONS. MOD. LIB.TOTAL URBAN URBAN RURAL MEN WOMEN BLACK HIS. WOMEN WOM SCHL. COLL. COLL+ CONS. MOD. LIB.TOTAL URBAN URBAN RURAL MEN WOMEN BLACK HIS. WOMEN WOM SCHL. COLL. COLL+ CONS. MOD. LIB. -------------------- -------------------- -------------------- -------------------- -------------------- -------------------- -------------------- -------------------- -------------------- -------------------- -------------------- -------------------- -------------------- -------------------- -------------------- -------------------- (A) (B) (C) (D) (E) (F) (G) (H) (I) (J) (K) (L) (M) (N) (O) (P)(A) (B) (C) (D) (E) (F) (G) (H) (I) (J) (K) (L) (M) (N) (O) (P)(A) (B) (C) (D) (E) (F) (G) (H) (I) (J) (K) (L) (M) (N) (O) (P)(A) (B) (C) (D) (E) (F) (G) (H) (I) (J) (K) (L) (M) (N) (O) (P) TOTAL 823 192 400 211 267 290 118 55 182 241 157 216 430 328TOTAL 823 192 400 211 267 290 118 55 182 241 157 216 430 328TOTAL 823 192 400 211 267 290 118 55 182 241 157 216 430 328TOTAL 823 192 400 211 267 290 118 55 182 241 157 216 430 328 247 214247 214247 214247 214 100% 100% 100% 100% 100% 100% 100% 100% 100% 100% 100% 100% 100% 100% 100% 100%100% 100% 100% 100% 100% 100% 100% 100% 100% 100% 100% 100% 100% 100% 100% 100%100% 100% 100% 100% 100% 100% 100% 100% 100% 100% 100% 100% 100% 100% 100% 100%100% 100% 100% 100% 100% 100% 100% 100% 100% 100% 100% 100% 100% 100% 100% 100% Unweighted Total 823 172 385 244 340 305 73 35 178 205 161 222 417 395 233 162Unweighted Total 823 172 385 244 340 305 73 35 178 205 161 222 417 395 233 162Unweighted Total 823 172 385 244 340 305 73 35 178 205 161 222 417 395 233 162Unweighted Total 823 172 385 244 340 305 73 35 178 205 161 222 417 395 233 162 HANDLING OF THE ECONOMY 369 61 163 136 145 139 24 18 68 108 78 110 171 257 84 17HANDLING OF THE ECONOMY 369 61 163 136 145 139 24 18 68 108 78 110 171 257 84 17HANDLING OF THE ECONOMY 369 61 163 136 145 139 24 18 68 108 78 110 171 257 84 17HANDLING OF THE ECONOMY 369 61 163 136 145 139 24 18 68 108 78 110 171 257 84 17 45% 32% 41% 64% 54% 48% 21% 32% 37% 45% 50% 51% 40% 79% 34% 8%45% 32% 41% 64% 54% 48% 21% 32% 37% 45% 50% 51% 40% 79% 34% 8%45% 32% 41% 64% 54% 48% 21% 32% 37% 45% 50% 51% 40% 79% 34% 8%45% 32% 41% 64% 54% 48% 21% 32% 37% 45% 50% 51% 40% 79% 34% 8% BC m M OP P BC m M OP P BC m M OP P BC m M OP P HANDLING THE SITUATIONHANDLING THE SITUATIONHANDLING THE SITUATIONHANDLING THE SITUATION 319 61 132 117 131 120 16 18 60 91 76 91 142 231 71 8319 61 132 117 131 120 16 18 60 91 76 91 142 231 71 8319 61 132 117 131 120 16 18 60 91 76 91 142 231 71 8319 61 132 117 131 120 16 18 60 91 76 91 142 231 71 8 AT THE SOUTHERN BORDER 39% 32% 33% 55% 49% 42% 14% 34% 33% 38% 49% 42% 33% 71% 29% 4%AT THE SOUTHERN BORDER 39% 32% 33% 55% 49% 42% 14% 34% 33% 38% 49% 42% 33% 71% 29% 4%AT THE SOUTHERN BORDER 39% 32% 33% 55% 49% 42% 14% 34% 33% 38% 49% 42% 33% 71% 29% 4%AT THE SOUTHERN BORDER 39% 32% 33% 55% 49% 42% 14% 34% 33% 38% 49% 42% 33% 71% 29% 4% BC G M m OP P BC G M m OP P BC G M m OP P BC G M m OP P OVERALL performance as 314 56 132 118 130 121 13 15 52 97 68 96 140 241 61 4OVERALL performance as 314 56 132 118 130 121 13 15 52 97 68 96 140 241 61 4OVERALL performance as 314 56 132 118 130 121 13 15 52 97 68 96 140 241 61 4OVERALL performance as 314 56 132 118 130 121 13 15 52 97 68 96 140 241 61 4 President so far 38% 29% 33% President so far 38% 29% 33% President so far 38% 29% 33% President so far 38% 29% 33% 56% 49% 42% 11% 27% 28% 40% 44% 45% 32% 74% 25% 2%56% 49% 42% 11% 27% 28% 40% 44% 45% 32% 74% 25% 2%56% 49% 42% 11% 27% 28% 40% 44% 45% 32% 74% 25% 2%56% 49% 42% 11% 27% 28% 40% 44% 45% 32% 74% 25% 2% BC g i m M OP P BC g i m M OP P BC g i m M OP P BC g i m M OP P CoCoCoComparison Groups: BCD/EF/GH/IJ/KLM/NOPmparison Groups: BCD/EF/GH/IJ/KLM/NOPmparison Groups: BCD/EF/GH/IJ/KLM/NOPmparison Groups: BCD/EF/GH/IJ/KLM/NOP Independent ZIndependent ZIndependent ZIndependent Z----Test for Percentages (unpooled proportions)Test for Percentages (unpooled proportions)Test for Percentages (unpooled proportions)Test for Percentages (unpooled proportions) Uppercase letters indicate significance at the 95% level.Uppercase letters indicate significance at the 95% level.Uppercase letters indicate significance at the 95% level.Uppercase letters indicate significance at the 95% level. Lowercase letters indicate significance at the 90% level.Lowercase letters indicate significance at the 90% level.Lowercase letters indicate significance at the 90% level.Lowercase letters indicate significance at the 90% level.

Table R2 Page 25Table R2 Page 25Table R2 Page 25Table R2 Page 25 Investor's Business DailyInvestor's Business DailyInvestor's Business DailyInvestor's Business Daily/TIPP Poll/TIPP Poll/TIPP Poll/TIPP Poll---- December 2018, Field 11/26 to 12/2 , Sample December 2018, Field 11/26 to 12/2 , Sample December 2018, Field 11/26 to 12/2 , Sample December 2018, Field 11/26 to 12/2 , Sample ---- 823 adults, MOE +/823 adults, MOE +/823 adults, MOE +/823 adults, MOE +/----3.3 pts, Traditional phone with live interviewers 3.3 pts, Traditional phone with live interviewers 3.3 pts, Traditional phone with live interviewers 3.3 pts, Traditional phone with live interviewers R2R2R2R2 How would you grade his performance: HANDLING OF THE ECONOMYHow would you grade his performance: HANDLING OF THE ECONOMYHow would you grade his performance: HANDLING OF THE ECONOMYHow would you grade his performance: HANDLING OF THE ECONOMY ======= REGION ======== ========= AGE ========= ==GENDER== ===RACE === ======= INCOME ======= =====PARTY===== ==INVESTOR======== REGION ======== ========= AGE ========= ==GENDER== ===RACE === ======= INCOME ======= =====PARTY===== ==INVESTOR======== REGION ======== ========= AGE ========= ==GENDER== ===RACE === ======= INCOME ======= =====PARTY===== ==INVESTOR======== REGION ======== ========= AGE ========= ==GENDER== ===RACE === ======= INCOME ======= =====PARTY===== ==INVESTOR= TOTAL TOTAL TOTAL TOTAL BLACK UND 30KBLACK UND 30KBLACK UND 30KBLACK UND 30K---- 50K50K50K50K---- NE MW SOUTH WEST 18NE MW SOUTH WEST 18NE MW SOUTH WEST 18NE MW SOUTH WEST 18----24 2524 2524 2524 25----44 4544 4544 4544 45----64 65+ MALE FEM. WHITE HISP 30K 50K 75K 75K+ DEM REP IND YES NO 64 65+ MALE FEM. WHITE HISP 30K 50K 75K 75K+ DEM REP IND YES NO 64 65+ MALE FEM. WHITE HISP 30K 50K 75K 75K+ DEM REP IND YES NO 64 65+ MALE FEM. WHITE HISP 30K 50K 75K 75K+ DEM REP IND YES NO -------------------- -------------------- -------------------- -------------------- -------------------- -------------------- -------------------- -------------------- -------------------- -------------------- -------------------- -------------------- -------------------- -------------------- -------------------- -------------------- -------------------- -------------------- -------------------- -------------------- -------------------- -------------------- (A) (B) (C) (D) (E) (F) (G) (H) (I) (J) (K) (L) (M) (N) (O) (P) (Q) (R) (A) (B) (C) (D) (E) (F) (G) (H) (I) (J) (K) (L) (M) (N) (O) (P) (Q) (R) (A) (B) (C) (D) (E) (F) (G) (H) (I) (J) (K) (L) (M) (N) (O) (P) (Q) (R) (A) (B) (C) (D) (E) (F) (G) (H) (I) (J) (K) (L) (M) (N) (O) (P) (Q) (R) (S) (T) (U) (V)(S) (T) (U) (V)(S) (T) (U) (V)(S) (T) (U) (V) TOTAL 823 147 181 309 186 45 234 293 207 393 430 556 171 92 131 138 3TOTAL 823 147 181 309 186 45 234 293 207 393 430 556 171 92 131 138 3TOTAL 823 147 181 309 186 45 234 293 207 393 430 556 171 92 131 138 3TOTAL 823 147 181 309 186 45 234 293 207 393 430 556 171 92 131 138 363 286 237 283 447 30963 286 237 283 447 30963 286 237 283 447 30963 286 237 283 447 309 100% 100% 100% 100% 100% 100% 100% 100% 100% 100% 100% 100% 100% 100% 100% 100% 100% 100% 100% 100% 100% 100% 100% 100% 100% 100% 100% 100% 100% 100% 100% 100% 100% 100% 100% 100% 100% 100% 100% 100% 100% 100% 100% 100% 100% 100%100% 100% 100% 100% 100% 100% 100% 100% 100% 100% 100% 100% 100% 100%100% 100% 100% 100% 100% 100% 100% 100% 100% 100% 100% 100% 100% 100%100% 100% 100% 100% 100% 100% 100% 100% 100% 100% 100% 100% 100% 100% Unweighted Total 823 158 180 311 174 17 102 289 371 433 390 645 107 104 145 126 3Unweighted Total 823 158 180 311 174 17 102 289 371 433 390 645 107 104 145 126 3Unweighted Total 823 158 180 311 174 17 102 289 371 433 390 645 107 104 145 126 3Unweighted Total 823 158 180 311 174 17 102 289 371 433 390 645 107 104 145 126 337 247 296 262 472 28237 247 296 262 472 28237 247 296 262 472 28237 247 296 262 472 282 A=Excellent A=Excellent A=Excellent A=Excellent 235 37 53 97 48 5 55 91 63 118 116 201 11 28 30 39 107 6 159 65 141 235 37 53 97 48 5 55 91 63 118 116 201 11 28 30 39 107 6 159 65 141 235 37 53 97 48 5 55 91 63 118 116 201 11 28 30 39 107 6 159 65 141 235 37 53 97 48 5 55 91 63 118 116 201 11 28 30 39 107 6 159 65 141 71717171 29% 25% 29% 31% 26% 11% 23% 31% 30% 30% 27% 36% 6% 31% 29% 25% 29% 31% 26% 11% 23% 31% 30% 30% 27% 36% 6% 31% 29% 25% 29% 31% 26% 11% 23% 31% 30% 30% 27% 36% 6% 31% 29% 25% 29% 31% 26% 11% 23% 31% 30% 30% 27% 36% 6% 31% 23% 28% 29% 2% 67% 23% 32% 23%23% 28% 29% 2% 67% 23% 32% 23%23% 28% 29% 2% 67% 23% 32% 23%23% 28% 29% 2% 67% 23% 32% 23% F F M RT R V F F M RT R V F F M RT R V F F M RT R V B=Good 134 23 22 57 B=Good 134 23 22 57 B=Good 134 23 22 57 B=Good 134 23 22 57 32 6 27 64 32 70 64 83 30 14 17 31 56 27 54 48 80 4732 6 27 64 32 70 64 83 30 14 17 31 56 27 54 48 80 4732 6 27 64 32 70 64 83 30 14 17 31 56 27 54 48 80 4732 6 27 64 32 70 64 83 30 14 17 31 56 27 54 48 80 47 16% 16% 12% 18% 17% 14% 12% 22% 15% 18% 15% 15% 17% 16% 13% 22% 16% 10% 23% 17% 16% 16% 12% 18% 17% 14% 12% 22% 15% 18% 15% 15% 17% 16% 13% 22% 16% 10% 23% 17% 16% 16% 12% 18% 17% 14% 12% 22% 15% 18% 15% 15% 17% 16% 13% 22% 16% 10% 23% 17% 16% 16% 12% 18% 17% 14% 12% 22% 15% 18% 15% 15% 17% 16% 13% 22% 16% 10% 23% 17% 18% 15%18% 15%18% 15%18% 15% Gi R R Gi R R Gi R R Gi R R C=Average 160 32 31 58 39 16 65 41 33 84 C=Average 160 32 31 58 39 16 65 41 33 84 C=Average 160 32 31 58 39 16 65 41 33 84 C=Average 160 32 31 58 39 16 65 41 33 84 76 90 49 21 38 30 61 76 16 66 68 8776 90 49 21 38 30 61 76 16 66 68 8776 90 49 21 38 30 61 76 16 66 68 8776 90 49 21 38 30 61 76 16 66 68 87 19% 22% 17% 19% 21% 35% 28% 14% 16% 21% 18% 16% 28% 23% 29% 22% 17% 26% 7% 23% 15% 19% 22% 17% 19% 21% 35% 28% 14% 16% 21% 18% 16% 28% 23% 29% 22% 17% 26% 7% 23% 15% 19% 22% 17% 19% 21% 35% 28% 14% 16% 21% 18% 16% 28% 23% 29% 22% 17% 26% 7% 23% 15% 19% 22% 17% 19% 21% 35% 28% 14% 16% 21% 18% 16% 28% 23% 29% 22% 17% 26% 7% 23% 15% 28%28%28%28% h HI L Q S S Uh HI L Q S S Uh HI L Q S S Uh HI L Q S S U D=Poor 116 19 30 40 28 10 26 41 33 48 68 68 35 7 15 8 D=Poor 116 19 30 40 28 10 26 41 33 48 68 68 35 7 15 8 D=Poor 116 19 30 40 28 10 26 41 33 48 68 68 35 7 15 8 D=Poor 116 19 30 40 28 10 26 41 33 48 68 68 35 7 15 8 69 62 6 48 77 2669 62 6 48 77 2669 62 6 48 77 2669 62 6 48 77 26 14% 13% 16% 13% 15% 22% 11% 14% 16% 12% 16% 12% 20% 8% 12% 6% 19% 22% 3% 17% 17% 14% 13% 16% 13% 15% 22% 11% 14% 16% 12% 16% 12% 20% 8% 12% 6% 19% 22% 3% 17% 17% 14% 13% 16% 13% 15% 22% 11% 14% 16% 12% 16% 12% 20% 8% 12% 6% 19% 22% 3% 17% 17% 14% 13% 16% 13% 15% 22% 11% 14% 16% 12% 16% 12% 20% 8% 12% 6% 19% 22% 3% 17% 17% 8%8%8%8% l NoP S S V l NoP S S V l NoP S S V l NoP S S V F=Unacceptable 171 34 45 54 38 8 59 56 42 69 101 113 43 19 30 31 F=Unacceptable 171 34 45 54 38 8 59 56 42 69 101 113 43 19 30 31 F=Unacceptable 171 34 45 54 38 8 59 56 42 69 101 113 43 19 30 31 F=Unacceptable 171 34 45 54 38 8 59 56 42 69 101 113 43 19 30 31 69 112 0 54 80 7569 112 0 54 80 7569 112 0 54 80 7569 112 0 54 80 75 21% 23% 25% 18% 20% 18% 25% 19% 20% 18% 24% 20% 25% 20% 23% 22% 19% 39% *% 19% 18% 21% 23% 25% 18% 20% 18% 25% 19% 20% 18% 24% 20% 25% 20% 23% 22% 19% 39% *% 19% 18% 21% 23% 25% 18% 20% 18% 25% 19% 20% 18% 24% 20% 25% 20% 23% 22% 19% 39% *% 19% 18% 21% 23% 25% 18% 20% 18% 25% 19% 20% 18% 24% 20% 25% 20% 23% 22% 19% 39% *% 19% 18% 24%24%24%24% j j j j ST S uST S uST S uST S u Not sure 7 2 Not sure 7 2 Not sure 7 2 Not sure 7 2 ---- 3 2 3 2 3 2 3 2 ---- 3 3 3 3 ---- 4 3 4 1 5 2 0 4 3 4 1 5 2 0 4 3 4 1 5 2 0 4 3 4 1 5 2 0 ---- 1 3 2 2 2 31 3 2 2 2 31 3 2 2 2 31 3 2 2 2 3 1% 1%1% 1%1% 1%1% 1% 1% 1% 1% 2% 1% 1% *% 3% 2% *% *% 1% 1% 1% *% 1%1% 1% 1% 2% 1% 1% *% 3% 2% *% *% 1% 1% 1% *% 1%1% 1% 1% 2% 1% 1% *% 3% 2% *% *% 1% 1% 1% *% 1%1% 1% 1% 2% 1% 1% *% 3% 2% *% *% 1% 1% 1% *% 1% GOOD GOOD GOOD GOOD ---- A OR B 369 61 75 154 80 11 82 154 95 188 180 283 41 43 47 70 163 3A OR B 369 61 75 154 80 11 82 154 95 188 180 283 41 43 47 70 163 3A OR B 369 61 75 154 80 11 82 154 95 188 180 283 41 43 47 70 163 3A OR B 369 61 75 154 80 11 82 154 95 188 180 283 41 43 47 70 163 33 3 3 3 213 113 221 118213 113 221 118213 113 221 118213 113 221 118 45% 41% 41% 50% 43% 25% 35% 53% 46% 48% 42% 51% 24% 46% 36% 50% 45% 12% 90% 40% 49% 45% 41% 41% 50% 43% 25% 35% 53% 46% 48% 42% 51% 24% 46% 36% 50% 45% 12% 90% 40% 49% 45% 41% 41% 50% 43% 25% 35% 53% 46% 48% 42% 51% 24% 46% 36% 50% 45% 12% 90% 40% 49% 45% 41% 41% 50% 43% 25% 35% 53% 46% 48% 42% 51% 24% 46% 36% 50% 45% 12% 90% 40% 49% 38%38%38%38% FG FG FG FG fg M o RT R V fg M o RT R V fg M o RT R V fg M o RT R V POOR POOR POOR POOR ---- D OR F 287 52 75 94 65 18 85 97 75 118 169 182 77 26 45 38 138 17D OR F 287 52 75 94 65 18 85 97 75 118 169 182 77 26 45 38 138 17D OR F 287 52 75 94 65 18 85 97 75 118 169 182 77 26 45 38 138 17D OR F 287 52 75 94 65 18 85 97 75 118 169 182 77 26 45 38 138 174 6 102 156 1014 6 102 156 1014 6 102 156 1014 6 102 156 101 35% 36% 41% 31% 35% 40% 36% 33% 36% 30% 39% 33% 45% 28% 34% 28% 38% 61% 3% 36% 35% 35% 36% 41% 31% 35% 40% 36% 33% 36% 30% 39% 33% 45% 28% 34% 28% 38% 61% 3% 36% 35% 35% 36% 41% 31% 35% 40% 36% 33% 36% 30% 39% 33% 45% 28% 34% 28% 38% 61% 3% 36% 35% 35% 36% 41% 31% 35% 40% 36% 33% 36% 30% 39% 33% 45% 28% 34% 28% 38% 61% 3% 36% 35% 33%33%33%33% D J L D J L D J L D J L p ST S p ST S p ST S p ST S Comparison Groups: BCDE/FGHI/JK/LM/NOPQ/RST/UVComparison Groups: BCDE/FGHI/JK/LM/NOPQ/RST/UVComparison Groups: BCDE/FGHI/JK/LM/NOPQ/RST/UVComparison Groups: BCDE/FGHI/JK/LM/NOPQ/RST/UV Independent ZIndependent ZIndependent ZIndependent Z----Test for Percentages (unpooled proportions)Test for Percentages (unpooled proportions)Test for Percentages (unpooled proportions)Test for Percentages (unpooled proportions) Uppercase letters indicate significance at the 95% level.Uppercase letters indicate significance at the 95% level.Uppercase letters indicate significance at the 95% level.Uppercase letters indicate significance at the 95% level. Lowercase letters indicate significanceLowercase letters indicate significanceLowercase letters indicate significanceLowercase letters indicate significance at the 90% level.at the 90% level.at the 90% level.at the 90% level.

Table R2 Page 26Table R2 Page 26Table R2 Page 26Table R2 Page 26 (Continued)(Continued)(Continued)(Continued) Investor's Business Daily/TIPP PollInvestor's Business Daily/TIPP PollInvestor's Business Daily/TIPP PollInvestor's Business Daily/TIPP Poll---- December 2018, Field 11/26 to 12/2 , Sample December 2018, Field 11/26 to 12/2 , Sample December 2018, Field 11/26 to 12/2 , Sample December 2018, Field 11/26 to 12/2 , Sample ---- 823 adults, MOE +/823 adults, MOE +/823 adults, MOE +/823 adults, MOE +/----3.3 pts, Traditional phone with live interviewers 3.3 pts, Traditional phone with live interviewers 3.3 pts, Traditional phone with live interviewers 3.3 pts, Traditional phone with live interviewers R2R2R2R2 How would you grade his performance: HANDLING OF THE ECONOMYHow would you grade his performance: HANDLING OF THE ECONOMYHow would you grade his performance: HANDLING OF THE ECONOMYHow would you grade his performance: HANDLING OF THE ECONOMY ======= REGION ======== ========= AGE ========= ==GENDER== ===RACE === ======= INCOME ======= =====PARTY===== ==INVESTOR======== REGION ======== ========= AGE ========= ==GENDER== ===RACE === ======= INCOME ======= =====PARTY===== ==INVESTOR======== REGION ======== ========= AGE ========= ==GENDER== ===RACE === ======= INCOME ======= =====PARTY===== ==INVESTOR======== REGION ======== ========= AGE ========= ==GENDER== ===RACE === ======= INCOME ======= =====PARTY===== ==INVESTOR= TOTAL TOTAL TOTAL TOTAL BLACK UND 30KBLACK UND 30KBLACK UND 30KBLACK UND 30K---- 50K50K50K50K---- NE MW SOUTH WEST 18NE MW SOUTH WEST 18NE MW SOUTH WEST 18NE MW SOUTH WEST 18----24 2524 2524 2524 25----44 4544 4544 4544 45----64 65+ MALE FEM. WHITE HISP 30K 50K 75K 75K+ 64 65+ MALE FEM. WHITE HISP 30K 50K 75K 75K+ 64 65+ MALE FEM. WHITE HISP 30K 50K 75K 75K+ 64 65+ MALE FEM. WHITE HISP 30K 50K 75K 75K+ DEM REP IND YES NO DEM REP IND YES NO DEM REP IND YES NO DEM REP IND YES NO -------------------- -------------------- -------------------- -------------------- -------------------- -------------------- -------------------- -------------------- -------------------- -------------------- -------------------- -------------------- -------------------- -------------------- -------------------- -------------------- -------------------- -------------------- -------------------- -------------------- -------------------- -------------------- (A) (B) (C) (D) (E) (F) (G) (A) (B) (C) (D) (E) (F) (G) (A) (B) (C) (D) (E) (F) (G) (A) (B) (C) (D) (E) (F) (G) (H) (I) (J) (K) (L) (M) (N) (O) (P) (Q) (R) (S) (T) (U) (V)(H) (I) (J) (K) (L) (M) (N) (O) (P) (Q) (R) (S) (T) (U) (V)(H) (I) (J) (K) (L) (M) (N) (O) (P) (Q) (R) (S) (T) (U) (V)(H) (I) (J) (K) (L) (M) (N) (O) (P) (Q) (R) (S) (T) (U) (V) Mean 2.18 2.08 2.04 2.33 2.13 1.78 1.97 2.31 2.20 2.31 2.06 2.34 1.59 2.29 2.02 2.28 2.Mean 2.18 2.08 2.04 2.33 2.13 1.78 1.97 2.31 2.20 2.31 2.06 2.34 1.59 2.29 2.02 2.28 2.Mean 2.18 2.08 2.04 2.33 2.13 1.78 1.97 2.31 2.20 2.31 2.06 2.34 1.59 2.29 2.02 2.28 2.Mean 2.18 2.08 2.04 2.33 2.13 1.78 1.97 2.31 2.20 2.31 2.06 2.34 1.59 2.29 2.02 2.28 2.18 1.13 3.55 2.08 2.28 2.0418 1.13 3.55 2.08 2.28 2.0418 1.13 3.55 2.08 2.28 2.0418 1.13 3.55 2.08 2.28 2.04 Comparison Groups: BCDE/FGHI/JK/LM/NOPQ/RST/UVComparison Groups: BCDE/FGHI/JK/LM/NOPQ/RST/UVComparison Groups: BCDE/FGHI/JK/LM/NOPQ/RST/UVComparison Groups: BCDE/FGHI/JK/LM/NOPQ/RST/UV Independent ZIndependent ZIndependent ZIndependent Z----Test for Percentages (unpooled proportions)Test for Percentages (unpooled proportions)Test for Percentages (unpooled proportions)Test for Percentages (unpooled proportions) Uppercase letters indicate significance at the 95% level.Uppercase letters indicate significance at the 95% level.Uppercase letters indicate significance at the 95% level.Uppercase letters indicate significance at the 95% level. Lowercase letters indicate significance at the 90% level.Lowercase letters indicate significance at the 90% level.Lowercase letters indicate significance at the 90% level.Lowercase letters indicate significance at the 90% level.

Table R2 Page 27Table R2 Page 27Table R2 Page 27Table R2 Page 27 Investor's Business Daily/TIPP PollInvestor's Business Daily/TIPP PollInvestor's Business Daily/TIPP PollInvestor's Business Daily/TIPP Poll---- December 2018, Field 11/26 to 12/2 , Sample December 2018, Field 11/26 to 12/2 , Sample December 2018, Field 11/26 to 12/2 , Sample December 2018, Field 11/26 to 12/2 , Sample ---- 823 adults, MOE +/823 adults, MOE +/823 adults, MOE +/823 adults, MOE +/----3.3 pts, Traditional phone with live interviewers 3.3 pts, Traditional phone with live interviewers 3.3 pts, Traditional phone with live interviewers 3.3 pts, Traditional phone with live interviewers R2R2R2R2 How would you grade his performance: HANDLING OF THE ECONOMYHow would you grade his performance: HANDLING OF THE ECONOMYHow would you grade his performance: HANDLING OF THE ECONOMYHow would you grade his performance: HANDLING OF THE ECONOMY ====AREA TYPE==== ===WHITE=== ==BLK/HISP= ==MAR.STAT= ====EDUCATION==== ====IDEOLOOGY========AREA TYPE==== ===WHITE=== ==BLK/HISP= ==MAR.STAT= ====EDUCATION==== ====IDEOLOOGY========AREA TYPE==== ===WHITE=== ==BLK/HISP= ==MAR.STAT= ====EDUCATION==== ====IDEOLOOGY========AREA TYPE==== ===WHITE=== ==BLK/HISP= ==MAR.STAT= ====EDUCATION==== ====IDEOLOOGY==== SUBSUBSUBSUB---- WHITE SINGL MARR HIGH SOME WHITE SINGL MARR HIGH SOME WHITE SINGL MARR HIGH SOME WHITE SINGL MARR HIGH SOME TOTAL URBAN URBAN RURAL MEN WOMEN BLACK HIS. WOMEN WOM SCHL. COLL. COLL+ CONS. MOD. LIB.TOTAL URBAN URBAN RURAL MEN WOMEN BLACK HIS. WOMEN WOM SCHL. COLL. COLL+ CONS. MOD. LIB.TOTAL URBAN URBAN RURAL MEN WOMEN BLACK HIS. WOMEN WOM SCHL. COLL. COLL+ CONS. MOD. LIB.TOTAL URBAN URBAN RURAL MEN WOMEN BLACK HIS. WOMEN WOM SCHL. COLL. COLL+ CONS. MOD. LIB. -------------------- -------------------- -------------------- -------------------- -------------------- -------------------- -------------------- -------------------- -------------------- -------------------- -------------------- -------------------- -------------------- -------------------- -------------------- -------------------- (A) (B) (A) (B) (A) (B) (A) (B) (C) (D) (E) (F) (G) (H) (I) (J) (K) (L) (M) (N) (O) (P)(C) (D) (E) (F) (G) (H) (I) (J) (K) (L) (M) (N) (O) (P)(C) (D) (E) (F) (G) (H) (I) (J) (K) (L) (M) (N) (O) (P)(C) (D) (E) (F) (G) (H) (I) (J) (K) (L) (M) (N) (O) (P) TOTAL 823 192 400 211 267 290 118 55 182 241 157 216 430 328 247 214TOTAL 823 192 400 211 267 290 118 55 182 241 157 216 430 328 247 214TOTAL 823 192 400 211 267 290 118 55 182 241 157 216 430 328 247 214TOTAL 823 192 400 211 267 290 118 55 182 241 157 216 430 328 247 214 100% 100% 100% 100%100% 100% 100% 100%100% 100% 100% 100%100% 100% 100% 100% 100% 100% 100% 100% 100% 100% 100% 100% 100% 100% 100% 100%100% 100% 100% 100% 100% 100% 100% 100% 100% 100% 100% 100%100% 100% 100% 100% 100% 100% 100% 100% 100% 100% 100% 100%100% 100% 100% 100% 100% 100% 100% 100% 100% 100% 100% 100% Unweighted Total 823 172 385 244 340 305 73 35 178 205 161 222 417 395 233 162Unweighted Total 823 172 385 244 340 305 73 35 178 205 161 222 417 395 233 162Unweighted Total 823 172 385 244 340 305 73 35 178 205 161 222 417 395 233 162Unweighted Total 823 172 385 244 340 305 73 35 178 205 161 222 417 395 233 162 A=Excellent 235 39 89 99 102 A=Excellent 235 39 89 99 102 A=Excellent 235 39 89 99 102 A=Excellent 235 39 89 99 102 99 6 6 41 72 51 69 107 190 32 499 6 6 41 72 51 69 107 190 32 499 6 6 41 72 51 69 107 190 32 499 6 6 41 72 51 69 107 190 32 4 29% 20% 22% 47% 38% 34% 5% 11% 22% 30% 32% 32% 25% 58% 13% 2%29% 20% 22% 47% 38% 34% 5% 11% 22% 30% 32% 32% 25% 58% 13% 2%29% 20% 22% 47% 38% 34% 5% 11% 22% 30% 32% 32% 25% 58% 13% 2%29% 20% 22% 47% 38% 34% 5% 11% 22% 30% 32% 32% 25% 58% 13% 2% BC BC BC BC OP P OP P OP P OP P B=Good 134 22 74 37 43 40 18 12 27 36 27 41 64 68 52 12B=Good 134 22 74 37 43 40 18 12 27 36 27 41 64 68 52 12B=Good 134 22 74 37 43 40 18 12 27 36 27 41 64 68 52 12B=Good 134 22 74 37 43 40 18 12 27 36 27 41 64 68 52 12 16% 11% 18% 18% 16% 14% 15% 22% 15% 15% 17% 19% 15% 21% 21% 6%16% 11% 18% 18% 16% 14% 15% 22% 15% 15% 17% 19% 15% 21% 21% 6%16% 11% 18% 18% 16% 14% 15% 22% 15% 15% 17% 19% 15% 21% 21% 6%16% 11% 18% 18% 16% 14% 15% 22% 15% 15% 17% 19% 15% 21% 21% 6% b P P b P P b P P b P P C=Average C=Average C=Average C=Average 160 53 81 21 50 40 31 17 35 41 39 39 80 39 56 55160 53 81 21 50 40 31 17 35 41 39 39 80 39 56 55160 53 81 21 50 40 31 17 35 41 39 39 80 39 56 55160 53 81 21 50 40 31 17 35 41 39 39 80 39 56 55 19% 28% 20% 10% 19% 14% 26% 32% 19% 17% 25% 18% 19% 12% 23% 26%19% 28% 20% 10% 19% 14% 26% 32% 19% 17% 25% 18% 19% 12% 23% 26%19% 28% 20% 10% 19% 14% 26% 32% 19% 17% 25% 18% 19% 12% 23% 26%19% 28% 20% 10% 19% 14% 26% 32% 19% 17% 25% 18% 19% 12% 23% 26% cD D N NcD D N NcD D N NcD D N N D=Poor 116 32 59 22 26 42 23 12 30 36 12 26 75 10 61 42D=Poor 116 32 59 22 26 42 23 12 30 36 12 26 75 10 61 42D=Poor 116 32 59 22 26 42 23 12 30 36 12 26 75 10 61 42D=Poor 116 32 59 22 26 42 23 12 30 36 12 26 75 10 61 42 14% 17% 14% 17% 14% 17% 14% 17% 15% 11% 10% 15% 19% 22% 17% 15% 8% 12% 17% 3% 25% 20%15% 11% 10% 15% 19% 22% 17% 15% 8% 12% 17% 3% 25% 20%15% 11% 10% 15% 19% 22% 17% 15% 8% 12% 17% 3% 25% 20%15% 11% 10% 15% 19% 22% 17% 15% 8% 12% 17% 3% 25% 20% K N NK N NK N NK N N F=Unacceptable 171 46 91 30F=Unacceptable 171 46 91 30F=Unacceptable 171 46 91 30F=Unacceptable 171 46 91 30 45 68 37 6 46 56 26 39 101 18 45 9745 68 37 6 46 56 26 39 101 18 45 9745 68 37 6 46 56 26 39 101 18 45 9745 68 37 6 46 56 26 39 101 18 45 97 21% 24% 23% 14% 17% 23% 31% 11% 25% 23% 16% 18% 24% 6% 18% 46%21% 24% 23% 14% 17% 23% 31% 11% 25% 23% 16% 18% 24% 6% 18% 46%21% 24% 23% 14% 17% 23% 31% 11% 25% 23% 16% 18% 24% 6% 18% 46%21% 24% 23% 14% 17% 23% 31% 11% 25% 23% 16% 18% 24% 6% 18% 46% d D d D d D d D H k N NOH k N NOH k N NOH k N NO Not sure 7 Not sure 7 Not sure 7 Not sure 7 ---- 6 1 0 0 3 2 4 6 1 0 0 3 2 4 6 1 0 0 3 2 4 6 1 0 0 3 2 4 ---- 2 2 3 3 1 22 2 3 3 1 22 2 3 3 1 22 2 3 3 1 2 1% 1% 1% *% *% 2% 31% 1% 1% *% *% 2% 31% 1% 1% *% *% 2% 31% 1% 1% *% *% 2% 3% 2% 1% 1% 1% 1% 1% 1%% 2% 1% 1% 1% 1% 1% 1%% 2% 1% 1% 1% 1% 1% 1%% 2% 1% 1% 1% 1% 1% 1% GOOD GOOD GOOD GOOD ---- A OR B 369 61 163 136 145 139 24 18 68 108 78 110 171 257 84 17A OR B 369 61 163 136 145 139 24 18 68 108 78 110 171 257 84 17A OR B 369 61 163 136 145 139 24 18 68 108 78 110 171 257 84 17A OR B 369 61 163 136 145 139 24 18 68 108 78 110 171 257 84 17 45% 32% 41% 64% 54% 48% 21% 32% 37% 445% 32% 41% 64% 54% 48% 21% 32% 37% 445% 32% 41% 64% 54% 48% 21% 32% 37% 445% 32% 41% 64% 54% 48% 21% 32% 37% 45% 50% 51% 40% 79% 34% 8%5% 50% 51% 40% 79% 34% 8%5% 50% 51% 40% 79% 34% 8%5% 50% 51% 40% 79% 34% 8% BC m M OP P BC m M OP P BC m M OP P BC m M OP P POOR POOR POOR POOR ---- D OR F 287 78 151 53 71 110 60 18 76 92 38 D OR F 287 78 151 53 71 110 60 18 76 92 38 D OR F 287 78 151 53 71 110 60 18 76 92 38 D OR F 287 78 151 53 71 110 60 18 76 92 38 65 176 28 105 14065 176 28 105 14065 176 28 105 14065 176 28 105 140 35% 41% 38% 25% 27% 38% 51% 32% 42% 38% 24% 30% 41% 8% 43% 65%35% 41% 38% 25% 27% 38% 51% 32% 42% 38% 24% 30% 41% 8% 43% 65%35% 41% 38% 25% 27% 38% 51% 32% 42% 38% 24% 30% 41% 8% 43% 65%35% 41% 38% 25% 27% 38% 51% 32% 42% 38% 24% 30% 41% 8% 43% 65% D D E h KL D D E h KL D D E h KL D D E h KL N NON NON NON NO Comparison Groups: BCD/EF/GH/IJ/KLM/NOPComparison Groups: BCD/EF/GH/IJ/KLM/NOPComparison Groups: BCD/EF/GH/IJ/KLM/NOPComparison Groups: BCD/EF/GH/IJ/KLM/NOP Independent ZIndependent ZIndependent ZIndependent Z----Test for Percentages (unpooled proportions)Test for Percentages (unpooled proportions)Test for Percentages (unpooled proportions)Test for Percentages (unpooled proportions) Uppercase letters indicate significance at the 95% level.Uppercase letters indicate significance at the 95% level.Uppercase letters indicate significance at the 95% level.Uppercase letters indicate significance at the 95% level. Lowercase letters indicate significance at the 90% level.Lowercase letters indicate significance at the 90% level.Lowercase letters indicate significance at the 90% level.Lowercase letters indicate significance at the 90% level.

Table R2 Page 28Table R2 Page 28Table R2 Page 28Table R2 Page 28 (Continued)(Continued)(Continued)(Continued) Investor's Business Daily/TIPP PollInvestor's Business Daily/TIPP PollInvestor's Business Daily/TIPP PollInvestor's Business Daily/TIPP Poll---- December 2018, Field 11/26 to 12/2 , Sample December 2018, Field 11/26 to 12/2 , Sample December 2018, Field 11/26 to 12/2 , Sample December 2018, Field 11/26 to 12/2 , Sample ---- 823 adults, MOE +/823 adults, MOE +/823 adults, MOE +/823 adults, MOE +/----3.3 pts, Traditional phone with live interviewers 3.3 pts, Traditional phone with live interviewers 3.3 pts, Traditional phone with live interviewers 3.3 pts, Traditional phone with live interviewers R2R2R2R2 How would you grade his performance: HANDLING OF THE ECONOMYHow would you grade his performance: HANDLING OF THE ECONOMYHow would you grade his performance: HANDLING OF THE ECONOMYHow would you grade his performance: HANDLING OF THE ECONOMY ====AREA TYPE==== ===WHITE=== ==BLK/HISP= ==MAR.STAT= ====EDUCATION==== ====IDEOLOOGY========AREA TYPE==== ===WHITE=== ==BLK/HISP= ==MAR.STAT= ====EDUCATION==== ====IDEOLOOGY========AREA TYPE==== ===WHITE=== ==BLK/HISP= ==MAR.STAT= ====EDUCATION==== ====IDEOLOOGY========AREA TYPE==== ===WHITE=== ==BLK/HISP= ==MAR.STAT= ====EDUCATION==== ====IDEOLOOGY==== SUBSUBSUBSUB---- WHITE SINGL MARR HIGH SOME WHITE SINGL MARR HIGH SOME WHITE SINGL MARR HIGH SOME WHITE SINGL MARR HIGH SOME TOTAL TOTAL TOTAL TOTAL URBAN URBAN RURAL MEN WOMEN BLACK HIS. WOMEN WOM SCHL. COLL. COLL+ CONS. MOD. LIB.URBAN URBAN RURAL MEN WOMEN BLACK HIS. WOMEN WOM SCHL. COLL. COLL+ CONS. MOD. LIB.URBAN URBAN RURAL MEN WOMEN BLACK HIS. WOMEN WOM SCHL. COLL. COLL+ CONS. MOD. LIB.URBAN URBAN RURAL MEN WOMEN BLACK HIS. WOMEN WOM SCHL. COLL. COLL+ CONS. MOD. LIB. -------------------- -------------------- -------------------- -------------------- -------------------- -------------------- -------------------- -------------------- -------------------- -------------------- -------------------- -------------------- -------------------- -------------------- -------------------- -------------------- (A) (B) (C) (A) (B) (C) (A) (B) (C) (A) (B) (C) (D) (E) (F) (G) (H) (I) (J) (K) (L) (M) (N) (O) (P)(D) (E) (F) (G) (H) (I) (J) (K) (L) (M) (N) (O) (P)(D) (E) (F) (G) (H) (I) (J) (K) (L) (M) (N) (O) (P)(D) (E) (F) (G) (H) (I) (J) (K) (L) (M) (N) (O) (P) Mean 2.18 1.87 2.02 2.73 2.49 2.21 1.43 2.00 1.93 2.14 2.42 2.35 2.00 3.24 1.86 0.98Mean 2.18 1.87 2.02 2.73 2.49 2.21 1.43 2.00 1.93 2.14 2.42 2.35 2.00 3.24 1.86 0.98Mean 2.18 1.87 2.02 2.73 2.49 2.21 1.43 2.00 1.93 2.14 2.42 2.35 2.00 3.24 1.86 0.98Mean 2.18 1.87 2.02 2.73 2.49 2.21 1.43 2.00 1.93 2.14 2.42 2.35 2.00 3.24 1.86 0.98 Comparison Groups: BCD/EF/GH/IJ/KLM/NOPComparison Groups: BCD/EF/GH/IJ/KLM/NOPComparison Groups: BCD/EF/GH/IJ/KLM/NOPComparison Groups: BCD/EF/GH/IJ/KLM/NOP Independent ZIndependent ZIndependent ZIndependent Z----Test for Percentages (unpooled proportions)Test for Percentages (unpooled proportions)Test for Percentages (unpooled proportions)Test for Percentages (unpooled proportions) Uppercase letters indicate significance at the 95% level.Uppercase letters indicate significance at the 95% level.Uppercase letters indicate significance at the 95% level.Uppercase letters indicate significance at the 95% level. Lowercase letters indicate significance at the 90% level.Lowercase letters indicate significance at the 90% level.Lowercase letters indicate significance at the 90% level.Lowercase letters indicate significance at the 90% level.

Table R17 Page 29Table R17 Page 29Table R17 Page 29Table R17 Page 29 Investor's Business DaInvestor's Business DaInvestor's Business DaInvestor's Business Daily/TIPP Pollily/TIPP Pollily/TIPP Pollily/TIPP Poll---- December 2018, Field 11/26 to 12/2 , Sample December 2018, Field 11/26 to 12/2 , Sample December 2018, Field 11/26 to 12/2 , Sample December 2018, Field 11/26 to 12/2 , Sample ---- 823 adults, MOE +/823 adults, MOE +/823 adults, MOE +/823 adults, MOE +/----3.3 pts, Traditional phone with live interviewers 3.3 pts, Traditional phone with live interviewers 3.3 pts, Traditional phone with live interviewers 3.3 pts, Traditional phone with live interviewers R17R17R17R17 How would you grade his performance: HANDLING THE SITUATION AT THE SOUTHERN BORDERHow would you grade his performance: HANDLING THE SITUATION AT THE SOUTHERN BORDERHow would you grade his performance: HANDLING THE SITUATION AT THE SOUTHERN BORDERHow would you grade his performance: HANDLING THE SITUATION AT THE SOUTHERN BORDER ======= REGION ======== ========= AGE ========= ==GENDER== ===RACE === ======= INCOME ======= =====PARTY===== ==INVESTOR======== REGION ======== ========= AGE ========= ==GENDER== ===RACE === ======= INCOME ======= =====PARTY===== ==INVESTOR======== REGION ======== ========= AGE ========= ==GENDER== ===RACE === ======= INCOME ======= =====PARTY===== ==INVESTOR======== REGION ======== ========= AGE ========= ==GENDER== ===RACE === ======= INCOME ======= =====PARTY===== ==INVESTOR= TOTAL TOTAL TOTAL TOTAL BLACK UND 30KBLACK UND 30KBLACK UND 30KBLACK UND 30K---- 50K50K50K50K---- NE MW SOUTH WEST 18NE MW SOUTH WEST 18NE MW SOUTH WEST 18NE MW SOUTH WEST 18----24 2524 2524 2524 25----44 4544 4544 4544 45----64 65+ MALE FEM. WHITE HISP 30K 50K 75K 75K+ DEM REP IND YES NO 64 65+ MALE FEM. WHITE HISP 30K 50K 75K 75K+ DEM REP IND YES NO 64 65+ MALE FEM. WHITE HISP 30K 50K 75K 75K+ DEM REP IND YES NO 64 65+ MALE FEM. WHITE HISP 30K 50K 75K 75K+ DEM REP IND YES NO -------------------- -------------------- -------------------- -------------------- -------------------- -------------------- -------------------- -------------------- -------------------- -------------------- -------------------- -------------------- -------------------- -------------------- -------------------- -------------------- -------------------- -------------------- -------------------- -------------------- -------------------- -------------------- (A) (B) (C) (D) (E) (F) (G) (H) (I) (J) (K) (L) (M) (N) (O) (P) (Q) (R) (A) (B) (C) (D) (E) (F) (G) (H) (I) (J) (K) (L) (M) (N) (O) (P) (Q) (R) (A) (B) (C) (D) (E) (F) (G) (H) (I) (J) (K) (L) (M) (N) (O) (P) (Q) (R) (A) (B) (C) (D) (E) (F) (G) (H) (I) (J) (K) (L) (M) (N) (O) (P) (Q) (R) (S) (T) (U) (V)(S) (T) (U) (V)(S) (T) (U) (V)(S) (T) (U) (V) TOTAL 823 147 181 309 186 45 234 293 207 393 430 556 171 92 131 138 3TOTAL 823 147 181 309 186 45 234 293 207 393 430 556 171 92 131 138 3TOTAL 823 147 181 309 186 45 234 293 207 393 430 556 171 92 131 138 3TOTAL 823 147 181 309 186 45 234 293 207 393 430 556 171 92 131 138 363 286 237 283 447 30963 286 237 283 447 30963 286 237 283 447 30963 286 237 283 447 309 100% 100% 100% 100% 100% 100% 100% 100% 100% 100% 100% 100% 100% 100% 100% 100% 100% 100% 100% 100% 100% 100% 100% 100% 100% 100% 100% 100% 100% 100% 100% 100% 100% 100% 100% 100% 100% 100% 100% 100% 100% 100% 100% 100% 100% 100%100% 100% 100% 100% 100% 100% 100% 100% 100% 100% 100% 100% 100% 100%100% 100% 100% 100% 100% 100% 100% 100% 100% 100% 100% 100% 100% 100%100% 100% 100% 100% 100% 100% 100% 100% 100% 100% 100% 100% 100% 100% Unweighted Total 823 158 180 311 174 17 102 289 371 433 390 645 107 104 145 126 3Unweighted Total 823 158 180 311 174 17 102 289 371 433 390 645 107 104 145 126 3Unweighted Total 823 158 180 311 174 17 102 289 371 433 390 645 107 104 145 126 3Unweighted Total 823 158 180 311 174 17 102 289 371 433 390 645 107 104 145 126 337 247 296 262 472 28237 247 296 262 472 28237 247 296 262 472 28237 247 296 262 472 282 A=Excellent A=Excellent A=Excellent A=Excellent 230 41 51 97 42 3 55 90 62 116 115 180 23 26 30 36 105 6 146 75 140 230 41 51 97 42 3 55 90 62 116 115 180 23 26 30 36 105 6 146 75 140 230 41 51 97 42 3 55 90 62 116 115 180 23 26 30 36 105 6 146 75 140 230 41 51 97 42 3 55 90 62 116 115 180 23 26 30 36 105 6 146 75 140 69696969 28% 28% 28% 31% 23% 7% 23% 31% 30% 29% 27% 32% 13% 28% 28% 28% 28% 31% 23% 7% 23% 31% 30% 29% 27% 32% 13% 28% 28% 28% 28% 31% 23% 7% 23% 31% 30% 29% 27% 32% 13% 28% 28% 28% 28% 31% 23% 7% 23% 31% 30% 29% 27% 32% 13% 28% 23% 26% 29% 2% 62% 26% 31% 22%23% 26% 29% 2% 62% 26% 31% 22%23% 26% 29% 2% 62% 26% 31% 22%23% 26% 29% 2% 62% 26% 31% 22% f F F M RT R V f F F M RT R V f F F M RT R V f F F M RT R V B=Good 89 15 19 38 B=Good 89 15 19 38 B=Good 89 15 19 38 B=Good 89 15 19 38 18 3 20 37 27 49 40 71 10 15 11 22 30 7 49 28 42 3818 3 20 37 27 49 40 71 10 15 11 22 30 7 49 28 42 3818 3 20 37 27 49 40 71 10 15 11 22 30 7 49 28 42 3818 3 20 37 27 49 40 71 10 15 11 22 30 7 49 28 42 38 11% 10% 10% 12% 10% 6% 8% 13% 13% 12% 9% 13% 6% 17% 8% 16% 8% 3% 21% 10% 11% 10% 10% 12% 10% 6% 8% 13% 13% 12% 9% 13% 6% 17% 8% 16% 8% 3% 21% 10% 11% 10% 10% 12% 10% 6% 8% 13% 13% 12% 9% 13% 6% 17% 8% 16% 8% 3% 21% 10% 11% 10% 10% 12% 10% 6% 8% 13% 13% 12% 9% 13% 6% 17% 8% 16% 8% 3% 21% 10% 9% 12%9% 12%9% 12%9% 12% M q RT R M q RT R M q RT R M q RT R C=Average 75 13 13 30 20 7 27 27 10 40 C=Average 75 13 13 30 20 7 27 27 10 40 C=Average 75 13 13 30 20 7 27 27 10 40 C=Average 75 13 13 30 20 7 27 27 10 40 35 46 20 4 24 16 27 22 22 28 42 3035 46 20 4 24 16 27 22 22 28 42 3035 46 20 4 24 16 27 22 22 28 42 3035 46 20 4 24 16 27 22 22 28 42 30 9% 9% 7% 10% 11% 16% 11% 9% 5% 10% 8% 8% 12% 4% 18% 11% 7% 8% 9% 10% 9% 9% 9% 7% 10% 11% 16% 11% 9% 5% 10% 8% 8% 12% 4% 18% 11% 7% 8% 9% 10% 9% 9% 9% 7% 10% 11% 16% 11% 9% 5% 10% 8% 8% 12% 4% 18% 11% 7% 8% 9% 10% 9% 9% 9% 7% 10% 11% 16% 11% 9% 5% 10% 8% 8% 12% 4% 18% 11% 7% 8% 9% 10% 9% 10%10%10%10% i i NQ i i NQ i i NQ i i NQ D=Poor 74 11 19 25 19 6 19 29 18 31 44 43 16 7 16 12 D=Poor 74 11 19 25 19 6 19 29 18 31 44 43 16 7 16 12 D=Poor 74 11 19 25 19 6 19 29 18 31 44 43 16 7 16 12 D=Poor 74 11 19 25 19 6 19 29 18 31 44 43 16 7 16 12 29 43 3 28 42 2529 43 3 28 42 2529 43 3 28 42 2529 43 3 28 42 25 9% 8% 10% 8% 10% 13% 8% 10% 9% 8% 10% 8% 10% 7% 12% 9% 8% 15% 1% 10% 9% 9% 8% 10% 8% 10% 13% 8% 10% 9% 8% 10% 8% 10% 7% 12% 9% 8% 15% 1% 10% 9% 9% 8% 10% 8% 10% 13% 8% 10% 9% 8% 10% 8% 10% 7% 12% 9% 8% 15% 1% 10% 9% 9% 8% 10% 8% 10% 13% 8% 10% 9% 8% 10% 8% 10% 7% 12% 9% 8% 15% 1% 10% 9% 8%8%8%8% S S S S S S S S F=Unacceptable 336 65 74 111 86 24 104 110 84 148 188 207 96 38 49 50 1F=Unacceptable 336 65 74 111 86 24 104 110 84 148 188 207 96 38 49 50 1F=Unacceptable 336 65 74 111 86 24 104 110 84 148 188 207 96 38 49 50 1F=Unacceptable 336 65 74 111 86 24 104 110 84 148 188 207 96 38 49 50 167 200 10 120 175 13967 200 10 120 175 13967 200 10 120 175 13967 200 10 120 175 139 41% 44% 41% 36% 46% 53% 44% 38% 40% 38% 44% 37% 56% 41% 37% 36% 46% 70% 4% 42% 39% 41% 44% 41% 36% 46% 53% 44% 38% 40% 38% 44% 37% 56% 41% 37% 36% 46% 70% 4% 42% 39% 41% 44% 41% 36% 46% 53% 44% 38% 40% 38% 44% 37% 56% 41% 37% 36% 46% 70% 4% 42% 39% 41% 44% 41% 36% 46% 53% 44% 38% 40% 38% 44% 37% 56% 41% 37% 36% 46% 70% 4% 42% 39% 45%45%45%45% d d d d L ST S L ST S L ST S L ST S Not sure 18 3 6 8 1 2 9 Not sure 18 3 6 8 1 2 9 Not sure 18 3 6 8 1 2 9 Not sure 18 3 6 8 1 2 9 ---- 7 10 9 9 6 3 1 2 7 8 6 4 7 77 10 9 9 6 3 1 2 7 8 6 4 7 77 10 9 9 6 3 1 2 7 8 6 4 7 77 10 9 9 6 3 1 2 7 8 6 4 7 7 2% 2%2% 2%2% 2%2% 2% 3% 3% *% 5% 4% 3% 2% 2% 2% 4% 3% 1% 2% 2% 3% 3% 2% 2% 2%3% 3% *% 5% 4% 3% 2% 2% 2% 4% 3% 1% 2% 2% 3% 3% 2% 2% 2%3% 3% *% 5% 4% 3% 2% 2% 2% 4% 3% 1% 2% 2% 3% 3% 2% 2% 2%3% 3% *% 5% 4% 3% 2% 2% 2% 4% 3% 1% 2% 2% 3% 3% 2% 2% 2% e e e e GOOD GOOD GOOD GOOD ---- A OR B 319 55 69 135 60 6 75 127 89 165 154 251 33 41 41 58 135 1A OR B 319 55 69 135 60 6 75 127 89 165 154 251 33 41 41 58 135 1A OR B 319 55 69 135 60 6 75 127 89 165 154 251 33 41 41 58 135 1A OR B 319 55 69 135 60 6 75 127 89 165 154 251 33 41 41 58 135 13 195 103 182 1083 195 103 182 1083 195 103 182 1083 195 103 182 108 39% 38% 38% 44% 32% 13% 32% 43% 39% 38% 38% 44% 32% 13% 32% 43% 39% 38% 38% 44% 32% 13% 32% 43% 39% 38% 38% 44% 32% 13% 32% 43% 43% 42% 36% 45% 19% 44% 31% 42% 37% 5% 82% 36% 41% 35%43% 42% 36% 45% 19% 44% 31% 42% 37% 5% 82% 36% 41% 35%43% 42% 36% 45% 19% 44% 31% 42% 37% 5% 82% 36% 41% 35%43% 42% 36% 45% 19% 44% 31% 42% 37% 5% 82% 36% 41% 35% e f FG Fg M RT R e f FG Fg M RT R e f FG Fg M RT R e f FG Fg M RT R POOR POOR POOR POOR ---- D OR FD OR FD OR FD OR F 410 76 93 137 105 30 123 140 102 179 231 251 112 45 65 62 195 243 13 148 217 410 76 93 137 105 30 123 140 102 179 231 251 112 45 65 62 195 243 13 148 217 410 76 93 137 105 30 123 140 102 179 231 251 112 45 65 62 195 243 13 148 217 410 76 93 137 105 30 123 140 102 179 231 251 112 45 65 62 195 243 13 148 217 164164164164 50% 52% 51% 44% 56% 66% 53% 48% 49% 46% 54% 45% 65% 49% 50% 52% 51% 44% 56% 66% 53% 48% 49% 46% 54% 45% 65% 49% 50% 52% 51% 44% 56% 66% 53% 48% 49% 46% 54% 45% 65% 49% 50% 52% 51% 44% 56% 66% 53% 48% 49% 46% 54% 45% 65% 49% 49% 45% 54% 85% 6% 52% 48% 53%49% 45% 54% 85% 6% 52% 48% 53%49% 45% 54% 85% 6% 52% 48% 53%49% 45% 54% 85% 6% 52% 48% 53% D j L ST S D j L ST S D j L ST S D j L ST S Comparison Groups: BCDE/FGHI/JK/LM/NOPQ/RST/UComparison Groups: BCDE/FGHI/JK/LM/NOPQ/RST/UComparison Groups: BCDE/FGHI/JK/LM/NOPQ/RST/UComparison Groups: BCDE/FGHI/JK/LM/NOPQ/RST/UVVVV Independent ZIndependent ZIndependent ZIndependent Z----Test for Percentages (unpooled proportions)Test for Percentages (unpooled proportions)Test for Percentages (unpooled proportions)Test for Percentages (unpooled proportions) Uppercase letters indicate significance at the 95% level.Uppercase letters indicate significance at the 95% level.Uppercase letters indicate significance at the 95% level.Uppercase letters indicate significance at the 95% level. Lowercase letters indicate significance at the 90% level.Lowercase letters indicate significance at the 90% level.Lowercase letters indicate significance at the 90% level.Lowercase letters indicate significance at the 90% level.
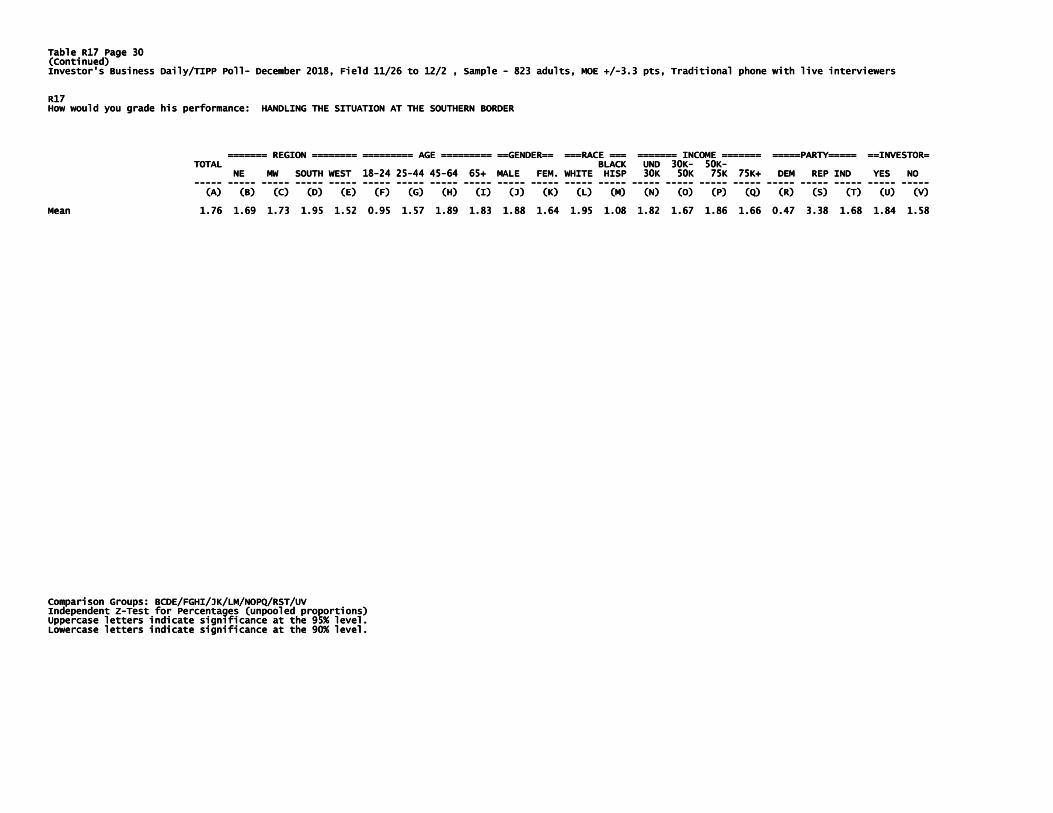
Table R17 Page 30Table R17 Page 30Table R17 Page 30Table R17 Page 30 (Continued)(Continued)(Continued)(Continued) Investor's Business Daily/TIPP PollInvestor's Business Daily/TIPP PollInvestor's Business Daily/TIPP PollInvestor's Business Daily/TIPP Poll---- December 201December 201December 201December 2018, Field 11/26 to 12/2 , Sample 8, Field 11/26 to 12/2 , Sample 8, Field 11/26 to 12/2 , Sample 8, Field 11/26 to 12/2 , Sample ---- 823 adults, MOE +/823 adults, MOE +/823 adults, MOE +/823 adults, MOE +/----3.3 pts, Traditional phone with live interviewers 3.3 pts, Traditional phone with live interviewers 3.3 pts, Traditional phone with live interviewers 3.3 pts, Traditional phone with live interviewers R17R17R17R17 How would you grade his performance: HANDLING THE SITUATION AT THE SOUTHERN BORDERHow would you grade his performance: HANDLING THE SITUATION AT THE SOUTHERN BORDERHow would you grade his performance: HANDLING THE SITUATION AT THE SOUTHERN BORDERHow would you grade his performance: HANDLING THE SITUATION AT THE SOUTHERN BORDER ======= REGION ======== ========= AGE ========= ==GENDER== ===RACE === ======= INCOME ======= =====PARTY===== ==INVESTOR======== REGION ======== ========= AGE ========= ==GENDER== ===RACE === ======= INCOME ======= =====PARTY===== ==INVESTOR======== REGION ======== ========= AGE ========= ==GENDER== ===RACE === ======= INCOME ======= =====PARTY===== ==INVESTOR======== REGION ======== ========= AGE ========= ==GENDER== ===RACE === ======= INCOME ======= =====PARTY===== ==INVESTOR= TOTAL TOTAL TOTAL TOTAL BLACK UND 30KBLACK UND 30KBLACK UND 30KBLACK UND 30K---- 50K50K50K50K---- NE MW SOUTH WEST 18NE MW SOUTH WEST 18NE MW SOUTH WEST 18NE MW SOUTH WEST 18----24 2524 2524 2524 25----44 4544 4544 4544 45----64 65+ MALE FEM. WHITE HISP 30K 50K 75K 75K+ DEM REP IND YES NO 64 65+ MALE FEM. WHITE HISP 30K 50K 75K 75K+ DEM REP IND YES NO 64 65+ MALE FEM. WHITE HISP 30K 50K 75K 75K+ DEM REP IND YES NO 64 65+ MALE FEM. WHITE HISP 30K 50K 75K 75K+ DEM REP IND YES NO -------------------- -------------------- -------------------- -------------------- -------------------- -------------------- -------------------- -------------------- -------------------- -------------------- -------------------- -------------------- -------------------- -------------------- -------------------- -------------------- -------------------- -------------------- -------------------- -------------------- -------------------- -------------------- (A) (B) (C) (D) (E) (F) (G) (H) (I) (J) (K) (L) (M) (N) (O) (P) (Q) (R) (A) (B) (C) (D) (E) (F) (G) (H) (I) (J) (K) (L) (M) (N) (O) (P) (Q) (R) (A) (B) (C) (D) (E) (F) (G) (H) (I) (J) (K) (L) (M) (N) (O) (P) (Q) (R) (A) (B) (C) (D) (E) (F) (G) (H) (I) (J) (K) (L) (M) (N) (O) (P) (Q) (R) (S) (T) (U) (V)(S) (T) (U) (V)(S) (T) (U) (V)(S) (T) (U) (V) Mean 1.76 1.69 1.73 1.95 1.52 0.95 1.57 1.89 1.83 1.88 1.64 1.95 1.08 1.82 1.67 1.86 1.Mean 1.76 1.69 1.73 1.95 1.52 0.95 1.57 1.89 1.83 1.88 1.64 1.95 1.08 1.82 1.67 1.86 1.Mean 1.76 1.69 1.73 1.95 1.52 0.95 1.57 1.89 1.83 1.88 1.64 1.95 1.08 1.82 1.67 1.86 1.Mean 1.76 1.69 1.73 1.95 1.52 0.95 1.57 1.89 1.83 1.88 1.64 1.95 1.08 1.82 1.67 1.86 1.66 0.47 3.38 1.68 1.84 1.5866 0.47 3.38 1.68 1.84 1.5866 0.47 3.38 1.68 1.84 1.5866 0.47 3.38 1.68 1.84 1.58 Comparison Groups: BCDE/FGHI/JK/LM/NOPQ/RST/UVComparison Groups: BCDE/FGHI/JK/LM/NOPQ/RST/UVComparison Groups: BCDE/FGHI/JK/LM/NOPQ/RST/UVComparison Groups: BCDE/FGHI/JK/LM/NOPQ/RST/UV Independent ZIndependent ZIndependent ZIndependent Z----Test for Percentages (unpooled proportions)Test for Percentages (unpooled proportions)Test for Percentages (unpooled proportions)Test for Percentages (unpooled proportions) Uppercase letters indicate significance at the 95% level.Uppercase letters indicate significance at the 95% level.Uppercase letters indicate significance at the 95% level.Uppercase letters indicate significance at the 95% level. Lowercase letters indicate significance at the 90% level.Lowercase letters indicate significance at the 90% level.Lowercase letters indicate significance at the 90% level.Lowercase letters indicate significance at the 90% level.

Table R17 Page 31Table R17 Page 31Table R17 Page 31Table R17 Page 31 Investor's Business Daily/TIPP PollInvestor's Business Daily/TIPP PollInvestor's Business Daily/TIPP PollInvestor's Business Daily/TIPP Poll---- December 2018, Field 11/26 to 12/2 , Sample December 2018, Field 11/26 to 12/2 , Sample December 2018, Field 11/26 to 12/2 , Sample December 2018, Field 11/26 to 12/2 , Sample ---- 823 adults, MOE +/823 adults, MOE +/823 adults, MOE +/823 adults, MOE +/----3.3 pts, Traditional phone with live interviewers 3.3 pts, Traditional phone with live interviewers 3.3 pts, Traditional phone with live interviewers 3.3 pts, Traditional phone with live interviewers R17R17R17R17 How would you grade his performance: HANDLING THE SITUATION AT THE SOUTHERN BORDERHow would you grade his performance: HANDLING THE SITUATION AT THE SOUTHERN BORDERHow would you grade his performance: HANDLING THE SITUATION AT THE SOUTHERN BORDERHow would you grade his performance: HANDLING THE SITUATION AT THE SOUTHERN BORDER ====AREA TYPE==== ===WHITE=== ==BLK/HISP= ==MAR.STAT= ====EDUCATION==== ====IDEOLOOGY========AREA TYPE==== ===WHITE=== ==BLK/HISP= ==MAR.STAT= ====EDUCATION==== ====IDEOLOOGY========AREA TYPE==== ===WHITE=== ==BLK/HISP= ==MAR.STAT= ====EDUCATION==== ====IDEOLOOGY========AREA TYPE==== ===WHITE=== ==BLK/HISP= ==MAR.STAT= ====EDUCATION==== ====IDEOLOOGY==== SUBSUBSUBSUB---- WHITE SINGL MARR HIGH SOME WHITE SINGL MARR HIGH SOME WHITE SINGL MARR HIGH SOME WHITE SINGL MARR HIGH SOME TOTAL URBAN URBAN RURAL MEN WOMEN BLACK HIS. WOMEN WOM SCHL. COLL. COLL+ CONS. MOD. LIB.TOTAL URBAN URBAN RURAL MEN WOMEN BLACK HIS. WOMEN WOM SCHL. COLL. COLL+ CONS. MOD. LIB.TOTAL URBAN URBAN RURAL MEN WOMEN BLACK HIS. WOMEN WOM SCHL. COLL. COLL+ CONS. MOD. LIB.TOTAL URBAN URBAN RURAL MEN WOMEN BLACK HIS. WOMEN WOM SCHL. COLL. COLL+ CONS. MOD. LIB. -------------------- -------------------- -------------------- -------------------- -------------------- -------------------- -------------------- -------------------- -------------------- -------------------- -------------------- -------------------- -------------------- -------------------- -------------------- -------------------- (A) (A) (A) (A) (B) (C) (D) (E) (F) (G) (H) (I) (J) (K) (L) (M) (N) (O) (P)(B) (C) (D) (E) (F) (G) (H) (I) (J) (K) (L) (M) (N) (O) (P)(B) (C) (D) (E) (F) (G) (H) (I) (J) (K) (L) (M) (N) (O) (P)(B) (C) (D) (E) (F) (G) (H) (I) (J) (K) (L) (M) (N) (O) (P) TOTAL 823 192 400 211 267 290 118 55 182 241 157 216 430 328 247 214TOTAL 823 192 400 211 267 290 118 55 182 241 157 216 430 328 247 214TOTAL 823 192 400 211 267 290 118 55 182 241 157 216 430 328 247 214TOTAL 823 192 400 211 267 290 118 55 182 241 157 216 430 328 247 214 100% 100% 100% 100% 100% 100% 100% 100% 100% 100% 100% 100% 100% 100% 100% 100% 100% 100% 100% 100% 100% 100% 100% 100% 100%100% 100% 100% 100% 100% 100% 100% 100% 100% 100% 100% 100% 100%100% 100% 100% 100% 100% 100% 100% 100% 100% 100% 100% 100% 100%100% 100% 100% 100% 100% 100% 100% 100% 100% 100% 100% 100% 100% Unweighted Total 823 172 385 244 340 305 73 35 178 205 161 222 417 395 233 162Unweighted Total 823 172 385 244 340 305 73 35 178 205 161 222 417 395 233 162Unweighted Total 823 172 385 244 340 305 73 35 178 205 161 222 417 395 233 162Unweighted Total 823 172 385 244 340 305 73 35 178 205 161 222 417 395 233 162 A=Excellent 230 40 89 96 9A=Excellent 230 40 89 96 9A=Excellent 230 40 89 96 9A=Excellent 230 40 89 96 90 91 10 15 38 75 55 61 108 180 45 30 91 10 15 38 75 55 61 108 180 45 30 91 10 15 38 75 55 61 108 180 45 30 91 10 15 38 75 55 61 108 180 45 3 28% 21% 22% 45% 34% 31% 8% 27% 21% 31% 35% 28% 25% 55% 18% 1%28% 21% 22% 45% 34% 31% 8% 27% 21% 31% 35% 28% 25% 55% 18% 1%28% 21% 22% 45% 34% 31% 8% 27% 21% 31% 35% 28% 25% 55% 18% 1%28% 21% 22% 45% 34% 31% 8% 27% 21% 31% 35% 28% 25% 55% 18% 1% BC BC BC BC G i m OP P G i m OP P G i m OP P G i m OP P B=Good 89 21 44 22 41 30 6 4 22 16 22 30 34 52 26 5B=Good 89 21 44 22 41 30 6 4 22 16 22 30 34 52 26 5B=Good 89 21 44 22 41 30 6 4 22 16 22 30 34 52 26 5B=Good 89 21 44 22 41 30 6 4 22 16 22 30 34 52 26 5 11% 11% 11% 10% 15% 10% 5% 6% 12% 7% 14% 14% 8% 16% 10% 2%11% 11% 11% 10% 15% 10% 5% 6% 12% 7% 14% 14% 8% 16% 10% 2%11% 11% 11% 10% 15% 10% 5% 6% 12% 7% 14% 14% 8% 16% 10% 2%11% 11% 11% 10% 15% 10% 5% 6% 12% 7% 14% 14% 8% 16% 10% 2% P P P P P P P P C=Average C=Average C=Average C=Average 75 14 46 14 25 21 16 3 15 21 17 25 33 41 26 475 14 46 14 25 21 16 3 15 21 17 25 33 41 26 475 14 46 14 25 21 16 3 15 21 17 25 33 41 26 475 14 46 14 25 21 16 3 15 21 17 25 33 41 26 4 9% 7% 12% 7% 9% 7% 14% 6% 8% 9% 11% 11% 8% 13% 10% 2%9% 7% 12% 7% 9% 7% 14% 6% 8% 9% 11% 11% 8% 13% 10% 2%9% 7% 12% 7% 9% 7% 14% 6% 8% 9% 11% 11% 8% 13% 10% 2%9% 7% 12% 7% 9% 7% 14% 6% 8% 9% 11% 11% 8% 13% 10% 2% d P P d P P d P P d P P D=Poor 74 24 38 11 22 22 13 3 19 24 18 21 34 16 31 25D=Poor 74 24 38 11 22 22 13 3 19 24 18 21 34 16 31 25D=Poor 74 24 38 11 22 22 13 3 19 24 18 21 34 16 31 25D=Poor 74 24 38 11 22 22 13 3 19 24 18 21 34 16 31 25 9% 9% 9% 9% 12% 10% 5% 8% 8% 11% 6% 10% 10% 11% 10% 8% 5% 13% 12%12% 10% 5% 8% 8% 11% 6% 10% 10% 11% 10% 8% 5% 13% 12%12% 10% 5% 8% 8% 11% 6% 10% 10% 11% 10% 8% 5% 13% 12%12% 10% 5% 8% 8% 11% 6% 10% 10% 11% 10% 8% 5% 13% 12% D d N ND d N ND d N ND d N N F=Unacceptable 336 92 174 F=Unacceptable 336 92 174 F=Unacceptable 336 92 174 F=Unacceptable 336 92 174 63 84 124 66 30 83 103 42 72 213 31 114 17663 84 124 66 30 83 103 42 72 213 31 114 17663 84 124 66 30 83 103 42 72 213 31 114 17663 84 124 66 30 83 103 42 72 213 31 114 176 41% 48% 43% 30% 31% 43% 56% 55% 46% 43% 27% 33% 50% 10% 46% 82%41% 48% 43% 30% 31% 43% 56% 55% 46% 43% 27% 33% 50% 10% 46% 82%41% 48% 43% 30% 31% 43% 56% 55% 46% 43% 27% 33% 50% 10% 46% 82%41% 48% 43% 30% 31% 43% 56% 55% 46% 43% 27% 33% 50% 10% 46% 82% D D D D D D D D E KL N NOE KL N NOE KL N NOE KL N NO Not sure 18 2 9 6 6 3 6 Not sure 18 2 9 6 6 3 6 Not sure 18 2 9 6 6 3 6 Not sure 18 2 9 6 6 3 6 ---- 6 3 4 7 8 8 6 26 3 4 7 8 8 6 26 3 4 7 8 8 6 26 3 4 7 8 8 6 2 2% 1% 2% 3% 2% 1% 5% 2% 1% 2% 3% 2% 1% 5% 2% 1% 2% 3% 2% 1% 5% 2% 1% 2% 3% 2% 1% 5% 3% 1% 3% 3% 2% 3% 2% 1%3% 1% 3% 3% 2% 3% 2% 1%3% 1% 3% 3% 2% 3% 2% 1%3% 1% 3% 3% 2% 3% 2% 1% GOOD GOOD GOOD GOOD ---- A OR B 319 61 132 117 131 120 16 18 60 91 76 91 142 231 71 8A OR B 319 61 132 117 131 120 16 18 60 91 76 91 142 231 71 8A OR B 319 61 132 117 131 120 16 18 60 91 76 91 142 231 71 8A OR B 319 61 132 117 131 120 16 18 60 91 76 91 142 231 71 8 39% 32% 33% 55% 49% 42% 14% 34% 33%39% 32% 33% 55% 49% 42% 14% 34% 33%39% 32% 33% 55% 49% 42% 14% 34% 33%39% 32% 33% 55% 49% 42% 14% 34% 33% 38% 49% 42% 33% 71% 29% 4%38% 49% 42% 33% 71% 29% 4%38% 49% 42% 33% 71% 29% 4%38% 49% 42% 33% 71% 29% 4% BC G M m OP P BC G M m OP P BC G M m OP P BC G M m OP P POOR POOR POOR POOR ---- D OR F 410 116 212 74 105 146 79 33 102 127 5D OR F 410 116 212 74 105 146 79 33 102 127 5D OR F 410 116 212 74 105 146 79 33 102 127 5D OR F 410 116 212 74 105 146 79 33 102 127 59 93 247 47 145 2009 93 247 47 145 2009 93 247 47 145 2009 93 247 47 145 200 50% 60% 53% 35% 39% 50% 67% 60% 56% 53% 38% 43% 57% 14% 59% 94%50% 60% 53% 35% 39% 50% 67% 60% 56% 53% 38% 43% 57% 14% 59% 94%50% 60% 53% 35% 39% 50% 67% 60% 56% 53% 38% 43% 57% 14% 59% 94%50% 60% 53% 35% 39% 50% 67% 60% 56% 53% 38% 43% 57% 14% 59% 94% D D E KD D E KD D E KD D E KL N NOL N NOL N NOL N NO Comparison Groups: BCD/EF/GH/IJ/KLM/NOPComparison Groups: BCD/EF/GH/IJ/KLM/NOPComparison Groups: BCD/EF/GH/IJ/KLM/NOPComparison Groups: BCD/EF/GH/IJ/KLM/NOP Independent ZIndependent ZIndependent ZIndependent Z----Test for Percentages (unpooled proportions)Test for Percentages (unpooled proportions)Test for Percentages (unpooled proportions)Test for Percentages (unpooled proportions) Uppercase letters indicate significance at the 95% level.Uppercase letters indicate significance at the 95% level.Uppercase letters indicate significance at the 95% level.Uppercase letters indicate significance at the 95% level. Lowercase letters indicate significance at the 90% level.Lowercase letters indicate significance at the 90% level.Lowercase letters indicate significance at the 90% level.Lowercase letters indicate significance at the 90% level.

Table R17 Page 32Table R17 Page 32Table R17 Page 32Table R17 Page 32 (Continued)(Continued)(Continued)(Continued) Investor's Business Daily/TIPP PollInvestor's Business Daily/TIPP PollInvestor's Business Daily/TIPP PollInvestor's Business Daily/TIPP Poll---- December 2018, Field 11/26 to 12/2 , Sample December 2018, Field 11/26 to 12/2 , Sample December 2018, Field 11/26 to 12/2 , Sample December 2018, Field 11/26 to 12/2 , Sample ---- 823 adults, MOE +/823 adults, MOE +/823 adults, MOE +/823 adults, MOE +/----3.3 pts, Traditional phone with live interviewers 3.3 pts, Traditional phone with live interviewers 3.3 pts, Traditional phone with live interviewers 3.3 pts, Traditional phone with live interviewers R17R17R17R17 How would you grade his performance: HANDLING THE SITUATION AT THEHow would you grade his performance: HANDLING THE SITUATION AT THEHow would you grade his performance: HANDLING THE SITUATION AT THEHow would you grade his performance: HANDLING THE SITUATION AT THE SOUTHERN BORDERSOUTHERN BORDERSOUTHERN BORDERSOUTHERN BORDER ====AREA TYPE==== ===WHITE=== ==BLK/HISP= ==MAR.STAT= ====EDUCATION==== ====IDEOLOOGY========AREA TYPE==== ===WHITE=== ==BLK/HISP= ==MAR.STAT= ====EDUCATION==== ====IDEOLOOGY========AREA TYPE==== ===WHITE=== ==BLK/HISP= ==MAR.STAT= ====EDUCATION==== ====IDEOLOOGY========AREA TYPE==== ===WHITE=== ==BLK/HISP= ==MAR.STAT= ====EDUCATION==== ====IDEOLOOGY==== SUBSUBSUBSUB---- WHITE SINGL MARR HIGH SOME WHITE SINGL MARR HIGH SOME WHITE SINGL MARR HIGH SOME WHITE SINGL MARR HIGH SOME TOTAL URBAN URBAN RURAL MEN WOMEN BLACK HIS. WOMEN WOM SCHL. COLL. COLL+ CONS. MOD. LIB.TOTAL URBAN URBAN RURAL MEN WOMEN BLACK HIS. WOMEN WOM SCHL. COLL. COLL+ CONS. MOD. LIB.TOTAL URBAN URBAN RURAL MEN WOMEN BLACK HIS. WOMEN WOM SCHL. COLL. COLL+ CONS. MOD. LIB.TOTAL URBAN URBAN RURAL MEN WOMEN BLACK HIS. WOMEN WOM SCHL. COLL. COLL+ CONS. MOD. LIB. -------------------- -------------------- -------------------- -------------------- -------------------- -------------------- -------------------- -------------------- -------------------- -------------------- -------------------- -------------------- -------------------- -------------------- -------------------- -------------------- (A) (B) (C) (D) (E) (F) (G) (H) (I) (J) (K) (L) (M) (N) (O) (P)(A) (B) (C) (D) (E) (F) (G) (H) (I) (J) (K) (L) (M) (N) (O) (P)(A) (B) (C) (D) (E) (F) (G) (H) (I) (J) (K) (L) (M) (N) (O) (P)(A) (B) (C) (D) (E) (F) (G) (H) (I) (J) (K) (L) (M) (N) (O) (P) Mean 1.76 1.44 1.58 2.37 2.12 1.80 0.93 1.46 1.50 1.73 2.20 1.94 1.50 3.04 1.41 0.28Mean 1.76 1.44 1.58 2.37 2.12 1.80 0.93 1.46 1.50 1.73 2.20 1.94 1.50 3.04 1.41 0.28Mean 1.76 1.44 1.58 2.37 2.12 1.80 0.93 1.46 1.50 1.73 2.20 1.94 1.50 3.04 1.41 0.28Mean 1.76 1.44 1.58 2.37 2.12 1.80 0.93 1.46 1.50 1.73 2.20 1.94 1.50 3.04 1.41 0.28 Comparison Groups: BCD/EF/GH/IJ/KLM/NOPComparison Groups: BCD/EF/GH/IJ/KLM/NOPComparison Groups: BCD/EF/GH/IJ/KLM/NOPComparison Groups: BCD/EF/GH/IJ/KLM/NOP Independent ZIndependent ZIndependent ZIndependent Z----Test for Percentages (unpooled proportions)Test for Percentages (unpooled proportions)Test for Percentages (unpooled proportions)Test for Percentages (unpooled proportions) Uppercase letters indicate significance at the 95% level.Uppercase letters indicate significance at the 95% level.Uppercase letters indicate significance at the 95% level.Uppercase letters indicate significance at the 95% level. Lowercase letters indicate significance at the 90% level.Lowercase letters indicate significance at the 90% level.Lowercase letters indicate significance at the 90% level.Lowercase letters indicate significance at the 90% level.
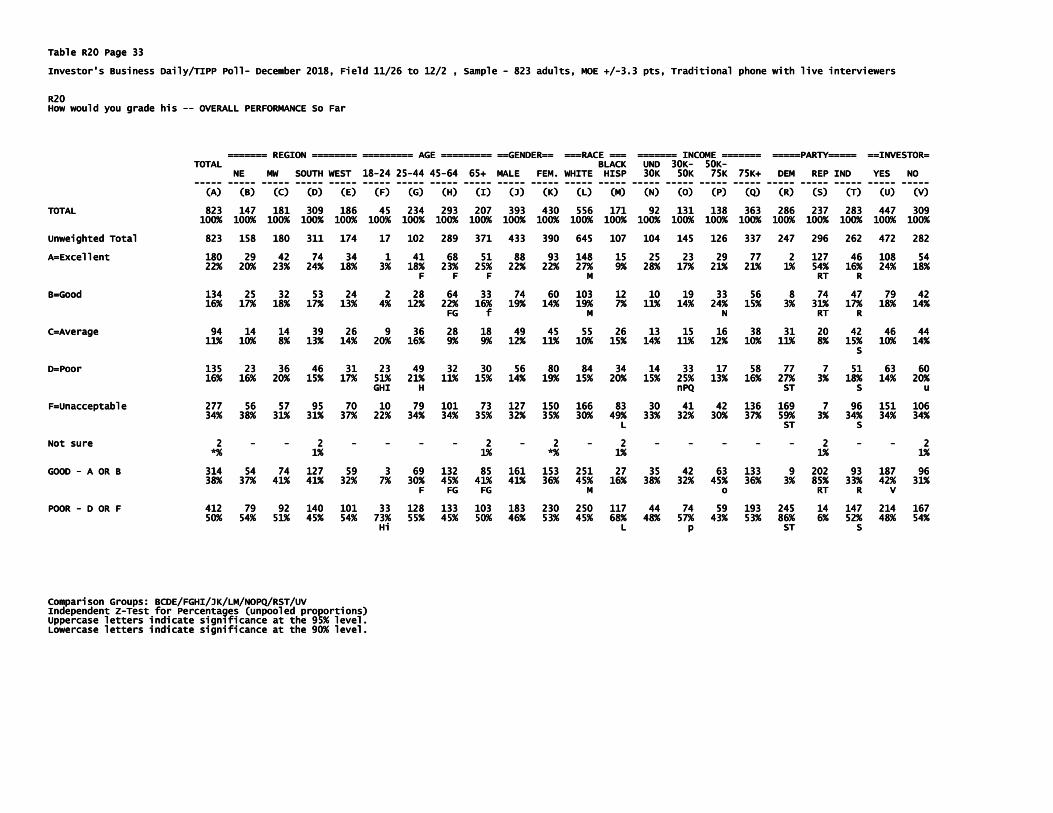
Table R20 Page 33Table R20 Page 33Table R20 Page 33Table R20 Page 33 Investor's Business Daily/TIPP PollInvestor's Business Daily/TIPP PollInvestor's Business Daily/TIPP PollInvestor's Business Daily/TIPP Poll---- December 2018, Field 11/26 to 12/2 , Sample December 2018, Field 11/26 to 12/2 , Sample December 2018, Field 11/26 to 12/2 , Sample December 2018, Field 11/26 to 12/2 , Sample ---- 823 adults, MOE +/823 adults, MOE +/823 adults, MOE +/823 adults, MOE +/----3.3 pts, Traditional phone with live interviewers 3.3 pts, Traditional phone with live interviewers 3.3 pts, Traditional phone with live interviewers 3.3 pts, Traditional phone with live interviewers R20R20R20R20 How would you grade his How would you grade his How would you grade his How would you grade his -------- OVERALL PERFORMANCE So FarOVERALL PERFORMANCE So FarOVERALL PERFORMANCE So FarOVERALL PERFORMANCE So Far ======= REGION ======== ========= AGE ========= ==GENDER== ===RACE === ======= INCOME ======= =====PARTY===== ==INVESTOR======== REGION ======== ========= AGE ========= ==GENDER== ===RACE === ======= INCOME ======= =====PARTY===== ==INVESTOR======== REGION ======== ========= AGE ========= ==GENDER== ===RACE === ======= INCOME ======= =====PARTY===== ==INVESTOR======== REGION ======== ========= AGE ========= ==GENDER== ===RACE === ======= INCOME ======= =====PARTY===== ==INVESTOR= TOTAL TOTAL TOTAL TOTAL BLACK UND 30KBLACK UND 30KBLACK UND 30KBLACK UND 30K---- 50K50K50K50K---- NE MW SOUTH WEST 18NE MW SOUTH WEST 18NE MW SOUTH WEST 18NE MW SOUTH WEST 18----24 2524 2524 2524 25----44 4544 4544 4544 45----64 65+ MALE FEM. WHITE HISP 30K 50K 75K 75K+ DEM REP IND YES NO 64 65+ MALE FEM. WHITE HISP 30K 50K 75K 75K+ DEM REP IND YES NO 64 65+ MALE FEM. WHITE HISP 30K 50K 75K 75K+ DEM REP IND YES NO 64 65+ MALE FEM. WHITE HISP 30K 50K 75K 75K+ DEM REP IND YES NO -------------------- -------------------- -------------------- -------------------- -------------------- -------------------- -------------------- -------------------- -------------------- -------------------- -------------------- -------------------- -------------------- -------------------- -------------------- -------------------- -------------------- -------------------- -------------------- -------------------- -------------------- -------------------- (A) (B) (C) (D) (E) (F) (G) (H) (I) (J) (K) (L) (M) (N) (O) (P) (Q) (R) (A) (B) (C) (D) (E) (F) (G) (H) (I) (J) (K) (L) (M) (N) (O) (P) (Q) (R) (A) (B) (C) (D) (E) (F) (G) (H) (I) (J) (K) (L) (M) (N) (O) (P) (Q) (R) (A) (B) (C) (D) (E) (F) (G) (H) (I) (J) (K) (L) (M) (N) (O) (P) (Q) (R) (S) (T) (U) (V)(S) (T) (U) (V)(S) (T) (U) (V)(S) (T) (U) (V) TOTAL 823 147 181 309 186 45 234 293 207 393 430 556 171 92 131 138 3TOTAL 823 147 181 309 186 45 234 293 207 393 430 556 171 92 131 138 3TOTAL 823 147 181 309 186 45 234 293 207 393 430 556 171 92 131 138 3TOTAL 823 147 181 309 186 45 234 293 207 393 430 556 171 92 131 138 363 286 237 283 447 30963 286 237 283 447 30963 286 237 283 447 30963 286 237 283 447 309 100% 100% 100% 100% 100% 100% 100% 100% 100% 100% 100% 100% 100% 100% 100% 100% 100% 100% 100% 100% 100% 100% 100% 100% 100% 100% 100% 100% 100% 100% 100% 100% 100% 100% 100% 100% 100% 100% 100% 100% 100% 100% 100% 100% 100% 100%100% 100% 100% 100% 100% 100% 100% 100% 100% 100% 100% 100% 100% 100%100% 100% 100% 100% 100% 100% 100% 100% 100% 100% 100% 100% 100% 100%100% 100% 100% 100% 100% 100% 100% 100% 100% 100% 100% 100% 100% 100% Unweighted Total 823 158 180 311 174 17 102 289 371 433 390 645 107 104 145 126 3Unweighted Total 823 158 180 311 174 17 102 289 371 433 390 645 107 104 145 126 3Unweighted Total 823 158 180 311 174 17 102 289 371 433 390 645 107 104 145 126 3Unweighted Total 823 158 180 311 174 17 102 289 371 433 390 645 107 104 145 126 337 247 296 262 472 28237 247 296 262 472 28237 247 296 262 472 28237 247 296 262 472 282 A=Excellent A=Excellent A=Excellent A=Excellent 180 29 42 74 34 1 41 68 51 88 93 148 15 25 23 29 77 2 127 46 108 180 29 42 74 34 1 41 68 51 88 93 148 15 25 23 29 77 2 127 46 108 180 29 42 74 34 1 41 68 51 88 93 148 15 25 23 29 77 2 127 46 108 180 29 42 74 34 1 41 68 51 88 93 148 15 25 23 29 77 2 127 46 108 54545454 22% 20% 23% 24% 18% 3% 18% 23% 25% 22% 22% 27% 9% 28% 22% 20% 23% 24% 18% 3% 18% 23% 25% 22% 22% 27% 9% 28% 22% 20% 23% 24% 18% 3% 18% 23% 25% 22% 22% 27% 9% 28% 22% 20% 23% 24% 18% 3% 18% 23% 25% 22% 22% 27% 9% 28% 17% 21% 21% 1% 54% 16% 24% 18%17% 21% 21% 1% 54% 16% 24% 18%17% 21% 21% 1% 54% 16% 24% 18%17% 21% 21% 1% 54% 16% 24% 18% F F F M RT R F F F M RT R F F F M RT R F F F M RT R B=Good 134 25 32 53 B=Good 134 25 32 53 B=Good 134 25 32 53 B=Good 134 25 32 53 24 2 28 64 33 74 60 103 12 10 19 33 56 8 74 47 79 4224 2 28 64 33 74 60 103 12 10 19 33 56 8 74 47 79 4224 2 28 64 33 74 60 103 12 10 19 33 56 8 74 47 79 4224 2 28 64 33 74 60 103 12 10 19 33 56 8 74 47 79 42 16% 17% 18% 17% 13% 4% 12% 22% 16% 19% 14% 19% 7% 11% 14% 24% 15% 3% 31% 17% 16% 17% 18% 17% 13% 4% 12% 22% 16% 19% 14% 19% 7% 11% 14% 24% 15% 3% 31% 17% 16% 17% 18% 17% 13% 4% 12% 22% 16% 19% 14% 19% 7% 11% 14% 24% 15% 3% 31% 17% 16% 17% 18% 17% 13% 4% 12% 22% 16% 19% 14% 19% 7% 11% 14% 24% 15% 3% 31% 17% 18% 14%18% 14%18% 14%18% 14% FG f M N RT R FG f M N RT R FG f M N RT R FG f M N RT R C=Average 94 14 14 39 26 9 36 28 18 49 C=Average 94 14 14 39 26 9 36 28 18 49 C=Average 94 14 14 39 26 9 36 28 18 49 C=Average 94 14 14 39 26 9 36 28 18 49 45 55 26 13 15 16 38 31 20 42 46 4445 55 26 13 15 16 38 31 20 42 46 4445 55 26 13 15 16 38 31 20 42 46 4445 55 26 13 15 16 38 31 20 42 46 44 11% 10% 8% 13% 14% 20% 16% 9% 9% 12% 11% 10% 15% 14% 11% 12% 10% 11% 8% 15% 10% 11% 10% 8% 13% 14% 20% 16% 9% 9% 12% 11% 10% 15% 14% 11% 12% 10% 11% 8% 15% 10% 11% 10% 8% 13% 14% 20% 16% 9% 9% 12% 11% 10% 15% 14% 11% 12% 10% 11% 8% 15% 10% 11% 10% 8% 13% 14% 20% 16% 9% 9% 12% 11% 10% 15% 14% 11% 12% 10% 11% 8% 15% 10% 14%14%14%14% S S S S D=Poor 135 23 36 46 31 23 49 32 30 56 80 84 34 14 33 17 D=Poor 135 23 36 46 31 23 49 32 30 56 80 84 34 14 33 17 D=Poor 135 23 36 46 31 23 49 32 30 56 80 84 34 14 33 17 D=Poor 135 23 36 46 31 23 49 32 30 56 80 84 34 14 33 17 58 77 7 51 63 6058 77 7 51 63 6058 77 7 51 63 6058 77 7 51 63 60 16% 16% 20% 15% 17% 51% 21% 11% 15% 14% 19% 15% 20% 15% 25% 13% 16% 27% 3% 18% 14% 16% 16% 20% 15% 17% 51% 21% 11% 15% 14% 19% 15% 20% 15% 25% 13% 16% 27% 3% 18% 14% 16% 16% 20% 15% 17% 51% 21% 11% 15% 14% 19% 15% 20% 15% 25% 13% 16% 27% 3% 18% 14% 16% 16% 20% 15% 17% 51% 21% 11% 15% 14% 19% 15% 20% 15% 25% 13% 16% 27% 3% 18% 14% 20%20%20%20% GHI GHI GHI GHI H nPQ ST S uH nPQ ST S uH nPQ ST S uH nPQ ST S u F=Unacceptable 277 56 57 95 70 10 79 101 73 127 150 166 83 30 41 42 1F=Unacceptable 277 56 57 95 70 10 79 101 73 127 150 166 83 30 41 42 1F=Unacceptable 277 56 57 95 70 10 79 101 73 127 150 166 83 30 41 42 1F=Unacceptable 277 56 57 95 70 10 79 101 73 127 150 166 83 30 41 42 136 169 7 96 151 10636 169 7 96 151 10636 169 7 96 151 10636 169 7 96 151 106 34% 38% 31% 31% 37% 22% 34% 34% 35% 32% 35% 30% 49% 33% 32% 30% 37% 59% 3% 34% 34% 34% 38% 31% 31% 37% 22% 34% 34% 35% 32% 35% 30% 49% 33% 32% 30% 37% 59% 3% 34% 34% 34% 38% 31% 31% 37% 22% 34% 34% 35% 32% 35% 30% 49% 33% 32% 30% 37% 59% 3% 34% 34% 34% 38% 31% 31% 37% 22% 34% 34% 35% 32% 35% 30% 49% 33% 32% 30% 37% 59% 3% 34% 34% 34%34%34%34% L ST S L ST S L ST S L ST S Not sure 2 Not sure 2 Not sure 2 Not sure 2 ---- ---- 2 2 2 2 ---- ---- ---- ---- 2 2 2 2 ---- 2 2 2 2 ---- 2 2 2 2 ---- ---- ---- ---- ---- 2 2 2 2 ---- ---- 2222 *% *% *% *% 1% 1% *% 1% 1% 1%1% 1% *% 1% 1% 1%1% 1% *% 1% 1% 1%1% 1% *% 1% 1% 1% GOOD GOOD GOOD GOOD ---- A OR B 314 54 74 127 59 3 69 132 85 161 153 251 27 35 42 63 133 A OR B 314 54 74 127 59 3 69 132 85 161 153 251 27 35 42 63 133 A OR B 314 54 74 127 59 3 69 132 85 161 153 251 27 35 42 63 133 A OR B 314 54 74 127 59 3 69 132 85 161 153 251 27 35 42 63 133 9 9 9 9 202 93 187 96202 93 187 96202 93 187 96202 93 187 96 38% 37% 41% 41% 32% 7% 30% 45% 41% 41% 36% 45% 16% 38% 32% 45% 36% 3% 85% 33% 42% 38% 37% 41% 41% 32% 7% 30% 45% 41% 41% 36% 45% 16% 38% 32% 45% 36% 3% 85% 33% 42% 38% 37% 41% 41% 32% 7% 30% 45% 41% 41% 36% 45% 16% 38% 32% 45% 36% 3% 85% 33% 42% 38% 37% 41% 41% 32% 7% 30% 45% 41% 41% 36% 45% 16% 38% 32% 45% 36% 3% 85% 33% 42% 31%31%31%31% F FG F FG F FG F FG FG M o RT R V FG M o RT R V FG M o RT R V FG M o RT R V POOR POOR POOR POOR ---- D OR F 412 79 92 140 101 33 128 133 103 183 230 250 117 44 74 59 193 24D OR F 412 79 92 140 101 33 128 133 103 183 230 250 117 44 74 59 193 24D OR F 412 79 92 140 101 33 128 133 103 183 230 250 117 44 74 59 193 24D OR F 412 79 92 140 101 33 128 133 103 183 230 250 117 44 74 59 193 245 14 147 214 1675 14 147 214 1675 14 147 214 1675 14 147 214 167 50% 54% 51% 45% 54% 73% 55% 45% 50% 46% 53% 45% 68% 48% 57% 43% 53% 86% 6% 52% 48% 50% 54% 51% 45% 54% 73% 55% 45% 50% 46% 53% 45% 68% 48% 57% 43% 53% 86% 6% 52% 48% 50% 54% 51% 45% 54% 73% 55% 45% 50% 46% 53% 45% 68% 48% 57% 43% 53% 86% 6% 52% 48% 50% 54% 51% 45% 54% 73% 55% 45% 50% 46% 53% 45% 68% 48% 57% 43% 53% 86% 6% 52% 48% 54%54%54%54% Hi L Hi L Hi L Hi L p ST S p ST S p ST S p ST S Comparison Groups: BCDE/FGHI/JK/LM/NOPQ/RST/UVComparison Groups: BCDE/FGHI/JK/LM/NOPQ/RST/UVComparison Groups: BCDE/FGHI/JK/LM/NOPQ/RST/UVComparison Groups: BCDE/FGHI/JK/LM/NOPQ/RST/UV Independent ZIndependent ZIndependent ZIndependent Z----Test for Percentages (unpooled proportions)Test for Percentages (unpooled proportions)Test for Percentages (unpooled proportions)Test for Percentages (unpooled proportions) Uppercase letters indicate significance at the 95% level.Uppercase letters indicate significance at the 95% level.Uppercase letters indicate significance at the 95% level.Uppercase letters indicate significance at the 95% level. Lowercase letters indicate significanceLowercase letters indicate significanceLowercase letters indicate significanceLowercase letters indicate significance at the 90% level.at the 90% level.at the 90% level.at the 90% level.
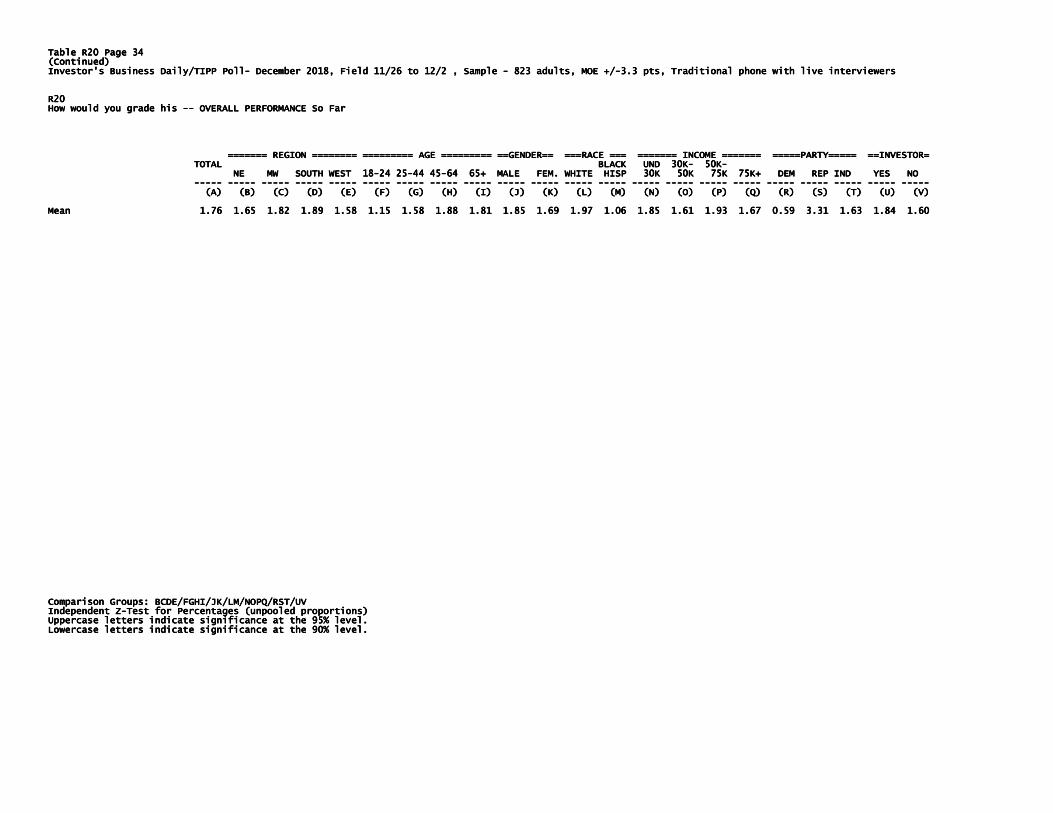
Table R20 Page 34Table R20 Page 34Table R20 Page 34Table R20 Page 34 (Continued)(Continued)(Continued)(Continued) Investor's Business Daily/TIPP PollInvestor's Business Daily/TIPP PollInvestor's Business Daily/TIPP PollInvestor's Business Daily/TIPP Poll---- December 2018, Field 11/26 to 12/2 , Sample December 2018, Field 11/26 to 12/2 , Sample December 2018, Field 11/26 to 12/2 , Sample December 2018, Field 11/26 to 12/2 , Sample ---- 823 adults, MOE +/823 adults, MOE +/823 adults, MOE +/823 adults, MOE +/----3.3 pts, Traditional phone with live interviewers 3.3 pts, Traditional phone with live interviewers 3.3 pts, Traditional phone with live interviewers 3.3 pts, Traditional phone with live interviewers R20R20R20R20 How would you grade his How would you grade his How would you grade his How would you grade his -------- OVERALL PERFORMANCE So FarOVERALL PERFORMANCE So FarOVERALL PERFORMANCE So FarOVERALL PERFORMANCE So Far ======= REGION ======== ========= AGE ========= ==GENDER== ===RACE === ======= INCOME ======= =====PARTY===== ==INVESTOR======== REGION ======== ========= AGE ========= ==GENDER== ===RACE === ======= INCOME ======= =====PARTY===== ==INVESTOR======== REGION ======== ========= AGE ========= ==GENDER== ===RACE === ======= INCOME ======= =====PARTY===== ==INVESTOR======== REGION ======== ========= AGE ========= ==GENDER== ===RACE === ======= INCOME ======= =====PARTY===== ==INVESTOR= TOTAL TOTAL TOTAL TOTAL BLACK UND 30KBLACK UND 30KBLACK UND 30KBLACK UND 30K---- 50K50K50K50K---- NE MW SOUTH WEST 18NE MW SOUTH WEST 18NE MW SOUTH WEST 18NE MW SOUTH WEST 18----24 2524 2524 2524 25----44 4544 4544 4544 45----64 65+ MALE FEM. WHITE HISP 30K 50K 75K 75K+ DEM RE64 65+ MALE FEM. WHITE HISP 30K 50K 75K 75K+ DEM RE64 65+ MALE FEM. WHITE HISP 30K 50K 75K 75K+ DEM RE64 65+ MALE FEM. WHITE HISP 30K 50K 75K 75K+ DEM REP IND YES NO P IND YES NO P IND YES NO P IND YES NO -------------------- -------------------- -------------------- -------------------- -------------------- -------------------- -------------------- -------------------- -------------------- -------------------- -------------------- -------------------- -------------------- -------------------- -------------------- -------------------- -------------------- -------------------- -------------------- -------------------- -------------------- -------------------- (A) (B) (C) (D) (E) (F) (G) (H) (I(A) (B) (C) (D) (E) (F) (G) (H) (I(A) (B) (C) (D) (E) (F) (G) (H) (I(A) (B) (C) (D) (E) (F) (G) (H) (I) (J) (K) (L) (M) (N) (O) (P) (Q) (R) (S) (T) (U) (V)) (J) (K) (L) (M) (N) (O) (P) (Q) (R) (S) (T) (U) (V)) (J) (K) (L) (M) (N) (O) (P) (Q) (R) (S) (T) (U) (V)) (J) (K) (L) (M) (N) (O) (P) (Q) (R) (S) (T) (U) (V) Mean 1.76 1.65 1.82 1.89 1.58 1.15 1.58 1.88 1.81 1.85 1.69 1.97 1.06 1.85 1.61 1.93 1.Mean 1.76 1.65 1.82 1.89 1.58 1.15 1.58 1.88 1.81 1.85 1.69 1.97 1.06 1.85 1.61 1.93 1.Mean 1.76 1.65 1.82 1.89 1.58 1.15 1.58 1.88 1.81 1.85 1.69 1.97 1.06 1.85 1.61 1.93 1.Mean 1.76 1.65 1.82 1.89 1.58 1.15 1.58 1.88 1.81 1.85 1.69 1.97 1.06 1.85 1.61 1.93 1.67 0.59 3.31 1.63 1.84 1.6067 0.59 3.31 1.63 1.84 1.6067 0.59 3.31 1.63 1.84 1.6067 0.59 3.31 1.63 1.84 1.60 Comparison Groups: BCDE/FGHI/JK/LM/NOPQ/RST/UVComparison Groups: BCDE/FGHI/JK/LM/NOPQ/RST/UVComparison Groups: BCDE/FGHI/JK/LM/NOPQ/RST/UVComparison Groups: BCDE/FGHI/JK/LM/NOPQ/RST/UV Independent ZIndependent ZIndependent ZIndependent Z----Test for Percentages (unpooled proportions)Test for Percentages (unpooled proportions)Test for Percentages (unpooled proportions)Test for Percentages (unpooled proportions) Uppercase letters indicate significance at the 95% level.Uppercase letters indicate significance at the 95% level.Uppercase letters indicate significance at the 95% level.Uppercase letters indicate significance at the 95% level. Lowercase letters indicate significance at the 90% level.Lowercase letters indicate significance at the 90% level.Lowercase letters indicate significance at the 90% level.Lowercase letters indicate significance at the 90% level.

Table R20 Page 35Table R20 Page 35Table R20 Page 35Table R20 Page 35 Investor's Business Daily/TIPP PollInvestor's Business Daily/TIPP PollInvestor's Business Daily/TIPP PollInvestor's Business Daily/TIPP Poll---- December 2018, Field 11/26 to 12/2 , Sample December 2018, Field 11/26 to 12/2 , Sample December 2018, Field 11/26 to 12/2 , Sample December 2018, Field 11/26 to 12/2 , Sample ---- 823 adults, MOE +/823 adults, MOE +/823 adults, MOE +/823 adults, MOE +/----3.3 pts, Traditional phone with live interviewers 3.3 pts, Traditional phone with live interviewers 3.3 pts, Traditional phone with live interviewers 3.3 pts, Traditional phone with live interviewers R20R20R20R20 How would you grade his How would you grade his How would you grade his How would you grade his -------- OVERALL PERFORMANCE So FarOVERALL PERFORMANCE So FarOVERALL PERFORMANCE So FarOVERALL PERFORMANCE So Far ====AREA TYPE==== ===WHITE=== ==BLK/HISP= ==MAR.STAT= ====EDUCATION==== ====IDEOLOOGY========AREA TYPE==== ===WHITE=== ==BLK/HISP= ==MAR.STAT= ====EDUCATION==== ====IDEOLOOGY========AREA TYPE==== ===WHITE=== ==BLK/HISP= ==MAR.STAT= ====EDUCATION==== ====IDEOLOOGY========AREA TYPE==== ===WHITE=== ==BLK/HISP= ==MAR.STAT= ====EDUCATION==== ====IDEOLOOGY==== SUBSUBSUBSUB---- WHITE SINGL MARR HIGH SOME WHITE SINGL MARR HIGH SOME WHITE SINGL MARR HIGH SOME WHITE SINGL MARR HIGH SOME TOTAL TOTAL TOTAL TOTAL URBAN URBAN RURAL MEN WOMEN BLACK HIS. WOMEN WOM SCHL. COLL. COLL+ CONS. MOD. LIB.URBAN URBAN RURAL MEN WOMEN BLACK HIS. WOMEN WOM SCHL. COLL. COLL+ CONS. MOD. LIB.URBAN URBAN RURAL MEN WOMEN BLACK HIS. WOMEN WOM SCHL. COLL. COLL+ CONS. MOD. LIB.URBAN URBAN RURAL MEN WOMEN BLACK HIS. WOMEN WOM SCHL. COLL. COLL+ CONS. MOD. LIB. -------------------- -------------------- -------------------- -------------------- -------------------- -------------------- -------------------- -------------------- -------------------- -------------------- -------------------- -------------------- -------------------- -------------------- -------------------- -------------------- (A) (B) (C) (A) (B) (C) (A) (B) (C) (A) (B) (C) (D) (E) (F) (G) (H) (I) (J) (K) (L) (M) (N) (O) (P)(D) (E) (F) (G) (H) (I) (J) (K) (L) (M) (N) (O) (P)(D) (E) (F) (G) (H) (I) (J) (K) (L) (M) (N) (O) (P)(D) (E) (F) (G) (H) (I) (J) (K) (L) (M) (N) (O) (P) TOTAL 823 192 400 211 267 290 118 55 182 241 157 216 430 328 247 214TOTAL 823 192 400 211 267 290 118 55 182 241 157 216 430 328 247 214TOTAL 823 192 400 211 267 290 118 55 182 241 157 216 430 328 247 214TOTAL 823 192 400 211 267 290 118 55 182 241 157 216 430 328 247 214 100% 100% 100% 100% 100%100% 100% 100% 100% 100%100% 100% 100% 100% 100%100% 100% 100% 100% 100% 100% 100% 100% 100% 100% 100% 100% 100% 100% 100% 100%100% 100% 100% 100% 100% 100% 100% 100% 100% 100% 100%100% 100% 100% 100% 100% 100% 100% 100% 100% 100% 100%100% 100% 100% 100% 100% 100% 100% 100% 100% 100% 100% Unweighted Total 823 172 385 244 340 305 73 35 178 205 161 222 417 395 233 162Unweighted Total 823 172 385 244 340 305 73 35 178 205 161 222 417 395 233 162Unweighted Total 823 172 385 244 340 305 73 35 178 205 161 222 417 395 233 162Unweighted Total 823 172 385 244 340 305 73 35 178 205 161 222 417 395 233 162 A=Excellent 180 33 65 74 75 73 A=Excellent 180 33 65 74 75 73 A=Excellent 180 33 65 74 75 73 A=Excellent 180 33 65 74 75 73 8 8 33 57 47 56 70 147 29 28 8 33 57 47 56 70 147 29 28 8 33 57 47 56 70 147 29 28 8 33 57 47 56 70 147 29 2 22% 17% 16% 35% 28% 25% 7% 15% 18% 24% 30% 26% 16% 45% 12% 1%22% 17% 16% 35% 28% 25% 7% 15% 18% 24% 30% 26% 16% 45% 12% 1%22% 17% 16% 35% 28% 25% 7% 15% 18% 24% 30% 26% 16% 45% 12% 1%22% 17% 16% 35% 28% 25% 7% 15% 18% 24% 30% 26% 16% 45% 12% 1% BC BC BC BC M M OP P M M OP P M M OP P M M OP P B=Good 134 22 67 44 55 49 6 7 19 40 22 40 69 95 33 2B=Good 134 22 67 44 55 49 6 7 19 40 22 40 69 95 33 2B=Good 134 22 67 44 55 49 6 7 19 40 22 40 69 95 33 2B=Good 134 22 67 44 55 49 6 7 19 40 22 40 69 95 33 2 16% 12% 17% 21% 20% 17% 5% 12% 10% 17% 14% 19% 16% 29% 13% 1%16% 12% 17% 21% 20% 17% 5% 12% 10% 17% 14% 19% 16% 29% 13% 1%16% 12% 17% 21% 20% 17% 5% 12% 10% 17% 14% 19% 16% 29% 13% 1%16% 12% 17% 21% 20% 17% 5% 12% 10% 17% 14% 19% 16% 29% 13% 1% B OP P B OP P B OP P B OP P C=Average C=Average C=Average C=Average 94 25 43 25 29 26 19 7 27 18 20 29 45 35 37 1694 25 43 25 29 26 19 7 27 18 20 29 45 35 37 1694 25 43 25 29 26 19 7 27 18 20 29 45 35 37 1694 25 43 25 29 26 19 7 27 18 20 29 45 35 37 16 11% 13% 11% 12% 11% 9% 16% 12% 15% 8% 13% 14% 11% 11% 15% 8%11% 13% 11% 12% 11% 9% 16% 12% 15% 8% 13% 14% 11% 11% 15% 8%11% 13% 11% 12% 11% 9% 16% 12% 15% 8% 13% 14% 11% 11% 15% 8%11% 13% 11% 12% 11% 9% 16% 12% 15% 8% 13% 14% 11% 11% 15% 8% j P j P j P j P D=Poor 135 37 75 21 33 50 21 13 36 42 27 30 76 28 39 61D=Poor 135 37 75 21 33 50 21 13 36 42 27 30 76 28 39 61D=Poor 135 37 75 21 33 50 21 13 36 42 27 30 76 28 39 61D=Poor 135 37 75 21 33 50 21 13 36 42 27 30 76 28 39 61 16% 16% 16% 16% 19% 19% 10% 13% 17% 18% 23% 20% 17% 17% 14% 18% 9% 16% 29%19% 19% 10% 13% 17% 18% 23% 20% 17% 17% 14% 18% 9% 16% 29%19% 19% 10% 13% 17% 18% 23% 20% 17% 17% 14% 18% 9% 16% 29%19% 19% 10% 13% 17% 18% 23% 20% 17% 17% 14% 18% 9% 16% 29% D D N NOD D N NOD D N NOD D N NO F=Unacceptable 277 74 151 F=Unacceptable 277 74 151 F=Unacceptable 277 74 151 F=Unacceptable 277 74 151 46 75 92 62 21 66 84 40 60 169 21 109 13246 75 92 62 21 66 84 40 60 169 21 109 13246 75 92 62 21 66 84 40 60 169 21 109 13246 75 92 62 21 66 84 40 60 169 21 109 132 34% 38% 38% 22% 28% 32% 53% 38% 36% 35% 25% 28% 39% 6% 44% 62%34% 38% 38% 22% 28% 32% 53% 38% 36% 35% 25% 28% 39% 6% 44% 62%34% 38% 38% 22% 28% 32% 53% 38% 36% 35% 25% 28% 39% 6% 44% 62%34% 38% 38% 22% 28% 32% 53% 38% 36% 35% 25% 28% 39% 6% 44% 62% D D D D D D D D KL N NOKL N NOKL N NOKL N NO Not sure 2 Not sure 2 Not sure 2 Not sure 2 ---- ---- 2 2 2 2 ---- ---- 2 2 2 2 ---- 2 2 2 2 ---- 2 2 2 2 ---- ---- 2 2 2 2 ---- ---- *% 1% 2% *% 1% 2% *% 1% 2% *% 1% 2% 1% 1% 1% 1% 1% 1% 1% 1% 1% 1% 1% 1% GOOD GOOD GOOD GOOD ---- A OR B 314 56 132 118 130 121 13 15 52 97 68 96 140 241 61 4A OR B 314 56 132 118 130 121 13 15 52 97 68 96 140 241 61 4A OR B 314 56 132 118 130 121 13 15 52 97 68 96 140 241 61 4A OR B 314 56 132 118 130 121 13 15 52 97 68 96 140 241 61 4 38% 29% 33% 56% 49% 42% 11% 27% 28%38% 29% 33% 56% 49% 42% 11% 27% 28%38% 29% 33% 56% 49% 42% 11% 27% 28%38% 29% 33% 56% 49% 42% 11% 27% 28% 40% 44% 45% 32% 74% 25% 2%40% 44% 45% 32% 74% 25% 2%40% 44% 45% 32% 74% 25% 2%40% 44% 45% 32% 74% 25% 2% BC g i m M OP P BC g i m M OP P BC g i m M OP P BC g i m M OP P POOR POOR POOR POOR ---- D OR F 412 111 226 67 108 142 84 33 102 126 6D OR F 412 111 226 67 108 142 84 33 102 126 6D OR F 412 111 226 67 108 142 84 33 102 126 6D OR F 412 111 226 67 108 142 84 33 102 126 67 90 245 49 149 1937 90 245 49 149 1937 90 245 49 149 1937 90 245 49 149 193 50% 58% 56% 32% 41% 49% 71% 61% 56% 52% 43% 42% 57% 15% 60% 90%50% 58% 56% 32% 41% 49% 71% 61% 56% 52% 43% 42% 57% 15% 60% 90%50% 58% 56% 32% 41% 49% 71% 61% 56% 52% 43% 42% 57% 15% 60% 90%50% 58% 56% 32% 41% 49% 71% 61% 56% 52% 43% 42% 57% 15% 60% 90% D D e KD D e KD D e KD D e KL N NOL N NOL N NOL N NO Comparison Groups: BCD/EF/GH/IJ/KLM/NOPComparison Groups: BCD/EF/GH/IJ/KLM/NOPComparison Groups: BCD/EF/GH/IJ/KLM/NOPComparison Groups: BCD/EF/GH/IJ/KLM/NOP Independent ZIndependent ZIndependent ZIndependent Z----Test for Percentages (unpooled proportions)Test for Percentages (unpooled proportions)Test for Percentages (unpooled proportions)Test for Percentages (unpooled proportions) Uppercase letters indicate significance at the 95% level.Uppercase letters indicate significance at the 95% level.Uppercase letters indicate significance at the 95% level.Uppercase letters indicate significance at the 95% level. Lowercase letters indicate significance at the 90% level.Lowercase letters indicate significance at the 90% level.Lowercase letters indicate significance at the 90% level.Lowercase letters indicate significance at the 90% level.

Table R20 Page 36Table R20 Page 36Table R20 Page 36Table R20 Page 36 (Continued)(Continued)(Continued)(Continued) Investor's Business Daily/TIPP PollInvestor's Business Daily/TIPP PollInvestor's Business Daily/TIPP PollInvestor's Business Daily/TIPP Poll---- December 2018, Field 11/26 to 12/2 , Sample December 2018, Field 11/26 to 12/2 , Sample December 2018, Field 11/26 to 12/2 , Sample December 2018, Field 11/26 to 12/2 , Sample ---- 823 adults, MOE +/823 adults, MOE +/823 adults, MOE +/823 adults, MOE +/----3.3 pts, Traditional phone with live interviewers 3.3 pts, Traditional phone with live interviewers 3.3 pts, Traditional phone with live interviewers 3.3 pts, Traditional phone with live interviewers R20R20R20R20 How would you grade his How would you grade his How would you grade his How would you grade his -------- OVERALL PERFORMANCE So FarOVERALL PERFORMANCE So FarOVERALL PERFORMANCE So FarOVERALL PERFORMANCE So Far ====AREA TYPE==== ===WHITE=== ==BLK/HISP= ==MAR.STAT= ====EDUCATION==== ====IDEOLOOGY========AREA TYPE==== ===WHITE=== ==BLK/HISP= ==MAR.STAT= ====EDUCATION==== ====IDEOLOOGY========AREA TYPE==== ===WHITE=== ==BLK/HISP= ==MAR.STAT= ====EDUCATION==== ====IDEOLOOGY========AREA TYPE==== ===WHITE=== ==BLK/HISP= ==MAR.STAT= ====EDUCATION==== ====IDEOLOOGY==== SUBSUBSUBSUB---- WHITE SINGL MARR HIGH SOME WHITE SINGL MARR HIGH SOME WHITE SINGL MARR HIGH SOME WHITE SINGL MARR HIGH SOME TOTAL URBAN URBAN RURAL MEN WOMEN BLACK HIS. WOMEN WOM SCHL. COLL. COLL+ CONS. MOD. LIB.TOTAL URBAN URBAN RURAL MEN WOMEN BLACK HIS. WOMEN WOM SCHL. COLL. COLL+ CONS. MOD. LIB.TOTAL URBAN URBAN RURAL MEN WOMEN BLACK HIS. WOMEN WOM SCHL. COLL. COLL+ CONS. MOD. LIB.TOTAL URBAN URBAN RURAL MEN WOMEN BLACK HIS. WOMEN WOM SCHL. COLL. COLL+ CONS. MOD. LIB. -------------------- -------------------- -------------------- -------------------- -------------------- -------------------- -------------------- -------------------- -------------------- -------------------- -------------------- -------------------- -------------------- -------------------- -------------------- -------------------- (A) (A) (A) (A) (B) (C) (D) (E) (F) (G) (H) (I) (J) (K) (L) (M) (N) (O) (P)(B) (C) (D) (E) (F) (G) (H) (I) (J) (K) (L) (M) (N) (O) (P)(B) (C) (D) (E) (F) (G) (H) (I) (J) (K) (L) (M) (N) (O) (P)(B) (C) (D) (E) (F) (G) (H) (I) (J) (K) (L) (M) (N) (O) (P) Mean 1.76 1.50 1.55 2.38 2.08 1.86 0.92 1.43 1.54 1.77 2.05 2.01 1.52 2.98 1.32 0.51Mean 1.76 1.50 1.55 2.38 2.08 1.86 0.92 1.43 1.54 1.77 2.05 2.01 1.52 2.98 1.32 0.51Mean 1.76 1.50 1.55 2.38 2.08 1.86 0.92 1.43 1.54 1.77 2.05 2.01 1.52 2.98 1.32 0.51Mean 1.76 1.50 1.55 2.38 2.08 1.86 0.92 1.43 1.54 1.77 2.05 2.01 1.52 2.98 1.32 0.51 Comparison Groups: BCD/EF/GH/IJ/KLM/NOPComparison Groups: BCD/EF/GH/IJ/KLM/NOPComparison Groups: BCD/EF/GH/IJ/KLM/NOPComparison Groups: BCD/EF/GH/IJ/KLM/NOP Independent ZIndependent ZIndependent ZIndependent Z----Test for Percentages (unpooled proportions)Test for Percentages (unpooled proportions)Test for Percentages (unpooled proportions)Test for Percentages (unpooled proportions) Uppercase letters indicate significance at the 95% level.Uppercase letters indicate significance at the 95% level.Uppercase letters indicate significance at the 95% level.Uppercase letters indicate significance at the 95% level. Lowercase letters indicate significance at the 90% level.Lowercase letters indicate significance at the 90% level.Lowercase letters indicate significance at the 90% level.Lowercase letters indicate significance at the 90% level.

Table E1 Page 37Table E1 Page 37Table E1 Page 37Table E1 Page 37 Investor's Business DaiInvestor's Business DaiInvestor's Business DaiInvestor's Business Daily/TIPP Pollly/TIPP Pollly/TIPP Pollly/TIPP Poll---- December 2018, Field 11/26 to 12/2 , Sample December 2018, Field 11/26 to 12/2 , Sample December 2018, Field 11/26 to 12/2 , Sample December 2018, Field 11/26 to 12/2 , Sample ---- 823 adults, MOE +/823 adults, MOE +/823 adults, MOE +/823 adults, MOE +/----3.3 pts, Traditional phone with live interviewers 3.3 pts, Traditional phone with live interviewers 3.3 pts, Traditional phone with live interviewers 3.3 pts, Traditional phone with live interviewers E1E1E1E1 Do you think that the U.S. economy is currently in a recession or not?Do you think that the U.S. economy is currently in a recession or not?Do you think that the U.S. economy is currently in a recession or not?Do you think that the U.S. economy is currently in a recession or not? ======= REGION ======== ========= AGE ========= ==GENDER== ===RACE === ======= INCOME ======= =====PARTY===== ==INVESTOR======== REGION ======== ========= AGE ========= ==GENDER== ===RACE === ======= INCOME ======= =====PARTY===== ==INVESTOR======== REGION ======== ========= AGE ========= ==GENDER== ===RACE === ======= INCOME ======= =====PARTY===== ==INVESTOR======== REGION ======== ========= AGE ========= ==GENDER== ===RACE === ======= INCOME ======= =====PARTY===== ==INVESTOR= TOTAL TOTAL TOTAL TOTAL BLACK UND 30KBLACK UND 30KBLACK UND 30KBLACK UND 30K---- 50K50K50K50K---- NE MW SOUTH WEST 18NE MW SOUTH WEST 18NE MW SOUTH WEST 18NE MW SOUTH WEST 18----24 2524 2524 2524 25----44 4544 4544 4544 45----64 65+ MALE FEM. WHITE HISP 30K 50K 75K 75K+ DEM REP IND YES NO 64 65+ MALE FEM. WHITE HISP 30K 50K 75K 75K+ DEM REP IND YES NO 64 65+ MALE FEM. WHITE HISP 30K 50K 75K 75K+ DEM REP IND YES NO 64 65+ MALE FEM. WHITE HISP 30K 50K 75K 75K+ DEM REP IND YES NO -------------------- -------------------- -------------------- -------------------- -------------------- -------------------- -------------------- -------------------- -------------------- -------------------- -------------------- -------------------- -------------------- -------------------- -------------------- -------------------- -------------------- -------------------- -------------------- -------------------- -------------------- -------------------- (A) (B) (C) (D) (E) (F) (G) (H) (I) (J) (K) (L) (M) (N) (O) (P) (Q) (R) (A) (B) (C) (D) (E) (F) (G) (H) (I) (J) (K) (L) (M) (N) (O) (P) (Q) (R) (A) (B) (C) (D) (E) (F) (G) (H) (I) (J) (K) (L) (M) (N) (O) (P) (Q) (R) (A) (B) (C) (D) (E) (F) (G) (H) (I) (J) (K) (L) (M) (N) (O) (P) (Q) (R) (S) (T) (U) (V)(S) (T) (U) (V)(S) (T) (U) (V)(S) (T) (U) (V) TOTAL 823 147 181 309 186 45 234 293 207 393 430 556 171 92 131 138 3TOTAL 823 147 181 309 186 45 234 293 207 393 430 556 171 92 131 138 3TOTAL 823 147 181 309 186 45 234 293 207 393 430 556 171 92 131 138 3TOTAL 823 147 181 309 186 45 234 293 207 393 430 556 171 92 131 138 363 286 237 283 447 30963 286 237 283 447 30963 286 237 283 447 30963 286 237 283 447 309 100% 100% 100% 100% 100% 100% 100% 100% 100% 100% 100% 100% 100% 100% 100% 100% 100% 100% 100% 100% 100% 100% 100% 100% 100% 100% 100% 100% 100% 100% 100% 100% 100% 100% 100% 100% 100% 100% 100% 100% 100% 100% 100% 100% 100% 100%100% 100% 100% 100% 100% 100% 100% 100% 100% 100% 100% 100% 100% 100%100% 100% 100% 100% 100% 100% 100% 100% 100% 100% 100% 100% 100% 100%100% 100% 100% 100% 100% 100% 100% 100% 100% 100% 100% 100% 100% 100% Unweighted Total 823 158 180 311 174 17 102 289 371 433 390 645 107 104 145 126 3Unweighted Total 823 158 180 311 174 17 102 289 371 433 390 645 107 104 145 126 3Unweighted Total 823 158 180 311 174 17 102 289 371 433 390 645 107 104 145 126 3Unweighted Total 823 158 180 311 174 17 102 289 371 433 390 645 107 104 145 126 337 247 296 262 472 28237 247 296 262 472 28237 247 296 262 472 28237 247 296 262 472 282 In a recessioIn a recessioIn a recessioIn a recession 126 20 30 61 15 14 49 38 20 49 77 68 47 26 29 19 32 69 1n 126 20 30 61 15 14 49 38 20 49 77 68 47 26 29 19 32 69 1n 126 20 30 61 15 14 49 38 20 49 77 68 47 26 29 19 32 69 1n 126 20 30 61 15 14 49 38 20 49 77 68 47 26 29 19 32 69 10 44 29 800 44 29 800 44 29 800 44 29 80 15% 13% 17% 20% 8% 32% 21% 13% 10% 12% 18% 12% 28% 28% 15% 13% 17% 20% 8% 32% 21% 13% 10% 12% 18% 12% 28% 28% 15% 13% 17% 20% 8% 32% 21% 13% 10% 12% 18% 12% 28% 28% 15% 13% 17% 20% 8% 32% 21% 13% 10% 12% 18% 12% 28% 28% 22% 14% 9% 24% 4% 16% 7% 26%22% 14% 9% 24% 4% 16% 7% 26%22% 14% 9% 24% 4% 16% 7% 26%22% 14% 9% 24% 4% 16% 7% 26% E E i hI j L PQ pQ ST S UE E i hI j L PQ pQ ST S UE E i hI j L PQ pQ ST S UE E i hI j L PQ pQ ST S U Not in a recession 644 118 141 235 Not in a recession 644 118 141 235 Not in a recession 644 118 141 235 Not in a recession 644 118 141 235 151 27 175 241 167 328 316 450 118 63 92 109 319 192 220 220 397 203151 27 175 241 167 328 316 450 118 63 92 109 319 192 220 220 397 203151 27 175 241 167 328 316 450 118 63 92 109 319 192 220 220 397 203151 27 175 241 167 328 316 450 118 63 92 109 319 192 220 220 397 203 78% 81% 78% 76% 81% 60% 75% 82% 80% 83% 74% 81% 69% 68% 70% 79% 88% 67% 93% 78% 78% 81% 78% 76% 81% 60% 75% 82% 80% 83% 74% 81% 69% 68% 70% 79% 88% 67% 93% 78% 78% 81% 78% 76% 81% 60% 75% 82% 80% 83% 74% 81% 69% 68% 70% 79% 88% 67% 93% 78% 78% 81% 78% 76% 81% 60% 75% 82% 80% 83% 74% 81% 69% 68% 70% 79% 88% 67% 93% 78% 89% 66%89% 66%89% 66%89% 66% f K M NOp RT R V f K M NOp RT R V f K M NOp RT R V f K M NOp RT R V Not sure 51 8 10 13 20 3 10 14 20 16 Not sure 51 8 10 13 20 3 10 14 20 16 Not sure 51 8 10 13 20 3 10 14 20 16 Not sure 51 8 10 13 20 3 10 14 20 16 36 39 6 3 10 10 12 25 7 19 21 2636 39 6 3 10 10 12 25 7 19 21 2636 39 6 3 10 10 12 25 7 19 21 2636 39 6 3 10 10 12 25 7 19 21 26 6% 5% 6% 4% 11% 8% 4% 5% 10% 4% 8% 7% 3% 4% 8% 7% 3% 9% 3% 7% 5% 6% 5% 6% 4% 11% 8% 4% 5% 10% 4% 8% 7% 3% 4% 8% 7% 3% 9% 3% 7% 5% 6% 5% 6% 4% 11% 8% 4% 5% 10% 4% 8% 7% 3% 4% 8% 7% 3% 9% 3% 7% 5% 6% 5% 6% 4% 11% 8% 4% 5% 10% 4% 8% 7% 3% 4% 8% 7% 3% 9% 3% 7% 5% 8%8%8%8% D gH j S D gH j S D gH j S D gH j S Refused 1 1 Refused 1 1 Refused 1 1 Refused 1 1 ---- ---- ---- ---- ---- ---- 1 1 1 1 ---- 1 1 1 1 ---- ---- ---- ---- ---- ---- 1 1 1 1 ---- ---- ---- ---- *% 1% *% *% *% *% 1% *% *% *% *% 1% *% *% *% *% 1% *% *% *% Comparison Groups: BCDE/FGHI/JK/LM/NOPQ/RST/UVComparison Groups: BCDE/FGHI/JK/LM/NOPQ/RST/UVComparison Groups: BCDE/FGHI/JK/LM/NOPQ/RST/UVComparison Groups: BCDE/FGHI/JK/LM/NOPQ/RST/UV Independent ZIndependent ZIndependent ZIndependent Z----Test for Percentages (unpooled proportions)Test for Percentages (unpooled proportions)Test for Percentages (unpooled proportions)Test for Percentages (unpooled proportions) Uppercase letters indicate significance at the 95% level.Uppercase letters indicate significance at the 95% level.Uppercase letters indicate significance at the 95% level.Uppercase letters indicate significance at the 95% level. Lowercase letters indicate significance at the 90% level.Lowercase letters indicate significance at the 90% level.Lowercase letters indicate significance at the 90% level.Lowercase letters indicate significance at the 90% level.

Table E1 Page 38Table E1 Page 38Table E1 Page 38Table E1 Page 38 Investor's BusinInvestor's BusinInvestor's BusinInvestor's Business Daily/TIPP Polless Daily/TIPP Polless Daily/TIPP Polless Daily/TIPP Poll---- December 2018, Field 11/26 to 12/2 , Sample December 2018, Field 11/26 to 12/2 , Sample December 2018, Field 11/26 to 12/2 , Sample December 2018, Field 11/26 to 12/2 , Sample ---- 823 adults, MOE +/823 adults, MOE +/823 adults, MOE +/823 adults, MOE +/----3.3 pts, Traditional phone with live interviewers 3.3 pts, Traditional phone with live interviewers 3.3 pts, Traditional phone with live interviewers 3.3 pts, Traditional phone with live interviewers E1E1E1E1 Do you think that the U.S. economy is currently in a recession or not?Do you think that the U.S. economy is currently in a recession or not?Do you think that the U.S. economy is currently in a recession or not?Do you think that the U.S. economy is currently in a recession or not? ====AREA TYPE==== ===WHITE=== ==BLK/HISP= ==MAR.STAT= ====EDUCATION==== ====IDEOLOOGY========AREA TYPE==== ===WHITE=== ==BLK/HISP= ==MAR.STAT= ====EDUCATION==== ====IDEOLOOGY========AREA TYPE==== ===WHITE=== ==BLK/HISP= ==MAR.STAT= ====EDUCATION==== ====IDEOLOOGY========AREA TYPE==== ===WHITE=== ==BLK/HISP= ==MAR.STAT= ====EDUCATION==== ====IDEOLOOGY==== SUBSUBSUBSUB---- WHITE SINGL MARR HIGH SOME WHITE SINGL MARR HIGH SOME WHITE SINGL MARR HIGH SOME WHITE SINGL MARR HIGH SOME TOTAL URBAN URBAN RURAL MEN WOMEN BLACK HIS. WOMEN WOM SCHL. COLL. COLL+ CONS. MOD. LIB.TOTAL URBAN URBAN RURAL MEN WOMEN BLACK HIS. WOMEN WOM SCHL. COLL. COLL+ CONS. MOD. LIB.TOTAL URBAN URBAN RURAL MEN WOMEN BLACK HIS. WOMEN WOM SCHL. COLL. COLL+ CONS. MOD. LIB.TOTAL URBAN URBAN RURAL MEN WOMEN BLACK HIS. WOMEN WOM SCHL. COLL. COLL+ CONS. MOD. LIB. -------------------- -------------------- -------------------- -------------------- -------------------- -------------------- -------------------- -------------------- -------------------- -------------------- -------------------- -------------------- -------------------- -------------------- -------------------- -------------------- (A) (B) (C) (D) (E) (F) (G) (H) (I) (J) (K) (L) (M) (N) (O) (P)(A) (B) (C) (D) (E) (F) (G) (H) (I) (J) (K) (L) (M) (N) (O) (P)(A) (B) (C) (D) (E) (F) (G) (H) (I) (J) (K) (L) (M) (N) (O) (P)(A) (B) (C) (D) (E) (F) (G) (H) (I) (J) (K) (L) (M) (N) (O) (P) TOTAL 823 192 400 211 267 290 118 55 182 241 157 216 430 328 247 214TOTAL 823 192 400 211 267 290 118 55 182 241 157 216 430 328 247 214TOTAL 823 192 400 211 267 290 118 55 182 241 157 216 430 328 247 214TOTAL 823 192 400 211 267 290 118 55 182 241 157 216 430 328 247 214 100% 10100% 10100% 10100% 100% 100% 100% 100% 100% 100% 100% 100% 100% 100% 100% 100% 100% 100% 100%0% 100% 100% 100% 100% 100% 100% 100% 100% 100% 100% 100% 100% 100% 100%0% 100% 100% 100% 100% 100% 100% 100% 100% 100% 100% 100% 100% 100% 100%0% 100% 100% 100% 100% 100% 100% 100% 100% 100% 100% 100% 100% 100% 100% Unweighted Total 823 172 385 244 340 305 73 35 178 205 161 222 417 395 233 162Unweighted Total 823 172 385 244 340 305 73 35 178 205 161 222 417 395 233 162Unweighted Total 823 172 385 244 340 305 73 35 178 205 161 222 417 395 233 162Unweighted Total 823 172 385 244 340 305 73 35 178 205 161 222 417 395 233 162 In a recession 126 46 51 In a recession 126 46 51 In a recession 126 46 51 In a recession 126 46 51 25 31 37 40 7 47 29 38 27 56 37 32 4825 31 37 40 7 47 29 38 27 56 37 32 4825 31 37 40 7 47 29 38 27 56 37 32 4825 31 37 40 7 47 29 38 27 56 37 32 48 15% 24% 13% 12% 12% 13% 34% 13% 26% 12% 24% 12% 13% 11% 13% 22%15% 24% 13% 12% 12% 13% 34% 13% 26% 12% 24% 12% 13% 11% 13% 22%15% 24% 13% 12% 12% 13% 34% 13% 26% 12% 24% 12% 13% 11% 13% 22%15% 24% 13% 12% 12% 13% 34% 13% 26% 12% 24% 12% 13% 11% 13% 22% CD CD CD CD H J LM NOH J LM NOH J LM NOH J LM NO Not in a recession 644 134 321 175 225 225 75 45 123 189 108 168 354 277 200 145Not in a recession 644 134 321 175 225 225 75 45 123 189 108 168 354 277 200 145Not in a recession 644 134 321 175 225 225 75 45 123 189 108 168 354 277 200 145Not in a recession 644 134 321 175 225 225 75 45 123 189 108 168 354 277 200 145 78% 70% 80% 83% 84% 78% 63% 78% 70% 80% 83% 84% 78% 63% 78% 70% 80% 83% 84% 78% 63% 78% 70% 80% 83% 84% 78% 63% 81% 68% 79% 69% 78% 82% 84% 81% 68%81% 68% 79% 69% 78% 82% 84% 81% 68%81% 68% 79% 69% 78% 82% 84% 81% 68%81% 68% 79% 69% 78% 82% 84% 81% 68% B B f G i K P P B B f G i K P P B B f G i K P P B B f G i K P P Not sure 51 12 28 11 11 28 3 3 12Not sure 51 12 28 11 11 28 3 3 12Not sure 51 12 28 11 11 28 3 3 12Not sure 51 12 28 11 11 28 3 3 12 21 10 21 19 14 14 2121 10 21 19 14 14 2121 10 21 19 14 14 2121 10 21 19 14 14 21 6% 6% 7% 5% 4% 10% 2% 6% 7% 9% 7% 10% 5% 4% 6% 10%6% 6% 7% 5% 4% 10% 2% 6% 7% 9% 7% 10% 5% 4% 6% 10%6% 6% 7% 5% 4% 10% 2% 6% 7% 9% 7% 10% 5% 4% 6% 10%6% 6% 7% 5% 4% 10% 2% 6% 7% 9% 7% 10% 5% 4% 6% 10% e m e m e m e m Refused 1 1 Refused 1 1 Refused 1 1 Refused 1 1 ---- ---- ---- ---- ---- ---- ---- 1 1 1 1 ---- ---- 1 1 1 1 ---- 1 1 1 1 ---- *% *% *% *% *% *% *% *% *% *% *% *% *% *% *% *% *% *% *% *% Comparison Groups: BCD/EF/GH/IJ/KLM/NOPComparison Groups: BCD/EF/GH/IJ/KLM/NOPComparison Groups: BCD/EF/GH/IJ/KLM/NOPComparison Groups: BCD/EF/GH/IJ/KLM/NOP Independent ZIndependent ZIndependent ZIndependent Z----Test for Percentages (unpooled proportions)Test for Percentages (unpooled proportions)Test for Percentages (unpooled proportions)Test for Percentages (unpooled proportions) Uppercase letters indicate significance at the 95% level.Uppercase letters indicate significance at the 95% level.Uppercase letters indicate significance at the 95% level.Uppercase letters indicate significance at the 95% level. Lowercase letters indicate significance at the 90% level.Lowercase letters indicate significance at the 90% level.Lowercase letters indicate significance at the 90% level.Lowercase letters indicate significance at the 90% level.
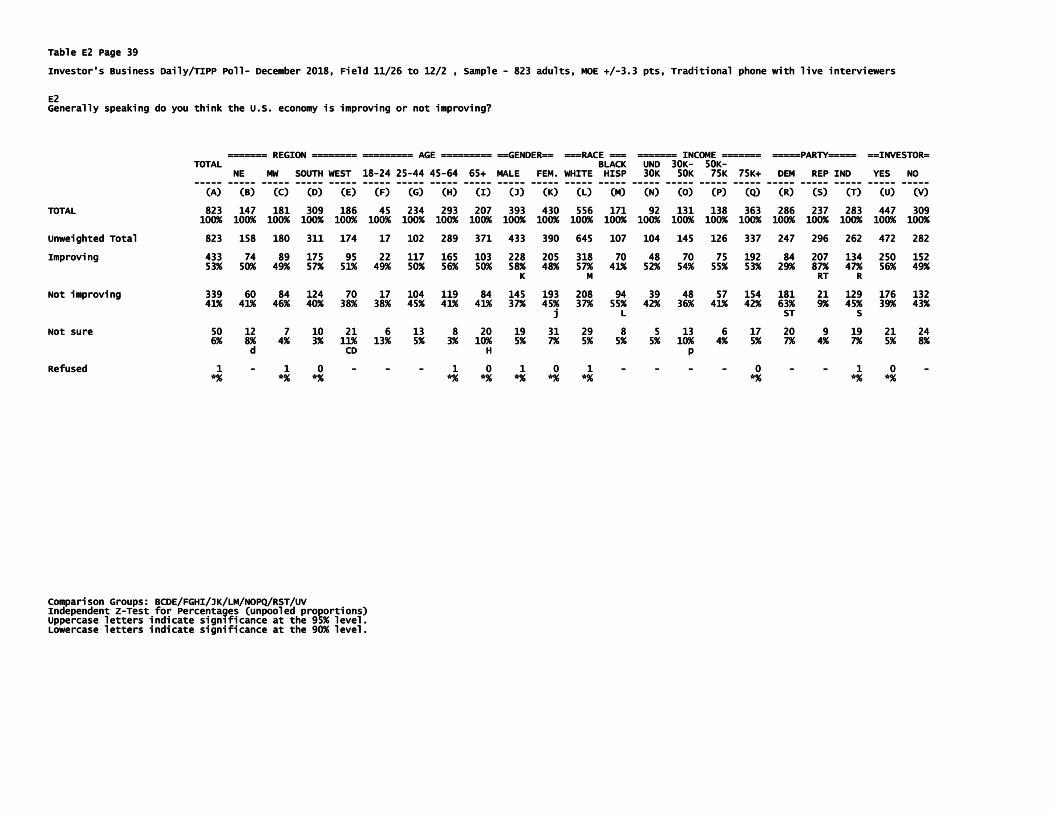
Table E2 Page 39Table E2 Page 39Table E2 Page 39Table E2 Page 39 Investor's Business Daily/TIPP PollInvestor's Business Daily/TIPP PollInvestor's Business Daily/TIPP PollInvestor's Business Daily/TIPP Poll---- December 2018, Field 11/26 to 12/2 , Sample December 2018, Field 11/26 to 12/2 , Sample December 2018, Field 11/26 to 12/2 , Sample December 2018, Field 11/26 to 12/2 , Sample ---- 823 adults, MOE +/823 adults, MOE +/823 adults, MOE +/823 adults, MOE +/----3.3 pts, Traditiona3.3 pts, Traditiona3.3 pts, Traditiona3.3 pts, Traditional phone with live interviewers l phone with live interviewers l phone with live interviewers l phone with live interviewers E2E2E2E2 Generally speaking do you think the U.S. economy is improving or not improving?Generally speaking do you think the U.S. economy is improving or not improving?Generally speaking do you think the U.S. economy is improving or not improving?Generally speaking do you think the U.S. economy is improving or not improving? ======= REGION ======== ========= AGE ========= ==GENDER== ===RACE === ======= INCOME ======= =====P======= REGION ======== ========= AGE ========= ==GENDER== ===RACE === ======= INCOME ======= =====P======= REGION ======== ========= AGE ========= ==GENDER== ===RACE === ======= INCOME ======= =====P======= REGION ======== ========= AGE ========= ==GENDER== ===RACE === ======= INCOME ======= =====PARTY===== ==INVESTOR=ARTY===== ==INVESTOR=ARTY===== ==INVESTOR=ARTY===== ==INVESTOR= TOTAL BLACK UND 30KTOTAL BLACK UND 30KTOTAL BLACK UND 30KTOTAL BLACK UND 30K---- 50K50K50K50K---- NE MW SOUTH WEST 18NE MW SOUTH WEST 18NE MW SOUTH WEST 18NE MW SOUTH WEST 18----24 2524 2524 2524 25----44 4544 4544 4544 45----64 64 64 64 65+ MALE FEM. WHITE HISP 30K 50K 75K 75K+ DEM REP IND YES NO 65+ MALE FEM. WHITE HISP 30K 50K 75K 75K+ DEM REP IND YES NO 65+ MALE FEM. WHITE HISP 30K 50K 75K 75K+ DEM REP IND YES NO 65+ MALE FEM. WHITE HISP 30K 50K 75K 75K+ DEM REP IND YES NO -------------------- -------------------- -------------------- -------------------- -------------------- -------------------- -------------------- -------------------- -------------------- -------------------- -------------------- -------------------- -------------------- -------------------- -------------------- -------------------- -------------------- -------------------- -------------------- -------------------- -------------------- -------------------- (A) (B) (C) (D) (E) (F) (G) (H) (I) (J) (K) (L) (M) (N) (O) (P) (Q) (R) (S) (T) (U) (A) (B) (C) (D) (E) (F) (G) (H) (I) (J) (K) (L) (M) (N) (O) (P) (Q) (R) (S) (T) (U) (A) (B) (C) (D) (E) (F) (G) (H) (I) (J) (K) (L) (M) (N) (O) (P) (Q) (R) (S) (T) (U) (A) (B) (C) (D) (E) (F) (G) (H) (I) (J) (K) (L) (M) (N) (O) (P) (Q) (R) (S) (T) (U) (V)(V)(V)(V) TOTAL 823 147 181 309 186 45 234 293 207 393 430 556 171 92 TOTAL 823 147 181 309 186 45 234 293 207 393 430 556 171 92 TOTAL 823 147 181 309 186 45 234 293 207 393 430 556 171 92 TOTAL 823 147 181 309 186 45 234 293 207 393 430 556 171 92 131 138 363 286 237 283 447 309131 138 363 286 237 283 447 309131 138 363 286 237 283 447 309131 138 363 286 237 283 447 309 100% 100% 100% 100% 100% 100% 100% 100% 100% 100% 100% 100% 100% 100% 100% 100% 100% 100% 100% 100% 100% 100% 100% 100% 100% 100% 100% 100% 100% 100% 100% 100% 100% 100% 100% 100% 100% 100% 100% 100% 100% 100% 100% 100% 100% 100% 100% 100% 100% 100% 100% 100% 100% 100% 100% 100% 100% 100% 100% 100% 100% 100% 100% 100% 100% 100% 100% 100% 100% 100% 100% 100% 100% 100% 100% 100% 100% 100% 100% 100% 100% 100% 100% 100% 100%100%100%100% Unweighted Total 823 158 180 311 Unweighted Total 823 158 180 311 Unweighted Total 823 158 180 311 Unweighted Total 823 158 180 311 174 17 102 289 371 433 390 645 107 104 145 126 337 247 296 262 472 282174 17 102 289 371 433 390 645 107 104 145 126 337 247 296 262 472 282174 17 102 289 371 433 390 645 107 104 145 126 337 247 296 262 472 282174 17 102 289 371 433 390 645 107 104 145 126 337 247 296 262 472 282 Improving 433 74 89 175 95 22 117 165 103 228 205 318 70 48 70 75 1Improving 433 74 89 175 95 22 117 165 103 228 205 318 70 48 70 75 1Improving 433 74 89 175 95 22 117 165 103 228 205 318 70 48 70 75 1Improving 433 74 89 175 95 22 117 165 103 228 205 318 70 48 70 75 192 84 207 134 92 84 207 134 92 84 207 134 92 84 207 134 250 152250 152250 152250 152 53% 50% 49% 57% 51% 49% 50% 56% 50% 58% 48% 57% 41% 52% 54% 55% 53% 29% 87% 47% 56% 53% 50% 49% 57% 51% 49% 50% 56% 50% 58% 48% 57% 41% 52% 54% 55% 53% 29% 87% 47% 56% 53% 50% 49% 57% 51% 49% 50% 56% 50% 58% 48% 57% 41% 52% 54% 55% 53% 29% 87% 47% 56% 53% 50% 49% 57% 51% 49% 50% 56% 50% 58% 48% 57% 41% 52% 54% 55% 53% 29% 87% 47% 56% 49%49%49%49% K K K K M RT R M RT R M RT R M RT R Not improving 339 60 84 124 70 17 104 119 84 145 193 208 94 39 48 57 1Not improving 339 60 84 124 70 17 104 119 84 145 193 208 94 39 48 57 1Not improving 339 60 84 124 70 17 104 119 84 145 193 208 94 39 48 57 1Not improving 339 60 84 124 70 17 104 119 84 145 193 208 94 39 48 57 154 181 21 129 176 13254 181 21 129 176 13254 181 21 129 176 13254 181 21 129 176 132 41% 41% 46% 40% 38% 38% 45% 41% 41% 37% 45% 37% 55% 42% 36% 41% 42% 63% 9% 45% 39% 41% 41% 46% 40% 38% 38% 45% 41% 41% 37% 45% 37% 55% 42% 36% 41% 42% 63% 9% 45% 39% 41% 41% 46% 40% 38% 38% 45% 41% 41% 37% 45% 37% 55% 42% 36% 41% 42% 63% 9% 45% 39% 41% 41% 46% 40% 38% 38% 45% 41% 41% 37% 45% 37% 55% 42% 36% 41% 42% 63% 9% 45% 39% 43%43%43%43% j j j j L ST S L ST S L ST S L ST S Not sure 50 12 7 10 21 6 13 8 20 19 31 29 8 5 13 6 Not sure 50 12 7 10 21 6 13 8 20 19 31 29 8 5 13 6 Not sure 50 12 7 10 21 6 13 8 20 19 31 29 8 5 13 6 Not sure 50 12 7 10 21 6 13 8 20 19 31 29 8 5 13 6 17 20 9 19 21 2417 20 9 19 21 2417 20 9 19 21 2417 20 9 19 21 24 6% 8%6% 8%6% 8%6% 8% 4% 3% 11% 13% 5% 3% 10% 5% 7% 5% 5% 5% 10% 4% 5% 7% 4% 7% 5% 8%4% 3% 11% 13% 5% 3% 10% 5% 7% 5% 5% 5% 10% 4% 5% 7% 4% 7% 5% 8%4% 3% 11% 13% 5% 3% 10% 5% 7% 5% 5% 5% 10% 4% 5% 7% 4% 7% 5% 8%4% 3% 11% 13% 5% 3% 10% 5% 7% 5% 5% 5% 10% 4% 5% 7% 4% 7% 5% 8% d CD H p d CD H p d CD H p d CD H p Refused 1 Refused 1 Refused 1 Refused 1 ---- 1 0 1 0 1 0 1 0 ---- ---- ---- 1 0 1 0 1 1 0 1 0 1 1 0 1 0 1 1 0 1 0 1 ---- ---- ---- ---- 0 0 0 0 ---- ---- 1 0 1 0 1 0 1 0 ---- *% *% *% *% *% *% *% *% *% *% *% *% *% *% *% *% *% *% *% *% *% *% *% *% *% *% *% *% *% *% *% *% *% *% *% *% *% *% *% *% *% *% *% *% Comparison Groups: BCDE/FGHI/JK/LM/NOPQ/RST/UVComparison Groups: BCDE/FGHI/JK/LM/NOPQ/RST/UVComparison Groups: BCDE/FGHI/JK/LM/NOPQ/RST/UVComparison Groups: BCDE/FGHI/JK/LM/NOPQ/RST/UV Independent ZIndependent ZIndependent ZIndependent Z----Test for Percentages (unpooled proportions)Test for Percentages (unpooled proportions)Test for Percentages (unpooled proportions)Test for Percentages (unpooled proportions) Uppercase letters indicate significance at the 95% level.Uppercase letters indicate significance at the 95% level.Uppercase letters indicate significance at the 95% level.Uppercase letters indicate significance at the 95% level. Lowercase letters indicate significance at the 90% level.Lowercase letters indicate significance at the 90% level.Lowercase letters indicate significance at the 90% level.Lowercase letters indicate significance at the 90% level.

Table E2 Page 40Table E2 Page 40Table E2 Page 40Table E2 Page 40 Investor's Business Daily/TIPP PollInvestor's Business Daily/TIPP PollInvestor's Business Daily/TIPP PollInvestor's Business Daily/TIPP Poll---- December 2018, Field 11/26 to 12/2 , Sample December 2018, Field 11/26 to 12/2 , Sample December 2018, Field 11/26 to 12/2 , Sample December 2018, Field 11/26 to 12/2 , Sample ---- 823 adults, MOE +/823 adults, MOE +/823 adults, MOE +/823 adults, MOE +/----3.3 pts, Traditiona3.3 pts, Traditiona3.3 pts, Traditiona3.3 pts, Traditional phone with live interviewers l phone with live interviewers l phone with live interviewers l phone with live interviewers E2E2E2E2 Generally speaking do you think the U.S. economy is improving or not improving?Generally speaking do you think the U.S. economy is improving or not improving?Generally speaking do you think the U.S. economy is improving or not improving?Generally speaking do you think the U.S. economy is improving or not improving? ====AREA TYPE==== ===WHITE=== ==BLK/HISP= ==MAR.STAT= ====EDUCATION==== ====IDEOLOOGY========AREA TYPE==== ===WHITE=== ==BLK/HISP= ==MAR.STAT= ====EDUCATION==== ====IDEOLOOGY========AREA TYPE==== ===WHITE=== ==BLK/HISP= ==MAR.STAT= ====EDUCATION==== ====IDEOLOOGY========AREA TYPE==== ===WHITE=== ==BLK/HISP= ==MAR.STAT= ====EDUCATION==== ====IDEOLOOGY==== SUBSUBSUBSUB---- WHITE SINGL MARR HIGH SOME WHITE SINGL MARR HIGH SOME WHITE SINGL MARR HIGH SOME WHITE SINGL MARR HIGH SOME TOTAL URBAN URBAN RURAL MEN WOMEN BLACK HIS. WOMEN WOM SCHL. COLL. COLL+ CONS. MOD. LIB.TOTAL URBAN URBAN RURAL MEN WOMEN BLACK HIS. WOMEN WOM SCHL. COLL. COLL+ CONS. MOD. LIB.TOTAL URBAN URBAN RURAL MEN WOMEN BLACK HIS. WOMEN WOM SCHL. COLL. COLL+ CONS. MOD. LIB.TOTAL URBAN URBAN RURAL MEN WOMEN BLACK HIS. WOMEN WOM SCHL. COLL. COLL+ CONS. MOD. LIB. -------------------- -------------------- -------------------- -------------------- -------------------- -------------------- -------------------- -------------------- -------------------- -------------------- -------------------- -------------------- -------------------- -------------------- -------------------- -------------------- (A) (B) (C) (D) (E) (F) (G) (H) (I) (J) (K) (L) (M) (N) (O) (P)(A) (B) (C) (D) (E) (F) (G) (H) (I) (J) (K) (L) (M) (N) (O) (P)(A) (B) (C) (D) (E) (F) (G) (H) (I) (J) (K) (L) (M) (N) (O) (P)(A) (B) (C) (D) (E) (F) (G) (H) (I) (J) (K) (L) (M) (N) (O) (P) TOTAL 823 19TOTAL 823 19TOTAL 823 19TOTAL 823 192 400 211 267 290 118 55 182 241 157 216 430 328 247 2142 400 211 267 290 118 55 182 241 157 216 430 328 247 2142 400 211 267 290 118 55 182 241 157 216 430 328 247 2142 400 211 267 290 118 55 182 241 157 216 430 328 247 214 100% 100% 100% 100% 100% 100% 100% 100% 100% 100% 100% 100% 100% 100% 100% 100%100% 100% 100% 100% 100% 100% 100% 100% 100% 100% 100% 100% 100% 100% 100% 100%100% 100% 100% 100% 100% 100% 100% 100% 100% 100% 100% 100% 100% 100% 100% 100%100% 100% 100% 100% 100% 100% 100% 100% 100% 100% 100% 100% 100% 100% 100% 100% Unweighted Total 823 172 385 244 340 305 73 35 178 205 161 222 417 395 233 162Unweighted Total 823 172 385 244 340 305 73 35 178 205 161 222 417 395 233 162Unweighted Total 823 172 385 244 340 305 73 35 178 205 161 222 417 395 233 162Unweighted Total 823 172 385 244 340 305 73 35 178 205 161 222 417 395 233 162 Improving 433 92 192 138 169 149 38 33 82 119 102 109 212 259 104 56Improving 433 92 192 138 169 149 38 33 82 119 102 109 212 259 104 56Improving 433 92 192 138 169 149 38 33 82 119 102 109 212 259 104 56Improving 433 92 192 138 169 149 38 33 82 119 102 109 212 259 104 56 53% 48% 48% 65% 63% 51% 32% 60% 45% 49% 65% 51% 49% 79% 42% 26%53% 48% 48% 65% 63% 51% 32% 60% 45% 49% 65% 51% 49% 79% 42% 26%53% 48% 48% 65% 63% 51% 32% 60% 45% 49% 65% 51% 49% 79% 42% 26%53% 48% 48% 65% 63% 51% 32% 60% 45% 49% 65% 51% 49% 79% 42% 26% BC F G LM OP P BC F G LM OP P BC F G LM OP P BC F G LM OP P Not improving Not improving Not improving Not improving 339 94 173 64 89 119 76 17 90 101 45 89 195 57 119 145339 94 173 64 89 119 76 17 90 101 45 89 195 57 119 145339 94 173 64 89 119 76 17 90 101 45 89 195 57 119 145339 94 173 64 89 119 76 17 90 101 45 89 195 57 119 145 41% 49% 43% 30% 33% 41% 65% 31% 49% 42% 28% 41% 45% 17% 48% 68%41% 49% 43% 30% 33% 41% 65% 31% 49% 42% 28% 41% 45% 17% 48% 68%41% 49% 43% 30% 33% 41% 65% 31% 49% 42% 28% 41% 45% 17% 48% 68%41% 49% 43% 30% 33% 41% 65% 31% 49% 42% 28% 41% 45% 17% 48% 68% D D H K K N NOD D H K K N NOD D H K K N NOD D H K K N NO Not sure 50 6 34 9 8 22 3 5 10 21 10 17 23 11 23 13Not sure 50 6 34 9 8 22 3 5 10 21 10 17 23 11 23 13Not sure 50 6 34 9 8 22 3 5 10 21 10 17 23 11 23 13Not sure 50 6 34 9 8 22 3 5 10 21 10 17 23 11 23 13 6% 3% 9% 6% 3% 9% 6% 3% 9% 6% 3% 9% 4% 3% 7% 3% 9% 6% 9% 6% 8% 5% 3% 9% 6%4% 3% 7% 3% 9% 6% 9% 6% 8% 5% 3% 9% 6%4% 3% 7% 3% 9% 6% 9% 6% 8% 5% 3% 9% 6%4% 3% 7% 3% 9% 6% 9% 6% 8% 5% 3% 9% 6% Bd e N Bd e N Bd e N Bd e N Refused 1 1 0 Refused 1 1 0 Refused 1 1 0 Refused 1 1 0 ---- 1 1 1 1 0 0 0 0 ---- ---- ---- 0 0 0 0 ---- 1 0 0 1 1 0 0 1 1 0 0 1 1 0 0 1 ---- *% *% *% *% *% *% *% *% *% *% *% *% *% *% *% *% *% *% *% *% *% *% *% *% *% *% *% *% *% *% *% *% *% *% *% *% *% *% *% *% Comparison Groups: BCD/EF/GH/IJ/KLM/NOPComparison Groups: BCD/EF/GH/IJ/KLM/NOPComparison Groups: BCD/EF/GH/IJ/KLM/NOPComparison Groups: BCD/EF/GH/IJ/KLM/NOP Independent ZIndependent ZIndependent ZIndependent Z----Test for Percentages (unpooled proportions)Test for Percentages (unpooled proportions)Test for Percentages (unpooled proportions)Test for Percentages (unpooled proportions) Uppercase letters indicate significance at the 95% level.Uppercase letters indicate significance at the 95% level.Uppercase letters indicate significance at the 95% level.Uppercase letters indicate significance at the 95% level. Lowercase letters indicate significance at the 90% level.Lowercase letters indicate significance at the 90% level.Lowercase letters indicate significance at the 90% level.Lowercase letters indicate significance at the 90% level.

Table E3 Page 41Table E3 Page 41Table E3 Page 41Table E3 Page 41 Investor's Business Daily/TIPP PollInvestor's Business Daily/TIPP PollInvestor's Business Daily/TIPP PollInvestor's Business Daily/TIPP Poll---- December 2018, Field 11/26December 2018, Field 11/26December 2018, Field 11/26December 2018, Field 11/26 to 12/2 , Sample to 12/2 , Sample to 12/2 , Sample to 12/2 , Sample ---- 823 adults, MOE +/823 adults, MOE +/823 adults, MOE +/823 adults, MOE +/----3.3 pts, Traditional phone with live interviewers 3.3 pts, Traditional phone with live interviewers 3.3 pts, Traditional phone with live interviewers 3.3 pts, Traditional phone with live interviewers E3E3E3E3 How concerned are you that the economy will be able to maintain its current level of performance in the next six How concerned are you that the economy will be able to maintain its current level of performance in the next six How concerned are you that the economy will be able to maintain its current level of performance in the next six How concerned are you that the economy will be able to maintain its current level of performance in the next six months? months? months? months? ======= REGION ======== ========= AGE ========= ==GENDER== ===RACE === ======= INCOME ======= =====PARTY===== ==INVESTOR======== REGION ======== ========= AGE ========= ==GENDER== ===RACE === ======= INCOME ======= =====PARTY===== ==INVESTOR======== REGION ======== ========= AGE ========= ==GENDER== ===RACE === ======= INCOME ======= =====PARTY===== ==INVESTOR======== REGION ======== ========= AGE ========= ==GENDER== ===RACE === ======= INCOME ======= =====PARTY===== ==INVESTOR= TOTAL TOTAL TOTAL TOTAL BLACK UND 30KBLACK UND 30KBLACK UND 30KBLACK UND 30K---- 50K50K50K50K---- NE MW SOUTH WEST 18NE MW SOUTH WEST 18NE MW SOUTH WEST 18NE MW SOUTH WEST 18----24 2524 2524 2524 25----44 4544 4544 4544 45----64 65+ MALE FEM. WHITE HISP 30K 50K 75K 75K+ DEM REP IND YES NO 64 65+ MALE FEM. WHITE HISP 30K 50K 75K 75K+ DEM REP IND YES NO 64 65+ MALE FEM. WHITE HISP 30K 50K 75K 75K+ DEM REP IND YES NO 64 65+ MALE FEM. WHITE HISP 30K 50K 75K 75K+ DEM REP IND YES NO -------------------- -------------------- -------------------- -------------------- -------------------- -------------------- -------------------- -------------------- -------------------- -------------------- -------------------- -------------------- -------------------- -------------------- -------------------- -------------------- -------------------- -------------------- -------------------- -------------------- -------------------- -------------------- (A) (B) (C) (D) (E) (F) (G) (H) (I) (J) (K) (L) (M) (N) (O) (P) (Q) (R) (A) (B) (C) (D) (E) (F) (G) (H) (I) (J) (K) (L) (M) (N) (O) (P) (Q) (R) (A) (B) (C) (D) (E) (F) (G) (H) (I) (J) (K) (L) (M) (N) (O) (P) (Q) (R) (A) (B) (C) (D) (E) (F) (G) (H) (I) (J) (K) (L) (M) (N) (O) (P) (Q) (R) (S) (T) (U) (V)(S) (T) (U) (V)(S) (T) (U) (V)(S) (T) (U) (V) TOTAL 823 147 181 309 186 45 234 293 207 393 430 556 171 92 131 138 3TOTAL 823 147 181 309 186 45 234 293 207 393 430 556 171 92 131 138 3TOTAL 823 147 181 309 186 45 234 293 207 393 430 556 171 92 131 138 3TOTAL 823 147 181 309 186 45 234 293 207 393 430 556 171 92 131 138 363 286 237 283 447 30963 286 237 283 447 30963 286 237 283 447 30963 286 237 283 447 309 100% 100% 100% 100% 100% 100% 100% 100% 100% 100% 100% 100% 100% 100% 100% 100% 100% 100% 100% 100% 100% 100% 100% 100% 100% 100% 100% 100% 100% 100% 100% 100% 100% 100% 100% 100% 100% 100% 100% 100% 100% 100% 100% 100% 100% 100%100% 100% 100% 100% 100% 100% 100% 100% 100% 100% 100% 100% 100% 100%100% 100% 100% 100% 100% 100% 100% 100% 100% 100% 100% 100% 100% 100%100% 100% 100% 100% 100% 100% 100% 100% 100% 100% 100% 100% 100% 100% Unweighted Total 823 158 180 311 174 17 102 289 371 433 390 645 107 104 145 126 3Unweighted Total 823 158 180 311 174 17 102 289 371 433 390 645 107 104 145 126 3Unweighted Total 823 158 180 311 174 17 102 289 371 433 390 645 107 104 145 126 3Unweighted Total 823 158 180 311 174 17 102 289 371 433 390 645 107 104 145 126 337 247 296 262 472 28237 247 296 262 472 28237 247 296 262 472 28237 247 296 262 472 282 Very concerneVery concerneVery concerneVery concerned 253 48 51 103 51 3 89 93 61 116 137 148 81 28 45 47 109 150 2d 253 48 51 103 51 3 89 93 61 116 137 148 81 28 45 47 109 150 2d 253 48 51 103 51 3 89 93 61 116 137 148 81 28 45 47 109 150 2d 253 48 51 103 51 3 89 93 61 116 137 148 81 28 45 47 109 150 20 78 126 1060 78 126 1060 78 126 1060 78 126 106 31% 32% 28% 33% 28% 8% 38% 32% 29% 29% 32% 27% 47% 30% 31% 32% 28% 33% 28% 8% 38% 32% 29% 29% 32% 27% 47% 30% 31% 32% 28% 33% 28% 8% 38% 32% 29% 29% 32% 27% 47% 30% 31% 32% 28% 33% 28% 8% 38% 32% 29% 29% 32% 27% 47% 30% 34% 34% 30% 53% 9% 27% 28% 34%34% 34% 30% 53% 9% 27% 28% 34%34% 34% 30% 53% 9% 27% 28% 34%34% 34% 30% 53% 9% 27% 28% 34% F F F L ST S F F F L ST S F F F L ST S F F F L ST S Somewhat concerned 253 48 70 92 Somewhat concerned 253 48 70 92 Somewhat concerned 253 48 70 92 Somewhat concerned 253 48 70 92 44 24 44 94 75 119 135 176 44 34 34 35 111 91 73 82 139 8944 24 44 94 75 119 135 176 44 34 34 35 111 91 73 82 139 8944 24 44 94 75 119 135 176 44 34 34 35 111 91 73 82 139 8944 24 44 94 75 119 135 176 44 34 34 35 111 91 73 82 139 89 31% 32% 39% 30% 23% 53% 19% 32% 36% 30% 31% 32% 26% 37% 26% 25% 31% 32% 31% 29% 31% 32% 39% 30% 23% 53% 19% 32% 36% 30% 31% 32% 26% 37% 26% 25% 31% 32% 31% 29% 31% 32% 39% 30% 23% 53% 19% 32% 36% 30% 31% 32% 26% 37% 26% 25% 31% 32% 31% 29% 31% 32% 39% 30% 23% 53% 19% 32% 36% 30% 31% 32% 26% 37% 26% 25% 31% 32% 31% 29% 31% 29%31% 29%31% 29%31% 29% E G G G E G G G E G G G E G G G Not very concerned 161 31 17 66 47 13 64 48 26 70 Not very concerned 161 31 17 66 47 13 64 48 26 70 Not very concerned 161 31 17 66 47 13 64 48 26 70 Not very concerned 161 31 17 66 47 13 64 48 26 70 91 126 18 13 26 33 70 29 62 66 92 5791 126 18 13 26 33 70 29 62 66 92 5791 126 18 13 26 33 70 29 62 66 92 5791 126 18 13 26 33 70 29 62 66 92 57 20% 21% 9% 21% 26% 30% 27% 17% 13% 18% 21% 23% 11% 14% 20% 24% 19% 10% 26% 23% 20% 20% 21% 9% 21% 26% 30% 27% 17% 13% 18% 21% 23% 11% 14% 20% 24% 19% 10% 26% 23% 20% 20% 21% 9% 21% 26% 30% 27% 17% 13% 18% 21% 23% 11% 14% 20% 24% 19% 10% 26% 23% 20% 20% 21% 9% 21% 26% 30% 27% 17% 13% 18% 21% 23% 11% 14% 20% 24% 19% 10% 26% 23% 20% 18%18%18%18% C C C HI M n R R C C C HI M n R R C C C HI M n R R C C C HI M n R R Not at all concerned 143 19 40 44 39 5 34 57 37 85 58 100 27 17 21 21 Not at all concerned 143 19 40 44 39 5 34 57 37 85 58 100 27 17 21 21 Not at all concerned 143 19 40 44 39 5 34 57 37 85 58 100 27 17 21 21 Not at all concerned 143 19 40 44 39 5 34 57 37 85 58 100 27 17 21 21 69 11 78 52 85 5169 11 78 52 85 5169 11 78 52 85 5169 11 78 52 85 51 17% 13% 22% 14% 21% 10% 14% 19% 18% 22% 14% 18% 16% 18% 16% 15% 19% 4% 33% 18% 19% 17% 13% 22% 14% 21% 10% 14% 19% 18% 22% 14% 18% 16% 18% 16% 15% 19% 4% 33% 18% 19% 17% 13% 22% 14% 21% 10% 14% 19% 18% 22% 14% 18% 16% 18% 16% 15% 19% 4% 33% 18% 19% 17% 13% 22% 14% 21% 10% 14% 19% 18% 22% 14% 18% 16% 18% 16% 15% 19% 4% 33% 18% 19% 16%16%16%16% bd bd bd bd K RT R K RT R K RT R K RT R Not sure 11 1 3 4 3 Not sure 11 1 3 4 3 Not sure 11 1 3 4 3 Not sure 11 1 3 4 3 ---- 3 1 6 2 9 5 1 1 6 3 1 6 2 9 5 1 1 6 3 1 6 2 9 5 1 1 6 3 1 6 2 9 5 1 1 6 ---- 3 4 3 3 6 53 4 3 3 6 53 4 3 3 6 53 4 3 3 6 5 1% 1% 2% 1% 1% 1% *% 3% 1% 2% 1% 1% 1% 4% 1% 2% 1% 1% 1% 1% 1% 2% 1% 1% 1% *% 3% 1% 2% 1% 1% 1% 4% 1% 2% 1% 1% 1% 1% 1% 2% 1% 1% 1% *% 3% 1% 2% 1% 1% 1% 4% 1% 2% 1% 1% 1% 1% 1% 2% 1% 1% 1% *% 3% 1% 2% 1% 1% 1% 4% 1% 2% 1% 1% 1% 2%2%2%2% H j H j H j H j Q Q Q Q Refused 2 Refused 2 Refused 2 Refused 2 ---- ---- ---- 2 2 2 2 ---- ---- ---- 2 2 2 2 2 2 2 2 ---- 0 0 0 0 ---- ---- ---- 1 0 1 0 1 0 1 0 ---- ---- 2 0 12 0 12 0 12 0 1 *% *% *% *% 1% 1% *% *% 1% *% 1% *% *%1% 1% *% *% 1% *% 1% *% *%1% 1% *% *% 1% *% 1% *% *%1% 1% *% *% 1% *% 1% *% *% CONCERNED 506 95 121 195 95 27 133 187 136 234 272 324 125 62 78 82 2CONCERNED 506 95 121 195 95 27 133 187 136 234 272 324 125 62 78 82 2CONCERNED 506 95 121 195 95 27 133 187 136 234 272 324 125 62 78 82 2CONCERNED 506 95 121 195 95 27 133 187 136 234 272 324 125 62 78 82 220 241 20 241 20 241 20 241 93 160 265 19593 160 265 19593 160 265 19593 160 265 195 62% 65% 67% 63% 51% 60% 57% 64% 65% 60% 63% 58% 73% 67% 60% 60% 60% 84% 39% 57% 59% 62% 65% 67% 63% 51% 60% 57% 64% 65% 60% 63% 58% 73% 67% 60% 60% 60% 84% 39% 57% 59% 62% 65% 67% 63% 51% 60% 57% 64% 65% 60% 63% 58% 73% 67% 60% 60% 60% 84% 39% 57% 59% 62% 65% 67% 63% 51% 60% 57% 64% 65% 60% 63% 58% 73% 67% 60% 60% 60% 84% 39% 57% 59% 63%63%63%63% E E E E E E E E E E E E L ST S L ST S L ST S L ST S NOT CONCERNED 304 51 57 110 86 18 98 105 63 155 149 227 45 29 47 54 1NOT CONCERNED 304 51 57 110 86 18 98 105 63 155 149 227 45 29 47 54 1NOT CONCERNED 304 51 57 110 86 18 98 105 63 155 149 227 45 29 47 54 1NOT CONCERNED 304 51 57 110 86 18 98 105 63 155 149 227 45 29 47 54 140 41 141 118 176 10840 41 141 118 176 10840 41 141 118 176 10840 41 141 118 176 108 37% 34% 31% 36% 47% 40% 42% 36% 31% 39% 35% 41% 27% 32% 36% 39% 38% 14% 59% 42% 39% 37% 34% 31% 36% 47% 40% 42% 36% 31% 39% 35% 41% 27% 32% 36% 39% 38% 14% 59% 42% 39% 37% 34% 31% 36% 47% 40% 42% 36% 31% 39% 35% 41% 27% 32% 36% 39% 38% 14% 59% 42% 39% 37% 34% 31% 36% 47% 40% 42% 36% 31% 39% 35% 41% 27% 32% 36% 39% 38% 14% 59% 42% 39% 35%35%35%35% bCd i M bCd i M bCd i M bCd i M RT R RT R RT R RT R Comparison Groups: BCDE/FGHI/JK/LM/NOPQ/RST/UVComparison Groups: BCDE/FGHI/JK/LM/NOPQ/RST/UVComparison Groups: BCDE/FGHI/JK/LM/NOPQ/RST/UVComparison Groups: BCDE/FGHI/JK/LM/NOPQ/RST/UV Independent ZIndependent ZIndependent ZIndependent Z----Test for Percentages (unpooled proportions)Test for Percentages (unpooled proportions)Test for Percentages (unpooled proportions)Test for Percentages (unpooled proportions) Uppercase letters indicate significance at the 95% level.Uppercase letters indicate significance at the 95% level.Uppercase letters indicate significance at the 95% level.Uppercase letters indicate significance at the 95% level. Lowercase letters indicate significance Lowercase letters indicate significance Lowercase letters indicate significance Lowercase letters indicate significance at the 90% level.at the 90% level.at the 90% level.at the 90% level.

Table E3 Page 42Table E3 Page 42Table E3 Page 42Table E3 Page 42 Investor's Business Daily/TIPP PollInvestor's Business Daily/TIPP PollInvestor's Business Daily/TIPP PollInvestor's Business Daily/TIPP Poll---- December 2018, Field 11/26 to 12/2 , Sample December 2018, Field 11/26 to 12/2 , Sample December 2018, Field 11/26 to 12/2 , Sample December 2018, Field 11/26 to 12/2 , Sample ---- 823 adults, MOE +/823 adults, MOE +/823 adults, MOE +/823 adults, MOE +/----3.3 pts, Traditional phone with live interviewers 3.3 pts, Traditional phone with live interviewers 3.3 pts, Traditional phone with live interviewers 3.3 pts, Traditional phone with live interviewers E3E3E3E3 How concerned are you that the economy will be able to maintain its current level of performance in the next six How concerned are you that the economy will be able to maintain its current level of performance in the next six How concerned are you that the economy will be able to maintain its current level of performance in the next six How concerned are you that the economy will be able to maintain its current level of performance in the next six months? months? months? months? ====AREA TYPE==== ===WHITE=== ==BLK/HISP= ==MAR.STAT= ====EDUCATION==== ====IDEOLOOGY========AREA TYPE==== ===WHITE=== ==BLK/HISP= ==MAR.STAT= ====EDUCATION==== ====IDEOLOOGY========AREA TYPE==== ===WHITE=== ==BLK/HISP= ==MAR.STAT= ====EDUCATION==== ====IDEOLOOGY========AREA TYPE==== ===WHITE=== ==BLK/HISP= ==MAR.STAT= ====EDUCATION==== ====IDEOLOOGY==== SUBSUBSUBSUB---- WHITE SINGL MARR HIGH SOME WHITE SINGL MARR HIGH SOME WHITE SINGL MARR HIGH SOME WHITE SINGL MARR HIGH SOME TOTAL URBAN URBAN RURAL MEN WOMEN BLACK HIS. WOMEN WOM SCHL. COLL. COLL+ CONS. MOD. LIB.TOTAL URBAN URBAN RURAL MEN WOMEN BLACK HIS. WOMEN WOM SCHL. COLL. COLL+ CONS. MOD. LIB.TOTAL URBAN URBAN RURAL MEN WOMEN BLACK HIS. WOMEN WOM SCHL. COLL. COLL+ CONS. MOD. LIB.TOTAL URBAN URBAN RURAL MEN WOMEN BLACK HIS. WOMEN WOM SCHL. COLL. COLL+ CONS. MOD. LIB. -------------------- -------------------- -------------------- -------------------- -------------------- -------------------- -------------------- -------------------- -------------------- -------------------- -------------------- -------------------- -------------------- -------------------- -------------------- -------------------- (A) (B) (C) (D) (E) (F) (G) (H) (I) (J) (K) (L) (M) (N) (O) (P)(A) (B) (C) (D) (E) (F) (G) (H) (I) (J) (K) (L) (M) (N) (O) (P)(A) (B) (C) (D) (E) (F) (G) (H) (I) (J) (K) (L) (M) (N) (O) (P)(A) (B) (C) (D) (E) (F) (G) (H) (I) (J) (K) (L) (M) (N) (O) (P) TOTAL 82TOTAL 82TOTAL 82TOTAL 823 192 400 211 267 290 118 55 182 241 157 216 430 328 247 2143 192 400 211 267 290 118 55 182 241 157 216 430 328 247 2143 192 400 211 267 290 118 55 182 241 157 216 430 328 247 2143 192 400 211 267 290 118 55 182 241 157 216 430 328 247 214 100% 100% 100% 100% 100% 100% 100% 100% 100% 100% 100% 100% 100% 100% 100% 100%100% 100% 100% 100% 100% 100% 100% 100% 100% 100% 100% 100% 100% 100% 100% 100%100% 100% 100% 100% 100% 100% 100% 100% 100% 100% 100% 100% 100% 100% 100% 100%100% 100% 100% 100% 100% 100% 100% 100% 100% 100% 100% 100% 100% 100% 100% 100% Unweighted Total 823 172 3Unweighted Total 823 172 3Unweighted Total 823 172 3Unweighted Total 823 172 385 244 340 305 73 35 178 205 161 222 417 395 233 16285 244 340 305 73 35 178 205 161 222 417 395 233 16285 244 340 305 73 35 178 205 161 222 417 395 233 16285 244 340 305 73 35 178 205 161 222 417 395 233 162 Very concerned 253 71 134 44 78 70 68 12 66 71 44 59 145 49 79 111Very concerned 253 71 134 44 78 70 68 12 66 71 44 59 145 49 79 111Very concerned 253 71 134 44 78 70 68 12 66 71 44 59 145 49 79 111Very concerned 253 71 134 44 78 70 68 12 66 71 44 59 145 49 79 111 31% 37% 33% 21% 31% 37% 33% 21% 31% 37% 33% 21% 31% 37% 33% 21% 29% 24% 58% 23% 36% 30% 28% 28% 34% 15% 32% 52%29% 24% 58% 23% 36% 30% 28% 28% 34% 15% 32% 52%29% 24% 58% 23% 36% 30% 28% 28% 34% 15% 32% 52%29% 24% 58% 23% 36% 30% 28% 28% 34% 15% 32% 52% D D H N NOD D H N NOD D H N NOD D H N NO Somewhat concerned 253 61 107 79 80 95 Somewhat concerned 253 61 107 79 80 95 Somewhat concerned 253 61 107 79 80 95 Somewhat concerned 253 61 107 79 80 95 31 13 61 71 51 68 127 96 86 6031 13 61 71 51 68 127 96 86 6031 13 61 71 51 68 127 96 86 6031 13 61 71 51 68 127 96 86 60 31% 32% 27% 37% 30% 33% 26% 24% 33% 30% 33% 32% 30% 29% 35% 28%31% 32% 27% 37% 30% 33% 26% 24% 33% 30% 33% 32% 30% 29% 35% 28%31% 32% 27% 37% 30% 33% 26% 24% 33% 30% 33% 32% 30% 29% 35% 28%31% 32% 27% 37% 30% 33% 26% 24% 33% 30% 33% 32% 30% 29% 35% 28% C C C C Not very concerned 161 34 86 37 51 76 10 9 36 52 28 47 83 84 51 21Not very concerned 161 34 86 37 51 76 10 9 36 52 28 47 83 84 51 21Not very concerned 161 34 86 37 51 76 10 9 36 52 28 47 83 84 51 21Not very concerned 161 34 86 37 51 76 10 9 36 52 28 47 83 84 51 21 20% 17% 22% 18% 19% 26% 8% 16% 20% 220% 17% 22% 18% 19% 26% 8% 16% 20% 220% 17% 22% 18% 19% 26% 8% 16% 20% 220% 17% 22% 18% 19% 26% 8% 16% 20% 22% 18% 22% 19% 26% 21% 10%2% 18% 22% 19% 26% 21% 10%2% 18% 22% 19% 26% 21% 10%2% 18% 22% 19% 26% 21% 10% e P P e P P e P P e P P Not at all concerned 143 27 62 49 57 44 9 19 16 41 31 Not at all concerned 143 27 62 49 57 44 9 19 16 41 31 Not at all concerned 143 27 62 49 57 44 9 19 16 41 31 Not at all concerned 143 27 62 49 57 44 9 19 16 41 31 38 71 97 26 1838 71 97 26 1838 71 97 26 1838 71 97 26 18 17% 14% 16% 23% 21% 15% 8% 35% 9% 17% 20% 18% 16% 30% 10% 8%17% 14% 16% 23% 21% 15% 8% 35% 9% 17% 20% 18% 16% 30% 10% 8%17% 14% 16% 23% 21% 15% 8% 35% 9% 17% 20% 18% 16% 30% 10% 8%17% 14% 16% 23% 21% 15% 8% 35% 9% 17% 20% 18% 16% 30% 10% 8% bc G i bc G i bc G i bc G i OP OP OP OP Not sure 11 0 10 Not sure 11 0 10 Not sure 11 0 10 Not sure 11 0 10 ---- 1 5 1 5 1 5 1 5 ---- 1 3 5 3 3 4 1 5 51 3 5 3 3 4 1 5 51 3 5 3 3 4 1 5 51 3 5 3 3 4 1 5 5 1% *% 2% *% 2% 2% 2% 2% 2% 1% 1% *% 2% 1% *% 2% *% 2% 2% 2% 2% 2% 1% 1% *% 2% 1% *% 2% *% 2% 2% 2% 2% 2% 1% 1% *% 2% 1% *% 2% *% 2% 2% 2% 2% 2% 1% 1% *% 2% 2%2%2%2% B n nB n nB n nB n n Refused 2 Refused 2 Refused 2 Refused 2 ---- 0 1 0 0 1 0 0 1 0 0 1 0 ---- ---- ---- ---- ---- ---- ---- 0 0 0 0 ---- 0 0 0 0 ---- *% *% 1% *% *% *% *% *% 1% *% *% *% *% *% 1% *% *% *% *% *% 1% *% *% *% CONCERNED 506 132 241 123 158 166 99 26 127 143 94 128 272 146 165 170CONCERNED 506 132 241 123 158 166 99 26 127 143 94 128 272 146 165 170CONCERNED 506 132 241 123 158 166 99 26 127 143 94 128 272 146 165 170CONCERNED 506 132 241 123 158 166 99 26 127 143 94 128 272 146 165 170 62% 68% 60% 58% 59% 57% 84% 47% 70% 59% 60% 59% 63% 44% 67% 80%62% 68% 60% 58% 59% 57% 84% 47% 70% 59% 60% 59% 63% 44% 67% 80%62% 68% 60% 58% 59% 57% 84% 47% 70% 59% 60% 59% 63% 44% 67% 80%62% 68% 60% 58% 59% 57% 84% 47% 70% 59% 60% 59% 63% 44% 67% 80% d H j N NOd H j N NOd H j N NOd H j N NO NOT CONCERNED NOT CONCERNED NOT CONCERNED NOT CONCERNED 304 60 149 87 107 119 19 28 53 93 59 85 154 181 77 39304 60 149 87 107 119 19 28 53 93 59 85 154 181 77 39304 60 149 87 107 119 19 28 53 93 59 85 154 181 77 39304 60 149 87 107 119 19 28 53 93 59 85 154 181 77 39 37% 31% 37% 41% 40% 41% 16% 51% 29% 39% 38% 39% 36% 55% 31% 18%37% 31% 37% 41% 40% 41% 16% 51% 29% 39% 38% 39% 36% 55% 31% 18%37% 31% 37% 41% 40% 41% 16% 51% 29% 39% 38% 39% 36% 55% 31% 18%37% 31% 37% 41% 40% 41% 16% 51% 29% 39% 38% 39% 36% 55% 31% 18% G OP P G OP P G OP P G OP P Comparison Groups: BCD/EF/GH/IJ/KLM/NOPComparison Groups: BCD/EF/GH/IJ/KLM/NOPComparison Groups: BCD/EF/GH/IJ/KLM/NOPComparison Groups: BCD/EF/GH/IJ/KLM/NOP Independent ZIndependent ZIndependent ZIndependent Z----Test for Percentages (unpooled proportions)Test for Percentages (unpooled proportions)Test for Percentages (unpooled proportions)Test for Percentages (unpooled proportions) Uppercase letters indicate significance at the 95% level.Uppercase letters indicate significance at the 95% level.Uppercase letters indicate significance at the 95% level.Uppercase letters indicate significance at the 95% level. Lowercase letters indicate significance at the 90% level.Lowercase letters indicate significance at the 90% level.Lowercase letters indicate significance at the 90% level.Lowercase letters indicate significance at the 90% level.

Table I1A Page 43Table I1A Page 43Table I1A Page 43Table I1A Page 43 Investor's Business Daily/TIPP PollInvestor's Business Daily/TIPP PollInvestor's Business Daily/TIPP PollInvestor's Business Daily/TIPP Poll---- December 2018, Field 11/26 to 12/2 , Sample December 2018, Field 11/26 to 12/2 , Sample December 2018, Field 11/26 to 12/2 , Sample December 2018, Field 11/26 to 12/2 , Sample ---- 823 adults, MOE +/823 adults, MOE +/823 adults, MOE +/823 adults, MOE +/----3.3 pts, Traditional phone with live interviewers 3.3 pts, Traditional phone with live interviewers 3.3 pts, Traditional phone with live interviewers 3.3 pts, Traditional phone with live interviewers I1AI1AI1AI1A Which of the followWhich of the followWhich of the followWhich of the following issues should be given the HIGHEST priority by Congress in the new year?ing issues should be given the HIGHEST priority by Congress in the new year?ing issues should be given the HIGHEST priority by Congress in the new year?ing issues should be given the HIGHEST priority by Congress in the new year? ======= REGION ======== ========= AGE ========= ==GENDER== ===RACE === ======= INCOME ======= =====PARTY===== ==INVESTOR======== REGION ======== ========= AGE ========= ==GENDER== ===RACE === ======= INCOME ======= =====PARTY===== ==INVESTOR======== REGION ======== ========= AGE ========= ==GENDER== ===RACE === ======= INCOME ======= =====PARTY===== ==INVESTOR======== REGION ======== ========= AGE ========= ==GENDER== ===RACE === ======= INCOME ======= =====PARTY===== ==INVESTOR= TOTAL BLACK UND 30KTOTAL BLACK UND 30KTOTAL BLACK UND 30KTOTAL BLACK UND 30K---- 50K50K50K50K---- NE MW SOUTH WEST 18NE MW SOUTH WEST 18NE MW SOUTH WEST 18NE MW SOUTH WEST 18----24 2524 2524 2524 25----44 4544 4544 4544 45----64 65+ MALE FEM. WHITE HISP 30K 50K64 65+ MALE FEM. WHITE HISP 30K 50K64 65+ MALE FEM. WHITE HISP 30K 50K64 65+ MALE FEM. WHITE HISP 30K 50K 75K 75K+ DEM REP IND YES NO 75K 75K+ DEM REP IND YES NO 75K 75K+ DEM REP IND YES NO 75K 75K+ DEM REP IND YES NO -------------------- -------------------- -------------------- -------------------- -------------------- -------------------- -------------------- -------------------- -------------------- -------------------- -------------------- -------------------- -------------------- -------------------- -------------------- -------------------- -------------------- -------------------- -------------------- -------------------- -------------------- -------------------- (A) (B) (C) (D) (E)(A) (B) (C) (D) (E)(A) (B) (C) (D) (E)(A) (B) (C) (D) (E) (F) (G) (H) (I) (J) (K) (L) (M) (N) (O) (P) (Q) (R) (S) (T) (U) (V)(F) (G) (H) (I) (J) (K) (L) (M) (N) (O) (P) (Q) (R) (S) (T) (U) (V)(F) (G) (H) (I) (J) (K) (L) (M) (N) (O) (P) (Q) (R) (S) (T) (U) (V)(F) (G) (H) (I) (J) (K) (L) (M) (N) (O) (P) (Q) (R) (S) (T) (U) (V) TOTAL 823 147 181 309 186 45 234 293 207 393 430 556 171 92 131 138 3TOTAL 823 147 181 309 186 45 234 293 207 393 430 556 171 92 131 138 3TOTAL 823 147 181 309 186 45 234 293 207 393 430 556 171 92 131 138 3TOTAL 823 147 181 309 186 45 234 293 207 393 430 556 171 92 131 138 363 286 237 283 447 63 286 237 283 447 63 286 237 283 447 63 286 237 283 447 309309309309 100% 100% 100% 100% 100% 100% 100% 100% 100% 100% 100% 100% 100% 100% 100% 100% 100% 100% 100% 100% 100% 100% 100% 100% 100% 100% 100% 100% 100% 100% 100% 100% 100% 100% 100% 100% 100% 100% 100% 100% 100% 100% 100% 100% 100% 100% 100% 100% 100% 100% 100% 100% 100% 100% 100% 100% 100% 100% 100% 100% 100% 100% 100% 100% 100% 100% 100% 100% 100% 100% 100% 100% 100% 100% 100% 100% 100% 100% 100% 100% 100% 100% 100% 100% 100%100%100%100% Unweighted Total 823 158 180 311 174 17 102 289 371 433 390Unweighted Total 823 158 180 311 174 17 102 289 371 433 390Unweighted Total 823 158 180 311 174 17 102 289 371 433 390Unweighted Total 823 158 180 311 174 17 102 289 371 433 390 645 107 104 145 126 337 247 296 262 472 282645 107 104 145 126 337 247 296 262 472 282645 107 104 145 126 337 247 296 262 472 282645 107 104 145 126 337 247 296 262 472 282 Healthcare costs 180 20 53 67 39 4 45 77 45 74 105 121 44 20 32 20 Healthcare costs 180 20 53 67 39 4 45 77 45 74 105 121 44 20 32 20 Healthcare costs 180 20 53 67 39 4 45 77 45 74 105 121 44 20 32 20 Healthcare costs 180 20 53 67 39 4 45 77 45 74 105 121 44 20 32 20 88 75 36 65 109 5888 75 36 65 109 5888 75 36 65 109 5888 75 36 65 109 58 22222222% 14% 30% 22% 21% 9% 19% 26% 22% 19% 25% 22% 26% 22% 24% 15% 24% 26% 15% 23% 24% 1% 14% 30% 22% 21% 9% 19% 26% 22% 19% 25% 22% 26% 22% 24% 15% 24% 26% 15% 23% 24% 1% 14% 30% 22% 21% 9% 19% 26% 22% 19% 25% 22% 26% 22% 24% 15% 24% 26% 15% 23% 24% 1% 14% 30% 22% 21% 9% 19% 26% 22% 19% 25% 22% 26% 22% 24% 15% 24% 26% 15% 23% 24% 19%9%9%9% B b F f p B b F f p B b F f p B b F f p S s S s S s S s Immigration 156 28 32 57 39 5 32 51 50 81 75 126 11 18 19 27 Immigration 156 28 32 57 39 5 32 51 50 81 75 126 11 18 19 27 Immigration 156 28 32 57 39 5 32 51 50 81 75 126 11 18 19 27 Immigration 156 28 32 57 39 5 32 51 50 81 75 126 11 18 19 27 67 12 82 58 90 4867 12 82 58 90 4867 12 82 58 90 4867 12 82 58 90 48 19% 19% 18% 19% 21% 11% 14% 18% 24% 21% 17% 23% 6% 19% 15% 20% 18% 4% 35% 20% 20% 19% 19% 18% 19% 21% 11% 14% 18% 24% 21% 17% 23% 6% 19% 15% 20% 18% 4% 35% 20% 20% 19% 19% 18% 19% 21% 11% 14% 18% 24% 21% 17% 23% 6% 19% 15% 20% 18% 4% 35% 20% 20% 19% 19% 18% 19% 21% 11% 14% 18% 24% 21% 17% 23% 6% 19% 15% 20% 18% 4% 35% 20% 20% 16%16%16%16% Gh M Gh M Gh M Gh M RT R RT R RT R RT R Economy and Jobs 104 16 18 55 14 Economy and Jobs 104 16 18 55 14 Economy and Jobs 104 16 18 55 14 Economy and Jobs 104 16 18 55 14 ---- 27 44 25 55 49 74 14 8 14 16 51 19 45 36 60 3427 44 25 55 49 74 14 8 14 16 51 19 45 36 60 3427 44 25 55 49 74 14 8 14 16 51 19 45 36 60 3427 44 25 55 49 74 14 8 14 16 51 19 45 36 60 34 13% 11%13% 11%13% 11%13% 11% 10% 18% 8% 12% 15% 12% 14% 11% 13% 8% 9% 10% 12% 14% 7% 19% 13% 13% 11%10% 18% 8% 12% 15% 12% 14% 11% 13% 8% 9% 10% 12% 14% 7% 19% 13% 13% 11%10% 18% 8% 12% 15% 12% 14% 11% 13% 8% 9% 10% 12% 14% 7% 19% 13% 13% 11%10% 18% 8% 12% 15% 12% 14% 11% 13% 8% 9% 10% 12% 14% 7% 19% 13% 13% 11% cE cE cE cE R r R r R r R r National security 86 17 19 35 15 3 24 35 22 41 45 61 15 6 15 19 National security 86 17 19 35 15 3 24 35 22 41 45 61 15 6 15 19 National security 86 17 19 35 15 3 24 35 22 41 45 61 15 6 15 19 National security 86 17 19 35 15 3 24 35 22 41 45 61 15 6 15 19 40 16 49 19 51 3440 16 49 19 51 3440 16 49 19 51 3440 16 49 19 51 34 10% 12% 10% 11% 8% 7% 10% 12% 10% 12% 10% 11% 8% 7% 10% 12% 10% 12% 10% 11% 8% 7% 10% 12% 10% 12% 10% 11% 8% 7% 10% 12% 11% 10% 10% 11% 9% 6% 12% 13% 11% 6% 21% 7% 11% 11%11% 10% 10% 11% 9% 6% 12% 13% 11% 6% 21% 7% 11% 11%11% 10% 10% 11% 9% 6% 12% 13% 11% 6% 21% 7% 11% 11%11% 10% 10% 11% 9% 6% 12% 13% 11% 6% 21% 7% 11% 11% RT RT RT RT Climate changClimate changClimate changClimate change 79 8 15 18 37 15 24 15 24 38 41 52 16 15 10 17 29 39 e 79 8 15 18 37 15 24 15 24 38 41 52 16 15 10 17 29 39 e 79 8 15 18 37 15 24 15 24 38 41 52 16 15 10 17 29 39 e 79 8 15 18 37 15 24 15 24 38 41 52 16 15 10 17 29 39 4 34 39 354 34 39 354 34 39 354 34 39 35 10% 6% 8% 6% 20% 33% 10% 5% 12% 10% 10% 9% 10% 16% 10% 6% 8% 6% 20% 33% 10% 5% 12% 10% 10% 9% 10% 16% 10% 6% 8% 6% 20% 33% 10% 5% 12% 10% 10% 9% 10% 16% 10% 6% 8% 6% 20% 33% 10% 5% 12% 10% 10% 9% 10% 16% 7% 12% 8% 14% 2% 12% 9% 11%7% 12% 8% 14% 2% 12% 9% 11%7% 12% 8% 14% 2% 12% 9% 11%7% 12% 8% 14% 2% 12% 9% 11% BCD gHi H oQ S S BCD gHi H oQ S S BCD gHi H oQ S S BCD gHi H oQ S S GunGunGunGun----related issues 70 20 20 20 related issues 70 20 20 20 related issues 70 20 20 20 related issues 70 20 20 20 10 12 24 19 12 23 47 35 27 9 9 14 28 52 1 17 31 3010 12 24 19 12 23 47 35 27 9 9 14 28 52 1 17 31 3010 12 24 19 12 23 47 35 27 9 9 14 28 52 1 17 31 3010 12 24 19 12 23 47 35 27 9 9 14 28 52 1 17 31 30 9% 14% 11% 6% 6% 26% 10% 7% 6% 6% 11% 6% 16% 10% 7% 10% 8% 18% *% 6% 9% 14% 11% 6% 6% 26% 10% 7% 6% 6% 11% 6% 16% 10% 7% 10% 8% 18% *% 6% 9% 14% 11% 6% 6% 26% 10% 7% 6% 6% 11% 6% 16% 10% 7% 10% 8% 18% *% 6% 9% 14% 11% 6% 6% 26% 10% 7% 6% 6% 11% 6% 16% 10% 7% 10% 8% 18% *% 6% 7% 10%7% 10%7% 10%7% 10% DE e hi J L ST S DE e hi J L ST S DE e hi J L ST S DE e hi J L ST S Investigating the White 69 19 12 22 16 4 22 25 16 32 Investigating the White 69 19 12 22 16 4 22 25 16 32 Investigating the White 69 19 12 22 16 4 22 25 16 32 Investigating the White 69 19 12 22 16 4 22 25 16 32 37 34 23 6 13 12 31 41 0 27 33 3037 34 23 6 13 12 31 41 0 27 33 3037 34 23 6 13 12 31 41 0 27 33 3037 34 23 6 13 12 31 41 0 27 33 30 House 8% 13% 7% 7% 9% 10% 9% 9% 8% 8% 9% 6% 14% 7% 10% 9% House 8% 13% 7% 7% 9% 10% 9% 9% 8% 8% 9% 6% 14% 7% 10% 9% House 8% 13% 7% 7% 9% 10% 9% 9% 8% 8% 9% 6% 14% 7% 10% 9% House 8% 13% 7% 7% 9% 10% 9% 9% 8% 8% 9% 6% 14% 7% 10% 9% 9% 14% *% 10% 7% 10%9% 14% *% 10% 7% 10%9% 14% *% 10% 7% 10%9% 14% *% 10% 7% 10% cd L S S cd L S S cd L S S cd L S S Infrastructure 48 12 7 18 10 Infrastructure 48 12 7 18 10 Infrastructure 48 12 7 18 10 Infrastructure 48 12 7 18 10 ---- 22 19 7 33 15 32 11 4 9 7 22 19 7 33 15 32 11 4 9 7 22 19 7 33 15 32 11 4 9 7 22 19 7 33 15 32 11 4 9 7 26 15 14 19 27 1826 15 14 19 27 1826 15 14 19 27 1826 15 14 19 27 18 6% 8% 4% 6% 5% 9% 6% 3% 8% 3% 6% 6% 4% 7% 5% 7% 5% 6% 7% 6% 6% 8% 4% 6% 5% 9% 6% 3% 8% 3% 6% 6% 4% 7% 5% 7% 5% 6% 7% 6% 6% 8% 4% 6% 5% 9% 6% 3% 8% 3% 6% 6% 4% 7% 5% 7% 5% 6% 7% 6% 6% 8% 4% 6% 5% 9% 6% 3% 8% 3% 6% 6% 4% 7% 5% 7% 5% 6% 7% 6% 6%6%6%6% i K i K i K i K Comparison Groups: BCDE/FGHI/JK/LM/NOPQ/RST/UVComparison Groups: BCDE/FGHI/JK/LM/NOPQ/RST/UVComparison Groups: BCDE/FGHI/JK/LM/NOPQ/RST/UVComparison Groups: BCDE/FGHI/JK/LM/NOPQ/RST/UV Independent ZIndependent ZIndependent ZIndependent Z----Test for Percentages (unpooled proportions)Test for Percentages (unpooled proportions)Test for Percentages (unpooled proportions)Test for Percentages (unpooled proportions) Uppercase letters indicate significance at the 95% level.Uppercase letters indicate significance at the 95% level.Uppercase letters indicate significance at the 95% level.Uppercase letters indicate significance at the 95% level. Lowercase letters indicate significance at the 90% level.Lowercase letters indicate significance at the 90% level.Lowercase letters indicate significance at the 90% level.Lowercase letters indicate significance at the 90% level.

Table I1A Page 44Table I1A Page 44Table I1A Page 44Table I1A Page 44 (Continued)(Continued)(Continued)(Continued) Investor's Business Daily/TIPP PollInvestor's Business Daily/TIPP PollInvestor's Business Daily/TIPP PollInvestor's Business Daily/TIPP Poll---- December 2018, Field 11/26 to 12/2 , Sample December 2018, Field 11/26 to 12/2 , Sample December 2018, Field 11/26 to 12/2 , Sample December 2018, Field 11/26 to 12/2 , Sample ---- 823 adults, MOE +/823 adults, MOE +/823 adults, MOE +/823 adults, MOE +/----3.3 pts3.3 pts3.3 pts3.3 pts, Traditional phone with live interviewers , Traditional phone with live interviewers , Traditional phone with live interviewers , Traditional phone with live interviewers I1AI1AI1AI1A Which of the following issues should be given the HIGHEST priority by Congress in the new year?Which of the following issues should be given the HIGHEST priority by Congress in the new year?Which of the following issues should be given the HIGHEST priority by Congress in the new year?Which of the following issues should be given the HIGHEST priority by Congress in the new year? ======= REGION ======== ========= AGE ========= ==GENDER== ===RACE === ======== REGION ======== ========= AGE ========= ==GENDER== ===RACE === ======== REGION ======== ========= AGE ========= ==GENDER== ===RACE === ======== REGION ======== ========= AGE ========= ==GENDER== ===RACE === ======= INCOME ======= =====PARTY===== ==INVESTOR======= INCOME ======= =====PARTY===== ==INVESTOR======= INCOME ======= =====PARTY===== ==INVESTOR======= INCOME ======= =====PARTY===== ==INVESTOR= TOTAL BLACK UND 30KTOTAL BLACK UND 30KTOTAL BLACK UND 30KTOTAL BLACK UND 30K---- 50K50K50K50K---- NE MW SONE MW SONE MW SONE MW SOUTH WEST 18UTH WEST 18UTH WEST 18UTH WEST 18----24 2524 2524 2524 25----44 4544 4544 4544 45----64 65+ MALE FEM. WHITE HISP 30K 50K 75K 75K+ DEM REP IND YES NO 64 65+ MALE FEM. WHITE HISP 30K 50K 75K 75K+ DEM REP IND YES NO 64 65+ MALE FEM. WHITE HISP 30K 50K 75K 75K+ DEM REP IND YES NO 64 65+ MALE FEM. WHITE HISP 30K 50K 75K 75K+ DEM REP IND YES NO -------------------- -------------------- -------------------- -------------------- -------------------- -------------------- -------------------- -------------------- -------------------- -------------------- -------------------- -------------------- -------------------- -------------------- -------------------- -------------------- -------------------- -------------------- -------------------- -------------------- -------------------- -------------------- (A) (B) (C) (D) (E) (F) (G) (H) (I) (J) (K) (L) (M) (N) (O) (P) (Q) (R) (S) (T) (U) (A) (B) (C) (D) (E) (F) (G) (H) (I) (J) (K) (L) (M) (N) (O) (P) (Q) (R) (S) (T) (U) (A) (B) (C) (D) (E) (F) (G) (H) (I) (J) (K) (L) (M) (N) (O) (P) (Q) (R) (S) (T) (U) (A) (B) (C) (D) (E) (F) (G) (H) (I) (J) (K) (L) (M) (N) (O) (P) (Q) (R) (S) (T) (U) (V)(V)(V)(V) Criminal justice reform 25 3 2 14 6 1 14 4 4 Criminal justice reform 25 3 2 14 6 1 14 4 4 Criminal justice reform 25 3 2 14 6 1 14 4 4 Criminal justice reform 25 3 2 14 6 1 14 4 4 14 11 16 8 3 10 6 3 12 5 7 6 1814 11 16 8 3 10 6 3 12 5 7 6 1814 11 16 8 3 10 6 3 12 5 7 6 1814 11 16 8 3 10 6 3 12 5 7 6 18 3% 2% 1% 5% 3% 3% 6% 1% 2% 4% 3% 3% 4% 3% 7% 5% 1% 4% 2% 2% 1% 3% 2% 1% 5% 3% 3% 6% 1% 2% 4% 3% 3% 4% 3% 7% 5% 1% 4% 2% 2% 1% 3% 2% 1% 5% 3% 3% 6% 1% 2% 4% 3% 3% 4% 3% 7% 5% 1% 4% 2% 2% 1% 3% 2% 1% 5% 3% 3% 6% 1% 2% 4% 3% 3% 4% 3% 7% 5% 1% 4% 2% 2% 1% 6%6%6%6% C h Q Q UC h Q Q UC h Q Q UC h Q Q U Not sure 4 1 2 1 0 Not sure 4 1 2 1 0 Not sure 4 1 2 1 0 Not sure 4 1 2 1 0 ---- ---- 3 1 2 3 43 1 2 3 43 1 2 3 43 1 2 3 4 ---- 3 0 3 0 3 0 3 0 ---- 1 2 1 1 1 31 2 1 1 1 31 2 1 1 1 31 2 1 1 1 3 1% *% 1% *% *% 1% 1% *% 1% 1% 3% *% *% 1% *% *% *% 1% *% 1% *% *% 1% 1% *% 1% 1% 3% *% *% 1% *% *% *% 1% *% 1% *% *% 1% 1% *% 1% 1% 3% *% *% 1% *% *% *% 1% *% 1% *% *% 1% 1% *% 1% 1% 3% *% *% 1% *% *% *% 1%1%1%1% Refused 2 Refused 2 Refused 2 Refused 2 2 2 2 2 ---- ---- ---- ---- ---- ---- 2 2 2 2 ---- 2 2 2 2 ---- 2 2 2 2 ---- ---- ---- ---- 2 2 2 2 ---- ---- ---- ---- *% 1% 1% *% 1% 1% *% 1% 1% *% 1% 1% *% 1% 1% *% 1% 1% *% 1% 1% *% 1% 1% Comparison Groups: BCDE/FGHI/JK/LM/NOPQ/RST/UVComparison Groups: BCDE/FGHI/JK/LM/NOPQ/RST/UVComparison Groups: BCDE/FGHI/JK/LM/NOPQ/RST/UVComparison Groups: BCDE/FGHI/JK/LM/NOPQ/RST/UV Independent ZIndependent ZIndependent ZIndependent Z----Test for Percentages (unpooled proportions)Test for Percentages (unpooled proportions)Test for Percentages (unpooled proportions)Test for Percentages (unpooled proportions) Uppercase letters indicate significance at the 95% level.Uppercase letters indicate significance at the 95% level.Uppercase letters indicate significance at the 95% level.Uppercase letters indicate significance at the 95% level. Lowercase letters indicate significance at the 90% level.Lowercase letters indicate significance at the 90% level.Lowercase letters indicate significance at the 90% level.Lowercase letters indicate significance at the 90% level.

Table I1A Page 45Table I1A Page 45Table I1A Page 45Table I1A Page 45 Investor's Business Daily/TIPP PollInvestor's Business Daily/TIPP PollInvestor's Business Daily/TIPP PollInvestor's Business Daily/TIPP Poll---- December 2018, Field 11/26 to 12/2 , Sample December 2018, Field 11/26 to 12/2 , Sample December 2018, Field 11/26 to 12/2 , Sample December 2018, Field 11/26 to 12/2 , Sample ---- 823 adults, MOE +/823 adults, MOE +/823 adults, MOE +/823 adults, MOE +/----3.3 pts, Traditional phone with live interviewers 3.3 pts, Traditional phone with live interviewers 3.3 pts, Traditional phone with live interviewers 3.3 pts, Traditional phone with live interviewers I1AI1AI1AI1A Which of the followWhich of the followWhich of the followWhich of the following issues should be given the HIGHEST priority by Congress in the new year?ing issues should be given the HIGHEST priority by Congress in the new year?ing issues should be given the HIGHEST priority by Congress in the new year?ing issues should be given the HIGHEST priority by Congress in the new year? ====AREA TYPE==== ===WHITE=== ==BLK/HISP= ==MAR.STAT= ====EDUCATION==== ====IDEOLOOGY========AREA TYPE==== ===WHITE=== ==BLK/HISP= ==MAR.STAT= ====EDUCATION==== ====IDEOLOOGY========AREA TYPE==== ===WHITE=== ==BLK/HISP= ==MAR.STAT= ====EDUCATION==== ====IDEOLOOGY========AREA TYPE==== ===WHITE=== ==BLK/HISP= ==MAR.STAT= ====EDUCATION==== ====IDEOLOOGY==== SUBSUBSUBSUB---- WHITE SINGL MARR HIGH SOME WHITE SINGL MARR HIGH SOME WHITE SINGL MARR HIGH SOME WHITE SINGL MARR HIGH SOME TOTAL URBAN URBAN RURAL MEN WOMEN BLACK HIS. WOMEN WOM SCHL. COLL. COLL+ CONS. MOD. LIB.TOTAL URBAN URBAN RURAL MEN WOMEN BLACK HIS. WOMEN WOM SCHL. COLL. COLL+ CONS. MOD. LIB.TOTAL URBAN URBAN RURAL MEN WOMEN BLACK HIS. WOMEN WOM SCHL. COLL. COLL+ CONS. MOD. LIB.TOTAL URBAN URBAN RURAL MEN WOMEN BLACK HIS. WOMEN WOM SCHL. COLL. COLL+ CONS. MOD. LIB. -------------------- -------------------- -------------------- -------------------- -------------------- -------------------- -------------------- -------------------- -------------------- -------------------- -------------------- -------------------- -------------------- -------------------- -------------------- -------------------- (A) (B) (C) (D) (E) (F) (G) (H) (I) (J) (K) (L) (M) (N) (O) (P)(A) (B) (C) (D) (E) (F) (G) (H) (I) (J) (K) (L) (M) (N) (O) (P)(A) (B) (C) (D) (E) (F) (G) (H) (I) (J) (K) (L) (M) (N) (O) (P)(A) (B) (C) (D) (E) (F) (G) (H) (I) (J) (K) (L) (M) (N) (O) (P) TOTAL TOTAL TOTAL TOTAL 823 192 400 211 267 290 118 55 182 241 157 216 430 328 247 214823 192 400 211 267 290 118 55 182 241 157 216 430 328 247 214823 192 400 211 267 290 118 55 182 241 157 216 430 328 247 214823 192 400 211 267 290 118 55 182 241 157 216 430 328 247 214 100% 100% 100% 100% 100% 100% 100% 100% 100% 100% 100% 100% 100% 100% 100% 100%100% 100% 100% 100% 100% 100% 100% 100% 100% 100% 100% 100% 100% 100% 100% 100%100% 100% 100% 100% 100% 100% 100% 100% 100% 100% 100% 100% 100% 100% 100% 100%100% 100% 100% 100% 100% 100% 100% 100% 100% 100% 100% 100% 100% 100% 100% 100% Unweighted Total 823 Unweighted Total 823 Unweighted Total 823 Unweighted Total 823 172 385 244 340 305 73 35 178 205 161 222 417 395 233 162172 385 244 340 305 73 35 178 205 161 222 417 395 233 162172 385 244 340 305 73 35 178 205 161 222 417 395 233 162172 385 244 340 305 73 35 178 205 161 222 417 395 233 162 Healthcare costs 180 44 96 37 52 69 33 11 31 73 37 50 88 47 83 42Healthcare costs 180 44 96 37 52 69 33 11 31 73 37 50 88 47 83 42Healthcare costs 180 44 96 37 52 69 33 11 31 73 37 50 88 47 83 42Healthcare costs 180 44 96 37 52 69 33 11 31 73 37 50 88 47 83 42 22% 23% 24% 22% 23% 24% 22% 23% 24% 22% 23% 24% 18% 19% 24% 28% 20% 17% 30% 24% 23% 20% 14% 34% 20%18% 19% 24% 28% 20% 17% 30% 24% 23% 20% 14% 34% 20%18% 19% 24% 28% 20% 17% 30% 24% 23% 20% 14% 34% 20%18% 19% 24% 28% 20% 17% 30% 24% 23% 20% 14% 34% 20% I NP I NP I NP I NP Immigration 156 28 72 50 67 Immigration 156 28 72 50 67 Immigration 156 28 72 50 67 Immigration 156 28 72 50 67 59 8 5 28 43 34 41 72 111 23 1759 8 5 28 43 34 41 72 111 23 1759 8 5 28 43 34 41 72 111 23 1759 8 5 28 43 34 41 72 111 23 17 19% 15% 18% 24% 25% 20% 6% 9% 15% 18% 22% 19% 17% 34% 9% 8%19% 15% 18% 24% 25% 20% 6% 9% 15% 18% 22% 19% 17% 34% 9% 8%19% 15% 18% 24% 25% 20% 6% 9% 15% 18% 22% 19% 17% 34% 9% 8%19% 15% 18% 24% 25% 20% 6% 9% 15% 18% 22% 19% 17% 34% 9% 8% b b b b OP OP OP OP Economy and Jobs 104 21 46 35 43 31 10 4 21 28 26 29 47 56 28 16Economy and Jobs 104 21 46 35 43 31 10 4 21 28 26 29 47 56 28 16Economy and Jobs 104 21 46 35 43 31 10 4 21 28 26 29 47 56 28 16Economy and Jobs 104 21 46 35 43 31 10 4 21 28 26 29 47 56 28 16 13% 11% 12% 16% 16% 11% 9% 7% 11%13% 11% 12% 16% 16% 11% 9% 7% 11%13% 11% 12% 16% 16% 11% 9% 7% 11%13% 11% 12% 16% 16% 11% 9% 7% 11% 12% 17% 13% 11% 17% 11% 8%12% 17% 13% 11% 17% 11% 8%12% 17% 13% 11% 17% 11% 8%12% 17% 13% 11% 17% 11% 8% P P P P National security 86 14 37 34 26 35 8 7 19 26 1National security 86 14 37 34 26 35 8 7 19 26 1National security 86 14 37 34 26 35 8 7 19 26 1National security 86 14 37 34 26 35 8 7 19 26 15 23 46 60 21 35 23 46 60 21 35 23 46 60 21 35 23 46 60 21 3 10% 7% 9% 16% 10% 12% 7% 12% 11% 11% 10% 11% 11% 18% 8% 1%10% 7% 9% 16% 10% 12% 7% 12% 11% 11% 10% 11% 11% 18% 8% 1%10% 7% 9% 16% 10% 12% 7% 12% 11% 11% 10% 11% 11% 18% 8% 1%10% 7% 9% 16% 10% 12% 7% 12% 11% 11% 10% 11% 11% 18% 8% 1% BC BC BC BC OP P OP P OP P OP P Climate change 79 18 44 16 20 32 5 11 23 18 7 24 47 7 20 48Climate change 79 18 44 16 20 32 5 11 23 18 7 24 47 7 20 48Climate change 79 18 44 16 20 32 5 11 23 18 7 24 47 7 20 48Climate change 79 18 44 16 20 32 5 11 23 18 7 24 47 7 20 48 10% 9% 11% 8% 8% 11% 5% 20% 12% 8% 5% 11% 11% 2% 8% 23%10% 9% 11% 8% 8% 11% 5% 20% 12% 8% 5% 11% 11% 2% 8% 23%10% 9% 11% 8% 8% 11% 5% 20% 12% 8% 5% 11% 11% 2% 8% 23%10% 9% 11% 8% 8% 11% 5% 20% 12% 8% 5% 11% 11% 2% 8% 23% G K K N NOG K K N NOG K K N NOG K K N NO GunGunGunGun----relatedrelatedrelatedrelated issues 70 15 44 11 11 24 23 4 29 18 13 12 44 8 29 32issues 70 15 44 11 11 24 23 4 29 18 13 12 44 8 29 32issues 70 15 44 11 11 24 23 4 29 18 13 12 44 8 29 32issues 70 15 44 11 11 24 23 4 29 18 13 12 44 8 29 32 9% 8% 11% 5% 4% 8% 19% 8% 16% 8% 9% 5% 10% 3% 12% 15%9% 8% 11% 5% 4% 8% 19% 8% 16% 8% 9% 5% 10% 3% 12% 15%9% 8% 11% 5% 4% 8% 19% 8% 16% 8% 9% 5% 10% 3% 12% 15%9% 8% 11% 5% 4% 8% 19% 8% 16% 8% 9% 5% 10% 3% 12% 15% D e h J L N ND e h J L N ND e h J L N ND e h J L N N Investigating the White 69 26 27 14 16 18 16 7 17 19 5 19 44 10 18 35Investigating the White 69 26 27 14 16 18 16 7 17 19 5 19 44 10 18 35Investigating the White 69 26 27 14 16 18 16 7 17 19 5 19 44 10 18 35Investigating the White 69 26 27 14 16 18 16 7 17 19 5 19 44 10 18 35 House 8% House 8% House 8% House 8% 13% 7% 6% 6% 6% 14% 13% 9% 8% 3% 9% 10% 3% 7% 16%13% 7% 6% 6% 6% 14% 13% 9% 8% 3% 9% 10% 3% 7% 16%13% 7% 6% 6% 6% 14% 13% 9% 8% 3% 9% 10% 3% 7% 16%13% 7% 6% 6% 6% 14% 13% 9% 8% 3% 9% 10% 3% 7% 16% cd K K n NOcd K K n NOcd K K n NOcd K K n NO Infrastructure 48 17 17 Infrastructure 48 17 17 Infrastructure 48 17 17 Infrastructure 48 17 17 12 22 9 8 3 9 6 8 12 28 19 17 1012 22 9 8 3 9 6 8 12 28 19 17 1012 22 9 8 3 9 6 8 12 28 19 17 1012 22 9 8 3 9 6 8 12 28 19 17 10 6% 9% 4% 6% 8% 3% 7% 5% 5% 2% 5% 6% 7% 6% 7% 5%6% 9% 4% 6% 8% 3% 7% 5% 5% 2% 5% 6% 7% 6% 7% 5%6% 9% 4% 6% 8% 3% 7% 5% 5% 2% 5% 6% 7% 6% 7% 5%6% 9% 4% 6% 8% 3% 7% 5% 5% 2% 5% 6% 7% 6% 7% 5% c F c F c F c F Comparison Groups: BCD/EF/GH/IJ/KLM/NOPComparison Groups: BCD/EF/GH/IJ/KLM/NOPComparison Groups: BCD/EF/GH/IJ/KLM/NOPComparison Groups: BCD/EF/GH/IJ/KLM/NOP Independent ZIndependent ZIndependent ZIndependent Z----Test for Percentages (unpooled proportions)Test for Percentages (unpooled proportions)Test for Percentages (unpooled proportions)Test for Percentages (unpooled proportions) Uppercase letters indicate significance at the 95% level.Uppercase letters indicate significance at the 95% level.Uppercase letters indicate significance at the 95% level.Uppercase letters indicate significance at the 95% level. Lowercase letters indicate siLowercase letters indicate siLowercase letters indicate siLowercase letters indicate significance at the 90% level.gnificance at the 90% level.gnificance at the 90% level.gnificance at the 90% level.

Table I1A Page 46Table I1A Page 46Table I1A Page 46Table I1A Page 46 (Continued)(Continued)(Continued)(Continued) Investor's Business Daily/TIPP PollInvestor's Business Daily/TIPP PollInvestor's Business Daily/TIPP PollInvestor's Business Daily/TIPP Poll---- December 2018, Field 11/26 to 12/2 , Sample December 2018, Field 11/26 to 12/2 , Sample December 2018, Field 11/26 to 12/2 , Sample December 2018, Field 11/26 to 12/2 , Sample ---- 823 adults, MOE +/823 adults, MOE +/823 adults, MOE +/823 adults, MOE +/----3.3 pts, Traditional phone with live interviewers 3.3 pts, Traditional phone with live interviewers 3.3 pts, Traditional phone with live interviewers 3.3 pts, Traditional phone with live interviewers I1AI1AI1AI1A Which of the following issues should be given the HIGHEST priority by Congress in the new year?Which of the following issues should be given the HIGHEST priority by Congress in the new year?Which of the following issues should be given the HIGHEST priority by Congress in the new year?Which of the following issues should be given the HIGHEST priority by Congress in the new year? ====AREA TYPE==== ===WHITE=== ==BLK/HISP= ==MAR.STAT= ====EDUCATION==== ====IDEOLOOGY========AREA TYPE==== ===WHITE=== ==BLK/HISP= ==MAR.STAT= ====EDUCATION==== ====IDEOLOOGY========AREA TYPE==== ===WHITE=== ==BLK/HISP= ==MAR.STAT= ====EDUCATION==== ====IDEOLOOGY========AREA TYPE==== ===WHITE=== ==BLK/HISP= ==MAR.STAT= ====EDUCATION==== ====IDEOLOOGY==== SUBSUBSUBSUB---- WHITE SINGL MARR HIGH SOME WHITE SINGL MARR HIGH SOME WHITE SINGL MARR HIGH SOME WHITE SINGL MARR HIGH SOME TOTAL URBAN URBAN RURAL MEN WOMEN BLACK HIS. WOMEN WOM SCHL. COLL. COLL+ CONS. MOD. LIB.TOTAL URBAN URBAN RURAL MEN WOMEN BLACK HIS. WOMEN WOM SCHL. COLL. COLL+ CONS. MOD. LIB.TOTAL URBAN URBAN RURAL MEN WOMEN BLACK HIS. WOMEN WOM SCHL. COLL. COLL+ CONS. MOD. LIB.TOTAL URBAN URBAN RURAL MEN WOMEN BLACK HIS. WOMEN WOM SCHL. COLL. COLL+ CONS. MOD. LIB. -------------------- -------------------- -------------------- -------------------- -------------------- -------------------- -------------------- -------------------- -------------------- -------------------- -------------------- -------------------- -------------------- -------------------- -------------------- -------------------- (A) (B) (C) (D) (E) (F) (G) (H) (I) (J) (K) (L) (M) (N) (O) (P)(A) (B) (C) (D) (E) (F) (G) (H) (I) (J) (K) (L) (M) (N) (O) (P)(A) (B) (C) (D) (E) (F) (G) (H) (I) (J) (K) (L) (M) (N) (O) (P)(A) (B) (C) (D) (E) (F) (G) (H) (I) (J) (K) (L) (M) (N) (O) (P) Criminal justice reform 25 8 14 2 7 Criminal justice reform 25 8 14 2 7 Criminal justice reform 25 8 14 2 7 Criminal justice reform 25 8 14 2 7 9 4 3 4 7 10 4 11 9 5 109 4 3 4 7 10 4 11 9 5 109 4 3 4 7 10 4 11 9 5 109 4 3 4 7 10 4 11 9 5 10 3% 4% 4% 1% 3% 3% 4% 6% 2% 3% 7% 2% 3% 3% 2% 5%3% 4% 4% 1% 3% 3% 4% 6% 2% 3% 7% 2% 3% 3% 2% 5%3% 4% 4% 1% 3% 3% 4% 6% 2% 3% 7% 2% 3% 3% 2% 5%3% 4% 4% 1% 3% 3% 4% 6% 2% 3% 7% 2% 3% 3% 2% 5% d D d D d D d D Lm Lm Lm Lm Not sure 4 Not sure 4 Not sure 4 Not sure 4 ---- 3 1 2 3 3 1 2 3 3 1 2 3 3 1 2 3 ---- ---- 1 1 0 3 1 1 4 1 1 0 3 1 1 4 1 1 0 3 1 1 4 1 1 0 3 1 1 4 ---- 1% 1% 1% 1% 1% 1% 1% 1% 1% 1% 1% 1% 1% 1% 1% 1% 1% 1% 1% 1% 1% 1% 1% 1% 1% *% 1% *% *% 1% 1% *% 1% *% *% 1% 1% *% 1% *% *% 1% 1% *% 1% *% *% 1% Refused 2 2 Refused 2 2 Refused 2 2 Refused 2 2 ---- ---- ---- ---- 2 2 2 2 ---- ---- 2 2 2 2 ---- ---- 2 2 2 2 ---- ---- ---- *% 1% 1% 1% *% 1% 1% 1% *% 1% 1% 1% *% 1% 1% 1% *% *% *% *% Comparison Groups: BCD/EF/GH/IJ/KLM/NOPComparison Groups: BCD/EF/GH/IJ/KLM/NOPComparison Groups: BCD/EF/GH/IJ/KLM/NOPComparison Groups: BCD/EF/GH/IJ/KLM/NOP Independent ZIndependent ZIndependent ZIndependent Z----Test for Percentages (unpooled proportions)Test for Percentages (unpooled proportions)Test for Percentages (unpooled proportions)Test for Percentages (unpooled proportions) Uppercase letters indicate significance at the 95% level.Uppercase letters indicate significance at the 95% level.Uppercase letters indicate significance at the 95% level.Uppercase letters indicate significance at the 95% level. Lowercase letters indicate significance at the 90% level.Lowercase letters indicate significance at the 90% level.Lowercase letters indicate significance at the 90% level.Lowercase letters indicate significance at the 90% level.

Table I1B Page 47Table I1B Page 47Table I1B Page 47Table I1B Page 47 Investor's Business Daily/TIPP PollInvestor's Business Daily/TIPP PollInvestor's Business Daily/TIPP PollInvestor's Business Daily/TIPP Poll---- December 2018, Field 11/26 to 12/2 , Sample December 2018, Field 11/26 to 12/2 , Sample December 2018, Field 11/26 to 12/2 , Sample December 2018, Field 11/26 to 12/2 , Sample ---- 823 adults, MOE +/823 adults, MOE +/823 adults, MOE +/823 adults, MOE +/----3.3 pts, Traditional phone with live interviewers 3.3 pts, Traditional phone with live interviewers 3.3 pts, Traditional phone with live interviewers 3.3 pts, Traditional phone with live interviewers I1BI1BI1BI1B Which of these issuWhich of these issuWhich of these issuWhich of these issues should be given the SECOND HIGHEST priority by Congress at the start of 2019?es should be given the SECOND HIGHEST priority by Congress at the start of 2019?es should be given the SECOND HIGHEST priority by Congress at the start of 2019?es should be given the SECOND HIGHEST priority by Congress at the start of 2019? ======= REGION ======== ========= AGE ========= ==GENDER== ===RACE === ======= INCOME ======= =====PARTY===== ==INVESTOR======== REGION ======== ========= AGE ========= ==GENDER== ===RACE === ======= INCOME ======= =====PARTY===== ==INVESTOR======== REGION ======== ========= AGE ========= ==GENDER== ===RACE === ======= INCOME ======= =====PARTY===== ==INVESTOR======== REGION ======== ========= AGE ========= ==GENDER== ===RACE === ======= INCOME ======= =====PARTY===== ==INVESTOR= TOTAL BLACK UND 30KTOTAL BLACK UND 30KTOTAL BLACK UND 30KTOTAL BLACK UND 30K---- 50K50K50K50K---- NE MW SOUTH WEST 18NE MW SOUTH WEST 18NE MW SOUTH WEST 18NE MW SOUTH WEST 18----24 2524 2524 2524 25----44 4544 4544 4544 45----64 65+ MALE FEM. WHITE HISP 30K 64 65+ MALE FEM. WHITE HISP 30K 64 65+ MALE FEM. WHITE HISP 30K 64 65+ MALE FEM. WHITE HISP 30K 50K 75K 75K+ DEM REP IND YES NO 50K 75K 75K+ DEM REP IND YES NO 50K 75K 75K+ DEM REP IND YES NO 50K 75K 75K+ DEM REP IND YES NO -------------------- -------------------- -------------------- -------------------- -------------------- -------------------- -------------------- -------------------- -------------------- -------------------- -------------------- -------------------- -------------------- -------------------- -------------------- -------------------- -------------------- -------------------- -------------------- -------------------- -------------------- -------------------- (A) (B) (C) (D) (A) (B) (C) (D) (A) (B) (C) (D) (A) (B) (C) (D) (E) (F) (G) (H) (I) (J) (K) (L) (M) (N) (O) (P) (Q) (R) (S) (T) (U) (V)(E) (F) (G) (H) (I) (J) (K) (L) (M) (N) (O) (P) (Q) (R) (S) (T) (U) (V)(E) (F) (G) (H) (I) (J) (K) (L) (M) (N) (O) (P) (Q) (R) (S) (T) (U) (V)(E) (F) (G) (H) (I) (J) (K) (L) (M) (N) (O) (P) (Q) (R) (S) (T) (U) (V) TOTAL 823 147 181 309 186 45 234 293 207 393 430 556 171 92 131 138 3TOTAL 823 147 181 309 186 45 234 293 207 393 430 556 171 92 131 138 3TOTAL 823 147 181 309 186 45 234 293 207 393 430 556 171 92 131 138 3TOTAL 823 147 181 309 186 45 234 293 207 393 430 556 171 92 131 138 363 286 237 283 63 286 237 283 63 286 237 283 63 286 237 283 447 309447 309447 309447 309 100% 100% 100% 100% 100% 100% 100% 100% 100% 100% 100% 100% 100% 100% 100% 100% 100% 100% 100% 100% 100% 100% 100% 100% 100% 100% 100% 100% 100% 100% 100% 100% 100% 100% 100% 100% 100% 100% 100% 100% 100% 100% 100% 100% 100% 100% 100% 100% 100% 100% 100% 100% 100% 100% 100% 100% 100% 100% 100% 100% 100% 100% 100% 100% 100% 100% 100% 100% 100% 100% 100% 100% 100% 100% 100% 100% 100% 100% 100% 100% 100% 100% 100% 100% 100%100%100%100% Unweighted Total 823 158 180 311 174 17 102 289 371 433 Unweighted Total 823 158 180 311 174 17 102 289 371 433 Unweighted Total 823 158 180 311 174 17 102 289 371 433 Unweighted Total 823 158 180 311 174 17 102 289 371 433 390 645 107 104 145 126 337 247 296 262 472 282390 645 107 104 145 126 337 247 296 262 472 282390 645 107 104 145 126 337 247 296 262 472 282390 645 107 104 145 126 337 247 296 262 472 282 Healthcare costs 147 27 34 65 21 13 41 40 45 65 81 101 32 21 24 22 Healthcare costs 147 27 34 65 21 13 41 40 45 65 81 101 32 21 24 22 Healthcare costs 147 27 34 65 21 13 41 40 45 65 81 101 32 21 24 22 Healthcare costs 147 27 34 65 21 13 41 40 45 65 81 101 32 21 24 22 57 53 40 50 78 5557 53 40 50 78 5557 53 40 50 78 5557 53 40 50 78 55 18% 18% 19% 21% 11% 30% 18% 14% 22% 17% 19% 18% 19% 22% 18% 16% 16% 19% 17% 18% 17% 18% 18% 19% 21% 11% 30% 18% 14% 22% 17% 19% 18% 19% 22% 18% 16% 16% 19% 17% 18% 17% 18% 18% 19% 21% 11% 30% 18% 14% 22% 17% 19% 18% 19% 22% 18% 16% 16% 19% 17% 18% 17% 18% 18% 19% 21% 11% 30% 18% 14% 22% 17% 19% 18% 19% 22% 18% 16% 16% 19% 17% 18% 17% 18%18%18%18% E H E H E H E H Immigration 143 24 37 52 30 8 49 52 27 65 79 108 28 20 31 34 Immigration 143 24 37 52 30 8 49 52 27 65 79 108 28 20 31 34 Immigration 143 24 37 52 30 8 49 52 27 65 79 108 28 20 31 34 Immigration 143 24 37 52 30 8 49 52 27 65 79 108 28 20 31 34 47 48 53 39 73 5947 48 53 39 73 5947 48 53 39 73 5947 48 53 39 73 59 17% 17% 20% 17% 16% 19% 21% 18% 13% 16% 18% 19% 16% 21% 24% 24% 13% 17% 22% 14% 16% 17% 17% 20% 17% 16% 19% 21% 18% 13% 16% 18% 19% 16% 21% 24% 24% 13% 17% 22% 14% 16% 17% 17% 20% 17% 16% 19% 21% 18% 13% 16% 18% 19% 16% 21% 24% 24% 13% 17% 22% 14% 16% 17% 17% 20% 17% 16% 19% 21% 18% 13% 16% 18% 19% 16% 21% 24% 24% 13% 17% 22% 14% 16% 19%19%19%19% i i i i Q Q T Q Q T Q Q T Q Q T Economy and Jobs 142 34 34 44 31 5 39 58 36 83 59 90 34 12 21 24 Economy and Jobs 142 34 34 44 31 5 39 58 36 83 59 90 34 12 21 24 Economy and Jobs 142 34 34 44 31 5 39 58 36 83 59 90 34 12 21 24 Economy and Jobs 142 34 34 44 31 5 39 58 36 83 59 90 34 12 21 24 61 32 53 55 78 4961 32 53 55 78 4961 32 53 55 78 4961 32 53 55 78 49 17% 23%17% 23%17% 23%17% 23% 19% 14% 17% 11% 16% 20% 17% 21% 14% 16% 20% 13% 16% 18% 17% 11% 22% 19% 18% 16%19% 14% 17% 11% 16% 20% 17% 21% 14% 16% 20% 13% 16% 18% 17% 11% 22% 19% 18% 16%19% 14% 17% 11% 16% 20% 17% 21% 14% 16% 20% 13% 16% 18% 17% 11% 22% 19% 18% 16%19% 14% 17% 11% 16% 20% 17% 21% 14% 16% 20% 13% 16% 18% 17% 11% 22% 19% 18% 16% d K d K d K d K R R R R R R R R National security 92 14 21 35 22 3 21 40 18 43 48 70 9 12 11 17 National security 92 14 21 35 22 3 21 40 18 43 48 70 9 12 11 17 National security 92 14 21 35 22 3 21 40 18 43 48 70 9 12 11 17 National security 92 14 21 35 22 3 21 40 18 43 48 70 9 12 11 17 41 9 44 37 49 3241 9 44 37 49 3241 9 44 37 49 3241 9 44 37 49 32 11% 9% 12% 11% 12% 8% 9% 14% 11% 9% 12% 11% 12% 8% 9% 14% 11% 9% 12% 11% 12% 8% 9% 14% 11% 9% 12% 11% 12% 8% 9% 14% 9% 11% 11% 13% 5% 13% 8% 12% 11% 3% 18% 13% 11% 10%9% 11% 11% 13% 5% 13% 8% 12% 11% 3% 18% 13% 11% 10%9% 11% 11% 13% 5% 13% 8% 12% 11% 3% 18% 13% 11% 10%9% 11% 11% 13% 5% 13% 8% 12% 11% 3% 18% 13% 11% 10% M R R M R R M R R M R R InvestigatingInvestigatingInvestigatingInvestigating the White 65 6 12 22 24 the White 65 6 12 22 24 the White 65 6 12 22 24 the White 65 6 12 22 24 ---- 15 29 19 25 40 42 16 6 6 6 42 44 5 16 46 1715 29 19 25 40 42 16 6 6 6 42 44 5 16 46 1715 29 19 25 40 42 16 6 6 6 42 44 5 16 46 1715 29 19 25 40 42 16 6 6 6 42 44 5 16 46 17 House 8% 4% 7% 7% 13% 6% 10% 9% 6% 9% 8% 9% 6% House 8% 4% 7% 7% 13% 6% 10% 9% 6% 9% 8% 9% 6% House 8% 4% 7% 7% 13% 6% 10% 9% 6% 9% 8% 9% 6% House 8% 4% 7% 7% 13% 6% 10% 9% 6% 9% 8% 9% 6% 4% 4% 12% 15% 2% 6% 10% 6%4% 4% 12% 15% 2% 6% 10% 6%4% 4% 12% 15% 2% 6% 10% 6%4% 4% 12% 15% 2% 6% 10% 6% Bd OP ST s V Bd OP ST s V Bd OP ST s V Bd OP ST s V Infrastructure 62 15 9 26 Infrastructure 62 15 9 26 Infrastructure 62 15 9 26 Infrastructure 62 15 9 26 13 2 15 26 14 35 27 41 9 2 7 13 32 18 22 20 36 2113 2 15 26 14 35 27 41 9 2 7 13 32 18 22 20 36 2113 2 15 26 14 35 27 41 9 2 7 13 32 18 22 20 36 2113 2 15 26 14 35 27 41 9 2 7 13 32 18 22 20 36 21 8% 10% 5% 8% 7% 4% 6% 9% 7% 9% 6% 7% 5% 2% 5% 10% 9% 6% 9% 7% 8% 10% 5% 8% 7% 4% 6% 9% 7% 9% 6% 7% 5% 2% 5% 10% 9% 6% 9% 7% 8% 10% 5% 8% 7% 4% 6% 9% 7% 9% 6% 7% 5% 2% 5% 10% 9% 6% 9% 7% 8% 10% 5% 8% 7% 4% 6% 9% 7% 9% 6% 7% 5% 2% 5% 10% 9% 6% 9% 7% 8% 7%8% 7%8% 7%8% 7% n n n n n n n n Climate change 59 8 17 17 17 Climate change 59 8 17 17 17 Climate change 59 8 17 17 17 Climate change 59 8 17 17 17 ---- 21 14 22 36 21 14 22 36 21 14 22 36 21 14 22 36 23 36 11 3 13 8 28 31 6 21 30 2423 36 11 3 13 8 28 31 6 21 30 2423 36 11 3 13 8 28 31 6 21 30 2423 36 11 3 13 8 28 31 6 21 30 24 7% 5% 9% 6% 9% 9% 5% 10% 9% 5% 6% 7% 4% 10% 6% 8% 11% 2% 8% 7% 7% 5% 9% 6% 9% 9% 5% 10% 9% 5% 6% 7% 4% 10% 6% 8% 11% 2% 8% 7% 7% 5% 9% 6% 9% 9% 5% 10% 9% 5% 6% 7% 4% 10% 6% 8% 11% 2% 8% 7% 7% 5% 9% 6% 9% 9% 5% 10% 9% 5% 6% 7% 4% 10% 6% 8% 11% 2% 8% 7% 8%8%8%8% H k n S S H k n S S H k n S S H k n S S Criminal justice reform 55 5 9 22 18 13 15 17 8 22 33 34 15 10 11 5 Criminal justice reform 55 5 9 22 18 13 15 17 8 22 33 34 15 10 11 5 Criminal justice reform 55 5 9 22 18 13 15 17 8 22 33 34 15 10 11 5 Criminal justice reform 55 5 9 22 18 13 15 17 8 22 33 34 15 10 11 5 29 23 6 25 25 2829 23 6 25 25 2829 23 6 25 25 2829 23 6 25 25 28 7% 4% 5% 7% 10% 29% 6% 6% 4% 6% 8% 6% 8% 11% 8% 4% 8% 8% 3% 9% 6% 7% 4% 5% 7% 10% 29% 6% 6% 4% 6% 8% 6% 8% 11% 8% 4% 8% 8% 3% 9% 6% 7% 4% 5% 7% 10% 29% 6% 6% 4% 6% 8% 6% 8% 11% 8% 4% 8% 8% 3% 9% 6% 7% 4% 5% 7% 10% 29% 6% 6% 4% 6% 8% 6% 8% 11% 8% 4% 8% 8% 3% 9% 6% 9%9%9%9% B ghI B ghI B ghI B ghI p S S p S S p S S p S S Comparison Groups: BCDE/FGHI/JK/LM/NOPQ/RST/UVComparison Groups: BCDE/FGHI/JK/LM/NOPQ/RST/UVComparison Groups: BCDE/FGHI/JK/LM/NOPQ/RST/UVComparison Groups: BCDE/FGHI/JK/LM/NOPQ/RST/UV Independent ZIndependent ZIndependent ZIndependent Z----Test for Percentages (unpooled proportions)Test for Percentages (unpooled proportions)Test for Percentages (unpooled proportions)Test for Percentages (unpooled proportions) Uppercase letters indicate significance at the 95% level.Uppercase letters indicate significance at the 95% level.Uppercase letters indicate significance at the 95% level.Uppercase letters indicate significance at the 95% level. Lowercase letters indicate significance at the 90% level.Lowercase letters indicate significance at the 90% level.Lowercase letters indicate significance at the 90% level.Lowercase letters indicate significance at the 90% level.

Table I1B Page 48Table I1B Page 48Table I1B Page 48Table I1B Page 48 (Continued)(Continued)(Continued)(Continued) Investor's Business Daily/TIPP PollInvestor's Business Daily/TIPP PollInvestor's Business Daily/TIPP PollInvestor's Business Daily/TIPP Poll---- December 2018, Field 11/26 to 12/2 , Sample December 2018, Field 11/26 to 12/2 , Sample December 2018, Field 11/26 to 12/2 , Sample December 2018, Field 11/26 to 12/2 , Sample ---- 823 adults, MOE +/823 adults, MOE +/823 adults, MOE +/823 adults, MOE +/----3.3 pts3.3 pts3.3 pts3.3 pts, Traditional phone with live interviewers , Traditional phone with live interviewers , Traditional phone with live interviewers , Traditional phone with live interviewers I1BI1BI1BI1B Which of these issues should be given the SECOND HIGHEST priority by Congress at the start of 2019?Which of these issues should be given the SECOND HIGHEST priority by Congress at the start of 2019?Which of these issues should be given the SECOND HIGHEST priority by Congress at the start of 2019?Which of these issues should be given the SECOND HIGHEST priority by Congress at the start of 2019? ======= REGION ======== ========= AGE ========= ==GENDER== ===RACE ========= REGION ======== ========= AGE ========= ==GENDER== ===RACE ========= REGION ======== ========= AGE ========= ==GENDER== ===RACE ========= REGION ======== ========= AGE ========= ==GENDER== ===RACE === ======= INCOME ======= =====PARTY===== ==INVESTOR== ======= INCOME ======= =====PARTY===== ==INVESTOR== ======= INCOME ======= =====PARTY===== ==INVESTOR== ======= INCOME ======= =====PARTY===== ==INVESTOR= TOTAL BLACK UND 30KTOTAL BLACK UND 30KTOTAL BLACK UND 30KTOTAL BLACK UND 30K---- 50K50K50K50K---- NE MW NE MW NE MW NE MW SOUTH WEST 18SOUTH WEST 18SOUTH WEST 18SOUTH WEST 18----24 2524 2524 2524 25----44 4544 4544 4544 45----64 65+ MALE FEM. WHITE HISP 30K 50K 75K 75K+ DEM REP IND YES NO 64 65+ MALE FEM. WHITE HISP 30K 50K 75K 75K+ DEM REP IND YES NO 64 65+ MALE FEM. WHITE HISP 30K 50K 75K 75K+ DEM REP IND YES NO 64 65+ MALE FEM. WHITE HISP 30K 50K 75K 75K+ DEM REP IND YES NO -------------------- -------------------- -------------------- -------------------- -------------------- -------------------- -------------------- -------------------- -------------------- -------------------- -------------------- -------------------- -------------------- -------------------- -------------------- -------------------- -------------------- -------------------- -------------------- -------------------- -------------------- -------------------- (A) (B) (C) (D) (E) (F) (G) (H) (I) (J) (K) (L) (M) (N) (O) (P) (Q) (R) (S) (T) (U) (A) (B) (C) (D) (E) (F) (G) (H) (I) (J) (K) (L) (M) (N) (O) (P) (Q) (R) (S) (T) (U) (A) (B) (C) (D) (E) (F) (G) (H) (I) (J) (K) (L) (M) (N) (O) (P) (Q) (R) (S) (T) (U) (A) (B) (C) (D) (E) (F) (G) (H) (I) (J) (K) (L) (M) (N) (O) (P) (Q) (R) (S) (T) (U) (V)(V)(V)(V) GunGunGunGun----related issues 51 12 6 23 9 related issues 51 12 6 23 9 related issues 51 12 6 23 9 related issues 51 12 6 23 9 ---- 19 15 1619 15 1619 15 1619 15 16 16 35 30 16 4 8 10 27 25 5 19 31 1916 35 30 16 4 8 10 27 25 5 19 31 1916 35 30 16 4 8 10 27 25 5 19 31 1916 35 30 16 4 8 10 27 25 5 19 31 19 6% 8% 4% 7% 5% 8% 5% 8% 4% 8% 5% 9% 4% 6% 7% 8% 9% 2% 7% 7% 6% 8% 4% 7% 5% 8% 5% 8% 4% 8% 5% 9% 4% 6% 7% 8% 9% 2% 7% 7% 6% 8% 4% 7% 5% 8% 5% 8% 4% 8% 5% 9% 4% 6% 7% 8% 9% 2% 7% 7% 6% 8% 4% 7% 5% 8% 5% 8% 4% 8% 5% 9% 4% 6% 7% 8% 9% 2% 7% 7% 6%6%6%6% j S S j S S j S S j S S Not sure 4 0 1 2 0 Not sure 4 0 1 2 0 Not sure 4 0 1 2 0 Not sure 4 0 1 2 0 ---- ---- 2 1 1 3 32 1 1 3 32 1 1 3 32 1 1 3 3 ---- 2 0 2 0 2 0 2 0 ---- ---- 1 2 0 1 2 0 1 2 0 1 2 0 ---- 3333 *% *% *% 1% *% 1% 1% *% 1% 1% 2% *% *% 1% *% *% *% *% 1% *% 1% 1% *% 1% 1% 2% *% *% 1% *% *% *% *% 1% *% 1% 1% *% 1% 1% 2% *% *% 1% *% *% *% *% 1% *% 1% 1% *% 1% 1% 2% *% *% 1% *% 1%1%1%1% Refused 2 Refused 2 Refused 2 Refused 2 2 2 2 2 ---- 1 1 1 1 ---- ---- ---- 1 2 1 2 1 2 1 1 2 1 2 1 2 1 1 2 1 2 1 2 1 1 2 1 2 1 2 1 ---- ---- ---- 2 2 2 2 ---- 1 1 1 1 ---- 1111 *% 1% *% *% 1% *% *% *% 1% 1% 1% *% 1% *% *% 1% *% *% *% 1% 1% 1% *% 1% *% *% 1% *% *% *% 1% 1% 1% *% 1% *% *% 1% *% *% *% 1% 1% 1% *% *%*% *%*% *%*% *% Comparison Groups: BCDE/FGHI/JK/LM/NOPQ/RST/UVComparison Groups: BCDE/FGHI/JK/LM/NOPQ/RST/UVComparison Groups: BCDE/FGHI/JK/LM/NOPQ/RST/UVComparison Groups: BCDE/FGHI/JK/LM/NOPQ/RST/UV Independent ZIndependent ZIndependent ZIndependent Z----Test for Percentages (unpooled proportions)Test for Percentages (unpooled proportions)Test for Percentages (unpooled proportions)Test for Percentages (unpooled proportions) Uppercase letters indicate significance at the 95% level.Uppercase letters indicate significance at the 95% level.Uppercase letters indicate significance at the 95% level.Uppercase letters indicate significance at the 95% level. Lowercase letters indicate significance at the 90% level.Lowercase letters indicate significance at the 90% level.Lowercase letters indicate significance at the 90% level.Lowercase letters indicate significance at the 90% level.

Table I1B Page 49Table I1B Page 49Table I1B Page 49Table I1B Page 49 Investor's Business Daily/TIPP PollInvestor's Business Daily/TIPP PollInvestor's Business Daily/TIPP PollInvestor's Business Daily/TIPP Poll---- December 2018, Field 11/26 to 12/2 , Sample December 2018, Field 11/26 to 12/2 , Sample December 2018, Field 11/26 to 12/2 , Sample December 2018, Field 11/26 to 12/2 , Sample ---- 823 adults, MOE +/823 adults, MOE +/823 adults, MOE +/823 adults, MOE +/----3.3 pts, Traditional phone with live interviewers 3.3 pts, Traditional phone with live interviewers 3.3 pts, Traditional phone with live interviewers 3.3 pts, Traditional phone with live interviewers I1BI1BI1BI1B Which of these issuWhich of these issuWhich of these issuWhich of these issues should be given the SECOND HIGHEST priority by Congress at the start of 2019?es should be given the SECOND HIGHEST priority by Congress at the start of 2019?es should be given the SECOND HIGHEST priority by Congress at the start of 2019?es should be given the SECOND HIGHEST priority by Congress at the start of 2019? ====AREA TYPE==== ===WHITE=== ==BLK/HISP= ==MAR.STAT= ====EDUCATION==== ====IDEOLOOGY========AREA TYPE==== ===WHITE=== ==BLK/HISP= ==MAR.STAT= ====EDUCATION==== ====IDEOLOOGY========AREA TYPE==== ===WHITE=== ==BLK/HISP= ==MAR.STAT= ====EDUCATION==== ====IDEOLOOGY========AREA TYPE==== ===WHITE=== ==BLK/HISP= ==MAR.STAT= ====EDUCATION==== ====IDEOLOOGY==== SUBSUBSUBSUB---- WHITE SINGL MARR HIGH SOME WHITE SINGL MARR HIGH SOME WHITE SINGL MARR HIGH SOME WHITE SINGL MARR HIGH SOME TOTAL URBAN URBAN RURAL MEN WOMEN BLACK HIS. WOMEN WOM SCHL. COLL. COLL+ CONS. MOD. LIB.TOTAL URBAN URBAN RURAL MEN WOMEN BLACK HIS. WOMEN WOM SCHL. COLL. COLL+ CONS. MOD. LIB.TOTAL URBAN URBAN RURAL MEN WOMEN BLACK HIS. WOMEN WOM SCHL. COLL. COLL+ CONS. MOD. LIB.TOTAL URBAN URBAN RURAL MEN WOMEN BLACK HIS. WOMEN WOM SCHL. COLL. COLL+ CONS. MOD. LIB. -------------------- -------------------- -------------------- -------------------- -------------------- -------------------- -------------------- -------------------- -------------------- -------------------- -------------------- -------------------- -------------------- -------------------- -------------------- -------------------- (A) (B) (C) (D) (E) (F) (G) (H) (I) (J) (K) (L) (M) (N) (O) (P)(A) (B) (C) (D) (E) (F) (G) (H) (I) (J) (K) (L) (M) (N) (O) (P)(A) (B) (C) (D) (E) (F) (G) (H) (I) (J) (K) (L) (M) (N) (O) (P)(A) (B) (C) (D) (E) (F) (G) (H) (I) (J) (K) (L) (M) (N) (O) (P) TOTAL TOTAL TOTAL TOTAL 823 192 400 211 267 290 118 55 182 241 157 216 430 328 247 214823 192 400 211 267 290 118 55 182 241 157 216 430 328 247 214823 192 400 211 267 290 118 55 182 241 157 216 430 328 247 214823 192 400 211 267 290 118 55 182 241 157 216 430 328 247 214 100% 100% 100% 100% 100% 100% 100% 100% 100% 100% 100% 100% 100% 100% 100% 100%100% 100% 100% 100% 100% 100% 100% 100% 100% 100% 100% 100% 100% 100% 100% 100%100% 100% 100% 100% 100% 100% 100% 100% 100% 100% 100% 100% 100% 100% 100% 100%100% 100% 100% 100% 100% 100% 100% 100% 100% 100% 100% 100% 100% 100% 100% 100% Unweighted Total 823 Unweighted Total 823 Unweighted Total 823 Unweighted Total 823 172 385 244 340 305 73 35 178 205 161 222 417 395 233 162172 385 244 340 305 73 35 178 205 161 222 417 395 233 162172 385 244 340 305 73 35 178 205 161 222 417 395 233 162172 385 244 340 305 73 35 178 205 161 222 417 395 233 162 Healthcare costs 147 33 72 38 45 56 25 9 46 34 32 39 73 66 26 46Healthcare costs 147 33 72 38 45 56 25 9 46 34 32 39 73 66 26 46Healthcare costs 147 33 72 38 45 56 25 9 46 34 32 39 73 66 26 46Healthcare costs 147 33 72 38 45 56 25 9 46 34 32 39 73 66 26 46 18% 17% 18% 18% 17% 18% 18% 17% 18% 18% 17% 18% 18% 17% 19% 21% 16% 25% 14% 21% 18% 17% 20% 10% 22%18% 17% 19% 21% 16% 25% 14% 21% 18% 17% 20% 10% 22%18% 17% 19% 21% 16% 25% 14% 21% 18% 17% 20% 10% 22%18% 17% 19% 21% 16% 25% 14% 21% 18% 17% 20% 10% 22% J O OJ O OJ O OJ O O Immigration 143 45 54 42 44 Immigration 143 45 54 42 44 Immigration 143 45 54 42 44 Immigration 143 45 54 42 44 64 18 10 30 49 39 32 68 77 31 3064 18 10 30 49 39 32 68 77 31 3064 18 10 30 49 39 32 68 77 31 3064 18 10 30 49 39 32 68 77 31 30 17% 23% 13% 20% 16% 22% 15% 18% 17% 20% 25% 15% 16% 24% 13% 14%17% 23% 13% 20% 16% 22% 15% 18% 17% 20% 25% 15% 16% 24% 13% 14%17% 23% 13% 20% 16% 22% 15% 18% 17% 20% 25% 15% 16% 24% 13% 14%17% 23% 13% 20% 16% 22% 15% 18% 17% 20% 25% 15% 16% 24% 13% 14% C c C c C c C c LM OP LM OP LM OP LM OP Economy and Jobs 142 22 78 38 58 32 24 10 33 27 25 41 74 69 45 22Economy and Jobs 142 22 78 38 58 32 24 10 33 27 25 41 74 69 45 22Economy and Jobs 142 22 78 38 58 32 24 10 33 27 25 41 74 69 45 22Economy and Jobs 142 22 78 38 58 32 24 10 33 27 25 41 74 69 45 22 17% 11% 19% 18% 22% 11% 21% 18% 18%17% 11% 19% 18% 22% 11% 21% 18% 18%17% 11% 19% 18% 22% 11% 21% 18% 18%17% 11% 19% 18% 22% 11% 21% 18% 18% 11% 16% 19% 17% 21% 18% 10%11% 16% 19% 17% 21% 18% 10%11% 16% 19% 17% 21% 18% 10%11% 16% 19% 17% 21% 18% 10% B F P p B F P p B F P p B F P p National security 92 19 41 29 33 37 5 4 22 24 1National security 92 19 41 29 33 37 5 4 22 24 1National security 92 19 41 29 33 37 5 4 22 24 1National security 92 19 41 29 33 37 5 4 22 24 17 27 45 54 29 67 27 45 54 29 67 27 45 54 29 67 27 45 54 29 6 11% 10% 10% 14% 12% 13% 5% 7% 12% 10% 11% 12% 11% 16% 12% 3%11% 10% 10% 14% 12% 13% 5% 7% 12% 10% 11% 12% 11% 16% 12% 3%11% 10% 10% 14% 12% 13% 5% 7% 12% 10% 11% 12% 11% 16% 12% 3%11% 10% 10% 14% 12% 13% 5% 7% 12% 10% 11% 12% 11% 16% 12% 3% P P P P P P P P Investigating the White 65 12 37 16 15 27 8 8 9 30 8 15 41 7 35 22Investigating the White 65 12 37 16 15 27 8 8 9 30 8 15 41 7 35 22Investigating the White 65 12 37 16 15 27 8 8 9 30 8 15 41 7 35 22Investigating the White 65 12 37 16 15 27 8 8 9 30 8 15 41 7 35 22 House 8% 6% 9% 7% 6% 9% 6% 15% 5% 13House 8% 6% 9% 7% 6% 9% 6% 15% 5% 13House 8% 6% 9% 7% 6% 9% 6% 15% 5% 13House 8% 6% 9% 7% 6% 9% 6% 15% 5% 13% 5% 7% 10% 2% 14% 10%% 5% 7% 10% 2% 14% 10%% 5% 7% 10% 2% 14% 10%% 5% 7% 10% 2% 14% 10% I N NI N NI N NI N N Infrastructure 62 13 30 16 26 15 8 1 11 16 9 Infrastructure 62 13 30 16 26 15 8 1 11 16 9 Infrastructure 62 13 30 16 26 15 8 1 11 16 9 Infrastructure 62 13 30 16 26 15 8 1 11 16 9 15 36 22 20 1815 36 22 20 1815 36 22 20 1815 36 22 20 18 8% 7% 7% 8% 10% 5% 7% 2% 6% 6% 6% 7% 8% 7% 8% 8%8% 7% 7% 8% 10% 5% 7% 2% 6% 6% 6% 7% 8% 7% 8% 8%8% 7% 7% 8% 10% 5% 7% 2% 6% 6% 6% 7% 8% 7% 8% 8%8% 7% 7% 8% 10% 5% 7% 2% 6% 6% 6% 7% 8% 7% 8% 8% Climate change 59 22 29 8 26 10 5 6 8 15 9 16 31 Climate change 59 22 29 8 26 10 5 6 8 15 9 16 31 Climate change 59 22 29 8 26 10 5 6 8 15 9 16 31 Climate change 59 22 29 8 26 10 5 6 8 15 9 16 31 5 24 255 24 255 24 255 24 25 7% 12% 7% 4% 10% 3% 4% 11% 4% 6% 6% 7% 7% 2% 10% 12%7% 12% 7% 4% 10% 3% 4% 11% 4% 6% 6% 7% 7% 2% 10% 12%7% 12% 7% 4% 10% 3% 4% 11% 4% 6% 6% 7% 7% 2% 10% 12%7% 12% 7% 4% 10% 3% 4% 11% 4% 6% 6% 7% 7% 2% 10% 12% D F N D F N D F N D F N NNNN Criminal justice reform 55 16 29 9 12 22 13 1 16 16 9 19 27 14 17 21Criminal justice reform 55 16 29 9 12 22 13 1 16 16 9 19 27 14 17 21Criminal justice reform 55 16 29 9 12 22 13 1 16 16 9 19 27 14 17 21Criminal justice reform 55 16 29 9 12 22 13 1 16 16 9 19 27 14 17 21 7% 8% 7% 4% 5% 8% 11% 3% 9% 7% 6% 9% 6% 4% 7% 10%7% 8% 7% 4% 5% 8% 11% 3% 9% 7% 6% 9% 6% 4% 7% 10%7% 8% 7% 4% 5% 8% 11% 3% 9% 7% 6% 9% 6% 4% 7% 10%7% 8% 7% 4% 5% 8% 11% 3% 9% 7% 6% 9% 6% 4% 7% 10% h nh nh nh n GunGunGunGun----related issues 51 8 29 13 6 24 10 6 6 28 8 10 32 10 17 23related issues 51 8 29 13 6 24 10 6 6 28 8 10 32 10 17 23related issues 51 8 29 13 6 24 10 6 6 28 8 10 32 10 17 23related issues 51 8 29 13 6 24 10 6 6 28 8 10 32 10 17 23 6% 4% 7% 6% 2% 8% 9% 11% 3% 11% 5% 5% 7% 3% 7% 11%6% 4% 7% 6% 2% 8% 9% 11% 3% 11% 5% 5% 7% 3% 7% 11%6% 4% 7% 6% 2% 8% 9% 11% 3% 11% 5% 5% 7% 3% 7% 11%6% 4% 7% 6% 2% 8% 9% 11% 3% 11% 5% 5% 7% 3% 7% 11% E I NE I NE I NE I N Comparison Groups: BCD/EF/GComparison Groups: BCD/EF/GComparison Groups: BCD/EF/GComparison Groups: BCD/EF/GH/IJ/KLM/NOPH/IJ/KLM/NOPH/IJ/KLM/NOPH/IJ/KLM/NOP Independent ZIndependent ZIndependent ZIndependent Z----Test for Percentages (unpooled proportions)Test for Percentages (unpooled proportions)Test for Percentages (unpooled proportions)Test for Percentages (unpooled proportions) Uppercase letters indicate significance at the 95% level.Uppercase letters indicate significance at the 95% level.Uppercase letters indicate significance at the 95% level.Uppercase letters indicate significance at the 95% level. Lowercase letters indicate significance at the 90% level.Lowercase letters indicate significance at the 90% level.Lowercase letters indicate significance at the 90% level.Lowercase letters indicate significance at the 90% level.

Table I1B Page 50Table I1B Page 50Table I1B Page 50Table I1B Page 50 (Continued)(Continued)(Continued)(Continued) Investor's Business Daily/TIPP PollInvestor's Business Daily/TIPP PollInvestor's Business Daily/TIPP PollInvestor's Business Daily/TIPP Poll---- DDDDecember 2018, Field 11/26 to 12/2 , Sample ecember 2018, Field 11/26 to 12/2 , Sample ecember 2018, Field 11/26 to 12/2 , Sample ecember 2018, Field 11/26 to 12/2 , Sample ---- 823 adults, MOE +/823 adults, MOE +/823 adults, MOE +/823 adults, MOE +/----3.3 pts, Traditional phone with live interviewers 3.3 pts, Traditional phone with live interviewers 3.3 pts, Traditional phone with live interviewers 3.3 pts, Traditional phone with live interviewers I1BI1BI1BI1B Which of these issues should be given the SECOND HIGHEST priority by Congress at the start of 2019?Which of these issues should be given the SECOND HIGHEST priority by Congress at the start of 2019?Which of these issues should be given the SECOND HIGHEST priority by Congress at the start of 2019?Which of these issues should be given the SECOND HIGHEST priority by Congress at the start of 2019? ====AREA TYPE==== ===WHITE=== ==BLK/HISP= ==MAR.STAT= ====EDUCATION==== ====IDEOLOOGY========AREA TYPE==== ===WHITE=== ==BLK/HISP= ==MAR.STAT= ====EDUCATION==== ====IDEOLOOGY========AREA TYPE==== ===WHITE=== ==BLK/HISP= ==MAR.STAT= ====EDUCATION==== ====IDEOLOOGY========AREA TYPE==== ===WHITE=== ==BLK/HISP= ==MAR.STAT= ====EDUCATION==== ====IDEOLOOGY==== SUBSUBSUBSUB---- WHITE SINGL MARR HIGH SOME WHITE SINGL MARR HIGH SOME WHITE SINGL MARR HIGH SOME WHITE SINGL MARR HIGH SOME TOTAL URBAN URBAN RURAL MEN WOMEN BLACK HIS. WOMEN WOM SCHL. COLL. COLL+ CONS. MOD. LIB.TOTAL URBAN URBAN RURAL MEN WOMEN BLACK HIS. WOMEN WOM SCHL. COLL. COLL+ CONS. MOD. LIB.TOTAL URBAN URBAN RURAL MEN WOMEN BLACK HIS. WOMEN WOM SCHL. COLL. COLL+ CONS. MOD. LIB.TOTAL URBAN URBAN RURAL MEN WOMEN BLACK HIS. WOMEN WOM SCHL. COLL. COLL+ CONS. MOD. LIB. -------------------- -------------------- -------------------- -------------------- -------------------- -------------------- -------------------- -------------------- -------------------- -------------------- -------------------- -------------------- -------------------- -------------------- -------------------- -------------------- (A) (B) (C) (D) (E) (F) (G) (H) (I) (J) (K) (L) (M) (N) (O) (P)(A) (B) (C) (D) (E) (F) (G) (H) (I) (J) (K) (L) (M) (N) (O) (P)(A) (B) (C) (D) (E) (F) (G) (H) (I) (J) (K) (L) (M) (N) (O) (P)(A) (B) (C) (D) (E) (F) (G) (H) (I) (J) (K) (L) (M) (N) (O) (P) Not sure 4 0 2 1 1 2 Not sure 4 0 2 1 1 2 Not sure 4 0 2 1 1 2 Not sure 4 0 2 1 1 2 ---- ---- 2 1 2 1 2 1 2 1 ---- 3 0 1 2 13 0 1 2 13 0 1 2 13 0 1 2 1 *% *% *% *% *% *% *% *% 1% 1% *% 1% *% *% 1% *%*% *% *% *% 1% 1% *% 1% *% *% 1% *%*% *% *% *% 1% 1% *% 1% *% *% 1% *%*% *% *% *% 1% 1% *% 1% *% *% 1% *% Refused 2 2 Refused 2 2 Refused 2 2 Refused 2 2 ---- 1 1 1 1 1 1 1 1 ---- 2 2 2 2 ---- ---- 2 2 2 2 ---- ---- 2 1 2 1 2 1 2 1 ---- ---- *% 1% *% 1% *% 1% *% 1% *% *% 1% 1% 1% *% *% *% 1% 1% 1% *% *% *% 1% 1% 1% *% *% *% 1% 1% 1% *% Comparison Groups: BCD/EF/GH/IJ/KLM/NOPComparison Groups: BCD/EF/GH/IJ/KLM/NOPComparison Groups: BCD/EF/GH/IJ/KLM/NOPComparison Groups: BCD/EF/GH/IJ/KLM/NOP Independent ZIndependent ZIndependent ZIndependent Z----Test for Percentages (unpooled proportions)Test for Percentages (unpooled proportions)Test for Percentages (unpooled proportions)Test for Percentages (unpooled proportions) Uppercase letters indicate significance at the 95% level.Uppercase letters indicate significance at the 95% level.Uppercase letters indicate significance at the 95% level.Uppercase letters indicate significance at the 95% level. Lowercase letters indicate significance at the 90% level.Lowercase letters indicate significance at the 90% level.Lowercase letters indicate significance at the 90% level.Lowercase letters indicate significance at the 90% level.

Table I1C Page 51Table I1C Page 51Table I1C Page 51Table I1C Page 51 Investor's Business Daily/TIPP PollInvestor's Business Daily/TIPP PollInvestor's Business Daily/TIPP PollInvestor's Business Daily/TIPP Poll---- December 2018, Field 11/26 to 12/2 , Sample December 2018, Field 11/26 to 12/2 , Sample December 2018, Field 11/26 to 12/2 , Sample December 2018, Field 11/26 to 12/2 , Sample ---- 823 adults, MOE +/823 adults, MOE +/823 adults, MOE +/823 adults, MOE +/----3.3 pts, Tradition3.3 pts, Tradition3.3 pts, Tradition3.3 pts, Traditional phone with live interviewers al phone with live interviewers al phone with live interviewers al phone with live interviewers I1CI1CI1CI1C Which of these issues should be given the SECOND HIGHEST priority by Congress at the start of 2019? (Combined)Which of these issues should be given the SECOND HIGHEST priority by Congress at the start of 2019? (Combined)Which of these issues should be given the SECOND HIGHEST priority by Congress at the start of 2019? (Combined)Which of these issues should be given the SECOND HIGHEST priority by Congress at the start of 2019? (Combined) ======= REGION ======== ========= AGE ========= ==GENDER== ===RACE ========= REGION ======== ========= AGE ========= ==GENDER== ===RACE ========= REGION ======== ========= AGE ========= ==GENDER== ===RACE ========= REGION ======== ========= AGE ========= ==GENDER== ===RACE === ======= INCOME ======= =====PARTY===== ==INVESTOR== ======= INCOME ======= =====PARTY===== ==INVESTOR== ======= INCOME ======= =====PARTY===== ==INVESTOR== ======= INCOME ======= =====PARTY===== ==INVESTOR= TOTAL BLACK UND 30KTOTAL BLACK UND 30KTOTAL BLACK UND 30KTOTAL BLACK UND 30K---- 50K50K50K50K---- NE MW NE MW NE MW NE MW SOUTH WEST 18SOUTH WEST 18SOUTH WEST 18SOUTH WEST 18----24 2524 2524 2524 25----44 4544 4544 4544 45----64 65+ MALE FEM. WHITE HISP 30K 50K 75K 75K+ DEM REP IND YES NO 64 65+ MALE FEM. WHITE HISP 30K 50K 75K 75K+ DEM REP IND YES NO 64 65+ MALE FEM. WHITE HISP 30K 50K 75K 75K+ DEM REP IND YES NO 64 65+ MALE FEM. WHITE HISP 30K 50K 75K 75K+ DEM REP IND YES NO -------------------- -------------------- -------------------- -------------------- -------------------- -------------------- -------------------- -------------------- -------------------- -------------------- -------------------- -------------------- -------------------- -------------------- -------------------- -------------------- -------------------- -------------------- -------------------- -------------------- -------------------- -------------------- (A) (B) (C) (D) (E) (F) (G) (H) (I) (J) (K) (L) (M) (N) (O) (P) (Q) (R) (S) (T) (U) (A) (B) (C) (D) (E) (F) (G) (H) (I) (J) (K) (L) (M) (N) (O) (P) (Q) (R) (S) (T) (U) (A) (B) (C) (D) (E) (F) (G) (H) (I) (J) (K) (L) (M) (N) (O) (P) (Q) (R) (S) (T) (U) (A) (B) (C) (D) (E) (F) (G) (H) (I) (J) (K) (L) (M) (N) (O) (P) (Q) (R) (S) (T) (U) (V)(V)(V)(V) TOTAL 823 147 181 309 186 45 234 293 207TOTAL 823 147 181 309 186 45 234 293 207TOTAL 823 147 181 309 186 45 234 293 207TOTAL 823 147 181 309 186 45 234 293 207 393 430 556 171 92 131 138 363 286 237 283 447 309393 430 556 171 92 131 138 363 286 237 283 447 309393 430 556 171 92 131 138 363 286 237 283 447 309393 430 556 171 92 131 138 363 286 237 283 447 309 100% 100% 100% 100% 100% 100% 100% 100% 100% 100% 100% 100% 100% 100% 100% 100% 100% 100% 100% 100% 100% 100% 100% 100% 100% 100% 100% 100% 100% 100% 100% 100% 100% 100% 100% 100% 100% 100% 100% 100% 100% 100% 100% 100% 100% 100% 100% 100% 100% 100% 100% 100% 100% 100% 100% 100% 100% 100% 100% 100% 100% 100% 100% 100% 100% 100% 100% 100% 100% 100% 100% 100% 100% 100% 100% 100% 100% 100% 100% 100% 100% 100% 100% 100% 100%100%100%100% Unweighted Total Unweighted Total Unweighted Total Unweighted Total 823 158 180 311 174 17 102 289 371 433 390 645 107 104 145 126 337 247 296 262 472 823 158 180 311 174 17 102 289 371 433 390 645 107 104 145 126 337 247 296 262 472 823 158 180 311 174 17 102 289 371 433 390 645 107 104 145 126 337 247 296 262 472 823 158 180 311 174 17 102 289 371 433 390 645 107 104 145 126 337 247 296 262 472 282282282282 Healthcare costs 327 47 88 132 60 18 86 117 90 140 187 222 76 41 56Healthcare costs 327 47 88 132 60 18 86 117 90 140 187 222 76 41 56Healthcare costs 327 47 88 132 60 18 86 117 90 140 187 222 76 41 56Healthcare costs 327 47 88 132 60 18 86 117 90 140 187 222 76 41 56 42 145 128 76 115 187 11342 145 128 76 115 187 11342 145 128 76 115 187 11342 145 128 76 115 187 113 40% 32% 48% 43% 32% 39% 37% 40% 43% 36% 44% 40% 44% 44% 42% 30% 40% 45% 32% 41% 42% 40% 32% 48% 43% 32% 39% 37% 40% 43% 36% 44% 40% 44% 44% 42% 30% 40% 45% 32% 41% 42% 40% 32% 48% 43% 32% 39% 37% 40% 43% 36% 44% 40% 44% 44% 42% 30% 40% 45% 32% 41% 42% 40% 32% 48% 43% 32% 39% 37% 40% 43% 36% 44% 40% 44% 44% 42% 30% 40% 45% 32% 41% 42% 37%37%37%37% BE be BE be BE be BE be j p p S s j p p S s j p p S s j p p S s Immigration 299 52 69 109 Immigration 299 52 69 109 Immigration 299 52 69 109 Immigration 299 52 69 109 69 14 81 103 77 146 154 234 39 38 50 61 114 60 135 97 163 10769 14 81 103 77 146 154 234 39 38 50 61 114 60 135 97 163 10769 14 81 103 77 146 154 234 39 38 50 61 114 60 135 97 163 10769 14 81 103 77 146 154 234 39 38 50 61 114 60 135 97 163 107 36% 35% 38% 35% 37% 30% 35% 35% 37% 37% 36% 42% 23% 41% 38% 44% 31% 21% 57% 34% 3636% 35% 38% 35% 37% 30% 35% 35% 37% 37% 36% 42% 23% 41% 38% 44% 31% 21% 57% 34% 3636% 35% 38% 35% 37% 30% 35% 35% 37% 37% 36% 42% 23% 41% 38% 44% 31% 21% 57% 34% 3636% 35% 38% 35% 37% 30% 35% 35% 37% 37% 36% 42% 23% 41% 38% 44% 31% 21% 57% 34% 36% 35%% 35%% 35%% 35% M q RT R M q RT R M q RT R M q RT R Economy and Jobs 247 50 52 99 45 5 66 103 61 139 1Economy and Jobs 247 50 52 99 45 5 66 103 61 139 1Economy and Jobs 247 50 52 99 45 5 66 103 61 139 1Economy and Jobs 247 50 52 99 45 5 66 103 61 139 108 164 49 20 35 41 111 51 98 91 138 8308 164 49 20 35 41 111 51 98 91 138 8308 164 49 20 35 41 111 51 98 91 138 8308 164 49 20 35 41 111 51 98 91 138 83 30% 34% 29% 32% 24% 11% 28% 35% 30% 35% 25% 30% 28% 22% 26% 29% 31% 18% 41% 32% 31% 30% 34% 29% 32% 24% 11% 28% 35% 30% 35% 25% 30% 28% 22% 26% 29% 31% 18% 41% 32% 31% 30% 34% 29% 32% 24% 11% 28% 35% 30% 35% 25% 30% 28% 22% 26% 29% 31% 18% 41% 32% 31% 30% 34% 29% 32% 24% 11% 28% 35% 30% 35% 25% 30% 28% 22% 26% 29% 31% 18% 41% 32% 31% 27%27%27%27% f F F K Rt R f F F K Rt R f F F K Rt R f F F K Rt R National security 178 31 40 70 37 7 45 75 40 84 93 132 24 18 26 36 National security 178 31 40 70 37 7 45 75 40 84 93 132 24 18 26 36 National security 178 31 40 70 37 7 45 75 40 84 93 132 24 18 26 36 National security 178 31 40 70 37 7 45 75 40 84 93 132 24 18 26 36 88881 25 93 56 100 651 25 93 56 100 651 25 93 56 100 651 25 93 56 100 65 22% 21% 22% 23% 20% 15% 19% 26% 19% 21% 22% 24% 14% 20% 20% 26% 22% 9% 39% 20% 22% 22% 21% 22% 23% 20% 15% 19% 26% 19% 21% 22% 24% 14% 20% 20% 26% 22% 9% 39% 20% 22% 22% 21% 22% 23% 20% 15% 19% 26% 19% 21% 22% 24% 14% 20% 20% 26% 22% 9% 39% 20% 22% 22% 21% 22% 23% 20% 15% 19% 26% 19% 21% 22% 24% 14% 20% 20% 26% 22% 9% 39% 20% 22% 21%21%21%21% i M RT R i M RT R i M RT R i M RT R Climate change 138 16 32 36 54 15 45 28 46 74 64 87 28 18 23 24 Climate change 138 16 32 36 54 15 45 28 46 74 64 87 28 18 23 24 Climate change 138 16 32 36 54 15 45 28 46 74 64 87 28 18 23 24 Climate change 138 16 32 36 54 15 45 28 46 74 64 87 28 18 23 24 57 70 10 56 69 5957 70 10 56 69 5957 70 10 56 69 5957 70 10 56 69 59 17% 11% 18% 12% 29% 33% 19% 10% 22% 19% 15% 16% 16% 20% 17% 18% 16% 25% 4% 20% 15% 17% 11% 18% 12% 29% 33% 19% 10% 22% 19% 15% 16% 16% 20% 17% 18% 16% 25% 4% 20% 15% 17% 11% 18% 12% 29% 33% 19% 10% 22% 19% 15% 16% 16% 20% 17% 18% 16% 25% 4% 20% 15% 17% 11% 18% 12% 29% 33% 19% 10% 22% 19% 15% 16% 16% 20% 17% 18% 16% 25% 4% 20% 15% 19%19%19%19% BCD H H H BCD H H H BCD H H H BCD H H H S S S S S S S S Investigating the White 134 25 24 45 40 4 37 54 35 57 77 76 39 12 19 17 Investigating the White 134 25 24 45 40 4 37 54 35 57 77 76 39 12 19 17 Investigating the White 134 25 24 45 40 4 37 54 35 57 77 76 39 12 19 17 Investigating the White 134 25 24 45 40 4 37 54 35 57 77 76 39 12 19 17 73 85 6 43 79 4773 85 6 43 79 4773 85 6 43 79 4773 85 6 43 79 47 House 16% 17% 13House 16% 17% 13House 16% 17% 13House 16% 17% 13% 14% 22% 10% 16% 19% 17% 14% 18% 14% 23% 13% 15% 13% 20% 30% 2% 15% 18% 15%% 14% 22% 10% 16% 19% 17% 14% 18% 14% 23% 13% 15% 13% 20% 30% 2% 15% 18% 15%% 14% 22% 10% 16% 19% 17% 14% 18% 14% 23% 13% 15% 13% 20% 30% 2% 15% 18% 15%% 14% 22% 10% 16% 19% 17% 14% 18% 14% 23% 13% 15% 13% 20% 30% 2% 15% 18% 15% L p ST L p ST L p ST L p ST S S S S GunGunGunGun----related issues 121 33 26 43 20 12 43 34 28 39 82 65 43 13 17 24 55 related issues 121 33 26 43 20 12 43 34 28 39 82 65 43 13 17 24 55 related issues 121 33 26 43 20 12 43 34 28 39 82 65 43 13 17 24 55 related issues 121 33 26 43 20 12 43 34 28 39 82 65 43 13 17 24 55 77 6 37 62 4977 6 37 62 4977 6 37 62 4977 6 37 62 49 15% 22% 15% 14% 11% 26% 18% 12% 13%15% 22% 15% 14% 11% 26% 18% 12% 13%15% 22% 15% 14% 11% 26% 18% 12% 13%15% 22% 15% 14% 11% 26% 18% 12% 13% 10% 19% 12% 25% 14% 13% 17% 15% 27% 3% 13% 14% 16%10% 19% 12% 25% 14% 13% 17% 15% 27% 3% 13% 14% 16%10% 19% 12% 25% 14% 13% 17% 15% 27% 3% 13% 14% 16%10% 19% 12% 25% 14% 13% 17% 15% 27% 3% 13% 14% 16% dE J L ST S dE J L ST S dE J L ST S dE J L ST S Infrastructure Infrastructure Infrastructure Infrastructure 110 27 17 44 23 2 37 44 21 69 42 73 20 6 15 20 58 33 36 39 63 110 27 17 44 23 2 37 44 21 69 42 73 20 6 15 20 58 33 36 39 63 110 27 17 44 23 2 37 44 21 69 42 73 20 6 15 20 58 33 36 39 63 110 27 17 44 23 2 37 44 21 69 42 73 20 6 15 20 58 33 36 39 63 39393939 13% 18% 9% 14% 12% 4% 16% 15% 10% 17% 10% 13% 11% 7% 12% 13% 18% 9% 14% 12% 4% 16% 15% 10% 17% 10% 13% 11% 7% 12% 13% 18% 9% 14% 12% 4% 16% 15% 10% 17% 10% 13% 11% 7% 12% 13% 18% 9% 14% 12% 4% 16% 15% 10% 17% 10% 13% 11% 7% 12% 15% 16% 11% 15% 14% 14% 13%15% 16% 11% 15% 14% 14% 13%15% 16% 11% 15% 14% 14% 13%15% 16% 11% 15% 14% 14% 13% c f fi K N c f fi K N c f fi K N c f fi K N Comparison Groups: BCDE/FGHI/JK/LM/NOPQ/RST/UVComparison Groups: BCDE/FGHI/JK/LM/NOPQ/RST/UVComparison Groups: BCDE/FGHI/JK/LM/NOPQ/RST/UVComparison Groups: BCDE/FGHI/JK/LM/NOPQ/RST/UV Independent ZIndependent ZIndependent ZIndependent Z----Test for Percentages (unpooled proportions)Test for Percentages (unpooled proportions)Test for Percentages (unpooled proportions)Test for Percentages (unpooled proportions) Uppercase letters indicate significance at the 95% level.Uppercase letters indicate significance at the 95% level.Uppercase letters indicate significance at the 95% level.Uppercase letters indicate significance at the 95% level. Lowercase letters indicate significance at the 90% level.Lowercase letters indicate significance at the 90% level.Lowercase letters indicate significance at the 90% level.Lowercase letters indicate significance at the 90% level.

Table I1C Page 52Table I1C Page 52Table I1C Page 52Table I1C Page 52 (Continued)(Continued)(Continued)(Continued) Investor's Business Daily/TIPP PollInvestor's Business Daily/TIPP PollInvestor's Business Daily/TIPP PollInvestor's Business Daily/TIPP Poll---- December 2018,December 2018,December 2018,December 2018, Field 11/26 to 12/2 , Sample Field 11/26 to 12/2 , Sample Field 11/26 to 12/2 , Sample Field 11/26 to 12/2 , Sample ---- 823 adults, MOE +/823 adults, MOE +/823 adults, MOE +/823 adults, MOE +/----3.3 pts, Traditional phone with live interviewers 3.3 pts, Traditional phone with live interviewers 3.3 pts, Traditional phone with live interviewers 3.3 pts, Traditional phone with live interviewers I1CI1CI1CI1C Which of these issues should be given the SECOND HIGHEST priority by Congress at the start of 2019? (Combined)Which of these issues should be given the SECOND HIGHEST priority by Congress at the start of 2019? (Combined)Which of these issues should be given the SECOND HIGHEST priority by Congress at the start of 2019? (Combined)Which of these issues should be given the SECOND HIGHEST priority by Congress at the start of 2019? (Combined) ========== REGION ======== ========= AGE ========= ==GENDER== ===RACE === ======= INCOME ======= =====PARTY===== ==INVESTOR======= REGION ======== ========= AGE ========= ==GENDER== ===RACE === ======= INCOME ======= =====PARTY===== ==INVESTOR======= REGION ======== ========= AGE ========= ==GENDER== ===RACE === ======= INCOME ======= =====PARTY===== ==INVESTOR======= REGION ======== ========= AGE ========= ==GENDER== ===RACE === ======= INCOME ======= =====PARTY===== ==INVESTOR= TOTAL BLACK UND 30KTOTAL BLACK UND 30KTOTAL BLACK UND 30KTOTAL BLACK UND 30K---- 50K50K50K50K---- NE MW SOUTH WEST 18NE MW SOUTH WEST 18NE MW SOUTH WEST 18NE MW SOUTH WEST 18----24 2524 2524 2524 25----44 4544 4544 4544 45----64 65+ MALE FEM. WHITE HISP 30K 50K 75K 75K+ DEM REP IND YES NO 64 65+ MALE FEM. WHITE HISP 30K 50K 75K 75K+ DEM REP IND YES NO 64 65+ MALE FEM. WHITE HISP 30K 50K 75K 75K+ DEM REP IND YES NO 64 65+ MALE FEM. WHITE HISP 30K 50K 75K 75K+ DEM REP IND YES NO -------------------- -------------------- -------------------- -------------------- -------------------- -------------------- -------------------- -------------------- -------------------- -------------------- -------------------- -------------------- -------------------- -------------------- -------------------- -------------------- -------------------- -------------------- -------------------- -------------------- -------------------- -------------------- (A) (B) (C) (D) (E) (F) (G) (H) (I) (J) (K) (L) (M) (N) (O) (P) (Q) (R) (S) (T) (U) (A) (B) (C) (D) (E) (F) (G) (H) (I) (J) (K) (L) (M) (N) (O) (P) (Q) (R) (S) (T) (U) (A) (B) (C) (D) (E) (F) (G) (H) (I) (J) (K) (L) (M) (N) (O) (P) (Q) (R) (S) (T) (U) (A) (B) (C) (D) (E) (F) (G) (H) (I) (J) (K) (L) (M) (N) (O) (P) (Q) (R) (S) (T) (U) (V)(V)(V)(V) Criminal jCriminal jCriminal jCriminal justice reform 79 9 10 36 24 14 29 21 12 36 43 50 22 13 21 11 32 36 ustice reform 79 9 10 36 24 14 29 21 12 36 43 50 22 13 21 11 32 36 ustice reform 79 9 10 36 24 14 29 21 12 36 43 50 22 13 21 11 32 36 ustice reform 79 9 10 36 24 14 29 21 12 36 43 50 22 13 21 11 32 36 11 32 31 4711 32 31 4711 32 31 4711 32 31 47 10% 10% 10% 10% 6% 6% 12% 13% 32% 12% 7% 6% 9% 10% 9% 13% 14% 16% 8% 9% 13% 5% 11% 7% 15%6% 6% 12% 13% 32% 12% 7% 6% 9% 10% 9% 13% 14% 16% 8% 9% 13% 5% 11% 7% 15%6% 6% 12% 13% 32% 12% 7% 6% 9% 10% 9% 13% 14% 16% 8% 9% 13% 5% 11% 7% 15%6% 6% 12% 13% 32% 12% 7% 6% 9% 10% 9% 13% 14% 16% 8% 9% 13% 5% 11% 7% 15% BC BC HI i pq BC BC HI i pq BC BC HI i pq BC BC HI i pq S S US S US S US S U Comparison Groups: BCDE/FGHI/JK/LM/NOPQ/RST/UVComparison Groups: BCDE/FGHI/JK/LM/NOPQ/RST/UVComparison Groups: BCDE/FGHI/JK/LM/NOPQ/RST/UVComparison Groups: BCDE/FGHI/JK/LM/NOPQ/RST/UV Independent ZIndependent ZIndependent ZIndependent Z----Test for Percentages (unpooled proportions)Test for Percentages (unpooled proportions)Test for Percentages (unpooled proportions)Test for Percentages (unpooled proportions) Uppercase letters indicate significance at the 95% level.Uppercase letters indicate significance at the 95% level.Uppercase letters indicate significance at the 95% level.Uppercase letters indicate significance at the 95% level. Lowercase letters indicate significance at the 90% level.Lowercase letters indicate significance at the 90% level.Lowercase letters indicate significance at the 90% level.Lowercase letters indicate significance at the 90% level.
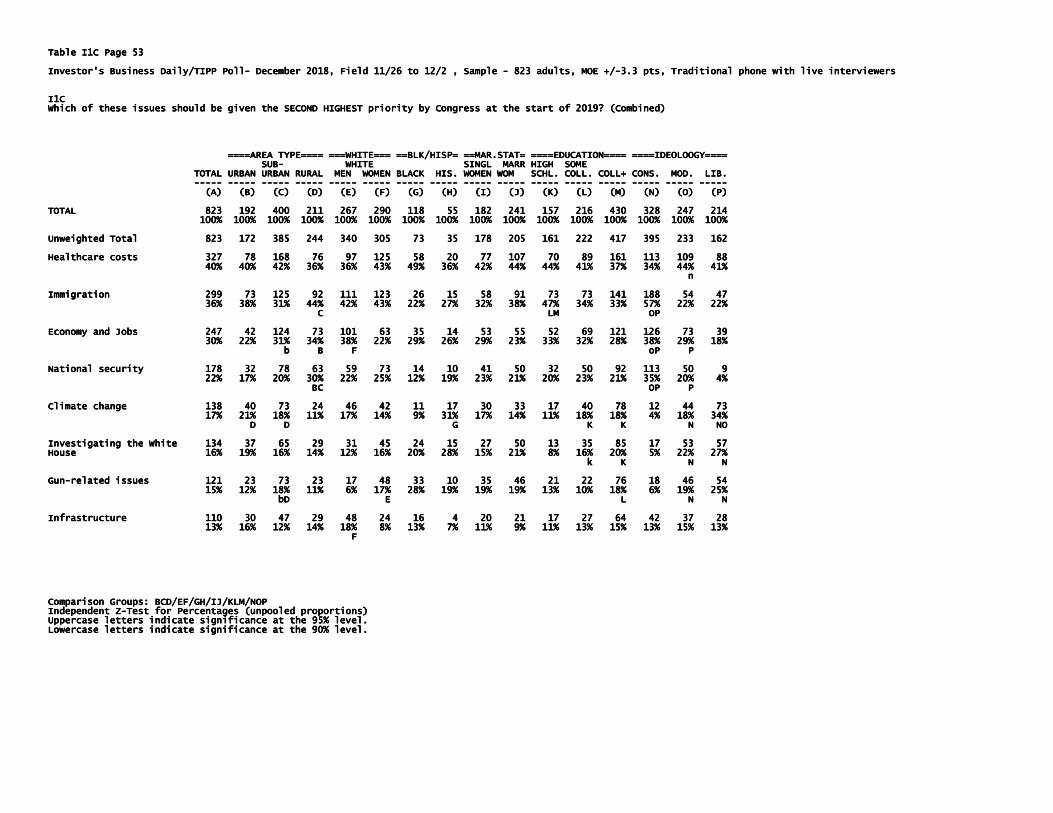
Table I1C Page 53Table I1C Page 53Table I1C Page 53Table I1C Page 53 Investor's Business Daily/TIPP PollInvestor's Business Daily/TIPP PollInvestor's Business Daily/TIPP PollInvestor's Business Daily/TIPP Poll---- December 2018, Field 11/26 to 12/2 , Sample December 2018, Field 11/26 to 12/2 , Sample December 2018, Field 11/26 to 12/2 , Sample December 2018, Field 11/26 to 12/2 , Sample ---- 823 adults, MOE +/823 adults, MOE +/823 adults, MOE +/823 adults, MOE +/----3.3 pts, Traditional phone with live interviewers 3.3 pts, Traditional phone with live interviewers 3.3 pts, Traditional phone with live interviewers 3.3 pts, Traditional phone with live interviewers I1CI1CI1CI1C Which of these issuWhich of these issuWhich of these issuWhich of these issues should be given the SECOND HIGHEST priority by Congress at the start of 2019? (Combined)es should be given the SECOND HIGHEST priority by Congress at the start of 2019? (Combined)es should be given the SECOND HIGHEST priority by Congress at the start of 2019? (Combined)es should be given the SECOND HIGHEST priority by Congress at the start of 2019? (Combined) ====AREA TYPE==== ===WHITE=== ==BLK/HISP= ==MAR.STAT= ====EDUCATION==== ====IDEOLOOGY========AREA TYPE==== ===WHITE=== ==BLK/HISP= ==MAR.STAT= ====EDUCATION==== ====IDEOLOOGY========AREA TYPE==== ===WHITE=== ==BLK/HISP= ==MAR.STAT= ====EDUCATION==== ====IDEOLOOGY========AREA TYPE==== ===WHITE=== ==BLK/HISP= ==MAR.STAT= ====EDUCATION==== ====IDEOLOOGY==== SUBSUBSUBSUB---- WHITE SINGL MARR HIGH SOME WHITE SINGL MARR HIGH SOME WHITE SINGL MARR HIGH SOME WHITE SINGL MARR HIGH SOME TOTAL URBAN URBAN RURAL MEN WOMEN BLACK HIS. WOMEN WOM SCHL. COLL. COLL+ CONS. MOD. LIB.TOTAL URBAN URBAN RURAL MEN WOMEN BLACK HIS. WOMEN WOM SCHL. COLL. COLL+ CONS. MOD. LIB.TOTAL URBAN URBAN RURAL MEN WOMEN BLACK HIS. WOMEN WOM SCHL. COLL. COLL+ CONS. MOD. LIB.TOTAL URBAN URBAN RURAL MEN WOMEN BLACK HIS. WOMEN WOM SCHL. COLL. COLL+ CONS. MOD. LIB. -------------------- -------------------- -------------------- -------------------- -------------------- -------------------- -------------------- -------------------- -------------------- -------------------- -------------------- -------------------- -------------------- -------------------- -------------------- -------------------- (A) (B) (C) (D) (E) (F) (G) (H) (I) (J) (K) (L) (M) (N) (O) (P)(A) (B) (C) (D) (E) (F) (G) (H) (I) (J) (K) (L) (M) (N) (O) (P)(A) (B) (C) (D) (E) (F) (G) (H) (I) (J) (K) (L) (M) (N) (O) (P)(A) (B) (C) (D) (E) (F) (G) (H) (I) (J) (K) (L) (M) (N) (O) (P) TOTAL TOTAL TOTAL TOTAL 823 192 400 211 267 290 118 55 182 241 157 216 430 328 247 214823 192 400 211 267 290 118 55 182 241 157 216 430 328 247 214823 192 400 211 267 290 118 55 182 241 157 216 430 328 247 214823 192 400 211 267 290 118 55 182 241 157 216 430 328 247 214 100% 100% 100% 100% 100% 100% 100% 100% 100% 100% 100% 100% 100% 100% 100% 100%100% 100% 100% 100% 100% 100% 100% 100% 100% 100% 100% 100% 100% 100% 100% 100%100% 100% 100% 100% 100% 100% 100% 100% 100% 100% 100% 100% 100% 100% 100% 100%100% 100% 100% 100% 100% 100% 100% 100% 100% 100% 100% 100% 100% 100% 100% 100% Unweighted Total 823 Unweighted Total 823 Unweighted Total 823 Unweighted Total 823 172 385 244 340 305 73 35 178 205 161 222 417 395 233 162172 385 244 340 305 73 35 178 205 161 222 417 395 233 162172 385 244 340 305 73 35 178 205 161 222 417 395 233 162172 385 244 340 305 73 35 178 205 161 222 417 395 233 162 Healthcare costs 327 78 168 76 97 125 58 20 77 107 70 89 161 113 109 88Healthcare costs 327 78 168 76 97 125 58 20 77 107 70 89 161 113 109 88Healthcare costs 327 78 168 76 97 125 58 20 77 107 70 89 161 113 109 88Healthcare costs 327 78 168 76 97 125 58 20 77 107 70 89 161 113 109 88 40% 40% 42% 40% 40% 42% 40% 40% 42% 40% 40% 42% 36% 36% 43% 49% 36% 42% 44% 44% 41% 37% 34% 44% 41%36% 36% 43% 49% 36% 42% 44% 44% 41% 37% 34% 44% 41%36% 36% 43% 49% 36% 42% 44% 44% 41% 37% 34% 44% 41%36% 36% 43% 49% 36% 42% 44% 44% 41% 37% 34% 44% 41% n n n n Immigration 299 73 125 92 111 Immigration 299 73 125 92 111 Immigration 299 73 125 92 111 Immigration 299 73 125 92 111 123 26 15 58 91 73 73 141 188 54 47123 26 15 58 91 73 73 141 188 54 47123 26 15 58 91 73 73 141 188 54 47123 26 15 58 91 73 73 141 188 54 47 36% 38% 31% 44% 42% 43% 22% 27% 32% 38% 47% 34% 33% 57% 22% 22%36% 38% 31% 44% 42% 43% 22% 27% 32% 38% 47% 34% 33% 57% 22% 22%36% 38% 31% 44% 42% 43% 22% 27% 32% 38% 47% 34% 33% 57% 22% 22%36% 38% 31% 44% 42% 43% 22% 27% 32% 38% 47% 34% 33% 57% 22% 22% C C C C LM OP LM OP LM OP LM OP Economy and Jobs 247 42 124 73 101 63 35 14 53 55 52 69 121 126 73 39Economy and Jobs 247 42 124 73 101 63 35 14 53 55 52 69 121 126 73 39Economy and Jobs 247 42 124 73 101 63 35 14 53 55 52 69 121 126 73 39Economy and Jobs 247 42 124 73 101 63 35 14 53 55 52 69 121 126 73 39 30% 22% 31% 34% 38% 22% 29% 26% 29%30% 22% 31% 34% 38% 22% 29% 26% 29%30% 22% 31% 34% 38% 22% 29% 26% 29%30% 22% 31% 34% 38% 22% 29% 26% 29% 23% 33% 32% 28% 38% 29% 18%23% 33% 32% 28% 38% 29% 18%23% 33% 32% 28% 38% 29% 18%23% 33% 32% 28% 38% 29% 18% b B F oP P b B F oP P b B F oP P b B F oP P National security 178 32 78 63 59 73 14 10 41 50 3National security 178 32 78 63 59 73 14 10 41 50 3National security 178 32 78 63 59 73 14 10 41 50 3National security 178 32 78 63 59 73 14 10 41 50 32 50 92 113 50 92 50 92 113 50 92 50 92 113 50 92 50 92 113 50 9 22% 17% 20% 30% 22% 25% 12% 19% 23% 21% 20% 23% 21% 35% 20% 4%22% 17% 20% 30% 22% 25% 12% 19% 23% 21% 20% 23% 21% 35% 20% 4%22% 17% 20% 30% 22% 25% 12% 19% 23% 21% 20% 23% 21% 35% 20% 4%22% 17% 20% 30% 22% 25% 12% 19% 23% 21% 20% 23% 21% 35% 20% 4% BC BC BC BC OP P OP P OP P OP P Climate change 138 40 73 24 46 42 11 17 30 33 17 40 78 12 44 73Climate change 138 40 73 24 46 42 11 17 30 33 17 40 78 12 44 73Climate change 138 40 73 24 46 42 11 17 30 33 17 40 78 12 44 73Climate change 138 40 73 24 46 42 11 17 30 33 17 40 78 12 44 73 17% 21% 18% 11% 17% 14% 9% 31% 17% 14% 11% 18% 18% 4% 18% 34%17% 21% 18% 11% 17% 14% 9% 31% 17% 14% 11% 18% 18% 4% 18% 34%17% 21% 18% 11% 17% 14% 9% 31% 17% 14% 11% 18% 18% 4% 18% 34%17% 21% 18% 11% 17% 14% 9% 31% 17% 14% 11% 18% 18% 4% 18% 34% D D G K K N NOD D G K K N NOD D G K K N NOD D G K K N NO InvestigatiInvestigatiInvestigatiInvestigating the White 134 37 65 29 31 45 24 15 27 50 13 35 85 17 53 57ng the White 134 37 65 29 31 45 24 15 27 50 13 35 85 17 53 57ng the White 134 37 65 29 31 45 24 15 27 50 13 35 85 17 53 57ng the White 134 37 65 29 31 45 24 15 27 50 13 35 85 17 53 57 House 16% 19% 16% 14% 12% 16% 20% 28% 15% 21% 8% 16% 20% 5% 22% 27%House 16% 19% 16% 14% 12% 16% 20% 28% 15% 21% 8% 16% 20% 5% 22% 27%House 16% 19% 16% 14% 12% 16% 20% 28% 15% 21% 8% 16% 20% 5% 22% 27%House 16% 19% 16% 14% 12% 16% 20% 28% 15% 21% 8% 16% 20% 5% 22% 27% k K N Nk K N Nk K N Nk K N N GunGunGunGun----related issues 121 23 73 23 17 48 33 10 35 46 21 22 76 18 46 54related issues 121 23 73 23 17 48 33 10 35 46 21 22 76 18 46 54related issues 121 23 73 23 17 48 33 10 35 46 21 22 76 18 46 54related issues 121 23 73 23 17 48 33 10 35 46 21 22 76 18 46 54 15% 15% 15% 15% 12% 18% 11% 6% 17% 28% 19% 19% 19% 13% 10% 18% 6% 19% 25%12% 18% 11% 6% 17% 28% 19% 19% 19% 13% 10% 18% 6% 19% 25%12% 18% 11% 6% 17% 28% 19% 19% 19% 13% 10% 18% 6% 19% 25%12% 18% 11% 6% 17% 28% 19% 19% 19% 13% 10% 18% 6% 19% 25% bD E L N NbD E L N NbD E L N NbD E L N N Infrastructure 110 30 47 Infrastructure 110 30 47 Infrastructure 110 30 47 Infrastructure 110 30 47 29 48 24 16 4 20 21 17 27 64 42 37 2829 48 24 16 4 20 21 17 27 64 42 37 2829 48 24 16 4 20 21 17 27 64 42 37 2829 48 24 16 4 20 21 17 27 64 42 37 28 13% 16% 12% 14% 18% 8% 13% 7% 11% 9% 11% 13% 15% 13% 15% 13%13% 16% 12% 14% 18% 8% 13% 7% 11% 9% 11% 13% 15% 13% 15% 13%13% 16% 12% 14% 18% 8% 13% 7% 11% 9% 11% 13% 15% 13% 15% 13%13% 16% 12% 14% 18% 8% 13% 7% 11% 9% 11% 13% 15% 13% 15% 13% F F F F Comparison Groups: BCD/EF/GH/IJ/KLM/NOPComparison Groups: BCD/EF/GH/IJ/KLM/NOPComparison Groups: BCD/EF/GH/IJ/KLM/NOPComparison Groups: BCD/EF/GH/IJ/KLM/NOP Independent ZIndependent ZIndependent ZIndependent Z----Test for Percentages (unpooled proportions)Test for Percentages (unpooled proportions)Test for Percentages (unpooled proportions)Test for Percentages (unpooled proportions) Uppercase letters indicate significance at the 95% level.Uppercase letters indicate significance at the 95% level.Uppercase letters indicate significance at the 95% level.Uppercase letters indicate significance at the 95% level. Lowercase letters indicate siLowercase letters indicate siLowercase letters indicate siLowercase letters indicate significance at the 90% level.gnificance at the 90% level.gnificance at the 90% level.gnificance at the 90% level.

Table I1C Page 54Table I1C Page 54Table I1C Page 54Table I1C Page 54 (Continued)(Continued)(Continued)(Continued) Investor's Business Daily/TIPP PollInvestor's Business Daily/TIPP PollInvestor's Business Daily/TIPP PollInvestor's Business Daily/TIPP Poll---- December 2018, Field 11/26 to 12/2 , Sample December 2018, Field 11/26 to 12/2 , Sample December 2018, Field 11/26 to 12/2 , Sample December 2018, Field 11/26 to 12/2 , Sample ---- 823 adults, MOE +/823 adults, MOE +/823 adults, MOE +/823 adults, MOE +/----3.3 pts, Traditional phone with live interviewers 3.3 pts, Traditional phone with live interviewers 3.3 pts, Traditional phone with live interviewers 3.3 pts, Traditional phone with live interviewers I1CI1CI1CI1C Which of these issues should be given the SECOND HIGHEST priority by Congress at the start of 2019? (Combined)Which of these issues should be given the SECOND HIGHEST priority by Congress at the start of 2019? (Combined)Which of these issues should be given the SECOND HIGHEST priority by Congress at the start of 2019? (Combined)Which of these issues should be given the SECOND HIGHEST priority by Congress at the start of 2019? (Combined) ====AREA TYPE==== ===WHITE=== ==BLK/HISP= ==MAR.STAT= ====EDUCATION==== ====IDEOLOOGY========AREA TYPE==== ===WHITE=== ==BLK/HISP= ==MAR.STAT= ====EDUCATION==== ====IDEOLOOGY========AREA TYPE==== ===WHITE=== ==BLK/HISP= ==MAR.STAT= ====EDUCATION==== ====IDEOLOOGY========AREA TYPE==== ===WHITE=== ==BLK/HISP= ==MAR.STAT= ====EDUCATION==== ====IDEOLOOGY==== SUBSUBSUBSUB---- WHITE SINGL MARR HIGH SOME WHITE SINGL MARR HIGH SOME WHITE SINGL MARR HIGH SOME WHITE SINGL MARR HIGH SOME TOTAL URBAN URBAN RURAL MEN WOMEN BLACK HIS. WOMEN WOM SCHL. COLL. COLL+ CONS. MOD. LIB.TOTAL URBAN URBAN RURAL MEN WOMEN BLACK HIS. WOMEN WOM SCHL. COLL. COLL+ CONS. MOD. LIB.TOTAL URBAN URBAN RURAL MEN WOMEN BLACK HIS. WOMEN WOM SCHL. COLL. COLL+ CONS. MOD. LIB.TOTAL URBAN URBAN RURAL MEN WOMEN BLACK HIS. WOMEN WOM SCHL. COLL. COLL+ CONS. MOD. LIB. -------------------- -------------------- -------------------- -------------------- -------------------- -------------------- -------------------- -------------------- -------------------- -------------------- -------------------- -------------------- -------------------- -------------------- -------------------- -------------------- (A) (B) (C) (D) (E) (F) (G) (H) (I) (J) (K) (L) (M) (N) (O) (P)(A) (B) (C) (D) (E) (F) (G) (H) (I) (J) (K) (L) (M) (N) (O) (P)(A) (B) (C) (D) (E) (F) (G) (H) (I) (J) (K) (L) (M) (N) (O) (P)(A) (B) (C) (D) (E) (F) (G) (H) (I) (J) (K) (L) (M) (N) (O) (P) Criminal justice reform 79 25 4Criminal justice reform 79 25 4Criminal justice reform 79 25 4Criminal justice reform 79 25 43 11 19 31 18 4 20 23 19 22 38 23 23 313 11 19 31 18 4 20 23 19 22 38 23 23 313 11 19 31 18 4 20 23 19 22 38 23 23 313 11 19 31 18 4 20 23 19 22 38 23 23 31 10% 13% 11% 5% 7% 11% 15% 8% 11% 10% 12% 10% 9% 7% 9% 15%10% 13% 11% 5% 7% 11% 15% 8% 11% 10% 12% 10% 9% 7% 9% 15%10% 13% 11% 5% 7% 11% 15% 8% 11% 10% 12% 10% 9% 7% 9% 15%10% 13% 11% 5% 7% 11% 15% 8% 11% 10% 12% 10% 9% 7% 9% 15% D D D D D D D D NNNN Comparison Groups: BCD/EF/GH/IJ/KLM/NOPComparison Groups: BCD/EF/GH/IJ/KLM/NOPComparison Groups: BCD/EF/GH/IJ/KLM/NOPComparison Groups: BCD/EF/GH/IJ/KLM/NOP Independent ZIndependent ZIndependent ZIndependent Z----Test for Percentages (unpooled proportions)Test for Percentages (unpooled proportions)Test for Percentages (unpooled proportions)Test for Percentages (unpooled proportions) Uppercase letters indicate significance at the 95% level.Uppercase letters indicate significance at the 95% level.Uppercase letters indicate significance at the 95% level.Uppercase letters indicate significance at the 95% level. Lowercase letters indicate significance at the 90% level.Lowercase letters indicate significance at the 90% level.Lowercase letters indicate significance at the 90% level.Lowercase letters indicate significance at the 90% level.

Table T1 Page 55Table T1 Page 55Table T1 Page 55Table T1 Page 55 Investor's Business Daily/TIPP PollInvestor's Business Daily/TIPP PollInvestor's Business Daily/TIPP PollInvestor's Business Daily/TIPP Poll---- December 2018, Field 11/26 to 12/2 , Sample December 2018, Field 11/26 to 12/2 , Sample December 2018, Field 11/26 to 12/2 , Sample December 2018, Field 11/26 to 12/2 , Sample ---- 823 adults, MOE +/823 adults, MOE +/823 adults, MOE +/823 adults, MOE +/----3.3 pts, Traditiona3.3 pts, Traditiona3.3 pts, Traditiona3.3 pts, Traditional phone with live interviewers l phone with live interviewers l phone with live interviewers l phone with live interviewers T1T1T1T1 How likely is it that the U.S. and China will be able to reach a trade deal in the near future?How likely is it that the U.S. and China will be able to reach a trade deal in the near future?How likely is it that the U.S. and China will be able to reach a trade deal in the near future?How likely is it that the U.S. and China will be able to reach a trade deal in the near future? ======= REGION ======== ========= AGE ========= ==GENDER== ===RACE === ======= INCOME======= REGION ======== ========= AGE ========= ==GENDER== ===RACE === ======= INCOME======= REGION ======== ========= AGE ========= ==GENDER== ===RACE === ======= INCOME======= REGION ======== ========= AGE ========= ==GENDER== ===RACE === ======= INCOME ======= =====PARTY===== ==INVESTOR======== =====PARTY===== ==INVESTOR======== =====PARTY===== ==INVESTOR======== =====PARTY===== ==INVESTOR= TOTAL BLACK UND 30KTOTAL BLACK UND 30KTOTAL BLACK UND 30KTOTAL BLACK UND 30K---- 50K50K50K50K---- NE MW SOUTH WEST 18NE MW SOUTH WEST 18NE MW SOUTH WEST 18NE MW SOUTH WEST 18----24 2524 2524 2524 25----44 4544 4544 4544 45----64 65+ MALE FEM. WHITE HISP 30K 50K 75K 75K+ DEM REP IND YES NO 64 65+ MALE FEM. WHITE HISP 30K 50K 75K 75K+ DEM REP IND YES NO 64 65+ MALE FEM. WHITE HISP 30K 50K 75K 75K+ DEM REP IND YES NO 64 65+ MALE FEM. WHITE HISP 30K 50K 75K 75K+ DEM REP IND YES NO -------------------- -------------------- -------------------- -------------------- -------------------- -------------------- -------------------- -------------------- -------------------- -------------------- -------------------- -------------------- -------------------- -------------------- -------------------- -------------------- -------------------- -------------------- -------------------- -------------------- -------------------- -------------------- (A) (B) (C) (D) (E) (F) (G) (H) (I) (J) (K) (L) (M) (N) (O) (P) (Q) (R) (S) (T) (U) (A) (B) (C) (D) (E) (F) (G) (H) (I) (J) (K) (L) (M) (N) (O) (P) (Q) (R) (S) (T) (U) (A) (B) (C) (D) (E) (F) (G) (H) (I) (J) (K) (L) (M) (N) (O) (P) (Q) (R) (S) (T) (U) (A) (B) (C) (D) (E) (F) (G) (H) (I) (J) (K) (L) (M) (N) (O) (P) (Q) (R) (S) (T) (U) (V)(V)(V)(V) TOTAL 823 147 181 309 186 45 234 293 207 393 430 55TOTAL 823 147 181 309 186 45 234 293 207 393 430 55TOTAL 823 147 181 309 186 45 234 293 207 393 430 55TOTAL 823 147 181 309 186 45 234 293 207 393 430 556 171 92 131 138 363 286 237 283 447 3096 171 92 131 138 363 286 237 283 447 3096 171 92 131 138 363 286 237 283 447 3096 171 92 131 138 363 286 237 283 447 309 100% 100% 100% 100% 100% 100% 100% 100% 100% 100% 100% 100% 100% 100% 100% 100% 100% 100% 100% 100% 100% 100% 100% 100% 100% 100% 100% 100% 100% 100% 100% 100% 100% 100% 100% 100% 100% 100% 100% 100% 100% 100% 100% 100% 100% 100% 100% 100% 100% 100% 100% 100% 100% 100% 100% 100% 100% 100% 100% 100% 100% 100% 100% 100% 100% 100% 100% 100% 100% 100% 100% 100% 100% 100% 100% 100% 100% 100% 100% 100% 100% 100% 100% 100% 100%100%100%100% Unweighted Total 823 1Unweighted Total 823 1Unweighted Total 823 1Unweighted Total 823 158 180 311 174 17 102 289 371 433 390 645 107 104 145 126 337 247 296 262 472 28258 180 311 174 17 102 289 371 433 390 645 107 104 145 126 337 247 296 262 472 28258 180 311 174 17 102 289 371 433 390 645 107 104 145 126 337 247 296 262 472 28258 180 311 174 17 102 289 371 433 390 645 107 104 145 126 337 247 296 262 472 282 Very likely 179 27 41 68 43 5 51 69 44 107 73 134 26 20 21 28 Very likely 179 27 41 68 43 5 51 69 44 107 73 134 26 20 21 28 Very likely 179 27 41 68 43 5 51 69 44 107 73 134 26 20 21 28 Very likely 179 27 41 68 43 5 51 69 44 107 73 134 26 20 21 28 89 289 289 289 20 87 67 109 600 87 67 109 600 87 67 109 600 87 67 109 60 22% 18% 23% 22% 23% 10% 22% 23% 21% 27% 17% 24% 15% 22% 16% 20% 25% 7% 37% 24% 24% 22% 18% 23% 22% 23% 10% 22% 23% 21% 27% 17% 24% 15% 22% 16% 20% 25% 7% 37% 24% 24% 22% 18% 23% 22% 23% 10% 22% 23% 21% 27% 17% 24% 15% 22% 16% 20% 25% 7% 37% 24% 24% 22% 18% 23% 22% 23% 10% 22% 23% 21% 27% 17% 24% 15% 22% 16% 20% 25% 7% 37% 24% 24% 19%19%19%19% K M RT R K M RT R K M RT R K M RT R Somewhat likely 333 61 81 124 67 23 77 119 94 159 174 227 60 44 63 52 1Somewhat likely 333 61 81 124 67 23 77 119 94 159 174 227 60 44 63 52 1Somewhat likely 333 61 81 124 67 23 77 119 94 159 174 227 60 44 63 52 1Somewhat likely 333 61 81 124 67 23 77 119 94 159 174 227 60 44 63 52 131 106 116 104 181 12431 106 116 104 181 12431 106 116 104 181 12431 106 116 104 181 124 40% 41% 45% 40% 36% 52% 33% 41% 45% 40% 41% 41% 35% 48% 48% 37% 36% 37% 49% 37% 40% 40% 41% 45% 40% 36% 52% 33% 41% 45% 40% 41% 41% 35% 48% 48% 37% 36% 37% 49% 37% 40% 40% 41% 45% 40% 36% 52% 33% 41% 45% 40% 41% 41% 35% 48% 48% 37% 36% 37% 49% 37% 40% 40% 41% 45% 40% 36% 52% 33% 41% 45% 40% 41% 41% 35% 48% 48% 37% 36% 37% 49% 37% 40% 40%40%40%40% G G G G q Q RT q Q RT q Q RT q Q RT Not very likely 173 28 33 65 46 11 53 54 47 72 101 107 52 13 32 30 Not very likely 173 28 33 65 46 11 53 54 47 72 101 107 52 13 32 30 Not very likely 173 28 33 65 46 11 53 54 47 72 101 107 52 13 32 30 Not very likely 173 28 33 65 46 11 53 54 47 72 101 107 52 13 32 30 80 101 20 49 98 6180 101 20 49 98 6180 101 20 49 98 6180 101 20 49 98 61 21% 19%21% 19%21% 19%21% 19% 18% 21% 25% 25% 23% 19% 22% 18% 23% 19% 30% 14% 25% 21% 22% 35% 8% 17% 22% 20%18% 21% 25% 25% 23% 19% 22% 18% 23% 19% 30% 14% 25% 21% 22% 35% 8% 17% 22% 20%18% 21% 25% 25% 23% 19% 22% 18% 23% 19% 30% 14% 25% 21% 22% 35% 8% 17% 22% 20%18% 21% 25% 25% 23% 19% 22% 18% 23% 19% 30% 14% 25% 21% 22% 35% 8% 17% 22% 20% L ST L ST L ST L ST S S S S Not at all likely 80 20 19 29 12 Not at all likely 80 20 19 29 12 Not at all likely 80 20 19 29 12 Not at all likely 80 20 19 29 12 ---- 33 33 12 36 44 46 24 8 10 16 40 32 7 39 35 3733 33 12 36 44 46 24 8 10 16 40 32 7 39 35 3733 33 12 36 44 46 24 8 10 16 40 32 7 39 35 3733 33 12 36 44 46 24 8 10 16 40 32 7 39 35 37 10% 13% 11% 9% 6% 14% 11% 10% 13% 11% 9% 6% 14% 11% 10% 13% 11% 9% 6% 14% 11% 10% 13% 11% 9% 6% 14% 11% 6% 9% 10% 8% 14% 9% 8% 12% 11% 11% 3% 14% 8% 12%6% 9% 10% 8% 14% 9% 8% 12% 11% 11% 3% 14% 8% 12%6% 9% 10% 8% 14% 9% 8% 12% 11% 11% 3% 14% 8% 12%6% 9% 10% 8% 14% 9% 8% 12% 11% 11% 3% 14% 8% 12% E I I S S E I I S S E I I S S E I I S S Not sure Not sure Not sure Not sure 57 12 6 22 17 6 21 17 11 19 39 42 10 5 5 13 23 27 7 23 25 57 12 6 22 17 6 21 17 11 19 39 42 10 5 5 13 23 27 7 23 25 57 12 6 22 17 6 21 17 11 19 39 42 10 5 5 13 23 27 7 23 25 57 12 6 22 17 6 21 17 11 19 39 42 10 5 5 13 23 27 7 23 25 25252525 7% 8% 3% 7% 9% 13% 9% 6% 5% 5% 9% 8% 6% 6% 7% 8% 3% 7% 9% 13% 9% 6% 5% 5% 9% 8% 6% 6% 7% 8% 3% 7% 9% 13% 9% 6% 5% 5% 9% 8% 6% 6% 7% 8% 3% 7% 9% 13% 9% 6% 5% 5% 9% 8% 6% 6% 4% 10% 6% 9% 3% 8% 6% 8%4% 10% 6% 9% 3% 8% 6% 8%4% 10% 6% 9% 3% 8% 6% 8%4% 10% 6% 9% 3% 8% 6% 8% c J S S c J S S c J S S c J S S Refused 1 Refused 1 Refused 1 Refused 1 ---- ---- 1 1 1 1 ---- ---- ---- 1 1 1 1 ---- 1 1 1 1 ---- 1 1 1 1 ---- 1 1 1 1 ---- ---- ---- ---- ---- 1 1 1 1 ---- 1111 *% *% *% *% *% 1% *% *% *% *% *% *% 1% *% *% *% *% *% *% 1% *% *% *% *% *% *% 1% *% *%*%*%*% LIKELY 512 88 123 192 110 28 127 187 138 266 247 361 86 65 84 79 2LIKELY 512 88 123 192 110 28 127 187 138 266 247 361 86 65 84 79 2LIKELY 512 88 123 192 110 28 127 187 138 266 247 361 86 65 84 79 2LIKELY 512 88 123 192 110 28 127 187 138 266 247 361 86 65 84 79 220 126 203 171 289 18420 126 203 171 289 18420 126 203 171 289 18420 126 203 171 289 184 62% 60% 68% 62% 59% 62% 55% 64% 66% 68% 62% 60% 68% 62% 59% 62% 55% 64% 66% 68% 62% 60% 68% 62% 59% 62% 55% 64% 66% 68% 62% 60% 68% 62% 59% 62% 55% 64% 66% 68% 57% 65% 50% 70% 64% 57% 61% 44% 86% 60% 65% 60%57% 65% 50% 70% 64% 57% 61% 44% 86% 60% 65% 60%57% 65% 50% 70% 64% 57% 61% 44% 86% 60% 65% 60%57% 65% 50% 70% 64% 57% 61% 44% 86% 60% 65% 60% G K M RT R G K M RT R G K M RT R G K M RT R NOT LIKELY NOT LIKELY NOT LIKELY NOT LIKELY 253 48 52 94 59 11 86 88 59 108 144 153 76 21 42 46 120 133 27 88 133 253 48 52 94 59 11 86 88 59 108 144 153 76 21 42 46 120 133 27 88 133 253 48 52 94 59 11 86 88 59 108 144 153 76 21 42 46 120 133 27 88 133 253 48 52 94 59 11 86 88 59 108 144 153 76 21 42 46 120 133 27 88 133 99999999 31% 33% 29% 30% 32% 25% 37% 30% 28% 28% 34% 27% 44% 23% 32% 33% 31% 33% 29% 30% 32% 25% 37% 30% 28% 28% 34% 27% 44% 23% 32% 33% 31% 33% 29% 30% 32% 25% 37% 30% 28% 28% 34% 27% 44% 23% 32% 33% 31% 33% 29% 30% 32% 25% 37% 30% 28% 28% 34% 27% 44% 23% 32% 33% 33% 46% 11% 31% 30% 32%33% 46% 11% 31% 30% 32%33% 46% 11% 31% 30% 32%33% 46% 11% 31% 30% 32% L ST S L ST S L ST S L ST S Comparison Groups: BCDE/FGHI/JK/LM/NOPQ/RST/UVComparison Groups: BCDE/FGHI/JK/LM/NOPQ/RST/UVComparison Groups: BCDE/FGHI/JK/LM/NOPQ/RST/UVComparison Groups: BCDE/FGHI/JK/LM/NOPQ/RST/UV Independent ZIndependent ZIndependent ZIndependent Z----Test for Percentages (unpooled proportions)Test for Percentages (unpooled proportions)Test for Percentages (unpooled proportions)Test for Percentages (unpooled proportions) Uppercase letters indicate significance at the 95% level.Uppercase letters indicate significance at the 95% level.Uppercase letters indicate significance at the 95% level.Uppercase letters indicate significance at the 95% level. Lowercase letters indicate significance at the 90% level.Lowercase letters indicate significance at the 90% level.Lowercase letters indicate significance at the 90% level.Lowercase letters indicate significance at the 90% level.
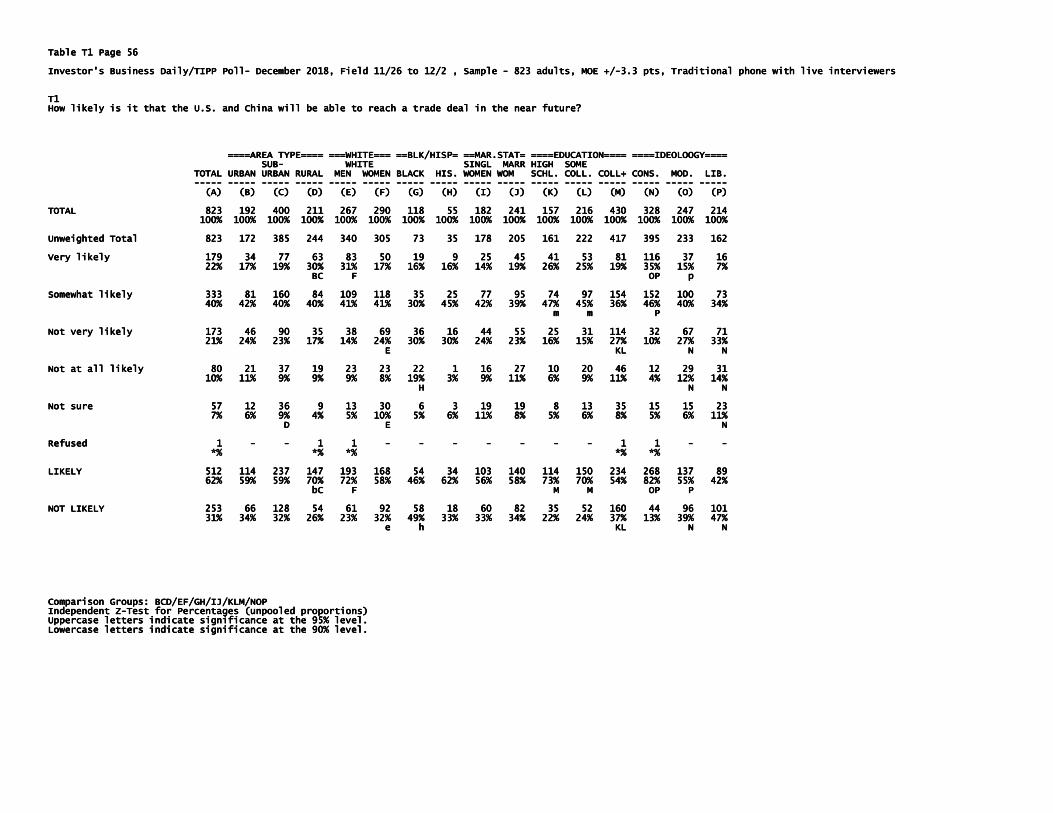
Table T1 Page 56Table T1 Page 56Table T1 Page 56Table T1 Page 56 Investor's Business Daily/TIPP PollInvestor's Business Daily/TIPP PollInvestor's Business Daily/TIPP PollInvestor's Business Daily/TIPP Poll---- December 2018, Field 11/26December 2018, Field 11/26December 2018, Field 11/26December 2018, Field 11/26 to 12/2 , Sample to 12/2 , Sample to 12/2 , Sample to 12/2 , Sample ---- 823 adults, MOE +/823 adults, MOE +/823 adults, MOE +/823 adults, MOE +/----3.3 pts, Traditional phone with live interviewers 3.3 pts, Traditional phone with live interviewers 3.3 pts, Traditional phone with live interviewers 3.3 pts, Traditional phone with live interviewers T1T1T1T1 How likely is it that the U.S. and China will be able to reach a trade deal in the near future?How likely is it that the U.S. and China will be able to reach a trade deal in the near future?How likely is it that the U.S. and China will be able to reach a trade deal in the near future?How likely is it that the U.S. and China will be able to reach a trade deal in the near future? ====AREA TYPE==== ===WHITE=======AREA TYPE==== ===WHITE=======AREA TYPE==== ===WHITE=======AREA TYPE==== ===WHITE=== ==BLK/HISP= ==MAR.STAT= ====EDUCATION==== ====IDEOLOOGY======BLK/HISP= ==MAR.STAT= ====EDUCATION==== ====IDEOLOOGY======BLK/HISP= ==MAR.STAT= ====EDUCATION==== ====IDEOLOOGY======BLK/HISP= ==MAR.STAT= ====EDUCATION==== ====IDEOLOOGY==== SUBSUBSUBSUB---- WHITE SINGL MARR HIGH SOME WHITE SINGL MARR HIGH SOME WHITE SINGL MARR HIGH SOME WHITE SINGL MARR HIGH SOME TOTAL URBAN URBAN RURAL MEN WOMEN BLACK HIS.TOTAL URBAN URBAN RURAL MEN WOMEN BLACK HIS.TOTAL URBAN URBAN RURAL MEN WOMEN BLACK HIS.TOTAL URBAN URBAN RURAL MEN WOMEN BLACK HIS. WOMEN WOM SCHL. COLL. COLL+ CONS. MOD. LIB.WOMEN WOM SCHL. COLL. COLL+ CONS. MOD. LIB.WOMEN WOM SCHL. COLL. COLL+ CONS. MOD. LIB.WOMEN WOM SCHL. COLL. COLL+ CONS. MOD. LIB. -------------------- -------------------- -------------------- -------------------- -------------------- -------------------- -------------------- -------------------- -------------------- -------------------- -------------------- -------------------- -------------------- -------------------- -------------------- -------------------- (A) (B) (C) (D) (E) (F) (G) (H) (I) (J)(A) (B) (C) (D) (E) (F) (G) (H) (I) (J)(A) (B) (C) (D) (E) (F) (G) (H) (I) (J)(A) (B) (C) (D) (E) (F) (G) (H) (I) (J) (K) (L) (M) (N) (O) (P)(K) (L) (M) (N) (O) (P)(K) (L) (M) (N) (O) (P)(K) (L) (M) (N) (O) (P) TOTAL 823 192 400 211 267 290 118 55 182 241 157 216 430 328 247 214TOTAL 823 192 400 211 267 290 118 55 182 241 157 216 430 328 247 214TOTAL 823 192 400 211 267 290 118 55 182 241 157 216 430 328 247 214TOTAL 823 192 400 211 267 290 118 55 182 241 157 216 430 328 247 214 100% 100% 100% 100% 100% 100% 100% 100% 100% 100% 100% 100% 100% 100% 100% 100%100% 100% 100% 100% 100% 100% 100% 100% 100% 100% 100% 100% 100% 100% 100% 100%100% 100% 100% 100% 100% 100% 100% 100% 100% 100% 100% 100% 100% 100% 100% 100%100% 100% 100% 100% 100% 100% 100% 100% 100% 100% 100% 100% 100% 100% 100% 100% Unweighted Total 823 172 385 244 340 305 73 35 178 205 161 222 417 395 233 162Unweighted Total 823 172 385 244 340 305 73 35 178 205 161 222 417 395 233 162Unweighted Total 823 172 385 244 340 305 73 35 178 205 161 222 417 395 233 162Unweighted Total 823 172 385 244 340 305 73 35 178 205 161 222 417 395 233 162 Very likelVery likelVery likelVery likely 179 34 77 63 83 50 19 9 25 45 41 53 81 116 37 16y 179 34 77 63 83 50 19 9 25 45 41 53 81 116 37 16y 179 34 77 63 83 50 19 9 25 45 41 53 81 116 37 16y 179 34 77 63 83 50 19 9 25 45 41 53 81 116 37 16 22% 17% 19% 30% 31% 17% 16% 16% 14% 19% 26% 25% 19% 35% 15% 7%22% 17% 19% 30% 31% 17% 16% 16% 14% 19% 26% 25% 19% 35% 15% 7%22% 17% 19% 30% 31% 17% 16% 16% 14% 19% 26% 25% 19% 35% 15% 7%22% 17% 19% 30% 31% 17% 16% 16% 14% 19% 26% 25% 19% 35% 15% 7% BC F OP p BC F OP p BC F OP p BC F OP p Somewhat likely 333 81 160 84 109 118 35 25 77 95 74 97 154 152 100 73Somewhat likely 333 81 160 84 109 118 35 25 77 95 74 97 154 152 100 73Somewhat likely 333 81 160 84 109 118 35 25 77 95 74 97 154 152 100 73Somewhat likely 333 81 160 84 109 118 35 25 77 95 74 97 154 152 100 73 40% 40% 40% 40% 42% 40% 40% 41% 41% 30% 45% 42% 39% 47% 45% 36% 46% 40% 34%42% 40% 40% 41% 41% 30% 45% 42% 39% 47% 45% 36% 46% 40% 34%42% 40% 40% 41% 41% 30% 45% 42% 39% 47% 45% 36% 46% 40% 34%42% 40% 40% 41% 41% 30% 45% 42% 39% 47% 45% 36% 46% 40% 34% m m P m m P m m P m m P Not very likely 173 46 90 Not very likely 173 46 90 Not very likely 173 46 90 Not very likely 173 46 90 35 38 69 36 16 44 55 25 31 114 32 67 7135 38 69 36 16 44 55 25 31 114 32 67 7135 38 69 36 16 44 55 25 31 114 32 67 7135 38 69 36 16 44 55 25 31 114 32 67 71 21% 24% 23% 17% 14% 24% 30% 30% 24% 23% 16% 15% 27% 10% 27% 33%21% 24% 23% 17% 14% 24% 30% 30% 24% 23% 16% 15% 27% 10% 27% 33%21% 24% 23% 17% 14% 24% 30% 30% 24% 23% 16% 15% 27% 10% 27% 33%21% 24% 23% 17% 14% 24% 30% 30% 24% 23% 16% 15% 27% 10% 27% 33% E KL N NE KL N NE KL N NE KL N N Not at all likely 80 21 37 19 23 23 22 1 16 27 10 20 46 12 29 31Not at all likely 80 21 37 19 23 23 22 1 16 27 10 20 46 12 29 31Not at all likely 80 21 37 19 23 23 22 1 16 27 10 20 46 12 29 31Not at all likely 80 21 37 19 23 23 22 1 16 27 10 20 46 12 29 31 10% 11% 9% 9% 9% 8% 19%10% 11% 9% 9% 9% 8% 19%10% 11% 9% 9% 9% 8% 19%10% 11% 9% 9% 9% 8% 19% 3% 9% 11% 6% 9% 11% 4% 12% 14%3% 9% 11% 6% 9% 11% 4% 12% 14%3% 9% 11% 6% 9% 11% 4% 12% 14%3% 9% 11% 6% 9% 11% 4% 12% 14% H N NH N NH N NH N N Not sure 57 12 36 9 13 30 6 3 1Not sure 57 12 36 9 13 30 6 3 1Not sure 57 12 36 9 13 30 6 3 1Not sure 57 12 36 9 13 30 6 3 19 19 8 13 35 15 15 239 19 8 13 35 15 15 239 19 8 13 35 15 15 239 19 8 13 35 15 15 23 7% 6% 9% 4% 5% 10% 5% 6% 11% 8% 5% 6% 8% 5% 6% 11%7% 6% 9% 4% 5% 10% 5% 6% 11% 8% 5% 6% 8% 5% 6% 11%7% 6% 9% 4% 5% 10% 5% 6% 11% 8% 5% 6% 8% 5% 6% 11%7% 6% 9% 4% 5% 10% 5% 6% 11% 8% 5% 6% 8% 5% 6% 11% D E D E D E D E NNNN Refused 1 Refused 1 Refused 1 Refused 1 ---- ---- 1 1 1 1 1 1 1 1 ---- ---- ---- ---- ---- ---- ---- 1 1 1 1 1 1 1 1 ---- ---- *% *% *% *% *% *% *% *% *% *% *% *% *% *% *% *% *% *% *% *% LIKELY 512 114 237 147 193 168 54 34 103 140 114 150 234 268 137 89LIKELY 512 114 237 147 193 168 54 34 103 140 114 150 234 268 137 89LIKELY 512 114 237 147 193 168 54 34 103 140 114 150 234 268 137 89LIKELY 512 114 237 147 193 168 54 34 103 140 114 150 234 268 137 89 62% 59% 59% 70% 72% 58% 46% 62% 56% 58% 73% 70% 54% 82% 55% 42%62% 59% 59% 70% 72% 58% 46% 62% 56% 58% 73% 70% 54% 82% 55% 42%62% 59% 59% 70% 72% 58% 46% 62% 56% 58% 73% 70% 54% 82% 55% 42%62% 59% 59% 70% 72% 58% 46% 62% 56% 58% 73% 70% 54% 82% 55% 42% bC F M M OP P bC F M M OP P bC F M M OP P bC F M M OP P NOT LIKELY NOT LIKELY NOT LIKELY NOT LIKELY 253 66 128 54 61 92 58 18 60 82 35 52 160 44 96 101253 66 128 54 61 92 58 18 60 82 35 52 160 44 96 101253 66 128 54 61 92 58 18 60 82 35 52 160 44 96 101253 66 128 54 61 92 58 18 60 82 35 52 160 44 96 101 31% 34% 32% 26% 23% 32% 49% 33% 33% 34% 22% 24% 37% 13% 39% 47%31% 34% 32% 26% 23% 32% 49% 33% 33% 34% 22% 24% 37% 13% 39% 47%31% 34% 32% 26% 23% 32% 49% 33% 33% 34% 22% 24% 37% 13% 39% 47%31% 34% 32% 26% 23% 32% 49% 33% 33% 34% 22% 24% 37% 13% 39% 47% e h KL N Ne h KL N Ne h KL N Ne h KL N N Comparison Groups: BCD/EF/GH/IJ/KLM/NOPComparison Groups: BCD/EF/GH/IJ/KLM/NOPComparison Groups: BCD/EF/GH/IJ/KLM/NOPComparison Groups: BCD/EF/GH/IJ/KLM/NOP Independent ZIndependent ZIndependent ZIndependent Z----Test for Percentages (unpooled proportions)Test for Percentages (unpooled proportions)Test for Percentages (unpooled proportions)Test for Percentages (unpooled proportions) Uppercase letters indicate significance at the 95% lUppercase letters indicate significance at the 95% lUppercase letters indicate significance at the 95% lUppercase letters indicate significance at the 95% level.evel.evel.evel. Lowercase letters indicate significance at the 90% level.Lowercase letters indicate significance at the 90% level.Lowercase letters indicate significance at the 90% level.Lowercase letters indicate significance at the 90% level.
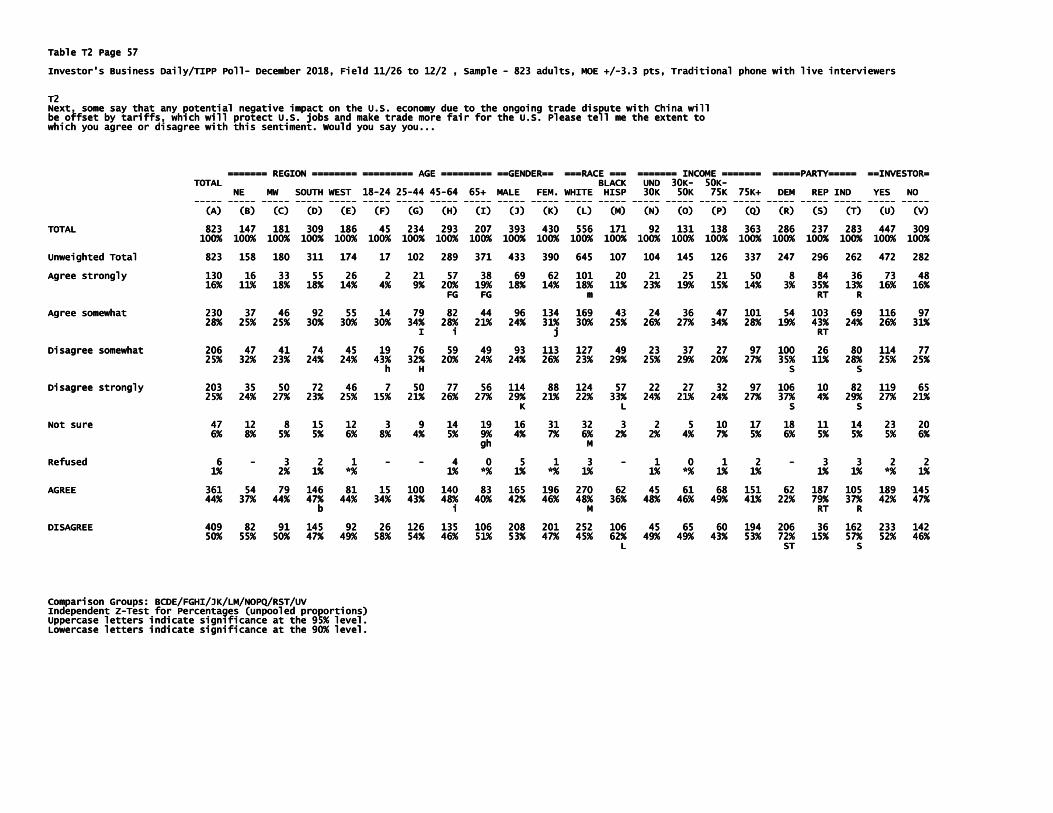
Table T2 Page 57Table T2 Page 57Table T2 Page 57Table T2 Page 57 Investor's Business Daily/TIPP PollInvestor's Business Daily/TIPP PollInvestor's Business Daily/TIPP PollInvestor's Business Daily/TIPP Poll---- December 2018, Field 11/26 to 12/2 , Sample December 2018, Field 11/26 to 12/2 , Sample December 2018, Field 11/26 to 12/2 , Sample December 2018, Field 11/26 to 12/2 , Sample ---- 823 adults, MOE +/823 adults, MOE +/823 adults, MOE +/823 adults, MOE +/----3.3 pts, Traditional phone with live interviewers 3.3 pts, Traditional phone with live interviewers 3.3 pts, Traditional phone with live interviewers 3.3 pts, Traditional phone with live interviewers T2T2T2T2 Next, some say Next, some say Next, some say Next, some say that any potential negative impact on the U.S. economy due to the ongoing trade dispute with China will that any potential negative impact on the U.S. economy due to the ongoing trade dispute with China will that any potential negative impact on the U.S. economy due to the ongoing trade dispute with China will that any potential negative impact on the U.S. economy due to the ongoing trade dispute with China will be offset by tariffs, which will protect U.S. jobs and make trade more fair for the U.S. Please tell me the extent to be offset by tariffs, which will protect U.S. jobs and make trade more fair for the U.S. Please tell me the extent to be offset by tariffs, which will protect U.S. jobs and make trade more fair for the U.S. Please tell me the extent to be offset by tariffs, which will protect U.S. jobs and make trade more fair for the U.S. Please tell me the extent to which you agree or disagree withwhich you agree or disagree withwhich you agree or disagree withwhich you agree or disagree with this sentiment. Would you say you...this sentiment. Would you say you...this sentiment. Would you say you...this sentiment. Would you say you... ======= REGION ======== ========= AGE ========= ==GENDER== ===RACE === ======= INCOME ======= =====PARTY===== ==INVESTOR======== REGION ======== ========= AGE ========= ==GENDER== ===RACE === ======= INCOME ======= =====PARTY===== ==INVESTOR======== REGION ======== ========= AGE ========= ==GENDER== ===RACE === ======= INCOME ======= =====PARTY===== ==INVESTOR======== REGION ======== ========= AGE ========= ==GENDER== ===RACE === ======= INCOME ======= =====PARTY===== ==INVESTOR= TOTAL BLACK UND 30KTOTAL BLACK UND 30KTOTAL BLACK UND 30KTOTAL BLACK UND 30K---- 50K50K50K50K---- NE MW SOUTH WEST 18NE MW SOUTH WEST 18NE MW SOUTH WEST 18NE MW SOUTH WEST 18----24 2524 2524 2524 25----44 4544 4544 4544 45----64 65+ MALE FEM. WHITE 64 65+ MALE FEM. WHITE 64 65+ MALE FEM. WHITE 64 65+ MALE FEM. WHITE HISP 30K 50K 75K 75K+ DEM REP IND YES NO HISP 30K 50K 75K 75K+ DEM REP IND YES NO HISP 30K 50K 75K 75K+ DEM REP IND YES NO HISP 30K 50K 75K 75K+ DEM REP IND YES NO -------------------- -------------------- -------------------- -------------------- -------------------- -------------------- -------------------- -------------------- -------------------- -------------------- -------------------- -------------------- -------------------- -------------------- -------------------- -------------------- -------------------- -------------------- -------------------- -------------------- -------------------- -------------------- (A) (B) (A) (B) (A) (B) (A) (B) (C) (D) (E) (F) (G) (H) (I) (J) (K) (L) (M) (N) (O) (P) (Q) (R) (S) (T) (U) (V)(C) (D) (E) (F) (G) (H) (I) (J) (K) (L) (M) (N) (O) (P) (Q) (R) (S) (T) (U) (V)(C) (D) (E) (F) (G) (H) (I) (J) (K) (L) (M) (N) (O) (P) (Q) (R) (S) (T) (U) (V)(C) (D) (E) (F) (G) (H) (I) (J) (K) (L) (M) (N) (O) (P) (Q) (R) (S) (T) (U) (V) TOTAL 823 147 181 309 186 45 234 293 207 393 430 556 171 92 131 138 3TOTAL 823 147 181 309 186 45 234 293 207 393 430 556 171 92 131 138 3TOTAL 823 147 181 309 186 45 234 293 207 393 430 556 171 92 131 138 3TOTAL 823 147 181 309 186 45 234 293 207 393 430 556 171 92 131 138 363 286 63 286 63 286 63 286 237 283 447 309237 283 447 309237 283 447 309237 283 447 309 100% 100% 100% 100% 100% 100% 100% 100% 100% 100% 100% 100% 100% 100% 100% 100% 100% 100% 100% 100% 100% 100% 100% 100% 100% 100% 100% 100% 100% 100% 100% 100% 100% 100% 100% 100% 100% 100% 100% 100% 100% 100% 100% 100% 100% 100% 100% 100% 100% 100% 100% 100% 100% 100% 100% 100% 100% 100% 100% 100% 100% 100% 100% 100% 100% 100% 100% 100% 100% 100% 100% 100% 100% 100% 100% 100% 100% 100% 100% 100% 100% 100% 100% 100% 100%100%100%100% Unweighted Total 823 158 180 311 174 17 102 289 Unweighted Total 823 158 180 311 174 17 102 289 Unweighted Total 823 158 180 311 174 17 102 289 Unweighted Total 823 158 180 311 174 17 102 289 371 433 390 645 107 104 145 126 337 247 296 262 472 282371 433 390 645 107 104 145 126 337 247 296 262 472 282371 433 390 645 107 104 145 126 337 247 296 262 472 282371 433 390 645 107 104 145 126 337 247 296 262 472 282 Agree strongly 130 16 33 55 26 2 21 57 38 69 62 101 20 21 25 21 Agree strongly 130 16 33 55 26 2 21 57 38 69 62 101 20 21 25 21 Agree strongly 130 16 33 55 26 2 21 57 38 69 62 101 20 21 25 21 Agree strongly 130 16 33 55 26 2 21 57 38 69 62 101 20 21 25 21 50 8 84 36 73 4850 8 84 36 73 4850 8 84 36 73 4850 8 84 36 73 48 16% 11% 18% 18% 14% 4% 9% 20% 19% 18% 14% 18% 11% 23% 19% 15% 14% 3% 35% 13% 16% 16% 11% 18% 18% 14% 4% 9% 20% 19% 18% 14% 18% 11% 23% 19% 15% 14% 3% 35% 13% 16% 16% 11% 18% 18% 14% 4% 9% 20% 19% 18% 14% 18% 11% 23% 19% 15% 14% 3% 35% 13% 16% 16% 11% 18% 18% 14% 4% 9% 20% 19% 18% 14% 18% 11% 23% 19% 15% 14% 3% 35% 13% 16% 16%16%16%16% FG FG m FG FG m FG FG m FG FG m RT R RT R RT R RT R Agree somewhat 230 37 46 92 55 14 79 82 44 96 134 169 43 24 36 47 1Agree somewhat 230 37 46 92 55 14 79 82 44 96 134 169 43 24 36 47 1Agree somewhat 230 37 46 92 55 14 79 82 44 96 134 169 43 24 36 47 1Agree somewhat 230 37 46 92 55 14 79 82 44 96 134 169 43 24 36 47 101 54 103 69 116 9701 54 103 69 116 9701 54 103 69 116 9701 54 103 69 116 97 28% 25% 25% 30% 28% 25% 25% 30% 28% 25% 25% 30% 28% 25% 25% 30% 30% 30% 34% 28% 21% 24% 31% 30% 25% 26% 27% 34% 28% 19% 43% 24% 26% 31%30% 30% 34% 28% 21% 24% 31% 30% 25% 26% 27% 34% 28% 19% 43% 24% 26% 31%30% 30% 34% 28% 21% 24% 31% 30% 25% 26% 27% 34% 28% 19% 43% 24% 26% 31%30% 30% 34% 28% 21% 24% 31% 30% 25% 26% 27% 34% 28% 19% 43% 24% 26% 31% I i j RT I i j RT I i j RT I i j RT Disagree somewhat 206 47 41 74 45 19 76 59 49 93 113 127 49 23 37 27 Disagree somewhat 206 47 41 74 45 19 76 59 49 93 113 127 49 23 37 27 Disagree somewhat 206 47 41 74 45 19 76 59 49 93 113 127 49 23 37 27 Disagree somewhat 206 47 41 74 45 19 76 59 49 93 113 127 49 23 37 27 97 100 26 80 114 7797 100 26 80 114 7797 100 26 80 114 7797 100 26 80 114 77 25% 32% 23% 24% 24% 43% 32% 20% 24% 24% 25% 32% 23% 24% 24% 43% 32% 20% 24% 24% 25% 32% 23% 24% 24% 43% 32% 20% 24% 24% 25% 32% 23% 24% 24% 43% 32% 20% 24% 24% 26% 23% 29% 25% 29% 20% 27% 35% 11% 28% 25% 25%26% 23% 29% 25% 29% 20% 27% 35% 11% 28% 25% 25%26% 23% 29% 25% 29% 20% 27% 35% 11% 28% 25% 25%26% 23% 29% 25% 29% 20% 27% 35% 11% 28% 25% 25% h H S S h H S S h H S S h H S S Disagree strongly Disagree strongly Disagree strongly Disagree strongly 203 35 50 72 46 7 50 77 56 114 88 124 57 22 27 32 97 106 10 82 119 203 35 50 72 46 7 50 77 56 114 88 124 57 22 27 32 97 106 10 82 119 203 35 50 72 46 7 50 77 56 114 88 124 57 22 27 32 97 106 10 82 119 203 35 50 72 46 7 50 77 56 114 88 124 57 22 27 32 97 106 10 82 119 65656565 25% 24% 27% 23% 25% 15% 21% 26% 27% 29% 21% 22% 33% 24% 21% 24% 25% 24% 27% 23% 25% 15% 21% 26% 27% 29% 21% 22% 33% 24% 21% 24% 25% 24% 27% 23% 25% 15% 21% 26% 27% 29% 21% 22% 33% 24% 21% 24% 25% 24% 27% 23% 25% 15% 21% 26% 27% 29% 21% 22% 33% 24% 21% 24% 27% 37% 4% 29% 27% 21%27% 37% 4% 29% 27% 21%27% 37% 4% 29% 27% 21%27% 37% 4% 29% 27% 21% K L S S K L S S K L S S K L S S Not sure 47 12 8 15 12 3 9 14 19 16 31 32 3 2 5 10 Not sure 47 12 8 15 12 3 9 14 19 16 31 32 3 2 5 10 Not sure 47 12 8 15 12 3 9 14 19 16 31 32 3 2 5 10 Not sure 47 12 8 15 12 3 9 14 19 16 31 32 3 2 5 10 17 18 11 14 23 2017 18 11 14 23 2017 18 11 14 23 2017 18 11 14 23 20 6% 8% 5% 5% 6% 8% 4% 5% 9% 4% 7% 6% 6% 8% 5% 5% 6% 8% 4% 5% 9% 4% 7% 6% 6% 8% 5% 5% 6% 8% 4% 5% 9% 4% 7% 6% 6% 8% 5% 5% 6% 8% 4% 5% 9% 4% 7% 6% 2% 2% 4% 7% 5% 6% 5% 5% 5% 6%2% 2% 4% 7% 5% 6% 5% 5% 5% 6%2% 2% 4% 7% 5% 6% 5% 5% 5% 6%2% 2% 4% 7% 5% 6% 5% 5% 5% 6% gh M gh M gh M gh M Refused 6 Refused 6 Refused 6 Refused 6 ---- 3 2 1 3 2 1 3 2 1 3 2 1 ---- ---- 4 0 5 1 3 4 0 5 1 3 4 0 5 1 3 4 0 5 1 3 ---- 1 0 1 2 1 0 1 2 1 0 1 2 1 0 1 2 ---- 3 3 2 23 3 2 23 3 2 23 3 2 2 1% 2% 1% *% 1% *% 1% *% 1% 1% *% 1% 1% 1% 2% 1% *% 1% *% 1% *% 1% 1% *% 1% 1% 1% 2% 1% *% 1% *% 1% *% 1% 1% *% 1% 1% 1% 2% 1% *% 1% *% 1% *% 1% 1% *% 1% 1% 1% 1% *% 1%1% 1% *% 1%1% 1% *% 1%1% 1% *% 1% AGREE 361 54 79 146 81 15 100 140 83 165 196 270 62 45 61 68 1AGREE 361 54 79 146 81 15 100 140 83 165 196 270 62 45 61 68 1AGREE 361 54 79 146 81 15 100 140 83 165 196 270 62 45 61 68 1AGREE 361 54 79 146 81 15 100 140 83 165 196 270 62 45 61 68 151 62 187 105 189 14551 62 187 105 189 14551 62 187 105 189 14551 62 187 105 189 145 44% 37% 44% 47% 44% 34% 43% 48% 44% 37% 44% 47% 44% 34% 43% 48% 44% 37% 44% 47% 44% 34% 43% 48% 44% 37% 44% 47% 44% 34% 43% 48% 40% 42% 46% 48% 36% 48% 46% 49% 41% 22% 79% 37% 42% 47%40% 42% 46% 48% 36% 48% 46% 49% 41% 22% 79% 37% 42% 47%40% 42% 46% 48% 36% 48% 46% 49% 41% 22% 79% 37% 42% 47%40% 42% 46% 48% 36% 48% 46% 49% 41% 22% 79% 37% 42% 47% b i M RT R b i M RT R b i M RT R b i M RT R DISAGREE DISAGREE DISAGREE DISAGREE 409 82 91 145 92 26 126 135 106 208 201 252 106 45 65 60 194 206 36 162 233 409 82 91 145 92 26 126 135 106 208 201 252 106 45 65 60 194 206 36 162 233 409 82 91 145 92 26 126 135 106 208 201 252 106 45 65 60 194 206 36 162 233 409 82 91 145 92 26 126 135 106 208 201 252 106 45 65 60 194 206 36 162 233 142142142142 50% 55% 50% 47% 49% 58% 54% 46% 51% 53% 47% 45% 62% 49% 50% 55% 50% 47% 49% 58% 54% 46% 51% 53% 47% 45% 62% 49% 50% 55% 50% 47% 49% 58% 54% 46% 51% 53% 47% 45% 62% 49% 50% 55% 50% 47% 49% 58% 54% 46% 51% 53% 47% 45% 62% 49% 49% 43% 53% 72% 15% 57% 52% 46%49% 43% 53% 72% 15% 57% 52% 46%49% 43% 53% 72% 15% 57% 52% 46%49% 43% 53% 72% 15% 57% 52% 46% L ST S L ST S L ST S L ST S Comparison Groups: BCDE/FGHI/JK/LM/NOPQ/RST/UVComparison Groups: BCDE/FGHI/JK/LM/NOPQ/RST/UVComparison Groups: BCDE/FGHI/JK/LM/NOPQ/RST/UVComparison Groups: BCDE/FGHI/JK/LM/NOPQ/RST/UV Independent ZIndependent ZIndependent ZIndependent Z----Test for Percentages (unpooled proportions)Test for Percentages (unpooled proportions)Test for Percentages (unpooled proportions)Test for Percentages (unpooled proportions) Uppercase letters indicate significance at the 95% level.Uppercase letters indicate significance at the 95% level.Uppercase letters indicate significance at the 95% level.Uppercase letters indicate significance at the 95% level. Lowercase letters indicate significance at the 90% level.Lowercase letters indicate significance at the 90% level.Lowercase letters indicate significance at the 90% level.Lowercase letters indicate significance at the 90% level.

Table T2 Page 58Table T2 Page 58Table T2 Page 58Table T2 Page 58 Investor's Business Daily/TIPP PollInvestor's Business Daily/TIPP PollInvestor's Business Daily/TIPP PollInvestor's Business Daily/TIPP Poll---- December 2018, Field 11/2December 2018, Field 11/2December 2018, Field 11/2December 2018, Field 11/26 to 12/2 , Sample 6 to 12/2 , Sample 6 to 12/2 , Sample 6 to 12/2 , Sample ---- 823 adults, MOE +/823 adults, MOE +/823 adults, MOE +/823 adults, MOE +/----3.3 pts, Traditional phone with live interviewers 3.3 pts, Traditional phone with live interviewers 3.3 pts, Traditional phone with live interviewers 3.3 pts, Traditional phone with live interviewers T2T2T2T2 Next, some say that any potential negative impact on the U.S. economy due to the ongoing trade dispute with China will Next, some say that any potential negative impact on the U.S. economy due to the ongoing trade dispute with China will Next, some say that any potential negative impact on the U.S. economy due to the ongoing trade dispute with China will Next, some say that any potential negative impact on the U.S. economy due to the ongoing trade dispute with China will be offset by tariffs, which will protect U.S. jobs and make trade more fair for the U.S. Please tell me the extent to be offset by tariffs, which will protect U.S. jobs and make trade more fair for the U.S. Please tell me the extent to be offset by tariffs, which will protect U.S. jobs and make trade more fair for the U.S. Please tell me the extent to be offset by tariffs, which will protect U.S. jobs and make trade more fair for the U.S. Please tell me the extent to which you agree or disagree with this sentiment. Would you say you...which you agree or disagree with this sentiment. Would you say you...which you agree or disagree with this sentiment. Would you say you...which you agree or disagree with this sentiment. Would you say you... ====AREA TYPE==== ===WHITE=== =====AREA TYPE==== ===WHITE=== =====AREA TYPE==== ===WHITE=== =====AREA TYPE==== ===WHITE=== ==BLK/HISP= ==MAR.STAT= ====EDUCATION==== ====IDEOLOOGY=====BLK/HISP= ==MAR.STAT= ====EDUCATION==== ====IDEOLOOGY=====BLK/HISP= ==MAR.STAT= ====EDUCATION==== ====IDEOLOOGY=====BLK/HISP= ==MAR.STAT= ====EDUCATION==== ====IDEOLOOGY==== SUBSUBSUBSUB---- WHITE SINGL MARR HIGH SOME WHITE SINGL MARR HIGH SOME WHITE SINGL MARR HIGH SOME WHITE SINGL MARR HIGH SOME TOTAL URBAN URBAN RURAL MEN WOMEN BLACK HIS. WTOTAL URBAN URBAN RURAL MEN WOMEN BLACK HIS. WTOTAL URBAN URBAN RURAL MEN WOMEN BLACK HIS. WTOTAL URBAN URBAN RURAL MEN WOMEN BLACK HIS. WOMEN WOM SCHL. COLL. COLL+ CONS. MOD. LIB.OMEN WOM SCHL. COLL. COLL+ CONS. MOD. LIB.OMEN WOM SCHL. COLL. COLL+ CONS. MOD. LIB.OMEN WOM SCHL. COLL. COLL+ CONS. MOD. LIB. -------------------- -------------------- -------------------- -------------------- -------------------- -------------------- -------------------- -------------------- -------------------- -------------------- -------------------- -------------------- -------------------- -------------------- -------------------- -------------------- (A) (B) (C) (D) (E) (F) (G) (H) (I) (J) (A) (B) (C) (D) (E) (F) (G) (H) (I) (J) (A) (B) (C) (D) (E) (F) (G) (H) (I) (J) (A) (B) (C) (D) (E) (F) (G) (H) (I) (J) (K) (L) (M) (N) (O) (P)(K) (L) (M) (N) (O) (P)(K) (L) (M) (N) (O) (P)(K) (L) (M) (N) (O) (P) TOTAL 823 192 400 211 267 290 118 55 182 241 157 216 430 328 247 214TOTAL 823 192 400 211 267 290 118 55 182 241 157 216 430 328 247 214TOTAL 823 192 400 211 267 290 118 55 182 241 157 216 430 328 247 214TOTAL 823 192 400 211 267 290 118 55 182 241 157 216 430 328 247 214 100% 100% 100% 100% 100% 100% 100% 100% 100% 100% 100% 100% 100% 100% 100% 100% 100% 100% 100% 100% 100% 100% 100% 100% 100% 100% 100% 100% 100% 100% 100% 100% 100% 100% 100% 100% 100% 100% 100% 100% 100% 100% 100% 100% 100% 100% 100% 100% 100% 100% 100% 100%100% 100% 100% 100%100% 100% 100% 100%100% 100% 100% 100% Unweighted Total 823 172 385 244 340 305 73 35 178 205 161 222 417 395 233 162Unweighted Total 823 172 385 244 340 305 73 35 178 205 161 222 417 395 233 162Unweighted Total 823 172 385 244 340 305 73 35 178 205 161 222 417 395 233 162Unweighted Total 823 172 385 244 340 305 73 35 178 205 161 222 417 395 233 162 Agree strongly 130 28 47 52 57 44 11 9 24 36 36 41 50 9Agree strongly 130 28 47 52 57 44 11 9 24 36 36 41 50 9Agree strongly 130 28 47 52 57 44 11 9 24 36 36 41 50 9Agree strongly 130 28 47 52 57 44 11 9 24 36 36 41 50 98 23 88 23 88 23 88 23 8 16% 15% 12% 25% 21% 15% 9% 16% 13% 15% 23% 19% 12% 30% 9% 4%16% 15% 12% 25% 21% 15% 9% 16% 13% 15% 23% 19% 12% 30% 9% 4%16% 15% 12% 25% 21% 15% 9% 16% 13% 15% 23% 19% 12% 30% 9% 4%16% 15% 12% 25% 21% 15% 9% 16% 13% 15% 23% 19% 12% 30% 9% 4% bC M m OP p bC M m OP p bC M m OP p bC M m OP p Agree somewhat 230 52 105 69 71 98 26 17 49 83 50 69 107 136 62 27Agree somewhat 230 52 105 69 71 98 26 17 49 83 50 69 107 136 62 27Agree somewhat 230 52 105 69 71 98 26 17 49 83 50 69 107 136 62 27Agree somewhat 230 52 105 69 71 98 26 17 49 83 50 69 107 136 62 27 28% 27% 26% 32% 27% 34% 22% 31% 27% 34% 32% 32% 25% 42% 25% 12%28% 27% 26% 32% 27% 34% 22% 31% 27% 34% 32% 32% 25% 42% 25% 12%28% 27% 26% 32% 27% 34% 22% 31% 27% 34% 32% 32% 25% 42% 25% 12%28% 27% 26% 32% 27% 34% 22% 31% 27% 34% 32% 32% 25% 42% 25% 12% OP P OP P OP P OP P Disagree somewhat 206 44 117 43 59 69 31 18 50 63 42 50 114 46 84 72Disagree somewhat 206 44 117 43 59 69 31 18 50 63 42 50 114 46 84 72Disagree somewhat 206 44 117 43 59 69 31 18 50 63 42 50 114 46 84 72Disagree somewhat 206 44 117 43 59 69 31 18 50 63 42 50 114 46 84 72 25% 23% 29% 21% 22% 24% 27% 32% 27% 26% 27% 23% 26% 14% 34% 34%25% 23% 29% 21% 22% 24% 27% 32% 27% 26% 27% 23% 26% 14% 34% 34%25% 23% 29% 21% 22% 24% 27% 32% 27% 26% 27% 23% 26% 14% 34% 34%25% 23% 29% 21% 22% 24% 27% 32% 27% 26% 27% 23% 26% 14% 34% 34% D N ND N ND N ND N N Disagree stDisagree stDisagree stDisagree strongly 203 60 103 34 68 56 47 11 40 47 23 38 133 27 65 96rongly 203 60 103 34 68 56 47 11 40 47 23 38 133 27 65 96rongly 203 60 103 34 68 56 47 11 40 47 23 38 133 27 65 96rongly 203 60 103 34 68 56 47 11 40 47 23 38 133 27 65 96 25% 31% 26% 16% 26% 19% 40% 21% 22% 19% 14% 17% 31% 8% 26% 45%25% 31% 26% 16% 26% 19% 40% 21% 22% 19% 14% 17% 31% 8% 26% 45%25% 31% 26% 16% 26% 19% 40% 21% 22% 19% 14% 17% 31% 8% 26% 45%25% 31% 26% 16% 26% 19% 40% 21% 22% 19% 14% 17% 31% 8% 26% 45% D D H KL N NOD D H KL N NOD D H KL N NOD D H KL N NO Not sure 47 7 27 11 8 23 3 Not sure 47 7 27 11 8 23 3 Not sure 47 7 27 11 8 23 3 Not sure 47 7 27 11 8 23 3 ---- 20 11 4 15 25 20 11 920 11 4 15 25 20 11 920 11 4 15 25 20 11 920 11 4 15 25 20 11 9 6% 6% 6% 6% 4% 7% 5% 3% 8% 3% 11% 4% 3% 7% 6% 6% 4% 4%4% 7% 5% 3% 8% 3% 11% 4% 3% 7% 6% 6% 4% 4%4% 7% 5% 3% 8% 3% 11% 4% 3% 7% 6% 6% 4% 4%4% 7% 5% 3% 8% 3% 11% 4% 3% 7% 6% 6% 4% 4% e j e j e j e j Refused 6 1 2 Refused 6 1 2 Refused 6 1 2 Refused 6 1 2 2 3 2 3 2 3 2 3 ---- ---- ---- ---- 1 1 2 1 1 3 11 1 2 1 1 3 11 1 2 1 1 3 11 1 2 1 1 3 1 1% *% *% 1% 1% *% 1% 1% *% *% 1% 1%1% *% *% 1% 1% *% 1% 1% *% *% 1% 1%1% *% *% 1% 1% *% 1% 1% *% *% 1% 1%1% *% *% 1% 1% *% 1% 1% *% *% 1% 1% AGREE 361 81 151 121 128 AGREE 361 81 151 121 128 AGREE 361 81 151 121 128 AGREE 361 81 151 121 128 141 37 26 74 119 87 111 157 234 84 35141 37 26 74 119 87 111 157 234 84 35141 37 26 74 119 87 111 157 234 84 35141 37 26 74 119 87 111 157 234 84 35 44% 42% 38% 57% 48% 49% 31% 47% 40% 50% 55% 51% 36% 71% 34% 16%44% 42% 38% 57% 48% 49% 31% 47% 40% 50% 55% 51% 36% 71% 34% 16%44% 42% 38% 57% 48% 49% 31% 47% 40% 50% 55% 51% 36% 71% 34% 16%44% 42% 38% 57% 48% 49% 31% 47% 40% 50% 55% 51% 36% 71% 34% 16% BC BC BC BC M M OP P M M OP P M M OP P M M OP P DISAGREE 409 104 220 77 127 125 78 29 89 110 64 88 247 73 149 168DISAGREE 409 104 220 77 127 125 78 29 89 110 64 88 247 73 149 168DISAGREE 409 104 220 77 127 125 78 29 89 110 64 88 247 73 149 168DISAGREE 409 104 220 77 127 125 78 29 89 110 64 88 247 73 149 168 50% 54% 55% 37% 48% 43% 66% 53% 49%50% 54% 55% 37% 48% 43% 66% 53% 49%50% 54% 55% 37% 48% 43% 66% 53% 49%50% 54% 55% 37% 48% 43% 66% 53% 49% 46% 41% 41% 57% 22% 60% 79%46% 41% 41% 57% 22% 60% 79%46% 41% 41% 57% 22% 60% 79%46% 41% 41% 57% 22% 60% 79% D D KL N NOD D KL N NOD D KL N NOD D KL N NO Comparison Groups: BCD/EF/GH/IJ/KLM/NOPComparison Groups: BCD/EF/GH/IJ/KLM/NOPComparison Groups: BCD/EF/GH/IJ/KLM/NOPComparison Groups: BCD/EF/GH/IJ/KLM/NOP Independent ZIndependent ZIndependent ZIndependent Z----Test for Percentages (unpooled proportions)Test for Percentages (unpooled proportions)Test for Percentages (unpooled proportions)Test for Percentages (unpooled proportions) Uppercase letters indicate significance at the 95% level.Uppercase letters indicate significance at the 95% level.Uppercase letters indicate significance at the 95% level.Uppercase letters indicate significance at the 95% level. Lowercase letters indicate significance at the 90% level.Lowercase letters indicate significance at the 90% level.Lowercase letters indicate significance at the 90% level.Lowercase letters indicate significance at the 90% level.
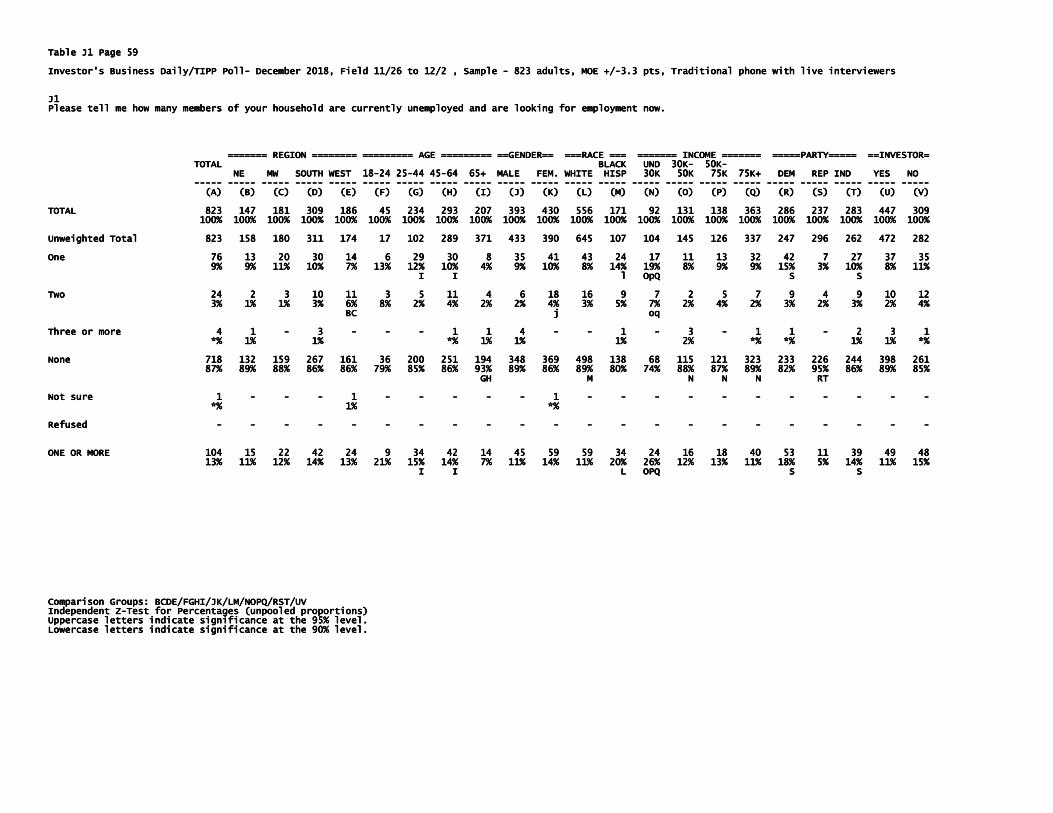
Table J1 Page 59Table J1 Page 59Table J1 Page 59Table J1 Page 59 Investor's Business Daily/TIPP PollInvestor's Business Daily/TIPP PollInvestor's Business Daily/TIPP PollInvestor's Business Daily/TIPP Poll---- December 2018, Field 11/26December 2018, Field 11/26December 2018, Field 11/26December 2018, Field 11/26 to 12/2 , Sample to 12/2 , Sample to 12/2 , Sample to 12/2 , Sample ---- 823 adults, MOE +/823 adults, MOE +/823 adults, MOE +/823 adults, MOE +/----3.3 pts, Traditional phone with live interviewers 3.3 pts, Traditional phone with live interviewers 3.3 pts, Traditional phone with live interviewers 3.3 pts, Traditional phone with live interviewers J1J1J1J1 Please tell me how many members of your household are currently unemployed and are looking for employment now.Please tell me how many members of your household are currently unemployed and are looking for employment now.Please tell me how many members of your household are currently unemployed and are looking for employment now.Please tell me how many members of your household are currently unemployed and are looking for employment now. ======= REGION======= REGION======= REGION======= REGION ======== ========= AGE ========= ==GENDER== ===RACE === ======= INCOME ======= =====PARTY===== ==INVESTOR========= ========= AGE ========= ==GENDER== ===RACE === ======= INCOME ======= =====PARTY===== ==INVESTOR========= ========= AGE ========= ==GENDER== ===RACE === ======= INCOME ======= =====PARTY===== ==INVESTOR========= ========= AGE ========= ==GENDER== ===RACE === ======= INCOME ======= =====PARTY===== ==INVESTOR= TOTAL BLACK UND 30KTOTAL BLACK UND 30KTOTAL BLACK UND 30KTOTAL BLACK UND 30K---- 50K50K50K50K---- NE MW SOUTH WEST 18NE MW SOUTH WEST 18NE MW SOUTH WEST 18NE MW SOUTH WEST 18----24 2524 2524 2524 25----44 4544 4544 4544 45----64 65+ MALE FEM. WHITE HISP 30K 50K 75K 75K+ DEM REP IND YES NO 64 65+ MALE FEM. WHITE HISP 30K 50K 75K 75K+ DEM REP IND YES NO 64 65+ MALE FEM. WHITE HISP 30K 50K 75K 75K+ DEM REP IND YES NO 64 65+ MALE FEM. WHITE HISP 30K 50K 75K 75K+ DEM REP IND YES NO -------------------- -------------------- -------------------- -------------------- -------------------- -------------------- -------------------- -------------------- -------------------- -------------------- -------------------- -------------------- -------------------- -------------------- -------------------- -------------------- -------------------- -------------------- -------------------- -------------------- -------------------- -------------------- (A) (B) (C) (D) (E) (F) (G) (H) (I) (J) (K) (L) (M) (N) (O) (P) (Q) (R) (S) (T) (U) (A) (B) (C) (D) (E) (F) (G) (H) (I) (J) (K) (L) (M) (N) (O) (P) (Q) (R) (S) (T) (U) (A) (B) (C) (D) (E) (F) (G) (H) (I) (J) (K) (L) (M) (N) (O) (P) (Q) (R) (S) (T) (U) (A) (B) (C) (D) (E) (F) (G) (H) (I) (J) (K) (L) (M) (N) (O) (P) (Q) (R) (S) (T) (U) (V)(V)(V)(V) TOTAL TOTAL TOTAL TOTAL 823 147 181 309 186 45 234 293 207 393 430 556 171 92 131 138 363 286 237 283 447 823 147 181 309 186 45 234 293 207 393 430 556 171 92 131 138 363 286 237 283 447 823 147 181 309 186 45 234 293 207 393 430 556 171 92 131 138 363 286 237 283 447 823 147 181 309 186 45 234 293 207 393 430 556 171 92 131 138 363 286 237 283 447 309309309309 100% 100% 100% 100% 100% 100% 100% 100% 100% 100% 100% 100% 100% 100% 100% 100%100% 100% 100% 100% 100% 100% 100% 100% 100% 100% 100% 100% 100% 100% 100% 100%100% 100% 100% 100% 100% 100% 100% 100% 100% 100% 100% 100% 100% 100% 100% 100%100% 100% 100% 100% 100% 100% 100% 100% 100% 100% 100% 100% 100% 100% 100% 100% 100% 100% 100% 100% 100% 100%100% 100% 100% 100% 100% 100%100% 100% 100% 100% 100% 100%100% 100% 100% 100% 100% 100% Unweighted Total 823 158 180 311 174 17 102 289 371 433 390 645 107 104 145 126 3Unweighted Total 823 158 180 311 174 17 102 289 371 433 390 645 107 104 145 126 3Unweighted Total 823 158 180 311 174 17 102 289 371 433 390 645 107 104 145 126 3Unweighted Total 823 158 180 311 174 17 102 289 371 433 390 645 107 104 145 126 337 247 296 262 472 28237 247 296 262 472 28237 247 296 262 472 28237 247 296 262 472 282 One 76 13 20 30 14 One 76 13 20 30 14 One 76 13 20 30 14 One 76 13 20 30 14 6 29 30 8 35 41 43 24 17 11 13 32 42 7 27 37 356 29 30 8 35 41 43 24 17 11 13 32 42 7 27 37 356 29 30 8 35 41 43 24 17 11 13 32 42 7 27 37 356 29 30 8 35 41 43 24 17 11 13 32 42 7 27 37 35 9% 9% 11% 10% 7% 13% 12% 10% 4% 9% 10% 8% 14% 19% 8% 9% 9% 15% 3% 10% 8% 9% 9% 11% 10% 7% 13% 12% 10% 4% 9% 10% 8% 14% 19% 8% 9% 9% 15% 3% 10% 8% 9% 9% 11% 10% 7% 13% 12% 10% 4% 9% 10% 8% 14% 19% 8% 9% 9% 15% 3% 10% 8% 9% 9% 11% 10% 7% 13% 12% 10% 4% 9% 10% 8% 14% 19% 8% 9% 9% 15% 3% 10% 8% 11%11%11%11% I I l OpQ S S I I l OpQ S S I I l OpQ S S I I l OpQ S S Two 24 2 3 10 11 3 5 11 4 6 18 16 9 7 2 5 Two 24 2 3 10 11 3 5 11 4 6 18 16 9 7 2 5 Two 24 2 3 10 11 3 5 11 4 6 18 16 9 7 2 5 Two 24 2 3 10 11 3 5 11 4 6 18 16 9 7 2 5 7 9 4 9 10 127 9 4 9 10 127 9 4 9 10 127 9 4 9 10 12 3% 1% 1% 3% 6% 8% 2% 4% 2% 2% 4% 3% 3% 1% 1% 3% 6% 8% 2% 4% 2% 2% 4% 3% 3% 1% 1% 3% 6% 8% 2% 4% 2% 2% 4% 3% 3% 1% 1% 3% 6% 8% 2% 4% 2% 2% 4% 3% 5% 7% 2% 4% 2% 3% 2% 3% 2% 4%5% 7% 2% 4% 2% 3% 2% 3% 2% 4%5% 7% 2% 4% 2% 3% 2% 3% 2% 4%5% 7% 2% 4% 2% 3% 2% 3% 2% 4% BC j oq BC j oq BC j oq BC j oq Three or more 4 1Three or more 4 1Three or more 4 1Three or more 4 1 ---- 3 3 3 3 ---- ---- ---- 1 1 4 1 1 4 1 1 4 1 1 4 ---- ---- 1 1 1 1 ---- 3 3 3 3 ---- 1 1 1 1 1 1 1 1 ---- 2 3 12 3 12 3 12 3 1 *% 1% 1% *% 1% 1% 1% 2% *% *% *% 1% 1% *% 1% 1% 1% 2% *% *% *% 1% 1% *% 1% 1% 1% 2% *% *% *% 1% 1% *% 1% 1% 1% 2% *% *% 1% 1% *%1% 1% *%1% 1% *%1% 1% *% None 718 132 159 267 161 36 200 251 194 348 369 498 138 68 115 121 3None 718 132 159 267 161 36 200 251 194 348 369 498 138 68 115 121 3None 718 132 159 267 161 36 200 251 194 348 369 498 138 68 115 121 3None 718 132 159 267 161 36 200 251 194 348 369 498 138 68 115 121 323 233 226 244 398 26123 233 226 244 398 26123 233 226 244 398 26123 233 226 244 398 261 87% 89% 88% 86% 86% 79% 85% 86% 87% 89% 88% 86% 86% 79% 85% 86% 87% 89% 88% 86% 86% 79% 85% 86% 87% 89% 88% 86% 86% 79% 85% 86% 93% 89% 86% 89% 80% 74% 88% 87% 89% 82% 95% 86% 89% 85%93% 89% 86% 89% 80% 74% 88% 87% 89% 82% 95% 86% 89% 85%93% 89% 86% 89% 80% 74% 88% 87% 89% 82% 95% 86% 89% 85%93% 89% 86% 89% 80% 74% 88% 87% 89% 82% 95% 86% 89% 85% GH M N N N RT GH M N N N RT GH M N N N RT GH M N N N RT Not sure Not sure Not sure Not sure 1 1 1 1 ---- ---- ---- 1 1 1 1 ---- ---- ---- ---- ---- 1 1 1 1 ---- ---- ---- ---- ---- ---- ---- ---- ---- ---- ---- *% 1% *% *% 1% *% *% 1% *% *% 1% *% Refused Refused Refused Refused ---- ---- ---- ---- ---- ---- ---- ---- ---- ---- ---- ---- ---- ---- ---- ---- ---- ---- ---- ---- ---- ---- ONE OR MORE 104 15 22 42 24 9 34 42 14 45 59 59 34 24 16 18 ONE OR MORE 104 15 22 42 24 9 34 42 14 45 59 59 34 24 16 18 ONE OR MORE 104 15 22 42 24 9 34 42 14 45 59 59 34 24 16 18 ONE OR MORE 104 15 22 42 24 9 34 42 14 45 59 59 34 24 16 18 40 53 11 39 40 53 11 39 40 53 11 39 40 53 11 39 49 4849 4849 4849 48 13% 11% 12% 14% 13% 21% 15% 14% 7% 11% 14% 11% 20% 26% 12% 13% 11% 18% 5% 14% 11% 13% 11% 12% 14% 13% 21% 15% 14% 7% 11% 14% 11% 20% 26% 12% 13% 11% 18% 5% 14% 11% 13% 11% 12% 14% 13% 21% 15% 14% 7% 11% 14% 11% 20% 26% 12% 13% 11% 18% 5% 14% 11% 13% 11% 12% 14% 13% 21% 15% 14% 7% 11% 14% 11% 20% 26% 12% 13% 11% 18% 5% 14% 11% 15%15%15%15% I I I I I I I I L OPQ S S L OPQ S S L OPQ S S L OPQ S S Comparison Groups: BCDE/FGHI/JK/LM/NOPQ/RST/UVComparison Groups: BCDE/FGHI/JK/LM/NOPQ/RST/UVComparison Groups: BCDE/FGHI/JK/LM/NOPQ/RST/UVComparison Groups: BCDE/FGHI/JK/LM/NOPQ/RST/UV Independent ZIndependent ZIndependent ZIndependent Z----Test for Percentages (unpooled proportions)Test for Percentages (unpooled proportions)Test for Percentages (unpooled proportions)Test for Percentages (unpooled proportions) Uppercase letters indicate significance at the 95% level.Uppercase letters indicate significance at the 95% level.Uppercase letters indicate significance at the 95% level.Uppercase letters indicate significance at the 95% level. Lowercase letters indicate significance at the 90% level.Lowercase letters indicate significance at the 90% level.Lowercase letters indicate significance at the 90% level.Lowercase letters indicate significance at the 90% level.

Table J1 Page 60Table J1 Page 60Table J1 Page 60Table J1 Page 60 Investor's Business Daily/TIPP PollInvestor's Business Daily/TIPP PollInvestor's Business Daily/TIPP PollInvestor's Business Daily/TIPP Poll---- December 2018, Field 11/26 to 12/2 , Sample December 2018, Field 11/26 to 12/2 , Sample December 2018, Field 11/26 to 12/2 , Sample December 2018, Field 11/26 to 12/2 , Sample ---- 823 adults, MOE +/823 adults, MOE +/823 adults, MOE +/823 adults, MOE +/----3.3 pts, Traditional phone with live interviewers 3.3 pts, Traditional phone with live interviewers 3.3 pts, Traditional phone with live interviewers 3.3 pts, Traditional phone with live interviewers J1J1J1J1 Please tell me how maPlease tell me how maPlease tell me how maPlease tell me how many members of your household are currently unemployed and are looking for employment now.ny members of your household are currently unemployed and are looking for employment now.ny members of your household are currently unemployed and are looking for employment now.ny members of your household are currently unemployed and are looking for employment now. ====AREA TYPE==== ===WHITE=== ==BLK/HISP= ==MAR.STAT= ====EDUCATION==== ====IDEOLOOGY========AREA TYPE==== ===WHITE=== ==BLK/HISP= ==MAR.STAT= ====EDUCATION==== ====IDEOLOOGY========AREA TYPE==== ===WHITE=== ==BLK/HISP= ==MAR.STAT= ====EDUCATION==== ====IDEOLOOGY========AREA TYPE==== ===WHITE=== ==BLK/HISP= ==MAR.STAT= ====EDUCATION==== ====IDEOLOOGY==== SUSUSUSUBBBB---- WHITE SINGL MARR HIGH SOME WHITE SINGL MARR HIGH SOME WHITE SINGL MARR HIGH SOME WHITE SINGL MARR HIGH SOME TOTAL URBAN URBAN RURAL MEN WOMEN BLACK HIS. WOMEN WOM SCHL. COLL. COLL+ CONS. MOD. LIB.TOTAL URBAN URBAN RURAL MEN WOMEN BLACK HIS. WOMEN WOM SCHL. COLL. COLL+ CONS. MOD. LIB.TOTAL URBAN URBAN RURAL MEN WOMEN BLACK HIS. WOMEN WOM SCHL. COLL. COLL+ CONS. MOD. LIB.TOTAL URBAN URBAN RURAL MEN WOMEN BLACK HIS. WOMEN WOM SCHL. COLL. COLL+ CONS. MOD. LIB. -------------------- -------------------- -------------------- -------------------- -------------------- -------------------- -------------------- -------------------- -------------------- -------------------- -------------------- -------------------- -------------------- -------------------- -------------------- -------------------- (A) (B) (C) (D) (E) (F) (G) (H) (I) (J) (K) (L) (M) (N) (O) (P)(A) (B) (C) (D) (E) (F) (G) (H) (I) (J) (K) (L) (M) (N) (O) (P)(A) (B) (C) (D) (E) (F) (G) (H) (I) (J) (K) (L) (M) (N) (O) (P)(A) (B) (C) (D) (E) (F) (G) (H) (I) (J) (K) (L) (M) (N) (O) (P) TOTAL 823 192 400 211 267 290 TOTAL 823 192 400 211 267 290 TOTAL 823 192 400 211 267 290 TOTAL 823 192 400 211 267 290 118 55 182 241 157 216 430 328 247 214118 55 182 241 157 216 430 328 247 214118 55 182 241 157 216 430 328 247 214118 55 182 241 157 216 430 328 247 214 100% 100% 100% 100% 100% 100% 100% 100% 100% 100% 100% 100% 100% 100% 100% 100%100% 100% 100% 100% 100% 100% 100% 100% 100% 100% 100% 100% 100% 100% 100% 100%100% 100% 100% 100% 100% 100% 100% 100% 100% 100% 100% 100% 100% 100% 100% 100%100% 100% 100% 100% 100% 100% 100% 100% 100% 100% 100% 100% 100% 100% 100% 100% Unweighted Total 823 172 385 244 340 305 73 35 178 205 161 222 417 395 233 162Unweighted Total 823 172 385 244 340 305 73 35 178 205 161 222 417 395 233 162Unweighted Total 823 172 385 244 340 305 73 35 178 205 161 222 417 395 233 162Unweighted Total 823 172 385 244 340 305 73 35 178 205 161 222 417 395 233 162 One 76 28 32 16 18 25 16 8 14 28 17 20 39 18 18 38One 76 28 32 16 18 25 16 8 14 28 17 20 39 18 18 38One 76 28 32 16 18 25 16 8 14 28 17 20 39 18 18 38One 76 28 32 16 18 25 16 8 14 28 17 20 39 18 18 38 9% 15% 8% 8% 7% 9% 13% 14% 8% 11% 11% 9% 9% 6% 7% 18%9% 15% 8% 8% 7% 9% 13% 14% 8% 11% 11% 9% 9% 6% 7% 18%9% 15% 8% 8% 7% 9% 13% 14% 8% 11% 11% 9% 9% 6% 7% 18%9% 15% 8% 8% 7% 9% 13% 14% 8% 11% 11% 9% 9% 6% 7% 18% CD NOCD NOCD NOCD NO Two Two Two Two 24 10 8 6 5 11 7 2 13 5 3 8 13 12 4 724 10 8 6 5 11 7 2 13 5 3 8 13 12 4 724 10 8 6 5 11 7 2 13 5 3 8 13 12 4 724 10 8 6 5 11 7 2 13 5 3 8 13 12 4 7 3% 5% 2% 3% 2% 4% 6% 3% 7% 2% 2% 4% 3% 4% 2% 3%3% 5% 2% 3% 2% 4% 6% 3% 7% 2% 2% 4% 3% 4% 2% 3%3% 5% 2% 3% 2% 4% 6% 3% 7% 2% 2% 4% 3% 4% 2% 3%3% 5% 2% 3% 2% 4% 6% 3% 7% 2% 2% 4% 3% 4% 2% 3% J J J J Three or more 4 3 1 Three or more 4 3 1 Three or more 4 3 1 Three or more 4 3 1 ---- ---- ---- ---- 1 1 1 1 ---- ---- ---- 1 2 1 2 1 2 1 2 ---- 3 3 3 3 ---- *% 1% *% *% 1% *% *% 1% *% *% 1% *% 3% 1% 1% 1% 3% 1% 1% 1% 3% 1% 1% 1% 3% 1% 1% 1% None 718 151 359 189 244 253 95 44 155 209 136 187 375 298 222 169None 718 151 359 189 244 253 95 44 155 209 136 187 375 298 222 169None 718 151 359 189 244 253 95 44 155 209 136 187 375 298 222 169None 718 151 359 189 244 253 95 44 155 209 136 187 375 298 222 169 87% 79% 90% 89% 92% 87% 79% 90% 89% 92% 87% 79% 90% 89% 92% 87% 79% 90% 89% 92% 88% 81% 80% 85% 87% 87% 87% 87% 91% 90% 79%88% 81% 80% 85% 87% 87% 87% 87% 91% 90% 79%88% 81% 80% 85% 87% 87% 87% 87% 91% 90% 79%88% 81% 80% 85% 87% 87% 87% 87% 91% 90% 79% B B P P B B P P B B P P B B P P Not sure 1 Not sure 1 Not sure 1 Not sure 1 ---- ---- ---- ---- ---- ---- ---- ---- ---- ---- ---- ---- ---- ---- ---- *% *% *% *% Refused Refused Refused Refused ---- ---- ---- ---- ---- ---- ---- ---- ---- ---- ---- ---- ---- ---- ---- ---- ONE OR MORE 104 41 41 22 22 36 23 11 27 32 ONE OR MORE 104 41 41 22 22 36 23 11 27 32 ONE OR MORE 104 41 41 22 22 36 23 11 27 32 ONE OR MORE 104 41 41 22 22 36 23 11 27 32 20 29 55 30 25 4520 29 55 30 25 4520 29 55 30 25 4520 29 55 30 25 45 13% 21% 10% 11% 8% 12% 19% 20% 15% 13% 13% 13% 13% 9% 10% 21%13% 21% 10% 11% 8% 12% 19% 20% 15% 13% 13% 13% 13% 9% 10% 21%13% 21% 10% 11% 8% 12% 19% 20% 15% 13% 13% 13% 13% 9% 10% 21%13% 21% 10% 11% 8% 12% 19% 20% 15% 13% 13% 13% 13% 9% 10% 21% CD CD CD CD NONONONO Comparison Groups: BCD/EF/GH/IJ/KLM/NOPComparison Groups: BCD/EF/GH/IJ/KLM/NOPComparison Groups: BCD/EF/GH/IJ/KLM/NOPComparison Groups: BCD/EF/GH/IJ/KLM/NOP Independent ZIndependent ZIndependent ZIndependent Z----Test for Percentages (unpooled proportions)Test for Percentages (unpooled proportions)Test for Percentages (unpooled proportions)Test for Percentages (unpooled proportions) Uppercase letters indicate significance at the 95% level.Uppercase letters indicate significance at the 95% level.Uppercase letters indicate significance at the 95% level.Uppercase letters indicate significance at the 95% level. Lowercase letters indicate significance at the 90% level.Lowercase letters indicate significance at the 90% level.Lowercase letters indicate significance at the 90% level.Lowercase letters indicate significance at the 90% level.

Table J2 Page 61Table J2 Page 61Table J2 Page 61Table J2 Page 61 Investor's Business Daily/TIPP PollInvestor's Business Daily/TIPP PollInvestor's Business Daily/TIPP PollInvestor's Business Daily/TIPP Poll---- December 2018, Field 11/26 to 12/2 , Sample December 2018, Field 11/26 to 12/2 , Sample December 2018, Field 11/26 to 12/2 , Sample December 2018, Field 11/26 to 12/2 , Sample ---- 823 adults, MOE +/823 adults, MOE +/823 adults, MOE +/823 adults, MOE +/----3.3 pts, Traditional phone with live interviewers 3.3 pts, Traditional phone with live interviewers 3.3 pts, Traditional phone with live interviewers 3.3 pts, Traditional phone with live interviewers J2J2J2J2 How concerned are you that in the next 12 months you or a member of your househoHow concerned are you that in the next 12 months you or a member of your househoHow concerned are you that in the next 12 months you or a member of your househoHow concerned are you that in the next 12 months you or a member of your household might be laid off:ld might be laid off:ld might be laid off:ld might be laid off: ======= REGION ======== ========= AGE ========= ==GENDER== ===RACE === ======= INCOME ======= =====PARTY===== ==INVESTOR======== REGION ======== ========= AGE ========= ==GENDER== ===RACE === ======= INCOME ======= =====PARTY===== ==INVESTOR======== REGION ======== ========= AGE ========= ==GENDER== ===RACE === ======= INCOME ======= =====PARTY===== ==INVESTOR======== REGION ======== ========= AGE ========= ==GENDER== ===RACE === ======= INCOME ======= =====PARTY===== ==INVESTOR= TOTAL BLACK UND 30KTOTAL BLACK UND 30KTOTAL BLACK UND 30KTOTAL BLACK UND 30K---- 50K50K50K50K---- NE MW SOUTH WEST 18NE MW SOUTH WEST 18NE MW SOUTH WEST 18NE MW SOUTH WEST 18----24 2524 2524 2524 25----44 4544 4544 4544 45----64 65+ MALE FEM. WHITE 64 65+ MALE FEM. WHITE 64 65+ MALE FEM. WHITE 64 65+ MALE FEM. WHITE HISP 30K 50K 75K 75K+ DEM REP IND YES NO HISP 30K 50K 75K 75K+ DEM REP IND YES NO HISP 30K 50K 75K 75K+ DEM REP IND YES NO HISP 30K 50K 75K 75K+ DEM REP IND YES NO -------------------- -------------------- -------------------- -------------------- -------------------- -------------------- -------------------- -------------------- -------------------- -------------------- -------------------- -------------------- -------------------- -------------------- -------------------- -------------------- -------------------- -------------------- -------------------- -------------------- -------------------- -------------------- (A) (B) (A) (B) (A) (B) (A) (B) (C) (D) (E) (F) (G) (H) (I) (J) (K) (L) (M) (N) (O) (P) (Q) (R) (S) (T) (U) (V)(C) (D) (E) (F) (G) (H) (I) (J) (K) (L) (M) (N) (O) (P) (Q) (R) (S) (T) (U) (V)(C) (D) (E) (F) (G) (H) (I) (J) (K) (L) (M) (N) (O) (P) (Q) (R) (S) (T) (U) (V)(C) (D) (E) (F) (G) (H) (I) (J) (K) (L) (M) (N) (O) (P) (Q) (R) (S) (T) (U) (V) TOTAL 823 147 181 309 186 45 234 293 207 393 430 556 171 92 131 138 3TOTAL 823 147 181 309 186 45 234 293 207 393 430 556 171 92 131 138 3TOTAL 823 147 181 309 186 45 234 293 207 393 430 556 171 92 131 138 3TOTAL 823 147 181 309 186 45 234 293 207 393 430 556 171 92 131 138 363 286 63 286 63 286 63 286 237 283 447 309237 283 447 309237 283 447 309237 283 447 309 100% 100% 100% 100% 100% 100% 100% 100% 100% 100% 100% 100% 100% 100% 100% 100% 100% 100% 100% 100% 100% 100% 100% 100% 100% 100% 100% 100% 100% 100% 100% 100% 100% 100% 100% 100% 100% 100% 100% 100% 100% 100% 100% 100% 100% 100% 100% 100% 100% 100% 100% 100% 100% 100% 100% 100% 100% 100% 100% 100% 100% 100% 100% 100% 100% 100% 100% 100% 100% 100% 100% 100% 100% 100% 100% 100% 100% 100% 100% 100% 100% 100% 100% 100% 100%100%100%100% Unweighted Total 823 158 180 311 174 17 102 289 Unweighted Total 823 158 180 311 174 17 102 289 Unweighted Total 823 158 180 311 174 17 102 289 Unweighted Total 823 158 180 311 174 17 102 289 371 433 390 645 107 104 145 126 337 247 296 262 472 282371 433 390 645 107 104 145 126 337 247 296 262 472 282371 433 390 645 107 104 145 126 337 247 296 262 472 282371 433 390 645 107 104 145 126 337 247 296 262 472 282 Very concerned 51 13 8 21 8 Very concerned 51 13 8 21 8 Very concerned 51 13 8 21 8 Very concerned 51 13 8 21 8 ---- 19 27 4 30 22 19 24 11 12 11 15 37 2 10 14 3319 27 4 30 22 19 24 11 12 11 15 37 2 10 14 3319 27 4 30 22 19 24 11 12 11 15 37 2 10 14 3319 27 4 30 22 19 24 11 12 11 15 37 2 10 14 33 6% 9% 5% 7% 5% 8% 9% 2% 8% 5% 3% 14% 12% 9% 8% 4% 13% 1% 4% 3% 6% 9% 5% 7% 5% 8% 9% 2% 8% 5% 3% 14% 12% 9% 8% 4% 13% 1% 4% 3% 6% 9% 5% 7% 5% 8% 9% 2% 8% 5% 3% 14% 12% 9% 8% 4% 13% 1% 4% 3% 6% 9% 5% 7% 5% 8% 9% 2% 8% 5% 3% 14% 12% 9% 8% 4% 13% 1% 4% 3% 11%11%11%11% i I L Q i I L Q i I L Q i I L Q q ST s Uq ST s Uq ST s Uq ST s U Somewhat concerned 68 14 14 19 21 3 28 25 8 30 38 50 12 6 9 19 Somewhat concerned 68 14 14 19 21 3 28 25 8 30 38 50 12 6 9 19 Somewhat concerned 68 14 14 19 21 3 28 25 8 30 38 50 12 6 9 19 Somewhat concerned 68 14 14 19 21 3 28 25 8 30 38 50 12 6 9 19 31 36 11 20 36 2831 36 11 20 36 2831 36 11 20 36 2831 36 11 20 36 28 8% 10% 8% 6% 8% 10% 8% 6% 8% 10% 8% 6% 8% 10% 8% 6% 11% 8% 12% 8% 4% 8% 9% 9% 7% 7% 7% 13% 9% 13% 5% 7% 8% 9%11% 8% 12% 8% 4% 8% 9% 9% 7% 7% 7% 13% 9% 13% 5% 7% 8% 9%11% 8% 12% 8% 4% 8% 9% 9% 7% 7% 7% 13% 9% 13% 5% 7% 8% 9%11% 8% 12% 8% 4% 8% 9% 9% 7% 7% 7% 13% 9% 13% 5% 7% 8% 9% d I I o St d I I o St d I I o St d I I o St Not very concerned 149 15 36 62 35 18 45 50 31 74 74 89 39 20 24 20 Not very concerned 149 15 36 62 35 18 45 50 31 74 74 89 39 20 24 20 Not very concerned 149 15 36 62 35 18 45 50 31 74 74 89 39 20 24 20 Not very concerned 149 15 36 62 35 18 45 50 31 74 74 89 39 20 24 20 68 57 25 63 76 5968 57 25 63 76 5968 57 25 63 76 5968 57 25 63 76 59 18% 10% 20% 20% 19% 40% 19% 17% 15% 19% 18% 10% 20% 20% 19% 40% 19% 17% 15% 19% 18% 10% 20% 20% 19% 40% 19% 17% 15% 19% 18% 10% 20% 20% 19% 40% 19% 17% 15% 19% 17% 16% 23% 22% 19% 14% 19% 20% 10% 22% 17% 19%17% 16% 23% 22% 19% 14% 19% 20% 10% 22% 17% 19%17% 16% 23% 22% 19% 14% 19% 20% 10% 22% 17% 19%17% 16% 23% 22% 19% 14% 19% 20% 10% 22% 17% 19% B B b hI S S B B b hI S S B B b hI S S B B b hI S S Not at all concerned Not at all concerned Not at all concerned Not at all concerned 553 104 122 207 120 23 142 192 163 259 294 397 96 55 86 88 249 155 200 189 321 553 104 122 207 120 23 142 192 163 259 294 397 96 55 86 88 249 155 200 189 321 553 104 122 207 120 23 142 192 163 259 294 397 96 55 86 88 249 155 200 189 321 553 104 122 207 120 23 142 192 163 259 294 397 96 55 86 88 249 155 200 189 321 188188188188 67% 71% 67% 67% 65% 52% 61% 65% 79% 66% 69% 71% 56% 60% 66% 64% 67% 71% 67% 67% 65% 52% 61% 65% 79% 66% 69% 71% 56% 60% 66% 64% 67% 71% 67% 67% 65% 52% 61% 65% 79% 66% 69% 71% 56% 60% 66% 64% 67% 71% 67% 67% 65% 52% 61% 65% 79% 66% 69% 71% 56% 60% 66% 64% 69% 54% 84% 67% 72% 61%69% 54% 84% 67% 72% 61%69% 54% 84% 67% 72% 61%69% 54% 84% 67% 72% 61% FGH M RT R V FGH M RT R V FGH M RT R V FGH M RT R V Not sure 1 Not sure 1 Not sure 1 Not sure 1 ---- 0 0 0 0 ---- 1 1 1 1 ---- ---- ---- 0 0 1 0 0 0 1 0 0 0 1 0 0 0 1 0 ---- ---- ---- 0 0 0 0 ---- 0 0 0 0 ---- ---- 0 0 0 0 ---- *% *% 1% *% *% *% *% *% *% *% *% *% 1% *% *% *% *% *% *% *% *% *% 1% *% *% *% *% *% *% *% *% *% 1% *% *% *% *% *% *% *% Refused 0 Refused 0 Refused 0 Refused 0 ---- 0 0 0 0 ---- ---- ---- ---- ---- 0 0 0 0 0 0 0 0 ---- 0 0 0 0 ---- ---- ---- ---- 0 0 0 0 ---- ---- 0 0 0 0 ---- 0000 *% *% *% *% *% *% *% *% *% *% *% *% *% *% *% *% *% *% *% *% *% *% *%*% *% *%*% *% *%*% *% *% CONCERNED 119 28 22 40 29 3 47 51 12 59 60 69 36 17 20 30 CONCERNED 119 28 22 40 29 3 47 51 12 59 60 69 36 17 20 30 CONCERNED 119 28 22 40 29 3 47 51 12 59 60 69 36 17 20 30 CONCERNED 119 28 22 40 29 3 47 51 12 59 60 69 36 17 20 30 46 73 13 30 50 6146 73 13 30 50 6146 73 13 30 50 6146 73 13 30 50 61 14% 19%14% 19%14% 19%14% 19% 12% 13% 16% 8% 20% 17% 6% 15% 14% 12% 21% 18% 15% 22% 13% 26% 5% 11% 11% 20%12% 13% 16% 8% 20% 17% 6% 15% 14% 12% 21% 18% 15% 22% 13% 26% 5% 11% 11% 20%12% 13% 16% 8% 20% 17% 6% 15% 14% 12% 21% 18% 15% 22% 13% 26% 5% 11% 11% 20%12% 13% 16% 8% 20% 17% 6% 15% 14% 12% 21% 18% 15% 22% 13% 26% 5% 11% 11% 20% fI I L q ST fI I L q ST fI I L q ST fI I L q ST s Us Us Us U NOT CONCERNED 702 119 158 269 155 41 187 242 194 333 369 486 135 75 111 108 3NOT CONCERNED 702 119 158 269 155 41 187 242 194 333 369 486 135 75 111 108 3NOT CONCERNED 702 119 158 269 155 41 187 242 194 333 369 486 135 75 111 108 3NOT CONCERNED 702 119 158 269 155 41 187 242 194 333 369 486 135 75 111 108 317 212 224 252 397 24717 212 224 252 397 24717 212 224 252 397 24717 212 224 252 397 247 85% 81% 87% 87% 84% 92% 80% 83% 85% 81% 87% 87% 84% 92% 80% 83% 85% 81% 87% 87% 84% 92% 80% 83% 85% 81% 87% 87% 84% 92% 80% 83% 94% 85% 86% 87% 79% 82% 85% 78% 87% 74% 95% 89% 89% 80%94% 85% 86% 87% 79% 82% 85% 78% 87% 74% 95% 89% 89% 80%94% 85% 86% 87% 79% 82% 85% 78% 87% 74% 95% 89% 89% 80%94% 85% 86% 87% 79% 82% 85% 78% 87% 74% 95% 89% 89% 80% g GH M p Rt R V g GH M p Rt R V g GH M p Rt R V g GH M p Rt R V ComparComparComparComparison Groups: BCDE/FGHI/JK/LM/NOPQ/RST/UVison Groups: BCDE/FGHI/JK/LM/NOPQ/RST/UVison Groups: BCDE/FGHI/JK/LM/NOPQ/RST/UVison Groups: BCDE/FGHI/JK/LM/NOPQ/RST/UV Independent ZIndependent ZIndependent ZIndependent Z----Test for Percentages (unpooled proportions)Test for Percentages (unpooled proportions)Test for Percentages (unpooled proportions)Test for Percentages (unpooled proportions) Uppercase letters indicate significance at the 95% level.Uppercase letters indicate significance at the 95% level.Uppercase letters indicate significance at the 95% level.Uppercase letters indicate significance at the 95% level. Lowercase letters indicate significance at the 90% level.Lowercase letters indicate significance at the 90% level.Lowercase letters indicate significance at the 90% level.Lowercase letters indicate significance at the 90% level.

Table J2 Page 62Table J2 Page 62Table J2 Page 62Table J2 Page 62 Investor's Business DaInvestor's Business DaInvestor's Business DaInvestor's Business Daily/TIPP Pollily/TIPP Pollily/TIPP Pollily/TIPP Poll---- December 2018, Field 11/26 to 12/2 , Sample December 2018, Field 11/26 to 12/2 , Sample December 2018, Field 11/26 to 12/2 , Sample December 2018, Field 11/26 to 12/2 , Sample ---- 823 adults, MOE +/823 adults, MOE +/823 adults, MOE +/823 adults, MOE +/----3.3 pts, Traditional phone with live interviewers 3.3 pts, Traditional phone with live interviewers 3.3 pts, Traditional phone with live interviewers 3.3 pts, Traditional phone with live interviewers J2J2J2J2 How concerned are you that in the next 12 months you or a member of your household might be laid off:How concerned are you that in the next 12 months you or a member of your household might be laid off:How concerned are you that in the next 12 months you or a member of your household might be laid off:How concerned are you that in the next 12 months you or a member of your household might be laid off: ====AREA TYPE==== ===WHITE=== ==BLK/HISP= ==MAR.STAT= ====EDUCATION==== ====IDEOLOOGY========AREA TYPE==== ===WHITE=== ==BLK/HISP= ==MAR.STAT= ====EDUCATION==== ====IDEOLOOGY========AREA TYPE==== ===WHITE=== ==BLK/HISP= ==MAR.STAT= ====EDUCATION==== ====IDEOLOOGY========AREA TYPE==== ===WHITE=== ==BLK/HISP= ==MAR.STAT= ====EDUCATION==== ====IDEOLOOGY==== SUBSUBSUBSUB---- WHITE SINGL MARR HIGH SOME WHITE SINGL MARR HIGH SOME WHITE SINGL MARR HIGH SOME WHITE SINGL MARR HIGH SOME TOTAL URBAN URBAN RURAL MEN WOMEN BLACK HIS. WOMEN WOM SCHL. COLL. COLL+ CONS. MOD. LIB.TOTAL URBAN URBAN RURAL MEN WOMEN BLACK HIS. WOMEN WOM SCHL. COLL. COLL+ CONS. MOD. LIB.TOTAL URBAN URBAN RURAL MEN WOMEN BLACK HIS. WOMEN WOM SCHL. COLL. COLL+ CONS. MOD. LIB.TOTAL URBAN URBAN RURAL MEN WOMEN BLACK HIS. WOMEN WOM SCHL. COLL. COLL+ CONS. MOD. LIB. -------------------- -------------------- -------------------- -------------------- -------------------- -------------------- -------------------- -------------------- -------------------- -------------------- -------------------- -------------------- -------------------- -------------------- -------------------- -------------------- (A) (B) (C) (D) (E) (F) (G) (H) (I) (J) (K) (L) (M) (N) (O) (P)(A) (B) (C) (D) (E) (F) (G) (H) (I) (J) (K) (L) (M) (N) (O) (P)(A) (B) (C) (D) (E) (F) (G) (H) (I) (J) (K) (L) (M) (N) (O) (P)(A) (B) (C) (D) (E) (F) (G) (H) (I) (J) (K) (L) (M) (N) (O) (P) TOTAL 823 192 400 211 267 290 118 55 182 241 157 216 430 328 247 214TOTAL 823 192 400 211 267 290 118 55 182 241 157 216 430 328 247 214TOTAL 823 192 400 211 267 290 118 55 182 241 157 216 430 328 247 214TOTAL 823 192 400 211 267 290 118 55 182 241 157 216 430 328 247 214 100% 10100% 10100% 10100% 100% 100% 100% 100% 100% 100% 100% 100% 100% 100% 100% 100% 100% 100% 100%0% 100% 100% 100% 100% 100% 100% 100% 100% 100% 100% 100% 100% 100% 100%0% 100% 100% 100% 100% 100% 100% 100% 100% 100% 100% 100% 100% 100% 100%0% 100% 100% 100% 100% 100% 100% 100% 100% 100% 100% 100% 100% 100% 100% Unweighted Total 823 172 385 244 340 305 73 35 178 205 161 222 417 395 233 162Unweighted Total 823 172 385 244 340 305 73 35 178 205 161 222 417 395 233 162Unweighted Total 823 172 385 244 340 305 73 35 178 205 161 222 417 395 233 162Unweighted Total 823 172 385 244 340 305 73 35 178 205 161 222 417 395 233 162 Very concerned 51 15 26 Very concerned 51 15 26 Very concerned 51 15 26 Very concerned 51 15 26 10 10 9 23 1 13 9 12 8 30 13 13 1910 10 9 23 1 13 9 12 8 30 13 13 1910 10 9 23 1 13 9 12 8 30 13 13 1910 10 9 23 1 13 9 12 8 30 13 13 19 6% 8% 6% 5% 4% 3% 19% 2% 7% 4% 8% 4% 7% 4% 5% 9%6% 8% 6% 5% 4% 3% 19% 2% 7% 4% 8% 4% 7% 4% 5% 9%6% 8% 6% 5% 4% 3% 19% 2% 7% 4% 8% 4% 7% 4% 5% 9%6% 8% 6% 5% 4% 3% 19% 2% 7% 4% 8% 4% 7% 4% 5% 9% H l nH l nH l nH l n Somewhat concerned 68 24 25 18 23 27 9 3 15 23 7 13 47 16 17 35Somewhat concerned 68 24 25 18 23 27 9 3 15 23 7 13 47 16 17 35Somewhat concerned 68 24 25 18 23 27 9 3 15 23 7 13 47 16 17 35Somewhat concerned 68 24 25 18 23 27 9 3 15 23 7 13 47 16 17 35 8% 12% 6% 9% 9% 9% 8% 8% 12% 6% 9% 9% 9% 8% 8% 12% 6% 9% 9% 9% 8% 8% 12% 6% 9% 9% 9% 8% 6% 8% 9% 4% 6% 11% 5% 7% 16%6% 8% 9% 4% 6% 11% 5% 7% 16%6% 8% 9% 4% 6% 11% 5% 7% 16%6% 8% 9% 4% 6% 11% 5% 7% 16% c Kl NOc Kl NOc Kl NOc Kl NO Not very concerned 149 41 81 24 48 41 29 10 35Not very concerned 149 41 81 24 48 41 29 10 35Not very concerned 149 41 81 24 48 41 29 10 35Not very concerned 149 41 81 24 48 41 29 10 35 37 26 46 74 34 55 5137 26 46 74 34 55 5137 26 46 74 34 55 5137 26 46 74 34 55 51 18% 21% 20% 11% 18% 14% 25% 19% 19% 15% 17% 21% 17% 10% 22% 24%18% 21% 20% 11% 18% 14% 25% 19% 19% 15% 17% 21% 17% 10% 22% 24%18% 21% 20% 11% 18% 14% 25% 19% 19% 15% 17% 21% 17% 10% 22% 24%18% 21% 20% 11% 18% 14% 25% 19% 19% 15% 17% 21% 17% 10% 22% 24% D D N ND D N ND D N ND D N N Not at all concerned 553 112 268 159 185 212 57 40 118 173 111 149 278 264 161 109Not at all concerned 553 112 268 159 185 212 57 40 118 173 111 149 278 264 161 109Not at all concerned 553 112 268 159 185 212 57 40 118 173 111 149 278 264 161 109Not at all concerned 553 112 268 159 185 212 57 40 118 173 111 149 278 264 161 109 67% 58% 67% 75% 69% 73% 48% 73% 65% 72% 71% 69% 65% 81% 65% 51%67% 58% 67% 75% 69% 73% 48% 73% 65% 72% 71% 69% 65% 81% 65% 51%67% 58% 67% 75% 69% 73% 48% 73% 65% 72% 71% 69% 65% 81% 65% 51%67% 58% 67% 75% 69% 73% 48% 73% 65% 72% 71% 69% 65% 81% 65% 51% b Bc G OP P b Bc G OP P b Bc G OP P b Bc G OP P Not sure Not sure Not sure Not sure 1 0 1 0 1 0 1 0 ---- ---- 0 0 0 0 ---- ---- ---- ---- ---- 0 0 0 0 ---- ---- ---- ---- 0000 *% *% *% *% *%*% *% *% *% *%*% *% *% *% *%*% *% *% *% *% Refused 0 Refused 0 Refused 0 Refused 0 0 0 0 0 ---- ---- 0 0 0 0 ---- ---- ---- ---- ---- ---- ---- 0 0 0 0 ---- 0 0 0 0 ---- *% *% *% *% *% *% *% *% *% *% *% *% *% *% *% *% *% *% *% *% CONCERNED 119 39 51 CONCERNED 119 39 51 CONCERNED 119 39 51 CONCERNED 119 39 51 28 33 36 32 4 29 31 19 21 78 29 30 5328 33 36 32 4 29 31 19 21 78 29 30 5328 33 36 32 4 29 31 19 21 78 29 30 5328 33 36 32 4 29 31 19 21 78 29 30 53 14% 20% 13% 13% 12% 12% 27% 8% 16% 13% 12% 10% 18% 9% 12% 25%14% 20% 13% 13% 12% 12% 27% 8% 16% 13% 12% 10% 18% 9% 12% 25%14% 20% 13% 13% 12% 12% 27% 8% 16% 13% 12% 10% 18% 9% 12% 25%14% 20% 13% 13% 12% 12% 27% 8% 16% 13% 12% 10% 18% 9% 12% 25% c c c c H L NOH L NOH L NOH L NO NOT CONCERNED 702 153 349 183 233 253 86 50 154 210 137 195 352 298 216 160NOT CONCERNED 702 153 349 183 233 253 86 50 154 210 137 195 352 298 216 160NOT CONCERNED 702 153 349 183 233 253 86 50 154 210 137 195 352 298 216 160NOT CONCERNED 702 153 349 183 233 253 86 50 154 210 137 195 352 298 216 160 85% 79% 87% 87% 87% 88% 73%85% 79% 87% 87% 87% 88% 73%85% 79% 87% 87% 87% 88% 73%85% 79% 87% 87% 87% 88% 73% 92% 84% 87% 88% 90% 82% 91% 88% 75%92% 84% 87% 88% 90% 82% 91% 88% 75%92% 84% 87% 88% 90% 82% 91% 88% 75%92% 84% 87% 88% 90% 82% 91% 88% 75% b G M P P b G M P P b G M P P b G M P P Comparison Groups: BCD/EF/GH/IJ/KLM/NOPComparison Groups: BCD/EF/GH/IJ/KLM/NOPComparison Groups: BCD/EF/GH/IJ/KLM/NOPComparison Groups: BCD/EF/GH/IJ/KLM/NOP Independent ZIndependent ZIndependent ZIndependent Z----Test for Percentages (unpooled proportions)Test for Percentages (unpooled proportions)Test for Percentages (unpooled proportions)Test for Percentages (unpooled proportions) Uppercase letters indicate significance at the 95% level.Uppercase letters indicate significance at the 95% level.Uppercase letters indicate significance at the 95% level.Uppercase letters indicate significance at the 95% level. Lowercase letters indicate significance at the 90% level.Lowercase letters indicate significance at the 90% level.Lowercase letters indicate significance at the 90% level.Lowercase letters indicate significance at the 90% level.

Table J12 Page 63Table J12 Page 63Table J12 Page 63Table J12 Page 63 Investor's Business Daily/TIPP PollInvestor's Business Daily/TIPP PollInvestor's Business Daily/TIPP PollInvestor's Business Daily/TIPP Poll---- December 2018, Field 11/2December 2018, Field 11/2December 2018, Field 11/2December 2018, Field 11/26 to 12/2 , Sample 6 to 12/2 , Sample 6 to 12/2 , Sample 6 to 12/2 , Sample ---- 823 adults, MOE +/823 adults, MOE +/823 adults, MOE +/823 adults, MOE +/----3.3 pts, Traditional phone with live interviewers 3.3 pts, Traditional phone with live interviewers 3.3 pts, Traditional phone with live interviewers 3.3 pts, Traditional phone with live interviewers J12J12J12J12 JOB SENSITIVE HOUSEHOLDS (Either looking for employment now or concerned)JOB SENSITIVE HOUSEHOLDS (Either looking for employment now or concerned)JOB SENSITIVE HOUSEHOLDS (Either looking for employment now or concerned)JOB SENSITIVE HOUSEHOLDS (Either looking for employment now or concerned) ======= REGION ======== ========= AGE ========= ======== REGION ======== ========= AGE ========= ======== REGION ======== ========= AGE ========= ======== REGION ======== ========= AGE ========= ==GENDER== ===RACE === ======= INCOME ======= =====PARTY===== ==INVESTOR==GENDER== ===RACE === ======= INCOME ======= =====PARTY===== ==INVESTOR==GENDER== ===RACE === ======= INCOME ======= =====PARTY===== ==INVESTOR==GENDER== ===RACE === ======= INCOME ======= =====PARTY===== ==INVESTOR= TOTAL BLACK UND 30KTOTAL BLACK UND 30KTOTAL BLACK UND 30KTOTAL BLACK UND 30K---- 50K50K50K50K---- NE MW SOUTH WEST 18NE MW SOUTH WEST 18NE MW SOUTH WEST 18NE MW SOUTH WEST 18----24 2524 2524 2524 25----44 4544 4544 4544 45----64 65+ MALE FEM. WHITE HISP 30K 50K 75K 75K+ DEM REP IND YES NO 64 65+ MALE FEM. WHITE HISP 30K 50K 75K 75K+ DEM REP IND YES NO 64 65+ MALE FEM. WHITE HISP 30K 50K 75K 75K+ DEM REP IND YES NO 64 65+ MALE FEM. WHITE HISP 30K 50K 75K 75K+ DEM REP IND YES NO -------------------- -------------------- -------------------- -------------------- -------------------- -------------------- -------------------- -------------------- -------------------- -------------------- -------------------- -------------------- -------------------- -------------------- -------------------- -------------------- -------------------- -------------------- -------------------- -------------------- -------------------- -------------------- (A) (B) (C) (D) (E) (F) (G) (H) (I) (J) (K) (L) (M) (N) (O) (P) (Q) (R) (S) (T) (U) (A) (B) (C) (D) (E) (F) (G) (H) (I) (J) (K) (L) (M) (N) (O) (P) (Q) (R) (S) (T) (U) (A) (B) (C) (D) (E) (F) (G) (H) (I) (J) (K) (L) (M) (N) (O) (P) (Q) (R) (S) (T) (U) (A) (B) (C) (D) (E) (F) (G) (H) (I) (J) (K) (L) (M) (N) (O) (P) (Q) (R) (S) (T) (U) (V)(V)(V)(V) TOTAL 823 147 181 309 186 TOTAL 823 147 181 309 186 TOTAL 823 147 181 309 186 TOTAL 823 147 181 309 186 45 234 293 207 393 430 556 171 92 131 138 363 286 237 283 447 30945 234 293 207 393 430 556 171 92 131 138 363 286 237 283 447 30945 234 293 207 393 430 556 171 92 131 138 363 286 237 283 447 30945 234 293 207 393 430 556 171 92 131 138 363 286 237 283 447 309 100% 100% 100% 100% 100% 100% 100% 100% 100% 100% 100% 100% 100% 100% 100% 100% 100% 100% 100% 100% 100% 100% 100% 100% 100% 100% 100% 100% 100% 100% 100% 100% 100% 100% 100% 100% 100% 100% 100% 100% 100% 100% 100% 100% 100% 100% 100% 100% 100% 100% 100% 100% 100% 100% 100% 100% 100% 100% 100% 100% 100% 100% 100% 100% 100% 100% 100% 100% 100% 100% 100% 100% 100% 100% 100% 100% 100% 100% 100% 100% 100% 100% 100% 100% 100100100100%%%% Unweighted Total 823 158 180 311 174 17 102 289 371 433 390 645 107 104 145 126 3Unweighted Total 823 158 180 311 174 17 102 289 371 433 390 645 107 104 145 126 3Unweighted Total 823 158 180 311 174 17 102 289 371 433 390 645 107 104 145 126 3Unweighted Total 823 158 180 311 174 17 102 289 371 433 390 645 107 104 145 126 337 247 296 262 472 28237 247 296 262 472 28237 247 296 262 472 28237 247 296 262 472 282 JOB SENSITIVE HH 181 35 31 69 46 13 64 75 22 83 98 JOB SENSITIVE HH 181 35 31 69 46 13 64 75 22 83 98 JOB SENSITIVE HH 181 35 31 69 46 13 64 75 22 83 98 JOB SENSITIVE HH 181 35 31 69 46 13 64 75 22 83 98 108 53 36 27 38 68 99 21 58 82 87108 53 36 27 38 68 99 21 58 82 87108 53 36 27 38 68 99 21 58 82 87108 53 36 27 38 68 99 21 58 82 87 22% 24% 17% 22% 25% 28% 28% 26% 11% 21% 23% 19% 31% 40% 21% 28% 19% 35% 9% 20% 18% 22% 24% 17% 22% 25% 28% 28% 26% 11% 21% 23% 19% 31% 40% 21% 28% 19% 35% 9% 20% 18% 22% 24% 17% 22% 25% 28% 28% 26% 11% 21% 23% 19% 31% 40% 21% 28% 19% 35% 9% 20% 18% 22% 24% 17% 22% 25% 28% 28% 26% 11% 21% 23% 19% 31% 40% 21% 28% 19% 35% 9% 20% 18% 28%28%28%28% I I L OQ q ST S UI I L OQ q ST S UI I L OQ q ST S UI I L OQ q ST S U ONE OR MORE LOOKING 104 15 22 42 24 9 34 42 14 45 59 59 34 24 16 18 40ONE OR MORE LOOKING 104 15 22 42 24 9 34 42 14 45 59 59 34 24 16 18 40ONE OR MORE LOOKING 104 15 22 42 24 9 34 42 14 45 59 59 34 24 16 18 40ONE OR MORE LOOKING 104 15 22 42 24 9 34 42 14 45 59 59 34 24 16 18 40 53 11 39 49 4853 11 39 49 4853 11 39 49 4853 11 39 49 48 FOR EMPLOYMENT 13% 11% 12% 14% 13% 21% 15% 14% 7% 11% 14% 11% FOR EMPLOYMENT 13% 11% 12% 14% 13% 21% 15% 14% 7% 11% 14% 11% FOR EMPLOYMENT 13% 11% 12% 14% 13% 21% 15% 14% 7% 11% 14% 11% FOR EMPLOYMENT 13% 11% 12% 14% 13% 21% 15% 14% 7% 11% 14% 11% 20% 26% 12% 13% 11% 18% 5% 14% 11% 15%20% 26% 12% 13% 11% 18% 5% 14% 11% 15%20% 26% 12% 13% 11% 18% 5% 14% 11% 15%20% 26% 12% 13% 11% 18% 5% 14% 11% 15% I I L OPQ S S I I L OPQ S S I I L OPQ S S I I L OPQ S S CONCERNED MEMBER OF HH 119 28CONCERNED MEMBER OF HH 119 28CONCERNED MEMBER OF HH 119 28CONCERNED MEMBER OF HH 119 28 22 40 29 3 47 51 12 59 60 69 36 17 20 30 46 73 13 30 50 6122 40 29 3 47 51 12 59 60 69 36 17 20 30 46 73 13 30 50 6122 40 29 3 47 51 12 59 60 69 36 17 20 30 46 73 13 30 50 6122 40 29 3 47 51 12 59 60 69 36 17 20 30 46 73 13 30 50 61 LOSING JOB 14% 19% 12% 13% 16% 8% 20% 17% 6% 15% 14% 12% 21% 18% 15% 22% 13%LOSING JOB 14% 19% 12% 13% 16% 8% 20% 17% 6% 15% 14% 12% 21% 18% 15% 22% 13%LOSING JOB 14% 19% 12% 13% 16% 8% 20% 17% 6% 15% 14% 12% 21% 18% 15% 22% 13%LOSING JOB 14% 19% 12% 13% 16% 8% 20% 17% 6% 15% 14% 12% 21% 18% 15% 22% 13% 26% 26% 26% 26% 5% 11% 11% 20%5% 11% 11% 20%5% 11% 11% 20%5% 11% 11% 20% fI I L q ST s UfI I L q ST s UfI I L q ST s UfI I L q ST s U Comparison Groups: BCDE/FGHI/JK/LM/NOPQ/RST/UVComparison Groups: BCDE/FGHI/JK/LM/NOPQ/RST/UVComparison Groups: BCDE/FGHI/JK/LM/NOPQ/RST/UVComparison Groups: BCDE/FGHI/JK/LM/NOPQ/RST/UV Independent ZIndependent ZIndependent ZIndependent Z----Test for Percentages (unpooled proportions)Test for Percentages (unpooled proportions)Test for Percentages (unpooled proportions)Test for Percentages (unpooled proportions) Uppercase letters indicate significance at the 95% level.Uppercase letters indicate significance at the 95% level.Uppercase letters indicate significance at the 95% level.Uppercase letters indicate significance at the 95% level. Lowercase letters indicate significance at the 90% level.Lowercase letters indicate significance at the 90% level.Lowercase letters indicate significance at the 90% level.Lowercase letters indicate significance at the 90% level.

Table J12 Page 64Table J12 Page 64Table J12 Page 64Table J12 Page 64 Investor's Business Daily/TIPP PollInvestor's Business Daily/TIPP PollInvestor's Business Daily/TIPP PollInvestor's Business Daily/TIPP Poll---- December 2018, Field 11/2December 2018, Field 11/2December 2018, Field 11/2December 2018, Field 11/26 to 12/2 , Sample 6 to 12/2 , Sample 6 to 12/2 , Sample 6 to 12/2 , Sample ---- 823 adults, MOE +/823 adults, MOE +/823 adults, MOE +/823 adults, MOE +/----3.3 pts, Traditional phone with live interviewers 3.3 pts, Traditional phone with live interviewers 3.3 pts, Traditional phone with live interviewers 3.3 pts, Traditional phone with live interviewers J12J12J12J12 JOB SENSITIVE HOUSEHOLDS (Either looking for employment now or concerned)JOB SENSITIVE HOUSEHOLDS (Either looking for employment now or concerned)JOB SENSITIVE HOUSEHOLDS (Either looking for employment now or concerned)JOB SENSITIVE HOUSEHOLDS (Either looking for employment now or concerned) ====AREA TYPE==== ===WHITE=== ==BLK/HISP= ==MAR.S====AREA TYPE==== ===WHITE=== ==BLK/HISP= ==MAR.S====AREA TYPE==== ===WHITE=== ==BLK/HISP= ==MAR.S====AREA TYPE==== ===WHITE=== ==BLK/HISP= ==MAR.STAT= ====EDUCATION==== ====IDEOLOOGY====TAT= ====EDUCATION==== ====IDEOLOOGY====TAT= ====EDUCATION==== ====IDEOLOOGY====TAT= ====EDUCATION==== ====IDEOLOOGY==== SUBSUBSUBSUB---- WHITE SINGL MARR HIGH SOME WHITE SINGL MARR HIGH SOME WHITE SINGL MARR HIGH SOME WHITE SINGL MARR HIGH SOME TOTAL URBAN URBAN RURAL MEN WOMEN BLACK HIS. WOMEN WOM SCHL. CTOTAL URBAN URBAN RURAL MEN WOMEN BLACK HIS. WOMEN WOM SCHL. CTOTAL URBAN URBAN RURAL MEN WOMEN BLACK HIS. WOMEN WOM SCHL. CTOTAL URBAN URBAN RURAL MEN WOMEN BLACK HIS. WOMEN WOM SCHL. COLL. COLL+ CONS. MOD. LIB.OLL. COLL+ CONS. MOD. LIB.OLL. COLL+ CONS. MOD. LIB.OLL. COLL+ CONS. MOD. LIB. -------------------- -------------------- -------------------- -------------------- -------------------- -------------------- -------------------- -------------------- -------------------- -------------------- -------------------- -------------------- -------------------- -------------------- -------------------- -------------------- (A) (B) (C) (D) (E) (F) (G) (H) (I) (J) (K) (L) (M) (A) (B) (C) (D) (E) (F) (G) (H) (I) (J) (K) (L) (M) (A) (B) (C) (D) (E) (F) (G) (H) (I) (J) (K) (L) (M) (A) (B) (C) (D) (E) (F) (G) (H) (I) (J) (K) (L) (M) (N) (O) (P)(N) (O) (P)(N) (O) (P)(N) (O) (P) TOTAL 823 192 400 211 267 290 118 55 182 241 157 216 430 328 247 214TOTAL 823 192 400 211 267 290 118 55 182 241 157 216 430 328 247 214TOTAL 823 192 400 211 267 290 118 55 182 241 157 216 430 328 247 214TOTAL 823 192 400 211 267 290 118 55 182 241 157 216 430 328 247 214 100% 100% 100% 100% 100% 100% 100% 100% 100% 100% 100% 100% 100% 100% 100% 100%100% 100% 100% 100% 100% 100% 100% 100% 100% 100% 100% 100% 100% 100% 100% 100%100% 100% 100% 100% 100% 100% 100% 100% 100% 100% 100% 100% 100% 100% 100% 100%100% 100% 100% 100% 100% 100% 100% 100% 100% 100% 100% 100% 100% 100% 100% 100% Unweighted Total 823 172 385 244 340 305 73 35 178 205 161 222 417 395 233 162Unweighted Total 823 172 385 244 340 305 73 35 178 205 161 222 417 395 233 162Unweighted Total 823 172 385 244 340 305 73 35 178 205 161 222 417 395 233 162Unweighted Total 823 172 385 244 340 305 73 35 178 205 161 222 417 395 233 162 JOB SENSITJOB SENSITJOB SENSITJOB SENSITIVE HH 181 64 76 40 46 62 39 14 44 54 34 40 106 41 47 85IVE HH 181 64 76 40 46 62 39 14 44 54 34 40 106 41 47 85IVE HH 181 64 76 40 46 62 39 14 44 54 34 40 106 41 47 85IVE HH 181 64 76 40 46 62 39 14 44 54 34 40 106 41 47 85 22% 33% 19% 19% 17% 21% 33% 25% 24% 23% 22% 19% 25% 13% 19% 40%22% 33% 19% 19% 17% 21% 33% 25% 24% 23% 22% 19% 25% 13% 19% 40%22% 33% 19% 19% 17% 21% 33% 25% 24% 23% 22% 19% 25% 13% 19% 40%22% 33% 19% 19% 17% 21% 33% 25% 24% 23% 22% 19% 25% 13% 19% 40% CD n NOCD n NOCD n NOCD n NO ONE OR MORE LOOKING 104 41 41 22 22 36 23 11 27 32 20 29 55 30 25 45ONE OR MORE LOOKING 104 41 41 22 22 36 23 11 27 32 20 29 55 30 25 45ONE OR MORE LOOKING 104 41 41 22 22 36 23 11 27 32 20 29 55 30 25 45ONE OR MORE LOOKING 104 41 41 22 22 36 23 11 27 32 20 29 55 30 25 45 FOR EMPLOYMENT 13% FOR EMPLOYMENT 13% FOR EMPLOYMENT 13% FOR EMPLOYMENT 13% 21% 10% 11% 8% 12% 19% 20% 15% 13% 13% 13% 13% 9% 10% 21%21% 10% 11% 8% 12% 19% 20% 15% 13% 13% 13% 13% 9% 10% 21%21% 10% 11% 8% 12% 19% 20% 15% 13% 13% 13% 13% 9% 10% 21%21% 10% 11% 8% 12% 19% 20% 15% 13% 13% 13% 13% 9% 10% 21% CD NOCD NOCD NOCD NO CONCERNED MEMBER OF HH 119 39 51 CONCERNED MEMBER OF HH 119 39 51 CONCERNED MEMBER OF HH 119 39 51 CONCERNED MEMBER OF HH 119 39 51 28 33 36 32 4 29 31 19 21 78 29 30 5328 33 36 32 4 29 31 19 21 78 29 30 5328 33 36 32 4 29 31 19 21 78 29 30 5328 33 36 32 4 29 31 19 21 78 29 30 53 LOSING JOB 14% 20% 13% 13% 12% 12% 27% 8% 16% 13% 12% 10% 18% 9% 12% 25%LOSING JOB 14% 20% 13% 13% 12% 12% 27% 8% 16% 13% 12% 10% 18% 9% 12% 25%LOSING JOB 14% 20% 13% 13% 12% 12% 27% 8% 16% 13% 12% 10% 18% 9% 12% 25%LOSING JOB 14% 20% 13% 13% 12% 12% 27% 8% 16% 13% 12% 10% 18% 9% 12% 25% c c c c H L NOH L NOH L NOH L NO Comparison Groups: BCD/EF/GH/IJ/KLM/NOPComparison Groups: BCD/EF/GH/IJ/KLM/NOPComparison Groups: BCD/EF/GH/IJ/KLM/NOPComparison Groups: BCD/EF/GH/IJ/KLM/NOP Independent ZIndependent ZIndependent ZIndependent Z----Test for Percentages (unpooled proportions)Test for Percentages (unpooled proportions)Test for Percentages (unpooled proportions)Test for Percentages (unpooled proportions) Uppercase letters indicate significance at the 95% level.Uppercase letters indicate significance at the 95% level.Uppercase letters indicate significance at the 95% level.Uppercase letters indicate significance at the 95% level. Lowercase letters indicate significance at the 90% level.Lowercase letters indicate significance at the 90% level.Lowercase letters indicate significance at the 90% level.Lowercase letters indicate significance at the 90% level.