table of contents for finance and planning · pdf filetable of contents for finance and...
TRANSCRIPT

i
TABLE OF CONTENTS
FOR FINANCE AND PLANNING COMMITTEE
Robert B. Rowling, Chairman John W. Barnhill, Jr. H. Scott Caven, Jr. Cyndi Taylor Krier Colleen McHugh
Committee Meeting: 8/9/2006
Board Meeting: 8/10/2006 Arlington, Texas
Committee
Meeting Board Meeting
Page
Convene 10:00 a.m. Chairman Rowling
1. U. T. System: Discussion and appropriate action related to approval of Docket No. 127
10:00 a.m. Discussion, if needed Dr. Kelley
Action
139
2. U. T. System: Approval of Shared Services Initiative 10:03 a.m. Action Dr. Kelley Mr. John Wheat, BearingPoint, Inc.
Action
139
3. U. T. System: Key Financial Indicators Report and Monthly Financial Report
10:23 a.m. Report Dr. Kelley
Not on Agenda
157
4. U. T. System: Approval to exceed the full-time equivalent limitation on employees paid from appropriated funds
10:28 a.m. Action Mr. Wallace
Action
166
5. U. T. System: Approval of Optional Retirement Program employer contribution rates for Fiscal Year 2007
10:31 a.m. Action Mr. Wallace
Action
168
6. U. T. System Board of Regents: Adoption of a Resolution authorizing the issuance, sale, and delivery of Permanent University Fund Bonds not to exceed $400,000,000 and authorization to complete all related transactions
10:34 a.m. Action Mr. Aldridge
Action
171
7. U. T. System Board of Regents: Adoption of Sixteenth Supplemental Resolution authorizing Revenue Financing System Bonds in an amount not to exceed $575,000,000; authorization to complete all related transactions; and resolution regarding parity debt
10:37 a.m. Action Mr. Aldridge
Action
172
8. U. T. System: Approval of aggregate amount of $108,000,000 of Revenue Financing System Equipment Financing for Fiscal Year 2007 and resolution regarding parity debt
10:40 a.m. Action Mr. Aldridge
Action
174

ii
Committee Meeting
Board Meeting
Page
9. U. T. System Board of Regents: Investments Report for the quarter ended May 31, 2006, and The University of Texas Investment Management Company (UTIMCO) Performance Summary Report
10:43 a.m. Report Mr. Boldt
Report
177
Adjourn 11:00 a.m.

139
1. U. T. System: Discussion and appropriate action related to approval of Docket No. 127
RECOMMENDATION It is recommended that Docket No. 127, beginning on Page Docket - 1, be approved. The Docket is printed on green paper at the back of the Supplemental Materials (Volume 2) of the Agenda Book. It is also recommended that the Board confirm that authority to execute contracts, doc-uments, or instruments approved therein has been delegated to appropriate officials of the respective institution involved. 2. U. T. System: Approval of Shared Services Initiative
RECOMMENDATION The Chancellor, the Interim Executive Vice Chancellor for Academic Affairs, and the Executive Vice Chancellor for Health Affairs concur in the recommendation of the Executive Vice Chancellor for Business Affairs that the U. T. System Board of Regents approve the Shared Services Initiative projects as follows: a. approve bringing the Arlington Data Center to Tier III status ($1.5 million); b. approve acquisition of 8,000 square feet of data center space from U. T.
M. D. Anderson Cancer Center ($2.4 million);
c. approve full implementation of the North Texas Student Information System (SIS) Pilot Project ($8.0 million); and
d. approve expenditure of Permanent University Funds (PUF) as authorized
by the approved budget (See Item 4 on Page 8).
PowerPoint presentations by Mr. John Wheat, Senior Manager, Texas Higher Education Practice, BearingPoint, Inc., and Dr. Kelley are set forth on Pages 36 - 42 and Pages 43 - 51, respectively, of the Supplemental Materials (Volume 2) of the Agenda Book.

140
BACKGROUND INFORMATION "Shared services" is the name given to a specific model for consolidating redundant information technology and business services in large organizations with multiple, geographically distributed units. It is a proven organizational strategy for achieving 1. cost savings realized through economies of scale; 2. process improvements attained through standardization; and 3. universal application of institutionally preferred practices. The shared services model has been employed in some form by approximately 80% of the U.S. Fortune 500 companies and its use is spreading to the not-for-profit sector as well. The U. T. System has been utilizing many of the concepts of shared services for some time. The "value-added" philosophy emphasized by Chancellor Yudof recognizes the basic premise that efficiency and effectiveness are best obtained by sharing respon-sibility and resources of the U. T. System and the campuses. Facilities construction management and legal services are examples within the U. T. System, which are consistent with this shared services concept. The formalization of a Shared Services Initiative with clear definition and objectives, utilization of best practices, and direct U. T. System investment is the next step in this evolutionary process. In January 2006, the U. T. System engaged BearingPoint, Inc., through an interagency contract arrangement with U. T. Medical Branch - Galveston, to review and comment on the viability of utilizing a shared services model within the U. T. System and specifically, to review the feasibility of undertaking a shared services pilot project of Enterprise Resource Planning (ERP) systems in North Texas. BearingPoint completed its report and determined that shared services is a viable and compelling model for the U. T. System. BearingPoint recommended that utilization of shared services within the U. T. System be pursued and that the pilot project be undertaken. In addition, during this past year the U. T. System Office of Technology and Informa-tion Services (OTIS) has been involved in reviewing the viability of consolidating some information technology operations into regional data centers to enhance efficiency and provide effective data backup and recovery for the U. T. campuses. This is con-sistent with a legislative directive (HB 1516, 79th Texas Legislature, Regular Session) requiring Texas state agencies, under the direction of the Department of Information Resources (DIR), to consolidate into state enterprise data centers. DIR has indicated that as long as the higher education systems make progress toward system-based consolidation, DIR will not require higher education to consolidate with other state agencies.

141
The data center consolidation and the potential for shared software applications are only now possible with the creation of the Lonestar Education and Research Network (LEARN), which provides the necessary statewide connectivity platform to offer a higher level of integration. The U. T. System will encourage institutions to participate in the Shared Services Initiative in two critical ways. First, by bearing much of the initial implementation cost, the U. T. System provides a financial incentive for institutions to participate. The rec-ommendation above asks approval for the U. T. System to contribute $11.9 million in one-time capital to fund the initial shared services projects. In turn, the campuses will be contributing 25-33% of the initial implementation costs and will be responsible for all ongoing operating expenses following implementation. Second, by providing a fair and equitable governance structure, the U. T. System can create an environment where institutions will not feel they are compromising customiza-tion for efficiency. The Shared Services Initiative is consistent with and recommended in the proposed U. T. System Strategic Plan for 2006-2015. The Plan noted that shared services was a logical way to improve productivity and efficiency. The initiative outlined here fulfills the shared services recommendation in the Strategic Plan. Further details about the Shared Services Initiative may be found on Pages 143 - 156. Information Technology Shared Services - Data Centers It has been recommended that the U. T. System establish three Tier III regional data centers along the LEARN network. The consolidated data centers would be available to all U. T. institutions and would provide opportunities for data redundancy, efficient disaster recovery, and lower data center operational costs for the campuses. Cam-puses would be invited and encouraged to participate, but would not be under a man-date to do so. The recommendation is for the U. T. System to invest in the initial infrastructure to bring these three regional data centers online, but that participating institutions share all operating costs. The U. T. System will own and manage the regional data centers; however, it is recommended that the U. T. System contract with a U. T. campus to functionally operate each data center. Operating costs born by the U. T. System will be charged to each participating campus. The U. T. System will be accountable to the participating campuses through signed service level agreements. In addition, the data centers will be governed by a repre-sentative body of internal customers and U. T. System personnel.

142
The recommended locations for the three regional data centers are Arlington, Houston, and Austin. These locations provide regional access to the LEARN network, allow for necessary geographic dispersion, have access to qualified personnel needed to operate the centers, and have provided a match between space available and local needs. The North Texas SIS Pilot Project As previously mentioned, BearingPoint was asked to assess the viability of a joint software implementation project in North Texas. An opportunity existed because both U. T. Arlington and U. T. Dallas were engaged in plans to replace their administrative systems. In addition, U. T. Tyler recognized the need to upgrade its systems, but was unclear as to how it could allocate the necessary resources to fund its own major administrative software upgrade. BearingPoint determined that a joint implementation was both feasible and advisable. Appropriately structured, such a project would yield the benefits of the Shared Services model and would serve as a pilot for future similar initiatives. Recognizing that the most critical need for U. T. Dallas and U. T. Tyler was to replace their outdated student infor-mation systems, it was recommended that the project extend U. T. Arlington's imple-mentation of a PeopleSoft SIS to U. T. Dallas and U. T. Tyler. There are other U. T. System initiatives that are underway or being discussed that would also fit under this Shared Services Initiative. These include: joint purchasing, a common time and effort reporting system, and standardization of the chart of accounts.

Prepared by the Office of Business Affairs August 9, 2006
1
The Shared Services Initiative “Shared services” is the name given to a specific model for consolidating redundant information technology (IT) and business services in large organizations with multiple, geographically distributed units. It is a proven organizational strategy for achieving:
1. Cost savings realized through economies of scale; 2. Process improvements attained through standardization; and 3. Universal application of institutionally preferred practices.
The shared services model has been employed in some form by approximately 80% of the U.S. Fortune 500 companies and its use is spreading to the not-for-profit sector as well. As illustrated in the diagram provided by BearingPoint, Inc. below, shared services is structured to incorporate both the economies of a centralized system and the customer service of a decentralized model.
143

Prepared by the Office of Business Affairs August 9, 2006
2
Shared services can be structured and delivered in at least three major levels: information technology, software services or business systems, and business processes. Typically, these levels build on one another in the sequence depicted. In fact, the U. T. System has been utilizing many of the concepts of shared services for some time. The “value-added” philosophy emphasized by Chancellor Yudof recognizes the basic premise that efficiency and effectiveness are best obtained by sharing responsibility and resources of the U. T. System and the campuses. Facilities construction management and legal services are examples within the U. T. System, which are consistent with this shared services concept. Nonetheless, the formalization of a Shared Services Initiative with clear definition and objectives, utilization of best practices, and direct U. T. System investment is the next step in this evolutionary process. In January 2006, the U. T. System engaged BearingPoint, Inc. to review and comment on the viability of utilizing a shared services model within the U. T. System and specifically, to review the feasibility of undertaking a shared services pilot project of Enterprise Resource Planning (ERP) systems in North Texas. BearingPoint completed its report and determined that shared services is a viable and compelling model for the U. T. System. It was recommended that utilization of shared services within the U. T. System be pursued and that the pilot project be undertaken. In addition, during this past year the U. T. System Office of Technology and Information Services (OTIS) has been involved in reviewing the viability of consolidating some information
144

Prepared by the Office of Business Affairs August 9, 2006
3
technology operations into regional data centers to enhance efficiency and provide effective data back-up and recovery for the U. T. campuses. This is consistent with a legislative directive (HB 1516, 79th Texas Legislature, Regular Session) requiring Texas state agencies, under the direction of the Department of Information Resources (DIR), to consolidate into state enterprise data centers. DIR has indicated that as long as the higher education systems make progress toward system-based consolidation, DIR will not require higher education to consolidate with other state agencies. The data center consolidation and the potential for shared software applications are only now possible with the creation of the Lonestar Education and Research Network (LEARN) which provides the necessary statewide connectivity platform to offer a higher level of integration. A Shared Services Initiative is consistent with and recommended in the proposed U. T. System Strategic Plan for 2006-2015. The plan noted that shared services was a logical way to improve productivity and efficiency. Implementation of the initiative outlined here would signal substantial progress toward achievement of one of the significant recommendations of the U. T. System Strategic Plan. There are other U. T. System initiatives that are underway or being discussed that would also fit under this Shared Services Initiative. One project addresses recent failures by institutions of higher education in complying with federal regulations pertaining to a researcher and/or institution properly accounting for his/her salary charged to a contract or grant. A common online effort reporting system would strengthen institutional compliance with these regulations. Others include joint purchasing, consolidated technology transfer offices, and standardization of the chart of accounts. The purpose of this report is to organize these various activities within the defined “shared services” structure and to recommend that the U. T. System move forward with and invest in several specific shared services initiatives. Appendix B provides a summary of the projects discussed in the report categorized under the three levels of shared services. The following best practices recommended by BearingPoint will provide the basis for how all such initiatives are implemented. Shared services projects should:
1. Be guided by a governance body of internal customers 2. Be operated from a distinct business unit created for this purpose 3. Have clearly defined service portfolios 4. Be run by a professional program management office 5. Charge a competitive price for all services 6. Behave like a external business entity 7. Be accountable to customers via service level agreements 8. Use quantitative performance measures to drive continuous quality improvement
This Shared Services Initiative empowers the institutions to jointly administer programs and systems with the U. T. System facilitating the process and creating incentives for institutional participation.
145
Prepared by the Office of Business Affairs August 9, 2006
4
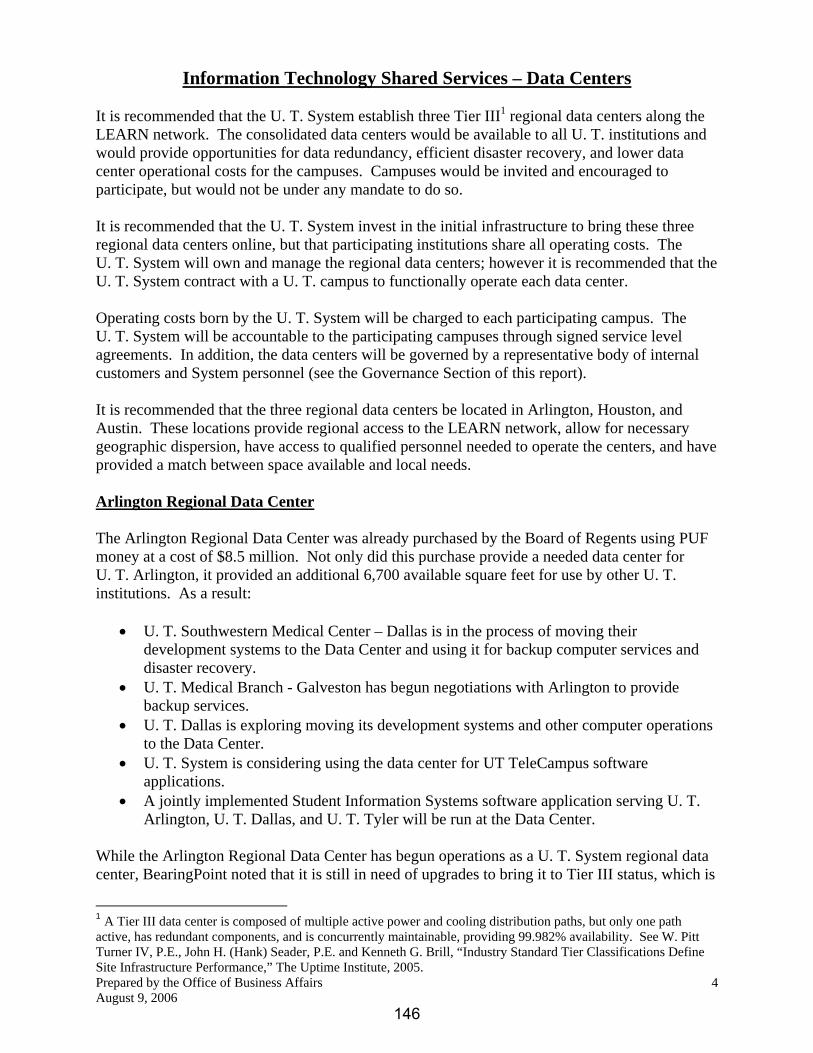
Information Technology Shared Services – Data Centers It is recommended that the U. T. System establish three Tier III1 regional data centers along the LEARN network. The consolidated data centers would be available to all U. T. institutions and would provide opportunities for data redundancy, efficient disaster recovery, and lower data center operational costs for the campuses. Campuses would be invited and encouraged to participate, but would not be under any mandate to do so. It is recommended that the U. T. System invest in the initial infrastructure to bring these three regional data centers online, but that participating institutions share all operating costs. The U. T. System will own and manage the regional data centers; however it is recommended that the U. T. System contract with a U. T. campus to functionally operate each data center. Operating costs born by the U. T. System will be charged to each participating campus. The U. T. System will be accountable to the participating campuses through signed service level agreements. In addition, the data centers will be governed by a representative body of internal customers and System personnel (see the Governance Section of this report). It is recommended that the three regional data centers be located in Arlington, Houston, and Austin. These locations provide regional access to the LEARN network, allow for necessary geographic dispersion, have access to qualified personnel needed to operate the centers, and have provided a match between space available and local needs. Arlington Regional Data Center The Arlington Regional Data Center was already purchased by the Board of Regents using PUF money at a cost of $8.5 million. Not only did this purchase provide a needed data center for U. T. Arlington, it provided an additional 6,700 available square feet for use by other U. T. institutions. As a result:
• U. T. Southwestern Medical Center – Dallas is in the process of moving their development systems to the Data Center and using it for backup computer services and disaster recovery.
• U. T. Medical Branch - Galveston has begun negotiations with Arlington to provide backup services.
• U. T. Dallas is exploring moving its development systems and other computer operations to the Data Center.
• U. T. System is considering using the data center for UT TeleCampus software applications.
• A jointly implemented Student Information Systems software application serving U. T. Arlington, U. T. Dallas, and U. T. Tyler will be run at the Data Center.
While the Arlington Regional Data Center has begun operations as a U. T. System regional data center, BearingPoint noted that it is still in need of upgrades to bring it to Tier III status, which is
1 A Tier III data center is composed of multiple active power and cooling distribution paths, but only one path active, has redundant components, and is concurrently maintainable, providing 99.982% availability. See W. Pitt Turner IV, P.E., John H. (Hank) Seader, P.E. and Kenneth G. Brill, “Industry Standard Tier Classifications Define Site Infrastructure Performance,” The Uptime Institute, 2005.
146

Prepared by the Office of Business Affairs August 9, 2006
5
imperative for it to be a robust disaster recovery solution. The costs for those upgrades are estimated to be $1.5 million and it is recommended that the Board of Regents authorize this additional capital investment. U. T. System Financial Responsibility: ONE-TIME The capital investment needed to bring the Arlington
Data Center to Tier III Status $1.5 million
Houston Regional Data Center U. T. M. D. Anderson Cancer Center owns and occupies a remote data center in Houston. The facility includes 8,000 square feet of Tier III data center space and 3,600 square feet of office space. The office space has historically been rented out to other entities. U. T. M. D. Anderson Cancer Center would prefer to make this space available to the U. T. System. For an approximate cost of $2.4 million, the 3,600 square feet of office space could be upgraded to Tier III data center status. This 11,600-square foot Tier III data center facility could then adequately serve as a second regional data center serving U. T. M. D. Anderson Cancer Center and potentially U. T. Health Science Center - Houston, U. T. Health Science Center - San Antonio, U. T. Brownsville, and U. T. Pan American. The Houston Regional Data Center would be ideal for housing a common online effort reporting system and creation of the Houston Regional Data Center would eventually allow for data storage redundancy between the Arlington and Houston regional centers. It is recommended that the Board of Regents authorize funding to complete the build-out of the Houston Data Center. U. T. System Financial Responsibility: ONE-TIME The capital investment needed to build out 3,600 square
feet of data center space at U. T. M. D. Anderson Cancer Center.
$2.4 million
Austin Regional Data Center U. T. Austin is in great need of a new data center. Rather than attempt to replace its current facility, it is more advantageous to pursue the acquisition and/or construction of a regional data center facility in Austin that would both serve Austin’s needs and function as a third U. T. System regional data center. It is estimated that 20,000 square feet of Tier III data center space would be needed to serve U. T. Austin and potentially, U. T. San Antonio, U. T. Permian Basin, and U. T. El Paso. The staff at U. T. Austin is supportive of a regional data center concept and is assisting with the planning, cost estimates and business case. A recommendation for U. T. System investment is not ready at this time, but will be forthcoming once plans become more complete.
147

Prepared by the Office of Business Affairs August 9, 2006
6
LEARN Network The continued expansion and enhancement of the LEARN network has allowed the U. T. System to move towards offering regional data centers throughout Texas. This robust infrastructure allows the U. T. System to proceed with the proposed Shared Services Initiative. However, continued capital investments in this network would allow the U. T. System to eventually control and maintain its own statewide network connecting all the U. T. institutions. Such a proprietary network would greatly facilitate future shared services projects. The U. T. System Office of Technology and Information Services has requested Library, Equipment, Repair and Rehabilitation funds to provide the needed capital enhancements. Thus, the funding request is not duplicated here.
148

Prepared by the Office of Business Affairs August 9, 2006
7
Business Systems Shared Services – Software Applications The North Texas SIS Pilot Project As previously mentioned, BearingPoint was asked to assess the viability of a joint software implementation project in North Texas. An opportunity existed because both U. T. Arlington and U. T. Dallas were engaged in plans to replace their administrative systems. In addition, U. T. Tyler recognized the need to upgrade its systems but was unclear as to how they could allocate the necessary resources to fund its own major administrative software upgrade. BearingPoint determined that a joint implementation was both feasible and advisable. Appropriately structured, such a project would yield the benefits of the shared services model and would serve as a pilot for future similar initiatives. Recognizing that the most critical need for U. T. Dallas and U. T. Tyler was to replace their outdated student information systems, it was recommended that the project extend U. T. Arlington’s implementation of a PeopleSoft Student Information System (SIS) to U. T. Dallas and U. T. Tyler.2 The institutions have agreed in principle to the joint SIS implementation and recognize the potential benefits of a shared services model. In addition, they will allow the U. T. System to provide oversight of the application on an ongoing basis in a manner that is agreeable to all three of the institutions as well as to the U. T. System. This pilot implementation allows the opportunity to establish a governance structure for a Shared Services Initiative (see the Governance section of this report). As an incentive to the campuses and consistent with the structure of the shared services model, it is recommended that the Board of Regents fund much of the initial licensing and implementation costs of this pilot project. These one-time costs, estimated at $8.0 million can be capitalized and funded from PUF distributions. In addition, it is essential that the U. T. System hire a small project management staff to manage this implementation and handle day-to-day operations (see Financial Commitments of the U. T. System section). In turn, each campus will contribute to the project by funding its own project manager, functional and technical support teams, and the necessary hardware on their campuses. While this funding commitment will vary based on the campus’ size, the total commitment from the participating institutions will likely be 25% to 33% of the total implementation costs. Furthermore, the institutions will be responsible for sharing all the ongoing operating costs after implementation.
2 U. T. Tyler’s participation is conditioned on the establishment of a dark fiber connection between Tyler/Longview and the Metroplex area by the LEARN network, which is planned for the upcoming year.
149

Prepared by the Office of Business Affairs August 9, 2006
8
U. T. System Financial Responsibilities: ONE-TIME The cost of extending the PeopleSoft Student Information
System license to U. T. Dallas and U. T. Tyler $2.0 million
ONE-TIME Consulting services associated with implementation and training
$3.5 million
ONE-TIME Necessary hardware to run the central application $1.5 million ONE-TIME Two years of prepaid maintenance on the hardware and
software licenses $1.0 million
Online Effort Reporting System Project Another project suited for shared services implementation addresses recent failures by institutions of higher education in complying with federal regulations pertaining to a researcher and/or institution properly accounting for his/her salary charged to a contract or grant. In recent years, noncompliance with these regulations has resulted in several institutions of higher education having to pay millions of dollars in fines and/or refunded research awards. The Office of Health Affairs has been spearheading several strategies designed to improve compliance with federal regulations relating to effort certification made by individuals who are paid from a sponsored program through standardizing policies, developing education programs, and ensuring appropriate monitoring activities exist. By leveraging the Guidance of Effort Reporting Policies, the Office of Health Affairs is studying the plausibility of a common online effort reporting system for multiple institutions, which could result in standardized processes as well as savings in the total implementation cost.
150

Prepared by the Office of Business Affairs August 9, 2006
9
Business Processes Shared Services Joint Purchasing The Office of Health Affairs, the Office of Technology and Information Services, the Office of Risk Management, and others have made considerable progress in facilitating joint purchasing contracts for the U. T. System. The Office of Health Affairs is now working on a plan for more formalized joint purchasing efforts. This project would be well suited for the Shared Services Initiative related to business processes. As the ideas are developed and formalized, further recommendations and suggestions in this area will come to the Board of Regents. Technology Transfer Offices The Office of Research and Technology Transfer is working with the institutions to enhance technology transfer services. Several institutions maintain on-campus technology transfer offices. Other institutions do not have the research volume to support such an initiative. In order to allow these smaller-volume institutions to support such efforts, the Office of Research and Technology Transfer is exploring multi-institutional affinity based Technology Transfer Offices. Current examples of affinity groups in other contexts include but are not limited to the Borderplex Council and the Metroplex Council. These shared offices would allow the smaller-volume institutions to partner with larger institutions to share the existing infrastructure.
151

Prepared by the Office of Business Affairs August 9, 2006
10
Financial Commitments of the U. T. System As previously noted, recommended best practices for implementation of any shared services project include an organization governed by the participants that operates like an external business unit and charges a competitive price for its services. Thus, ongoing operating costs of all shared services projects would be born by the participating institutions. However, the Shared Services Initiative recommends a significant investment from the U. T. System to start these projects and facilitate their implementation. By providing such financial incentives, campuses will be encouraged to participate, a means will be provided for smaller campuses to take part in activities they could not otherwise afford, and overall efficiency and effectiveness for the U. T. System will increase. The suggested U. T. System investment includes one-time capital investments like those recommended in this paper for the Arlington Regional Data Center ($1.5 million), the Houston Regional Data Center ($2.4 million), and the North Texas SIS Pilot Project implementation ($8.0 million). In most cases—such as in the SIS project implementation—the campuses also participate in the implementation costs, but the majority of these one-time expenses would be born by the U. T. System. As other projects are recommended, it is anticipated that additional one-time capital funding requests will come to the Board of Regents. Furthermore, as part of the Shared Services Initiative, it is recommended that a Shared Services Office be created and that this group be funded by and report to the U. T. System Executive Vice Chancellor for Business Affairs. The Shared Services Office would be responsible for facilitating and overseeing each project implementation. The small project management staff would be assigned to various shared services projects, as needed, to ensure successful implementation and to work with and report to the project governing committees. Once projects are implemented, all responsibilities would be transitioned to campus staff and/or to permanent project staff funded by the participating institutions. With the implementation of the North Texas SIS pilot project, it is suggested that three staff members (a Project Manager, an Assistant Project Manager, and an Administrative Assistant) be hired into the Shared Services Office, two of these employees would be located in Arlington, and one in Austin. The staff would be accountable to oversee the successful implementation of this project over the next two years and then would move to other implementation projects. Eventually, this model could be duplicated in Houston (as a small team oversees the implementation of a common online effort reporting system there, for example) and in Austin. It is envisioned that the entire staff of the Shared Services Office could grow to as many as seven employees with two working in Arlington, two in Houston and three in Austin. However, at this point only an increase in the Fiscal Year 2007 operating budget of approximately $300,000 is being requested to fund staff initially responsible for implementation of the North Texas SIS Pilot Project. Future hires will be dependant on the approval of additional projects. RECURRING A full-time project implementation staff of up to three
people in Arlington $300 K
152

Prepared by the Office of Business Affairs August 9, 2006
11
Governance A main distinction between centralization and shared services is the relationship built between the U. T. System and the institutions. With shared services, the U. T. System is providing a service to the internal customer. This service model includes formalized service level agreements (SLAs), performance metrics and goals, and a defined service arrangement between the customer (the institutions) and the service provider (U. T. System). The SIS implementation and the Arlington Regional Data Center will act as pilot implementations for the Shared Services Initiative. As such, guidelines will be set and SLAs will be approved with the expectation that they will be the first iteration of an evolving governance program that will support this initiative. Generally, it is proposed that a bicameral governance system be implemented for each shared services project. Projects would be overseen by a Governing Committee and a Steering Committee. The Governing Committee, comprised of participating institutions (each with an equal vote) and chaired by a U. T. System representative, will address strategic issues such as the establishment and maintenance of key operating principles, approval of the funding model and capital and operating budgets, approval of the Service Level Agreements, and approval of policies and procedures governing the project. The Governing Committee will also be charged with resolving conflicts forwarded by the Steering Committee. The chair of the Governing Committee is also ultimately responsible for the ongoing success of the project, and will be empowered to mediate conflicts and break deadlocks when consensus cannot be reached. The Steering Committee, comprised of participating institutions (each receiving a weighted vote based on the size of their involvement in the project) and U. T. System representatives, will be responsible for day-to-day decision-making, consideration of the local priorities of each institution and balancing those priorities within the joint project, establishing the SLAs by mutual agreement, recommending budgets and budget changes, managing customer relationships, and bringing conflicts (along with recommended solutions) to the Governing Committee. Institutions interested in a shared services project, but not yet participating may be invited to send nonvoting observers to serve on either of the committees.
153

Prepared by the Office of Business Affairs August 9, 2006
12
Appendix A: Validation for Implementation (Return On Investment) Arlington Regional Data Center Cost Savings:
• Frees space on campus for other purposes o The alternative for U. T. Southwestern Medical Center – Dallas was to acquire or
build its own data center at an estimated cost of over $2,500 per square foot o U. T. Dallas will be able to eliminate one of its on-campus data centers
Freeing space Enhancing efficiencies and Addressing health and safety issues
• Generates personnel savings due to umbrella management of data center o It takes approximately the same number of staff to run a small or large data center
• Provides real estate savings due to space reduction o U. T. Arlington secured a data center with inexpensive real estate
• Offers more efficient use of already available and owned space at U. T. Arlington o Many campuses have no other easy access to available data center space
Added Value:
• Offers redundancy for disaster recovery not previously available to institutions o U. T. Medical Branch - Galveston is moving data backup to Arlington due to
lessons learned from recent hurricane activity • Provides for higher level of service (24x7) than a some campuses can provide • Generates a higher level of security than exists at some campuses • Provides, for the first time, Tier III data center to some U. T. institutions
Houston Regional Data Center
• Makes available to more U. T. Institutions the same cost savings and added value referenced above
• In addition, acquisition of a Houston Regional Data Center would provide redundancy for disaster recovery not previously available
• Redundant regional data centers would facilitate U. T.’s ability to provide common applications housed at the data centers with high availability
154

Prepared by the Office of Business Affairs August 9, 2006
13
North Texas Student Information Systems Joint Application Cost Savings:
• Allows for total costs that will be at least 1/3 less than the cost of implementing a Student Information System on each of the three campuses individually
• Provides savings in: o Personnel due to a single implementation team o Licensing due to economies of scale o Developing standard reports, such as those for the Coordinating Board
Added Value
• Increases help desk services due to economies of scale o Because there are more users and the help desk is consolidated, it is possible to
offer more hours of help-desk coverage • Provides opportunities to share best practices on a single platform
o It is natural that the institutions sharing the SIS will have significantly more interaction than institutions who are working individually.
• Enhances efficiency in gathering System-wide information
155

14
Appendix B: Shared Services IT Shared Services Business Systems Shared Services Business Process Shared Services
Regional Data Centers • Arlington
o 6,700 Square Feet Available o Owned By U. T. System o Run By U. T. Arlington o Participants
U. T. Arlington U. T. Dallas U. T. Tyler U. T. Southwestern Medical Center - Dallas U. T. Medical Branch - Galveston U. T. System U. T. Health Center - Tyler*
• One-Time Investment Needed to Upgrade to Tier III Status $1.5 Million
• Houston o 11,600 Square Feet Available o Run by U. T. M. D. Anderson Cancer Center o Participants
U. T. M. D. Anderson Cancer Center U. T. Health Science Center - San Antonio U. T. Health Science Center - Houston* U. T. Pan American* U. T. Brownsville* U. T. System*
o One-Time Investment Needed to Build Out For Shared Use $2.4 Million
• Austin o 20,000 Square Feet Total o Owned By U. T. System o Run by U. T. Austin o Participants
U. T. Austin U. T. San Antonio* U. T. El Paso* U. T. Permian Basin*
o One-Time Investment Needed To build or Purchase TBD LEARN Network • The Network needed for Adequate Connectivity and Redundancy
North Texas Student Information Systems Joint Application • Participants
o U. T. Arlington o U. T. Dallas o U. T. Tyler
• One-Time Investment Needed for Initial Software licensing and Implementation Costs $8.0 million
• Recurring Investment Needed For Project Management $300,000
Online Effort Reporting System • Participants TBD • Cost TBD
Joint Purchasing • Participants TBD • Cost TBD Technology Transfer Office • Participants TBD • Cost TBD
* Possible
156

157
3. U. T. System: Key Financial Indicators Report and Monthly Financial Report
Dr. Scott C. Kelley, Executive Vice Chancellor for Business Affairs, will discuss the Key Financial Indicators Report, as set forth on Pages 158 - 165, and the June Monthly Financial Report (MFR), as set forth on Pages 52 - 77 of the Supplemental Materials (Volume 2) of the Agenda Book. The reports represent the consolidated and individual operating results of the U. T. System institutions.
REPORT The Key Financial Indicators Report compares the System-wide results of operations, key revenues and expenses, reserves, and key financial ratios in a graphical presen-tation from Fiscal Year 2002 through June 2006. Ratios requiring balance sheet data are provided for Fiscal Year 2002 through Fiscal Year 2005. The MFR is provided as support for the Key Financial Indicators. The MFR includes the detailed numbers behind the System-wide graphs as well as detail for each individual institution as of June 2006.

THE UNIVERSITY OF TEXAS SYSTEM
QUARTERLY KEY STRATEGIC INDICATORS REPORT
3RD QUARTER FY 2006
158

Actual 2002 Through 2005 amounts(SOURCE: Annual Financial Reports Fiscal Years 2002, 2003, 2004 and 2005)
2006 Budget amounts(SOURCE: Operating Budget Summary 2006)
Projected 2006 amounts(trend based on the average change of the previous four years of data)
Monthly Financial Report Year to Date amounts for May 2005 and May 2006
Annual State Net Revenue Collections for 2002, 2003, 2004 and 2005(SOURCE: Texas Revenue History by Source 1978-2005, State Comptroller's Office)
Year to Date State Net Revenue Collections for May 2005 and May 2006(SOURCE: State Comptroller's Office)
Estimated State Revenue Collections for 2006(SOURCE: 2006-07 Certification Revenue Estimate, State Comptroller's Office)
2002, 2003, 2004 and 2005 Annual Average of FTEs, Average of 1st, 2nd and 3rd Quarter 2006 FTEs(SOURCE: State Auditor's Office Quarterly FTE Report)
Year to Date margin for June 2006(SOURCE: Monthly Financial Report for June 2006)
Projected 2006(SOURCE: Monthly Financial Report Year- End Projections collected June 2006)
Year to Date margin for June 2005(SOURCE: Monthly Financial Report for June 2006)
Target Normalized Rates
Aaa/Aa1 Median(SOURCE: Moody's)
A2 Median(SOURCE: Moody's)
Fair Facilities Condition Index (5% - 10%)
Good Facilities Condition Index (Exceeds 10%)
KEY
159

PROJECTED 2006
KEY INDICATORS OF REVENUESACTUAL 2002 THROUGH 2005
YEAR TO DATE 2005 AND 2006 FROM MAY MONTHLY FINANCIAL REPORT
2,123.62,325.1
2,599.92,201.5
3,074.92,502.3
3,275.7
-
500
1,000
1,500
2,000
2,500
3,000
3,500
2002 2003 2004 2005 2006
Clinical RevenuesIn Millions
76%
72%
1,651.81,778.1
1,905.6
1,543.6
1,974.8
1,634.0
2,115.3
-
500
1,000
1,500
2,000
2,500
2002 2003 2004 2005 2006
Sponsored ProgramsIn Millions
55,22258,310 62,073 55,063
65,810 61,22266,294
-
10,000
20,000
30,000
40,000
50,000
60,000
70,000
80,000
2002 2003 2004 2005 2006
State Net RevenuesIn Millions
92%
84%
1,615.4 1,585.6 1,578.1
1,214.5
1,557.5
1,309.6
1,739.3
-
200
400
600
800
1,000
1,200
1,400
1,600
1,800
2002 2003 2004 2005 2006
State AppropriationsIn Millions
75%78%
626.5727.4
878.1 800.5
991.0873.8
1,038.3
-
200
400
600
800
1,000
1,200
2002 2003 2004 2005 2006
Gross Tuition and FeesIn Millions
386.6 415.5468.7
373.0
534.3
404.4
511.1
-
100
200
300
400
500
600
2002 2003 2004 2005 2006
Auxiliary Enterprises andSales and Services of Educational Activities
In Millions
265.2
525.4 491.9 455.3
630.6
531.6 547.7
-
100
200
300
400
500
600
700
2002 2003 2004 2005 2006
Investment Income(Excludes Realized and Unrealized Gains and Losses)
In Millions
224.7
193.9
179.9
197.1
265.8
211.3
171.7
-
50
100
150
200
250
300
2002 2003 2004 2005 2006
Gift Contributions for OperationsIn Millions
74%123%
84%
78% 70%
72%
77%
81%
97%
79%
160

PROJECTED 2006
KEY INDICATORS OF EXPENSESACTUAL 2002 THROUGH 2005
YEAR TO DATE 2005 AND 2006 FROM MAY MONTHLY FINANCIAL REPORT
3,452.1
3,723.2 3,962.7
3,169.0
4,317.1
3,431.0
4,405.7
-
500
1,000
1,500
2,000
2,500
3,000
3,500
4,000
4,500
2002 2003 2004 2005 2006
Salaries and WagesIn Millions
73%
884.3
969.6938.7 781.3
1,042.4
849.2
1,110.7
-
200
400
600
800
1,000
1,200
2002 2003 2004 2005 2006
Fringe Benefits CostsIn Millions
76%
689.6 735.1 758.2701.5
897.0 778.6980.9
-
100
200
300
400
500
600
700
800
900
1,000
2002 2003 2004 2005 2006
Materials and SuppliesIn Millions
130.5141.2 152.1 137.6
181.8
191.6 219.6
-
50
100
150
200
250
2002 2003 2004 2005 2006
UtilitiesIn Millions
92.3 89.7 90.9
100.4
135.0135.5 156.2
-
20
40
60
80
100
120
140
160
2002 2003 2004 2005 2006
Interest Expense on Capital Asset FinancingIn Millions
297.5333.4
382.6 357.2
477.8
390.1
560.2
-
100
200
300
400
500
600
2002 2003 2004 2005 2006
Depreciation and AmortizationIn Millions
67,513.1 69,728.2 70,603.875,416.5
79,506.9
-
10,000
20,000
30,000
40,000
50,000
60,000
70,000
80,000
2002 2003 2004 2005 2006
Full-Time Equivalent Employees(FTEs)
25.6% 26.0%
23.7%24.1% 25.2%
0%
5%
10%
15%
20%
25%
30%
2002 2003 2004 2005 2006
Fringe as a Percentage of Salaries
79%
78%
76%
87%
74%
87%
75%
70%
78%
75%
161

KEY INDICATORS OF RESERVESACTUAL 2002 THROUGH 2005
PROJECTED 2006YEAR TO DATE 2005 AND 2006 FROM MAY MONTHLY FINANCIAL REPORT
System-wide Operating Margin(Excludes Realized and Unrealized Gains and Losses)
226.1
277.8
105.2
342.2
261.3
358.2341.9
-
50
100
150
200
250
300
350
400
2002 2003 2004 2005 2006
In Millions
System-wide Operating Margin Ratio
1.5%
4.5%
3.3%
4.0%
0.0%
0.5%
1.0%
1.5%
2.0%
2.5%
3.0%
3.5%
4.0%
4.5%
5.0%
2002 2003 2004 2005
63%
81%
Normalized Annual Operating Margin Ratio
1.2
3.5
2.5
3.1
0.0
0.5
1.0
1.5
2.0
2.5
3.0
3.5
4.0
2002 2003 2004 2005
Return on Net Assets Ratio
15.1%
10.2%9.0%
-3.8%-5%
0%
5%
10%
15%
20%
2002 2003 2004 2005
Primary Reserve Ratio
42.8%
48.0% 46.9%44.7%
0%
10%
20%
30%
40%
50%
60%
2002 2003 2004 2005
Normalized Primary Reserve Ratio
3.6 3.53.4
3.2
0.0
0.5
1.0
1.5
2.0
2.5
3.0
3.5
4.0
2002 2003 2004 2005
Normalized Return on Net Assets Ratio
-1.9
5.1
7.6
4.5
-4
-2
0
2
4
6
8
10
2002 2003 2004 2005
162

-1 0 1 2 3 4 5 6 7 8 9 10
Assess institutionalviability to survive
Re-engineerthe institution
Direct institutional resourcesto allow transformation
Focus resources tocompete in future state
Allow experimentationwith new initiatives
Deploy resources toachieve a robust mission
KEY INDICATORS OF FINANCIAL HEALTH2002 THROUGH 2005
Scale for Charting CFI Performance
Composite Financial Index (CFI)
3.53.3
3.8
2.2
0.0
0.5
1.0
1.5
2.0
2.5
3.0
3.5
4.0
2002 2003 2004 2005
163

KEY INDICATORS OF CAPITAL NEEDS AND CAPACITY2002 THROUGH 2005
Actual Debt Service Coverage Ratio
8.6
5.3 5.0 5.3
0x
1x
2x
3x
4x
5x
6x
7x
8x
9x
10x
2002 2003 2004 2005
2.4
2.9
Expendable Financial Resources to Debt Ratio
1.01.1
1.2
1.5
0.0
0.5
1.0
1.5
2.0
2.5
2002 2003 2004 2005
Actual Debt Service to Operations Ratio
2.7% 2.6%2.4%
2.0%
0.0%
0.5%
1.0%
1.5%
2.0%
2.5%
3.0%
3.5%
4.0%
2002 2003 2004 2005
3.7
3.8
Normalized Expendable Financial Resources to Debt Ratio
2.4
3.5
2.6
2.9
0.0
0.5
1.0
1.5
2.0
2.5
3.0
3.5
4.0
2002 2003 2004 2005
2.4
0.7
Facilities Renewal Backlog
835.3778.1771.9
801.0
-
100
200
300
400
500
600
700
800
900
2002 2003 2004 2005
In Millions Facilities Condition Index
5.7% 5.4%5.0%
6.2%
0.0%
1.0%
2.0%
3.0%
4.0%
5.0%
6.0%
7.0%
8.0%
9.0%
10.0%
2002 2003 2004 2005
10%
5%
164

KEY INDICATORS OF RESERVES
PROJECTED 2006 YEAR-END MARGINYEAR TO DATE 2005 AND 2006 FROM JUNE MONTHLY FINANCIAL REPORT
Operating Margin by Institution(Excludes Realized and Unrealized Gains and Losses)
11.0
79.7
4.0
(2.8)
1.50.0
(0.5)
20.6
1.2
25.0
(41.6)
32.2
3.3
72.5
(3.0)
37.7
0.72.11.7
13.6
68.6
(4.0) (1.0)
18.0
0.6
30.8
92.3
(41.6)
3.5
(3.6)
(60.0)
(40.0)
(20.0)
-
20.0
40.0
60.0
80.0
100.0
ARL AUS BRW DAL ELP PA PB SA TYL SWM GMB HHS SAH MDA THC
Current MFR to date Projected year end Prior MFR to date
In Millions
Operating Margin as a Percentage of Year-end Revenue by Institution(Excludes Realized and Unrealized Gains and Losses)
3.2%
4.7%
3.1%
-1.1%
0.6%0.0%
-1.3%
5.7%
1.8% 2.0%
-2.3%
4.5%
0.6%
3.2%
-2.3%
0.3%
0.8%1.3%
4.0% 4.1%
-1.5%
-2.5%
4.9%
0.9%
2.5%
4.1%
-2.3%
0.7%
-2.7%
5.3%
-8.0%
-6.0%
-4.0%
-2.0%
0.0%
2.0%
4.0%
6.0%
8.0%
ARL AUS BRW DAL ELP PA PB SA TYL SWM GMB HHS SAH MDA THC
Current MFR to date Projected year end Prior MFR to date
In Millions
165

166
4. U. T. System: Approval to exceed the full-time equivalent limitation on employees paid from appropriated funds
RECOMMENDATION The Chancellor concurs in the recommendation of the Interim Executive Vice Chan-cellor for Academic Affairs, the Executive Vice Chancellor for Business Affairs, the Executive Vice Chancellor for Health Affairs, and the presidents of the affected U. T. System institutions that the U. T. System Board of Regents approve allowing those institutions, as set forth in the table on Page 167, to exceed the number of full-time equivalent (FTE) employees paid from appropriated funds for Fiscal Year 2007 that are authorized in Article III of the General Appropriations Act. Also, as required by Article IX, Section 6.14 of the General Appropriations Act, it is recommended that the U. T. System Board of Regents submit a request to the Governor's Office and the Legislative Budget Board to grant approval for these institutions to exceed the authorized number of FTE employees paid from appropriated funds.
BACKGROUND INFORMATION The General Appropriations Act places a limit on the number of FTE employees paid from appropriated funds that an institution may employ without written approval of the Governor and the Legislative Budget Board. To exceed the FTE limitation, a request must be submitted by the governing board and must include the date on which the board approved the request, a statement justifying the need to exceed the limitation, the source of funds to be used to pay the salaries, and an explanation as to why the functions of the proposed additional FTEs cannot be performed within current staffing levels. Detailed justification information is set forth on Pages 78 - 88 of the Supple-mental Materials (Volume 2) of the Agenda Book. U. T. Austin, U. T. Dallas, U. T. Medical Branch - Galveston, U. T. Health Science Center - Houston, U. T. Health Center - Tyler, and U. T. System Administration will be under the FTE cap and are not requesting to exceed the FTE limitation.

Faculty Staff TotalInstruction 576.7 210.2 786.9 Academic Support - 43.8 43.8 Research 134.1 173.4 307.5 Public Service 2.6 5.0 7.6 Hospitals and Clinics 85.1 766.1 851.2 Institutional Support - 324.5 324.5 Student Support - 69.3 69.3 Operations and Maintenance of Plant - 394.9 394.9 Scholarships and Fellowships - - - Total 798.5 1,987.2 2,785.7
Request to Exceed Cap - by Institution
FY 2007 Cap Faculty Staff Total U. T. Arlington 2,104.8 87.0 34.0 121.0 U. T. Austin 6,641.0 - - - *U. T. Brownsville 429.9 176.9 219.9 396.8 U. T. Dallas 1,354.8 - - - *U. T. El Paso 1,724.6 34.3 39.0 73.3 U. T. Pan American 1,445.7 52.0 73.0 125.0 U. T. Permian Basin 268.3 17.5 13.5 31.0 U. T. San Antonio 1,834.0 88.0 109.6 197.6 U. T. Tyler 419.0 32.0 30.0 62.0 Total Academic Institutions 16,222.1 487.7 519.0 1,006.7
U. T. Southwestern Medical Center 1,773.2 81.9 57.3 139.2 U. T. Medical Branch - Galveston 5,729.8 - - - *U. T. Health Science Center - Houston 1,858.1 - - - *U. T. Health Science Center - San Antonio 2,208.6 100.0 45.0 145.0 U. T. M. D. Anderson Cancer Center 10,452.4 128.9 1,365.9 1,494.8 U. T. Health Center - Tyler 919.7 - - - * Total Health Institutions 22,941.8 310.8 1,468.2 1,779.0
U. T. System Administration 249.0 - - - *
U. T. System Total 39,412.9 798.5 1,987.2 2,785.7
and U. T. System Administration will not exceed their cap.
* U. T. Austin, U. T. Dallas, U. T. Medical Branch - Galveston, U. T. HSC Houston, U. T. HC Tyler,
The University of Texas SystemRequest to Exceed Full-time Equivalent Limitation on Employees Paid From Appropriated Funds
Request to Exceed Cap - by Function
Request to Exceed Cap
Office of the Controller August 2006
167

168
5. U. T. System: Approval of Optional Retirement Program employer contribution rates for Fiscal Year 2007
RECOMMENDATION The Chancellor concurs in the recommendation of the Interim Executive Vice Chancellor for Academic Affairs, the Executive Vice Chancellor for Business Affairs, the Executive Vice Chancellor for Health Affairs, and the Vice Chancellor for Administration that the U. T. System Board of Regents approve the Optional Retirement Program (ORP) employer contribution rates for Fiscal Year 2007 as follows: a. 8.5% for all institutions and System Administration with respect to
employees who participated in the ORP prior to September 1, 1995; and b. for all other employees, an employer contribution rate as recommended by
each institution and set forth on Page 170.
BACKGROUND INFORMATION Prior to September 1, 1995, the ORP employer contribution rate was 8.5% for all ORP participants. An enactment by the 74th Texas Legislature reduced ORP employer contributions to participants from 8.5% to 6.0%, effective September 1, 1995. However, U. T. System was permitted to "grandfather" those employees participating in the ORP during the 1994-95 biennium. This resulted in a two-tiered ORP employer con-tribution rate for U. T. System employees: those who participated in ORP during the 1994-95 biennium continued to receive 8.5%, while those who did not participate during the 1994-95 biennium received 6.0%. The 78th Texas Legislature enacted Texas Government Code Section 830.2015, which expanded the definition of a grandfathered employee from one who had par-ticipated during the 1994-95 biennium to one who had participated in ORP prior to September 1, 1995. The legislation also granted permissive authority for institutions of higher education to set the ORP employer contribution rate for grandfathered and nongrandfathered participants at any percentage level between 6.0% and 8.5%. It is not required that the rate be the same for grandfathered employees, nor that the rate be the same for all U. T. System institutions. Given the diversity of the U. T. System institutions and the differential budget impact for each institution, each institutional president was asked to propose its ORP employer contribution rates for grandfathered and nongrandfathered participants. For Fiscal Year 2007, with respect to grandfathered employees hired prior to September 1, 1995, all U. T. System institutions elected to continue the current 8.5% employer contribution rate. For nongrandfathered participants hired after September 1, 1995, five institutions have elected to increase the ORP employer contribution rate from the rate established

169
by the Board for Fiscal Year 2006. U. T. Arlington has elected to increase the contri-bution rate from 6.0% to 6.5%. Four institutions (U. T. Austin, U. T. Dallas, U. T. Pan American, and U. T. Southwestern Medical Center - Dallas) have elected to increase the contribution rate from 6.5% to 7.0%. For nongrandfathered participants hired after September 1, 1995, the remaining institutions have elected to adopt the same rate adopted in the prior year. The governing board of an institution of higher education has the authority to set the ORP employer contribution rates in accordance with rules issued by the Texas Higher Education Coordinating Board. Under those rules, the governing board is to deter-mine the employer contribution rates once per year, to be effective for the entire year. All institutions plan to implement the employer contribution rates effective Septem-ber 1, 2006, with the exception of U. T. Austin. Because of the number of employees this will impact and the required analysis of each individual's tax deferrals to ensure compliance with the Internal Revenue Code, U. T. Austin proposes implementation of the new employer contribution rate change beginning with paychecks issued on or after January 1, 2007. Approval of this Agenda Item will authorize all U. T. System institutions with the exception of U. T. Austin to implement the ORP employer contribution rates on September 1, 2006, and authorize U. T. Austin to implement beginning with pay-checks issued on or after January 1, 2007.

Office of the Controller August 2006
The University of Texas System Proposed Optional Retirement Plan Contribution Rates Fiscal Year 2006 Fiscal Year 2007
Grandfathered Nongrandfathered Grandfathered Nongrandfathered U. T. Arlington 8.5% 6.0% 8.5% 6.5% U. T. Austin* 8.5% 6.5% 8.5% 7.0% U. T. Brownsville 8.5% 6.0% 8.5% 6.0% U. T. Dallas 8.5% 6.5% 8.5% 7.0% U. T. El Paso 8.5% 6.0% 8.5% 6.0% U. T. Pan American 8.5% 6.5% 8.5% 7.0% U. T. Permian Basin 8.5% 8.5% 8.5% 8.5% U. T. San Antonio 8.5% 8.5% 8.5% 8.5% U. T. Tyler 8.5% 8.5% 8.5% 8.5% U. T. Southwestern Medical Center - Dallas 8.5% 6.5% 8.5% 7.0% U. T. Medical Branch - Galveston 8.5% 8.5% 8.5% 8.5% U. T. HSC - Houston 8.5% 6.0% 8.5% 6.0% U. T. HSC - San Antonio 8.5% 6.0% 8.5% 6.0% U. T. M. D. Anderson Center 8.5% 8.5% 8.5% 8.5% U. T. Health Center - Tyler 8.5% 8.5% 8.5% 8.5% U. T. System Administration 8.5% 8.5% 8.5% 8.5% *U. T. Austin will implement 1/1/2007. Rate will continue at 6.5% from 9/1/2006-12/31/2006.
170

171
6. U. T. System Board of Regents: Adoption of a Resolution authorizing the issuance, sale, and delivery of Permanent University Fund Bonds not to exceed $400,000,000 and authorization to complete all related transactions
RECOMMENDATION The Chancellor concurs in the recommendation of the Executive Vice Chancellor for Business Affairs that the U. T. System Board of Regents a. adopt a Resolution, substantially in the form previously approved by the
Board of Regents, authorizing the issuance, sale, and delivery of Board of Regents of The University of Texas System Permanent University Fund Bonds in one or more installments in an aggregate principal amount not to exceed $400,000,000 to be used to refund certain outstanding Permanent University Fund Bonds, to refund all or a portion of the then outstanding Permanent University Fund Flexible Rate Notes, Series A, and to pay the costs of issuance; and
b. authorize appropriate officers and employees of U. T. System as set forth
in the Resolution to take any and all actions necessary to carry out the intentions of the U. T. System Board of Regents within the limitations and procedures specified therein; to make certain covenants and agreements in connection therewith; and to resolve other matters incident and related to the issuance, sale, security, and delivery of such bonds.
BACKGROUND INFORMATION Adoption of the Resolution would authorize the advance or current refunding of a portion of certain outstanding Permanent University Fund (PUF) Bonds provided the refunding exceeds a minimum present value debt service savings threshold. An advance refunding involves issuing bonds to refund outstanding bonds more than 90 days in advance of the call date whereas a current refunding involves issuing bonds to refund outstanding bonds within 90 days of the call date. Refunding bonds are issued at lower interest rates thereby producing debt service savings. Adoption of this Resolution will provide the flexibility to select the particular bonds to be refunded depending on market conditions at the time of pricing. As provided in the Resolution, the potential bonds to be refunded include the outstand-ing PUF Bonds, Series 1997, Series 2002A&B, Series 2004A&B, Series 2005A&B, and Series 2006A.

172
The Resolution would also authorize the current refunding of all or a portion of the PUF Flexible Rate Notes, Series A. The PUF Flexible Rate Note program is used to provide interim financing for PUF projects approved by the Board. Adoption of the Resolution will permit the interim financing provided through the Notes to be replaced with long-term financing. Proceeds from the Bonds related to refunding outstanding debt will be used to pur-chase U.S. government or other eligible securities to be placed in one or more escrow accounts. Proceeds from the escrowed securities will be used to redeem the refunded bonds and the refunded Flexible Rate Notes. The proposed Resolution has been reviewed by outside bond counsel and the U. T. System Office of General Counsel.
Note: The proposed Resolution is available online at http://www.utsystem.edu/bor/AgendaBook/Aug06/8-9&10-06Meetingpage.htm.
7. U. T. System Board of Regents: Adoption of Sixteenth Supplemental Res-
olution authorizing Revenue Financing System Bonds in an amount not to exceed $575,000,000; authorization to complete all related transactions; and resolution regarding parity debt
RECOMMENDATION The Chancellor concurs in the recommendation of the Executive Vice Chancellor for Business Affairs that the U. T. System Board of Regents a. adopt the Sixteenth Supplemental Resolution to the Master Resolution,
substantially in the standard form approved by the Board of Regents on November 13, 2003, authorizing the issuance, sale, and delivery of Board of Regents of The University of Texas System Revenue Financing System Bonds in one or more installments in an aggregate principal amount not to exceed $575,000,000 with a final maturity not to exceed the Year 2040 for the purpose of refunding a portion of the outstanding Revenue Financing System Commercial Paper Notes, Series A; to provide new money to fund construction and acquisition costs of projects in the Capital Improvement Program; to current or advance refund certain outstanding Revenue Financing System Bonds to produce present value debt service savings; and to pay the costs of issuance and any original issue discount;
b. authorize issuance of the Bonds and the execution of corresponding
interest rate swap transactions consistent with the U. T. System Interest Rate Swap Policy; and

173
c. authorize appropriate officers and employees of the U. T. System as set forth in the Sixteenth Supplemental Resolution to take any and all actions necessary to carry out the intentions of the U. T. System Board of Regents, within the limitations and procedures specified therein; make certain covenants and agreements in connection therewith; and resolve other matters incident and related to the issuance, sale, security, and delivery of such Bonds.
The Chancellor also concurs with the recommendation of the Executive Vice Chancellor for Business Affairs that, in compliance with Section 5 of the Amended and Restated Master Resolution Establishing The University of Texas System Revenue Financing System adopted by the U. T. System Board of Regents on February 14, 1991, amended on October 8, 1993, and August 14, 1997, and upon delivery of the Certificate of an Authorized Representative as required by Section 5 of the Master Resolution, the U. T. System Board of Regents resolve that a. sufficient funds will be available to meet the financial obligations of the
U. T. System, including sufficient Pledged Revenues as defined in the Master Resolution to satisfy the Annual Debt Service Requirements of the Financing System, and to meet all financial obligations of the Board relating to the Financing System; and
b. the institutions, which are "Members" as such term is used in the Master
Resolution, possess the financial capacity to satisfy their direct obligation as defined in the Master Resolution relating to the issuance by the U. T. System Board of Regents of tax-exempt Parity Debt.
BACKGROUND INFORMATION On February 14, 1991, the U. T. System Board of Regents adopted a Master Resolution establishing the Revenue Financing System (RFS) to create a cost-effective, System-wide financing structure for institutions of the U. T. System. Since that time, the Board has adopted 15 supplemental resolutions to provide debt financing for projects that have received the requisite U. T. System Board of Regents and Texas Higher Education Coordinating Board approvals. Adoption of the Sixteenth Supplemental Resolution (Resolution) would authorize the refunding of certain outstanding RFS Bonds provided that an advance refunding exceed a minimum 3% present value debt service savings threshold. An advance refunding involves issuing bonds to refund outstanding bonds in advance of the call date. Refund-ing bonds are issued at lower interest rates thereby producing debt service savings. Adoption of this Resolution will provide the flexibility to select the particular bonds to be refunded depending on market conditions at the time of pricing. The particular bonds to be refunded will be called for redemption on the first practical optional redemption date for each series of refunded bonds occurring after the delivery of the refunding bonds.

174
The Resolution authorizes refunding a portion of the outstanding Revenue Financing System Commercial Paper Notes, Series A, refunding certain outstanding RFS Bonds for savings, and new money to fund construction and acquisition costs of projects in the Capital Improvement Program. Generally, commercial paper debt is issued to fund projects during the construction phase and the debt is not amortized. Once construction is complete, the commercial paper is refunded with bonds. Depending on the level of interest rates at the time of pricing, outstanding commercial paper and new money for construction may be financed with long-term debt. The Resolution provides authority to execute interest rate swap agreements. The determination to utilize an interest rate swap agreement will be made based on market conditions at the time of pricing and will be in accordance with the U. T. System Interest Rate Swap Policy approved by the Board in February 2003 using standard International Swaps and Derivatives Association, Inc. (ISDA) documentation. The Chairman of the Board of Regents and the Chairman of the Finance and Planning Committee will be informed of any proposed transactions to be undertaken pursuant to the Resolution. In addition, the Resolution authorizes remarketing, tender, auction, and broker-dealer agreements customarily utilized in connection with the types of variable rate instruments authorized. The proposed Sixteenth Supplemental Resolution has been reviewed by outside bond counsel and the U. T. System Office of General Counsel. Note: The Sixteenth Supplemental Resolution and forms of auction agreement
and broker-dealer agreement are in substantially the same form as the Thirteenth through Fifteenth Supplemental Resolutions and forms of auction agreement and broker-dealer agreement previously approved by the Board on November 13, 2003, for use as standard agreements. These documents have not been included as part of the Agenda materials, but are available upon request.
8. U. T. System: Approval of aggregate amount of $108,000,000 of Revenue
Financing System Equipment Financing for Fiscal Year 2007 and resolution regarding parity debt
RECOMMENDATION The Chancellor concurs in the recommendation of the Executive Vice Chancellor for Business Affairs that the U. T. System Board of Regents a. approve an aggregate amount of $108,000,000 of Revenue Financing
System Equipment Financing as allocated to those U. T. System institu-tions as set out on Page 176; and

175
b. resolve in accordance with Section 5 of the Amended and Restated Master Resolution Establishing The University of Texas System Revenue Financing System that
• parity debt shall be issued to pay the cost of equipment including
costs incurred prior to the issuance of such parity debt;
• sufficient funds will be available to meet the financial obligations of the U. T. System, including sufficient Pledged Revenues as defined in the Master Resolution to satisfy the Annual Debt Service Requirements of the Financing System, and to meet all financial obligations of the U. T. System Board of Regents relating to the Financing System;
• the institutions and U. T. System Administration, which are "Mem-
bers" as such term is used in the Master Resolution, possess the financial capacity to satisfy their direct obligation as defined in the Master Resolution relating to the issuance by the U. T. System Board of Regents of tax-exempt parity debt in the aggregate amount of $108,000,000 for the purchase of equipment; and
• this resolution satisfies the official intent requirements set forth in
Section 1.150-2 of the Code of Federal Regulations that evidences the Board's intention to reimburse project expenditures with bond proceeds.
BACKGROUND INFORMATION At the April 14, 1994 meeting, the U. T. System Board of Regents approved the use of Revenue Financing System debt for equipment purchases in accordance with the Guidelines Governing Administration of the Revenue Financing System. The guidelines specify that the equipment to be financed must have a useful life of at least three years. The debt is amortized twice a year with full amortization not to exceed 10 years. This Agenda Item requests approval of an aggregate amount of $108,000,000 for equipment financing for Fiscal Year 2007. The U. T. System Board of Regents approved $120,011,000 of equipment financing in Fiscal Year 2006, of which $57,849,000 has been issued through June 30, 2006. Further details on the equipment to be financed and debt coverage ratios for individual institutions may be found on Page 176.

Deb
tSe
rvic
e$
Am
ount
of
Des
crip
tion
of
Cov
erag
eIn
stitu
tion
Req
uest
Expe
cted
Equ
ipm
ent P
urch
ases
Rat
io (1
)
U. T
. Arli
ngto
n$1
,000
,000
Fitn
ess
cent
er e
quip
men
t3.
3x
U. T
. Aus
tin1,
500,
000
C
lass
room
& re
sear
ch e
quip
men
t, te
chno
logy
infra
stru
ctur
e4.
6x
U. T
. Bro
wns
ville
961,
000
Sur
veill
ance
equ
ipm
ent,
polic
e ra
dio,
ther
mal
pla
nt e
quip
men
t2.
4x
U. T
. Dal
las
7,00
0,00
0In
form
atio
n re
sour
ces
proj
ects
, gen
eral
pur
pose
equ
ipm
ent
5.2x
U. T
. El P
aso
828,
000
Tech
nolo
gy in
frast
ruct
ure,
veh
icle
repl
acem
ent
1.8x
U. T
. Pan
Am
eric
an1,
605,
000
Te
chno
logy
infra
stru
ctur
e, v
ehic
le re
plac
emen
t1.
4x
U. T
. San
Ant
onio
3,50
0,00
0
Sci
entif
ic &
lab
equi
pmen
t2.
9x
U. T
. Sou
thw
este
rn M
edic
al C
ente
r - D
alla
s35
,000
,000
Clin
ical
& h
ospi
tal e
quip
men
t, in
form
atio
n re
sour
ces
proj
ects
3.5x
U. T
. Med
ical
Bra
nch
- Gal
vest
on10
,000
,000
Clin
ical
& in
form
atio
n te
chno
logy
equ
ipm
ent
2.5x
U. T
. Hea
lth S
cien
ce C
ente
r - S
an A
nton
io
16,0
00,0
00
C
yclo
tron,
rese
arch
, clin
ical
& in
form
atio
n te
chno
logy
equ
ipm
ent
2.6x
U. T
. M. D
. And
erso
n C
ance
r Cen
ter
30,0
00,0
00
R
esea
rch
& c
linic
al e
quip
men
t4.
6x
U. T
. Sys
tem
606,
000
Tech
nolo
gy in
frast
ruct
ure
NA
Tota
l$1
08,0
00,0
00
(1)
Ref
lect
s FY
200
5 ac
tual
deb
t ser
vice
cov
erag
e ra
tio.
U. T
. Sys
tem
Offi
ce o
f Fin
ance
, Jun
e 19
, 200
6
AP
PR
OV
AL
OF
U. T
. SY
STE
M E
QU
IPM
EN
T FI
NA
NC
ING
FY
200
7
176

177
9. U. T. System Board of Regents: Investments Report for the quarter ended May 31, 2006, and The University of Texas Investment Management Com-pany (UTIMCO) Performance Summary Report
REPORT
The Investments Report for the quarter ended May 31, 2006, is set forth on Pages 178 - 182. The items as presented reflect changes to policy portfolio hedge fund benchmark performance effective January 1, 2006, pending approval as discussed and considered in Item 13 on Pages 44 - 51. Item I on Page 178 reports activity for the Permanent University Fund (PUF) investments. The PUF's net investment return for the quarter end was 1.84% versus its composite benchmark return of 1.45%. The PUF's net asset value increased by $230.3 million since the beginning of the quarter to $10,028.9 million. This change in net asset value includes increases due to contributions from PUF land receipts and net investment return. Item II on Page 179 reports activity for the General Endowment Fund (GEF) investments. The GEF's net investment return for the quarter was 1.87% versus its composite benchmark return of 1.45%. The GEF's net asset value increased during the quarter to $5,330.8 million. Item III on Page 180 reports activity for the Intermediate Term Fund (ITF). The ITF was implemented on February 1, 2006. The ITF's net investment return for the quarter was .68% versus its composite benchmark return of .21%. The ITF's net asset value increased during the quarter to $2,988.8 largely due to net contributions. Item IV on Page 181 presents book and market value of cash, debt, equity, and other securities held in funds outside of internal investment pools. Total cash and equiva-lents, consisting primarily of institutional operating funds held in the Dreyfus money market fund, increased by $282.2 million to $1,460.1 million during the three months since the last reporting period. Market values for the remaining asset types were debt securities: $45.7 million versus $46.4 million at the beginning of the period; equities: $82.4 million versus $81.6 million at the beginning of the period; and other investments: $.3 million versus $105.7 million at the beginning of the period. The May 31, 2006, UTIMCO Performance Summary Report is attached on Page 182.
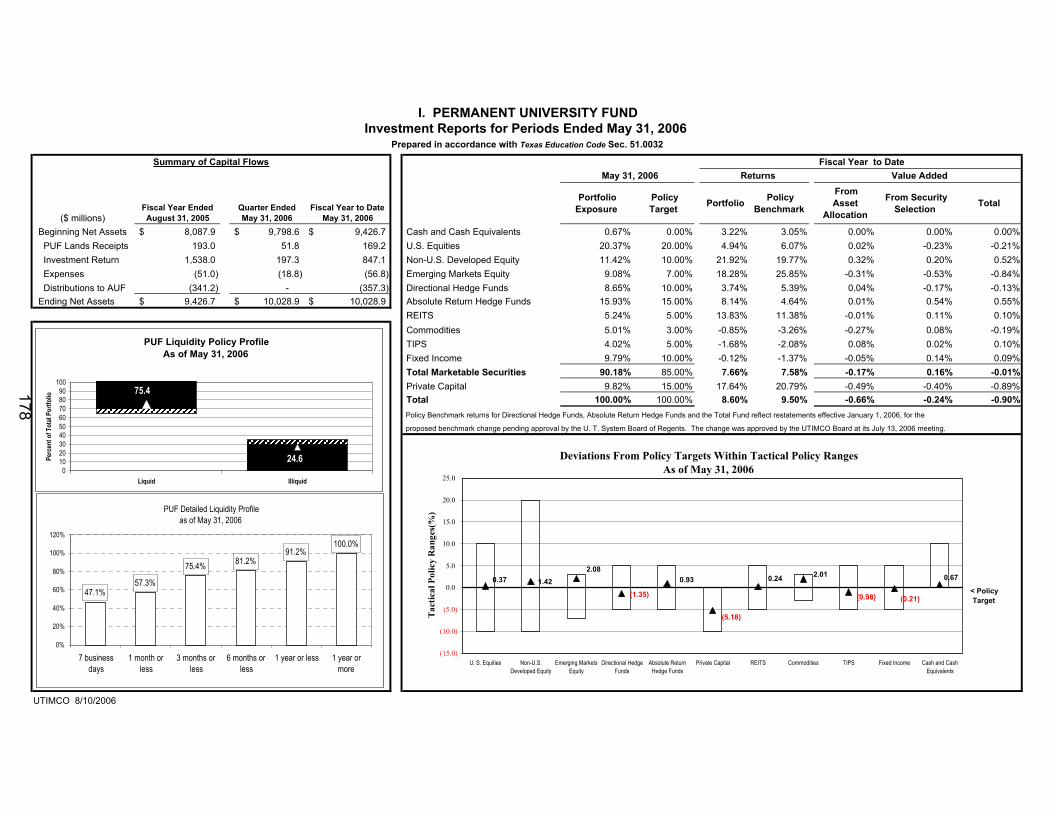
I. PERMANENT UNIVERSITY FUNDInvestment Reports for Periods Ended May 31, 2006
Prepared in accordance with Texas Education Code Sec. 51.0032
Summary of Capital Flows Fiscal Year to Date May 31, 2006 Returns Value Added
($ millions)Fiscal Year Ended August 31, 2005
Quarter Ended May 31, 2006
Fiscal Year to Date May 31, 2006
Portfolio Exposure
Policy Target Portfolio Policy
Benchmark
From Asset
Allocation
From Security Selection Total
Beginning Net Assets 8,087.9$ 9,798.6$ 9,426.7$ Cash and Cash Equivalents 0.67% 0.00% 3.22% 3.05% 0.00% 0.00% 0.00% PUF Lands Receipts 193.0 51.8 169.2 U.S. Equities 20.37% 20.00% 4.94% 6.07% 0.02% -0.23% -0.21% Investment Return 1,538.0 197.3 847.1 Non-U.S. Developed Equity 11.42% 10.00% 21.92% 19.77% 0.32% 0.20% 0.52% Expenses (51.0) (18.8) (56.8) Emerging Markets Equity 9.08% 7.00% 18.28% 25.85% -0.31% -0.53% -0.84% Distributions to AUF (341.2) - (357.3) Directional Hedge Funds 8.65% 10.00% 3.74% 5.39% 0.04% -0.17% -0.13% Ending Net Assets 9,426.7$ 10,028.9$ 10,028.9$ Absolute Return Hedge Funds 15.93% 15.00% 8.14% 4.64% 0.01% 0.54% 0.55%
REITS 5.24% 5.00% 13.83% 11.38% -0.01% 0.11% 0.10%Commodities 5.01% 3.00% -0.85% -3.26% -0.27% 0.08% -0.19%TIPS 4.02% 5.00% -1.68% -2.08% 0.08% 0.02% 0.10%Fixed Income 9.79% 10.00% -0.12% -1.37% -0.05% 0.14% 0.09%Total Marketable Securities 90.18% 85.00% 7.66% 7.58% -0.17% 0.16% -0.01%Private Capital 9.82% 15.00% 17.64% 20.79% -0.49% -0.40% -0.89%Total 100.00% 100.00% 8.60% 9.50% -0.66% -0.24% -0.90%Policy Benchmark returns for Directional Hedge Funds, Absolute Return Hedge Funds and the Total Fund reflect restatements effective January 1, 2006, for the
proposed benchmark change pending approval by the U. T. System Board of Regents. The change was approved by the UTIMCO Board at its July 13, 2006 meeting.
UTIMCO 8/10/2006
PUF Liquidity Policy ProfileAs of May 31, 2006
24.6
75.4
0102030405060708090
100
Liquid Illiquid
Perc
ent o
f Tot
al Po
rtfol
io
PUF Detailed Liquidity Profileas of May 31, 2006
47.1%57.3%
75.4% 81.2%91.2%
100.0%
0%
20%
40%
60%
80%
100%
120%
7 businessdays
1 month orless
3 months orless
6 months orless
1 year or less 1 year ormore
Deviations From Policy Targets Within Tactical Policy RangesAs of May 31, 2006
1.420.37 0.93
(1.35)
2.010.24 0.67
(0.21)(0.98)
(5.18)
2.08
(15.0)
(10.0)
(5.0)
0.0
5.0
10.0
15.0
20.0
25.0
U. S. Equities Non-U.S.Developed Equity
Emerging MarketsEquity
Directional HedgeFunds
Absolute ReturnHedge Funds
Private Capital REITS Commodities TIPS Fixed Income Cash and CashEquivalents
Tact
ical
Pol
icy
Ran
ges(
%)
< Policy Target
178

II. GENERAL ENDOWMENT FUNDInvestment Reports for Periods Ended May 31, 2006
Prepared in accordance with Texas Education Code Sec. 51.0032
Summary of Capital Flows Fiscal Year to Date May 31, 2006 Returns Value Added
($ millions)Fiscal Year Ended August 31, 2005
Quarter Ended May 31, 2006
Fiscal Year to Date May 31, 2006
Portfolio Exposure
Policy Target Portfolio Policy
Benchmark
From Asset
Allocation
From Security Selection
Total
Beginning Net Assets 4,207.6$ 5,228.5$ 4,926.8$ Cash and Cash Equivalents 0.00% 0.00% 3.22% 3.05% 0.03% 0.00% 0.03% Contributions 139.2 59.3 246.5 U.S. Equities 19.73% 20.00% 5.26% 6.07% -0.04% -0.16% -0.20% Withdrawals (4.7) (0.2) (105.7) Non-U.S. Developed Equity 11.32% 10.00% 21.62% 19.77% 0.31% 0.17% 0.48% Distributions (206.4) (55.1) (164.6) Emerging Markets Equity 8.85% 7.00% 17.81% 25.85% -0.35% -0.56% -0.91% Investment Return 814.2 106.1 453.9 Directional Hedge Funds 8.63% 10.00% 3.64% 5.39% 0.04% -0.18% -0.14% Expenses (23.1) (7.8) (26.1) Absolute Return Hedge Funds 16.33% 15.00% 8.07% 4.64% 0.01% 0.52% 0.53% Ending Net Assets 4,926.8$ 5,330.8$ 5,330.8$ REITS 5.12% 5.00% 13.86% 11.38% -0.03% 0.12% 0.09%
Commodities 5.00% 3.00% -0.82% -3.26% -0.26% 0.08% -0.18%TIPS 4.02% 5.00% -1.69% -2.08% 0.09% 0.02% 0.11%Fixed Income 9.92% 10.00% 0.15% -1.37% -0.05% 0.17% 0.12%Total Marketable Securities 88.92% 85.00% 7.62% 7.58% -0.25% 0.18% -0.07%Private Capital 11.08% 15.00% 16.66% 20.79% -0.35% -0.54% -0.89%Total 100.00% 100.00% 8.54% 9.50% -0.60% -0.36% -0.96%Policy Benchmark returns for Directional Hedge Funds, Absolute Return Hedge Funds and the Total Fund reflect restatements effective January 1, 2006, for the
proposed benchmark change pending approval by the U. T. System Board of Regents. The change was approved by the UTIMCO Board at its July 13, 2006 meeting.
UTIMCO 8/10/2006
GEF Liquidity Policy ProfileAs of May 31, 2006
26.1
73.9
0102030405060708090
100
Liquid Illiquid
Perc
ent o
f Tot
al Po
rtfol
io
Deviations From Policy Targets Within Tactical Policy Ranges As of May 31, 2006
(0.98)(3.92)
(0.08)
0.000.12
2.001.33
(1.37)
1.85
(0.27)
1.32
(15.0)
(10.0)
(5.0)
0.0
5.0
10.0
15.0
20.0
25.0
U. S. Equities Non-U.S.Developed
Equity
EmergingMarkets Equity
DirectionalHedge Funds
Absolute ReturnHedge Funds
Private Capital REITS Commodities TIPS Fixed Income Cash and CashEquivalents
Tac
tical
Pol
icy
Ran
ges
(%)
< Policy Target
GEF Detailed Liquidity Profile as of May 31, 2006
44.9%55.6%
73.9% 80.6%91.1%
100.0%
0%
20%
40%
60%
80%
100%
120%
7 businessdays
1 month orless
3 months orless
6 months orless
1 year or less 1 year or more
179

III. INTERMEDIATE TERM FUNDInvestment Reports for Periods Ended May 31, 2006
Prepared in accordance with Texas Education Code Sec. 51.0032
Summary of Capital Flows Four Months Ended May 31, 2006 May 31, 2006 Returns Value Added
($ millions)Quarter Ended May 31, 2006
Inception to Date
Portfolio Exposure
Policy Target Portfolio Policy
Benchmark
From Asset
Allocation
From Security Selection
Total
Beginning Net Assets 2,920.0$ -$ Cash and Cash Equivalents 1.16% 0.00% 1.54% 1.49% -0.02% 0.00% -0.02% Contributions 134.0 3,064.9 U.S. Equities 13.89% 15.00% 0.22% -0.28% 0.01% 0.08% 0.09% Withdrawals (62.2) (62.2) Non-U.S. Developed Equity 4.90% 5.00% 4.05% 3.80% 0.01% 0.01% 0.02% Distributions (22.8) (30.1) Emerging Markets Equity 4.95% 5.00% -4.90% 3.37% -0.02% -0.09% -0.11% Investment Return 26.3 23.0 Directional Hedge Funds 10.37% 12.50% 0.23% 1.54% -0.03% -0.16% -0.19% Expenses (6.5) (6.8) Absolute Return Hedge Funds 13.96% 12.50% 3.42% 1.54% 0.04% 0.23% 0.27% Ending Net Assets 2,988.8$ 2,988.8$ REITS 10.00% 10.00% 2.08% 0.67% -0.02% 0.13% 0.11%
Commodities 5.62% 5.00% 0.01% 0.82% 0.01% -0.04% -0.03%TIPS 10.13% 10.00% -1.59% -2.04% -0.01% 0.05% 0.04%Fixed Income 25.02% 25.00% 0.17% -0.94% -0.02% 0.28% 0.26%Total 100.00% 100.00% 0.57% 0.13% -0.05% 0.49% 0.44%Policy Benchmark returns for Directional Hedge Funds, Absolute Return Hedge Funds and the Total Fund reflect restatements effective January 1, 2006, for the
proposed benchmark change pending approval by the U. T. System Board of Regents. The change was approved by the UTIMCO Board at its July 13, 2006 meeting.
UTIMCO 8/10/2006
ITF Liquidity Policy ProfileAs of May 31, 2006
Deviations From Policy Targets Within Tactical Policy RangesAs of May 31, 2006
0.020.00
(1.11)
(0.10)
(0.05) 1.160.62
0.13
(2.13)
1.46
(15.0)
(10.0)
(5.0)
0.0
5.0
10.0
15.0
20.0
25.0
U. S. Equities Non-U.S.Developed Equity
Emerging MarketsEquity
Directional HedgeFunds
Absolute ReturnHedge Funds
REITS Commodities TIPS Fixed Income Cash and CashEquivalents
Tac
tical
Pol
icy
Ran
ges(
%)
< Policy Target
13.3
86.7
0102030405060708090
100
Liquid Illiquid
Perc
ent o
f Tot
al Po
rtfol
io
ITF Detailed Liquidity Profile as of May 31, 2006
66.3% 73.5%86.7% 88.0% 95.0% 100.0%
0%
20%
40%
60%
80%
100%
120%
7 businessdays
1 month orless
3 monthsor less
6 monthsor less
1 year orless
1 year ormore
180

IV. SEPARATELY INVESTED ASSETS
Summary Investment Report at May 31, 2006
Report prepared in accordance with Texas Education Code Sec. 51.0032.
($ thousands)
FUND TYPE
CURRENT PURPOSE ENDOWMENT & ANNUITY & LIFE TOTAL EXCLUDING OPERATING FUNDS
DESIGNATED RESTRICTED SIMILAR FUNDS INCOME FUNDS AGENCY FUNDS OPERATING FUNDS (SHORT TERM FUND) TOTAL
ASSET TYPES
Cash & Equivalents: BOOK MARKET BOOK MARKET BOOK MARKET BOOK MARKET BOOK MARKET BOOK MARKET BOOK MARKET BOOK MARKET
Beginning value 2/28/06 4,492 4,492 2,861 2,861 82,665 82,665 792 792 2,288 2,288 93,098 93,098 1,084,812 1,084,812 1,177,910 1,177,910 Increase/(Decrease) (2,902) (2,902) 3,249 3,249 (35,236) (35,236) (124) (124) 1,062 1,062 (33,951) (33,951) 316,122 316,122 282,171 282,171 Ending value 5/31/06 1,590 1,590 6,110 6,110 47,429 47,429 668 668 3,350 3,350 59,147 59,147 1,400,934 1,400,934 1,460,081 1,460,081
Debt Securities:
Beginning value 2/28/06 - - 263 212 29,878 29,543 16,599 16,668 - - 46,740 46,423 - - 46,740 46,423 Increase/(Decrease) - - - 17 (1) (309) (2) (412) - - (3) (704) - - (3) (704) Ending value 5/31/06 - - 263 229 29,877 29,234 16,597 16,256 - - 46,737 45,719 - - 46,737 45,719
Equity Securities:
Beginning value 2/28/06 27 7,364 3,409 3,135 36,879 44,313 21,577 26,836 - - 61,892 81,648 - - 61,892 81,648 Increase/(Decrease) - (1,123) 2,374 2,380 167 (332) (149) (154) - - 2,392 771 - - 2,392 771 Ending value 5/31/06 27 6,241 5,783 5,515 37,046 43,981 21,428 26,682 - - 64,284 82,419 - - 64,284 82,419
Other:
Beginning value 2/28/06 105,487 105,487 139 139 1 1 239 105 - - 105,866 105,732 - - 105,866 105,732 Increase/(Decrease) (105,487) (105,487) 38 38 1 1 12 - - - (105,436) (105,448) - - (105,436) (105,448) Ending value 5/31/06 - - 177 177 2 2 251 105 - - 430 284 - - 430 284
Total Assets:
Beginning value 2/28/06 110,006 117,343 6,672 6,347 149,423 156,522 39,207 44,401 2,288 2,288 307,596 326,901 1,084,812 1,084,812 1,392,408 1,411,713 Increase/(Decrease) (108,389) (109,512) 5,661 5,684 (35,069) (35,876) (263) (690) 1,062 1,062 (136,998) (139,332) 316,122 316,122 179,124 176,790 Ending value 5/31/06 1,617 7,831 12,333 12,031 114,354 120,646 38,944 43,711 3,350 3,350 170,598 187,569 1,400,934 1,400,934 1,571,532 1,588,503
Details of individual assets by account furnished upon request.
UTIMCO 8/10/2006
181

UTIMCO Performance Summary(Preliminary Benchmarks Contingent upon U. T. System Board of Regents' Approval)
May 31, 2006
Periods Ended May 31, 2006Net (Returns for Periods Longer Than One Year are Annualized)
Asset Value Calendar Fiscal5/31/2006 One Three Year Six Year One Two Three Four Five Ten
ENDOWMENT FUNDS (in Millions) Month Months To Date Months To Date Year Years Years Years Years YearsPermanent University Fund 10,028.9$ (1.33) 1.84 4.70 6.64 8.60 14.62 14.01 15.98 11.14 8.31 9.60General Endowment Fund (1.24) 1.87 4.78 6.71 8.55 14.49 13.94 16.00 11.26 8.60 N/APermanent Health Fund 974.0 (1.26) 1.84 4.78 6.68 8.49 14.40 13.86 15.86 11.14 8.48 N/ALong Term Fund 4,356.8 (1.26) 1.84 4.79 6.68 8.50 14.41 13.86 15.88 11.17 8.52 10.08Separately Invested Funds 187.5 N/A N/A N/A N/A N/A N/A N/A N/A N/A N/A N/A
Total Endowment Funds 15,547.2 OPERATING FUNDS
Short Term Fund 1,400.9 0.42 1.20 1.91 2.26 3.22 4.06 3.01 2.34 2.14 2.28 3.98Intermediate Term Fund 2,988.8 (1.52) 0.68 N/A N/A N/A N/A N/A N/A N/A N/A N/A
Total Operating Funds 4,389.7
Total Investments 19,936.9$
BENCHMARKS (1)(2)Permanent University Fund: Policy Portfolio (1.84) 1.45 5.17 6.96 9.50 14.10 13.04 13.57 9.37 6.39 10.18General Endowment Fund: Policy Portfolio (1.84) 1.45 5.17 6.96 9.50 14.10 13.04 13.57 9.37 6.40 9.92Short Term Fund: 90 Day Treasury Bills Average Yield 0.40 1.16 1.80 2.13 3.05 3.83 2.90 2.28 2.10 2.23 3.82Intermediate Term Fund: Policy Portfolio (1.75) 0.21 N/A N/A N/A N/A N/A N/A N/A N/A N/A
VALUE ADDED (3)Permanent University Fund 0.51 0.39 (0.47) (0.32) (0.89) 0.52 0.97 2.41 1.76 1.92 (0.58)General Endowment Fund 0.59 0.41 (0.39) (0.25) (0.95) 0.39 0.90 2.43 1.88 2.21 N/APermanent Health Fund 0.58 0.39 (0.39) (0.28) (1.01) 0.30 0.82 2.29 1.77 2.08 N/ALong Term Fund 0.58 0.39 (0.38) (0.28) (0.99) 0.31 0.83 2.30 1.79 2.12 0.16Short Term Fund 0.01 0.04 0.10 0.13 0.18 0.23 0.11 0.06 0.04 0.05 0.16Intermediate Term Fund 0.23 0.48 N/A N/A N/A N/A N/A N/A N/A N/A N/A
(1) - Effective May 6, 2004, benchmark returns for the PUF policy portfolio have been restated for prior periods beginning June 1, 1993 through September 30, 2000 and for the GEF/LTF policy portfolio for prior periods beginning June 1, 1993 through September 30, 2001 to correct the following technical errors in benchmark construction and calculation: (a) to reflect actual asset class target allocations which were in place, or the practical implementation of changes to those policy allocations, and (b) to distinguish between PUF and GEF/LTF historical investment objectives and distribution policies by accurately representing actual asset class allocations during those periods.
Benchmark returns for the PUF and GEF/LTF policy portfolios were also restated for all prior periods beginning June 1, 1993 through December 31, 2003 to replace various benchmark returns reported previously for the Private Capital asset class. Specifically, the Wilshire 5000 + 4%, the benchmark used prior to January 1, 2004, was replaced with the Venture Economics Periodic IRR Index, a more appropriate benchmark measure for the actual Private Capital portfolio.
Complete details of the restatement and previous policy portfolio benchmark history are documented on the UTIMCO website at www.UTIMCO.org or are available upon request.
(3) - Value added is a measure of the difference between actual returns and benchmark or policy portfolio returns for each period shown. Value added is a result of the active management decisions made by UTIMCO staff and external managers.
(2) Benchmark returns for the PUF, GEF and ITF policy portfolios reflect restatements effective January 1, 2006, for the proposed Hedge Fund benchmark change pending approval by the U. T. System Board of Regents. The change was approved by the UTIMCO Board at its July 13, 2006 meeting.
UTIMCO 8/10/2006
182