table of contents for finance and … of contents for finance and planning committee ... 1,684.4...
TRANSCRIPT

TABLE OF CONTENTSFOR
FINANCE AND PLANNING COMMITTEE
Committee Meeting: 5/11/2016
Board Meeting: 5/12/2016 Austin, Texas
R. Steven Hicks, ChairmanDavid J. BeckWallace L. Hall, Jr.Jeffery D. HildebrandSara Martinez Tucker
Committee Meeting
Board Meeting
Page
Convene 2:45 p.m.Chairman Hicks
1. U. T. System Board of Regents: Discussion and appropriate action regarding Consent Agenda items, if any, assigned for Committee consideration
3:00 p.m.Discussion Action 67
2. U. T. System: Key Financial Indicators Report and Monthly Financial Report
3:05 p.m.Report/DiscussionDr. Kelley
Not on Agenda
68
3. U. T. System Board of Regents: Report on activities of the University Lands Advisory Board
3:15 p.m. Report/DiscussionRegent CranbergMr. Houser
Not on Agenda
102
4. U. T. System Board of Regents: Adoption of a Supplemental Resolution authorizing the issuance, sale, and delivery of Revenue Financing System Bonds and authorization to complete all related transactions
3:30 p.m.ActionMr. Hull
Action 103
5. U. T. System Board of Regents: The University of Texas Investment Management Company (UTIMCO) Performance Summary Report and Investment Reports for the quarter ended February 29, 2016
3:35 p.m.Report/DiscussionMr. Zimmerman
Report 105
6. U. T. System Board of Regents: Approval of annual distributions from the Permanent University Fund, the Permanent Health Fund, the Long Term Fund, and the Intermediate Term Fund
3:50 p.m.ActionDr. Kelley
Action 111
Adjourn 3:45 p.m.
May 11-12, 2016 Meeting of the U. T. System Board of Regents - Finance and Planning Committee
Agenda Book - 66

1. U. T. System Board of Regents: Discussion and appropriate action regarding Consent Agenda items, if any, assigned for Committee consideration
RECOMMENDATION
The proposed Consent Agenda is located at the back of the book. Consent Agenda itemsassigned to this Committee are on Pages 264 - 269.
May 11-12, 2016 Meeting of the U. T. System Board of Regents - Finance and Planning Committee
Agenda Book - 67

2. U. T. System: Key Financial Indicators Report and Monthly Financial Report
REPORT
Dr. Scott C. Kelley, Executive Vice Chancellor for Business Affairs, will discuss the KeyFinancial Indicators Report, as set forth on Pages 69 - 76 and the March Monthly FinancialReport on Pages 77 - 101. The reports represent the consolidated and individual operatingdetail of the U. T. System institutions.
The Key Financial Indicators Report compares the Systemwide quarterly results of operations,key revenues and expenses, reserves, and key financial ratios in a graphical presentation fromFiscal Year 2012 through February 2016. Ratios requiring balance sheet data are provided forFiscal Year 2011 through Fiscal Year 2015.
May 11-12, 2016 Meeting of the U. T. System Board of Regents - Finance and Planning Committee
Agenda Book - 68

THE UNIVERSITY OF TEXAS SYSTEM
KEY FINANCIAL INDICATORS REPORT
FEBRUARY 2016
U. T. System Office of the Controller May 2016
May 11-12, 2016 Meeting of the U. T. System Board of Regents - Finance and Planning Committee
Agenda Book - 69

Actual Annual Amounts(SOURCE: Annual Financial Reports)
Projected Amounts based on the average change of the previous three years of data
Monthly Financial Report Year-to-Date Amounts
Annual and Quarterly Average of FTEs(SOURCE: State Auditor's Office Quarterly FTE Report)
Year-to-Date Margin(SOURCE: Monthly Financial Report)
Projected Amounts based on Monthly Financial Report
Year-to-Date Margin(SOURCE: Monthly Financial Report)
Target Normalized Rates
Aaa Median(SOURCE: Moody's)
A2 Median(SOURCE: Moody's)
KEY
U. T. System Office of the Controller May 2016
May 11-12, 2016 Meeting of the U. T. System Board of Regents - Finance and Planning Committee
Agenda Book - 70

PROJECTED 2016
KEY INDICATORS OF REVENUESACTUAL 2012 THROUGH 2015
YEAR-TO-DATE 2015 AND 2016 FROM FEBRUARY MONTHLY FINANCIAL REPORT
-
1,000
2,000
3,000
4,000
5,000
6,000
7,000
8,000
12 13 14 15 16
3,275.5 3,535.5
5,369.4 5,778.4
6,158.0
6,749.3 7,132.6
Clinical RevenuesIn Millions
50%49%
-
500
1,000
1,500
2,000
2,500
3,000
3,500
12 13 14 15 16
1,529.1 1,730.4
3,097.3 3,242.1
3,065.3 3,232.0
3,459.6 Sponsored Programs
In Millions
-
2,000
4,000
6,000
8,000
10,000
12,000
14,000
16,000
18,000
12 13 14 15 16
8,134.8 8,760.0
14,339.6 15,060.1
16,102.1 16,878.6
17,174.9 Total RevenuesIn Millions
51%48%
-
300
600
900
1,200
1,500
1,800
12 13 14 15 16
761.0 816.1
1,393.2 1,401.8 1,504.5
1,565.2 1,632.3
Tuition and FeesIn Millions
-
200
400
600
800
1,000
1,200
12 13 14 15 16
594.4 620.7
826.3 887.6
960.4 1,037.0
1,074.8
Auxiliary Enterprises andSales and Services of Educational
Activities
In Millions
-
200
400
600
800
1,000
1,200
1,400
1,600
1,800
12 13 14 15 16
501.7 459.4
1,290.9 1,263.8
1,662.2
1,348.8
722.5
Investment Income(Excludes Realized and Unrealized Gains and Losses)
In Millions
-
50
100
150
200
250
300
350
400
450
500
12 13 14 15 16
260.4 230.1 331.8
445.3
414.2
475.9
408.4
Gift Contributions for OperationsIn Millions
55% 56%
50%
47%57%
37%
50%
49%
64%
-
500
1,000
1,500
2,000
2,500
12 13 14 15 16
1,012.8 1,133.0
1,936.4 1,846.8
2,062.4 2,096.5 2,236.9
State Appropriations andHigher Education Assistance Fund
In Millions
51%48%
58%
U. T. System Office of the Controller May 2016
May 11-12, 2016 Meeting of the U. T. System Board of Regents - Finance and Planning Committee
Agenda Book - 71
PROJECTED 2016
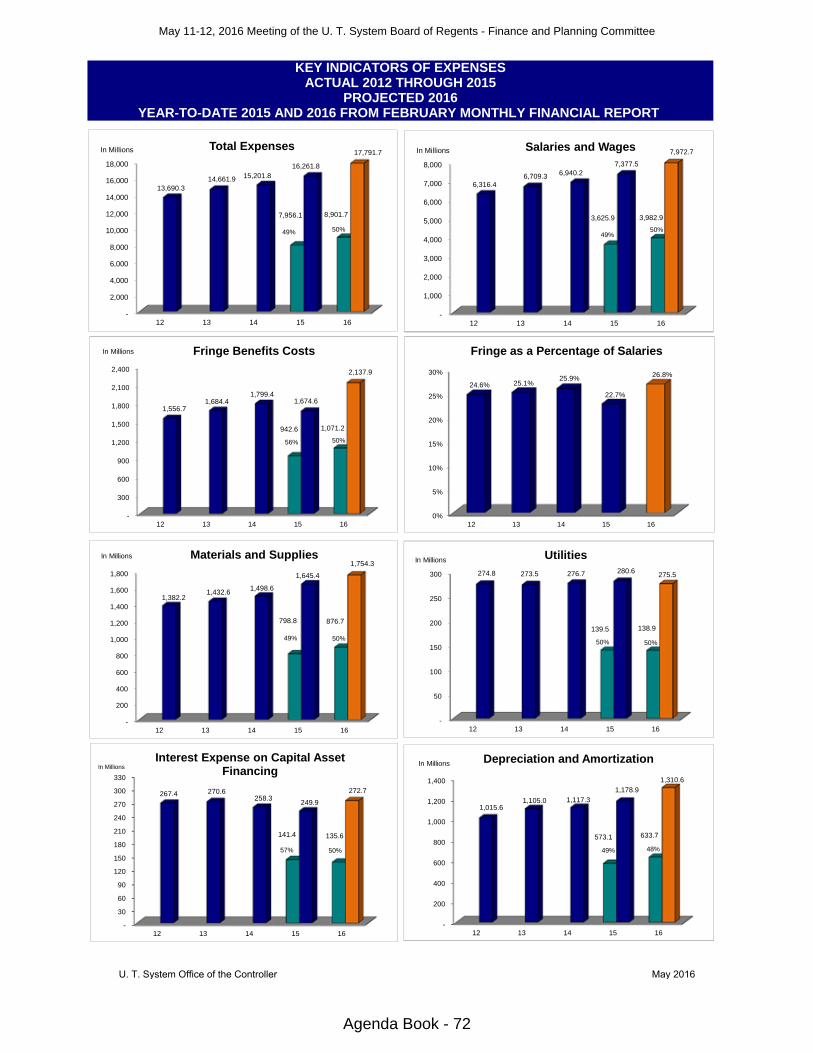
KEY INDICATORS OF EXPENSESACTUAL 2012 THROUGH 2015
YEAR-TO-DATE 2015 AND 2016 FROM FEBRUARY MONTHLY FINANCIAL REPORT
-
300
600
900
1,200
1,500
1,800
2,100
2,400
12 13 14 15 16
942.6 1,071.2
1,556.7 1,684.4
1,799.4 1,674.6
2,137.9
Fringe Benefits CostsIn Millions
50%
-
200
400
600
800
1,000
1,200
1,400
1,600
1,800
12 13 14 15 16
798.8 876.7
1,382.2 1,432.6
1,498.6
1,645.4
1,754.3 Materials and SuppliesIn Millions
-
50
100
150
200
250
300
12 13 14 15 16
139.5 138.9
274.8 273.5 276.7 280.6 275.5
UtilitiesIn Millions
-
30
60
90
120
150
180
210
240
270
300
330
12 13 14 15 16
141.4 135.6
267.4 270.6 258.3
249.9
272.7
Interest Expense on Capital Asset FinancingIn Millions
-
200
400
600
800
1,000
1,200
1,400
12 13 14 15 16
573.1 633.7
1,015.6 1,105.0 1,117.3
1,178.9
1,310.6
Depreciation and AmortizationIn Millions
0%
5%
10%
15%
20%
25%
30%
12 13 14 15 16
24.6% 25.1%25.9%
22.7%
26.8%
Fringe as a Percentage of Salaries
50%49%50% 50%
57% 50% 49% 48%
56%
-
2,000
4,000
6,000
8,000
10,000
12,000
14,000
16,000
18,000
12 13 14 15 16
7,956.1 8,901.7
13,690.3 14,661.9 15,201.8
16,261.8
17,791.7 Total ExpensesIn Millions
50%49%
-
1,000
2,000
3,000
4,000
5,000
6,000
7,000
8,000
12 13 14 15 16
3,625.9 3,982.9
6,316.4 6,709.3 6,940.2
7,377.5
7,972.7 Salaries and WagesIn Millions
50%49%
U. T. System Office of the Controller May 2016
May 11-12, 2016 Meeting of the U. T. System Board of Regents - Finance and Planning Committee
Agenda Book - 72

KEY INDICATORS OF RESERVESACTUAL 2011 THROUGH 2015
PROJECTED 2016YEAR-TO-DATE 2015 AND 2016 FROM FEBRUARY MONTHLY FINANCIAL REPORT
178.7
(141.7)
649.3
398.2
900.3
616.8
(616.8) (800)
(600)
(400)
(200)
-
200
400
600
800
1,000
12 13 14 15 16
Systemwide Operating Margin(Excludes Realized and Unrealized Gains and Losses)
In Millions
5.2%
4.5%
2.6%
5.6%
3.7%
0.0%
1.0%
2.0%
3.0%
4.0%
5.0%
6.0%
11 12 13 14 15
Systemwide Operating Margin Ratio
29%
23%
4.0
3.5
2.0
4.3
2.8
0.0
0.5
1.0
1.5
2.0
2.5
3.0
3.5
4.0
4.5
5.0
11 12 13 14 15
Normalized Annual Operating Margin Ratio
13.9%
9.7% 10.8%
21.9%
-6.5%-10%
-5%
0%
5%
10%
15%
20%
25%
11 12 13 14 15
Return on Net Position Ratio
57.3% 56.0% 55.4%60.0%
37.6%
0%
10%
20%
30%
40%
50%
60%
70%
11 12 13 14 15
Primary Reserve Ratio
4.3 4.2 4.24.5
2.8
0.0
0.5
1.0
1.5
2.0
2.5
3.0
3.5
4.0
4.5
5.0
11 12 13 14 15
Normalized Primary Reserve Ratio
7.0
4.9 5.4
11.0
-3.3
-6
-4
-2
0
2
4
6
8
10
12
11 12 13 14 15
Normalized Return on Net Position Ratio
U. T. System Office of the Controller May 2016
May 11-12, 2016 Meeting of the U. T. System Board of Regents - Finance and Planning Committee
Agenda Book - 73

KEY INDICATORS OF CAPITAL NEEDS AND CAPACITY2011 THROUGH 2015
*For FY 2011 through 2014 the source of backlog data is the Facilities' Renewal Model (FRRM) and those systems that have exceeded their Life Cycle Age. Beginning in FY 2015, the deferred maintenance data is taken from the new annual BOR Campus Condition Report and the facilities' executives assessment of those systems that have failed or will fail within the current budget cycle (within one year).
Note: Line between FY 2014 and 2015 indicates a change in the source data.
Note: Line between FY 2014 and 2015 indicates a change in the source data.
0.0
0.5
1.0
1.5
2.0
2.5
3.0
11 12 13 14 15
2.4 2.4 2.42.6
1.7
Normalized Expendable Financial Resources to Debt Ratio
0.0%
0.5%
1.0%
1.5%
2.0%
2.5%
3.0%
3.5%
4.0%
4.5%
11 12 13 14 15
3.4%3.2%
3.5%
4.2%
1.8%
Facilities Condition Index
0.0%
1.0%
2.0%
3.0%
4.0%
5.0%
6.0%
7.0%
11 12 13 14 15
3.8% 3.8%3.6% 3.6% 3.5%
Actual Debt Service to Operations Ratio
3.6%
6.3%
0.0
0.5
1.0
1.5
2.0
2.5
3.0
3.5
4.0
4.5
5.0
11 12 13 14 15
3.9 3.8 3.9 4.2
4.7
Actual Debt Service Coverage Ratio
1.9
3.3
-
200
400
600
800
1,000
1,200
1,400
1,600
11* 12* 13* 14* 15
1,003.7 1,031.0
1,204.7
1,470.4
693.6
Facilities Renewal Backlog FY11-FY14and Deferred Maintenance FY15
In Millions
0.0
0.5
1.0
1.5
2.0
2.5
11 12 13 14 15
1.0 1.0 1.0 1.1
0.7
Expendable Financial Resources to Debt Ratio
2.4
0.4
U. T. System Office of the Controller May 2016
May 11-12, 2016 Meeting of the U. T. System Board of Regents - Finance and Planning Committee
Agenda Book - 74

-4 -3 -2 -1 0 1 2 3 4 5 6 7 8 9 10
Consider whether financialexigency is appropriate
With likely large liquidity and debt compliance issues, consider structuredprograms to conserve cash
Assess debt and Departmentof Education compliance andremediation issues
Consider substantiveprogrammatic adjustments
Re-engineerthe institution
Direct institutional resources to allow transformation
Focus resources to compete in future state
Allow experimentation with new initiatives
Deploy resources to achieve a robust mission
Source: Strategic Financial Analysis for Higher Education, Seventh Edition
Scale for Charting CFI Performance
KEY INDICATORS OF FINANCIAL HEALTH2011 THROUGH 2015
0.0
1.0
2.0
3.0
4.0
5.0
6.0
11 12 13 14 15
4.1
3.6 3.6
5.1
1.2
Composite Financial Index (CFI)
U. T. System Office of the Controller May 2016
May 11-12, 2016 Meeting of the U. T. System Board of Regents - Finance and Planning Committee
Agenda Book - 75

KEY INDICATORS OF RESERVES
PROJECTED 2016 YEAR-END MARGINYEAR-TO-DATE 2015 AND 2016 FROM FEBRUARY MONTHLY FINANCIAL REPORT
12.4
98.7
5.3
(10.3)(7.8)
7.7 2.9
(4.7)
84.1
(11.8)
49.1
16.8
199.2
(8.5)
27.2
185.2
10.6
(16.9)(10.6)
2.2 4.0
(14.8)
151.6
(12.7)
37.3
7.0
252.6
2.1
(60.0)
(10.0)
40.0
90.0
140.0
190.0
240.0
290.0
ARL AUS DAL ELP PB RGV SA TYL SWM GMB HHS SAH MDA THC
Operating Margin by Institution(Excludes Realized and Unrealized Gains and Losses)
Current Monthly Financial Report to date Projected year-end Prior Monthly Financial Report to date
In Millions
2.1%
3.6%
0.9%
-2.5%
-10.7%
1.9%0.6%
-3.9%
3.2%
-0.6%
3.2%2.1%
4.4%
-4.4%
4.6%
6.7%
1.8%
-4.0%
-14.4%
0.6% 0.8%
-12.2%
5.7%
-0.7%
2.4%
0.9%
5.6%
1.1%
-20.0%
-15.0%
-10.0%
-5.0%
0.0%
5.0%
10.0%
ARL AUS DAL ELP PB RGV SA TYL SWM GMB HHS SAH MDA THC
Operating Margin as a Percentage of Year-end Revenue by Institution(Excludes Realized and Unrealized Gains and Losses)
Current Monthly Financial Report to date Projected year-end Prior Monthly Financial Report to date
In Millions
U. T. System Office of the Controller May 2016
May 11-12, 2016 Meeting of the U. T. System Board of Regents - Finance and Planning Committee
Agenda Book - 76

TH E UN I V E R S I T Y O F TE X A S SY S T E M OF F I C E O F T H E CO N T R O L L E R
MONTHLY FINANCIAL REPORT (unaudited)
MARCH 2016
201 Seventh Street, ASH 5th Floor Austin, Texas 78701
512.499.4527 www.utsystem.edu/cont
U. T. System Office of the Controller May 2016
May 11-12, 2016 Meeting of the U. T. System Board of Regents - Finance and Planning Committee
Agenda Book - 77

THE UNIVERSITY OF TEXAS SYSTEM
MONTHLY FINANCIAL REPORT
(Unaudited)
FOR THE SEVEN MONTHS ENDING
March 31, 2016
U. T. System Office of the Controller May 2016
May 11-12, 2016 Meeting of the U. T. System Board of Regents - Finance and Planning Committee
Agenda Book - 78

The University of Texas System Monthly Financial Report
Foreword
The Monthly Financial Report (MFR) compares the results of operations between the current year-to-date cumulative amounts and the prior year-to-date cumulative amounts. Explanations are provided for institutions having the largest variances in Adjusted Income (Loss) year-to-date as compared to the prior year, both in terms of dollars and percentages. In addition, although no significant variance may exist, institutions with losses may be discussed. The data is reported in three sections: (1) Operating Revenues, (2) Operating Expenses, and (3) Other Nonoperating Adjustments. Presentation of state appropriation revenues are required under GASB 35 to be reflected as nonoperating revenues, so all institutions will report an Operating Loss prior to this adjustment. The MFR provides an Adjusted Income (Loss), which takes into account the nonoperating adjustments associated with core operating activities. An Adjusted Margin (as a percentage of operating and nonoperating revenue adjustments) is calculated for each period and is intended to reflect relative operating contributions to financial health.
U. T. System Office of the Controller May 2016
May 11-12, 2016 Meeting of the U. T. System Board of Regents - Finance and Planning Committee
Agenda Book - 79

UNAUDITED
The University of Texas System Consolidated
Monthly Financial Report, Comparison of Operating Results and Margin
For the Period Ending March 31, 2016
MarchMarchMarchMarchYear-to-Date Year-to-Date Year-to-Date Year-to-Date FY 2016FY 2016FY 2016FY 2016
MarchMarchMarchMarchYear-to-DateYear-to-DateYear-to-DateYear-to-DateFY 2015FY 2015FY 2015FY 2015 VarianceVarianceVarianceVariance
Fluctuation Fluctuation Fluctuation Fluctuation PercentagePercentagePercentagePercentage
Operating RevenuesOperating RevenuesOperating RevenuesOperating Revenues
Net Student Tuition and Fees 957,955,280.56 885,589,210.17 72,366,070.39 8.2%
Sponsored Programs 1,795,627,618.51 1,629,691,108.13 165,936,510.38 10.2%
Net Sales and Services of Educational Activities 363,160,571.04 346,986,394.20 16,174,176.84 4.7%
Net Sales and Services of Hospitals 3,125,647,854.25 2,975,889,583.88 149,758,270.37 5.0%
Net Professional Fees 957,804,352.55 870,472,329.07 87,332,023.48 10.0%
Net Auxiliary Enterprises 360,809,591.61 343,368,667.75 17,440,923.86 5.1%
Other Operating Revenues 259,944,938.51 227,719,681.98 32,225,256.53 14.2%
Total Operating RevenuesTotal Operating RevenuesTotal Operating RevenuesTotal Operating Revenues 7,820,950,207.037,820,950,207.037,820,950,207.037,820,950,207.03 7,279,716,975.187,279,716,975.187,279,716,975.187,279,716,975.18 541,233,231.85541,233,231.85541,233,231.85541,233,231.85 7.4%7.4%7.4%7.4%
Operating ExpensesOperating ExpensesOperating ExpensesOperating Expenses
Salaries and Wages 4,657,822,206.98 4,241,916,177.72 415,906,029.26 9.8%
Payroll Related Costs 1,264,680,089.15 1,110,163,127.76 154,516,961.39 13.9%
Cost of Goods Sold 85,926,963.88 74,126,778.08 11,800,185.80 15.9%
Professional Fees and Services 314,794,004.82 236,402,242.08 78,391,762.74 33.2%
Other Contracted Services 467,376,756.16 444,085,538.42 23,291,217.74 5.2%
Travel 80,371,587.71 74,137,401.65 6,234,186.06 8.4%
Materials and Supplies 1,030,188,693.86 949,092,741.85 81,095,952.01 8.5%
Utilities 159,423,667.93 161,763,533.73 (2,339,865.80) -1.4%
Communications 67,218,682.53 67,561,983.41 (343,300.88) -0.5%
Repairs and Maintenance 187,069,292.48 172,768,801.32 14,300,491.16 8.3%
Rentals and Leases 99,137,237.34 93,350,948.95 5,786,288.39 6.2%
Printing and Reproduction 21,832,603.11 20,144,381.61 1,688,221.50 8.4%
Bad Debt Expense 561,534.61 612,121.38 (50,586.77) -8.3%
Claims and Losses 5,451,402.66 30,826,325.55 (25,374,922.89) -82.3%
Increase in Net OPEB Obligation 388,991,548.75 326,590,952.92 62,400,595.83 19.1%
Pension Expense 124,188,614.35 - 124,188,614.35 100.0%
Scholarships and Fellowships 264,421,854.02 225,568,984.93 38,852,869.09 17.2%
Depreciation and Amortization 740,516,200.34 667,839,654.31 72,676,546.03 10.9%
Federal Sponsored Program Pass-Through to Other State Agencies 15,617,314.73 11,123,431.04 4,493,883.69 40.4%
State Sponsored Program Pass-Through to Other State Agencies 10,973,801.85 1,672,831.21 9,300,970.64 556.0%
Other Operating Expenses 262,687,623.84 248,188,488.04 14,499,135.80 5.8%
Total Operating ExpensesTotal Operating ExpensesTotal Operating ExpensesTotal Operating Expenses 10,249,251,681.1010,249,251,681.1010,249,251,681.1010,249,251,681.10 9,157,936,445.969,157,936,445.969,157,936,445.969,157,936,445.96 1,091,315,235.141,091,315,235.141,091,315,235.141,091,315,235.14 11.9%11.9%11.9%11.9%
Operating LossOperating LossOperating LossOperating Loss (2,428,301,474.07)(2,428,301,474.07)(2,428,301,474.07)(2,428,301,474.07) (1,878,219,470.78)(1,878,219,470.78)(1,878,219,470.78)(1,878,219,470.78) (550,082,003.29)(550,082,003.29)(550,082,003.29)(550,082,003.29) -29.3%-29.3%-29.3%-29.3%
Other Nonoperating AdjustmentsOther Nonoperating AdjustmentsOther Nonoperating AdjustmentsOther Nonoperating Adjustments
State Appropriations 1,318,904,661.42 1,182,117,613.75 136,787,047.67 11.6%
Nonexchange Sponsored Programs 208,773,612.15 156,686,665.94 52,086,946.21 33.2%
Gift Contributions for Operations 300,918,649.54 296,741,147.84 4,177,501.70 1.4%
Net Investment Income 525,845,686.13 596,387,710.48 (70,542,024.35) -11.8%
Interest Expense on Capital Asset Financings (159,452,753.75) (158,786,222.42) (666,531.33) -0.4%
Net Other Nonoperating AdjustmentsNet Other Nonoperating AdjustmentsNet Other Nonoperating AdjustmentsNet Other Nonoperating Adjustments 2,194,989,855.492,194,989,855.492,194,989,855.492,194,989,855.49 2,073,146,915.592,073,146,915.592,073,146,915.592,073,146,915.59 121,842,939.90121,842,939.90121,842,939.90121,842,939.90 5.9%5.9%5.9%5.9%
Adjusted Income (Loss) including Depreciation & AmortizationAdjusted Income (Loss) including Depreciation & AmortizationAdjusted Income (Loss) including Depreciation & AmortizationAdjusted Income (Loss) including Depreciation & Amortization (233,311,618.58)(233,311,618.58)(233,311,618.58)(233,311,618.58) 194,927,444.81194,927,444.81194,927,444.81194,927,444.81 (428,239,063.39)(428,239,063.39)(428,239,063.39)(428,239,063.39) -219.7%-219.7%-219.7%-219.7%
Adjusted Margin % including Depreciation & AmortizationAdjusted Margin % including Depreciation & AmortizationAdjusted Margin % including Depreciation & AmortizationAdjusted Margin % including Depreciation & Amortization -2.3%-2.3%-2.3%-2.3% 2.0%2.0%2.0%2.0%
Investment Gain (Losses) (1,222,227,534.72) 149,309,079.32 (1,371,536,614.04) -918.6%
Adj. Inc. (Loss) with Investment Gains (Losses)Adj. Inc. (Loss) with Investment Gains (Losses)Adj. Inc. (Loss) with Investment Gains (Losses)Adj. Inc. (Loss) with Investment Gains (Losses) (1,455,539,153.30)(1,455,539,153.30)(1,455,539,153.30)(1,455,539,153.30) 344,236,524.13344,236,524.13344,236,524.13344,236,524.13 (1,799,775,677.43)(1,799,775,677.43)(1,799,775,677.43)(1,799,775,677.43) -522.8%-522.8%-522.8%-522.8%
Adj. Margin % with Investment Gains (Losses)Adj. Margin % with Investment Gains (Losses)Adj. Margin % with Investment Gains (Losses)Adj. Margin % with Investment Gains (Losses) -16.3%-16.3%-16.3%-16.3% 3.6%3.6%3.6%3.6%
Adjusted Income (Loss) excluding Depreciation & AmortizationAdjusted Income (Loss) excluding Depreciation & AmortizationAdjusted Income (Loss) excluding Depreciation & AmortizationAdjusted Income (Loss) excluding Depreciation & Amortization 507,204,581.76507,204,581.76507,204,581.76507,204,581.76 862,767,099.12862,767,099.12862,767,099.12862,767,099.12 (355,562,517.36)(355,562,517.36)(355,562,517.36)(355,562,517.36) -41.2%-41.2%-41.2%-41.2%
Adjusted Margin % excluding Depreciation & AmortizationAdjusted Margin % excluding Depreciation & AmortizationAdjusted Margin % excluding Depreciation & AmortizationAdjusted Margin % excluding Depreciation & Amortization 5.0%5.0%5.0%5.0% 9.1%9.1%9.1%9.1%
U. T. System Office of the Controller May 2016
May 11-12, 2016 Meeting of the U. T. System Board of Regents - Finance and Planning Committee
Agenda Book - 80

March MarchYear-to-Date Year-to-Date Fluctuation
FY 2016 FY 2015 Variance PercentageU. T. System Administration (485,556,831.45)$ (164,704,834.41)$ (320,851,997.04) (1) -194.8%U. T. Arlington 23,555,053.75 8,386,913.39 15,168,140.36 (2) 180.9%U. T. Austin 124,610,715.07 114,261,375.75 10,349,339.32 9.1%U. T. Brownsville (640,964.65) (5,528,427.55) 4,887,462.90 88.4%U. T. Dallas 4,406,214.94 4,959,089.27 (552,874.33) -11.1%U. T. El Paso (11,138,662.30) (8,064,301.47) (3,074,360.83) (3) -38.1%U. T. Permian Basin (3,263,086.51) (4) (3,938,847.29) 675,760.78 17.2%U. T. Rio Grande Valley 7,670,604.43 - 7,670,604.43 100.0%U. T. San Antonio 3,099,158.19 9,312,859.13 (6,213,700.94) (5) -66.7%U. T. Tyler (6,518,211.60) (4,065,666.33) (2,452,545.27) (6) -60.3%U. T. Southwestern Medical Center 119,451,557.31 60,171,756.24 59,279,801.07 (7) 98.5%U. T. Medical Branch - Galveston (13,311,551.83) 20,235,084.77 (33,546,636.60) (8) -165.8%U. T. Health Science Center - Houston 53,916,808.49 17,901,402.92 36,015,405.57 (9) 201.2%U. T. Health Science Center - San Antonio 13,669,697.80 19,802,292.00 (6,132,594.20) (10) -31.0%U. T. M. D. Anderson Cancer Center 122,906,414.92 283,417,600.71 (160,511,185.79) (11) -56.6%U. T. Health Science Center - Tyler (8,393,419.56) (1,619,257.76) (6,774,161.80) (12) -418.3%Elimination of AUF Transfer (177,775,115.58) (155,599,594.56) (22,175,521.02) -14.3%
Total Adjusted Income (Loss) (233,311,618.58) 194,927,444.81 (428,239,063.39) -219.7%
Investment Gains (Losses) (1,222,227,534.72) 149,309,079.32 (1,371,536,614.04) -918.6%
Total Adjusted Income (Loss) with Investment Gains (Losses) Including Depreciation and Amortization (1,455,539,153.30)$ 344,236,524.13$ (1,799,775,677.43)$ -522.8%
March MarchYear-to-Date Year-to-Date Fluctuation
FY 2016 FY 2015 Variance PercentageU. T. System Administration (475,114,297.69)$ (154,274,423.26)$ (320,839,874.43) -208.0%U. T. Arlington 50,258,275.78 34,626,970.58 15,631,305.20 45.1%U. T. Austin 268,985,715.07 254,261,375.75 14,724,339.32 5.8%U. T. Brownsville (285,810.06) (570,978.05) 285,167.99 49.9%U. T. Dallas 41,495,714.94 38,560,900.49 2,934,814.45 7.6%U. T. El Paso 7,110,582.37 9,446,312.54 (2,335,730.17) -24.7%U. T. Permian Basin 4,883,163.49 3,662,334.14 1,220,829.35 33.3%U. T. Rio Grande Valley 29,747,306.94 - 29,747,306.94 100.0%U. T. San Antonio 31,014,836.58 37,781,865.42 (6,767,028.84) -17.9%U. T. Tyler 1,586,684.13 2,961,581.09 (1,374,896.96) -46.4%U. T. Southwestern Medical Center 210,864,671.73 148,633,280.81 62,231,390.92 41.9%U. T. Medical Branch - Galveston 55,453,183.58 78,445,127.29 (22,991,943.71) -29.3%U. T. Health Science Center - Houston 89,916,303.38 52,753,646.64 37,162,656.74 70.4%U. T. Health Science Center - San Antonio 44,586,364.47 50,427,292.00 (5,840,927.53) -11.6%U. T. M. D. Anderson Cancer Center 326,532,063.47 456,797,191.40 (130,265,127.93) -28.5%U. T. Health Science Center - Tyler (2,055,060.84) 4,854,216.84 (6,909,277.68) -142.3%Elimination of AUF Transfer (177,775,115.58) (155,599,594.56) (22,175,521.02) -14.3%
Total Adjusted Income (Loss) 507,204,581.76 862,767,099.12 (355,562,517.36) -41.2%
Total Adjusted Income (Loss) Excluding Depreciation and Amortization 507,204,581.76$ 862,767,099.12$ (355,562,517.36)$ -41.2%
Excluding Depreciation and Amortization Expense
The University of Texas System
Comparison of Adjusted Income (Loss)
For the Seven Months Ending March 31, 2016
Including Depreciation and Amortization Expense
U. T. System Office of the Controller May 2016
May 11-12, 2016 Meeting of the U. T. System Board of Regents - Finance and Planning Committee
Agenda Book - 81

THE UNIVERSITY OF TEXAS SYSTEM EXPLANATION OF VARIANCES ON THE MONTHLY FINANCIAL REPORT
For the Seven Months Ending March 31, 2016
Explanations are provided for institutions having the largest variances in adjusted income (loss) year-to-date as compared to the prior year, both in terms of dollars and percentages. Explanations are also provided for institutions with a current year-to-date adjusted loss and/or a projected year-to-date loss.
(1) U. T. System Administration – The $320.9 million (194.8%) increase in adjusted loss over the same period last year was primarily due to a decrease in oil and gas royalties, which are a component of net investment income. Additionally, GASB Statement No. 68, Accounting and Financial Reporting for Pensions, became effective in 2015. U. T. System Administration recognized an accrual of $124.2 million for the entire U. T. System for the first seven months of 2016; however, in 2015 the pension expense was not recognized until July. Also contributing to the increase in the adjusted loss was an increase of $62.4 million in the accrual for Other Postemployment Benefits (OPEB) expense for the entire U. T. System. Finally, in 2015, U. T. System Administration recognized $41.6 million of gifts for operations for U. T. Rio Grande Valley with no comparable gifts in 2016. As a result of these factors, U. T. System Administration incurred a year-to-date loss of $485.6 million. Excluding depreciation and amortization expense, U. T. System Administration’s adjusted loss was $475.1 million or -218.7% of revenues. U. T. System Administration anticipates ending the year with a $905.2 million loss, -302.2% of projected revenues, which includes $17.9 million of depreciation and amortization expense, as well as a $666.8 million accrual for OPEB and a $212.9 million accrual for pension expense.
(2) U. T. Arlington – The $15.2 million (180.9%) increase in adjusted income over the same period last year was primarily attributable to an increase in nonexchange sponsored programs as a result of increased Texas Research Incentive Program funds received in 2016 and an increase in state appropriations. Excluding depreciation and amortization expense, U. T. Arlington’s adjusted income was $50.3 million or 14.7% of revenues.
(3) U. T. El Paso – The $3.1 million (38.1%) increase in adjusted loss over the same period last year was largely attributable to an increase in salaries and wages and payroll related costs due to merit increases implemented in 2016. As a result, U. T. El Paso incurred a year-to-date loss of $11.1 million. Other factors contributing to the loss include the following: an increase in tuition exemption scholarship expense, primarily related to the Hazelwood and Hazelwood Legacy programs; and an increase in depreciation expense over the last five years as a result of the rapid growth of buildings and research infrastructure on campus. Excluding depreciation and amortization expense, U. T. El Paso’s adjusted income was $7.1 million or 2.9% of revenues. U. T. El Paso anticipates ending the year with a $13.9 million loss, -3.2% of projected revenues, which includes $32.0 million of depreciation and amortization expense. U. T. El Paso is implementing measures to reduce spending, including a hiring freeze on
positions that are not mission critical, utility savings efforts, and other cost savings measures.
(4) U. T. Permian Basin incurred a year-to-date loss of $3.3 million primarily due to the following: an increase in salaries and wages and payroll related costs driven by merit increases and additional faculty to accommodate the increased enrollment; an increase in payroll related costs attributable to increased premium sharing rates; and a decrease in gift contributions for operations as a result of large contributions for the football program received in 2015 with no comparable gifts received in 2016. Excluding depreciation and amortization expense, U. T. Permian Basin’s adjusted income was $4.9 million or 10.3% of revenues. U. T. Permian Basin anticipates ending the year with a $5.5 million loss, -7.4% of projected revenues, which includes $13.0 million of depreciation and amortization expense.
(5) U. T. San Antonio – The $6.2 million (66.7%) decrease in adjusted income over the same period last year was primarily due to increases in salaries and wages and payroll related costs as a result of merit increases. Additionally, the monthly amount for Retiree Premium Sharing was not recorded in the prior year, which also contributed to the increase in payroll related costs. Excluding depreciation and amortization expense, U. T. San Antonio’s adjusted income was $31.0 million or 10.1% of revenues.
(6) U. T. Tyler – The $2.5 million (60.3%) increase in adjusted loss over the same period last year was largely due to an increase in salaries and wages and payroll related costs driven by merit and market increases. The number of full-time equivalents also increased as a result of the new College of Pharmacy and the implementation of PeopleSoft. As a result of these factors, combined with an increase in depreciation and amortization expense for the new Pharmacy Building, U. T. Tyler incurred a year-to-date loss of $6.5 million. Excluding depreciation and amortization expense, U. T. Tyler’s adjusted income was $1.6 million or 2.2% of revenues. U. T. Tyler anticipates ending the year with a $13.6 million loss, -11.0% of projected revenues, which includes $14.6 million of depreciation and amortization expense. The projected loss is the result of an increase in personnel and renovation projects across the campus not meeting the threshold for capitalization.
U. T. System Office of the Controller May 2016
May 11-12, 2016 Meeting of the U. T. System Board of Regents - Finance and Planning Committee
Agenda Book - 82

(7) U. T. Southwestern Medical Center – The $59.3 million (98.5%) increase in adjusted income over the same period last year was primarily attributable to an increase in net sales and services of hospitals as a result of increased outpatient and inpatient revenue and an increase in net professional fees attributable to an increase in volume in managed care, Medicare and charity care. Other operating revenues also increased primarily due to increases in revenue from the Delivery System Reform Incentive Payments (DSRIP) and the Network Access Improvement Program. These increases in revenue were partially offset by increases in salaries and wages and payroll related costs as a result of additional employees, a 3% merit increase and increased premium sharing rates. Excluding depreciation and amortization expense, Southwestern’s adjusted income was $210.9 million or 13.2% of revenues.
(8) U. T. Medical Branch – Galveston – The $33.5 million (165.8%) increase in adjusted loss as compared to adjusted income over the same period last year was primarily attributable to an increase in salaries and wages and payroll related costs due to merit increases, and additional staffing resulting from clinical recruitment and preparation for the opening of Jennie Sealy and League City Hospitals. Payroll related costs also increased as a result of increased premium sharing rates. Other operating revenues also decreased primarily due to decreased revenue from DSRIP and Meaningful Use revenues. As a result of these factors, UTMB incurred a year-to-date loss of $13.3 million. Excluding depreciation and amortization, UTMB’s adjusted income was $55.5 million or 5.0% of revenues. UTMB anticipates ending the year with a $12.2 million loss which represents -0.6% of projected revenues and includes $132.5 million of depreciation and amortization expense.
(9) U. T. Health Science Center – Houston – The $36.0 million (201.2%) increase in adjusted income as compared to the same period last year was primarily attributable to an increase in sponsored program revenue related to growth of the physician practice plan. Net professional fees also increased due to an increase in gross charges as a result of faculty recruitments and the planned expansion and growth of the physician practice plan, as well as an increase in uncompensated care revenue. These revenue increases were partially offset by increased salaries and wages and payroll related costs as a result of the ongoing recruitment efforts related to the planned expansion and growth of the physician practice plan. Excluding depreciation and amortization expense, UTHSC-Houston’s adjusted income was $89.9 million or 9.9% of revenues.
(10) U. T. Health Science Center – San Antonio – The $6.1 million (31.0%) decrease in adjusted income over the same period last year was primarily due to increases in other contracted services, materials and supplies and professional fees and services. Other contracted services increased due to increases in service agreements associated with the South Texas DSRIP programs and sub-recipient payments related to federal sponsored programs. Materials and supplies increased as a result of increases in drug and medication supplies at the Cancer Therapy and Research Center Pharmacy and UT Medicine clinics due to increase in clinical volumes, as
well as costs related to the new Center for Oral Health Care & Research building, which was place into service in July 2015 and increased clinical and research laboratory supplies. Professional fees and services increased primarily due to engagements with external consultants to develop a clinical transformation strategy associated with the physician practice plan. Excluding depreciation and amortization expense, UTHSC-San Antonio’s adjusted income was $44.6 million or 9.3% of revenues.
(11) U. T. M. D. Anderson Cancer Center – The $160.5 million (56.6%) decrease in adjusted income over the same period last year was primarily attributable to an increase in expenses combined with a decrease in patient revenues as a result of the implementation of the new EPIC Electronic Health Record system (EHR). Expenses increased due to the following: salaries and wages and payroll related costs increased due to an increase in full-time employees, salary increases and increased premium sharing rates; professional fees and services increased as a result of increased consulting expenses primarily related to the EPIC EHR project; and depreciation and amortization increased as a result of the completion of several large projects such as the Zayed Building, which was placed into service in February 2015, and the EPIC EHR system, which was placed into service in March 2016, as well as various other facility management and software projects. Excluding depreciation and amortization expense, M. D. Anderson’s adjusted income was $326.5 million or 12.5% of revenues. M. D. Anderson anticipated a material impact to revenues and expenses as a result of the EPIC EHR implementation. The post implementation strategy will focus on clinical productivity and operational efficiencies to return to normalized operations by year-end.
(12) U. T. Health Science Center – Tyler – The $6.8 million (418.3%) increase in adjusted loss over the same period last year was primarily attributable to the following: a decrease in other operating revenues driven by a decrease of $1.9 million in Meaningful Use and Physician Quality Reporting System healthcare incentive revenue; and an increase in salaries and wages and payroll related costs as a result of the hiring of 66 behavioral health employees due to the dissolution of the main psychiatric subcontractor, as well as the addition of new employees for the new Population/Community Health Program and for the opening of the clinic in Lindale. As a result of these factors, UTHSC-Tyler incurred a year-to-date loss of $8.4 million. Excluding depreciation and amortization expense, UTHSC-Tyler’s adjusted loss was $2.1 million or -1.9% of revenues. UTHSC-Tyler anticipates ending the year with a positive margin of $2.1 million as a result of adjustments to the workforce size currently underway, a 3% institution-wide expense reduction initiative implemented for the second half of 2016, and anticipated growth in clinical services with a corresponding increase in net patient revenue. This represents 1.1% of projected revenues and includes $10.9 million of depreciation and amortization expense.
U. T. System Office of the Controller May 2016
May 11-12, 2016 Meeting of the U. T. System Board of Regents - Finance and Planning Committee
Agenda Book - 83

GLOSSARY OF TERMS OPERATING REVENUES:
NET STUDENT TUITION – All student tuition and fee revenues earned at the UT institution for educational purposes, net of tuition discounting.
SPONSORED PROGRAMS – Funding received from local, state and federal governments or private agencies, organizations or individuals, excluding Federal Pell Grant Program which is reported as nonoperating. Includes amounts received for services performed on grants, contracts, and agreements from these entities for current operations. This also includes indirect cost recoveries and pass-through federal and state grants.
NET SALES AND SERVICES OF EDUCATIONAL ACTIVITIES – Revenues that are related to the conduct of instruction, research, and public service and revenues from activities that exist to provide an instructional and laboratory experience for students that create goods and services that may be sold.
NET SALES AND SERVICES OF HOSPITALS – Revenues (net of discounts, allowances, and bad debt expense) generated from UT health institution’s daily patient care, special or other services, as well as revenues from health clinics that are part of a hospital.
NET PROFESSIONAL FEES – Revenues (net of discounts, allowances, and bad debt expense) derived from the fees charged by the professional staffs at UT health institutions as part of the Medical Practice Plans. These revenues are also identified as Practice Plan income. Examples of such fees include doctor’s fees for clinic visits, medical and dental procedures, professional opinions, and anatomical procedures, such as analysis of specimens after a surgical procedure, etc.
NET AUXILIARY ENTERPRISES – Revenues derived from a service to students, faculty, or staff in which a fee is charged that is directly related to, although not necessarily equal to the cost of the service (e.g., bookstores, dormitories, dining halls, snack bars, inter-collegiate athletic programs, etc.).
OTHER OPERATING REVENUES – Other revenues generated from sales or services provided to meet current fiscal year operating expenses, which are not included in the preceding categories (e.g., certified nonprofit healthcare company revenues, donated drugs, interest on student loans, etc.) Other receipts for settlements, judgments and lawsuits are considered nonoperating revenues.
OPERATING EXPENSES:
SALARIES AND WAGES – Expenses for all salaries and wages of individuals employed by the institution including full-time, part-time, longevity, hourly, seasonal, etc. Includes salary augmentation and incentive compensation.
PAYROLL RELATED COSTS – Expenses for all employee benefits paid by the institution or paid by the state on behalf of the institution. Includes supplemental retirement annuities.
COST OF GOODS SOLD – Purchases of goods for resale and raw materials purchased for use in the manufacture of products intended for sale to others.
PROFESSIONAL FEES AND SERVICES – Payments for services rendered on a fee, contract, or other basis by a person, firm, corporation, or company recognized as possessing a high degree of learning and responsibility. Includes such items as services of a consultant, legal counsel, financial or audit fees, medical contracted services, guest lecturers (not employees) and expert witnesses.
OTHER CONTRACTED SERVICES – Payments for services rendered on a contractual basis by a person, firm, corporation or company that possess a lesser degree of learning and responsibility than that required for Professional Fees and Services. Includes such items as temporary employment expenses, janitorial services, dry cleaning services, etc.
TRAVEL – Payments for travel costs incurred by employees and board members for meetings and training.
MATERIALS AND SUPPLIES – Payments for consumable items. Includes, but is not limited to: computer consumables, office supplies, paper products, soap, lights, plants, fuels and lubricants, chemicals and gasses, medical supplies and copier supplies. Also includes postal services, and subscriptions and other publications not for permanent retention.
UTILITIES – Payments for the purchase of electricity, natural gas, water, and thermal energy.
COMMUNICATIONS - Electronically transmitted communications services (telephone, internet, computation center services, etc.).
REPAIRS AND MAINTENANCE – Payments for the maintenance and repair of equipment, furnishings, motor vehicles, buildings and other plant facilities, and waste disposal. Includes, but is not limited to repair and maintenance to copy machines, furnishings, equipment – including medical and laboratory equipment, office equipment and aircraft.
RENTALS AND LEASES – Payments for rentals or leases of furnishings and equipment, vehicles, land and office buildings (all rental of space).
PRINTING AND REPRODUCTION – Printing and reproduction costs associated with the printing/copying of the institution’s documents and publications.
BAD DEBT EXPENSE – Expenses incurred by the university related to nonrevenue receivables such as non-payment of student loans.
U. T. System Office of the Controller May 2016
May 11-12, 2016 Meeting of the U. T. System Board of Regents - Finance and Planning Committee
Agenda Book - 84

CLAIMS AND LOSSES – Payments for claims from self-insurance programs. Other claims for settlements, judgments and lawsuits are considered nonoperating expenses.
INCREASE IN NET OPEB OBLIGATION – The change in the actuarially estimated liability of the cost of providing healthcare benefits to UT System’s employees after they separate from employment (retire).
PENSION EXPENSE – An estimate of year-end expense which will be allocated from the Texas Comptroller’s Office based upon prior year amounts.
SCHOLARSHIPS AND FELLOWSHIPS – Payments made for scholarship grants to students authorized by law, net of tuition discounting.
DEPRECIATION AND AMORTIZATION – Depreciation on capital assets and amortization expense on intangible assets.
FEDERAL SPONSORED PROGRAM PASS-THROUGHS TO OTHER STATE AGENCIES – Pass-throughs to other Texas state agencies, including other universities, of federal grants and contracts.
STATE SPONSORED PROGRAM PASS-THROUGHS TO OTHER STATE AGENCIES – Pass-throughs to other Texas state agencies, including Texas universities.
OTHER OPERATING EXPENSES – Other operating expenses not identified in other line items above (e.g., certified non-profit healthcare company expenses, property taxes, insurance premiums, credit card fees, hazardous waste disposal expenses, meetings and conferences, etc.). Other claims for settlements, judgments and lawsuits are considered nonoperating expenses.
OPERATING LOSS – Total operating revenues less total operating expenses before other nonoperating adjustments like state appropriations.
OTHER NONOPERATING ADJUSTMENTS:
STATE APPROPRIATIONS – Appropriations from the State General Revenue fund, which supplement the UT institutional revenue in meeting operating expenses, such as faculty salaries, utilities, and institutional support.
NONEXCHANGE SPONSORED PROGRAMS – Funding received for the Federal Pell Grant Program, the portion of “state appropriations” funded by the American Recovery and Reinvestment Act, Texas Research Incentive Program (TRIP) and Enrollment Growth funding.
GIFT CONTRIBUTIONS FOR OPERATIONS – Consist of gifts from donors received for use in current operations, excluding gifts for capital acquisition and endowment gifts. Gifts for capital acquisition which can only be used to build or buy capital assets are excluded because they cannot be used to support current operations. Endowment gifts must be held in perpetuity and cannot be spent. The distributed income from endowment gifts must be spent according to the donor’s stipulations.
NET INVESTMENT INCOME (on institutions’ sheets) – Interest and dividend income on treasury balances, bank accounts, Short Term Fund, Intermediate Term Fund and Long Term Fund. It also includes distributed earnings from the Permanent Health Fund and patent and royalty income.
NET INVESTMENT INCOME (on the consolidated sheet) – Interest and dividend earnings of the Permanent University Fund, Short Term Fund, Intermediate Term Fund, Long Term Fund and Permanent Health Fund. This line item also includes the Available University Fund surface income, oil and gas royalties, and mineral lease bonus sales.
INTEREST EXPENSE ON CAPITAL ASSET FINANCINGS – Interest expenses associated with bond and note borrowings utilized to finance capital improvement projects by an institution. This consists of the interest portion of mandatory debt service transfers under the Revenue Financing System, Tuition Revenue bond and Permanent University Fund (PUF) bond programs. PUF interest expense is reported on System Administration as the debt legally belongs to the Board of Regents.
ADJUSTED INCOME (LOSS) including Depreciation and Amortization – Total operating revenues less total operating expenses including depreciation and amortization expense plus net other nonoperating adjustments.
ADJUSTED MARGIN % including Depreciation and Amortization – Percentage of Adjusted Income (Loss) including depreciation and amortization expense divided by Total Operating Revenues plus Net Nonoperating Adjustments less Interest Expense on Capital Asset Financings.
AVAILABLE UNIVERSITY FUND TRANSFER – Includes Available University Fund (AUF) transfer to System Administration for Educational and General operations and to UT Austin for Excellence Funding. These transfers are funded by investment earnings from the Permanent University Fund (PUF), which are required by law to be reported in the PUF at System Administration. On the MFR, investment income for System Administration has been reduced for the amount of the System Administration transfer so as not to overstate investment income for System Administration. The AUF transfers are eliminated at the consolidated level to avoid overstating System-wide revenues, as the amounts will be reflected as transfers at year-end.
INVESTMENT GAINS (LOSSES) – Realized and unrealized gains and losses on investments.
ADJUSTED INCOME (LOSS) excluding Depreciation and Amortization – Total operating revenues less total operating expenses excluding depreciation and amortization expense plus net other nonoperating adjustments.
ADJUSTED MARGIN % excluding Depreciation and Amortization – Percentage of Adjusted Income (Loss) excluding depreciation and amortization expense divided by Total Operating Revenues plus Net Nonoperating Adjustments less Interest Expense on Capital Asset Financings.
U. T. System Office of the Controller May 2016
May 11-12, 2016 Meeting of the U. T. System Board of Regents - Finance and Planning Committee
Agenda Book - 85

UNAUDITED
The University of Texas System Administration
Monthly Financial Report, Comparison of Operating Results and Margin
For the Period Ending March 31, 2016
MarchMarchMarchMarchYear-to-Date Year-to-Date Year-to-Date Year-to-Date FY 2016FY 2016FY 2016FY 2016
MarchMarchMarchMarchYear-to-DateYear-to-DateYear-to-DateYear-to-DateFY 2015FY 2015FY 2015FY 2015 VarianceVarianceVarianceVariance
Fluctuation Fluctuation Fluctuation Fluctuation PercentagePercentagePercentagePercentage
Operating RevenuesOperating RevenuesOperating RevenuesOperating Revenues
Sponsored Programs 11,631,794.00 7,172,414.48 4,459,379.52 62.2%
Net Sales and Services of Educational Activities 24,147,196.07 17,543,946.86 6,603,249.21 37.6%
Other Operating Revenues 15,286,810.39 12,243,127.73 3,043,682.66 24.9%
Total Operating RevenuesTotal Operating RevenuesTotal Operating RevenuesTotal Operating Revenues 51,065,800.4651,065,800.4651,065,800.4651,065,800.46 36,959,489.0736,959,489.0736,959,489.0736,959,489.07 14,106,311.3914,106,311.3914,106,311.3914,106,311.39 38.2%38.2%38.2%38.2%
Operating ExpensesOperating ExpensesOperating ExpensesOperating Expenses
Salaries and Wages 38,020,732.36 34,229,665.75 3,791,066.61 11.1%
Payroll Related Costs 8,624,368.54 8,394,350.79 230,017.75 2.7%
Professional Fees and Services 8,671,708.18 8,281,795.50 389,912.68 4.7%
Other Contracted Services 15,342,152.01 16,330,116.62 (987,964.61) -6.0%
Travel 887,253.00 876,963.42 10,289.58 1.2%
Materials and Supplies 12,769,789.26 5,815,208.50 6,954,580.76 119.6%
Utilities 193,850.79 229,459.84 (35,609.05) -15.5%
Communications 6,086,758.44 4,883,717.70 1,203,040.74 24.6%
Repairs and Maintenance 15,310,072.95 4,122,457.66 11,187,615.29 271.4%
Rentals and Leases 3,393,535.52 2,267,588.80 1,125,946.72 49.7%
Printing and Reproduction 1,048,401.17 210,040.07 838,361.10 399.1%
Claims and Losses 5,451,402.66 30,826,325.55 (25,374,922.89) -82.3%
Increase in Net OPEB Obligation 388,991,548.75 326,590,952.92 62,400,595.83 19.1%
Pension Expense 124,188,614.35 - 124,188,614.35 100.0%
Scholarships and Fellowships 393,891.67 398,500.00 (4,608.33) -1.2%
Depreciation and Amortization 10,442,533.76 10,430,411.15 12,122.61 0.1%
State Sponsored Program Pass-Through to Other State Agencies 1,112,462.12 973,024.35 139,437.77 14.3%
Other Operating Expenses 23,987,369.06 18,862,174.50 5,125,194.56 27.2%
Total Operating ExpensesTotal Operating ExpensesTotal Operating ExpensesTotal Operating Expenses 664,916,444.59664,916,444.59664,916,444.59664,916,444.59 473,722,753.12473,722,753.12473,722,753.12473,722,753.12 191,193,691.47191,193,691.47191,193,691.47191,193,691.47 40.4%40.4%40.4%40.4%
Operating LossOperating LossOperating LossOperating Loss (613,850,644.13)(613,850,644.13)(613,850,644.13)(613,850,644.13) (436,763,264.05)(436,763,264.05)(436,763,264.05)(436,763,264.05) (177,087,380.08)(177,087,380.08)(177,087,380.08)(177,087,380.08) -40.5%-40.5%-40.5%-40.5%
Other Nonoperating AdjustmentsOther Nonoperating AdjustmentsOther Nonoperating AdjustmentsOther Nonoperating Adjustments
State Appropriations 1,654,901.11 1,001,375.64 653,525.47 65.3%
Nonexchange Sponsored Programs 13,712,379.80 13,574,111.80 138,268.00 1.0%
Gift Contributions for Operations 881,522.07 42,613,101.98 (41,731,579.91) -97.9%
Net Investment Income 89,758,103.22 211,550,478.01 (121,792,374.79) -57.6%
Interest Expense on Capital Asset Financings (37,884,758.35) (38,733,628.37) 848,870.02 2.2%
Net Other Nonoperating AdjustmentsNet Other Nonoperating AdjustmentsNet Other Nonoperating AdjustmentsNet Other Nonoperating Adjustments 68,122,147.8568,122,147.8568,122,147.8568,122,147.85 230,005,439.06230,005,439.06230,005,439.06230,005,439.06 (161,883,291.21)(161,883,291.21)(161,883,291.21)(161,883,291.21) -70.4%-70.4%-70.4%-70.4%
Adjusted Income (Loss) including Depreciation & AmortizationAdjusted Income (Loss) including Depreciation & AmortizationAdjusted Income (Loss) including Depreciation & AmortizationAdjusted Income (Loss) including Depreciation & Amortization (545,728,496.28)(545,728,496.28)(545,728,496.28)(545,728,496.28) (206,757,824.99)(206,757,824.99)(206,757,824.99)(206,757,824.99) (338,970,671.29)(338,970,671.29)(338,970,671.29)(338,970,671.29) -163.9%-163.9%-163.9%-163.9%
Adjusted Margin % including Depreciation & AmortizationAdjusted Margin % including Depreciation & AmortizationAdjusted Margin % including Depreciation & AmortizationAdjusted Margin % including Depreciation & Amortization -347.4%-347.4%-347.4%-347.4% -67.6%-67.6%-67.6%-67.6%
Available University Fund Transfer 60,171,664.83 42,052,990.58 18,118,674.25 43.1%
Adjusted Income (Loss) with AUF TransferAdjusted Income (Loss) with AUF TransferAdjusted Income (Loss) with AUF TransferAdjusted Income (Loss) with AUF Transfer (485,556,831.45)(485,556,831.45)(485,556,831.45)(485,556,831.45) (164,704,834.41)(164,704,834.41)(164,704,834.41)(164,704,834.41) (320,851,997.04)(320,851,997.04)(320,851,997.04)(320,851,997.04) -194.8%-194.8%-194.8%-194.8%
Adjusted Margin % with AUF TransferAdjusted Margin % with AUF TransferAdjusted Margin % with AUF TransferAdjusted Margin % with AUF Transfer -223.5%-223.5%-223.5%-223.5% -47.4%-47.4%-47.4%-47.4%
Investment Gain (Losses) (571,598,248.97) 264,196,464.72 (835,794,713.69) -316.4%
Adj. Inc. (Loss) with AUF Transfer & Invest. Gains (Losses)Adj. Inc. (Loss) with AUF Transfer & Invest. Gains (Losses)Adj. Inc. (Loss) with AUF Transfer & Invest. Gains (Losses)Adj. Inc. (Loss) with AUF Transfer & Invest. Gains (Losses) (1,057,155,080.42)(1,057,155,080.42)(1,057,155,080.42)(1,057,155,080.42) $99,491,630.31$99,491,630.31$99,491,630.31$99,491,630.31 (1,156,646,710.73)(1,156,646,710.73)(1,156,646,710.73)(1,156,646,710.73) -1,162.6%-1,162.6%-1,162.6%-1,162.6%
Adj. Margin % with AUF Transfer & Invest. Gains (Losses)Adj. Margin % with AUF Transfer & Invest. Gains (Losses)Adj. Margin % with AUF Transfer & Invest. Gains (Losses)Adj. Margin % with AUF Transfer & Invest. Gains (Losses) 298.3%298.3%298.3%298.3% 16.3%16.3%16.3%16.3%
Adjusted Income (Loss) with AUF Transfer excluding Depreciation & Adjusted Income (Loss) with AUF Transfer excluding Depreciation & Adjusted Income (Loss) with AUF Transfer excluding Depreciation & Adjusted Income (Loss) with AUF Transfer excluding Depreciation & AmortizationAmortizationAmortizationAmortization (475,114,297.69)(475,114,297.69)(475,114,297.69)(475,114,297.69) (154,274,423.26)(154,274,423.26)(154,274,423.26)(154,274,423.26) (320,839,874.43)(320,839,874.43)(320,839,874.43)(320,839,874.43) -208.0%-208.0%-208.0%-208.0%
Adjusted Margin % with AUF Transfer excluding Depreciation & Adjusted Margin % with AUF Transfer excluding Depreciation & Adjusted Margin % with AUF Transfer excluding Depreciation & Adjusted Margin % with AUF Transfer excluding Depreciation & AmortizationAmortizationAmortizationAmortization -218.7%-218.7%-218.7%-218.7% -44.4%-44.4%-44.4%-44.4%
U. T. System Office of the Controller May 2016
May 11-12, 2016 Meeting of the U. T. System Board of Regents - Finance and Planning Committee
Agenda Book - 86

UNAUDITED
The University of Texas at Arlington
Monthly Financial Report, Comparison of Operating Results and Margin
For the Period Ending March 31, 2016
MarchMarchMarchMarchYear-to-Date Year-to-Date Year-to-Date Year-to-Date FY 2016FY 2016FY 2016FY 2016
MarchMarchMarchMarchYear-to-DateYear-to-DateYear-to-DateYear-to-DateFY 2015FY 2015FY 2015FY 2015 VarianceVarianceVarianceVariance
Fluctuation Fluctuation Fluctuation Fluctuation PercentagePercentagePercentagePercentage
Operating RevenuesOperating RevenuesOperating RevenuesOperating Revenues
Net Student Tuition and Fees 143,024,341.81 132,949,770.99 10,074,570.82 7.6%
Sponsored Programs 38,284,667.65 41,679,176.19 (3,394,508.54) -8.1%
Net Sales and Services of Educational Activities 11,326,892.60 12,687,564.00 (1,360,671.40) -10.7%
Net Auxiliary Enterprises 23,795,175.43 21,480,977.21 2,314,198.22 10.8%
Other Operating Revenues 5,395,264.13 4,312,864.13 1,082,400.00 25.1%
Total Operating RevenuesTotal Operating RevenuesTotal Operating RevenuesTotal Operating Revenues 221,826,341.62221,826,341.62221,826,341.62221,826,341.62 213,110,352.52213,110,352.52213,110,352.52213,110,352.52 8,715,989.108,715,989.108,715,989.108,715,989.10 4.1%4.1%4.1%4.1%
Operating ExpensesOperating ExpensesOperating ExpensesOperating Expenses
Salaries and Wages 146,105,563.29 143,121,777.16 2,983,786.13 2.1%
Payroll Related Costs 35,960,137.32 33,156,313.70 2,803,823.62 8.5%
Cost of Goods Sold 3,622.76 4,687.69 (1,064.93) -22.7%
Professional Fees and Services 5,366,058.37 5,487,306.97 (121,248.60) -2.2%
Other Contracted Services 32,196,174.35 30,745,667.48 1,450,506.87 4.7%
Travel 3,956,893.59 3,603,760.10 353,133.49 9.8%
Materials and Supplies 13,681,606.21 11,800,444.61 1,881,161.60 15.9%
Utilities 5,833,333.33 5,834,536.51 (1,203.18) -
Communications 4,883,593.72 4,869,935.79 13,657.93 0.3%
Repairs and Maintenance 4,199,576.61 7,036,307.55 (2,836,730.94) -40.3%
Rentals and Leases 2,229,248.64 1,852,264.46 376,984.18 20.4%
Printing and Reproduction 1,584,452.38 1,439,912.70 144,539.68 10.0%
Bad Debt Expense 153,796.71 360,658.56 (206,861.85) -57.4%
Scholarships and Fellowships 19,129,784.92 18,360,459.00 769,325.92 4.2%
Depreciation and Amortization 26,703,222.03 26,240,057.19 463,164.84 1.8%
Federal Sponsored Program Pass-Through to Other State Agencies 2,785,271.93 1,871,244.26 914,027.67 48.8%
State Sponsored Program Pass-Through to Other State Agencies 85,184.27 136,498.71 (51,314.44) -37.6%
Other Operating Expenses 7,660,874.05 7,233,424.86 427,449.19 5.9%
Total Operating ExpensesTotal Operating ExpensesTotal Operating ExpensesTotal Operating Expenses 312,518,394.48312,518,394.48312,518,394.48312,518,394.48 303,155,257.30303,155,257.30303,155,257.30303,155,257.30 9,363,137.189,363,137.189,363,137.189,363,137.18 3.1%3.1%3.1%3.1%
Operating LossOperating LossOperating LossOperating Loss (90,692,052.86)(90,692,052.86)(90,692,052.86)(90,692,052.86) (90,044,904.78)(90,044,904.78)(90,044,904.78)(90,044,904.78) (647,148.08)(647,148.08)(647,148.08)(647,148.08) -0.7%-0.7%-0.7%-0.7%
Other Nonoperating AdjustmentsOther Nonoperating AdjustmentsOther Nonoperating AdjustmentsOther Nonoperating Adjustments
State Appropriations 76,698,411.42 69,781,999.58 6,916,411.84 9.9%
Nonexchange Sponsored Programs 33,955,734.98 26,250,000.00 7,705,734.98 29.4%
Gift Contributions for Operations 2,891,666.96 4,546,855.72 (1,655,188.76) -36.4%
Net Investment Income 7,550,197.62 5,278,325.87 2,271,871.75 43.0%
Interest Expense on Capital Asset Financings (6,848,904.37) (7,425,363.00) 576,458.63 7.8%
Net Other Nonoperating AdjustmentsNet Other Nonoperating AdjustmentsNet Other Nonoperating AdjustmentsNet Other Nonoperating Adjustments 114,247,106.61114,247,106.61114,247,106.61114,247,106.61 98,431,818.1798,431,818.1798,431,818.1798,431,818.17 15,815,288.4415,815,288.4415,815,288.4415,815,288.44 16.1%16.1%16.1%16.1%
Adjusted Income (Loss) including Depreciation & AmortizationAdjusted Income (Loss) including Depreciation & AmortizationAdjusted Income (Loss) including Depreciation & AmortizationAdjusted Income (Loss) including Depreciation & Amortization 23,555,053.7523,555,053.7523,555,053.7523,555,053.75 8,386,913.398,386,913.398,386,913.398,386,913.39 15,168,140.3615,168,140.3615,168,140.3615,168,140.36 180.9%180.9%180.9%180.9%
Adjusted Margin % including Depreciation & AmortizationAdjusted Margin % including Depreciation & AmortizationAdjusted Margin % including Depreciation & AmortizationAdjusted Margin % including Depreciation & Amortization 6.9%6.9%6.9%6.9% 2.6%2.6%2.6%2.6%
Investment Gain (Losses) (20,834,453.97) (1,327,188.41) (19,507,265.56) -1,469.8%
Adj. Inc. (Loss) with Investment Gains (Losses)Adj. Inc. (Loss) with Investment Gains (Losses)Adj. Inc. (Loss) with Investment Gains (Losses)Adj. Inc. (Loss) with Investment Gains (Losses) 2,720,599.782,720,599.782,720,599.782,720,599.78 7,059,724.987,059,724.987,059,724.987,059,724.98 (4,339,125.20)(4,339,125.20)(4,339,125.20)(4,339,125.20) -61.5%-61.5%-61.5%-61.5%
Adj. Margin % with Investment Gains (Losses)Adj. Margin % with Investment Gains (Losses)Adj. Margin % with Investment Gains (Losses)Adj. Margin % with Investment Gains (Losses) 0.8%0.8%0.8%0.8% 2.2%2.2%2.2%2.2%
Adjusted Income (Loss) excluding Depreciation & AmortizationAdjusted Income (Loss) excluding Depreciation & AmortizationAdjusted Income (Loss) excluding Depreciation & AmortizationAdjusted Income (Loss) excluding Depreciation & Amortization 50,258,275.7850,258,275.7850,258,275.7850,258,275.78 34,626,970.5834,626,970.5834,626,970.5834,626,970.58 15,631,305.2015,631,305.2015,631,305.2015,631,305.20 45.1%45.1%45.1%45.1%
Adjusted Margin % excluding Depreciation & AmortizationAdjusted Margin % excluding Depreciation & AmortizationAdjusted Margin % excluding Depreciation & AmortizationAdjusted Margin % excluding Depreciation & Amortization 14.7%14.7%14.7%14.7% 10.9%10.9%10.9%10.9%
U. T. System Office of the Controller May 2016
May 11-12, 2016 Meeting of the U. T. System Board of Regents - Finance and Planning Committee
Agenda Book - 87

UNAUDITED
The University of Texas at Austin
Monthly Financial Report, Comparison of Operating Results and Margin
For the Period Ending March 31, 2016
MarchMarchMarchMarchYear-to-Date Year-to-Date Year-to-Date Year-to-Date FY 2016FY 2016FY 2016FY 2016
MarchMarchMarchMarchYear-to-DateYear-to-DateYear-to-DateYear-to-DateFY 2015FY 2015FY 2015FY 2015 VarianceVarianceVarianceVariance
Fluctuation Fluctuation Fluctuation Fluctuation PercentagePercentagePercentagePercentage
Operating RevenuesOperating RevenuesOperating RevenuesOperating Revenues
Net Student Tuition and Fees 281,166,666.67 282,916,666.67 (1,750,000.00) -0.6%
Sponsored Programs 326,365,780.49 323,477,810.03 2,887,970.46 0.9%
Net Sales and Services of Educational Activities 240,196,827.99 238,562,133.29 1,634,694.70 0.7%
Net Auxiliary Enterprises 193,055,611.13 185,974,794.06 7,080,817.07 3.8%
Other Operating Revenues 4,815,551.72 3,641,876.06 1,173,675.66 32.2%
Total Operating RevenuesTotal Operating RevenuesTotal Operating RevenuesTotal Operating Revenues 1,045,600,438.001,045,600,438.001,045,600,438.001,045,600,438.00 1,034,573,280.111,034,573,280.111,034,573,280.111,034,573,280.11 11,027,157.8911,027,157.8911,027,157.8911,027,157.89 1.1%1.1%1.1%1.1%
Operating ExpensesOperating ExpensesOperating ExpensesOperating Expenses
Salaries and Wages 691,808,442.20 664,146,430.03 27,662,012.17 4.2%
Payroll Related Costs 200,962,639.40 182,791,650.09 18,170,989.31 9.9%
Cost of Goods Sold 15,528,251.44 14,917,047.90 611,203.54 4.1%
Professional Fees and Services 17,617,827.23 19,558,175.76 (1,940,348.53) -9.9%
Other Contracted Services 90,066,337.17 83,992,188.85 6,074,148.32 7.2%
Travel 23,554,917.96 23,560,942.18 (6,024.22) -
Materials and Supplies 75,816,348.48 84,491,916.95 (8,675,568.47) -10.3%
Utilities 49,874,055.96 52,246,788.23 (2,372,732.27) -4.5%
Communications 22,738,691.39 25,851,651.73 (3,112,960.34) -12.0%
Repairs and Maintenance 41,119,163.90 38,903,650.53 2,215,513.37 5.7%
Rentals and Leases 12,936,171.63 11,570,436.42 1,365,735.21 11.8%
Printing and Reproduction 4,909,457.47 5,314,150.25 (404,692.78) -7.6%
Bad Debt Expense 275,316.10 184,295.56 91,020.54 49.4%
Scholarships and Fellowships 70,000,000.00 70,000,000.00 - -
Depreciation and Amortization 144,375,000.00 140,000,000.00 4,375,000.00 3.1%
Federal Sponsored Program Pass-Through to Other State Agencies 2,088,476.20 2,255,283.66 (166,807.46) -7.4%
State Sponsored Program Pass-Through to Other State Agencies 9,230,625.00 - 9,230,625.00 100.0%
Other Operating Expenses 67,428,440.53 63,590,162.39 3,838,278.14 6.0%
Total Operating ExpensesTotal Operating ExpensesTotal Operating ExpensesTotal Operating Expenses 1,540,330,162.061,540,330,162.061,540,330,162.061,540,330,162.06 1,483,374,770.531,483,374,770.531,483,374,770.531,483,374,770.53 56,955,391.5356,955,391.5356,955,391.5356,955,391.53 3.8%3.8%3.8%3.8%
Operating LossOperating LossOperating LossOperating Loss (494,729,724.06)(494,729,724.06)(494,729,724.06)(494,729,724.06) (448,801,490.42)(448,801,490.42)(448,801,490.42)(448,801,490.42) (45,928,233.64)(45,928,233.64)(45,928,233.64)(45,928,233.64) -10.2%-10.2%-10.2%-10.2%
Other Nonoperating AdjustmentsOther Nonoperating AdjustmentsOther Nonoperating AdjustmentsOther Nonoperating Adjustments
State Appropriations 215,070,564.63 192,540,969.01 22,529,595.62 11.7%
Nonexchange Sponsored Programs 25,666,666.67 27,766,666.67 (2,100,000.00) -7.6%
Gift Contributions for Operations 95,314,044.74 81,574,460.26 13,739,584.48 16.8%
Net Investment Income 132,275,055.35 133,568,827.81 (1,293,772.46) -1.0%
Interest Expense on Capital Asset Financings (26,761,007.84) (27,987,652.14) 1,226,644.30 4.4%
Net Other Nonoperating AdjustmentsNet Other Nonoperating AdjustmentsNet Other Nonoperating AdjustmentsNet Other Nonoperating Adjustments 441,565,323.55441,565,323.55441,565,323.55441,565,323.55 407,463,271.61407,463,271.61407,463,271.61407,463,271.61 34,102,051.9434,102,051.9434,102,051.9434,102,051.94 8.4%8.4%8.4%8.4%
Adjusted Income (Loss) including Depreciation & AmortizationAdjusted Income (Loss) including Depreciation & AmortizationAdjusted Income (Loss) including Depreciation & AmortizationAdjusted Income (Loss) including Depreciation & Amortization (53,164,400.51)(53,164,400.51)(53,164,400.51)(53,164,400.51) (41,338,218.81)(41,338,218.81)(41,338,218.81)(41,338,218.81) (11,826,181.70)(11,826,181.70)(11,826,181.70)(11,826,181.70) -28.6%-28.6%-28.6%-28.6%
Adjusted Margin % including Depreciation & AmortizationAdjusted Margin % including Depreciation & AmortizationAdjusted Margin % including Depreciation & AmortizationAdjusted Margin % including Depreciation & Amortization -3.5%-3.5%-3.5%-3.5% -2.8%-2.8%-2.8%-2.8%
Available University Fund Transfer 177,775,115.58 155,599,594.56 22,175,521.02 14.3%
Adjusted Income (Loss) with AUF TransferAdjusted Income (Loss) with AUF TransferAdjusted Income (Loss) with AUF TransferAdjusted Income (Loss) with AUF Transfer 124,610,715.07124,610,715.07124,610,715.07124,610,715.07 114,261,375.75114,261,375.75114,261,375.75114,261,375.75 10,349,339.3210,349,339.3210,349,339.3210,349,339.32 9.1%9.1%9.1%9.1%
Adjusted Margin % with AUF TransferAdjusted Margin % with AUF TransferAdjusted Margin % with AUF TransferAdjusted Margin % with AUF Transfer 7.4%7.4%7.4%7.4% 7.0%7.0%7.0%7.0%
Investment Gain (Losses) (196,921,355.19) (52,327,332.69) (144,594,022.50) -276.3%
Adj. Inc. (Loss) with AUF Transfer & Invest. Gains (Losses)Adj. Inc. (Loss) with AUF Transfer & Invest. Gains (Losses)Adj. Inc. (Loss) with AUF Transfer & Invest. Gains (Losses)Adj. Inc. (Loss) with AUF Transfer & Invest. Gains (Losses) (72,310,640.12)(72,310,640.12)(72,310,640.12)(72,310,640.12) $61,934,043.06$61,934,043.06$61,934,043.06$61,934,043.06 (134,244,683.18)(134,244,683.18)(134,244,683.18)(134,244,683.18) -216.8%-216.8%-216.8%-216.8%
Adj. Margin % with AUF Transfer & Invest. Gains (Losses)Adj. Margin % with AUF Transfer & Invest. Gains (Losses)Adj. Margin % with AUF Transfer & Invest. Gains (Losses)Adj. Margin % with AUF Transfer & Invest. Gains (Losses) -4.8%-4.8%-4.8%-4.8% 3.9%3.9%3.9%3.9%
Adjusted Income (Loss) with AUF Transfer excluding Depreciation & Adjusted Income (Loss) with AUF Transfer excluding Depreciation & Adjusted Income (Loss) with AUF Transfer excluding Depreciation & Adjusted Income (Loss) with AUF Transfer excluding Depreciation & AmortizationAmortizationAmortizationAmortization 268,985,715.07268,985,715.07268,985,715.07268,985,715.07 254,261,375.75254,261,375.75254,261,375.75254,261,375.75 14,724,339.3214,724,339.3214,724,339.3214,724,339.32 5.8%5.8%5.8%5.8%
Adjusted Margin % with AUF Transfer excluding Depreciation & Adjusted Margin % with AUF Transfer excluding Depreciation & Adjusted Margin % with AUF Transfer excluding Depreciation & Adjusted Margin % with AUF Transfer excluding Depreciation & AmortizationAmortizationAmortizationAmortization 15.9%15.9%15.9%15.9% 15.6%15.6%15.6%15.6%
U. T. System Office of the Controller May 2016
May 11-12, 2016 Meeting of the U. T. System Board of Regents - Finance and Planning Committee
Agenda Book - 88

UNAUDITED
The University of Texas at Brownsville
Monthly Financial Report, Comparison of Operating Results and Margin
For the Period Ending March 31, 2016
MarchMarchMarchMarchYear-to-Date Year-to-Date Year-to-Date Year-to-Date FY 2016FY 2016FY 2016FY 2016
MarchMarchMarchMarchYear-to-DateYear-to-DateYear-to-DateYear-to-DateFY 2015FY 2015FY 2015FY 2015 VarianceVarianceVarianceVariance
Fluctuation Fluctuation Fluctuation Fluctuation PercentagePercentagePercentagePercentage
Operating RevenuesOperating RevenuesOperating RevenuesOperating Revenues
Net Student Tuition and Fees - 18,569,767.43 (18,569,767.43) -100.0%
Sponsored Programs - 14,430,825.73 (14,430,825.73) -100.0%
Net Sales and Services of Educational Activities - 1,321,599.88 (1,321,599.88) -100.0%
Net Auxiliary Enterprises - 1,165,392.75 (1,165,392.75) -100.0%
Other Operating Revenues - 46,208.48 (46,208.48) -100.0%
Total Operating RevenuesTotal Operating RevenuesTotal Operating RevenuesTotal Operating Revenues - - - - 35,533,794.2735,533,794.2735,533,794.2735,533,794.27 (35,533,794.27)(35,533,794.27)(35,533,794.27)(35,533,794.27) -100.0%-100.0%-100.0%-100.0%
Operating ExpensesOperating ExpensesOperating ExpensesOperating Expenses
Salaries and Wages - 29,196,974.83 (29,196,974.83) -100.0%
Payroll Related Costs - 8,817,576.35 (8,817,576.35) -100.0%
Professional Fees and Services 232.40 713,100.51 (712,868.11) -100.0%
Other Contracted Services - 439,775.12 (439,775.12) -100.0%
Travel - 843,382.40 (843,382.40) -100.0%
Materials and Supplies 74,001.70 2,985,765.90 (2,911,764.20) -97.5%
Utilities - 1,071,869.39 (1,071,869.39) -100.0%
Communications - 147,987.28 (147,987.28) -100.0%
Repairs and Maintenance 211,575.96 634,087.39 (422,511.43) -66.6%
Rentals and Leases - 2,169,574.88 (2,169,574.88) -100.0%
Printing and Reproduction - 166,354.34 (166,354.34) -100.0%
Scholarships and Fellowships - 18,973,026.20 (18,973,026.20) -100.0%
Depreciation and Amortization 355,154.59 4,957,449.50 (4,602,294.91) -92.8%
Federal Sponsored Program Pass-Through to Other State Agencies - 94,510.21 (94,510.21) -100.0%
Other Operating Expenses - 2,700,785.33 (2,700,785.33) -100.0%
Total Operating ExpensesTotal Operating ExpensesTotal Operating ExpensesTotal Operating Expenses 640,964.65640,964.65640,964.65640,964.65 73,912,219.6373,912,219.6373,912,219.6373,912,219.63 (73,271,254.98)(73,271,254.98)(73,271,254.98)(73,271,254.98) -99.1%-99.1%-99.1%-99.1%
Operating LossOperating LossOperating LossOperating Loss (640,964.65)(640,964.65)(640,964.65)(640,964.65) (38,378,425.36)(38,378,425.36)(38,378,425.36)(38,378,425.36) 37,737,460.7137,737,460.7137,737,460.7137,737,460.71 98.3%98.3%98.3%98.3%
Other Nonoperating AdjustmentsOther Nonoperating AdjustmentsOther Nonoperating AdjustmentsOther Nonoperating Adjustments
State Appropriations - 23,565,717.27 (23,565,717.27) -100.0%
Nonexchange Sponsored Programs - 9,358,433.16 (9,358,433.16) -100.0%
Gift Contributions for Operations - 266,497.54 (266,497.54) -100.0%
Net Investment Income - 1,289,913.81 (1,289,913.81) -100.0%
Interest Expense on Capital Asset Financings - (1,630,563.97) 1,630,563.97 100.0%
Net Other Nonoperating AdjustmentsNet Other Nonoperating AdjustmentsNet Other Nonoperating AdjustmentsNet Other Nonoperating Adjustments - - - - 32,849,997.8132,849,997.8132,849,997.8132,849,997.81 (32,849,997.81)(32,849,997.81)(32,849,997.81)(32,849,997.81) -100.0%-100.0%-100.0%-100.0%
Adjusted Income (Loss) including Depreciation & AmortizationAdjusted Income (Loss) including Depreciation & AmortizationAdjusted Income (Loss) including Depreciation & AmortizationAdjusted Income (Loss) including Depreciation & Amortization (640,964.65)(640,964.65)(640,964.65)(640,964.65) (5,528,427.55)(5,528,427.55)(5,528,427.55)(5,528,427.55) 4,887,462.904,887,462.904,887,462.904,887,462.90 88.4%88.4%88.4%88.4%
Adjusted Margin % including Depreciation & AmortizationAdjusted Margin % including Depreciation & AmortizationAdjusted Margin % including Depreciation & AmortizationAdjusted Margin % including Depreciation & Amortization -7.9%-7.9%-7.9%-7.9%
Investment Gain (Losses) (0.04) (968,644.74) 968,644.70 100.0%
Adj. Inc. (Loss) with Investment Gains (Losses)Adj. Inc. (Loss) with Investment Gains (Losses)Adj. Inc. (Loss) with Investment Gains (Losses)Adj. Inc. (Loss) with Investment Gains (Losses) (640,964.69)(640,964.69)(640,964.69)(640,964.69) (6,497,072.29)(6,497,072.29)(6,497,072.29)(6,497,072.29) 5,856,107.605,856,107.605,856,107.605,856,107.60 90.1%90.1%90.1%90.1%
Adj. Margin % with Investment Gains (Losses)Adj. Margin % with Investment Gains (Losses)Adj. Margin % with Investment Gains (Losses)Adj. Margin % with Investment Gains (Losses) N/A -9.4%-9.4%-9.4%-9.4%
Adjusted Income (Loss) excluding Depreciation & AmortizationAdjusted Income (Loss) excluding Depreciation & AmortizationAdjusted Income (Loss) excluding Depreciation & AmortizationAdjusted Income (Loss) excluding Depreciation & Amortization (285,810.06)(285,810.06)(285,810.06)(285,810.06) (570,978.05)(570,978.05)(570,978.05)(570,978.05) 285,167.99285,167.99285,167.99285,167.99 49.9%49.9%49.9%49.9%
Adjusted Margin % excluding Depreciation & AmortizationAdjusted Margin % excluding Depreciation & AmortizationAdjusted Margin % excluding Depreciation & AmortizationAdjusted Margin % excluding Depreciation & Amortization -0.8%-0.8%-0.8%-0.8%
U. T. System Office of the Controller May 2016
N/A
N/A
May 11-12, 2016 Meeting of the U. T. System Board of Regents - Finance and Planning Committee
Agenda Book - 89

UNAUDITED
The University of Texas at Dallas
Monthly Financial Report, Comparison of Operating Results and Margin
For the Period Ending March 31, 2016
MarchMarchMarchMarchYear-to-Date Year-to-Date Year-to-Date Year-to-Date FY 2016FY 2016FY 2016FY 2016
MarchMarchMarchMarchYear-to-DateYear-to-DateYear-to-DateYear-to-DateFY 2015FY 2015FY 2015FY 2015 VarianceVarianceVarianceVariance
Fluctuation Fluctuation Fluctuation Fluctuation PercentagePercentagePercentagePercentage
Operating RevenuesOperating RevenuesOperating RevenuesOperating Revenues
Net Student Tuition and Fees 165,902,459.09 156,506,849.31 9,395,609.78 6.0%
Sponsored Programs 34,103,711.31 34,235,358.59 (131,647.28) -0.4%
Net Sales and Services of Educational Activities 10,665,571.87 8,731,491.24 1,934,080.63 22.2%
Net Auxiliary Enterprises 16,261,330.91 16,945,713.82 (684,382.91) -4.0%
Other Operating Revenues 2,679,908.70 3,177,363.66 (497,454.96) -15.7%
Total Operating RevenuesTotal Operating RevenuesTotal Operating RevenuesTotal Operating Revenues 229,612,981.88229,612,981.88229,612,981.88229,612,981.88 219,596,776.62219,596,776.62219,596,776.62219,596,776.62 10,016,205.2610,016,205.2610,016,205.2610,016,205.26 4.6%4.6%4.6%4.6%
Operating ExpensesOperating ExpensesOperating ExpensesOperating Expenses
Salaries and Wages 166,212,902.41 152,391,973.21 13,820,929.20 9.1%
Payroll Related Costs 39,039,536.07 36,433,203.33 2,606,332.74 7.2%
Professional Fees and Services 6,042,457.82 5,627,823.93 414,633.89 7.4%
Other Contracted Services 9,209,761.07 11,015,667.31 (1,805,906.24) -16.4%
Travel 3,740,655.60 3,107,995.80 632,659.80 20.4%
Materials and Supplies 19,307,223.83 14,933,535.57 4,373,688.26 29.3%
Utilities 6,492,063.06 6,914,512.12 (422,449.06) -6.1%
Communications 422,249.78 121,229.44 301,020.34 248.3%
Repairs and Maintenance 3,465,406.81 2,910,473.19 554,933.62 19.1%
Rentals and Leases 4,173,831.85 4,019,465.03 154,366.82 3.8%
Printing and Reproduction 1,227,743.20 1,142,262.65 85,480.55 7.5%
Scholarships and Fellowships 23,506,454.47 28,268,856.51 (4,762,402.04) -16.8%
Depreciation and Amortization 37,089,500.00 33,601,811.22 3,487,688.78 10.4%
Federal Sponsored Program Pass-Through to Other State Agencies 43,753.14 17,349.80 26,403.34 152.2%
State Sponsored Program Pass-Through to Other State Agencies 232,682.37 280,079.54 (47,397.17) -16.9%
Other Operating Expenses 12,932,738.27 9,368,101.20 3,564,637.07 38.1%
Total Operating ExpensesTotal Operating ExpensesTotal Operating ExpensesTotal Operating Expenses 333,138,959.75333,138,959.75333,138,959.75333,138,959.75 310,154,339.85310,154,339.85310,154,339.85310,154,339.85 22,984,619.9022,984,619.9022,984,619.9022,984,619.90 7.4%7.4%7.4%7.4%
Operating LossOperating LossOperating LossOperating Loss (103,525,977.87)(103,525,977.87)(103,525,977.87)(103,525,977.87) (90,557,563.23)(90,557,563.23)(90,557,563.23)(90,557,563.23) (12,968,414.64)(12,968,414.64)(12,968,414.64)(12,968,414.64) -14.3%-14.3%-14.3%-14.3%
Other Nonoperating AdjustmentsOther Nonoperating AdjustmentsOther Nonoperating AdjustmentsOther Nonoperating Adjustments
State Appropriations 64,529,784.77 70,373,281.58 (5,843,496.81) -8.3%
Nonexchange Sponsored Programs 31,194,407.42 13,682,940.83 17,511,466.59 128.0%
Gift Contributions for Operations 7,583,333.33 7,630,106.93 (46,773.60) -0.6%
Net Investment Income 13,601,894.15 12,877,384.54 724,509.61 5.6%
Interest Expense on Capital Asset Financings (8,977,226.86) (9,047,061.38) 69,834.52 0.8%
Net Other Nonoperating AdjustmentsNet Other Nonoperating AdjustmentsNet Other Nonoperating AdjustmentsNet Other Nonoperating Adjustments 107,932,192.81107,932,192.81107,932,192.81107,932,192.81 95,516,652.5095,516,652.5095,516,652.5095,516,652.50 12,415,540.3112,415,540.3112,415,540.3112,415,540.31 13.0%13.0%13.0%13.0%
Adjusted Income (Loss) including Depreciation & AmortizationAdjusted Income (Loss) including Depreciation & AmortizationAdjusted Income (Loss) including Depreciation & AmortizationAdjusted Income (Loss) including Depreciation & Amortization 4,406,214.944,406,214.944,406,214.944,406,214.94 4,959,089.274,959,089.274,959,089.274,959,089.27 (552,874.33)(552,874.33)(552,874.33)(552,874.33) -11.1%-11.1%-11.1%-11.1%
Adjusted Margin % including Depreciation & AmortizationAdjusted Margin % including Depreciation & AmortizationAdjusted Margin % including Depreciation & AmortizationAdjusted Margin % including Depreciation & Amortization 1.3%1.3%1.3%1.3% 1.5%1.5%1.5%1.5%
Investment Gain (Losses) (13,492,246.50) (6,827,386.94) (6,664,859.56) -97.6%
Adj. Inc. (Loss) with Investment Gains (Losses)Adj. Inc. (Loss) with Investment Gains (Losses)Adj. Inc. (Loss) with Investment Gains (Losses)Adj. Inc. (Loss) with Investment Gains (Losses) (9,086,031.56)(9,086,031.56)(9,086,031.56)(9,086,031.56) (1,868,297.67)(1,868,297.67)(1,868,297.67)(1,868,297.67) (7,217,733.89)(7,217,733.89)(7,217,733.89)(7,217,733.89) -386.3%-386.3%-386.3%-386.3%
Adj. Margin % with Investment Gains (Losses)Adj. Margin % with Investment Gains (Losses)Adj. Margin % with Investment Gains (Losses)Adj. Margin % with Investment Gains (Losses) -2.7%-2.7%-2.7%-2.7% -0.6%-0.6%-0.6%-0.6%
Adjusted Income (Loss) excluding Depreciation & AmortizationAdjusted Income (Loss) excluding Depreciation & AmortizationAdjusted Income (Loss) excluding Depreciation & AmortizationAdjusted Income (Loss) excluding Depreciation & Amortization 41,495,714.9441,495,714.9441,495,714.9441,495,714.94 38,560,900.4938,560,900.4938,560,900.4938,560,900.49 2,934,814.452,934,814.452,934,814.452,934,814.45 7.6%7.6%7.6%7.6%
Adjusted Margin % excluding Depreciation & AmortizationAdjusted Margin % excluding Depreciation & AmortizationAdjusted Margin % excluding Depreciation & AmortizationAdjusted Margin % excluding Depreciation & Amortization 12.0%12.0%12.0%12.0% 11.9%11.9%11.9%11.9%
U. T. System Office of the Controller May 2016
May 11-12, 2016 Meeting of the U. T. System Board of Regents - Finance and Planning Committee
Agenda Book - 90

UNAUDITED
The University of Texas at El Paso
Monthly Financial Report, Comparison of Operating Results and Margin
For the Period Ending March 31, 2016
MarchMarchMarchMarchYear-to-Date Year-to-Date Year-to-Date Year-to-Date FY 2016FY 2016FY 2016FY 2016
MarchMarchMarchMarchYear-to-DateYear-to-DateYear-to-DateYear-to-DateFY 2015FY 2015FY 2015FY 2015 VarianceVarianceVarianceVariance
Fluctuation Fluctuation Fluctuation Fluctuation PercentagePercentagePercentagePercentage
Operating RevenuesOperating RevenuesOperating RevenuesOperating Revenues
Net Student Tuition and Fees 68,496,426.95 65,656,158.45 2,840,268.50 4.3%
Sponsored Programs 53,407,478.56 46,334,560.07 7,072,918.49 15.3%
Net Sales and Services of Educational Activities 4,552,768.20 3,749,255.50 803,512.70 21.4%
Net Auxiliary Enterprises 18,682,205.90 23,010,580.10 (4,328,374.20) -18.8%
Other Operating Revenues (7,902.63) 49,835.83 (57,738.46) -115.9%
Total Operating RevenuesTotal Operating RevenuesTotal Operating RevenuesTotal Operating Revenues 145,130,976.98145,130,976.98145,130,976.98145,130,976.98 138,800,389.95138,800,389.95138,800,389.95138,800,389.95 6,330,587.036,330,587.036,330,587.036,330,587.03 4.6%4.6%4.6%4.6%
Operating ExpensesOperating ExpensesOperating ExpensesOperating Expenses
Salaries and Wages 110,369,830.70 99,414,291.97 10,955,538.73 11.0%
Payroll Related Costs 29,084,382.17 26,552,989.39 2,531,392.78 9.5%
Professional Fees and Services 6,701,928.24 1,864,375.17 4,837,553.07 259.5%
Other Contracted Services 7,145,995.90 19,632,280.56 (12,486,284.66) -63.6%
Travel 4,717,252.62 4,562,765.55 154,487.07 3.4%
Materials and Supplies 11,542,976.33 11,104,081.13 438,895.20 4.0%
Utilities 4,982,683.03 4,858,956.69 123,726.34 2.5%
Communications 595,559.89 743,557.58 (147,997.69) -19.9%
Repairs and Maintenance 3,823,783.97 3,158,501.77 665,282.20 21.1%
Rentals and Leases 1,931,081.53 2,528,160.23 (597,078.70) -23.6%
Printing and Reproduction 682,625.19 811,150.20 (128,525.01) -15.8%
Scholarships and Fellowships 44,818,748.16 39,660,842.53 5,157,905.63 13.0%
Depreciation and Amortization 18,249,244.67 17,510,614.01 738,630.66 4.2%
Federal Sponsored Program Pass-Through to Other State Agencies 2,971,813.54 168,854.82 2,802,958.72 1,660.0%
State Sponsored Program Pass-Through to Other State Agencies - 34,450.69 (34,450.69) -100.0%
Other Operating Expenses 7,223,002.91 5,616,426.52 1,606,576.39 28.6%
Total Operating ExpensesTotal Operating ExpensesTotal Operating ExpensesTotal Operating Expenses 254,840,908.85254,840,908.85254,840,908.85254,840,908.85 238,222,298.81238,222,298.81238,222,298.81238,222,298.81 16,618,610.0416,618,610.0416,618,610.0416,618,610.04 7.0%7.0%7.0%7.0%
Operating LossOperating LossOperating LossOperating Loss (109,709,931.87)(109,709,931.87)(109,709,931.87)(109,709,931.87) (99,421,908.86)(99,421,908.86)(99,421,908.86)(99,421,908.86) (10,288,023.01)(10,288,023.01)(10,288,023.01)(10,288,023.01) -10.3%-10.3%-10.3%-10.3%
Other Nonoperating AdjustmentsOther Nonoperating AdjustmentsOther Nonoperating AdjustmentsOther Nonoperating Adjustments
State Appropriations 65,232,895.00 58,707,187.00 6,525,708.00 11.1%
Nonexchange Sponsored Programs 26,615,854.72 26,824,163.02 (208,308.30) -0.8%
Gift Contributions for Operations 3,694,877.54 2,956,292.80 738,584.74 25.0%
Net Investment Income 7,216,784.26 7,428,426.73 (211,642.47) -2.8%
Interest Expense on Capital Asset Financings (4,189,141.95) (4,558,462.16) 369,320.21 8.1%
Net Other Nonoperating AdjustmentsNet Other Nonoperating AdjustmentsNet Other Nonoperating AdjustmentsNet Other Nonoperating Adjustments 98,571,269.5798,571,269.5798,571,269.5798,571,269.57 91,357,607.3991,357,607.3991,357,607.3991,357,607.39 7,213,662.187,213,662.187,213,662.187,213,662.18 7.9%7.9%7.9%7.9%
Adjusted Income (Loss) including Depreciation & AmortizationAdjusted Income (Loss) including Depreciation & AmortizationAdjusted Income (Loss) including Depreciation & AmortizationAdjusted Income (Loss) including Depreciation & Amortization (11,138,662.30)(11,138,662.30)(11,138,662.30)(11,138,662.30) (8,064,301.47)(8,064,301.47)(8,064,301.47)(8,064,301.47) (3,074,360.83)(3,074,360.83)(3,074,360.83)(3,074,360.83) -38.1%-38.1%-38.1%-38.1%
Adjusted Margin % including Depreciation & AmortizationAdjusted Margin % including Depreciation & AmortizationAdjusted Margin % including Depreciation & AmortizationAdjusted Margin % including Depreciation & Amortization -4.5%-4.5%-4.5%-4.5% -3.4%-3.4%-3.4%-3.4%
Investment Gain (Losses) (14,234,379.75) (3,859,399.22) (10,374,980.53) -268.8%
Adj. Inc. (Loss) with Investment Gains (Losses)Adj. Inc. (Loss) with Investment Gains (Losses)Adj. Inc. (Loss) with Investment Gains (Losses)Adj. Inc. (Loss) with Investment Gains (Losses) (25,373,042.05)(25,373,042.05)(25,373,042.05)(25,373,042.05) (11,923,700.69)(11,923,700.69)(11,923,700.69)(11,923,700.69) (13,449,341.36)(13,449,341.36)(13,449,341.36)(13,449,341.36) -112.8%-112.8%-112.8%-112.8%
Adj. Margin % with Investment Gains (Losses)Adj. Margin % with Investment Gains (Losses)Adj. Margin % with Investment Gains (Losses)Adj. Margin % with Investment Gains (Losses) -10.9%-10.9%-10.9%-10.9% -5.2%-5.2%-5.2%-5.2%
Adjusted Income (Loss) excluding Depreciation & AmortizationAdjusted Income (Loss) excluding Depreciation & AmortizationAdjusted Income (Loss) excluding Depreciation & AmortizationAdjusted Income (Loss) excluding Depreciation & Amortization 7,110,582.377,110,582.377,110,582.377,110,582.37 9,446,312.549,446,312.549,446,312.549,446,312.54 (2,335,730.17)(2,335,730.17)(2,335,730.17)(2,335,730.17) -24.7%-24.7%-24.7%-24.7%
Adjusted Margin % excluding Depreciation & AmortizationAdjusted Margin % excluding Depreciation & AmortizationAdjusted Margin % excluding Depreciation & AmortizationAdjusted Margin % excluding Depreciation & Amortization 2.9%2.9%2.9%2.9% 4.0%4.0%4.0%4.0%
U. T. System Office of the Controller May 2016
May 11-12, 2016 Meeting of the U. T. System Board of Regents - Finance and Planning Committee
Agenda Book - 91
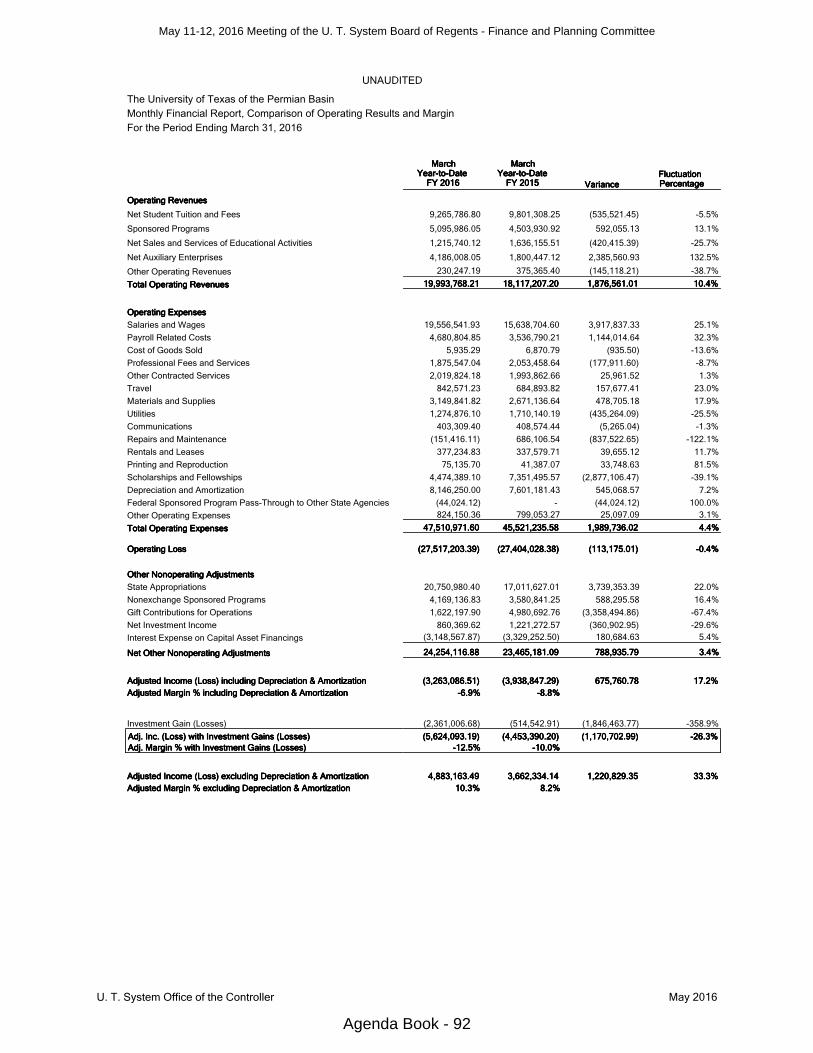
UNAUDITED
The University of Texas of the Permian Basin
Monthly Financial Report, Comparison of Operating Results and Margin
For the Period Ending March 31, 2016
MarchMarchMarchMarchYear-to-Date Year-to-Date Year-to-Date Year-to-Date FY 2016FY 2016FY 2016FY 2016
MarchMarchMarchMarchYear-to-DateYear-to-DateYear-to-DateYear-to-DateFY 2015FY 2015FY 2015FY 2015 VarianceVarianceVarianceVariance
Fluctuation Fluctuation Fluctuation Fluctuation PercentagePercentagePercentagePercentage
Operating RevenuesOperating RevenuesOperating RevenuesOperating Revenues
Net Student Tuition and Fees 9,265,786.80 9,801,308.25 (535,521.45) -5.5%
Sponsored Programs 5,095,986.05 4,503,930.92 592,055.13 13.1%
Net Sales and Services of Educational Activities 1,215,740.12 1,636,155.51 (420,415.39) -25.7%
Net Auxiliary Enterprises 4,186,008.05 1,800,447.12 2,385,560.93 132.5%
Other Operating Revenues 230,247.19 375,365.40 (145,118.21) -38.7%
Total Operating RevenuesTotal Operating RevenuesTotal Operating RevenuesTotal Operating Revenues 19,993,768.2119,993,768.2119,993,768.2119,993,768.21 18,117,207.2018,117,207.2018,117,207.2018,117,207.20 1,876,561.011,876,561.011,876,561.011,876,561.01 10.4%10.4%10.4%10.4%
Operating ExpensesOperating ExpensesOperating ExpensesOperating Expenses
Salaries and Wages 19,556,541.93 15,638,704.60 3,917,837.33 25.1%
Payroll Related Costs 4,680,804.85 3,536,790.21 1,144,014.64 32.3%
Cost of Goods Sold 5,935.29 6,870.79 (935.50) -13.6%
Professional Fees and Services 1,875,547.04 2,053,458.64 (177,911.60) -8.7%
Other Contracted Services 2,019,824.18 1,993,862.66 25,961.52 1.3%
Travel 842,571.23 684,893.82 157,677.41 23.0%
Materials and Supplies 3,149,841.82 2,671,136.64 478,705.18 17.9%
Utilities 1,274,876.10 1,710,140.19 (435,264.09) -25.5%
Communications 403,309.40 408,574.44 (5,265.04) -1.3%
Repairs and Maintenance (151,416.11) 686,106.54 (837,522.65) -122.1%
Rentals and Leases 377,234.83 337,579.71 39,655.12 11.7%
Printing and Reproduction 75,135.70 41,387.07 33,748.63 81.5%
Scholarships and Fellowships 4,474,389.10 7,351,495.57 (2,877,106.47) -39.1%
Depreciation and Amortization 8,146,250.00 7,601,181.43 545,068.57 7.2%
Federal Sponsored Program Pass-Through to Other State Agencies (44,024.12) - (44,024.12) 100.0%
Other Operating Expenses 824,150.36 799,053.27 25,097.09 3.1%
Total Operating ExpensesTotal Operating ExpensesTotal Operating ExpensesTotal Operating Expenses 47,510,971.6047,510,971.6047,510,971.6047,510,971.60 45,521,235.5845,521,235.5845,521,235.5845,521,235.58 1,989,736.021,989,736.021,989,736.021,989,736.02 4.4%4.4%4.4%4.4%
Operating LossOperating LossOperating LossOperating Loss (27,517,203.39)(27,517,203.39)(27,517,203.39)(27,517,203.39) (27,404,028.38)(27,404,028.38)(27,404,028.38)(27,404,028.38) (113,175.01)(113,175.01)(113,175.01)(113,175.01) -0.4%-0.4%-0.4%-0.4%
Other Nonoperating AdjustmentsOther Nonoperating AdjustmentsOther Nonoperating AdjustmentsOther Nonoperating Adjustments
State Appropriations 20,750,980.40 17,011,627.01 3,739,353.39 22.0%
Nonexchange Sponsored Programs 4,169,136.83 3,580,841.25 588,295.58 16.4%
Gift Contributions for Operations 1,622,197.90 4,980,692.76 (3,358,494.86) -67.4%
Net Investment Income 860,369.62 1,221,272.57 (360,902.95) -29.6%
Interest Expense on Capital Asset Financings (3,148,567.87) (3,329,252.50) 180,684.63 5.4%
Net Other Nonoperating AdjustmentsNet Other Nonoperating AdjustmentsNet Other Nonoperating AdjustmentsNet Other Nonoperating Adjustments 24,254,116.8824,254,116.8824,254,116.8824,254,116.88 23,465,181.0923,465,181.0923,465,181.0923,465,181.09 788,935.79788,935.79788,935.79788,935.79 3.4%3.4%3.4%3.4%
Adjusted Income (Loss) including Depreciation & AmortizationAdjusted Income (Loss) including Depreciation & AmortizationAdjusted Income (Loss) including Depreciation & AmortizationAdjusted Income (Loss) including Depreciation & Amortization (3,263,086.51)(3,263,086.51)(3,263,086.51)(3,263,086.51) (3,938,847.29)(3,938,847.29)(3,938,847.29)(3,938,847.29) 675,760.78675,760.78675,760.78675,760.78 17.2%17.2%17.2%17.2%
Adjusted Margin % including Depreciation & AmortizationAdjusted Margin % including Depreciation & AmortizationAdjusted Margin % including Depreciation & AmortizationAdjusted Margin % including Depreciation & Amortization -6.9%-6.9%-6.9%-6.9% -8.8%-8.8%-8.8%-8.8%
Investment Gain (Losses) (2,361,006.68) (514,542.91) (1,846,463.77) -358.9%
Adj. Inc. (Loss) with Investment Gains (Losses)Adj. Inc. (Loss) with Investment Gains (Losses)Adj. Inc. (Loss) with Investment Gains (Losses)Adj. Inc. (Loss) with Investment Gains (Losses) (5,624,093.19)(5,624,093.19)(5,624,093.19)(5,624,093.19) (4,453,390.20)(4,453,390.20)(4,453,390.20)(4,453,390.20) (1,170,702.99)(1,170,702.99)(1,170,702.99)(1,170,702.99) -26.3%-26.3%-26.3%-26.3%
Adj. Margin % with Investment Gains (Losses)Adj. Margin % with Investment Gains (Losses)Adj. Margin % with Investment Gains (Losses)Adj. Margin % with Investment Gains (Losses) -12.5%-12.5%-12.5%-12.5% -10.0%-10.0%-10.0%-10.0%
Adjusted Income (Loss) excluding Depreciation & AmortizationAdjusted Income (Loss) excluding Depreciation & AmortizationAdjusted Income (Loss) excluding Depreciation & AmortizationAdjusted Income (Loss) excluding Depreciation & Amortization 4,883,163.494,883,163.494,883,163.494,883,163.49 3,662,334.143,662,334.143,662,334.143,662,334.14 1,220,829.351,220,829.351,220,829.351,220,829.35 33.3%33.3%33.3%33.3%
Adjusted Margin % excluding Depreciation & AmortizationAdjusted Margin % excluding Depreciation & AmortizationAdjusted Margin % excluding Depreciation & AmortizationAdjusted Margin % excluding Depreciation & Amortization 10.3%10.3%10.3%10.3% 8.2%8.2%8.2%8.2%
U. T. System Office of the Controller May 2016
May 11-12, 2016 Meeting of the U. T. System Board of Regents - Finance and Planning Committee
Agenda Book - 92

UNAUDITED
The University of Texas Rio Grande Valley
Monthly Financial Report, Comparison of Operating Results and Margin
For the Period Ending March 31, 2016
MarchMarchMarchMarchYear-to-Date Year-to-Date Year-to-Date Year-to-Date FY 2016FY 2016FY 2016FY 2016
MarchMarchMarchMarchYear-to-DateYear-to-DateYear-to-DateYear-to-DateFY 2015FY 2015FY 2015FY 2015 VarianceVarianceVarianceVariance
Fluctuation Fluctuation Fluctuation Fluctuation PercentagePercentagePercentagePercentage
Operating RevenuesOperating RevenuesOperating RevenuesOperating Revenues
Net Student Tuition and Fees 70,639,809.87 - 70,639,809.87 100.0%
Sponsored Programs 58,742,553.62 - 58,742,553.62 100.0%
Net Sales and Services of Educational Activities 2,612,790.46 - 2,612,790.46 100.0%
Net Professional Fees 131,602.58 - 131,602.58 100.0%
Net Auxiliary Enterprises 6,646,340.37 - 6,646,340.37 100.0%
Other Operating Revenues 5,701,254.46 - 5,701,254.46 100.0%
Total Operating RevenuesTotal Operating RevenuesTotal Operating RevenuesTotal Operating Revenues 144,474,351.36144,474,351.36144,474,351.36144,474,351.36 - - - - 144,474,351.36144,474,351.36144,474,351.36144,474,351.36 100.0%100.0%100.0%100.0%
Operating ExpensesOperating ExpensesOperating ExpensesOperating Expenses
Salaries and Wages 115,595,441.93 - 115,595,441.93 100.0%
Payroll Related Costs 33,825,127.04 - 33,825,127.04 100.0%
Cost of Goods Sold 269,059.21 - 269,059.21 100.0%
Professional Fees and Services 1,259,013.11 - 1,259,013.11 100.0%
Other Contracted Services 4,995,024.36 - 4,995,024.36 100.0%
Travel 4,113,082.38 - 4,113,082.38 100.0%
Materials and Supplies 8,448,457.49 - 8,448,457.49 100.0%
Utilities 4,542,672.12 - 4,542,672.12 100.0%
Communications 304,706.14 - 304,706.14 100.0%
Repairs and Maintenance 2,749,680.95 - 2,749,680.95 100.0%
Rentals and Leases 2,812,593.75 - 2,812,593.75 100.0%
Printing and Reproduction 400,059.74 - 400,059.74 100.0%
Bad Debt Expense 4,700.38 - 4,700.38 100.0%
Scholarships and Fellowships 59,267,930.11 - 59,267,930.11 100.0%
Depreciation and Amortization 22,076,702.51 - 22,076,702.51 100.0%
Federal Sponsored Program Pass-Through to Other State Agencies 145,273.37 - 145,273.37 100.0%
Other Operating Expenses 4,849,838.52 - 4,849,838.52 100.0%
Total Operating ExpensesTotal Operating ExpensesTotal Operating ExpensesTotal Operating Expenses 265,659,363.11265,659,363.11265,659,363.11265,659,363.11 - - - - 265,659,363.11265,659,363.11265,659,363.11265,659,363.11 100.0%100.0%100.0%100.0%
Operating LossOperating LossOperating LossOperating Loss (121,185,011.75)(121,185,011.75)(121,185,011.75)(121,185,011.75) - - - - (121,185,011.75)(121,185,011.75)(121,185,011.75)(121,185,011.75) 100.0%100.0%100.0%100.0%
Other Nonoperating AdjustmentsOther Nonoperating AdjustmentsOther Nonoperating AdjustmentsOther Nonoperating Adjustments
State Appropriations 88,992,512.00 - 88,992,512.00 100.0%
Nonexchange Sponsored Programs 34,458,985.07 - 34,458,985.07 100.0%
Gift Contributions for Operations 5,653,670.05 - 5,653,670.05 100.0%
Net Investment Income 3,435,857.92 - 3,435,857.92 100.0%
Interest Expense on Capital Asset Financings (3,685,408.86) - (3,685,408.86) 100.0%
Net Other Nonoperating AdjustmentsNet Other Nonoperating AdjustmentsNet Other Nonoperating AdjustmentsNet Other Nonoperating Adjustments 128,855,616.18128,855,616.18128,855,616.18128,855,616.18 - - - - 128,855,616.18128,855,616.18128,855,616.18128,855,616.18 100.0%100.0%100.0%100.0%
Adjusted Income (Loss) including Depreciation & AmortizationAdjusted Income (Loss) including Depreciation & AmortizationAdjusted Income (Loss) including Depreciation & AmortizationAdjusted Income (Loss) including Depreciation & Amortization 7,670,604.437,670,604.437,670,604.437,670,604.43 - - - - 7,670,604.437,670,604.437,670,604.437,670,604.43 100.0%100.0%100.0%100.0%
Adjusted Margin % including Depreciation & AmortizationAdjusted Margin % including Depreciation & AmortizationAdjusted Margin % including Depreciation & AmortizationAdjusted Margin % including Depreciation & Amortization 2.8%2.8%2.8%2.8%
Investment Gain (Losses) (4,268,324.63) - (4,268,324.63) 100.0%
Adj. Inc. (Loss) with Investment Gains (Losses)Adj. Inc. (Loss) with Investment Gains (Losses)Adj. Inc. (Loss) with Investment Gains (Losses)Adj. Inc. (Loss) with Investment Gains (Losses) 3,402,279.803,402,279.803,402,279.803,402,279.80 - - - - 3,402,279.803,402,279.803,402,279.803,402,279.80 100.0%100.0%100.0%100.0%
Adj. Margin % with Investment Gains (Losses)Adj. Margin % with Investment Gains (Losses)Adj. Margin % with Investment Gains (Losses)Adj. Margin % with Investment Gains (Losses) 1.2%1.2%1.2%1.2%
Adjusted Income (Loss) excluding Depreciation & AmortizationAdjusted Income (Loss) excluding Depreciation & AmortizationAdjusted Income (Loss) excluding Depreciation & AmortizationAdjusted Income (Loss) excluding Depreciation & Amortization 29,747,306.9429,747,306.9429,747,306.9429,747,306.94 - - - - 29,747,306.9429,747,306.9429,747,306.9429,747,306.94 100.0%100.0%100.0%100.0%
Adjusted Margin % excluding Depreciation & AmortizationAdjusted Margin % excluding Depreciation & AmortizationAdjusted Margin % excluding Depreciation & AmortizationAdjusted Margin % excluding Depreciation & Amortization 10.7%10.7%10.7%10.7%
U. T. System Office of the Controller May 2016
May 11-12, 2016 Meeting of the U. T. System Board of Regents - Finance and Planning Committee
Agenda Book - 93

UNAUDITED
The University of Texas at San Antonio
Monthly Financial Report, Comparison of Operating Results and Margin
For the Period Ending March 31, 2016
MarchMarchMarchMarchYear-to-Date Year-to-Date Year-to-Date Year-to-Date FY 2016FY 2016FY 2016FY 2016
MarchMarchMarchMarchYear-to-DateYear-to-DateYear-to-DateYear-to-DateFY 2015FY 2015FY 2015FY 2015 VarianceVarianceVarianceVariance
Fluctuation Fluctuation Fluctuation Fluctuation PercentagePercentagePercentagePercentage
Operating RevenuesOperating RevenuesOperating RevenuesOperating Revenues
Net Student Tuition and Fees 106,898,041.77 113,838,010.13 (6,939,968.36) -6.1%
Sponsored Programs 35,805,583.55 35,474,416.73 331,166.82 0.9%
Net Sales and Services of Educational Activities 8,809,640.02 8,051,502.39 758,137.63 9.4%
Net Auxiliary Enterprises 26,409,668.51 24,692,475.17 1,717,193.34 7.0%
Other Operating Revenues 2,148,351.51 1,858,765.24 289,586.27 15.6%
Total Operating RevenuesTotal Operating RevenuesTotal Operating RevenuesTotal Operating Revenues 180,071,285.36180,071,285.36180,071,285.36180,071,285.36 183,915,169.66183,915,169.66183,915,169.66183,915,169.66 (3,843,884.30)(3,843,884.30)(3,843,884.30)(3,843,884.30) -2.1%-2.1%-2.1%-2.1%
Operating ExpensesOperating ExpensesOperating ExpensesOperating Expenses
Salaries and Wages 141,659,109.11 131,524,689.21 10,134,419.90 7.7%
Payroll Related Costs 36,232,619.35 33,592,439.69 2,640,179.66 7.9%
Cost of Goods Sold 175,000.00 228,860.34 (53,860.34) -23.5%
Professional Fees and Services 3,734,088.73 3,476,062.29 258,026.44 7.4%
Other Contracted Services 8,225,082.85 9,966,192.82 (1,741,109.97) -17.5%
Travel 6,343,774.17 5,600,353.64 743,420.53 13.3%
Materials and Supplies 17,842,970.14 17,779,330.20 63,639.94 0.4%
Utilities 7,226,784.33 7,758,333.33 (531,549.00) -6.9%
Communications 1,727,996.26 1,378,390.45 349,605.81 25.4%
Repairs and Maintenance 4,894,097.83 5,089,768.97 (195,671.14) -3.8%
Rentals and Leases 1,353,955.77 1,395,542.17 (41,586.40) -3.0%
Printing and Reproduction 868,683.48 1,004,089.14 (135,405.66) -13.5%
Bad Debt Expense 127,721.42 46,666.67 81,054.75 173.7%
Scholarships and Fellowships 25,811,258.67 22,982,842.86 2,828,415.81 12.3%
Depreciation and Amortization 27,915,678.39 28,469,006.29 (553,327.90) -1.9%
Federal Sponsored Program Pass-Through to Other State Agencies 962,430.23 906,980.34 55,449.89 6.1%
Other Operating Expenses 8,884,592.41 8,793,058.89 91,533.52 1.0%
Total Operating ExpensesTotal Operating ExpensesTotal Operating ExpensesTotal Operating Expenses 293,985,843.14293,985,843.14293,985,843.14293,985,843.14 279,992,607.30279,992,607.30279,992,607.30279,992,607.30 13,993,235.8413,993,235.8413,993,235.8413,993,235.84 5.0%5.0%5.0%5.0%
Operating LossOperating LossOperating LossOperating Loss (113,914,557.78)(113,914,557.78)(113,914,557.78)(113,914,557.78) (96,077,437.64)(96,077,437.64)(96,077,437.64)(96,077,437.64) (17,837,120.14)(17,837,120.14)(17,837,120.14)(17,837,120.14) -18.6%-18.6%-18.6%-18.6%
Other Nonoperating AdjustmentsOther Nonoperating AdjustmentsOther Nonoperating AdjustmentsOther Nonoperating Adjustments
State Appropriations 75,099,225.25 71,800,298.50 3,298,926.75 4.6%
Nonexchange Sponsored Programs 29,895,801.25 27,257,501.25 2,638,300.00 9.7%
Gift Contributions for Operations 4,666,666.67 4,348,193.43 318,473.24 7.3%
Net Investment Income 15,938,570.49 11,197,565.74 4,741,004.75 42.3%
Interest Expense on Capital Asset Financings (8,586,547.69) (9,213,262.15) 626,714.46 6.8%
Net Other Nonoperating AdjustmentsNet Other Nonoperating AdjustmentsNet Other Nonoperating AdjustmentsNet Other Nonoperating Adjustments 117,013,715.97117,013,715.97117,013,715.97117,013,715.97 105,390,296.77105,390,296.77105,390,296.77105,390,296.77 11,623,419.2011,623,419.2011,623,419.2011,623,419.20 11.0%11.0%11.0%11.0%
Adjusted Income (Loss) including Depreciation & AmortizationAdjusted Income (Loss) including Depreciation & AmortizationAdjusted Income (Loss) including Depreciation & AmortizationAdjusted Income (Loss) including Depreciation & Amortization 3,099,158.193,099,158.193,099,158.193,099,158.19 9,312,859.139,312,859.139,312,859.139,312,859.13 (6,213,700.94)(6,213,700.94)(6,213,700.94)(6,213,700.94) -66.7%-66.7%-66.7%-66.7%
Adjusted Margin % including Depreciation & AmortizationAdjusted Margin % including Depreciation & AmortizationAdjusted Margin % including Depreciation & AmortizationAdjusted Margin % including Depreciation & Amortization 1.0%1.0%1.0%1.0% 3.1%3.1%3.1%3.1%
Investment Gain (Losses) (25,643,439.57) 29,415,511.53 (55,058,951.10) -187.2%
Adj. Inc. (Loss) with Investment Gains (Losses)Adj. Inc. (Loss) with Investment Gains (Losses)Adj. Inc. (Loss) with Investment Gains (Losses)Adj. Inc. (Loss) with Investment Gains (Losses) (22,544,281.38)(22,544,281.38)(22,544,281.38)(22,544,281.38) 38,728,370.6638,728,370.6638,728,370.6638,728,370.66 (61,272,652.04)(61,272,652.04)(61,272,652.04)(61,272,652.04) -158.2%-158.2%-158.2%-158.2%
Adj. Margin % with Investment Gains (Losses)Adj. Margin % with Investment Gains (Losses)Adj. Margin % with Investment Gains (Losses)Adj. Margin % with Investment Gains (Losses) -8.1%-8.1%-8.1%-8.1% 11.8%11.8%11.8%11.8%
Adjusted Income (Loss) excluding Depreciation & AmortizationAdjusted Income (Loss) excluding Depreciation & AmortizationAdjusted Income (Loss) excluding Depreciation & AmortizationAdjusted Income (Loss) excluding Depreciation & Amortization 31,014,836.5831,014,836.5831,014,836.5831,014,836.58 37,781,865.4237,781,865.4237,781,865.4237,781,865.42 (6,767,028.84)(6,767,028.84)(6,767,028.84)(6,767,028.84) -17.9%-17.9%-17.9%-17.9%
Adjusted Margin % excluding Depreciation & AmortizationAdjusted Margin % excluding Depreciation & AmortizationAdjusted Margin % excluding Depreciation & AmortizationAdjusted Margin % excluding Depreciation & Amortization 10.1%10.1%10.1%10.1% 12.7%12.7%12.7%12.7%
U. T. System Office of the Controller May 2016
May 11-12, 2016 Meeting of the U. T. System Board of Regents - Finance and Planning Committee
Agenda Book - 94

UNAUDITED
The University of Texas at Tyler
Monthly Financial Report, Comparison of Operating Results and Margin
For the Period Ending March 31, 2016
MarchMarchMarchMarchYear-to-Date Year-to-Date Year-to-Date Year-to-Date FY 2016FY 2016FY 2016FY 2016
MarchMarchMarchMarchYear-to-DateYear-to-DateYear-to-DateYear-to-DateFY 2015FY 2015FY 2015FY 2015 VarianceVarianceVarianceVariance
Fluctuation Fluctuation Fluctuation Fluctuation PercentagePercentagePercentagePercentage
Operating RevenuesOperating RevenuesOperating RevenuesOperating Revenues
Net Student Tuition and Fees 23,683,559.68 22,262,486.98 1,421,072.70 6.4%
Sponsored Programs 6,783,132.57 8,544,475.54 (1,761,342.97) -20.6%
Net Sales and Services of Educational Activities 4,152,620.05 2,267,019.77 1,885,600.28 83.2%
Net Auxiliary Enterprises 4,879,623.00 3,848,439.00 1,031,184.00 26.8%
Other Operating Revenues 255,285.77 177,657.62 77,628.15 43.7%
Total Operating RevenuesTotal Operating RevenuesTotal Operating RevenuesTotal Operating Revenues 39,754,221.0739,754,221.0739,754,221.0739,754,221.07 37,100,078.9137,100,078.9137,100,078.9137,100,078.91 2,654,142.162,654,142.162,654,142.162,654,142.16 7.2%7.2%7.2%7.2%
Operating ExpensesOperating ExpensesOperating ExpensesOperating Expenses
Salaries and Wages 39,856,303.94 33,454,874.15 6,401,429.79 19.1%
Payroll Related Costs 9,514,736.43 8,592,583.80 922,152.63 10.7%
Cost of Goods Sold 17,739.57 16,616.65 1,122.92 6.8%
Professional Fees and Services 1,529,431.13 2,024,559.32 (495,128.19) -24.5%
Other Contracted Services 3,392,945.10 3,310,648.12 82,296.98 2.5%
Travel 1,149,158.90 1,007,755.03 141,403.87 14.0%
Materials and Supplies 4,902,407.84 4,488,431.44 413,976.40 9.2%
Utilities 1,510,742.36 1,307,626.01 203,116.35 15.5%
Communications 374,860.10 736,246.15 (361,386.05) -49.1%
Repairs and Maintenance 1,582,664.13 1,957,495.14 (374,831.01) -19.1%
Rentals and Leases 396,617.03 349,619.16 46,997.87 13.4%
Printing and Reproduction 811,876.41 785,627.86 26,248.55 3.3%
Bad Debt Expense - 20,500.59 (20,500.59) -100.0%
Scholarships and Fellowships 1,624,136.62 3,665,582.84 (2,041,446.22) -55.7%
Depreciation and Amortization 8,104,895.73 7,027,247.42 1,077,648.31 15.3%
Federal Sponsored Program Pass-Through to Other State Agencies - 23,303.00 (23,303.00) -100.0%
Other Operating Expenses 2,064,322.21 1,691,798.93 372,523.28 22.0%
Total Operating ExpensesTotal Operating ExpensesTotal Operating ExpensesTotal Operating Expenses 76,832,837.5076,832,837.5076,832,837.5076,832,837.50 70,460,515.6170,460,515.6170,460,515.6170,460,515.61 6,372,321.896,372,321.896,372,321.896,372,321.89 9.0%9.0%9.0%9.0%
Operating LossOperating LossOperating LossOperating Loss (37,078,616.43)(37,078,616.43)(37,078,616.43)(37,078,616.43) (33,360,436.70)(33,360,436.70)(33,360,436.70)(33,360,436.70) (3,718,179.73)(3,718,179.73)(3,718,179.73)(3,718,179.73) -11.1%-11.1%-11.1%-11.1%
Other Nonoperating AdjustmentsOther Nonoperating AdjustmentsOther Nonoperating AdjustmentsOther Nonoperating Adjustments
State Appropriations 23,243,528.00 21,283,346.00 1,960,182.00 9.2%
Nonexchange Sponsored Programs 5,718,524.00 4,616,526.00 1,101,998.00 23.9%
Gift Contributions for Operations 1,061,227.15 3,144,577.28 (2,083,350.13) -66.3%
Net Investment Income 2,584,275.89 2,707,230.16 (122,954.27) -4.5%
Interest Expense on Capital Asset Financings (2,047,150.21) (2,456,909.07) 409,758.86 16.7%
Net Other Nonoperating AdjustmentsNet Other Nonoperating AdjustmentsNet Other Nonoperating AdjustmentsNet Other Nonoperating Adjustments 30,560,404.8330,560,404.8330,560,404.8330,560,404.83 29,294,770.3729,294,770.3729,294,770.3729,294,770.37 1,265,634.461,265,634.461,265,634.461,265,634.46 4.3%4.3%4.3%4.3%
Adjusted Income (Loss) including Depreciation & AmortizationAdjusted Income (Loss) including Depreciation & AmortizationAdjusted Income (Loss) including Depreciation & AmortizationAdjusted Income (Loss) including Depreciation & Amortization (6,518,211.60)(6,518,211.60)(6,518,211.60)(6,518,211.60) (4,065,666.33)(4,065,666.33)(4,065,666.33)(4,065,666.33) (2,452,545.27)(2,452,545.27)(2,452,545.27)(2,452,545.27) -60.3%-60.3%-60.3%-60.3%
Adjusted Margin % including Depreciation & AmortizationAdjusted Margin % including Depreciation & AmortizationAdjusted Margin % including Depreciation & AmortizationAdjusted Margin % including Depreciation & Amortization -9.0%-9.0%-9.0%-9.0% -5.9%-5.9%-5.9%-5.9%
Investment Gain (Losses) (3,775,564.56) (1,200,351.77) (2,575,212.79) -214.5%
Adj. Inc. (Loss) with Investment Gains (Losses)Adj. Inc. (Loss) with Investment Gains (Losses)Adj. Inc. (Loss) with Investment Gains (Losses)Adj. Inc. (Loss) with Investment Gains (Losses) (10,293,776.16)(10,293,776.16)(10,293,776.16)(10,293,776.16) (5,266,018.10)(5,266,018.10)(5,266,018.10)(5,266,018.10) (5,027,758.06)(5,027,758.06)(5,027,758.06)(5,027,758.06) -95.5%-95.5%-95.5%-95.5%
Adj. Margin % with Investment Gains (Losses)Adj. Margin % with Investment Gains (Losses)Adj. Margin % with Investment Gains (Losses)Adj. Margin % with Investment Gains (Losses) -15.0%-15.0%-15.0%-15.0% -7.8%-7.8%-7.8%-7.8%
Adjusted Income (Loss) excluding Depreciation & AmortizationAdjusted Income (Loss) excluding Depreciation & AmortizationAdjusted Income (Loss) excluding Depreciation & AmortizationAdjusted Income (Loss) excluding Depreciation & Amortization 1,586,684.131,586,684.131,586,684.131,586,684.13 2,961,581.092,961,581.092,961,581.092,961,581.09 (1,374,896.96)(1,374,896.96)(1,374,896.96)(1,374,896.96) -46.4%-46.4%-46.4%-46.4%
Adjusted Margin % excluding Depreciation & AmortizationAdjusted Margin % excluding Depreciation & AmortizationAdjusted Margin % excluding Depreciation & AmortizationAdjusted Margin % excluding Depreciation & Amortization 2.2%2.2%2.2%2.2% 4.3%4.3%4.3%4.3%
U. T. System Office of the Controller May 2016
May 11-12, 2016 Meeting of the U. T. System Board of Regents - Finance and Planning Committee
Agenda Book - 95

UNAUDITED
The University of Texas Southwestern Medical Center
Monthly Financial Report, Comparison of Operating Results and Margin
For the Period Ending March 31, 2016
MarchMarchMarchMarchYear-to-Date Year-to-Date Year-to-Date Year-to-Date FY 2016FY 2016FY 2016FY 2016
MarchMarchMarchMarchYear-to-DateYear-to-DateYear-to-DateYear-to-DateFY 2015FY 2015FY 2015FY 2015 VarianceVarianceVarianceVariance
Fluctuation Fluctuation Fluctuation Fluctuation PercentagePercentagePercentagePercentage
Operating RevenuesOperating RevenuesOperating RevenuesOperating Revenues
Net Student Tuition and Fees 13,257,600.53 12,979,211.57 278,388.96 2.1%
Sponsored Programs 329,949,473.17 315,939,493.27 14,009,979.90 4.4%
Net Sales and Services of Educational Activities 7,929,856.35 6,346,396.46 1,583,459.89 25.0%
Net Sales and Services of Hospitals 621,759,202.72 522,113,862.73 99,645,339.99 19.1%
Net Professional Fees 311,576,860.13 275,877,185.00 35,699,675.13 12.9%
Net Auxiliary Enterprises 16,526,135.19 13,815,345.42 2,710,789.77 19.6%
Other Operating Revenues 65,371,049.15 36,305,984.81 29,065,064.34 80.1%
Total Operating RevenuesTotal Operating RevenuesTotal Operating RevenuesTotal Operating Revenues 1,366,370,177.241,366,370,177.241,366,370,177.241,366,370,177.24 1,183,377,479.261,183,377,479.261,183,377,479.261,183,377,479.26 182,992,697.98182,992,697.98182,992,697.98182,992,697.98 15.5%15.5%15.5%15.5%
Operating ExpensesOperating ExpensesOperating ExpensesOperating Expenses
Salaries and Wages 747,121,152.63 673,860,449.04 73,260,703.59 10.9%
Payroll Related Costs 198,252,657.07 158,035,842.43 40,216,814.64 25.4%
Cost of Goods Sold 3,775,035.09 3,205,977.64 569,057.45 17.7%
Professional Fees and Services 48,674,644.52 31,886,231.20 16,788,413.32 52.7%
Other Contracted Services 68,970,563.04 70,508,163.66 (1,537,600.62) -2.2%
Travel 6,970,597.89 6,184,953.30 785,644.59 12.7%
Materials and Supplies 218,992,367.21 200,598,540.59 18,393,826.62 9.2%
Utilities 11,168,148.18 14,685,120.19 (3,516,972.01) -23.9%
Communications 6,623,593.35 6,485,370.50 138,222.85 2.1%
Repairs and Maintenance 8,204,766.90 6,028,401.87 2,176,365.03 36.1%
Rentals and Leases 4,973,795.06 3,972,259.24 1,001,535.82 25.2%
Printing and Reproduction 1,389,159.17 1,832,993.23 (443,834.06) -24.2%
Scholarships and Fellowships 796,576.81 1,483,108.67 (686,531.86) -46.3%
Depreciation and Amortization 91,413,114.42 88,461,524.57 2,951,589.85 3.3%
Federal Sponsored Program Pass-Through to Other State Agencies 1,346,014.18 882,723.38 463,290.80 52.5%
Other Operating Expenses 37,585,576.95 37,459,600.44 125,976.51 0.3%
Total Operating ExpensesTotal Operating ExpensesTotal Operating ExpensesTotal Operating Expenses 1,456,257,762.471,456,257,762.471,456,257,762.471,456,257,762.47 1,305,571,259.951,305,571,259.951,305,571,259.951,305,571,259.95 150,686,502.52150,686,502.52150,686,502.52150,686,502.52 11.5%11.5%11.5%11.5%
Operating LossOperating LossOperating LossOperating Loss (89,887,585.23)(89,887,585.23)(89,887,585.23)(89,887,585.23) (122,193,780.69)(122,193,780.69)(122,193,780.69)(122,193,780.69) 32,306,195.4632,306,195.4632,306,195.4632,306,195.46 26.4%26.4%26.4%26.4%
Other Nonoperating AdjustmentsOther Nonoperating AdjustmentsOther Nonoperating AdjustmentsOther Nonoperating Adjustments
State Appropriations 108,354,051.00 99,731,386.14 8,622,664.86 8.6%
Nonexchange Sponsored Programs - - -
Gift Contributions for Operations 60,708,408.67 46,193,481.88 14,514,926.79 31.4%
Net Investment Income 58,122,477.06 53,218,106.51 4,904,370.55 9.2%
Interest Expense on Capital Asset Financings (17,845,794.19) (16,777,437.60) (1,068,356.59) -6.4%
Net Other Nonoperating AdjustmentsNet Other Nonoperating AdjustmentsNet Other Nonoperating AdjustmentsNet Other Nonoperating Adjustments 209,339,142.54209,339,142.54209,339,142.54209,339,142.54 182,365,536.93182,365,536.93182,365,536.93182,365,536.93 26,973,605.6126,973,605.6126,973,605.6126,973,605.61 14.8%14.8%14.8%14.8%
Adjusted Income (Loss) including Depreciation & AmortizationAdjusted Income (Loss) including Depreciation & AmortizationAdjusted Income (Loss) including Depreciation & AmortizationAdjusted Income (Loss) including Depreciation & Amortization 119,451,557.31119,451,557.31119,451,557.31119,451,557.31 60,171,756.2460,171,756.2460,171,756.2460,171,756.24 59,279,801.0759,279,801.0759,279,801.0759,279,801.07 98.5%98.5%98.5%98.5%
Adjusted Margin % including Depreciation & AmortizationAdjusted Margin % including Depreciation & AmortizationAdjusted Margin % including Depreciation & AmortizationAdjusted Margin % including Depreciation & Amortization 7.5%7.5%7.5%7.5% 4.4%4.4%4.4%4.4%
Investment Gain (Losses) (84,252,207.79) (33,268,567.30) (50,983,640.49) -153.2%
Adj. Inc. (Loss) with Investment Gains (Losses)Adj. Inc. (Loss) with Investment Gains (Losses)Adj. Inc. (Loss) with Investment Gains (Losses)Adj. Inc. (Loss) with Investment Gains (Losses) 35,199,349.5235,199,349.5235,199,349.5235,199,349.52 26,903,188.9426,903,188.9426,903,188.9426,903,188.94 8,296,160.588,296,160.588,296,160.588,296,160.58 30.8%30.8%30.8%30.8%
Adj. Margin % with Investment Gains (Losses)Adj. Margin % with Investment Gains (Losses)Adj. Margin % with Investment Gains (Losses)Adj. Margin % with Investment Gains (Losses) 2.3%2.3%2.3%2.3% 2.0%2.0%2.0%2.0%
Adjusted Income (Loss) excluding Depreciation & AmortizationAdjusted Income (Loss) excluding Depreciation & AmortizationAdjusted Income (Loss) excluding Depreciation & AmortizationAdjusted Income (Loss) excluding Depreciation & Amortization 210,864,671.73210,864,671.73210,864,671.73210,864,671.73 148,633,280.81148,633,280.81148,633,280.81148,633,280.81 62,231,390.9262,231,390.9262,231,390.9262,231,390.92 41.9%41.9%41.9%41.9%
Adjusted Margin % excluding Depreciation & AmortizationAdjusted Margin % excluding Depreciation & AmortizationAdjusted Margin % excluding Depreciation & AmortizationAdjusted Margin % excluding Depreciation & Amortization 13.2%13.2%13.2%13.2% 10.8%10.8%10.8%10.8%
U. T. System Office of the Controller May 2016
May 11-12, 2016 Meeting of the U. T. System Board of Regents - Finance and Planning Committee
Agenda Book - 96

UNAUDITED
The University of Texas Medical Branch at Galveston
Monthly Financial Report, Comparison of Operating Results and Margin
For the Period Ending March 31, 2016
MarchMarchMarchMarchYear-to-Date Year-to-Date Year-to-Date Year-to-Date FY 2016FY 2016FY 2016FY 2016
MarchMarchMarchMarchYear-to-DateYear-to-DateYear-to-DateYear-to-DateFY 2015FY 2015FY 2015FY 2015 VarianceVarianceVarianceVariance
Fluctuation Fluctuation Fluctuation Fluctuation PercentagePercentagePercentagePercentage
Operating RevenuesOperating RevenuesOperating RevenuesOperating Revenues
Net Student Tuition and Fees 21,139,899.21 21,081,223.85 58,675.36 0.3%
Sponsored Programs 114,019,923.76 105,583,487.58 8,436,436.18 8.0%
Net Sales and Services of Educational Activities 9,714,844.83 14,436,886.22 (4,722,041.39) -32.7%
Net Sales and Services of Hospitals 585,067,584.96 539,134,622.34 45,932,962.62 8.5%
Net Professional Fees 101,506,757.14 93,912,429.93 7,594,327.21 8.1%
Net Auxiliary Enterprises 5,721,001.21 5,320,047.92 400,953.29 7.5%
Other Operating Revenues 25,606,765.36 32,876,441.81 (7,269,676.45) -22.1%
Total Operating RevenuesTotal Operating RevenuesTotal Operating RevenuesTotal Operating Revenues 862,776,776.47862,776,776.47862,776,776.47862,776,776.47 812,345,139.65812,345,139.65812,345,139.65812,345,139.65 50,431,636.8250,431,636.8250,431,636.8250,431,636.82 6.2%6.2%6.2%6.2%
Operating ExpensesOperating ExpensesOperating ExpensesOperating Expenses
Salaries and Wages 560,193,185.56 514,790,544.65 45,402,640.91 8.8%
Payroll Related Costs 152,883,681.10 139,846,752.54 13,036,928.56 9.3%
Cost of Goods Sold 50,625,760.74 43,056,716.61 7,569,044.13 17.6%
Professional Fees and Services 21,446,257.16 19,551,306.00 1,894,951.16 9.7%
Other Contracted Services 68,752,014.89 58,767,262.70 9,984,752.19 17.0%
Travel 4,208,558.69 4,042,045.13 166,513.56 4.1%
Materials and Supplies 91,547,172.79 84,501,350.82 7,045,821.97 8.3%
Utilities 20,001,062.95 18,288,724.30 1,712,338.65 9.4%
Communications 5,648,374.17 5,343,891.20 304,482.97 5.7%
Repairs and Maintenance 27,286,075.55 26,900,763.44 385,312.11 1.4%
Rentals and Leases 15,110,731.50 15,700,668.08 (589,936.58) -3.8%
Printing and Reproduction 878,129.89 837,960.96 40,168.93 4.8%
Scholarships and Fellowships 4,472,004.10 4,425,999.92 46,004.18 1.0%
Depreciation and Amortization 68,764,735.41 58,210,042.52 10,554,692.89 18.1%
Federal Sponsored Program Pass-Through to Other State Agencies 378,557.09 816,377.45 (437,820.36) -53.6%
Other Operating Expenses 21,132,205.68 24,343,481.15 (3,211,275.47) -13.2%
Total Operating ExpensesTotal Operating ExpensesTotal Operating ExpensesTotal Operating Expenses 1,113,328,507.271,113,328,507.271,113,328,507.271,113,328,507.27 1,019,423,887.471,019,423,887.471,019,423,887.471,019,423,887.47 93,904,619.8093,904,619.8093,904,619.8093,904,619.80 9.2%9.2%9.2%9.2%
Operating LossOperating LossOperating LossOperating Loss (250,551,730.80)(250,551,730.80)(250,551,730.80)(250,551,730.80) (207,078,747.82)(207,078,747.82)(207,078,747.82)(207,078,747.82) (43,472,982.98)(43,472,982.98)(43,472,982.98)(43,472,982.98) -21.0%-21.0%-21.0%-21.0%
Other Nonoperating AdjustmentsOther Nonoperating AdjustmentsOther Nonoperating AdjustmentsOther Nonoperating Adjustments
State Appropriations 211,836,667.82 202,785,965.77 9,050,702.05 4.5%
Nonexchange Sponsored Programs 769,013.20 840,846.00 (71,832.80) -8.5%
Gift Contributions for Operations 5,382,584.52 3,841,056.53 1,541,527.99 40.1%
Net Investment Income 27,000,071.84 23,790,994.39 3,209,077.45 13.5%
Interest Expense on Capital Asset Financings (7,748,158.41) (3,945,030.10) (3,803,128.31) -96.4%
Net Other Nonoperating AdjustmentsNet Other Nonoperating AdjustmentsNet Other Nonoperating AdjustmentsNet Other Nonoperating Adjustments 237,240,178.97237,240,178.97237,240,178.97237,240,178.97 227,313,832.59227,313,832.59227,313,832.59227,313,832.59 9,926,346.389,926,346.389,926,346.389,926,346.38 4.4%4.4%4.4%4.4%
Adjusted Income (Loss) including Depreciation & AmortizationAdjusted Income (Loss) including Depreciation & AmortizationAdjusted Income (Loss) including Depreciation & AmortizationAdjusted Income (Loss) including Depreciation & Amortization (13,311,551.83)(13,311,551.83)(13,311,551.83)(13,311,551.83) 20,235,084.7720,235,084.7720,235,084.7720,235,084.77 (33,546,636.60)(33,546,636.60)(33,546,636.60)(33,546,636.60) -165.8%-165.8%-165.8%-165.8%
Adjusted Margin % including Depreciation & AmortizationAdjusted Margin % including Depreciation & AmortizationAdjusted Margin % including Depreciation & AmortizationAdjusted Margin % including Depreciation & Amortization -1.2%-1.2%-1.2%-1.2% 1.9%1.9%1.9%1.9%
Investment Gain (Losses) (47,735,678.36) (9,880,820.08) (37,854,858.28) -383.1%
Adj. Inc. (Loss) with Investment Gains (Losses)Adj. Inc. (Loss) with Investment Gains (Losses)Adj. Inc. (Loss) with Investment Gains (Losses)Adj. Inc. (Loss) with Investment Gains (Losses) (61,047,230.19)(61,047,230.19)(61,047,230.19)(61,047,230.19) 10,354,264.6910,354,264.6910,354,264.6910,354,264.69 (71,401,494.88)(71,401,494.88)(71,401,494.88)(71,401,494.88) -689.6%-689.6%-689.6%-689.6%
Adj. Margin % with Investment Gains (Losses)Adj. Margin % with Investment Gains (Losses)Adj. Margin % with Investment Gains (Losses)Adj. Margin % with Investment Gains (Losses) -5.8%-5.8%-5.8%-5.8% 1.0%1.0%1.0%1.0%
Adjusted Income (Loss) excluding Depreciation & AmortizationAdjusted Income (Loss) excluding Depreciation & AmortizationAdjusted Income (Loss) excluding Depreciation & AmortizationAdjusted Income (Loss) excluding Depreciation & Amortization 55,453,183.5855,453,183.5855,453,183.5855,453,183.58 78,445,127.2978,445,127.2978,445,127.2978,445,127.29 (22,991,943.71)(22,991,943.71)(22,991,943.71)(22,991,943.71) -29.3%-29.3%-29.3%-29.3%
Adjusted Margin % excluding Depreciation & AmortizationAdjusted Margin % excluding Depreciation & AmortizationAdjusted Margin % excluding Depreciation & AmortizationAdjusted Margin % excluding Depreciation & Amortization 5.0%5.0%5.0%5.0% 7.5%7.5%7.5%7.5%
U. T. System Office of the Controller May 2016
May 11-12, 2016 Meeting of the U. T. System Board of Regents - Finance and Planning Committee
Agenda Book - 97

UNAUDITED
The University of Texas Health Science Center at Houston
Monthly Financial Report, Comparison of Operating Results and Margin
For the Period Ending March 31, 2016
MarchMarchMarchMarchYear-to-Date Year-to-Date Year-to-Date Year-to-Date FY 2016FY 2016FY 2016FY 2016
MarchMarchMarchMarchYear-to-DateYear-to-DateYear-to-DateYear-to-DateFY 2015FY 2015FY 2015FY 2015 VarianceVarianceVarianceVariance
Fluctuation Fluctuation Fluctuation Fluctuation PercentagePercentagePercentagePercentage
Operating RevenuesOperating RevenuesOperating RevenuesOperating Revenues
Net Student Tuition and Fees 30,681,191.32 27,029,025.37 3,652,165.95 13.5%
Sponsored Programs 412,305,157.48 342,959,715.86 69,345,441.62 20.2%
Net Sales and Services of Educational Activities 22,660,649.48 17,609,368.47 5,051,281.01 28.7%
Net Sales and Services of Hospitals 43,940,018.48 37,423,719.34 6,516,299.14 17.4%
Net Professional Fees 196,276,117.75 160,712,026.77 35,564,090.98 22.1%
Net Auxiliary Enterprises 16,839,652.03 15,948,904.00 890,748.03 5.6%
Other Operating Revenues 34,272,159.18 30,498,750.95 3,773,408.23 12.4%
Total Operating RevenuesTotal Operating RevenuesTotal Operating RevenuesTotal Operating Revenues 756,974,945.72756,974,945.72756,974,945.72756,974,945.72 632,181,510.76632,181,510.76632,181,510.76632,181,510.76 124,793,434.96124,793,434.96124,793,434.96124,793,434.96 19.7%19.7%19.7%19.7%
Operating ExpensesOperating ExpensesOperating ExpensesOperating Expenses
Salaries and Wages 486,477,071.19 435,050,809.98 51,426,261.21 11.8%
Payroll Related Costs 110,919,538.94 94,545,849.14 16,373,689.80 17.3%
Cost of Goods Sold 13,978,456.70 9,731,759.15 4,246,697.55 43.6%
Professional Fees and Services 40,820,702.37 31,143,779.04 9,676,923.33 31.1%
Other Contracted Services 44,636,010.71 44,262,708.38 373,302.33 0.8%
Travel 6,068,202.64 5,707,448.32 360,754.32 6.3%
Materials and Supplies 35,578,277.38 30,791,532.02 4,786,745.36 15.5%
Utilities 9,462,858.39 9,832,605.13 (369,746.74) -3.8%
Communications 3,285,035.39 2,865,872.62 419,162.77 14.6%
Repairs and Maintenance 7,557,428.44 7,699,194.88 (141,766.44) -1.8%
Rentals and Leases 20,040,181.33 17,731,487.53 2,308,693.80 13.0%
Printing and Reproduction 3,992,081.17 3,084,999.35 907,081.82 29.4%
Scholarships and Fellowships 3,542,013.26 3,546,498.77 (4,485.51) -0.1%
Depreciation and Amortization 35,999,494.89 34,852,243.72 1,147,251.17 3.3%
Federal Sponsored Program Pass-Through to Other State Agencies 3,542,361.24 4,160,578.03 (618,216.79) -14.9%
Other Operating Expenses 23,808,795.52 24,095,416.95 (286,621.43) -1.2%
Total Operating ExpensesTotal Operating ExpensesTotal Operating ExpensesTotal Operating Expenses 849,708,509.56849,708,509.56849,708,509.56849,708,509.56 759,102,783.01759,102,783.01759,102,783.01759,102,783.01 90,605,726.5590,605,726.5590,605,726.5590,605,726.55 11.9%11.9%11.9%11.9%
Operating LossOperating LossOperating LossOperating Loss (92,733,563.84)(92,733,563.84)(92,733,563.84)(92,733,563.84) (126,921,272.25)(126,921,272.25)(126,921,272.25)(126,921,272.25) 34,187,708.4134,187,708.4134,187,708.4134,187,708.41 26.9%26.9%26.9%26.9%
Other Nonoperating AdjustmentsOther Nonoperating AdjustmentsOther Nonoperating AdjustmentsOther Nonoperating Adjustments
State Appropriations 120,176,139.09 116,440,162.39 3,735,976.70 3.2%
Nonexchange Sponsored Programs 339,112.00 357,965.29 (18,853.29) -5.3%
Gift Contributions for Operations 11,913,016.89 16,323,685.51 (4,410,668.62) -27.0%
Net Investment Income 20,574,274.32 18,484,701.00 2,089,573.32 11.3%
Interest Expense on Capital Asset Financings (6,352,169.97) (6,783,839.02) 431,669.05 6.4%
Net Other Nonoperating AdjustmentsNet Other Nonoperating AdjustmentsNet Other Nonoperating AdjustmentsNet Other Nonoperating Adjustments 146,650,372.33146,650,372.33146,650,372.33146,650,372.33 144,822,675.17144,822,675.17144,822,675.17144,822,675.17 1,827,697.161,827,697.161,827,697.161,827,697.16 1.3%1.3%1.3%1.3%
Adjusted Income (Loss) including Depreciation & AmortizationAdjusted Income (Loss) including Depreciation & AmortizationAdjusted Income (Loss) including Depreciation & AmortizationAdjusted Income (Loss) including Depreciation & Amortization 53,916,808.4953,916,808.4953,916,808.4953,916,808.49 17,901,402.9217,901,402.9217,901,402.9217,901,402.92 36,015,405.5736,015,405.5736,015,405.5736,015,405.57 201.2%201.2%201.2%201.2%
Adjusted Margin % including Depreciation & AmortizationAdjusted Margin % including Depreciation & AmortizationAdjusted Margin % including Depreciation & AmortizationAdjusted Margin % including Depreciation & Amortization 5.9%5.9%5.9%5.9% 2.3%2.3%2.3%2.3%
Investment Gain (Losses) (20,079,243.24) (8,550,614.82) (11,528,628.42) -134.8%
Adj. Inc. (Loss) with Investment Gains (Losses)Adj. Inc. (Loss) with Investment Gains (Losses)Adj. Inc. (Loss) with Investment Gains (Losses)Adj. Inc. (Loss) with Investment Gains (Losses) 33,837,565.2533,837,565.2533,837,565.2533,837,565.25 9,350,788.109,350,788.109,350,788.109,350,788.10 24,486,777.1524,486,777.1524,486,777.1524,486,777.15 261.9%261.9%261.9%261.9%
Adj. Margin % with Investment Gains (Losses)Adj. Margin % with Investment Gains (Losses)Adj. Margin % with Investment Gains (Losses)Adj. Margin % with Investment Gains (Losses) 3.8%3.8%3.8%3.8% 1.2%1.2%1.2%1.2%
Adjusted Income (Loss) excluding Depreciation & AmortizationAdjusted Income (Loss) excluding Depreciation & AmortizationAdjusted Income (Loss) excluding Depreciation & AmortizationAdjusted Income (Loss) excluding Depreciation & Amortization 89,916,303.3889,916,303.3889,916,303.3889,916,303.38 52,753,646.6452,753,646.6452,753,646.6452,753,646.64 37,162,656.7437,162,656.7437,162,656.7437,162,656.74 70.4%70.4%70.4%70.4%
Adjusted Margin % excluding Depreciation & AmortizationAdjusted Margin % excluding Depreciation & AmortizationAdjusted Margin % excluding Depreciation & AmortizationAdjusted Margin % excluding Depreciation & Amortization 9.9%9.9%9.9%9.9% 6.7%6.7%6.7%6.7%
U. T. System Office of the Controller May 2016
May 11-12, 2016 Meeting of the U. T. System Board of Regents - Finance and Planning Committee
Agenda Book - 98

UNAUDITED
The University of Texas Health Science Center at San Antonio
Monthly Financial Report, Comparison of Operating Results and Margin
For the Period Ending March 31, 2016
MarchMarchMarchMarchYear-to-Date Year-to-Date Year-to-Date Year-to-Date FY 2016FY 2016FY 2016FY 2016
MarchMarchMarchMarchYear-to-DateYear-to-DateYear-to-DateYear-to-DateFY 2015FY 2015FY 2015FY 2015 VarianceVarianceVarianceVariance
Fluctuation Fluctuation Fluctuation Fluctuation PercentagePercentagePercentagePercentage
Operating RevenuesOperating RevenuesOperating RevenuesOperating Revenues
Net Student Tuition and Fees 22,468,119.92 20,885,939.08 1,582,180.84 7.6%
Sponsored Programs 173,764,308.61 175,456,656.06 (1,692,347.45) -1.0%
Net Sales and Services of Educational Activities 12,552,926.12 11,770,229.08 782,697.04 6.6%
Net Professional Fees 106,852,953.25 95,759,399.84 11,093,553.41 11.6%
Net Auxiliary Enterprises 3,183,140.71 3,377,150.12 (194,009.41) -5.7%
Other Operating Revenues 23,243,611.15 27,530,232.18 (4,286,621.03) -15.6%
Total Operating RevenuesTotal Operating RevenuesTotal Operating RevenuesTotal Operating Revenues 342,065,059.76342,065,059.76342,065,059.76342,065,059.76 334,779,606.36334,779,606.36334,779,606.36334,779,606.36 7,285,453.407,285,453.407,285,453.407,285,453.40 2.2%2.2%2.2%2.2%
Operating ExpensesOperating ExpensesOperating ExpensesOperating Expenses
Salaries and Wages 243,628,604.09 245,247,077.24 (1,618,473.15) -0.7%
Payroll Related Costs 68,588,858.21 65,610,004.48 2,978,853.73 4.5%
Professional Fees and Services 13,722,623.55 11,651,102.82 2,071,520.73 17.8%
Other Contracted Services 19,314,520.20 14,809,667.71 4,504,852.49 30.4%
Travel 2,711,484.42 2,718,277.23 (6,792.81) -0.2%
Materials and Supplies 27,425,008.15 22,681,887.25 4,743,120.90 20.9%
Utilities 10,847,998.00 10,208,333.33 639,664.67 6.3%
Communications 6,399,559.41 7,356,506.64 (956,947.23) -13.0%
Repairs and Maintenance 3,374,551.26 3,196,187.84 178,363.42 5.6%
Rentals and Leases 3,324,874.15 3,042,237.94 282,636.21 9.3%
Printing and Reproduction 1,013,047.69 957,002.92 56,044.77 5.9%
Scholarships and Fellowships 4,576,971.47 4,437,403.18 139,568.29 3.1%
Depreciation and Amortization 30,916,666.67 30,625,000.00 291,666.67 1.0%
Federal Sponsored Program Pass-Through to Other State Agencies 904,166.67 875,000.00 29,166.67 3.3%
Other Operating Expenses 21,848,847.81 22,558,979.28 (710,131.47) -3.1%
Total Operating ExpensesTotal Operating ExpensesTotal Operating ExpensesTotal Operating Expenses 458,597,781.75458,597,781.75458,597,781.75458,597,781.75 445,974,667.86445,974,667.86445,974,667.86445,974,667.86 12,623,113.8912,623,113.8912,623,113.8912,623,113.89 2.8%2.8%2.8%2.8%
Operating LossOperating LossOperating LossOperating Loss (116,532,721.99)(116,532,721.99)(116,532,721.99)(116,532,721.99) (111,195,061.50)(111,195,061.50)(111,195,061.50)(111,195,061.50) (5,337,660.49)(5,337,660.49)(5,337,660.49)(5,337,660.49) -4.8%-4.8%-4.8%-4.8%
Other Nonoperating AdjustmentsOther Nonoperating AdjustmentsOther Nonoperating AdjustmentsOther Nonoperating Adjustments
State Appropriations 98,361,163.83 102,803,777.42 (4,442,613.59) -4.3%
Nonexchange Sponsored Programs 758,333.33 729,166.67 29,166.66 4.0%
Gift Contributions for Operations 13,846,498.69 11,396,393.52 2,450,105.17 21.5%
Net Investment Income 22,011,865.66 21,202,311.42 809,554.24 3.8%
Interest Expense on Capital Asset Financings (4,775,441.72) (5,134,295.53) 358,853.81 7.0%
Net Other Nonoperating AdjustmentsNet Other Nonoperating AdjustmentsNet Other Nonoperating AdjustmentsNet Other Nonoperating Adjustments 130,202,419.79130,202,419.79130,202,419.79130,202,419.79 130,997,353.50130,997,353.50130,997,353.50130,997,353.50 (794,933.71)(794,933.71)(794,933.71)(794,933.71) -0.6%-0.6%-0.6%-0.6%
Adjusted Income (Loss) including Depreciation & AmortizationAdjusted Income (Loss) including Depreciation & AmortizationAdjusted Income (Loss) including Depreciation & AmortizationAdjusted Income (Loss) including Depreciation & Amortization 13,669,697.8013,669,697.8013,669,697.8013,669,697.80 19,802,292.0019,802,292.0019,802,292.0019,802,292.00 (6,132,594.20)(6,132,594.20)(6,132,594.20)(6,132,594.20) -31.0%-31.0%-31.0%-31.0%
Adjusted Margin % including Depreciation & AmortizationAdjusted Margin % including Depreciation & AmortizationAdjusted Margin % including Depreciation & AmortizationAdjusted Margin % including Depreciation & Amortization 2.9%2.9%2.9%2.9% 4.2%4.2%4.2%4.2%
Investment Gain (Losses) (33,217,275.72) (9,781,276.98) (23,435,998.74) -239.6%
Adj. Inc. (Loss) with Investment Gains (Losses)Adj. Inc. (Loss) with Investment Gains (Losses)Adj. Inc. (Loss) with Investment Gains (Losses)Adj. Inc. (Loss) with Investment Gains (Losses) (19,547,577.92)(19,547,577.92)(19,547,577.92)(19,547,577.92) 10,021,015.0210,021,015.0210,021,015.0210,021,015.02 (29,568,592.94)(29,568,592.94)(29,568,592.94)(29,568,592.94) -295.1%-295.1%-295.1%-295.1%
Adj. Margin % with Investment Gains (Losses)Adj. Margin % with Investment Gains (Losses)Adj. Margin % with Investment Gains (Losses)Adj. Margin % with Investment Gains (Losses) -4.4%-4.4%-4.4%-4.4% 2.2%2.2%2.2%2.2%
Adjusted Income (Loss) excluding Depreciation & AmortizationAdjusted Income (Loss) excluding Depreciation & AmortizationAdjusted Income (Loss) excluding Depreciation & AmortizationAdjusted Income (Loss) excluding Depreciation & Amortization 44,586,364.4744,586,364.4744,586,364.4744,586,364.47 50,427,292.0050,427,292.0050,427,292.0050,427,292.00 (5,840,927.53)(5,840,927.53)(5,840,927.53)(5,840,927.53) -11.6%-11.6%-11.6%-11.6%
Adjusted Margin % excluding Depreciation & AmortizationAdjusted Margin % excluding Depreciation & AmortizationAdjusted Margin % excluding Depreciation & AmortizationAdjusted Margin % excluding Depreciation & Amortization 9.3%9.3%9.3%9.3% 10.7%10.7%10.7%10.7%
U. T. System Office of the Controller May 2016
May 11-12, 2016 Meeting of the U. T. System Board of Regents - Finance and Planning Committee
Agenda Book - 99

UNAUDITED
The University of Texas M. D. Anderson Cancer Center
Monthly Financial Report, Comparison of Operating Results and Margin
For the Period Ending March 31, 2016
MarchMarchMarchMarchYear-to-Date Year-to-Date Year-to-Date Year-to-Date FY 2016FY 2016FY 2016FY 2016
MarchMarchMarchMarchYear-to-DateYear-to-DateYear-to-DateYear-to-DateFY 2015FY 2015FY 2015FY 2015 VarianceVarianceVarianceVariance
Fluctuation Fluctuation Fluctuation Fluctuation PercentagePercentagePercentagePercentage
Operating RevenuesOperating RevenuesOperating RevenuesOperating Revenues
Net Student Tuition and Fees 1,253,036.96 1,039,018.17 214,018.79 20.6%
Sponsored Programs 180,038,998.79 164,579,116.29 15,459,882.50 9.4%
Net Sales and Services of Educational Activities 1,315,312.21 1,275,581.07 39,731.14 3.1%
Net Sales and Services of Hospitals 1,843,201,874.19 1,841,354,688.75 1,847,185.44 0.1%
Net Professional Fees 232,339,461.27 235,733,863.28 (3,394,402.01) -1.4%
Net Auxiliary Enterprises 24,484,119.79 25,865,003.85 (1,380,884.06) -5.3%
Other Operating Revenues 60,862,525.96 58,676,151.33 2,186,374.63 3.7%
Total Operating RevenuesTotal Operating RevenuesTotal Operating RevenuesTotal Operating Revenues 2,343,495,329.172,343,495,329.172,343,495,329.172,343,495,329.17 2,328,523,422.742,328,523,422.742,328,523,422.742,328,523,422.74 14,971,906.4314,971,906.4314,971,906.4314,971,906.43 0.6%0.6%0.6%0.6%
Operating ExpensesOperating ExpensesOperating ExpensesOperating Expenses
Salaries and Wages 1,096,724,467.77 1,024,166,662.84 72,557,804.93 7.1%
Payroll Related Costs 319,544,878.48 296,167,709.38 23,377,169.10 7.9%
Cost of Goods Sold 1,461,161.60 2,893,460.93 (1,432,299.33) -49.5%
Professional Fees and Services 130,529,005.73 88,014,997.91 42,514,007.82 48.3%
Other Contracted Services 86,327,018.01 70,767,188.28 15,559,829.73 22.0%
Travel 10,752,271.48 11,291,364.27 (539,092.79) -4.8%
Materials and Supplies 475,267,738.29 442,481,290.31 32,786,447.98 7.4%
Utilities 24,952,007.27 25,432,346.04 (480,338.77) -1.9%
Communications 7,006,608.53 5,847,042.79 1,159,565.74 19.8%
Repairs and Maintenance 60,097,804.04 61,184,742.84 (1,086,938.80) -1.8%
Rentals and Leases 25,341,130.81 25,673,961.33 (332,830.52) -1.3%
Printing and Reproduction 2,912,510.67 2,464,409.51 448,101.16 18.2%
Scholarships and Fellowships 1,915,410.88 1,952,804.00 (37,393.12) -1.9%
Depreciation and Amortization 203,625,648.55 173,379,590.69 30,246,057.86 17.4%
Federal Sponsored Program Pass-Through to Other State Agencies 365,786.98 (1,092,656.61) 1,458,443.59 133.5%
State Sponsored Program Pass-Through to Other State Agencies 312,848.09 248,777.92 64,070.17 25.8%
Other Operating Expenses 20,224,974.98 19,037,693.11 1,187,281.87 6.2%
Total Operating ExpensesTotal Operating ExpensesTotal Operating ExpensesTotal Operating Expenses 2,467,361,272.162,467,361,272.162,467,361,272.162,467,361,272.16 2,249,911,385.542,249,911,385.542,249,911,385.542,249,911,385.54 217,449,886.62217,449,886.62217,449,886.62217,449,886.62 9.7%9.7%9.7%9.7%
Operating LossOperating LossOperating LossOperating Loss (123,865,942.99)(123,865,942.99)(123,865,942.99)(123,865,942.99) 78,612,037.2078,612,037.2078,612,037.2078,612,037.20 (202,477,980.19)(202,477,980.19)(202,477,980.19)(202,477,980.19) -257.6%-257.6%-257.6%-257.6%
Other Nonoperating AdjustmentsOther Nonoperating AdjustmentsOther Nonoperating AdjustmentsOther Nonoperating Adjustments
State Appropriations 117,467,845.58 109,022,475.49 8,445,370.09 7.7%
Nonexchange Sponsored Programs 1,519,662.88 1,847,504.00 (327,841.12) -17.7%
Gift Contributions for Operations 85,322,912.30 66,777,068.22 18,545,844.08 27.8%
Net Investment Income 62,292,257.94 48,081,139.06 14,211,118.88 29.6%
Interest Expense on Capital Asset Financings (19,830,320.79) (20,922,623.26) 1,092,302.47 5.2%
Net Other Nonoperating AdjustmentsNet Other Nonoperating AdjustmentsNet Other Nonoperating AdjustmentsNet Other Nonoperating Adjustments 246,772,357.91246,772,357.91246,772,357.91246,772,357.91 204,805,563.51204,805,563.51204,805,563.51204,805,563.51 41,966,794.4041,966,794.4041,966,794.4041,966,794.40 20.5%20.5%20.5%20.5%
Adjusted Income (Loss) including Depreciation & AmortizationAdjusted Income (Loss) including Depreciation & AmortizationAdjusted Income (Loss) including Depreciation & AmortizationAdjusted Income (Loss) including Depreciation & Amortization 122,906,414.92122,906,414.92122,906,414.92122,906,414.92 283,417,600.71283,417,600.71283,417,600.71283,417,600.71 (160,511,185.79)(160,511,185.79)(160,511,185.79)(160,511,185.79) -56.6%-56.6%-56.6%-56.6%
Adjusted Margin % including Depreciation & AmortizationAdjusted Margin % including Depreciation & AmortizationAdjusted Margin % including Depreciation & AmortizationAdjusted Margin % including Depreciation & Amortization 4.7%4.7%4.7%4.7% 11.1%11.1%11.1%11.1%
Investment Gain (Losses) (181,219,842.57) (15,094,105.44) (166,125,737.13) -1,100.6%
Adj. Inc. (Loss) with Investment Gains (Losses)Adj. Inc. (Loss) with Investment Gains (Losses)Adj. Inc. (Loss) with Investment Gains (Losses)Adj. Inc. (Loss) with Investment Gains (Losses) (58,313,427.65)(58,313,427.65)(58,313,427.65)(58,313,427.65) 268,323,495.27268,323,495.27268,323,495.27268,323,495.27 (326,636,922.92)(326,636,922.92)(326,636,922.92)(326,636,922.92) -121.7%-121.7%-121.7%-121.7%
Adj. Margin % with Investment Gains (Losses)Adj. Margin % with Investment Gains (Losses)Adj. Margin % with Investment Gains (Losses)Adj. Margin % with Investment Gains (Losses) -2.4%-2.4%-2.4%-2.4% 10.6%10.6%10.6%10.6%
Adjusted Income (Loss) excluding Depreciation & AmortizationAdjusted Income (Loss) excluding Depreciation & AmortizationAdjusted Income (Loss) excluding Depreciation & AmortizationAdjusted Income (Loss) excluding Depreciation & Amortization 326,532,063.47326,532,063.47326,532,063.47326,532,063.47 456,797,191.40456,797,191.40456,797,191.40456,797,191.40 (130,265,127.93)(130,265,127.93)(130,265,127.93)(130,265,127.93) -28.5%-28.5%-28.5%-28.5%
Adjusted Margin % excluding Depreciation & AmortizationAdjusted Margin % excluding Depreciation & AmortizationAdjusted Margin % excluding Depreciation & AmortizationAdjusted Margin % excluding Depreciation & Amortization 12.5%12.5%12.5%12.5% 17.9%17.9%17.9%17.9%
U. T. System Office of the Controller May 2016
May 11-12, 2016 Meeting of the U. T. System Board of Regents - Finance and Planning Committee
Agenda Book - 100

UNAUDITED
The University of Texas Health Science Center at Tyler
Monthly Financial Report, Comparison of Operating Results and Margin
For the Period Ending March 31, 2016
MarchMarchMarchMarchYear-to-Date Year-to-Date Year-to-Date Year-to-Date FY 2016FY 2016FY 2016FY 2016
MarchMarchMarchMarchYear-to-DateYear-to-DateYear-to-DateYear-to-DateFY 2015FY 2015FY 2015FY 2015 VarianceVarianceVarianceVariance
Fluctuation Fluctuation Fluctuation Fluctuation PercentagePercentagePercentagePercentage
Operating RevenuesOperating RevenuesOperating RevenuesOperating Revenues
Net Student Tuition and Fees 78,339.98 73,773.92 4,566.06 6.2%
Sponsored Programs 15,329,068.90 9,319,670.79 6,009,398.11 64.5%
Net Sales and Services of Educational Activities 1,306,934.67 997,264.46 309,670.21 31.1%
Net Sales and Services of Hospitals 31,679,173.90 35,862,690.72 (4,183,516.82) -11.7%
Net Professional Fees 9,120,600.43 8,477,424.25 643,176.18 7.6%
Net Auxiliary Enterprises 139,579.38 123,397.21 16,182.17 13.1%
Other Operating Revenues 14,084,056.47 15,949,056.75 (1,865,000.28) -11.7%
Total Operating RevenuesTotal Operating RevenuesTotal Operating RevenuesTotal Operating Revenues 71,737,753.7371,737,753.7371,737,753.7371,737,753.73 70,803,278.1070,803,278.1070,803,278.1070,803,278.10 934,475.63934,475.63934,475.63934,475.63 1.3%1.3%1.3%1.3%
Operating ExpensesOperating ExpensesOperating ExpensesOperating Expenses
Salaries and Wages 54,492,857.87 45,681,253.06 8,811,604.81 19.3%
Payroll Related Costs 16,566,124.18 14,089,072.44 2,477,051.74 17.6%
Cost of Goods Sold 86,941.48 64,780.38 22,161.10 34.2%
Professional Fees and Services 6,802,479.24 5,068,167.02 1,734,312.22 34.2%
Other Contracted Services 6,783,332.32 7,544,148.15 (760,815.83) -10.1%
Travel 354,913.14 344,501.46 10,411.68 3.0%
Materials and Supplies 13,842,506.94 11,968,289.92 1,874,217.02 15.7%
Utilities 1,060,532.06 1,384,182.43 (323,650.37) -23.4%
Communications 717,786.56 522,009.10 195,777.46 37.5%
Repairs and Maintenance 3,344,059.29 3,260,661.71 83,397.58 2.6%
Rentals and Leases 742,253.94 740,103.97 2,149.97 0.3%
Printing and Reproduction 39,239.78 52,041.36 (12,801.58) -24.6%
Scholarships and Fellowships 92,283.78 61,564.88 30,718.90 49.9%
Depreciation and Amortization 6,338,358.72 6,473,474.60 (135,115.88) -2.1%
Federal Sponsored Program Pass-Through to Other State Agencies 127,434.28 143,882.70 (16,448.42) -11.4%
Other Operating Expenses 2,231,894.58 2,038,331.22 193,563.36 9.5%
Total Operating ExpensesTotal Operating ExpensesTotal Operating ExpensesTotal Operating Expenses 113,622,998.16113,622,998.16113,622,998.16113,622,998.16 99,436,464.4099,436,464.4099,436,464.4099,436,464.40 14,186,533.7614,186,533.7614,186,533.7614,186,533.76 14.3%14.3%14.3%14.3%
Operating LossOperating LossOperating LossOperating Loss (41,885,244.43)(41,885,244.43)(41,885,244.43)(41,885,244.43) (28,633,186.30)(28,633,186.30)(28,633,186.30)(28,633,186.30) (13,252,058.13)(13,252,058.13)(13,252,058.13)(13,252,058.13) -46.3%-46.3%-46.3%-46.3%
Other Nonoperating AdjustmentsOther Nonoperating AdjustmentsOther Nonoperating AdjustmentsOther Nonoperating Adjustments
State Appropriations 31,435,991.52 25,268,044.95 6,167,946.57 24.4%
Nonexchange Sponsored Programs - - -
Gift Contributions for Operations 376,022.06 148,683.48 227,338.58 152.9%
Net Investment Income 2,451,965.96 2,438,042.28 13,923.68 0.6%
Interest Expense on Capital Asset Financings (772,154.67) (840,842.17) 68,687.50 8.2%
Net Other Nonoperating AdjustmentsNet Other Nonoperating AdjustmentsNet Other Nonoperating AdjustmentsNet Other Nonoperating Adjustments 33,491,824.8733,491,824.8733,491,824.8733,491,824.87 27,013,928.5427,013,928.5427,013,928.5427,013,928.54 6,477,896.336,477,896.336,477,896.336,477,896.33 24.0%24.0%24.0%24.0%
Adjusted Income (Loss) including Depreciation & AmortizationAdjusted Income (Loss) including Depreciation & AmortizationAdjusted Income (Loss) including Depreciation & AmortizationAdjusted Income (Loss) including Depreciation & Amortization (8,393,419.56)(8,393,419.56)(8,393,419.56)(8,393,419.56) (1,619,257.76)(1,619,257.76)(1,619,257.76)(1,619,257.76) (6,774,161.80)(6,774,161.80)(6,774,161.80)(6,774,161.80) -418.3%-418.3%-418.3%-418.3%
Adjusted Margin % including Depreciation & AmortizationAdjusted Margin % including Depreciation & AmortizationAdjusted Margin % including Depreciation & AmortizationAdjusted Margin % including Depreciation & Amortization -7.9%-7.9%-7.9%-7.9% -1.6%-1.6%-1.6%-1.6%
Investment Gain (Losses) (2,594,267.18) (702,665.63) (1,891,601.55) -269.2%
Adj. Inc. (Loss) with Investment Gains (Losses)Adj. Inc. (Loss) with Investment Gains (Losses)Adj. Inc. (Loss) with Investment Gains (Losses)Adj. Inc. (Loss) with Investment Gains (Losses) (10,987,686.74)(10,987,686.74)(10,987,686.74)(10,987,686.74) (2,321,923.39)(2,321,923.39)(2,321,923.39)(2,321,923.39) (8,665,763.35)(8,665,763.35)(8,665,763.35)(8,665,763.35) -373.2%-373.2%-373.2%-373.2%
Adj. Margin % with Investment Gains (Losses)Adj. Margin % with Investment Gains (Losses)Adj. Margin % with Investment Gains (Losses)Adj. Margin % with Investment Gains (Losses) -10.6%-10.6%-10.6%-10.6% -2.4%-2.4%-2.4%-2.4%
Adjusted Income (Loss) excluding Depreciation & AmortizationAdjusted Income (Loss) excluding Depreciation & AmortizationAdjusted Income (Loss) excluding Depreciation & AmortizationAdjusted Income (Loss) excluding Depreciation & Amortization (2,055,060.84)(2,055,060.84)(2,055,060.84)(2,055,060.84) 4,854,216.844,854,216.844,854,216.844,854,216.84 (6,909,277.68)(6,909,277.68)(6,909,277.68)(6,909,277.68) -142.3%-142.3%-142.3%-142.3%
Adjusted Margin % excluding Depreciation & AmortizationAdjusted Margin % excluding Depreciation & AmortizationAdjusted Margin % excluding Depreciation & AmortizationAdjusted Margin % excluding Depreciation & Amortization -1.9%-1.9%-1.9%-1.9% 4.9%4.9%4.9%4.9%
U. T. System Office of the Controller May 2016
May 11-12, 2016 Meeting of the U. T. System Board of Regents - Finance and Planning Committee
Agenda Book - 101

3. U. T. System Board of Regents: Report on activities of the University Lands Advisory Board
REPORT
Regent Cranberg, Chairman of the University Lands Advisory Board (ULAB), and Mr. MarkHouser, Chief Executive Officer - University Lands, will report on activities related to the ULAB.
BACKGROUND INFORMATION
The ULAB was established by the Board of Regents on May 15, 2014, to advise the Board onoperations and management of the University Lands Office, to review and recommend budgetsto the Board, and to provide strategic direction for University Lands.
May 11-12, 2016 Meeting of the U. T. System Board of Regents - Finance and Planning Committee
Agenda Book - 102
4. U. T. System Board of Regents: Adoption of a Supplemental Resolution authorizing the issuance, sale, and delivery of Revenue Financing System Bonds and authorization to complete all related transactions
RECOMMENDATION
The Chancellor concurs in the recommendation of the Executive Vice Chancellor for BusinessAffairs that the U. T. System Board of Regents
a. adopt a Supplemental Resolution, substantially in the form previously approvedby the U. T. System Board of Regents, authorizing the issuance, sale, and deliveryof Board of Regents of The University of Texas System Revenue FinancingSystem (RFS) Bonds in one or more installments in an aggregate principal amountnot to exceed $925 million to be used to refund certain outstanding RFS Bonds, torefund RFS Commercial Paper Notes, to provide new money to fund constructionand acquisition costs of projects in the Capital Improvement Program, and to paythe costs of issuance; and
b. authorize appropriate officers and employees of U. T. System as set forth inthe Supplemental Resolution to take any and all actions necessary to carry outthe intentions of the U. T. System Board of Regents within the limitations andprocedures specified therein; to make certain covenants and agreements inconnection therewith; and to resolve other matters incident and related to theissuance, sale, security, and delivery of such RFS Bonds.
BACKGROUND INFORMATION
On August 20, 2015, the Board of Regents adopted the 29th Supplemental Resolutionauthorizing the issuance of additional RFS Bonds in an amount not to exceed $600 million.This authority was utilized to issue $255,825,000 of Revenue Financing System Taxable Bonds,Series 2016A on January 14, 2016, and $206,040,000 of Revenue Financing System Bonds,Series 2016B (Green Bonds) on January 22, 2016. Adoption of this 30th SupplementalResolution would provide additional capacity to finance additional projects, including tuitionrevenue bond projects, under the same provisions as the prior resolution.
Adoption of the Supplemental Resolution would authorize the advance or current refundingof a portion of certain outstanding RFS Bonds provided that an advance refunding exceedsa minimum 3% present value debt service savings threshold. An advance refunding involvesissuing bonds to refund outstanding bonds more than 90 days in advance of the call datewhereas a current refunding involves issuing bonds to refund outstanding bonds within 90 daysof the call date. Refunding bonds are issued at lower interest rates thereby producing debtservice savings. Adoption of this Supplemental Resolution will provide the flexibility to selectthe particular bonds to be refunded depending on market conditions at the time of pricing.
The Supplemental Resolution would also authorize the current refunding of all or a portion of theRFS Commercial Paper Notes. The RFS Commercial Paper Note program is used to provideinterim financing for RFS projects approved by the Board. Adoption of the Supplemental
May 11-12, 2016 Meeting of the U. T. System Board of Regents - Finance and Planning Committee
Agenda Book - 103

Resolution will permit the interim financing provided through the Notes to be replaced with long-term financing. The Supplemental Resolution also authorizes the issuance of bonds to providenew money to fund the capital costs of eligible projects.
The Supplemental Resolution would also authorize the appropriate officers and employees ofthe U. T. System to refund outstanding RFS Bonds pursuant to a tender program and to uselawfully available funds to defease outstanding RFS Bonds when economically advantageous.
The proposed Supplemental Resolution has been reviewed by outside bond counsel and theU. T. System Office of General Counsel.
Note: The proposed Resolution is available online at http://www.utsystem.edu/board-of-regents/meetings/board-meeting-2016-05-11.
May 11-12, 2016 Meeting of the U. T. System Board of Regents - Finance and Planning Committee
Agenda Book - 104

5. U. T. System Board of Regents: The University of Texas Investment Management Company (UTIMCO) Performance Summary Report and Investment Reports for the quarter ended February 29, 2016
REPORT
The February 29, 2016 UTIMCO Performance Summary Report is set forth on Page 106.
The Investment Reports for the quarter ended February 29, 2016, are set forth onPages 107 - 110.
Item I on Page 107 reports activity for the Permanent University Fund (PUF) investments.The PUF's net investment return for the quarter was negative 3.89% versus its compositebenchmark return of negative 4.39%. The PUF's net asset value decreased by $572 millionduring the quarter to $16,978 million. The decrease was due to $119 million PUF Landsreceipts, less a net investment return of negative $691 million. No distribution was made tothe Available University Fund (AUF) during the quarter.
Item II on Page 108 reports activity for the General Endowment Fund (GEF) investments.The GEF's net investment return for the quarter was negative 3.82% versus its compositebenchmark return of negative 4.39%. The GEF's net asset value decreased by $322 millionduring the quarter to $7,820 million.
Item III on Page 109 reports activity for the Intermediate Term Fund (ITF). The ITF's netinvestment return for the quarter was negative 3.65% versus its composite benchmark returnof negative 2.42%. The net asset value increased during the quarter to $7,134 million due tonet contributions of $354 million, less net investment return of negative $261 million anddistributions of $54 million.
All exposures were within their asset class and investment type ranges. Liquidity was withinpolicy.
Item IV on Page 110 presents book and market values of cash, debt, equity, and othersecurities held in funds outside of internal investment pools. Total cash and equivalents,consisting primarily of institutional operating funds held in the Dreyfus and Fidelity moneymarket fund, increased by $504 million to $2,515 million during the three months since the lastreporting period. Market values for the remaining asset types were debt securities: $20 millionversus $20 million at the beginning of the period; equities: $85 million versus $240 million atthe beginning of the period; and other investments: $1 million versus $2 million at the beginningof the period.
May 11-12, 2016 Meeting of the U. T. System Board of Regents - Finance and Planning Committee
Agenda Book - 105

UTIMCO Performance SummaryFebruary 29, 2016
NetAsset Value2/29/2016
(in Millions) 1 Mo 3 Mos Fiscal Calendar 1 Yr 3 Yrs 5 Yrs 10 YrsENDOWMENT FUNDS
Permanent University Fund $ 16,978 (0.33%) (3.89%) (4.31%) (3.00%) (4.91%) 4.22% 4.60% 4.99%
Permanent Health Fund 1,004 (3.82) (4.41) 4.24 4.62 5.02Long Term Fund 6,816 (3.82) (4.41) 4.24 4.63 5.02
General Endowment Fund 7,820 (0.32%) (3.82%) (4.37%) (3.06%) (4.75%) 4.33% 4.71% 5.10%
Separately Invested Funds 239 N/A N/A N/A N/A N/A N/A N/A N/ATotal Endowment Funds 25,037
OPERATING FUNDSIntermediate Term Fund 7,134 (0.29%) (3.65%) (4.26%) (2.85%) (7.67%) 0.90% 2.10% 3.75%Short Term Fund and Debt Proceeds Fund 2,383 0.03 0.09 0.14 0.07 0.21 0.13 N/A N/A
Total Operating Funds 9,517
Total Assets Under Management $ 34,554VALUE ADDED (Percent)Permanent University Fund (0.43%) 0.50% (1.37%) (1.13%) (0.99%) 0.66% 0.81% 1.56%General Endowment Fund (0.42%) 0.57% (1.43%) (1.19%) (0.83%) 0.77% 0.92% 1.67%Intermediate Term Fund (0.60%) (1.23%) (1.42%) (1.05%) (1.30%) 0.85% 1.30% 1.88%
VALUE ADDED ($ IN MILLIONS)Permanent University Fund ($73) $88 ($241) ($197) ($176) $321 $624 $2,209General Endowment Fund (34) 46 (119) (97) (69) 184 370 1,297Intermediate Term Fund (43) (89) (104) (76) -98 139 333 849
Total Value Added ($150) $45 ($464) ($370) ($343) $644 $1,327 $4,355
UTIMCO 3/31/2016
Footnote available upon request.
Periods Ended February 29, 2016(Returns for Periods Longer Than One Year are Annualized)
Short Term Year to Date Historic Returns
May 11-12, 2016 M
eeting of the U. T
. System
Board of R
egents - Finance and P
lanning Com
mittee
Agenda B
ook - 106
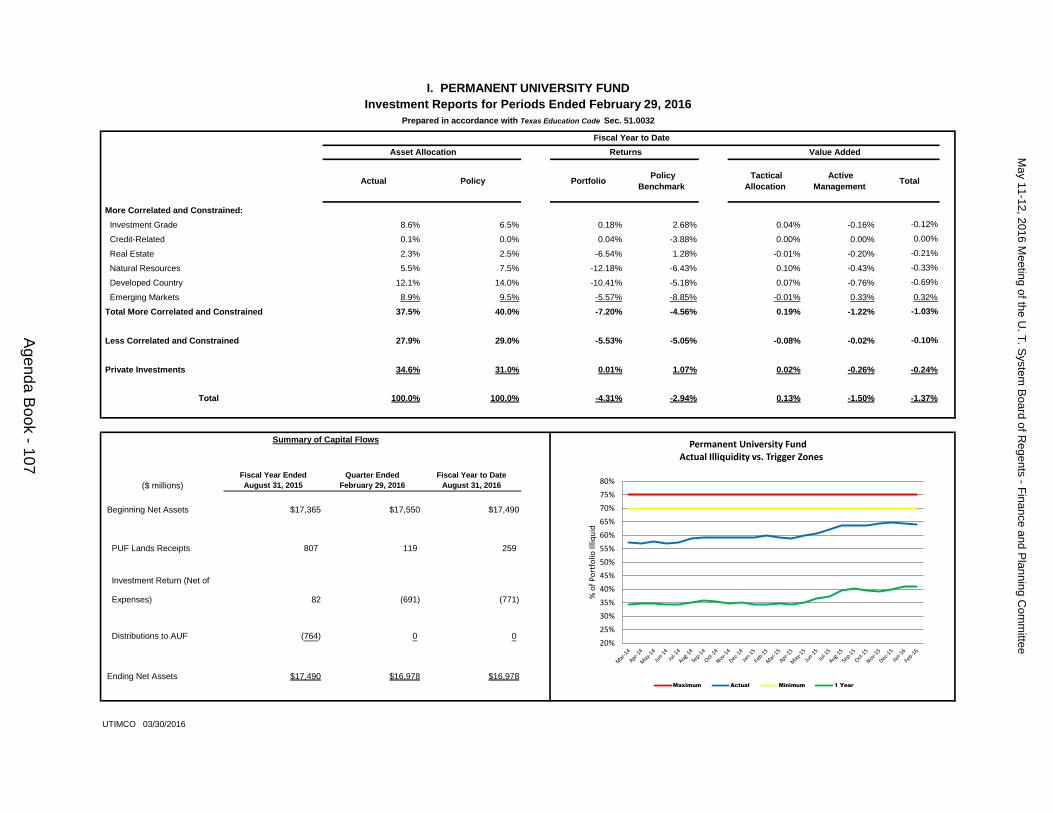
Actual Policy Portfolio Policy
Benchmark
Tactical
Allocation
Active
Management Total
More Correlated and Constrained:
Investment Grade 8.6% 6.5% 0.18% 2.68% 0.04% -0.16% -0.12%
Credit-Related 0.1% 0.0% 0.04% -3.88% 0.00% 0.00% 0.00%
Real Estate 2.3% 2.5% -6.54% 1.28% -0.01% -0.20% -0.21%
Natural Resources 5.5% 7.5% -12.18% -6.43% 0.10% -0.43% -0.33%
Developed Country 12.1% 14.0% -10.41% -5.18% 0.07% -0.76% -0.69%
Emerging Markets 8.9% 9.5% -5.57% -8.85% -0.01% 0.33% 0.32%
Total More Correlated and Constrained 37.5% 40.0% -7.20% -4.56% 0.19% -1.22% -1.03%
Less Correlated and Constrained 27.9% 29.0% -5.53% -5.05% -0.08% -0.02% -0.10%
Private Investments 34.6% 31.0% 0.01% 1.07% 0.02% -0.26% -0.24%
Total 100.0% 100.0% -4.31% -2.94% 0.13% -1.50% -1.37%
Summary of Capital Flows
($ millions)
Fiscal Year Ended
August 31, 2015
Quarter Ended
February 29, 2016
Fiscal Year to Date
August 31, 2016
Beginning Net Assets $17,365 $17,550 $17,490
PUF Lands Receipts 807 119 259
Investment Return (Net of
Expenses) 82 (691) (771)
Distributions to AUF (764) 0 0
Ending Net Assets $17,490 $16,978 $16,978
UTIMCO 03/30/2016
I. PERMANENT UNIVERSITY FUND
Investment Reports for Periods Ended February 29, 2016
Prepared in accordance with Texas Education Code Sec. 51.0032
Fiscal Year to Date
Asset Allocation Returns Value Added
20%
25%
30%
35%
40%
45%
50%
55%
60%
65%
70%
75%
80%
% o
f P
ort
folio
Illiq
uid
Permanent University FundActual Illiquidity vs. Trigger Zones
Maximum Actual Minimum 1 Year
May 11-12, 2016 M
eeting of the U. T
. System
Board of R
egents - Finance and P
lanning Com
mittee
Agenda B
ook - 107

Actual Policy Portfolio Policy Benchmark Tactical Allocation
Active Management Total
More Correlated and Constrained: Investment Grade 6.8% 6.5% 0.99% 2.68% 0.04% -0.11% -0.07% Credit-Related 0.1% 0.0% 0.04% -3.88% 0.00% 0.00% 0.00% Real Estate 2.3% 2.5% -6.53% 1.28% 0.00% -0.20% -0.20% Natural Resources 5.7% 7.5% -12.16% -6.43% 0.10% -0.44% -0.34% Developed Country 12.6% 14.0% -10.24% -5.18% 0.04% -0.71% -0.67% Emerging Markets 9.1% 9.5% -6.53% -8.85% 0.00% 0.22% 0.22%Total More Correlated and Constrained 36.6% 40.0% -7.30% -4.56% 0.18% -1.24% -1.06%
Less Correlated and Constrained 28.3% 29.0% -5.53% -5.05% -0.10% -0.03% -0.13%
Private Investments 35.1% 31.0% 0.00% 1.07% 0.02% -0.26% -0.24%
Total 100.0% 100.0% -4.37% -2.94% 0.10% -1.53% -1.43%
Summary of Capital Flows
($ millions)Fiscal Year Ended August 31, 2015
Quarter Ended February 29, 2016
Fiscal Year to Date August 31, 2016
Beginning Net Assets $8,325 $8,142 $8,237
Contributions 230 94 150
Withdrawals (43) (1) (4)
Distributions (366) (102) (203)
Investment Return (Net of
Expenses) 91 (313) (360)
Ending Net Assets $8,237 $7,820 $7,820
UTIMCO 3/21/16
II. GENERAL ENDOWMENT FUNDInvestment Reports for Periods Ended February 29, 2016
Prepared in accordance with Texas Education Code Sec. 51.0032
Fiscal Year to Date Asset Allocation Returns Value Added
20%
25%
30%
35%
40%
45%
50%
55%
60%65%
70%
75%
80%
% of P
ortfolio Illiquid
General Endowment FundActual Illiquidity vs. Trigger Zones
Maximum Actual Minimum 1 Year
May 11-12, 2016 M
eeting of the U. T
. System
Board of R
egents - Finance and P
lanning Com
mittee
Agenda B
ook - 108

Actual Policy Portfolio Policy Benchmark Tactical Allocation
Active Management Total
More Correlated and Constrained: Investment Grade 34.3% 30.0% 1.22% 2.68% 0.08% -0.42% -0.34% Credit-Related 0.0% 0.0% 0.00% 0.00% 0.00% 0.00% 0.00% Real Estate 2.5% 3.0% -6.53% 1.28% 0.02% -0.22% -0.20% Natural Resources 4.9% 7.0% -12.15% -6.43% 0.10% -0.41% -0.31% Developed Country 7.8% 9.0% -10.33% -5.18% 0.02% -0.48% -0.46% Emerging Markets 5.0% 6.0% -6.45% -8.85% 0.02% 0.15% 0.17%Total More Correlated and Constrained 54.5% 55.0% -3.22% -1.05% 0.24% -1.38% -1.14%
Less Correlated and Constrained 45.5% 45.0% -5.54% -5.05% -0.28% 0.00% -0.28%
Private Investments 0.0% 0.0% 0.00% 0.00% 0.00% 0.00% 0.00%
Total 100.0% 100.0% -4.26% -2.84% -0.04% -1.38% -1.42%
Summary of Capital Flows
($ millions)Fiscal Year Ended August 31, 2015
Quarter Ended February 29, 2016
Fiscal Year to Date August 31, 2016
Beginning Net Assets $6,665 $7,095 $7,037
Contributions 1,448 428 707
Withdrawals (627) (74) (196)
Distributions (210) (54) (107)
Investment Return (Net of
Expenses) (239) (261) (307)
Ending Net Assets $7,037 $7,134 $7,134
UTIMCO 4/5/2016
Returns Value Added
III. INTERMEDIATE TERM FUNDInvestment Reports for Periods Ended February 29, 2016
Prepared in accordance with Texas Education Code Sec. 51.0032
Asset Allocation Fiscal Year to Date
0%
5%
10%
15%
20%
25%
30%
35%
40%
45%
50%
55%
60%
% of P
ortfolio Illiquid
Intermediate Term FundActual Illiquidity vs. Trigger Zones
Maximum Actual Minimum 1 Year
May 11-12, 2016 M
eeting of the U. T
. System
Board of R
egents - Finance and P
lanning Com
mittee
Agenda B
ook - 109

IV. SEPARATELY INVESTED ASSETSSummary Investment Report at February 29, 2016
Report prepared in accordance with Texas Education Code Sec. 51.0032
($ thousands)FUND TYPE
OPERATING FUNDSCURRENT PURPOSE ENDOWMENT & ANNUITY & LIFE TOTAL EXCLUDING (DEBT PROCEEDS AND
DESIGNATED RESTRICTED SIMILAR FUNDS INCOME FUNDS AGENCY FUNDS OPERATING FUNDS (SHORT TERM FUND) TOTALASSET TYPESCash & Equivalents: BOOK MARKET BOOK MARKET BOOK MARKET BOOK MARKET BOOK MARKET BOOK MARKET BOOK MARKET BOOK MARKETBeginning value 11/30/15 10,247 10,247 3,645 3,645 98,013 98,013 1,859 1,859 739 739 114,503 114,503 1,895,989 1,895,989 2,010,492 2,010,492 Increase/(Decrease) (10,246) (10,246) (2,043) (2,042) (343) (343) (261) (261) 481 481 (12,412) (12,411) 516,616 516,616 504,204 504,205 Ending value 02/29/16 1 1 1,602 1,603 97,670 97,670 1,598 1,598 1,220 1,220 102,091 102,092 2,412,605 2,412,605 2,514,696 2,514,697
Debt Securities: Beginning value 11/30/15 - - 11 12 11,353 11,554 8,908 8,713 - - 20,272 20,279 - - 20,272 20,279 Increase/(Decrease) - - (4) (6) (136) (272) 288 (46) - - 148 (324) - - 148 (324) Ending value 02/29/16 - - 7 6 11,217 11,282 9,196 8,667 - - 20,420 19,955 - - 20,420 19,955
Equity Securities: Beginning value 11/30/15 180,941 177,399 575 575 41,432 50,047 12,534 12,355 - - 235,482 240,376 - - 235,482 240,376 Increase/(Decrease) (176,985) (166,451) (41) (31) 533 12,662 - (1,214) - - (176,493) (155,034) - - (176,493) (155,034) Ending value 02/29/16 3,956 10,948 534 544 41,965 62,709 12,534 11,141 - - 58,989 85,342 - - 58,989 85,342
Other:Beginning value 11/30/15 - - 973 973 2 2 4 4 931 931 1,910 1,910 - - 1,910 1,910 Increase/(Decrease) - - (159) (159) (2) (2) 1 1 (479) (479) (639) (639) - - (639) (639) Ending value 02/29/16 - - 814 814 - - 5 5 452 452 1,271 1,271 - - 1,271 1,271
Total Assets:Beginning value 11/30/15 191,188 187,646 5,204 5,205 150,800 159,616 23,305 22,931 1,670 1,670 372,167 377,068 1,895,989 1,895,989 2,268,156 2,273,057 Increase/(Decrease) (187,231) (176,697) (2,247) (2,238) 52 12,045 28 (1,520) 2 2 (189,396) (168,408) 516,616 516,616 327,220 348,208 Ending value 02/29/16 3,957 10,949 2,957 2,967 150,852 171,661 23,333 21,411 1,672 1,672 182,771 208,660 2,412,605 2,412,605 2,595,376 2,621,265
Details of individual assets by account furnished upon request.
UTIMCO 3/22/2016
May 11-12, 2016 M
eeting of the U. T
. System
Board of R
egents - Finance and P
lanning Com
mittee
Agenda B
ook - 110

6. U. T. System Board of Regents: Approval of annual distributions from the Permanent University Fund, the Permanent Health Fund, the Long Term Fund, and the Intermediate Term Fund
RECOMMENDATION
The Chancellor concurs with the Deputy Chancellor and the Executive Vice Chancellor for Business Affairs in the recommendation that
a. the Fiscal Year 2017 distribution from the Permanent University Fund (PUF) to the Available University Fund (AUF) be increased from $772,876,690 to $839,441,000effective September 1, 2016. This distribution equates to 5.00% of the trailing 12-quarter average of the net asset value of the PUF;
b. the distribution rate for the Permanent Health Fund (PHF) be increased from $0.0606 per unit to $0.0612 per unit for Fiscal Year 2017 (effective with November 30, 2016 distribution);
c. the distribution rate for the U. T. System Long Term Fund (LTF) be increased from $0.3472 per unit to $0.3507 per unit for Fiscal Year 2017 (effective with November 30, 2016 distribution); and
d. the distribution rate for the U. T. System Intermediate Term Fund (ITF) remain at 3.0% per annum (paid monthly) for Fiscal Year 2017.
BACKGROUND INFORMATION
The PUF Investment Policy states that the Board of Regents will approve an annual distribution from the PUF to the AUF. Regents’ Rule 80303 provides that the default distribution shall be an amount equal to 4.75% of the trailing 12-quarter average of the net asset value of the PUF for the quarter ending February of each fiscal year unless the average annual rate of return of the PUF investments over the trailing 12 quarters exceeds the Expected Return by 25 basis points or more, in which case distribution shall be an amount equal to 5.0% of the trailing 12-quarter average. “Expected Return” is the Expected Annual Return or Benchmarks set out in Exhibit A to the PUF Investment Policy Statement.
As shown in the table below, the average annual return of the PUF investments for the trailing 12 quarters ending February 29, 2016, did not exceed the Expected Return by 25 basis points or more (≥.25%). Therefore, as outlined in Regents’ Rule 80303, the “default” distribution rate for Fiscal Year 2016-2017 would be 4.75%, or $797,468,950.
Trailing 12 Quarters Ending February 29,
2016 Expected or Benchmark Excess/(Deficit)Average Annual Rate of Return
4.22% 5.40% (1.18%)
May 11-12, 2016 Meeting of the U. T. System Board of Regents - Finance and Planning Committee
Agenda Book - 111

Due to continued relatively strong royalty income and a desire to continue to enhance quality and invest in the U. T. System institutions even during a period of moderate capital market returns, it is the recommendation of the Chancellor and the Executive Vice Chancellor for Business Affairs that the distribution from the PUF to the AUF for Fiscal Year 2017 be $839,441,000 or 5.00% of the trailing 12-quarter average of the net asset value of the PUF. This calculation is shown below:
Quarter Ended Net Asset Value05/31/2013 14,630,924,69708/31/2013 14,852,538,51011/30/2013 15,625,425,85702/28/2014 16,284,907,290
05/31/2014 16,912,325,81808/31/2014 17,364,902,52011/30/2014 17,533,457,25502/28/2015 18,043,442,921
05/31/2015 18,200,267,85508/31/2015 17,490,041,36511/30/2015 17,549,833,95002/29/2016 16,977,772,075
$ 201,465,840,112Number of quarters 12Average Net Asset Value $ 16,788,820,009Distribution Percentage 5.00%
FY 2016-17 Distribution $ 839,441,000
Article VII, Section 18 of the Texas Constitution requires that the amount of distributions to the AUF be determined by the Board of Regents of The University Texas System (Board of Regents) in a manner intended to provide the AUF with a stable and predictable stream of annual distributions and to maintain over time the purchasing power of PUF investments andannual distributions to the AUF. The Constitution further limits the Board of Regents’ discretion to set annual PUF distributions to the satisfaction of three tests:
1. The amount of PUF distributions to the AUF in a fiscal year must be not less than the amount needed to pay the principal and interest due and owing in that fiscal year on PUF bonds and notes. The proposed distribution of $839,441,000 is substantially greater than PUF bond debt service of $290,306,000 projected for FY 2016-2017.
System Debt ServiceU. T. $ 154,155,000
TAMU 136,151,000 Total: $ 290,306,000
Sources: U. T. System Office of Finance
Texas A&M University System Office of Treasury Services
2. The Board of Regents may not increase annual PUF distributions to the AUF (except as necessary to pay PUF debt service) if the purchasing power of PUF investments for any rolling 10-year period has not been preserved. As the schedule below indicates, the average annual increase in the rate of growth of the value of PUF investments (net of expenses, inflation, and distributions) for the trailing 10-year period ended February 29, 2016, was 3.67%, which indicates that the purchasing power test was met.
May 11-12, 2016 Meeting of the U. T. System Board of Regents - Finance and Planning Committee
Agenda Book - 112
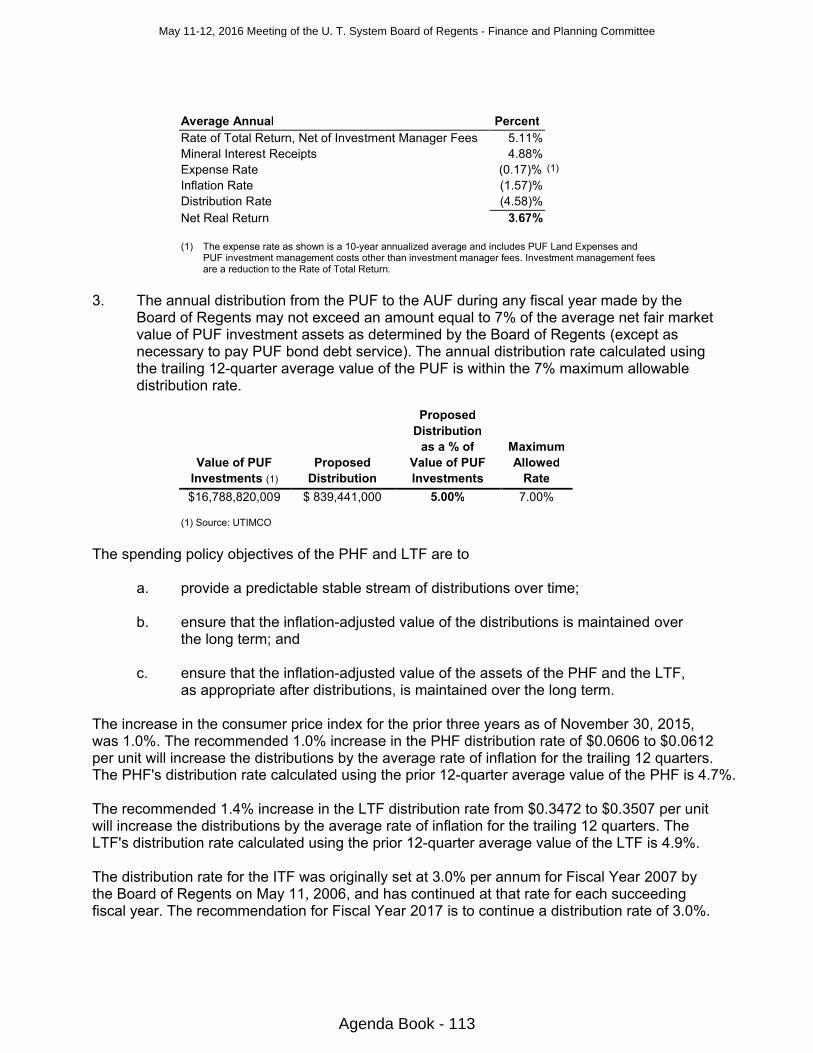
Average Annual PercentRate of Total Return, Net of Investment Manager Fees 5.11%Mineral Interest Receipts 4.88%Expense Rate (0.17)% (1)
Inflation Rate (1.57)%Distribution Rate (4.58)%Net Real Return 3.67%
(1) The expense rate as shown is a 10-year annualized average and includes PUF Land Expenses andPUF investment management costs other than investment manager fees. Investment management fees are a reduction to the Rate of Total Return.
3. The annual distribution from the PUF to the AUF during any fiscal year made by the Board of Regents may not exceed an amount equal to 7% of the average net fair market value of PUF investment assets as determined by the Board of Regents (except as necessary to pay PUF bond debt service). The annual distribution rate calculated using the trailing 12-quarter average value of the PUF is within the 7% maximum allowable distribution rate.
ProposedDistribution
as a % of MaximumValue of PUF Proposed Value of PUF Allowed
Investments (1) Distribution Investments Rate
$16,788,820,009 $ 839,441,000 5.00% 7.00%
(1) Source: UTIMCO
The spending policy objectives of the PHF and LTF are to
a. provide a predictable stable stream of distributions over time;
b. ensure that the inflation-adjusted value of the distributions is maintained over the long term; and
c. ensure that the inflation-adjusted value of the assets of the PHF and the LTF, as appropriate after distributions, is maintained over the long term.
The increase in the consumer price index for the prior three years as of November 30, 2015, was 1.0%. The recommended 1.0% increase in the PHF distribution rate of $0.0606 to $0.0612per unit will increase the distributions by the average rate of inflation for the trailing 12 quarters. The PHF's distribution rate calculated using the prior 12-quarter average value of the PHF is 4.7%.
The recommended 1.4% increase in the LTF distribution rate from $0.3472 to $0.3507 per unit will increase the distributions by the average rate of inflation for the trailing 12 quarters. The LTF's distribution rate calculated using the prior 12-quarter average value of the LTF is 4.9%.
The distribution rate for the ITF was originally set at 3.0% per annum for Fiscal Year 2007 by the Board of Regents on May 11, 2006, and has continued at that rate for each succeeding fiscal year. The recommendation for Fiscal Year 2017 is to continue a distribution rate of 3.0%.
May 11-12, 2016 Meeting of the U. T. System Board of Regents - Finance and Planning Committee
Agenda Book - 113