table of contents - design indaba · design indaba expo (majority high lsm shopping crowds) the...
TRANSCRIPT


This is Design Indaba Design Indaba HighlightsEconomic Impact Design Indaba MarketingSponsorship Architecture (2014)Sponsorship Branding Rights (2014)Design Indaba AudienceRights Property Evaluation (2014) Prepared by: Prof Kamilla Swart: Kamilla – SA Sport and Tourism Consultancy (May 2014)
Design Indaba ConfEREnCEDesign Indaba ExPoDesign Indaba MUSICDesign Indaba fILMDesign Indaba Do TAnKDesign Indaba DIGITAL
Economic Contribution of the 2014 Design IndabaPrepared by: Barry Standish, in Association with University of Cape Town, Graduate School of Business (May 2014)
Sponsorship Branding Rights (2015)Design Indaba Digital Ratecard
Table Of COnTenTs
Page68101116182628
485256606468
73
9296
1.2.3.4.5.6.7.8.
9.10.11.12.13.14.
15.
16.17.

average sales per visitor to the general public at expo
(double the figure for any other expo)
r201.9 million 1146 r15.4
571
575
indirect jobs created
direct jobs created
r13.7
r736
r1.7
million in business orders
african countries excluding south africa
million in sales to public
total jobs created million earned
the economic impact of
RighTs PROPeRTy Prepared by Prof Kamilla Swart: Kamilla – SA Sport and Tourism Consultancy
POsT-evenT RePORT baCkBy Interactive Africa
s P O n s O R s h i P evaluation 2014
1. This is Design inDaba
Since 1994, Design Indaba has been championing the notion that creativity can make a better world. We believe the design industry is one to be reckoned with and can contribute to local and global economies, in the same capacity as the finance, mining or oil industries; the success of Design Indaba is evidence of this. In the past six years alone, Design Indaba has contributed over R1.7 billion to the South African GDP – one of the largest contributions to the GDP from a single source in the design industry.
Design plays a major role in job creation and economic growth and leads to a better quality of life for humankind. Design observes societal problems and provides solutions; it’s all about thinking differently and ultimately growing businesses and bottom lines. We embrace this as a fundamental truth to the world we live in. Africa’s natural resources are both a blessing and a curse, having led to minimal investment in human capital. There is a dire need to readdress this in order to allow continued growth into the global marketplace. The creative industries must become the country’s and continent’s greatest export. As a company, we want to continue making this a reality.
hisTORy Of Design inDaba
Design Indaba did not come to life fully formed. It has taken the dedication and support of our team, sponsors, speakers, media and loyal audience to transform it into what it is today.
from the inaugural conference in 1995 with just 11 speakers, Design Indaba has grown to become a multidisciplinary celebration of every form of creativity and design, importing the brightest creative minds to Cape Town and exporting the best of African design into the global marketplace.
As a company, Design Indaba seeks to continue this phenomenal growth and look beyond our shores by both incorporating design from the entire continent and also propogating Design Indaba as a brand and ideology globally. This export will rests on our belief that the creative will inherit the earth. only through adressing socio-economic and context-specific environmental issues through creativity will we leave a better world, and a better Africa as inheritance
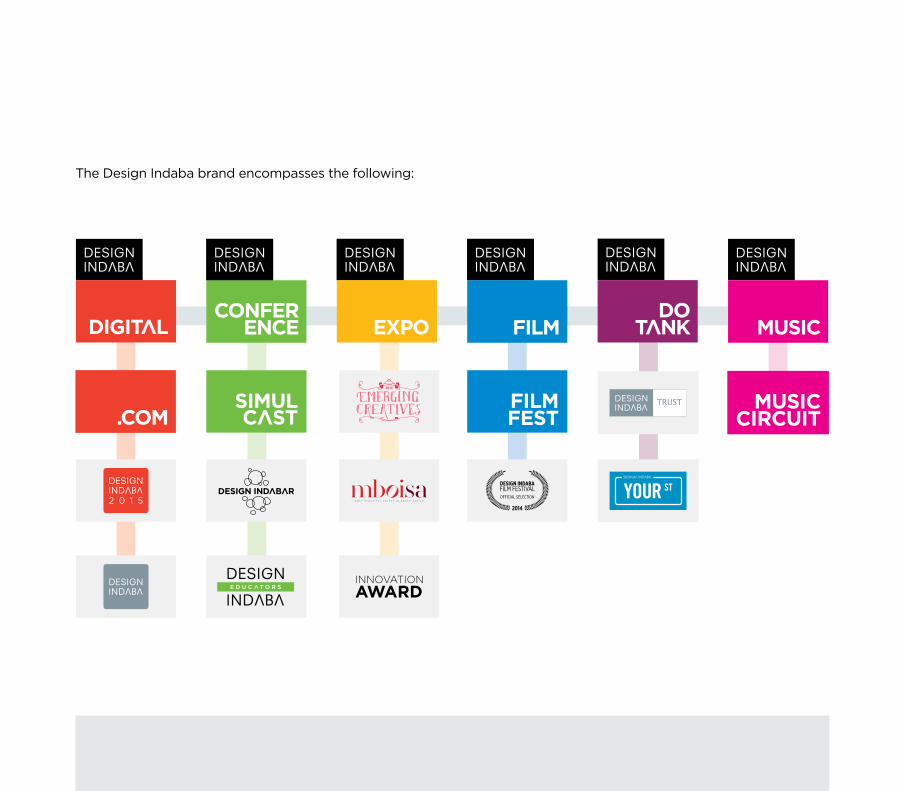
The Design Indaba brand encompasses the following:
simulCasT
filmfesT
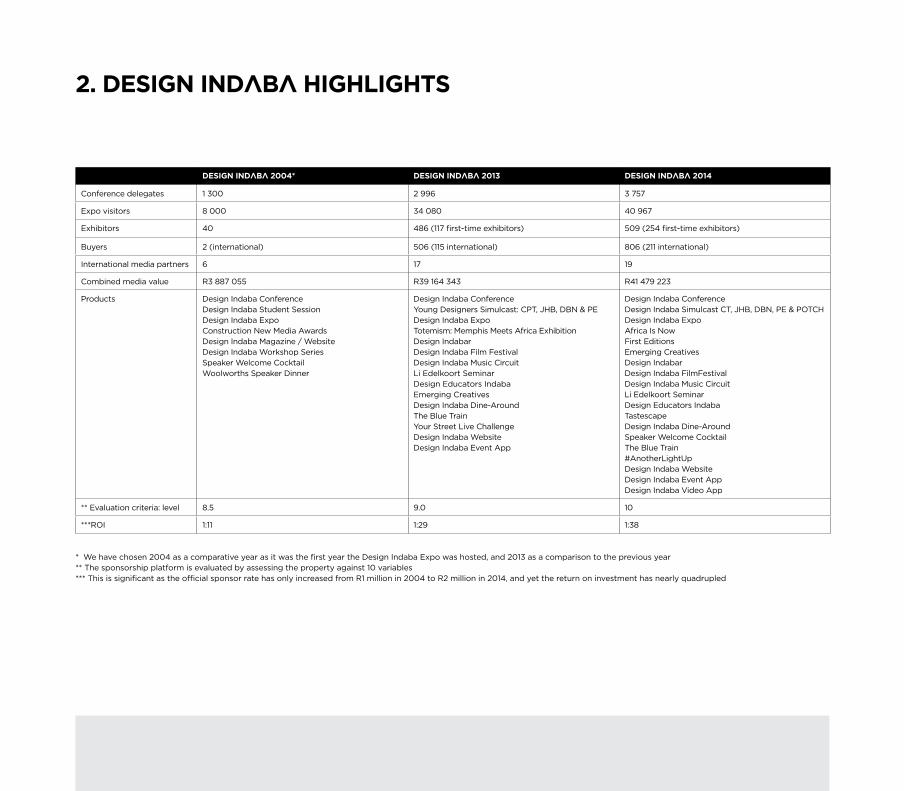
2. Design inDaba highlighTs
Design inDaba 2004* Design inDaba 2013 Design inDaba 2014
Conference delegates 1 300 2 996 3 757
Expo visitors 8 000 34 080 40 967
Exhibitors 40 486 (117 first-time exhibitors) 509 (254 first-time exhibitors)
Buyers 2 (international) 506 (115 international) 806 (211 international)
International media partners 6 17 19
Combined media value R3 887 055 R39 164 343 R41 479 223
Products Design Indaba Conference Design Indaba Student SessionDesign Indaba ExpoConstruction new Media AwardsDesign Indaba Magazine / WebsiteDesign Indaba Workshop SeriesSpeaker Welcome Cocktail Woolworths Speaker Dinner
Design Indaba Conference Young Designers Simulcast: CPT, JHB, DBn & PEDesign Indaba ExpoTotemism: Memphis Meets Africa ExhibitionDesign Indabar Design Indaba film festivalDesign Indaba Music CircuitLi Edelkoort SeminarDesign Educators IndabaEmerging CreativesDesign Indaba Dine-AroundThe Blue TrainYour Street Live ChallengeDesign Indaba WebsiteDesign Indaba Event App
Design Indaba ConferenceDesign Indaba Simulcast CT, JHB, DBn, PE & PoTCHDesign Indaba ExpoAfrica Is nowfirst EditionsEmerging CreativesDesign IndabarDesign Indaba filmfestivalDesign Indaba Music CircuitLi Edelkoort SeminarDesign Educators IndabaTastescapeDesign Indaba Dine-AroundSpeaker Welcome CocktailThe Blue Train#AnotherLightUpDesign Indaba WebsiteDesign Indaba Event AppDesign Indaba Video App
** Evaluation criteria: level 8.5 9.0 10
***RoI 1:11 1:29 1:38
* We have chosen 2004 as a comparative year as it was the first year the Design Indaba Expo was hosted, and 2013 as a comparison to the previous year** The sponsorship platform is evaluated by assessing the property against 10 variables*** This is significant as the official sponsor rate has only increased from R1 million in 2004 to R2 million in 2014, and yet the return on investment has nearly quadrupled
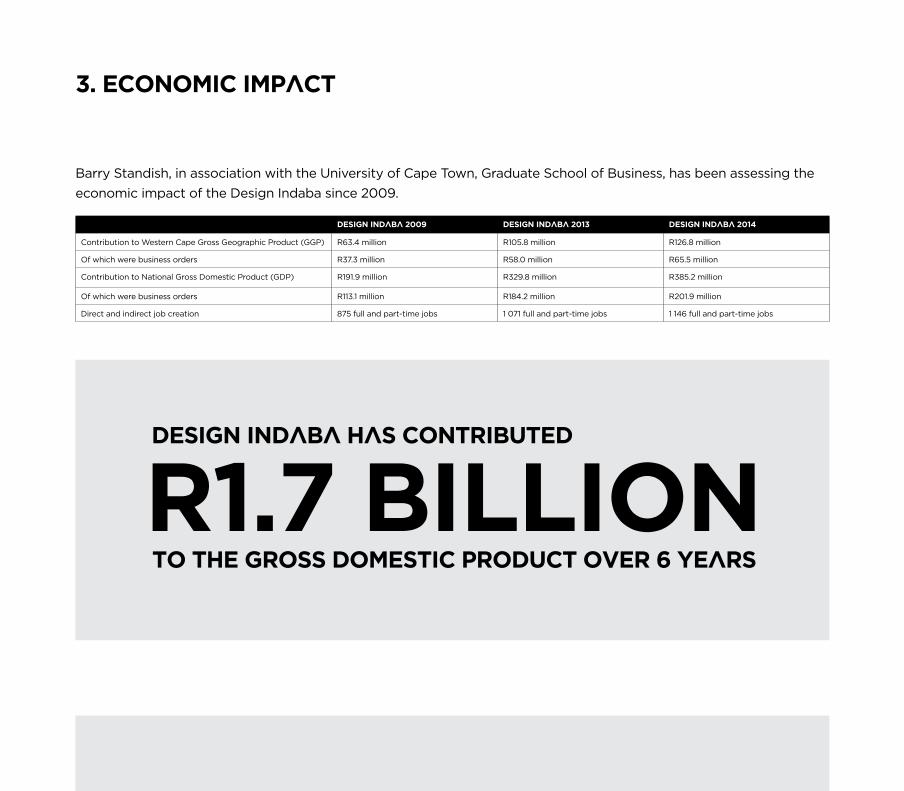
DESIGN INDABA 2009 DESIGN INDABA 2013 DESIGN INDABA 2014
Contribution to Western Cape Gross Geographic Product (GGP) R63.4 million R105.8 million R126.8 million
Of which were business orders R37.3 million R58.0 million R65.5 million
Contribution to National Gross Domestic Product (GDP) R191.9 million R329.8 million R385.2 million
Of which were business orders R113.1 million R184.2 million R201.9 million
Direct and indirect job creation 875 full and part-time jobs 1 071 full and part-time jobs 1 146 full and part-time jobs
Barry Standish, in association with the University of Cape Town, Graduate School of Business, has been assessing the economic impact of the Design Indaba since 2009.
3. EcoNomIc ImpAct
R1.7 BIllIoNto thE GRoSS DomEStIc pRoDuct ovER 6 yEARS
DESIGN INDABA hAS coNtRIButED
4. Design inDaba maRkeTing
When Design Indaba first launched, it largely attracted the young hipsters of the advertising industry, as well as academics and players involved specifically in the creative industry. However, research analysis indicates that as Design Indaba has evolved, the audience has also evolved significantly, and now plays host to:• Middle and senior-management marketers from
corporate South Africa• Design practitioners including architects, interior
decorators, artists, writers and fashion designers• Students – both high school and tertiary level• The advertising industry• Financial services and manufacturing industry• Academics• Small business owners and entrepreneurs• The general public – specifically regarding the
Design Indaba Expo (majority high LSM shopping crowds)
The corporate sector’s increased acknowledgement of the importance of design, creativity, innovation and inspiration in their business – from strategic initiatives to the daily running of the business – has resulted in this major shift and expansion of the current audience.
THE MARKETING MIXDesign Indaba has a comprehensive promotional platform that employs the marketing aspects of both international and local media.
2014 Design inDaba CamPaign
The 2014 campaign focussed on the proud legacy of Design Indaba, that for 20 years we have brought the world’s brightest creative minds to Cape Town and their words have impacted the entire fabric of our local design culture. Design Indaba has been “spreading the word” that design has the power to change the world for the better since its inception.
The campaign featured the ideas, statements and sentiments of both past and present speakers and exhibitors that have impacted both our notions of design and the world around them. The ad campaign used these quotes and ‘painted’ the cityscape of Cape Town with bold statements like “We should design for a better society and not for a richer society” – (oliviero Toscani) and “Creativity is what you do when there is not available knowledge” (Alejandro Aravena).
There was also an aspect of physically “spreading the word” with the marketing collateral. flyers, posters, programmes, advertisements, billboards, window wraps, painted walls and vehicle branding all carried profound statements and could either be physically spread or were in high traffic areas to spread the thinking and provoke conversation.

lOCal meDia COveRage
TelevisionenCA, SABC 2, SABC 3, eTV, MnET, Aljazeera, Kyknet, Ann7, VUZU TV, CnBC Africa, SABC news, Africa Magic
RadioCape Talk, KfM, 5fm, Bush Radio, Smile fM, SAfm, Heart 104.9, Goodhope fM, Talk Radio 702, Chai fM, UJfM 95.4, Algoa fM, Power fM, fine Music Radio, Radio Tygerberg, 2oceansVibe Radio, Radio CCfM, Radio Atlantis
MagazinesElle, Elle Décor, Visi, Art South Africa, House & Leisure, Real Estate, High Life South Africa, the Verve, Designing Ways, Service, Sawbona, Equinox. Property Junction, SA plastics, Mens Inc., Ideas, odyssey, Blaque, Hello Cape Town, Hello Durban, Hello Johannesburg, Screen Africa, Motherwell Sun, Walmer Sun, The northern Sun, Beyond, Women’s Choice, The Bay Magazine, AdVantage, GQ, Cosmopolitan, Ideas, Idees, Skyways, South African Garden and Home, Habitat, Grazia South Africa, Taste, fairlady, Good Housekeeping, House & Garden, Grazia South Africa, You, Huisgenoot, The Big Issue, Tuis, Kulula, Mango Juice, DRUM, finWeek, Property Magazine
NewspapersSunday Times, The Times, Die Burger, Mail & Guardian, Cape Times, Cape Argus, The Herald, The new Age, City Press, Weekend Argus, Beeld, Eikestandnuus, The Star, Sunday Independent, Business Day, Sunday Tribune, Daily news, Pretoria news, Mercury, The Sowetan, Son, Western Sun, Volksblad, People’s Post, Daily Dispatch, Daily Voice, Your Business, noordwes Gazette, The next 48 Hours, Business Day Wanted, Cape Business news, City Views, City Vision, Designtimes, financial Mail, Herald, Hillcrest fever, Hospitality market Place, The Event, Witness Weekend, The Tattler

Onlineaccordingtojerri.blogspot.com, zagossip.com, enca.com, eikestadnuus.co.za, whatsonincapetown.com, getnews.co.za, yomzansi.com, filmcontact.com, mype.co.za, travelground.com, link2media.co.za, oprahmag.co.za, iwantthat.co.za, news100.co.za, leadingarchitecture.co.za 021magazine.co.za, 2oceansvibe.com, 48hours.co.za, 10and5.com, advantagemagazine.co.za, adfocus.co.za, afashionfriend.co.za, africareport.com, algoafm.co.za, all4women.co.za, andlollipops.com, atlargewithwanted.tumblr.com, artslink.co.za, arttimes.co.za, bandwidthblog.com, basa.co.za, bdlive.co.za, becomingyou.co.za, beeld.com, bizcommunity.com, blaque.co.za, bpmmag.co.za, businessday.co.za, businesstrade.co.za, capetown.gov.za, capetownlive.com, capegateway.gov.za, capetownmagazine.com, capetownpartnership.co.za, capetown.travel, cbn.co.za, channel24.co.za, cherryflava.com, citypress.co.za, designmind.com, destinyman.com, dieburger.com, dievolksblad.co.za, dmma.co.za, dontparty.co.za, dressedbystyle.com, dstv.com, durbanzone.co.za, eat-in.co.za, eatout.co.za, ecr.co.za, electrotrash.co.za, elle.co.za, emergingstars.co.za, emmajanenation.com, engineeringnews.co.za, eventsnow.co.za, fairlady.com, fastmoving.co.za, fm.co.za, furturecapetown.com, getitonline.co.za, glamour.co.za, golegal.co.za, gq.co.za, handsomethings.com, hy-se-sy-se.com, iafrica.com, iammagazine.co.za, ifashion.co.za, iheartyouroutfit.com, iolproperty.co.za, itonline.co.za, itssimplyheaven.com, itweb.co.za, iwantthat.co.za, jip.co.za, kimgray.co.za, kissblushandtell.com, lanaloustyle.blogspot.com, leadsa.co.za, liveoutloud.co.za, loveaffaircapetown.com, manofthecloth.co.za, marieclairevoyant.com, marcelaospina.com, marketingupdate.co.za, marklives.com, mediaupdate.co.za, mg.co.za, missmoss.co.za, msn.co.za, mycitybynight.co.za, nadiavandermescht.co.za, ngopulse.org, onesmallseed.com, picknpay.co.za, plascontrends.co.za, politicsweb.co.za, polity.org.za, popularmechanics.co.za, propertyposer.co.za, publicityupdate.co.za, sacreativenetwork.co.za, sadecor.co.za, sagoodnews.co.za, sahomeowner.co.za, samusicscene.co.za, shadesofgold.co.za, sharmanator.com, shesthegeek.co.za, showbizone.co.za, sikidesign.blogspot.com, simplygreen.co.za, skinnylaminx.com/blog, southafrica.net, spice4life.co.za, styleguidecapetown.blogspot.stylesociety.co.za, sundayworld.co.za, superficialgirls.com, tailsofamermaid.com, thecallsheet.co.za, thedailymaverick.co.za, thedesigntabloid.co.za, theevent.co.za, thegremlin.co.za, theherald.co.za, themarketingsite.com, themedia.co.za, thenewage.co.za, theprettyblog.com, thepropertymag.co.za, theridgeonline.co.za, timeslive.co.za, tonight.co.za, totallymad.co.za, trendlives.info, ventureburn.com, visi.co.za, volksblad.com, we-are-awesome.com, wecanchange.co.za, whalecottage.com/blogwhatson.co.za, whatsupcapetown.com, whatsupjozi.com, wine.co.za, zaplurk.com
com,
inTeRnaTiOnal meDia COveRage
MagazinesAxIS, Casa Vogue, Creative Review, ICon, Idn, novum, +81, Dwell, Computer Arts, It’s nice That, Design Week, new York Times Magazine, The Guardian (UK), Wallpaper, The Telegraph (UK), Vogue Italy, DAMn, Ideat
Onlineartsthread.com, autraliandesignreview.com, axisjiku.com, blog.artsthread.com, casavogue.globo.com, designboom.com, coolhunting.com, nytimes.com, core77.com, dezeen.com, news360.com, flipboard.com, 89plus.com, itsnicethat.com, idnworld.com, creativebloq.com, feedly.com, creativereview.com, tmagazine.blogs.nytimes.com, novumnet.de, new.pentagram.com, plus81.com, africa.com, semalt.com, wolffolins.com, freshhome.com, pentagram.com, sodapop-design.de, trendtablet.com, designweek.com, dribble.com, gizmodo.com, yatzer.com, cnet.com, 71n7.com, anotherafrica.com, africandigitalart.com, theguardian.com, wallpaper.com, iconeye.com, wgsn.com, contemporary-african-art.com, sagmeisterwalsh.com, scoop.it, hat-trickdesign.co.uk, thesouthafrican.com, skyscrapercity.com, thesouthisblooming.com, dwell.com, lonelyplanet.com, thecreatorsproject.vice.com, atelierfiftyfive.com, jasperealesoriginal.com, stylesight.com, gizmodo.co.uk, telegraph.co.uk, petapixel.com, design-report.de, designbeats.net, fashions.org, habiter-autrement.org, id.carleton.ca, bellanaija.com, cutedrop.com.br, nellyben.com, knifeedgeforums.com, craftafrika.org, inhabitat.com, openarchitecturenetwork.org, design.nl, sanvie.de, ogilvy.com, psfk.com, sogou.com, thevoicebw.com, topsy.com, viaggi.corriere.it, plascontrends.co.za, teresaperez.com.br, wired.com, vam.ac.uk, woostercollective.com, africanlookbook.com, anothermag.com, ansa.it, longnow.org, alastudents.org, memeburn.com, themarketingsite.com, africafashionguide.com, parsons.edu, tuinieren.nl, thewrendesign.com, bfirooz.com, baidu.com, designhunter.co.uk, deisgn-real.com, creativetime.org, creativecounsil.nl, largetail.com, thisisafrica.me, designtoimprovelife.dk, seethisway.com, theculturetrip.com, petitepassport.com, reliancenetconnect.co.in, rosenbaum.com.br, thinkform.com, vogue.it, travelandleisure.com, whatdesigncando.nl, arts.ac.uk, bbc.co.uk
aDveRTising
Advertising placement occurred in all significant channels of communication, including broadcast, print and online to a booked media value of R26 100 000.
The advertising was implemented regionally, nationally and internationally. Print advertising started in november 2013, followed by online advertising in December 2013 and then broadcast advertising in January 2014. for Design Indaba 2014, the broadcast campaign ran until mid-March, the online campaigns are still running and the last print ad appeared in March/April issues. The street pole posters were distributed two weeks prior to the event, highlighting Design Indaba on the whole, but specifically the Design Indaba Expo.
Local advertising was placed in/on:enCA, Sunday Times, Mail & Guardian, Marklives, Bizcommunity, Between10and5, Design Times, Elle Decoration, House & Leisure, Hello Cape Town, We-Are-Awesome, 2oceansVibe, Don’t Party, MyCityBynight, Primedia (Cape Talk), Visi, and Art South Africa.
International print and online publications placements in/on:AxIS (Japan) Casa Vogue (Brazil), Cool Hunting (USA), Core77 (USA), Creative Review (UK), novum (Germany), Design Week (UK), Computer Arts (UK), Designboom (Italy), Dezeen (UK), Arts Thread (UK), Ego Design (Canada), Icon (UK), Idn (Hong Kong), It’s nice That (UK), +81 (Japan), WGSn (USA), and Dwell (USA)
PubliCiTy
The publicity received by the Design Indaba event for 2014 was valued at over R41 million. The media interest has increased over the past few years and the publicity programme rolls out six months prior to the Design Indaba event.
The free publicity generated continues throughout the year in many design, fashion, lifestyle and décor publications. The Design Indaba advocacy work adds significantly to the publicity portfolio, both locally and internationally, as the corporate sector is increasingly turning to Design Indaba as the standard for design, creativity and innovation.
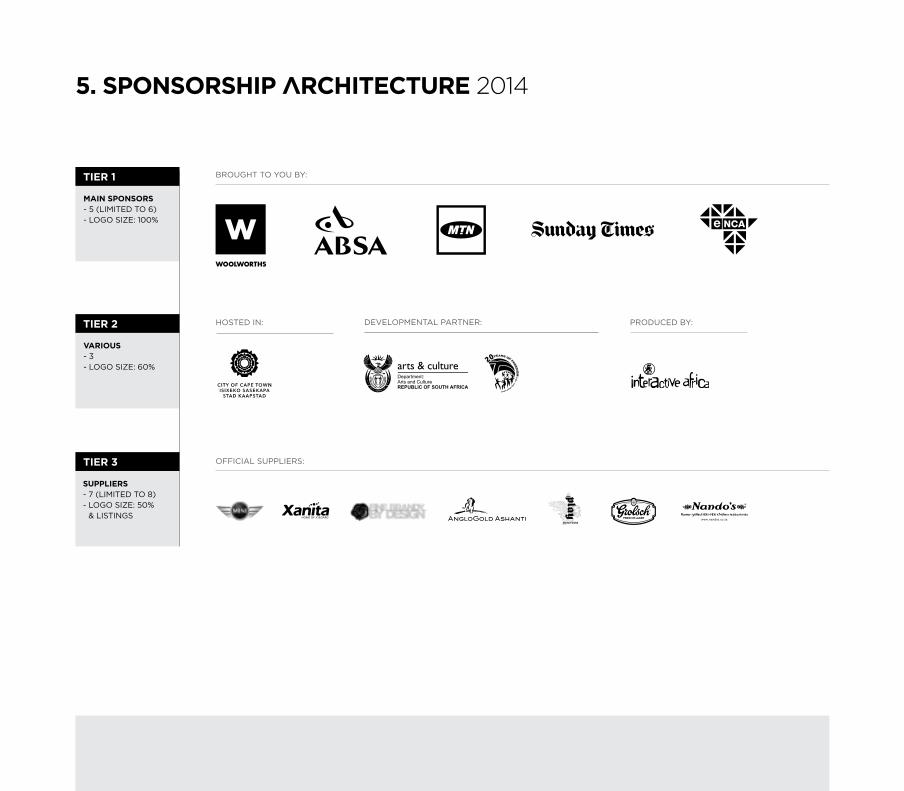
TieR 1
MAIN SpoNSoRS- 5 (LIMITED To 6)- LoGo SIZE: 100%
TieR 2
vARIouS- 3- LoGo SIZE: 60%
TieR 3
SupplIERS- 7 (LIMITED To 8) - LoGo SIZE: 50%
& LISTInGS
5. sPOnsORshiP aRChiTeCTuRe 2014
BRoUGHT To YoU BY:
offICIAL SUPPLIERS:
PRoDUCED BY:DEVELoPMEnTAL PARTnER:HoSTED In:
®
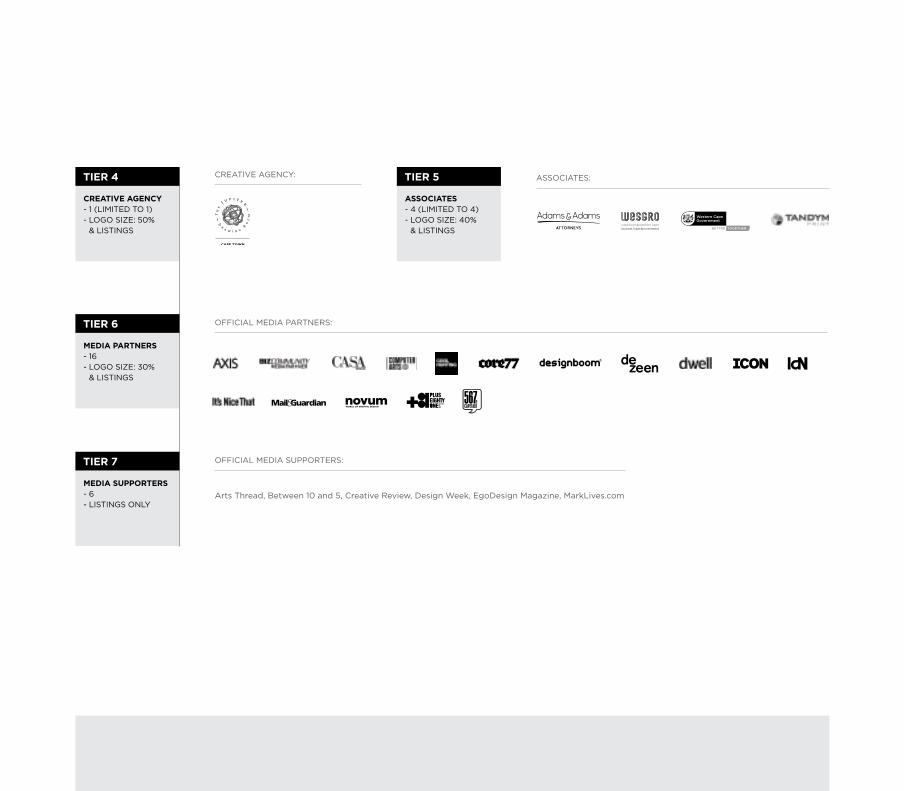
TieR 4
CREATIvE AGENCy- 1 (LIMITED To 1) - LoGo SIZE: 50%
& LISTInGS
TieR 5
ASSoCIATES- 4 (LIMITED To 4) - LoGo SIZE: 40%
& LISTInGS
TieR 6
MEdIA pARTNERS- 16- LoGo SIZE: 30%
& LISTInGS
TieR 7
MEdIA SuppoRTERS- 6- LISTInGS onLY
offICIAL MEDIA SUPPoRTERS:
Arts Thread, Between 10 and 5, Creative Review, Design Week, EgoDesign Magazine, MarkLives.com
CREATIVE AGEnCY: ASSoCIATES:
offICIAL MEDIA PARTnERS:
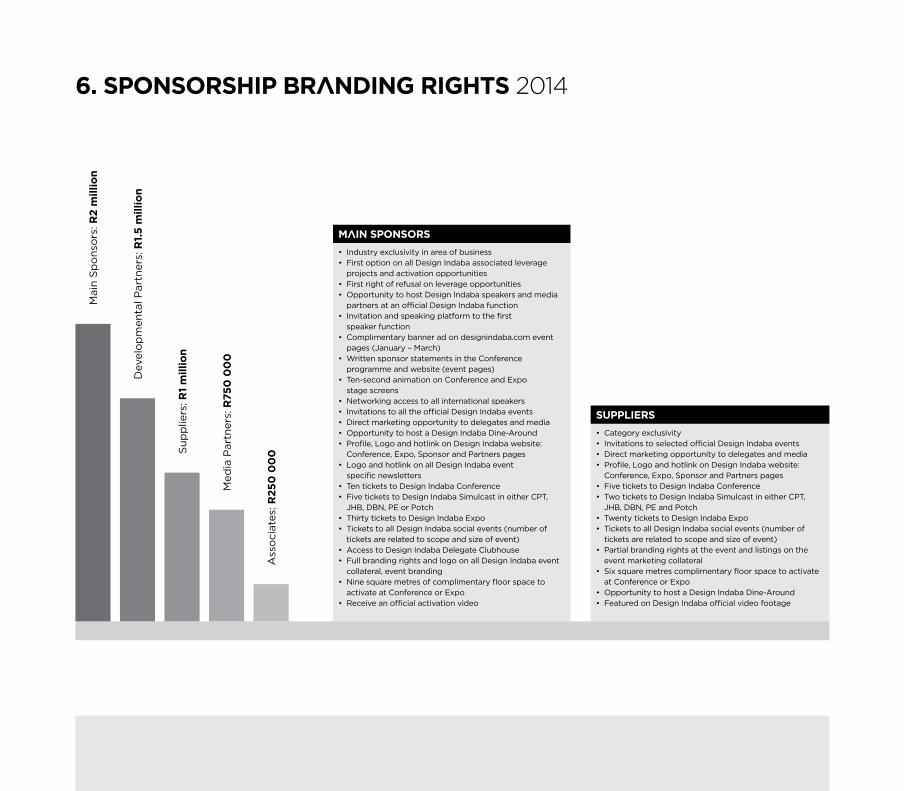
6. sPOnsORshiP bRanDing RighTs 2014
main sPOnsORs
• Industry exclusivity in area of business• First option on all Design Indaba associated leverage
projects and activation opportunities• First right of refusal on leverage opportunities• Opportunity to host Design Indaba speakers and media
partners at an official Design Indaba function• Invitation and speaking platform to the first
speaker function• Complimentary banner ad on designindaba.com event
pages (January – March)• Written sponsor statements in the Conference
programme and website (event pages)• Ten-second animation on Conference and Expo
stage screens• Networking access to all international speakers• Invitations to all the official Design Indaba events• Direct marketing opportunity to delegates and media• Opportunity to host a Design Indaba Dine-Around• Profile, Logo and hotlink on Design Indaba website:
Conference, Expo, Sponsor and Partners pages• Logo and hotlink on all Design Indaba event
specific newsletters• Ten tickets to Design Indaba Conference• Five tickets to Design Indaba Simulcast in either CPT,
JHB, DBn, PE or Potch• Thirty tickets to Design Indaba Expo• Tickets to all Design Indaba social events (number of
tickets are related to scope and size of event)• Access to Design Indaba Delegate Clubhouse• Full branding rights and logo on all Design Indaba event
collateral, event branding • Nine square metres of complimentary floor space to
activate at Conference or Expo• Receive an official activation video
suPPlieRs
• Category exclusivity• Invitations to selected official Design Indaba events• Direct marketing opportunity to delegates and media• Profile, Logo and hotlink on Design Indaba website:
Conference, Expo, Sponsor and Partners pages• Five tickets to Design Indaba Conference• Two tickets to Design Indaba Simulcast in either CPT,
JHB, DBn, PE and Potch• Twenty tickets to Design Indaba Expo• Tickets to all Design Indaba social events (number of
tickets are related to scope and size of event)• Partial branding rights at the event and listings on the
event marketing collateral• Six square metres complimentary floor space to activate
at Conference or Expo• Opportunity to host a Design Indaba Dine-Around• Featured on Design Indaba official video footage
Ass
oci
ates
: R25
0 0
00
Mai
n S
po
nso
rs: R
2 m
illio
n
Dev
elo
pm
enta
l Par
tner
s: R
1.5
mill
ion
Sup
plie
rs: R
1 m
illio
n
Med
ia P
artn
ers:
R75
0 0
00
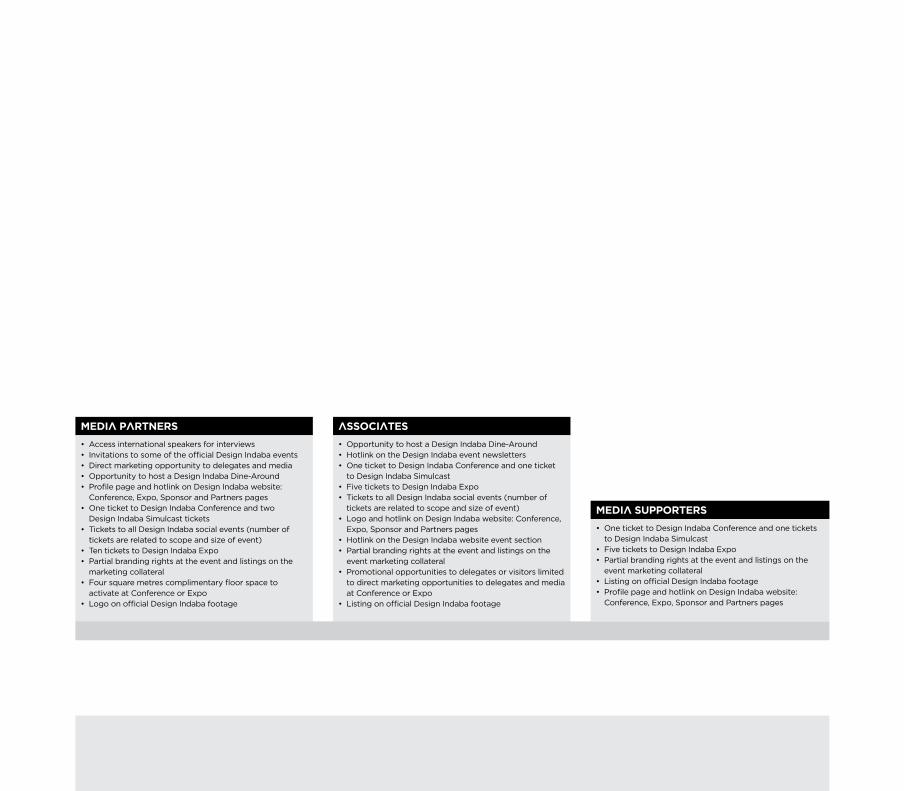
meDia PaRTneRs
• Access international speakers for interviews• Invitations to some of the official Design Indaba events• Direct marketing opportunity to delegates and media• Opportunity to host a Design Indaba Dine-Around• Profile page and hotlink on Design Indaba website:
Conference, Expo, Sponsor and Partners pages• One ticket to Design Indaba Conference and two
Design Indaba Simulcast tickets• Tickets to all Design Indaba social events (number of
tickets are related to scope and size of event)• Ten tickets to Design Indaba Expo• Partial branding rights at the event and listings on the
marketing collateral• Four square metres complimentary floor space to
activate at Conference or Expo• Logo on official Design Indaba footage
assOCiaTes
• Opportunity to host a Design Indaba Dine-Around• Hotlink on the Design Indaba event newsletters• One ticket to Design Indaba Conference and one ticket
to Design Indaba Simulcast• Five tickets to Design Indaba Expo• Tickets to all Design Indaba social events (number of
tickets are related to scope and size of event)• Logo and hotlink on Design Indaba website: Conference,
Expo, Sponsor and Partners pages• Hotlink on the Design Indaba website event section• Partial branding rights at the event and listings on the
event marketing collateral• Promotional opportunities to delegates or visitors limited
to direct marketing opportunities to delegates and media at Conference or Expo
• Listing on official Design Indaba footage
meDia suPPORTeRs
• One ticket to Design Indaba Conference and one tickets to Design Indaba Simulcast
• Five tickets to Design Indaba Expo• Partial branding rights at the event and listings on the
event marketing collateral• Listing on official Design Indaba footage• Profile page and hotlink on Design Indaba website:
Conference, Expo, Sponsor and Partners pages
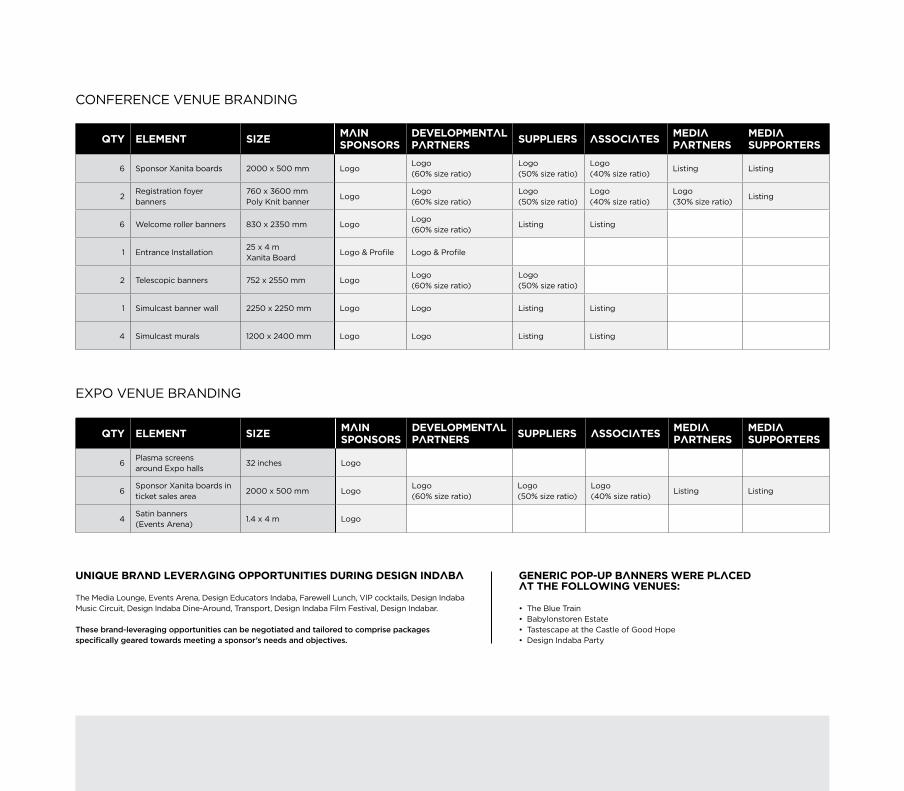
QTy elemenT siZe main sPOnsORs
DevelOPmenTal PaRTneRs suPPlieRs assOCiaTes meDia
PaRTneRsmeDia suPPORTeRs
6 Sponsor xanita boards 2000 x 500 mm LogoLogo (60% size ratio)
Logo (50% size ratio)
Logo (40% size ratio)
Listing Listing
2Registration foyer banners
760 x 3600 mm Poly Knit banner
LogoLogo (60% size ratio)
Logo (50% size ratio)
Logo(40% size ratio)
Logo(30% size ratio)
Listing
6 Welcome roller banners 830 x 2350 mm LogoLogo (60% size ratio)
Listing Listing
1 Entrance Installation25 x 4 m xanita Board
Logo & Profile Logo & Profile
2 Telescopic banners 752 x 2550 mm LogoLogo (60% size ratio)
Logo (50% size ratio)
1 Simulcast banner wall 2250 x 2250 mm Logo Logo Listing Listing
4 Simulcast murals 1200 x 2400 mm Logo Logo Listing Listing
QTy elemenT siZe main sPOnsORs
DevelOPmenTal PaRTneRs suPPlieRs assOCiaTes meDia
PaRTneRsmeDia suPPORTeRs
6Plasma screens around Expo halls
32 inches Logo
6Sponsor xanita boards in ticket sales area
2000 x 500 mm LogoLogo (60% size ratio)
Logo (50% size ratio)
Logo (40% size ratio)
Listing Listing
4Satin banners (Events Arena)
1.4 x 4 m Logo
ConfEREnCE VEnUE BRAnDInG
ExPo VEnUE BRAnDInG
geneRiC POP-uP banneRs WeRe PlaCeD aT The fOllOWing venues:
• The Blue Train • Babylonstoren Estate • Tastescape at the Castle of Good Hope• Design Indaba Party
uniQue bRanD leveRaging OPPORTuniTies DuRing Design inDaba
The Media Lounge, Events Arena, Design Educators Indaba, farewell Lunch, VIP cocktails, Design Indaba Music Circuit, Design Indaba Dine-Around, Transport, Design Indaba film festival, Design Indabar.
These brand-leveraging opportunities can be negotiated and tailored to comprise packages specifically geared towards meeting a sponsor’s needs and objectives.

QTy elemenT siZe main sPOnsORs
DevelOPmenTal PaRTneRs suPPlieRs assOCiaTes meDia
PaRTneRsmeDia suPPORTeRs
6 Sponsor xanita boards 2000 x 500 mm LogoLogo (60% size ratio)
Logo (50% size ratio)
Logo (40% size ratio)
Listing Listing
2Registration foyer banners
760 x 3600 mm Poly Knit banner
LogoLogo (60% size ratio)
Logo (50% size ratio)
Logo(40% size ratio)
Logo(30% size ratio)
Listing
6 Welcome roller banners 830 x 2350 mm LogoLogo (60% size ratio)
Listing Listing
1 Entrance Installation25 x 4 m xanita Board
Logo & Profile Logo & Profile
2 Telescopic banners 752 x 2550 mm LogoLogo (60% size ratio)
Logo (50% size ratio)
1 Simulcast banner wall 2250 x 2250 mm Logo Logo Listing Listing
4 Simulcast murals 1200 x 2400 mm Logo Logo Listing Listing
QTy elemenT siZe main sPOnsORs
DevelOPmenTal PaRTneRs suPPlieRs assOCiaTes meDia
PaRTneRsmeDia suPPORTeRs
6Plasma screens around Expo halls
32 inches Logo
6Sponsor xanita boards in ticket sales area
2000 x 500 mm LogoLogo (60% size ratio)
Logo (50% size ratio)
Logo (40% size ratio)
Listing Listing
4Satin banners (Events Arena)
1.4 x 4 m Logo
QTy elemenT siZe main sPOnsORs
DevelOPmenTal PaRTneRs suPPlieRs assOCiaTes meDia
PaRTneRsmeDia suPPORTeRs
20 Printed adverts Various LogoLogo (60% size ratio)
Listing Listing
1 Website –Logo & copy with hotlink
Logo & hotlink (60% size ratio)
Listing & hotlink
Listing & hotlink
Listing & hotlink
Listing & hotlink
Monthly Electronic newsletter – LogoLogo (60% size ratio)
Listing Listing
250Emerging Creatives posters
A2 Logo
2 000 Street pole posters A1 LogoLogo (60% size ratio)
Listing Listing
656 Street pole flags 1 200 x 2 700 mm1 x logo per flag
500 Simulcast posters A1 Logo Logo Listing Listing
1 400 Simulcast programmes A6 Logo Logo Logo (50% size ratio)
Logo (40% size ratio)
Logo (30% size ratio)
Listing
1 400 Simulcast delegate bags – Logo
7 800Conference speaker programme
A2Logo & 250 word write-up
Logo (60% size ratio)
Logo (50% size ratio)
ListingLogo (30% size ratio)
Listing
10 000 Visitors Guide A5Logo & advertisement
Logo (60% size ratio)
Listing Listing Listing Listing
1 000 Buyers Guide A6Logo & 250 word write-up
Logo (60% size ratio)
Logo (50% size ratio)
Logo (40% size ratio)
Logo (30% size ratio)
Listing
3 Television commercials – LogoLogo (60% size ratio)
–Design Indaba official video footage
–Logo & interview
Logo (60% size ratio)
Logo (50% size ratio)
Logo (30% size ratio)
– CTICC screens – LogoLogo (60% size ratio)
Logo (50% size ratio)
Logo (40% size ratio)
Logo (30% size ratio)
Listing
– Various 10-second animations
– LogoLogo (60% size ratio)
Logo (50% size ratio)
Logo (40% size ratio)
Logo (30% size ratio)
Listing
PRoMoTIonAL ELEMEnTS WITH LoGo VISIBILITY AnD WEIGHTInG


7. Design inDaba auDienCe
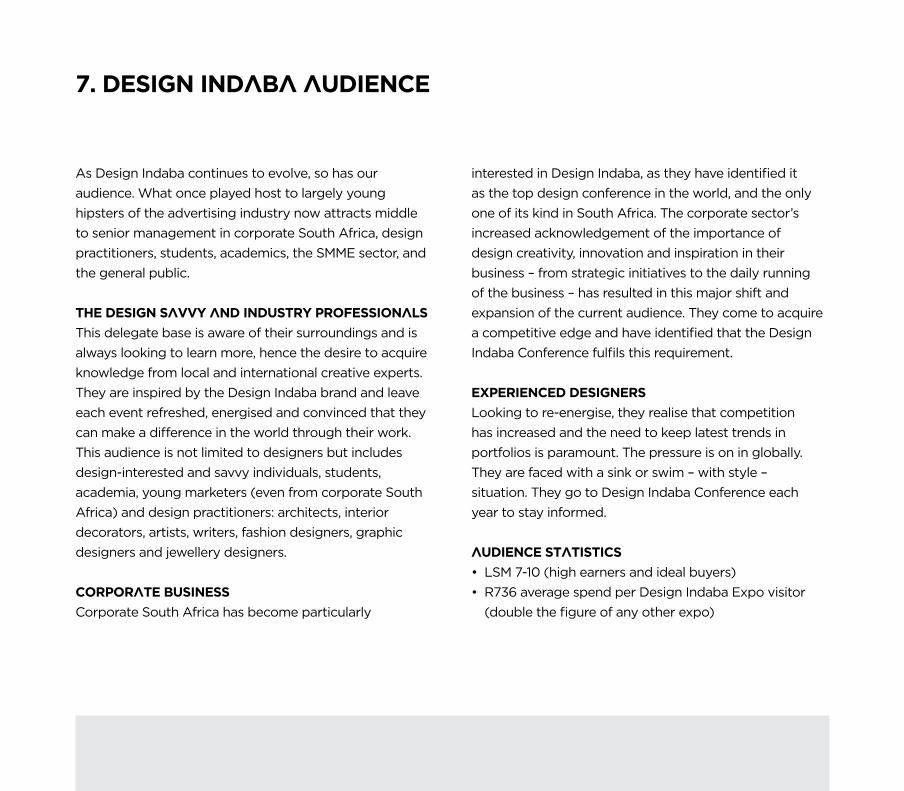
As Design Indaba continues to evolve, so has our audience. What once played host to largely young hipsters of the advertising industry now attracts middle to senior management in corporate South Africa, design practitioners, students, academics, the SMME sector, and the general public.
The Design savvy anD inDusTRy PROfessiOnals
This delegate base is aware of their surroundings and is always looking to learn more, hence the desire to acquire knowledge from local and international creative experts. They are inspired by the Design Indaba brand and leave each event refreshed, energised and convinced that they can make a difference in the world through their work. This audience is not limited to designers but includes design-interested and savvy individuals, students, academia, young marketers (even from corporate South Africa) and design practitioners: architects, interior decorators, artists, writers, fashion designers, graphic designers and jewellery designers.
CORPORaTe business
Corporate South Africa has become particularly
interested in Design Indaba, as they have identified it as the top design conference in the world, and the only one of its kind in South Africa. The corporate sector’s increased acknowledgement of the importance of design creativity, innovation and inspiration in their business – from strategic initiatives to the daily running of the business – has resulted in this major shift and expansion of the current audience. They come to acquire a competitive edge and have identified that the Design Indaba Conference fulfils this requirement.
eXPeRienCeD DesigneRs
Looking to re-energise, they realise that competition has increased and the need to keep latest trends in portfolios is paramount. The pressure is on in globally. They are faced with a sink or swim – with style – situation. They go to Design Indaba Conference each year to stay informed.
auDienCe sTaTisTiCs
• LSM 7-10 (high earners and ideal buyers)• R736 average spend per Design Indaba Expo visitor
(double the figure of any other expo)
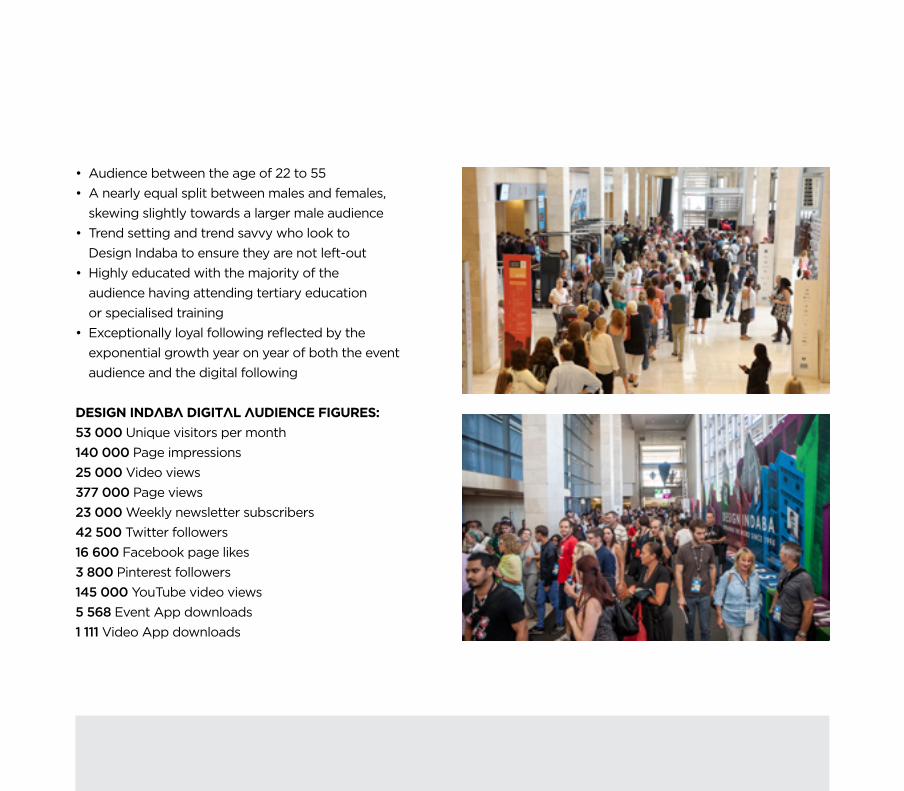
• Audience between the age of 22 to 55• A nearly equal split between males and females,
skewing slightly towards a larger male audience• Trend setting and trend savvy who look to
Design Indaba to ensure they are not left-out• Highly educated with the majority of the
audience having attending tertiary education or specialised training
• Exceptionally loyal following reflected by the exponential growth year on year of both the event audience and the digital following
Design inDaba DigiTal auDienCe figuRes:
53 000 Unique visitors per month140 000 Page impressions 25 000 Video views377 000 Page views23 000 Weekly newsletter subscribers42 500 Twitter followers16 600 facebook page likes3 800 Pinterest followers145 000 YouTube video views5 568 Event App downloads1 111 Video App downloads
26
8. RighTs PROPeRTy evaluaTiOn 2014Prepared by Prof Kamilla Swart – Kamilla-SA Sport and Tourism Consultancy (May 2014)
inTRODuCTiOn
for over a decade Interactive Africa, the owners of Design Indaba, has championed design to explore how it contributes to solving problems in an emerging country and has advocated the creative revolution. now in its 19th year, Design Indaba 2014 took place at the Cape Town International Convention Centre and included Design Indaba Conference and Design Indaba Simulcast from 26 to 28 february and Design Indaba Expo from 28 february to 2 March.
The Design Indaba Conference provides a platform for the exchange of ideas and insights and focuses on bringing international thought leadership to South Africa while Design Indaba Expo presents a marketplace for South Africa’s top design talent to showcase local goods and services to the global market through influential international buyers. Each year the Design Indaba festival gains growing impetus assembling some of the world’s most pioneering and perceptive creative minds. It has built up brand equity together with a great reputation both nationally and internationally. Design Indaba was honoured amongst 14 other winners for the Your Street Challenge at the 2012 Annual Business Day Business and Arts South Africa (BASA) Awards. The Your Street Challenge provides a platform to showcase how design thinking can be used to transform lives, cities and streets and involves members from creative and design communities finding ways of enhancing the way people experience their streets, their living and working environments. The challenge has been carried out across various cities in South Africa as well as in Eindhoven, The netherlands and Risør in norway, with future plans to extend the project further.
In addition to the flagship Conference and Expo, Design Indaba has become a multidisciplinary platform that champions all of the creative sectors. It has grown into a multitiered experience that incorporates other events, media, education, training, activism, advocacy and business development.
Sponsors of Design Indaba are given the opportunity to support culturally orientated activities as opposed to more commonly sponsored sporting activities. The events provide an opportunity to connect with people in a different space and Design Indaba is one of the biggest design, creative and innovation platforms in South Africa.
Interactive Africa has taken a proactive approach in evaluating the rights offered to potential sponsors, and have done so on an ongoing and consistent basis, hence making the event more marketable to prospective sponsors. An independent evaluation has been undertaken in order to evaluate Design Indaba as a sponsorship property.
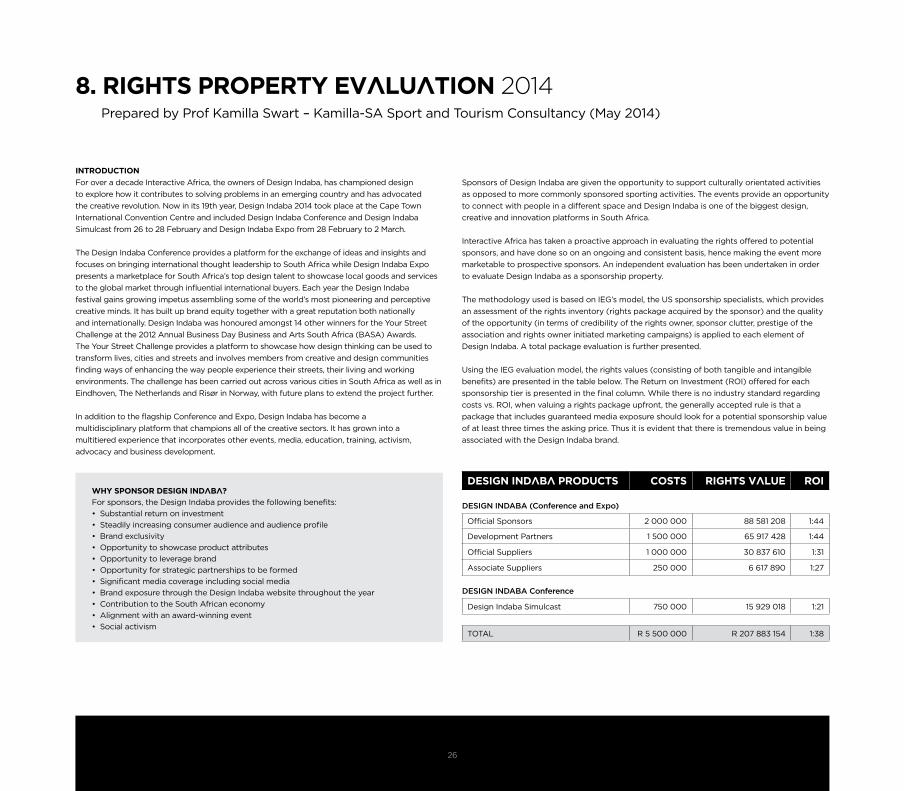
The methodology used is based on IEG’s model, the US sponsorship specialists, which provides an assessment of the rights inventory (rights package acquired by the sponsor) and the quality of the opportunity (in terms of credibility of the rights owner, sponsor clutter, prestige of the association and rights owner initiated marketing campaigns) is applied to each element of Design Indaba. A total package evaluation is further presented. Using the IEG evaluation model, the rights values (consisting of both tangible and intangible benefits) are presented in the table below. The Return on Investment (RoI) offered for each sponsorship tier is presented in the final column. While there is no industry standard regarding costs vs. RoI, when valuing a rights package upfront, the generally accepted rule is that a package that includes guaranteed media exposure should look for a potential sponsorship value of at least three times the asking price. Thus it is evident that there is tremendous value in being associated with the Design Indaba brand.
Why sPOnsOR Design inDaba?
for sponsors, the Design Indaba provides the following benefits:• Substantial return on investment• Steadily increasing consumer audience and audience profile• Brand exclusivity• Opportunity to showcase product attributes• Opportunity to leverage brand• Opportunity for strategic partnerships to be formed• Significant media coverage including social media • Brand exposure through the Design Indaba website throughout the year• Contribution to the South African economy• Alignment with an award-winning event• Social activism
Design inDaba PRODuCTs COsTs RighTs value ROi
DESIGN INDABA (Conference and Expo)
official Sponsors 2 000 000 88 581 208 1:44
Development Partners 1 500 000 65 917 428 1:44
official Suppliers 1 000 000 30 837 610 1:31
Associate Suppliers 250 000 6 617 890 1:27
DESIGN INDABA Conference
Design Indaba Simulcast 750 000 15 929 018 1:21
ToTAL R 5 500 000 R 207 883 154 1:38

27
The fOllOWing shOulD be nOTeD:
• Costs supplied are illustrative figures and can be negotiated per sponsor.• In terms of the official sponsors and suppliers of the various Design Indaba products as per the table above, the costs are deemed to be appropriate. It is also worth considering current trends
in sponsorship negotiation which point towards creating tailored packages around a potential sponsor’s needs rather than standard, inflexible rights packages. Sponsors value being granted an element of exclusivity within the overall sponsorship programme as this allows them to create a point of difference amongst other event sponsors and drive share of impact for their brand through this. Whilst still having a structured commercial programme with strict sponsorship tiers and a limited number of sponsors within each category to maintain the property’s exclusivity, it is still possible to negotiate tailored packages that are specifically geared towards meeting a sponsor’s needs and objectives, within these parameters.
• Irrespective of the level of the sponsorship, all sponsors/suppliers/partners of Design Indaba receive the full benefit of the brand and what it represents in the marketplace. • It is important to underscore that the various Design Indaba products lend itself to through-the-year activation, thus extending the Design Indaba brand and hence association throughout the year.
In so doing, potential sponsors will be able to leverage their sponsorship more efficiently. In addition Design Indaba as a combination of both the conference and the exhibition extends leveraging opportunities for a brand even further.
• The evaluation has been conducted within the context of business tourism which is an increasingly important segment of our growing industry. Business travel is a lucrative sector of the market, which ramps up tourism’s contribution to the economy in general. on average, business travellers spend three times more than leisure travellers and up to 40% of business travellers’ return to a destination within five years. There is also significant crossover into the leisure market.
1:38 RoI

28
The Design inDaba COnfeRenCe & eXPO RighTs invenTORy assessmenT
DESIGn InDABA offICIAL SPonSoRS (ConfEREnCE AnD ExPo) (R2 MILLIon ExCLUDInG VAT)
RighT value
Confirmed international media space (including print, electronic) 13 811 280
Confirmed local media space (including print, broadcast, electronic) 4 501 032
Advertising and event branding and communications materials 7 788 573
10x Conference tickets, 5x Simulcast tickets, 45x Expo tickets, 10x VIP Music tickets, 20x general admission Music tickets, 20x filmfest tickets, 1x Blue Train boarding pass, 2x Tastescape experience
98 670
Event registration and access control 686 557
Exhibition stand (maximum 3m x 3m at R2 600 per square metre) at either Conference or Expo 23 400
Design Indaba digital assets 1 805 253
feature on a Design Indaba DVD 495 000
Venue, floorspace production, facilities, catering and AV (Conference and Expo) 4 932 966
Delegate bag insert 648 000
Construction of exhibition areas 5 028 752
functions and events 732 014
Access to international speakers 3 739 107
Total value of Rights Inventory 44 290 604
note 1: PR and other incidental rights that are not guaranteed sponsor benefits have been excluded from the above as they are taken into consideration as part of the evaluation criteria for assessing the quality of the opportunity.
note 2: This is a standard rights package; however, additional rights can be negotiated individually with respective partners, depending on their requirements.
29
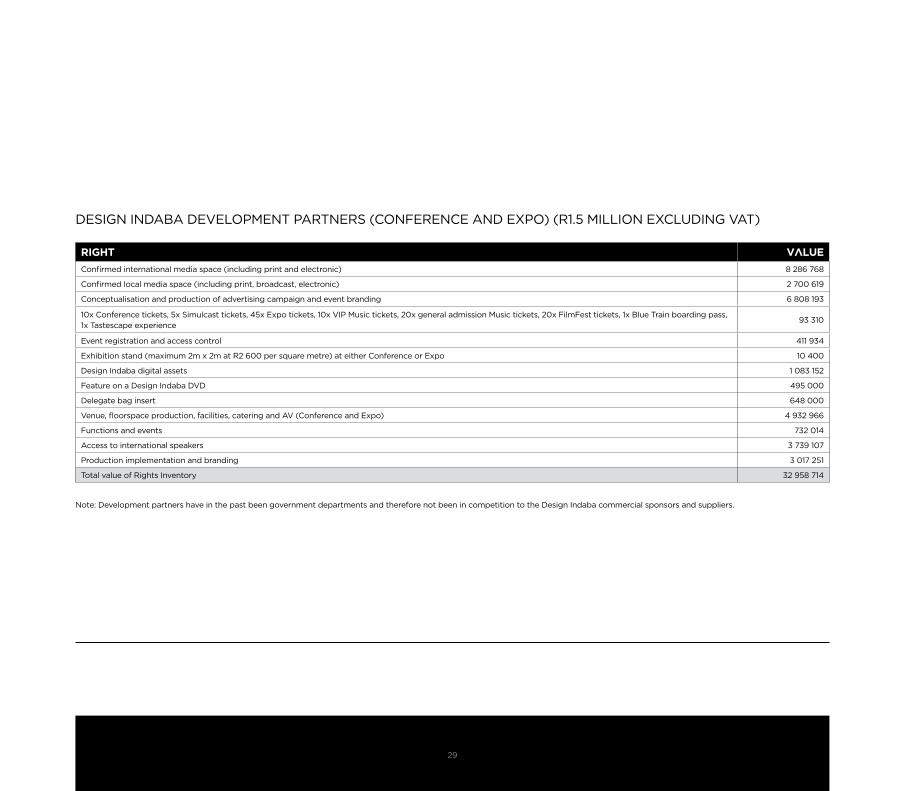
DESIGn InDABA DEVELoPMEnT PARTnERS (ConfEREnCE AnD ExPo) (R1.5 MILLIon ExCLUDInG VAT)
RighT value
Confirmed international media space (including print and electronic) 8 286 768
Confirmed local media space (including print, broadcast, electronic) 2 700 619
Conceptualisation and production of advertising campaign and event branding 6 808 193
10x Conference tickets, 5x Simulcast tickets, 45x Expo tickets, 10x VIP Music tickets, 20x general admission Music tickets, 20x filmfest tickets, 1x Blue Train boarding pass, 1x Tastescape experience
93 310
Event registration and access control 411 934
Exhibition stand (maximum 2m x 2m at R2 600 per square metre) at either Conference or Expo 10 400
Design Indaba digital assets 1 083 152
feature on a Design Indaba DVD 495 000
Delegate bag insert 648 000
Venue, floorspace production, facilities, catering and AV (Conference and Expo) 4 932 966
functions and events 732 014
Access to international speakers 3 739 107
Production implementation and branding 3 017 251
Total value of Rights Inventory 32 958 714
note: Development partners have in the past been government departments and therefore not been in competition to the Design Indaba commercial sponsors and suppliers.
30
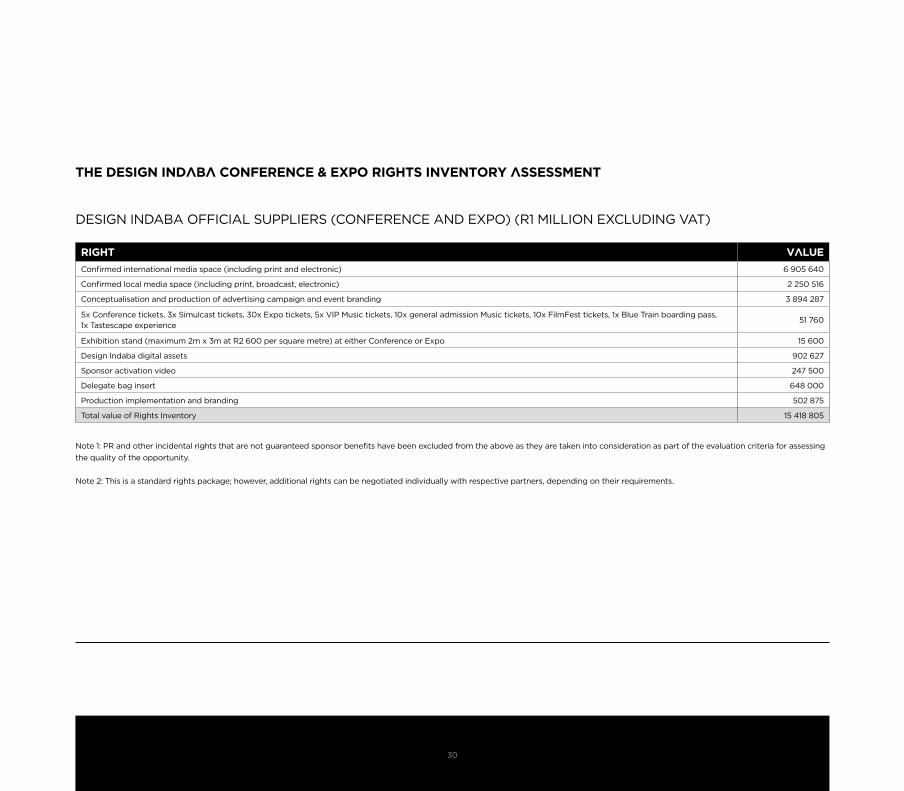
The Design inDaba COnfeRenCe & eXPO RighTs invenTORy assessmenT
DESIGn InDABA offICIAL SUPPLIERS (ConfEREnCE AnD ExPo) (R1 MILLIon ExCLUDInG VAT)
RighT value
Confirmed international media space (including print and electronic) 6 905 640
Confirmed local media space (including print, broadcast, electronic) 2 250 516
Conceptualisation and production of advertising campaign and event branding 3 894 287
5x Conference tickets, 3x Simulcast tickets, 30x Expo tickets, 5x VIP Music tickets, 10x general admission Music tickets, 10x filmfest tickets, 1x Blue Train boarding pass, 1x Tastescape experience
51 760
Exhibition stand (maximum 2m x 3m at R2 600 per square metre) at either Conference or Expo 15 600
Design Indaba digital assets 902 627
Sponsor activation video 247 500
Delegate bag insert 648 000
Production implementation and branding 502 875
Total value of Rights Inventory 15 418 805
note 1: PR and other incidental rights that are not guaranteed sponsor benefits have been excluded from the above as they are taken into consideration as part of the evaluation criteria for assessing the quality of the opportunity.
note 2: This is a standard rights package; however, additional rights can be negotiated individually with respective partners, depending on their requirements.

31
DESIGn InDABA ASSoCIATES (ConfEREnCE AnD ExPo) (R250 000 ExLUDInG VAT)
RighT value
Advertising and event branding and communications materials 1 726410
1x Conference tickets, 2x Simulcast tickets, 10x Expo tickets, 4x VIP Music tickets, 8x general admission Music tickets, 10x filmfest tickets, 1x Blue Train boarding pass, 1x Tastescape experience
18 410
Design Indaba digital assets 225 656
Sponsor activation video 61 875
Delegate bag insert 648 000
Production implementation and branding 628 594
Total value of Rights Inventory 3 308 945
note 1: PR and other incidental rights that are not guaranteed sponsor benefits have been excluded from the above as they are taken into consideration as part of the evaluation criteria for assessing the quality of the opportunity.
note 2: This is a standard rights package; however, additional rights can be negotiated individually with respective partners, depending on their requirements.
It is further noted that a bespoke package can be negotiated for sponsors/suppliers who contribute less than R250 000. This package will be based on rights in proportion to the value of rights obtained for other sponsorship tiers.

32
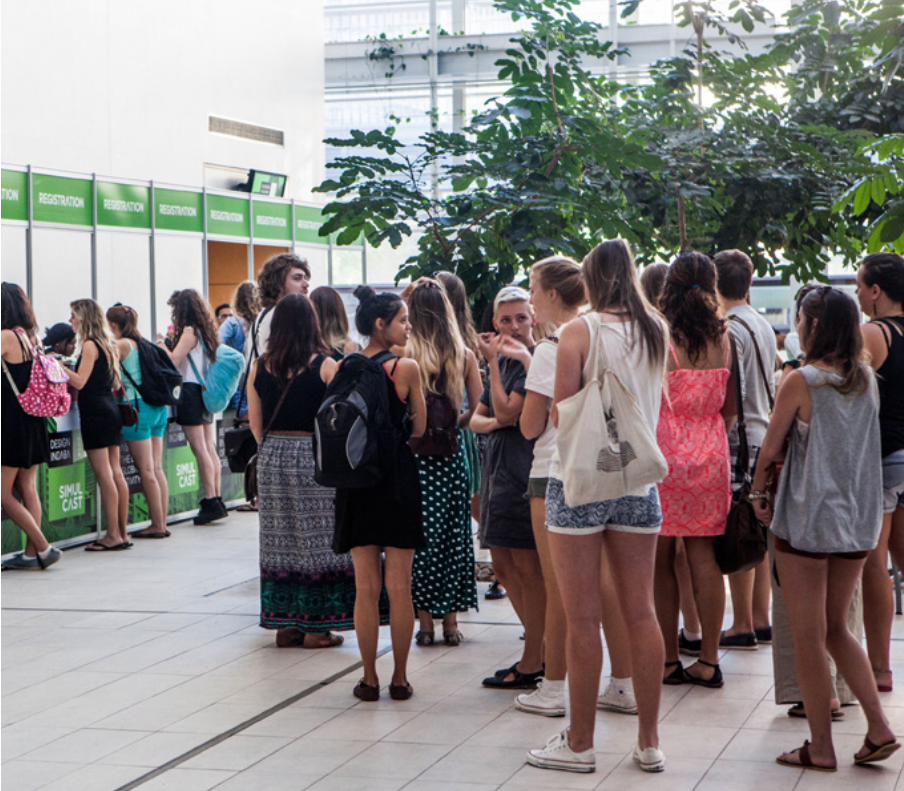
Design inDaba simulCasT
Since 2006, the Design Indaba Simulcast has catered for emerging designers, design students and other young people (under 25 years) from across all creative fields. At a reduced rate, these delegates watch a live broadcast of the speakers in an auditorium close to the main venue. and additional venues in other cities. Six hundred and fifty students attended the Simulcast of the 2014 conference in Cape Town, 310 people attended the Design Indaba Simulcast in Johannesburg and 118 attended in Durban.
In 2014, 60 young designers from Port Elizabeth also had the opportunity to participate via the Simulcast, while 252 attended for the first time in Potchefstroom. The Design Indaba Simulcast has shown significant growth in the past few years. It is anticipated that this exposure will grow the creative talent in the country and make for even more impressive events in future. Moreover, it is important for sponsors to engage with young creatives and students, and consequently contribute to the process of growing the creative industry towards sustainable job creation and development.
DESIGn InDABA SIMULCAST (CAPE ToWn, JoHAnnESBURG, DURBAn, PoRT ELIZABETH AnD PoCHEfSTRooM) (R750 000 ExCLUDInG VAT)
RighT value
Conceptualisation and production of advertising campaign and event branding 4 673 144
Confirmed local media space (including print and electronic) 1 026 593
10x Conference tickets, 40x Simulcast tickets, 50x Expo tickets, 5x VIP Music tickets, 10x general admission Music tickets, 10x filmfest tickets, 1x Blue Train boarding pass, 1x Tastescape experience
93 310
Simulcast delegate bag insert 187 812
Design Indaba digital assets 180 525
feature on a Design Indaba DVD 495 000
Venue, catering and AV 1 308 125
Total value of Rights Inventory 7 964 509
33

34
QualiTy Of The OPPORTuniTy: Design inDaba 2014 COnfeRenCe anD eXPO
evaluaTiOn CRiTeRia yes/nO
Prestige of Property
Design Indaba has become the largest creative platform in the Southern Hemisphere and the world’s biggest design conference. What started as a small conference in 1995 with 11 speakers has morphed into a multidisciplinary celebration of every form of creativity and design. The event is supported both by local and international designers, exhibitors and creative industry business people. The Design Indaba Conference boasts the largest number of international speakers at a single event, compared with other conferences held at the Cape Town International Convention Centre (CTICC). Design Indaba has won numerous awards including the EIBTM award for Best Conference in the World (2005) and Best Live Event at the Loerie Awards (2007). Both speakers and international media have heralded the platform as the best conference on creativity in the world. The Conference and Expo take place annually at the CTICC, a venue that also enhances the profile of the property.
YES
Recognition / Awareness
The promotional campaign for the event was valued at over R26 million this year and created significant awareness among the target audiences within the industry as well as those who utilise the industry to assist in furthering company goals. The primary audience are those interested in design (from nearly every practice) and innovation. The event attracts experienced designers, academics and networkers. An increasing corporate audience is also in attendance as they have recognised the importance of design, creativity and innovation in business and to the bottom line. Design Indaba attracts large numbers of people locally. 40 967 people attended the Expo, 2 203 attendees at the Conference, 1 390 at the Simulcast, 3 186 at the Music festival and 1 305 attendees at the filmfest for a total audience of over 48 000 people, who has some form of contact with the Design Indaba brand. There were over 500 exhibitors at this year’s Expo.
YES
Level of Audience Interest / Loyalty
Close to 600 leading speakers from South Africa and around the world have participated in the event in its lifetime. In 2014, 3 593 delegates attended including international delegates from 26 different countries from both developed and developing regions of the globe. 53% of the audience was male and 42% female. 23% of the audience in 2014 was from Cape Town and surrounds with 19% of the delegates from Gauteng, 2% from other parts of South Africa and 2% international. 46% of the Design Indaba attendees are repeat delegates, with many attending the last 3 or 4 editions. The Expo is also an exciting retail environment and attracts a high LSM shopper with refined tastes, in need of new hunting grounds. 2014 saw 809 buyers register to attend, with 211 of these being international buyers. As mentioned above, the Design Indaba community is testimony to the loyalty the brand attracts. With the increasing proliferation of social media and digital marketing, it is important to underscore that Design Indaba is a brand that has a community, where people identify and feel a sense of belonging. It is also worth noting that the website has grown in stature: before it only attracted the local community and was visited only around the period of Design Indaba but it now has a wider international and local community and is updated and visited all year round.
YES
Ability to Activate
The Design Indaba platform is multifaceted and features a Conference, Expo, Music and film events. All of these events speak to an engaged audience that sponsors have been able to tap into. A targeted, loyal, interested, niche but still vast audience can be activated through any of the Design Indaba channels. There is mass media presence, which allows for additional exposure to activations as well as the brand itself. With category exclusivity and non-ambushability, sponsors can activate without competition from rival brands. not only does Design Indaba provide a loudhailer for sponsors to a savvy, high LSM, captive audience, it also provides opportunity for content generation, or collaboration to leverage sponsor brands in a decidedly unique and attention-getting manner. As a case study: one of the main sponsors’ activation at the Design Indaba Conference and Expo this year received over 3 408 mentions of their hashtag by 329 contributors, which received 412 engagements (retweets/replies/shares) leading to nearly 5.6 million opportunities to see (oTS) and an advertising value equivalent (AVE) of close to R1.3 million. This was only their social media coverage; their formal media coverage (print, broadcast and online) garnered them a further R650 000 in exposure. The main sponsors’ activation on the Design Indaba platform generated a total of almost R2 million in exposure for their brand, initiatives and products/services.
YES
The sponsorship platform is evaluated by assessing the property against 10 variables. As the official sponsor to Design Indaba will have rights to both the Design Indaba Conference and the Design Indaba Expo, the quality of the opportunity for both properties needs to be considered and is presented below.
35
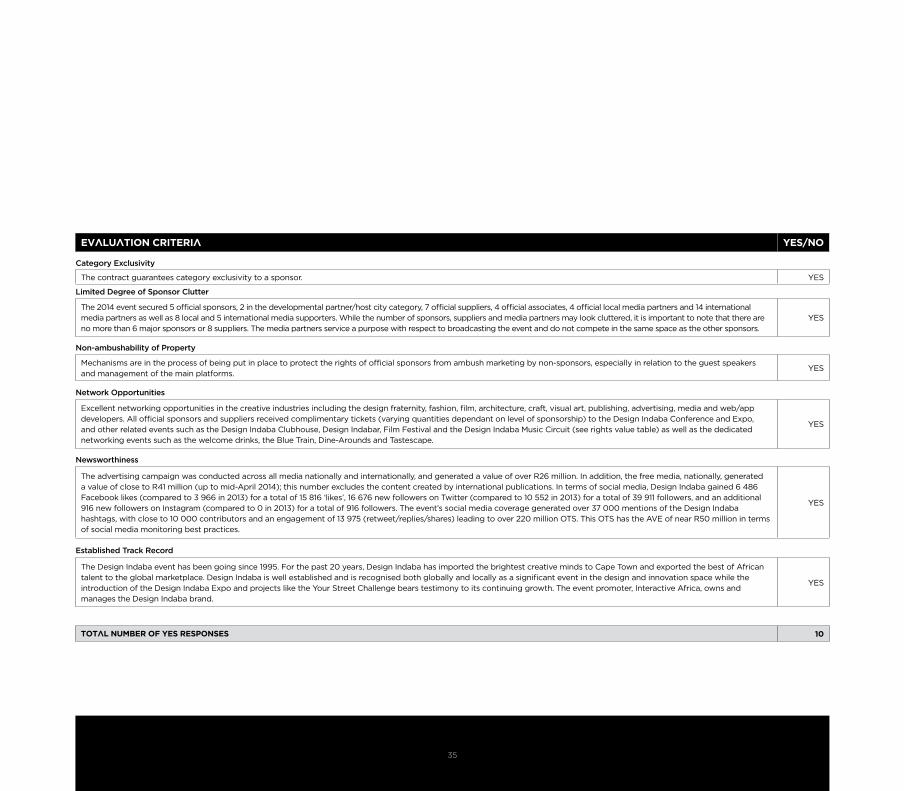
evaluaTiOn CRiTeRia yes/nO
Category Exclusivity
The contract guarantees category exclusivity to a sponsor. YES
Limited Degree of Sponsor Clutter
The 2014 event secured 5 official sponsors, 2 in the developmental partner/host city category, 7 official suppliers, 4 official associates, 4 official local media partners and 14 international media partners as well as 8 local and 5 international media supporters. While the number of sponsors, suppliers and media partners may look cluttered, it is important to note that there are no more than 6 major sponsors or 8 suppliers. The media partners service a purpose with respect to broadcasting the event and do not compete in the same space as the other sponsors.
YES
Non-ambushability of Property
Mechanisms are in the process of being put in place to protect the rights of official sponsors from ambush marketing by non-sponsors, especially in relation to the guest speakers and management of the main platforms.
YES
Network Opportunities
Excellent networking opportunities in the creative industries including the design fraternity, fashion, film, architecture, craft, visual art, publishing, advertising, media and web/app developers. All official sponsors and suppliers received complimentary tickets (varying quantities dependant on level of sponsorship) to the Design Indaba Conference and Expo, and other related events such as the Design Indaba Clubhouse, Design Indabar, film festival and the Design Indaba Music Circuit (see rights value table) as well as the dedicated networking events such as the welcome drinks, the Blue Train, Dine-Arounds and Tastescape.
YES
Newsworthiness
The advertising campaign was conducted across all media nationally and internationally, and generated a value of over R26 million. In addition, the free media, nationally, generated a value of close to R41 million (up to mid-April 2014); this number excludes the content created by international publications. In terms of social media, Design Indaba gained 6 486 facebook likes (compared to 3 966 in 2013) for a total of 15 816 ‘likes’, 16 676 new followers on Twitter (compared to 10 552 in 2013) for a total of 39 911 followers, and an additional 916 new followers on Instagram (compared to 0 in 2013) for a total of 916 followers. The event’s social media coverage generated over 37 000 mentions of the Design Indaba hashtags, with close to 10 000 contributors and an engagement of 13 975 (retweet/replies/shares) leading to over 220 million oTS. This oTS has the AVE of near R50 million in terms of social media monitoring best practices.
YES
Established Track Record
The Design Indaba event has been going since 1995. for the past 20 years, Design Indaba has imported the brightest creative minds to Cape Town and exported the best of African talent to the global marketplace. Design Indaba is well established and is recognised both globally and locally as a significant event in the design and innovation space while the introduction of the Design Indaba Expo and projects like the Your Street Challenge bears testimony to its continuing growth. The event promoter, Interactive Africa, owns and manages the Design Indaba brand.
YES
TOTal numbeR Of yes ResPOnses 10
36
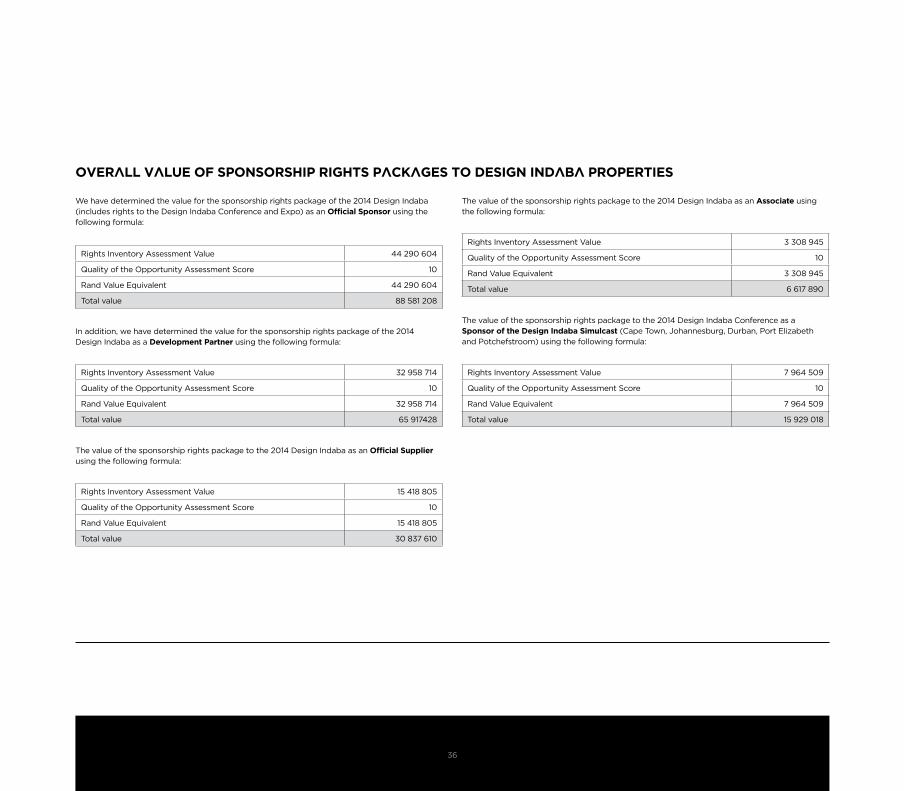
OveRall value Of sPOnsORshiP RighTs PaCkages TO Design inDaba PROPeRTies
We have determined the value for the sponsorship rights package of the 2014 Design Indaba (includes rights to the Design Indaba Conference and Expo) as an official Sponsor using the following formula:
In addition, we have determined the value for the sponsorship rights package of the 2014 Design Indaba as a development partner using the following formula:
The value of the sponsorship rights package to the 2014 Design Indaba Conference as a Sponsor of the design Indaba Simulcast (Cape Town, Johannesburg, Durban, Port Elizabeth and Potchefstroom) using the following formula:
The value of the sponsorship rights package to the 2014 Design Indaba as an official Supplier using the following formula:
The value of the sponsorship rights package to the 2014 Design Indaba as an Associate using the following formula:
Rights Inventory Assessment Value 44 290 604
Quality of the opportunity Assessment Score 10
Rand Value Equivalent 44 290 604
Total value 88 581 208
Rights Inventory Assessment Value 32 958 714
Quality of the opportunity Assessment Score 10
Rand Value Equivalent 32 958 714
Total value 65 917428
Rights Inventory Assessment Value 15 418 805
Quality of the opportunity Assessment Score 10
Rand Value Equivalent 15 418 805
Total value 30 837 610
Rights Inventory Assessment Value 3 308 945
Quality of the opportunity Assessment Score 10
Rand Value Equivalent 3 308 945
Total value 6 617 890
Rights Inventory Assessment Value 7 964 509
Quality of the opportunity Assessment Score 10
Rand Value Equivalent 7 964 509
Total value 15 929 018

37
sOCial meDia anD DigiTal maRkeTing
Social media is an important component of marketing strategies and tactics. Mobile phones have a larger penetration in Africa than the Internet currently, and the ability to operate social networks via mobile phones has created new opportunities for users to interact. Bloggers can also make use of their mobile phones to blog, and mobile users often access the web via their phones.
Social media platforms such as facebook, Twitter and LinkedIn have seen dramatic growth in recent times and are now recognised as valuable marketing tools. facebook reports over 1 billion mobile monthly active users (MAUs) as of March 2014, 757 million daily active users on average in December 2013, approximately 81% of daily active users are outside the U.S. and Canada and 1.23 billion monthly active users as of December 31, 2013(1).
Twitter is reported to have an average of 241 million MAUs as of December 2013, an increase of 30% year-over-year, 184 million mobile MAUs in the fourth quarter of 2013, an increase of 37% year-over-year, representing 76% of total MAUs, and Timeline views reached 148 billion in the fourth quarter of 2013, an increase of 26% year-over-year(2).
In South Africa social media has become as a core pillar of Internet activity, along with email, news and banking (fuseware and World Wide Worx, 2011). A research report by communications firm Portland revealed that South Africa has the most active Twitter users in Africa(3). South Africa saw a growth of 129% in Twitter users last year. In 2011, the number of active Twitter users was 1.1 million. Users increased to 2.4 million in 2012, and hit 5.5 million in 2013(4).
facebook has become the biggest social network in South Africa, seeing its strongest growth yet in the past year – and overtaking Mxit for the first time; one of the key findings of the SA Social Media Landscape 2014 research study(5). The study showed that facebook has 9.4 million active users in South Africa, up from 6.8 million users a year ago. Mxit, the previous market leader, has remained stable at a little more than 6 million users as it feels the effects of competing instant messaging services like WhatsApp and 2Go, as well as from the growth of social networking on phones.
“The most significant finding, aside from the growth itself, was the extent to which social networks are being used on phones in South Africa,” says Arthur Goldstuck, MD of
technology market researchers World Wide Worx. “no less than 87% of facebook users and 85% of Twitter users are accessing these tools on their phones.”
The report highlights the intensified use of social media by South African corporations, revealing that 93% of major brands use facebook, 79% use Twitter, 58% YouTube, 46% LinkedIn and 28% Pinterest. Goldstuck, however, adds that “The survey shows that the measurement of social media effectiveness remains relatively unsophisticated. on Twitter, 83% of companies measure effectiveness by number of followers, while only 48% conduct sentiment analysis. on facebook, 87% measure number of fans and 79% number of posts and comments, while only 54% are assessing the tone of those posts through sentiment analysis.”
sOCial meDia aT Design inDabaAs mentioned previously Design Indaba’s presence in social media has grown substantially. Design Indaba gained 6 486 facebook likes (compared to 3 966 in 2013) for a total of 15 816 ‘likes’, 16 676 new followers on Twitter (compared to 10 552 in 2013) for a total of 39 911 followers, and an additional 916 new followers on Instagram (compared to 0 in 2013) for a total of 916 followers.
The event’s social media coverage generated over 37 000 mentions of the Design Indaba hashtags, with close to 10 000 contributors and an engagement of 13 975 (retweet/replies/shares) leading to over 220 million oTS. This oTS has the AVE of near R50 million in terms of social media monitoring best practices. Social media is currently the top tool to leverage sponsorships (see sponsorship trend section below) thus Design Indaba provides sponsors with an ideal platform for social media leveraging and extending the reach and engagement opportunities for sponsors.
(1) newsroom.fb.com/company-info
(2) investor.twitterinc.com/releasedetail.cfm?ReleaseID=823321
(3) portland-communications.com/publications/how-africa-tweets-2014
(4) iol.co.za/scitech/technology/internet/sa-s-twitter-stars-1.1677749#.U1JLWVc6s0k
(5) worldwideworx.com/wp-content/uploads/2013/10/Exec-Summary-Social-Media-2014.pdf

38
Globally sponsorship will increase but at a slower rate to reach $55.3 billion(6). north America, the largest market, is expected to grow at 5.5% while Europe, the second largest market, is expecting much slower growth at 2.1%.
Asia is expected to be the fastest growing market (5.6%) due to strong sponsorship markets in Russia, China and India. Central and South America will see market growth at 5%, primarily due to Brazil’s hosting of the 2014 fIfA World Cup™ whereas Africa and the Middle East growth is expected to slow down, with a 4.3% increase.
The IEG 2014 forecast indicates that sport (70%) and entertainment (10%) will maintain their lead and grow at a faster rate than other types of partnerships (causes – 9%, arts – 4%, festivals, fairs and annual events – 4% and associations and membership organisations (3%) and will continue to demand nearly eight out of ten event sponsorship dollars.
The South African sponsorship industry is a growing R6.9-billion industry; with R4.6-billion spend on rights fees and over R2.3 billion on leverage. As per the global trend, most of the sponsorship dollar is spend on sport and in South Africa, the top five sports account for 70% of the sponsorship spend in South Africa(7).
mOsT valuable sPOnsOR benefiTs
According to the 14th annual IEG/Performance Research Sponsorship Decision-makers Survey, brand marketers say they are no longer as interested in receiving identification on sponsored properties’ media buys and collateral materials, with both of those benefits no longer among the ten most valuable.
Reflecting a desire for benefits that deliver more than just visibility, sponsors are instead prioritising connections to personalities and talent associated with properties, as well as access to sponsored organisations’ databases and mailing lists. The latter returned to the top ten, while the former cracked the list for the first time in the survey’s history. Design Indaba provides sponsors with many of the most valuable benefits listed in figure 1.
(6) IEG 2014 Sponsorship forecasts
(7) BMI 2012
sPOnsORshiP TRenDs fIGURE 1: MoST VALUABLE SPonSoR BEnEfITS
Right to Promote Co-Branded Products
Access to Property Mailing List/Database
Tickets and Hospitality
Spokesperson / Access to Personalities
Access to Property Content
Title of a Proprietary Area
Rights to Property Marks and Logo
Broadcast Ad opportunities
on-site Signage
Category Exclusivity
23
25
27
28
30
31
41
42
43
58
Percent of respondents who ranked the factor a 9 or a 10 on a 10-point scale, where 10 is extremely valuable in
relation to sponsor benefits
Source: IEG/Performance Research 2014 Sponsorship Decision-Makers Survey
39
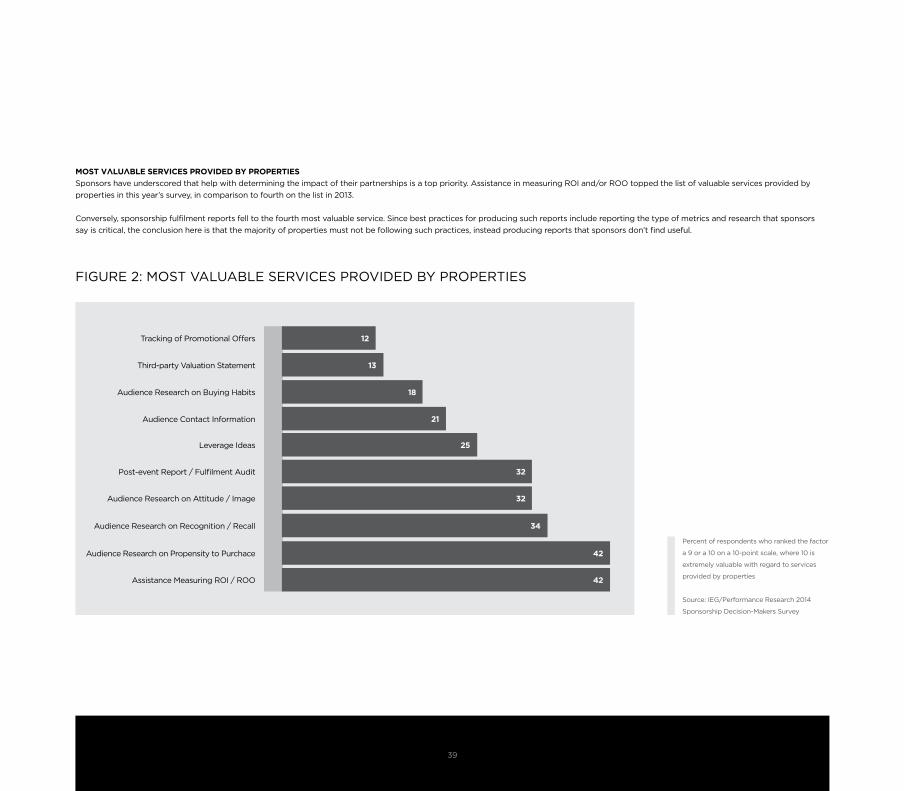
mOsT valuable seRviCes PROviDeD by PROPeRTies
Sponsors have underscored that help with determining the impact of their partnerships is a top priority. Assistance in measuring RoI and/or Roo topped the list of valuable services provided by properties in this year’s survey, in comparison to fourth on the list in 2013.
Conversely, sponsorship fulfilment reports fell to the fourth most valuable service. Since best practices for producing such reports include reporting the type of metrics and research that sponsors say is critical, the conclusion here is that the majority of properties must not be following such practices, instead producing reports that sponsors don’t find useful.
fIGURE 2: MoST VALUABLE SERVICES PRoVIDED BY PRoPERTIES
Tracking of Promotional offers
Third-party Valuation Statement
Audience Research on Buying Habits
Audience Contact Information
Leverage Ideas
Post-event Report / fulfilment Audit
Audience Research on Attitude / Image
Audience Research on Recognition / Recall
Audience Research on Propensity to Purchace
Assistance Measuring RoI / Roo
12
13
18
21
25
32
32
34
42
42
Percent of respondents who ranked the factor
a 9 or a 10 on a 10-point scale, where 10 is
extremely valuable with regard to services
provided by properties
Source: IEG/Performance Research 2014
Sponsorship Decision-Makers Survey
40
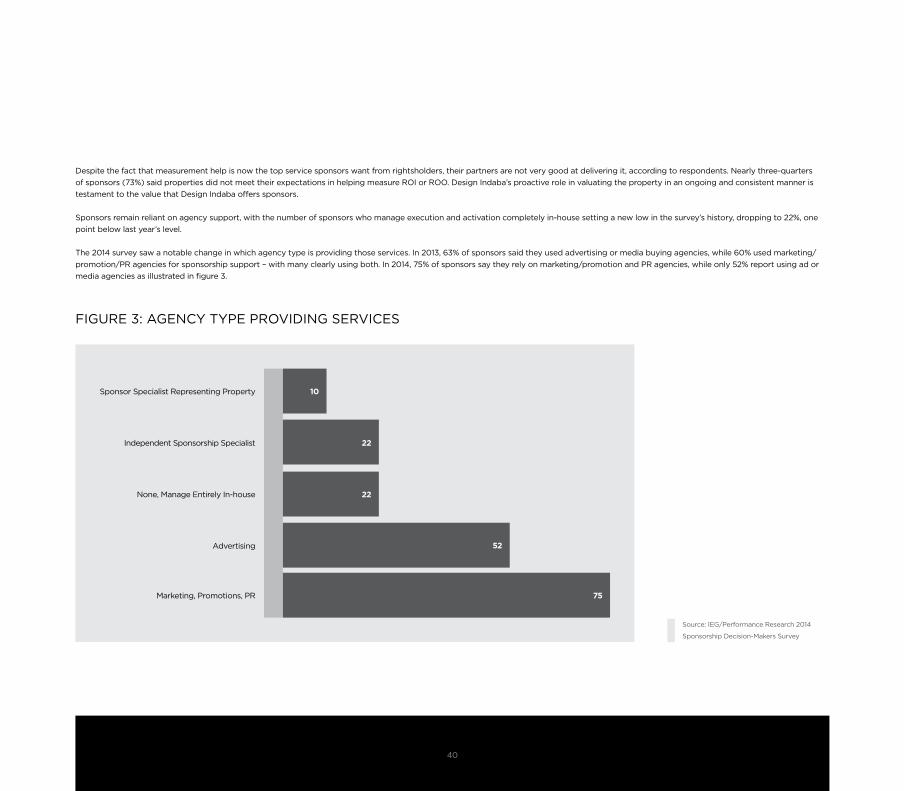
Despite the fact that measurement help is now the top service sponsors want from rightsholders, their partners are not very good at delivering it, according to respondents. nearly three-quarters of sponsors (73%) said properties did not meet their expectations in helping measure RoI or Roo. Design Indaba’s proactive role in valuating the property in an ongoing and consistent manner is testament to the value that Design Indaba offers sponsors. Sponsors remain reliant on agency support, with the number of sponsors who manage execution and activation completely in-house setting a new low in the survey’s history, dropping to 22%, one point below last year’s level.
The 2014 survey saw a notable change in which agency type is providing those services. In 2013, 63% of sponsors said they used advertising or media buying agencies, while 60% used marketing/promotion/PR agencies for sponsorship support – with many clearly using both. In 2014, 75% of sponsors say they rely on marketing/promotion and PR agencies, while only 52% report using ad or media agencies as illustrated in figure 3.
fIGURE 3: AGEnCY TYPE PRoVIDInG SERVICES
Sponsor Specialist Representing Property
Independent Sponsorship Specialist
none, Manage Entirely In-house
Advertising
Marketing, Promotions, PR
10
22
22
52
75
Source: IEG/Performance Research 2014
Sponsorship Decision-Makers Survey
41
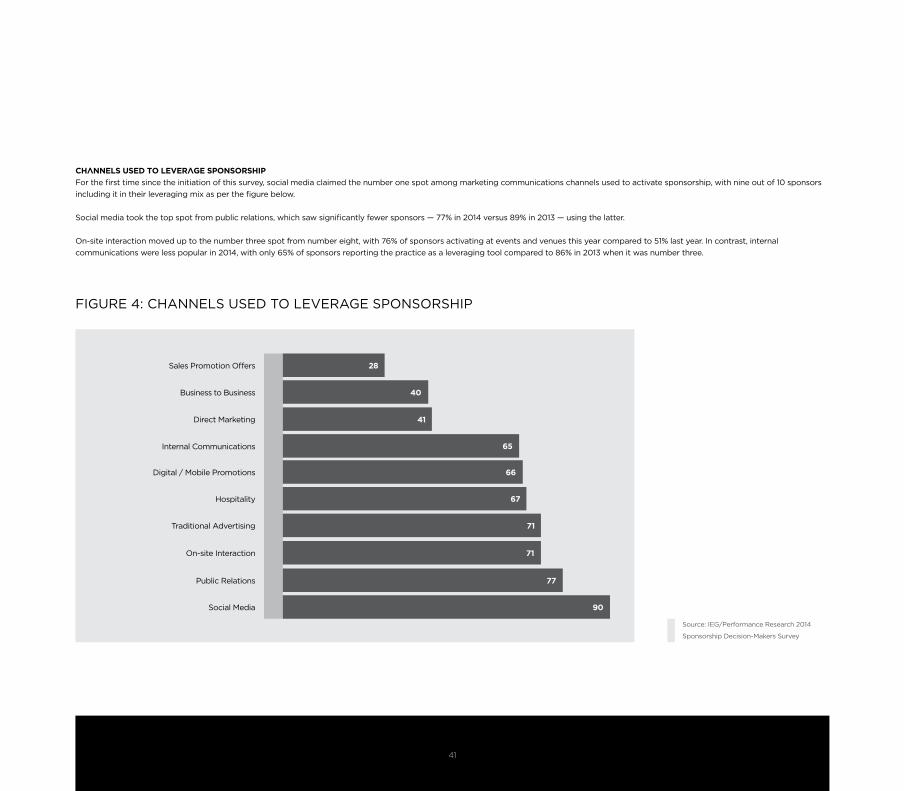
Channels useD TO leveRage sPOnsORshiP
for the first time since the initiation of this survey, social media claimed the number one spot among marketing communications channels used to activate sponsorship, with nine out of 10 sponsors including it in their leveraging mix as per the figure below.
Social media took the top spot from public relations, which saw significantly fewer sponsors — 77% in 2014 versus 89% in 2013 — using the latter.
on-site interaction moved up to the number three spot from number eight, with 76% of sponsors activating at events and venues this year compared to 51% last year. In contrast, internal communications were less popular in 2014, with only 65% of sponsors reporting the practice as a leveraging tool compared to 86% in 2013 when it was number three.
Source: IEG/Performance Research 2014
Sponsorship Decision-Makers Survey
fIGURE 4: CHAnnELS USED To LEVERAGE SPonSoRSHIP
Sales Promotion offers
Business to Business
Direct Marketing
Internal Communications
Digital / Mobile Promotions
Hospitality
Traditional Advertising
on-site Interaction
Public Relations
Social Media
28
40
41
65
66
67
71
71
77
90
42
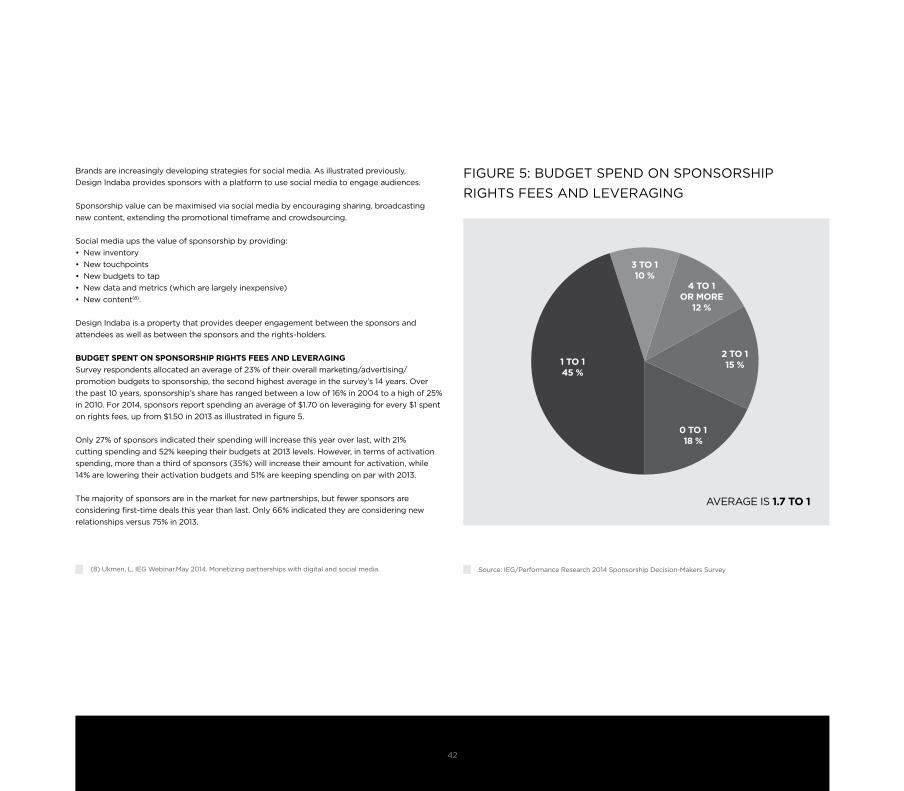
Brands are increasingly developing strategies for social media. As illustrated previously, Design Indaba provides sponsors with a platform to use social media to engage audiences.
Sponsorship value can be maximised via social media by encouraging sharing, broadcasting new content, extending the promotional timeframe and crowdsourcing.
Social media ups the value of sponsorship by providing:• New inventory• New touchpoints• New budgets to tap• New data and metrics (which are largely inexpensive)• New content(8).
Design Indaba is a property that provides deeper engagement between the sponsors and attendees as well as between the sponsors and the rights-holders.
buDgeT sPenT On sPOnsORshiP RighTs fees anD leveRaging
Survey respondents allocated an average of 23% of their overall marketing/advertising/ promotion budgets to sponsorship, the second highest average in the survey’s 14 years. over the past 10 years, sponsorship’s share has ranged between a low of 16% in 2004 to a high of 25% in 2010. for 2014, sponsors report spending an average of $1.70 on leveraging for every $1 spent on rights fees, up from $1.50 in 2013 as illustrated in figure 5.
only 27% of sponsors indicated their spending will increase this year over last, with 21% cutting spending and 52% keeping their budgets at 2013 levels. However, in terms of activation spending, more than a third of sponsors (35%) will increase their amount for activation, while 14% are lowering their activation budgets and 51% are keeping spending on par with 2013.
The majority of sponsors are in the market for new partnerships, but fewer sponsors are considering first-time deals this year than last. only 66% indicated they are considering new relationships versus 75% in 2013.
(8) Ukmen, L. IEG Webinar.May 2014. Monetizing partnerships with digital and social media.
fIGURE 5: BUDGET SPEnD on SPonSoRSHIP RIGHTS fEES AnD LEVERAGInG
AVERAGE IS 1.7 To 1
1 To 1 45 %
3 To 1 10 %
4 To 1 oR MoRE
12 %
2 To 1 15 %
0 To 1 18 %
Source: IEG/Performance Research 2014 Sponsorship Decision-Makers Survey
43
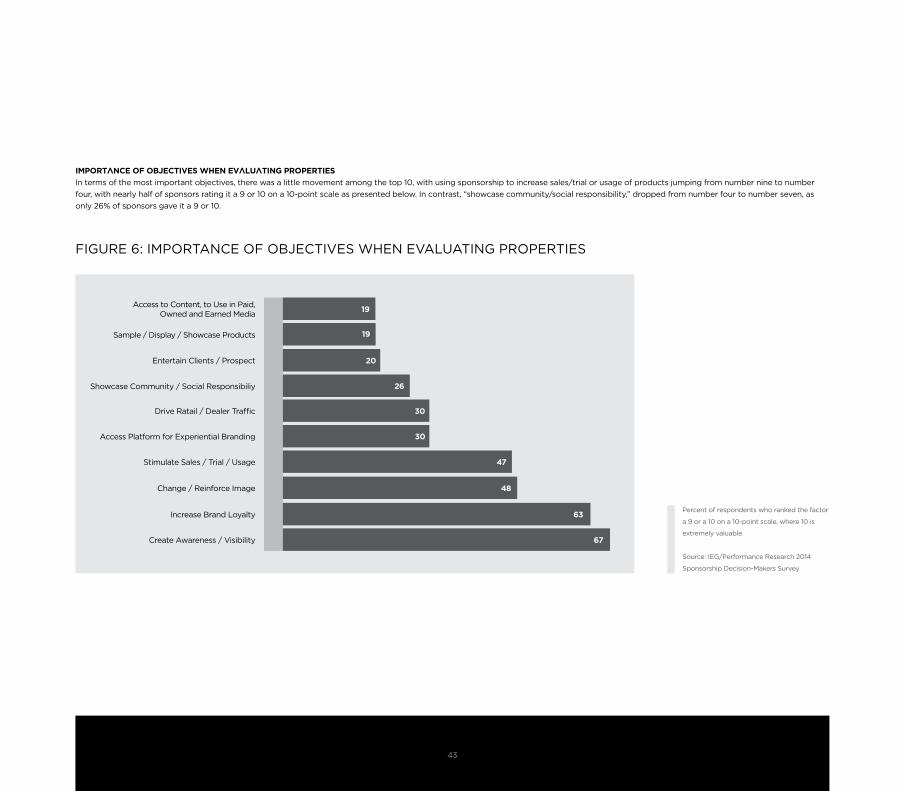
imPORTanCe Of ObjeCTives When evaluaTing PROPeRTies
In terms of the most important objectives, there was a little movement among the top 10, with using sponsorship to increase sales/trial or usage of products jumping from number nine to number four, with nearly half of sponsors rating it a 9 or 10 on a 10-point scale as presented below. In contrast, “showcase community/social responsibility,” dropped from number four to number seven, as only 26% of sponsors gave it a 9 or 10.
Percent of respondents who ranked the factor
a 9 or a 10 on a 10-point scale, where 10 is
extremely valuable
Source: IEG/Performance Research 2014
Sponsorship Decision-Makers Survey
fIGURE 6: IMPoRTAnCE of oBJECTIVES WHEn EVALUATInG PRoPERTIES
Access to Content, to Use in Paid, owned and Earned Media
Sample / Display / Showcase Products
Entertain Clients / Prospect
Showcase Community / Social Responsibiliy
Drive Ratail / Dealer Traffic
Access Platform for Experiential Branding
Stimulate Sales / Trial / Usage
Change / Reinforce Image
Increase Brand Loyalty
Create Awareness / Visibility
19
19
20
26
30
30
47
48
63
67

44
value Of sPOnsORshiP meTRiCs
Regarding which metrics were most important to sponsors, there was little change among the top ten. “Awareness of products/services/brands” and “attitudes toward the brand” each moved up one spot to number one and number two, respectively – replacing the former number one: awareness of the company or brand’s sponsorship. The survey included a new option for respondents among metrics: “Amount of positive social media activity.” It joined the top ten at number six.
Percent of respondents who ranked the factor a 9
or a 10 on a 10-point scale, where 10 is extremely
valuable in terms of sponsorship metrics
Source: IEG/Performance Research 2014
Sponsorship Decision-Makers Survey
fIGURE 7: VALUE of SPonSoRSHIP METRICS
Employee Internal Response
Lead Generation
Response to Sponsorship Related
Response to Customer / Prospect
Amount of Positive Social Media Activity
Amount of Media Exposure Generated
Product / Service Sales
Awareness of Company’s / Brand’s Sponsorship
Attitude Towards Brand
Awareness of Products / Services / Brand
53
54
64
69
71
73
73
83
88
91
45
COnClusiOns
It is apparent that Design Indaba has grown in stature and prominence over the years. It has built up brand equity together with a great reputation nationally and internationally. With Cape Town being awarded World Design Capital status in 2014, the importance of design is underscored. Design Indaba as an annual recurring event can offer sponsors a platform to associate themselves with a unique event and a valuable sponsorship platform for companies and brands operating in this environment.
Although there is no industry standard regarding costs vs. RoI, when valuing a rights package upfront, the generally accepted rule is a package that includes guaranteed media exposure should look for a potential sponsorship value of at least three times the asking price. It is evident that each of the Design Indaba properties has rights attached to it that are considerably higher than the costs. This makes sponsoring one of the Design Indaba properties a lucrative option for prospective sponsors. Moreover, irrespective of the level of the sponsorship, all sponsors/suppliers/partners of Design Indaba receive the full benefit of the brand and what it represents in the marketplace.
In terms of the official sponsors and suppliers of the various Design Indaba products, the costs are deemed to be appropriate. It is also worth highlighting current trends in sponsorship negotiation which point towards creating tailored packages around a potential sponsor’s needs rather than standard, inflexible rights packages. Category exclusivity is a key benefit for sponsors within the overall sponsorship programme as this allows them to create a point of differentiation amongst other event sponsors and drive share of impact for their brand through this. While still having a structured commercial programme with strict sponsorship tiers and a limited number of sponsors within each category to maintain the property’s exclusivity, it is still possible to negotiate tailored packages that are specifically geared towards meeting a sponsor’s needs and objectives, within these parameters. We would recommend this approach be taken in this case.
It is also worth noting that the various Design Indaba products lend themselves to through-the-year activation, thus extending the Design Indaba brand and hence association throughout the year. In so doing, potential sponsors will be able to leverage their sponsorship more efficiently. In addition, Design Indaba as a combination of both the conference and the expo, along with new products such as film and music that are constantly evolving, extend leveraging opportunities for a brand even further. Design Indaba is able to generate considerable media coverage, including social media which is a particularly important leveraging medium for sponsors. Additional offerings such as designindaba.com and other digital assets provide further leveraging opportunities for sponsors and emphasises that Design Indaba has grown into a multitiered experience that has significant returns for sponsors.
Design Indaba has built long-standing relationships with sponsors over the years, which has led to the formation of strategic partnerships where common brand synergy is found. It has developed creative branding opportunities, which are well-integrated into the event, thus providing both traction and reach as well as points of differentiation for sponsors. Design Indaba provides sponsors with many opportunities to engage with the audience through interactive and unique experiences and allowing sponsors to cut through the clutter by maximising exclusivity and permitting sponsors to “own” an “on-site” area or specific content. Design Indaba’s embracement of social media lends itself to extending reach and engagement, in addition to sharing insights to maximise the value to sponsors. Design Indaba is committed to helping sponsors tell their stories and has developed networking opportunities for its family of sponsors thus further enabling business opportunities among co-sponsors.
In conclusion, the value of the sponsorship of the Design Indaba brand is immense as a sponsor of a particular Design Indaba component is associated with the Design Indaba brand as a whole. It is evident that the Design Indaba is a category leader, and attracts a targeted, monied market – image merchants of the world that invent and dictate trends for consumers at large. It is a niche event and attracts a distinctive target audience, thus providing a unique sponsorship opportunity.
2014 faCTsCAPE ToWn InTERnATIonAL ConVEnTIon CEnTRE
26 – 28 fEB 201452 SPEAKERS
3 757 DELEGATES (InCLUDInG SIMULCAST)
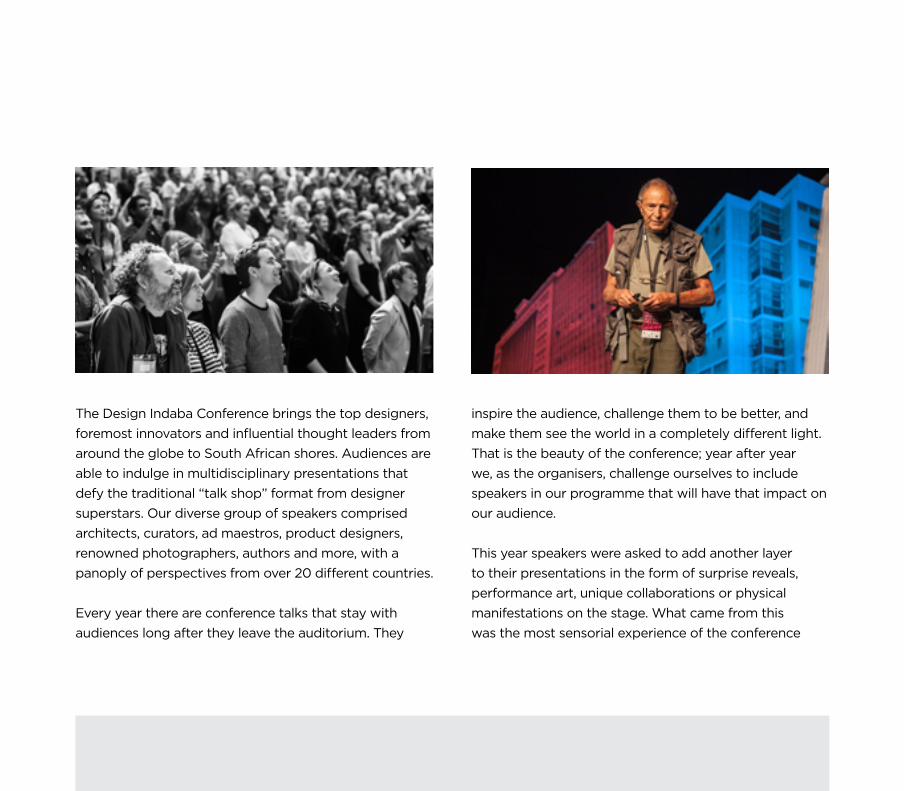
The Design Indaba Conference brings the top designers, foremost innovators and influential thought leaders from around the globe to South African shores. Audiences are able to indulge in multidisciplinary presentations that defy the traditional “talk shop” format from designer superstars. our diverse group of speakers comprised architects, curators, ad maestros, product designers, renowned photographers, authors and more, with a panoply of perspectives from over 20 different countries.
Every year there are conference talks that stay with audiences long after they leave the auditorium. They
inspire the audience, challenge them to be better, and make them see the world in a completely different light. That is the beauty of the conference; year after year we, as the organisers, challenge ourselves to include speakers in our programme that will have that impact on our audience.
This year speakers were asked to add another layer to their presentations in the form of surprise reveals, performance art, unique collaborations or physical manifestations on the stage. What came from this was the most sensorial experience of the conference
since its inception. Whether it was DJ Stout presenting alongside a special musical score by Graham Reynolds, or David Goldblatt, iconic South African photographer, reflecting on over 50 years of work in a striking and humbling presentation, or Thomas Heatherwick unveiling his groundbreaking vision to transform grain silos on the V&A Waterfront into the largest museum of contemporary African art on the continent, the audience was left seeing the world and the design industry anew.
eDuCaTORs inDaba
The 2014 Educators Indaba was led by a panel of foremost Danish designers and educators who presented InDEx: Education initiatives as well as the international arts educational exchange project, CICLo, which improves access to quality arts education and the cultural and social relevance of arts education.
The session opened with a discussion of InDEx: Design to Improve Life Education. Eva Christine Hoffmann and Caroline fehrn-Christensen explored the fundamental principle behind Design to Improve Life Education. This was followed by a presentation of education ventures launched by Denmark in South Africa.
Design Education and Arts Education was the focal point of the second half of the session. olaf Gerlach-Hansen, Senior Advisor at the Danish Cultural Institute, examined how design education has evolved such that design thinking has become part of the new, broader arts education framework. The seminar finished with a discourse regarding the major challenges remaining across educational systems.
Design inDabaR
Design Indabar is not your typical watering hole. Created from shipping containers and elaborate scaffolding structures, Design Indabar is a beautifully designed portable bar and multifunctional activation space.
Situated within walking distance from the CTICC, Design Indabar 2014 included food trucks, a cash bar and live entertainment by the likes of Blush n Bass, Honey B, Sideshow and Einstein. In addition to opening from 17:00 to 20:00 each day of the Conference, delegates also had the option to use their meal vouchers during lunchtime to get some fresh air, sunshine and experience some local flavour.


2014 faCTs40 967 VISIToRS oVER THE foUR DAYS
LSM LEVEL of SHoPPERS 8-10509 ExHIBIToRS (InCLUDInG 245 fIRST-TIME ExHIBIToRS)
806 BUYERS (595 LoCAL VS. 211 InTERnATIonAL)36 DEDICATED MEDIA

This year’s Design Indaba Expo showcased the creative energy that is forging a new, formidable reputation for African design in the international arena. With over 500 exhibitors from South Africa and for the first time the rest of the continent, the Expo cemented its reputation as the country’s premier showcase of cutting-edge design. over 800 buyers (the largest number in the expo’s 10-year history), representing both local and international retail stores, were inspired to forge connections with local designers through sales and
orders placed at the Expo, catapulting its contribution to the local economy. Local fashion was a highlight with some of South Africa’s biggest names represented both on the ramp and on the floor. In true David Tlale style, the internationally renowned fashion designer collaborated with Dutch fabric house Vlisco for an all-African inspired range, which closed the fashion ramp with aplomb on day three of the expo.
The Emerging Creatives sector, sponsored by the Department of Arts and Culture, acts as an incubator
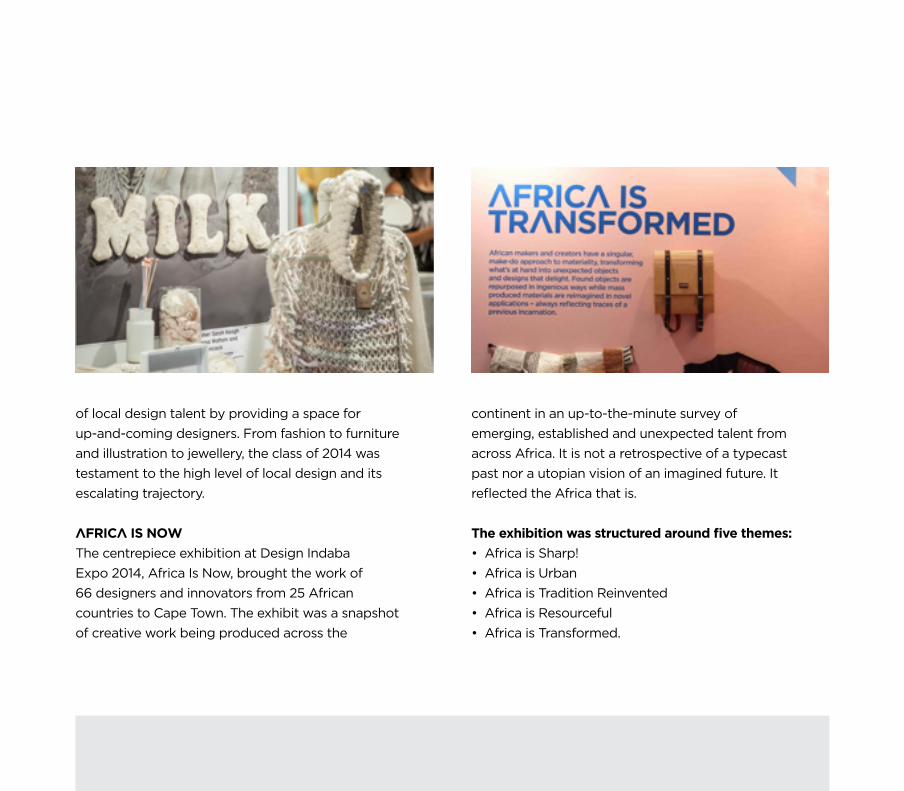
of local design talent by providing a space for up-and-coming designers. from fashion to furniture and illustration to jewellery, the class of 2014 was testament to the high level of local design and its escalating trajectory. afRiCa is nOW
The centrepiece exhibition at Design Indaba Expo 2014, Africa Is now, brought the work of 66 designers and innovators from 25 African countries to Cape Town. The exhibit was a snapshot of creative work being produced across the
continent in an up-to-the-minute survey of emerging, established and unexpected talent from across Africa. It is not a retrospective of a typecast past nor a utopian vision of an imagined future. It reflected the Africa that is.
The exhibition was structured around five themes:• Africa is Sharp!• Africa is Urban • Africa is Tradition Reinvented • Africa is Resourceful • Africa is Transformed.
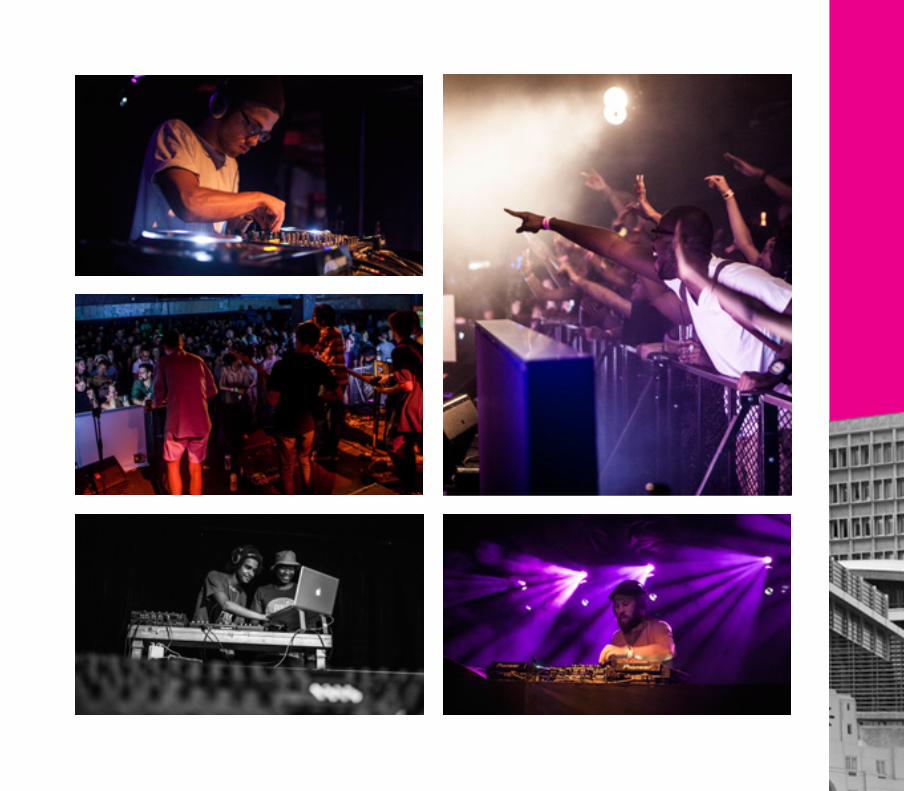
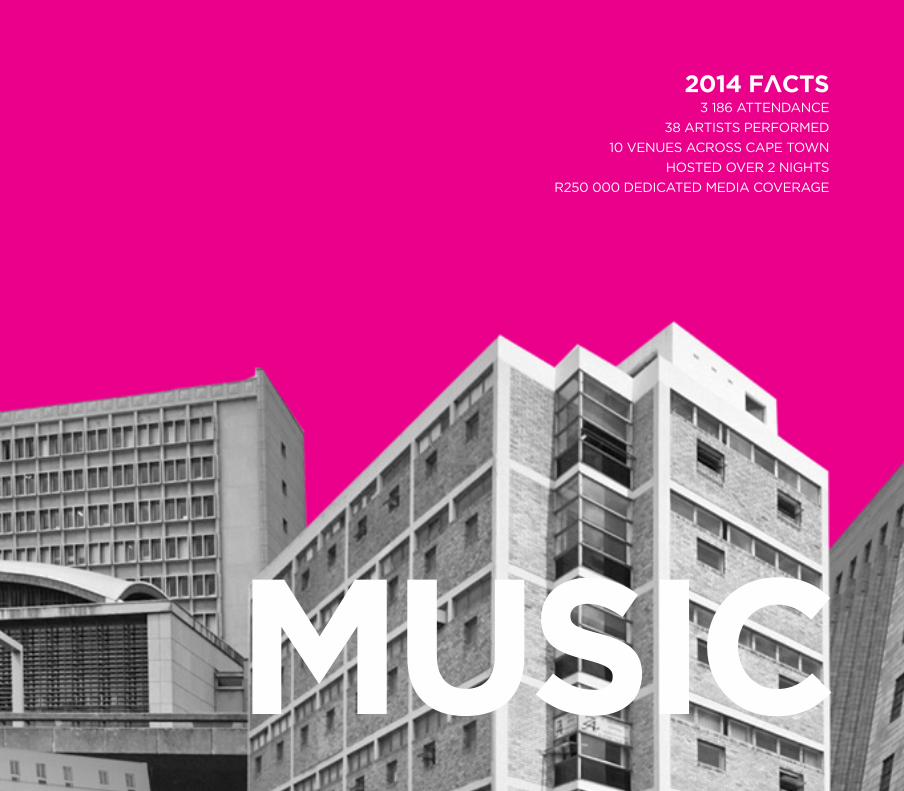
2014 faCTs3 186 ATTEnDAnCE
38 ARTISTS PERfoRMED10 VEnUES ACRoSS CAPE ToWn
HoSTED oVER 2 nIGHTSR250 000 DEDICATED MEDIA CoVERAGE
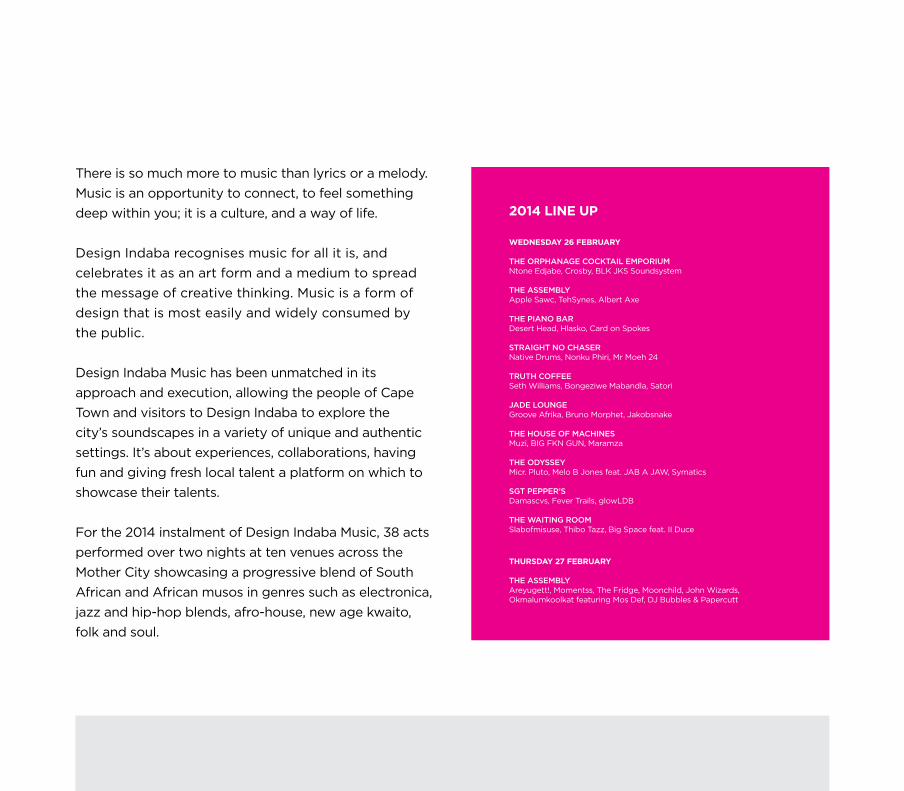
There is so much more to music than lyrics or a melody. Music is an opportunity to connect, to feel something deep within you; it is a culture, and a way of life.
Design Indaba recognises music for all it is, and celebrates it as an art form and a medium to spread the message of creative thinking. Music is a form of design that is most easily and widely consumed by the public.
Design Indaba Music has been unmatched in its approach and execution, allowing the people of Cape Town and visitors to Design Indaba to explore the city’s soundscapes in a variety of unique and authentic settings. It’s about experiences, collaborations, having fun and giving fresh local talent a platform on which to showcase their talents.
for the 2014 instalment of Design Indaba Music, 38 acts performed over two nights at ten venues across the Mother City showcasing a progressive blend of South African and African musos in genres such as electronica, jazz and hip-hop blends, afro-house, new age kwaito, folk and soul.
2014 line uP
WEdNESdAy 26 FEBRuARy
THE ORPHANAGE COCKTAIL EMPORIUMntone Edjabe, Crosby, BLK JKS Soundsystem
THE ASSEMBLYApple Sawc, TehSynes, Albert Axe
THE PIANO BARDesert Head, Hlasko, Card on Spokes
STRAIGHT NO CHASERnative Drums, nonku Phiri, Mr Moeh 24
TRUTH COFFEESeth Williams, Bongeziwe Mabandla, Satori
JADE LOUNGEGroove Afrika, Bruno Morphet, Jakobsnake
THE HOUSE OF MACHINESMuzi, BIG fKn GUn, Maramza
THE ODYSSEYMicr. Pluto, Melo B Jones feat. JAB A JAW, Symatics
SGT PEPPER’SDamascvs, fever Trails, glowLDB
THE WAITING ROOMSlabofmisuse, Thibo Tazz, Big Space feat. II Duce
THuRSdAy 27 FEBRuARy
THE ASSEMBLYAreyugett!, Momentss, The Fridge, Moonchild, John Wizards, okmalumkoolkat featuring Mos Def, DJ Bubbles & Papercutt
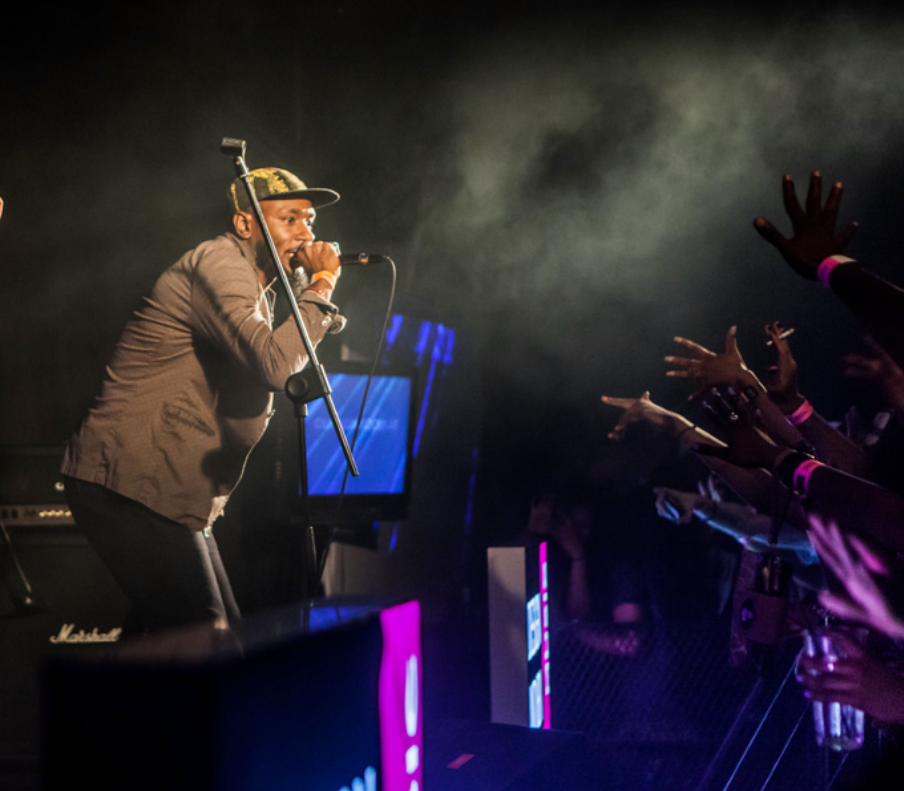
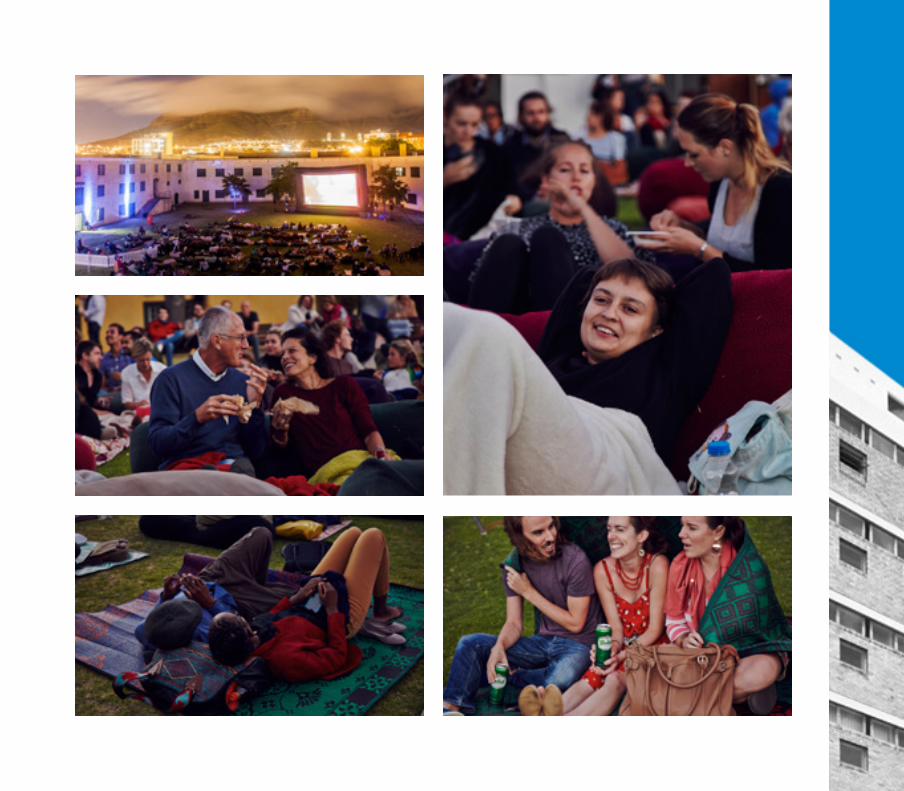

2014 faCTs1 305 VISIToRS
1 GLoBAL PREMIERE9 AfRICAn PREMIERS
3 SPECTACULAR VEnUES10 nIGHTS of AWARD-WInnInG DoCUMEnTARIES
Design Indaba filmfest 2014 presented 10 documentary feature films, never before seen on South African soil, in unforgettable settings. from intimately told, quirky narratives to bold conversation-starters, the film selection showcased the genius and passion that drives creativity in endeavours such as urban planning, old-school sign painting, skateboarding and photography.
The festival took place over 10 nights at three different venues each capturing the heritage and picturesque beauty of Cape Town.
Maiden’s Cove in Clifton played host to the first three films, screened in an old-school drive-in style setting. Viewers enjoyed cinematic brilliance with the Atlantic ocean on one side and the Twelve Apostles on the other.
The films shown at Maiden’s Cove were music documentaries and included: Sound City directed by Dave Grohl (foo fighters), the oscar-winning 20 Feet From Stardom and The Otherside an award-
winning documentary about the up-and-coming Seattle Hip Hop scene.
Cape Town’s oldest surviving building, the Castle of Good Hope, hosted six films outdoors, with the audience picnicking against the backdrop of Table Mountain.
The films featured at this venue included: The Human Scale, which was also broadcast on eTV with the Design Indaba license, This Ain’t California (Cannes Independent film festival winner), Gregory Crewdson: Brief Encounters (Denver film festival Award winner), Sign Painters, introduced by Ed Suter (renowned photographer), Cutie and the Boxer (2014 oscar nominee 2014) and Finding Fela (2014 Sundance film festival debut), which was introduced by the film’s executive producer, Stephen Hendle.
for the grand finale, we screened Wes Anderson’s latest film, The Grand Budapest Hotel, in the nuMetro Cinemas at Cape Town’s iconic V&A Waterfront.This screening was its second ever before the global release nearly a month later.

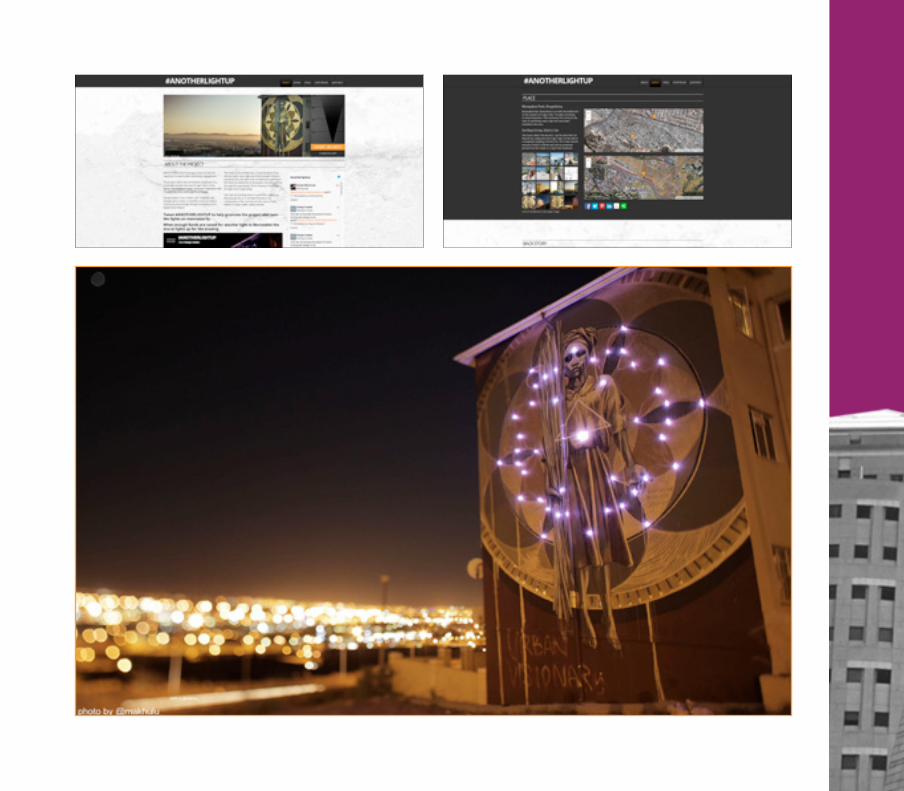

Design Indaba’s primary social activisim project for 2014, #ANoTHERlIGHTup leverages street art with the capacity of crowd-funded community engagement. This project aims to raise funds for streetlights to light up a 700m pathway between public taps and other better lit areas in Monwabisi Park, Khayelitsha. Installing lights is one impactful move towards creating a safer space for the local residents.
Design Indaba Trust, faith47 and Thingking teamed up to create a mural that atcivates community-level change through the duality of art-based social impact.
The multi-storey artwork has a visual feedback loop: the wall lights up at night each time enough money is raised for one new light to be installed in the informal settlement of in Khayelitsha, through the organisation VPUU (Violence Prevention through Urban Upgrading).
The intricate lighting pattern is an artistic endeavour that also serves as a reminder that there are communities in the city that lack the luxury of light, which is a major public safety concern.
for the people of Monwabisi Park, their only access to free, clean water is via public municipal water taps. Residents develop daily routines around necessary trips to the nearest tap. The ‘emtonjenis’ (public tap spaces) have thus become communal gathering areas. However, these spaces and the adjoining pathways have also become a target for crime, as they are not lit up at night. In informal settlements there is a direct correlation between light and safety.
The mural, entitled ‘The Harvest’, is located in District Six next to De Waal Drive. faith47 chose an image that represents the feminine spirit that is nurturing and life giving, bearing crops — a symbol of fertility and abundance. The background is subtly adorned with sacred geometry; the flower of Life gives shape to a golden tapestry radiating from her umbilical centre.
It is with care that she watches over the city, with her palm open as if to ask, surrender, challenge, give, calm, request or quietly symbolise her intention of peace. Thingking helped with the development of the project and technical elements. Design Indaba Trust assisted on project management and marketing and funded the mural.
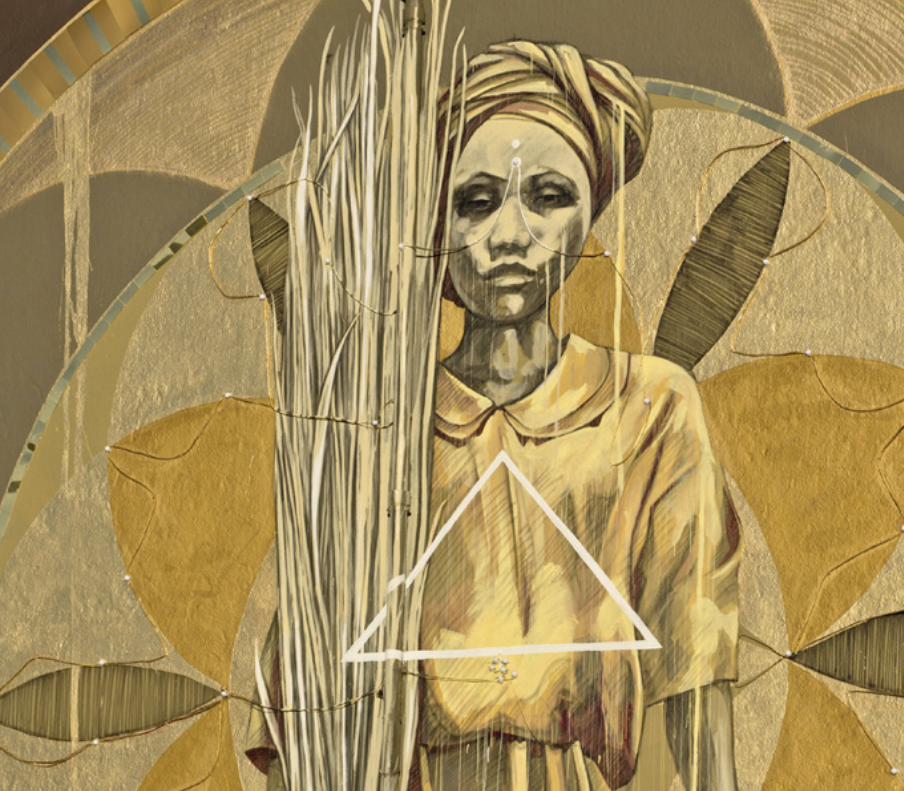
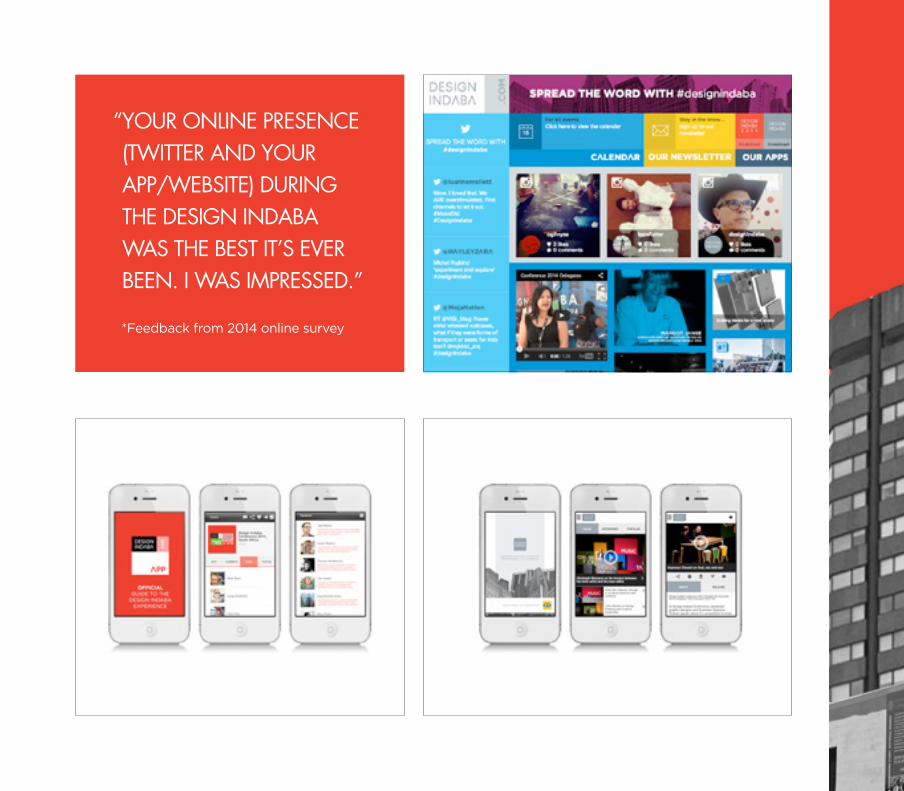
“ Your online presence (TwiTTer and Your app/websiTe) during The design indaba was The besT iT’s ever been. i was impressed.”
*feedback from 2014 online survey

2014 faCTs53 000 UnIQUE VISITS PER MonTH
42 500 foLLoWERS on TWITTER16 600 LIKES on fACEBooK
23 000 nEWSLETTER SUBSCRIBERS6 679 APP DoWnLoADS (ACRoSS EVEnT & VIDEo APPS)

DesigninDaba.COm
Rising to prominence as a leading standalone design publication, designindaba.com embodies how creativity and the design sectors are actively driving a better world. Its focus is global, local and African creativity, through the lens of the work and opinions of industry experts.
founded on the meticulous curation of Design Indaba’s Conference and Expo, it is a one-stop design resource of top quality, original content that inspires, educates and activates its visitors to use creativity for good.
Multimedia in format, features include in-depth articles, image galleries and exclusive video interviews and series. one of its premium offerings is a video library of the full-length Conference Talks. It also offers a Designer Directory of global and local creative practitioners.
A global online publication based in South Africa, designindaba.com is becoming the leading voice on African design, creativity and innovation. Africa is a source of vibrant design inspiration and ingenious contextual solutions to vexing challenges. By uncovering its stories, Design Indaba celebrates and grows African
creativity, offering an international platform for the continent’s rich offering.
Design inDaba aPPs
Design Indaba now has two mobile apps for ioS and Android: a newly launched video app and a festival app, featuring the annual event guide.
Design Indaba’s video app features high-quality, original videos released weekly. You’ll find all Design Indaba Conference Talks as well as exclusive interviews and design series featuring the world’s top designers.
The Design Indaba festival app is a mobile event guide for the annual Design Indaba festival. It features the full programme of events, live news updates, notifications for event announcements and a host of interactive features.
Online infORmaTiOn
Traffic and reach*Designindaba.com has 53 000 visits per month,140 000 page impressions and a total of over 25 000 video views. Web traffic peaks around festival time, with
february 2014 receiving over 118 000 visits and 377 000 pageviews. With an increasingly global reach, 64% of visitors are from outside South Africa.
online audience*Design Indaba has a loyal online audience of discerning, influential individuals, consisting of creative professionals, media, students and design aficionados within the creative sectors. Many of these are Design Indaba Conference delegates and Expo exhibitors. our audience profile ranges between LSMs 8 and 10.
Weekly newsletter: 23 000 subscribersTwitter: 42 500 followersfacebook: 16 600 likesPinterest: 3 800 followersYouTube: 145 000 video viewsEvent app: 5 568 downloadsVideo app: 1 111 downloads
Design inDaba 2014 DigiTal aCTivaTiOn
overviewDesign Indaba had a full content team on board at the 2014 festival for the first time, producing articles, videos and social media content live and on the fly. The culmination of the digital conversation was presented as a splash page at Designindaba.com/live, which all visitors to the website were redirected to during Design Indaba 2014.
The total content output during the 5-day period at the CTICC consisted of:• 33 news/videos/galleries on designindaba.com• 20 YouTube videos• 19 Insta-videos• 49 Instagram pics• 505 sent Tweets from @designindaba • 9 Facebook event pages with a total of 11 362 invited
guests and 2 434 confirmed attending• 3 Design Indaba 2014 pin boards:
- 2014 speakers work (141 Pins, 1 258 followers)- 2014 exhibitors (303 Pins, 1 290 followers)- Africa is now (429 Pins, 3 520 followers)
* Analytics correct as of 1 May 2014. Averages reflect the last calendar year.

ConversationIn order to gauge online conversation around Design Indaba, mentions of it were tracked across the web over the period of the festival as well as before and after (14 february to 14 March). This date range was chosen because it provides data for an equal number of days on either sides of the main events (Conference and Expo), enabling pre- and post-event analysis.
Mentionsfrom 14 february to 14 March, there were 37 217 mentions, with over 220 000 “opportunities to see” (the number of people who may have seen the aforementioned mentions).
The earned media value on these was just under R50 million, and the number of contributors were just under 10 000 during the main events (Conference and Expo).
The number of mentions peaked around the period of the Conference and Expo, with 71% (27 042) of the mentions occurring between 26 february and 2 March. There is a slight spike in the volume of mentions about
eight days before the events start, with a slightly more pronounced spike in the two days leading up to the event.
visitsThe number of visits and unique visitors both increased from 2013 to 2014. Visits increased from 30 593 to 41 233, which is an increase of 34.8%, with unique visitors increasing from 23 615 to 31 525, or 33.5% increase.
pageviews and pages per visitThe website saw an increase of 52.9% in number of pageviews, increasing from 92 221 to 141 055 from 2013 to 2014. The number of pages per visit increased from 3.01 to 3.42, or an increase of 13.48%.
sOCial meDia
design Indaba’s social media platforms garnered the following:Twitter: 2632 new followers (total 39 911) = 7% increasefacebook: 1621 new likes (total 15 816) = 11.4% increaseInstagram: 911 new followers (total 916) = 18220% increase (new account launched at DI2014)Pinterest: 183 new followers (total 3520) = 5.4% increase
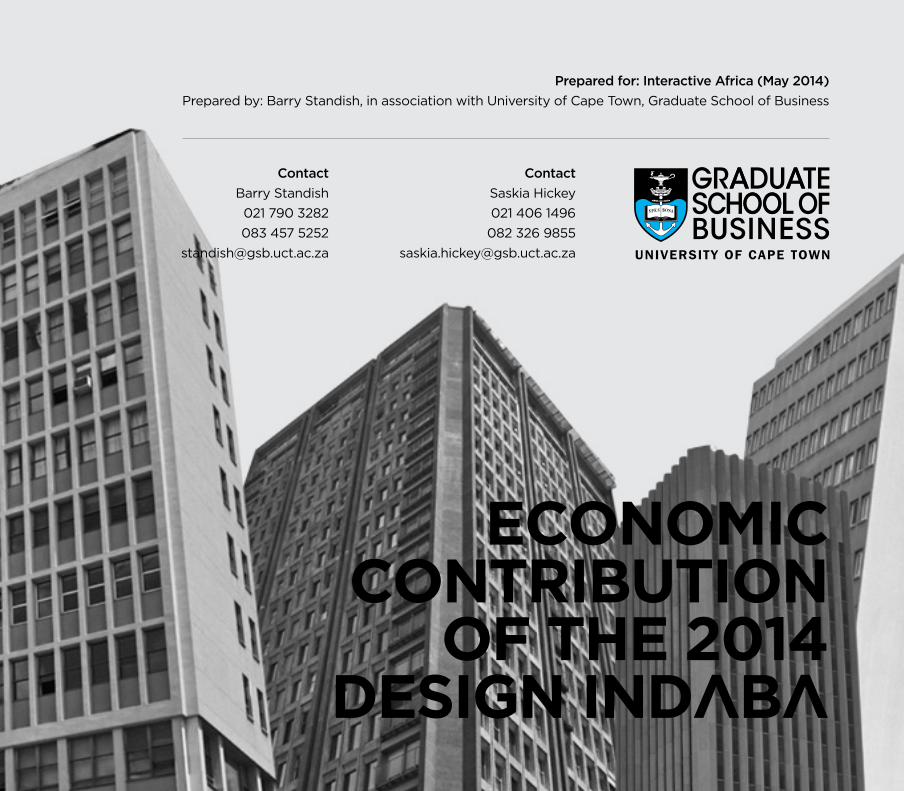
71
ContactBarry Standish021 790 3282083 457 5252
ContactSaskia Hickey021 406 1496082 326 9855
eCOnOmiC COnTRibuTiOn
Of The 2014 Design inDaba
Prepared for: Interactive Africa (May 2014)Prepared by: Barry Standish, in association with University of Cape Town, Graduate School of Business
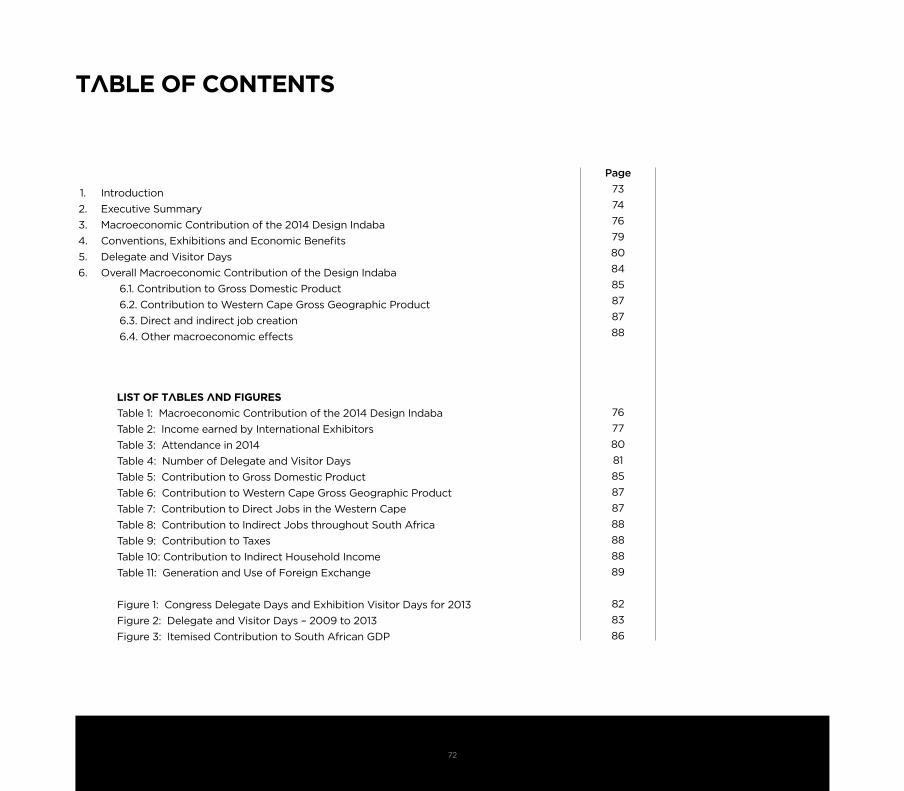
72
Introduction Executive SummaryMacroeconomic Contribution of the 2014 Design Indaba Conventions, Exhibitions and Economic Benefits Delegate and Visitor Days overall Macroeconomic Contribution of the Design Indaba
6.1. Contribution to Gross Domestic Product 6.2. Contribution to Western Cape Gross Geographic Product 6.3. Direct and indirect job creation 6.4. other macroeconomic effects
Table Of COnTenTs
lisT Of Tables anD figuRes
Table 1: Macroeconomic Contribution of the 2014 Design IndabaTable 2: Income earned by International ExhibitorsTable 3: Attendance in 2014Table 4: number of Delegate and Visitor DaysTable 5: Contribution to Gross Domestic ProductTable 6: Contribution to Western Cape Gross Geographic Product Table 7: Contribution to Direct Jobs in the Western CapeTable 8: Contribution to Indirect Jobs throughout South AfricaTable 9: Contribution to TaxesTable 10: Contribution to Indirect Household IncomeTable 11: Generation and Use of foreign Exchange
figure 1: Congress Delegate Days and Exhibition Visitor Days for 2013figure 2: Delegate and Visitor Days – 2009 to 2013figure 3: Itemised Contribution to South African GDP
Page73747679808485878788
7677808185878788888889
828386
1.2.3.4.5.6.

73
1. inTRODuCTiOn
Design Indaba is a major event in Cape Town. It has, over the last twenty years, made a major contribution to growing the design industry in the Western Cape. It is also a major force for good because many of the people who exhibit at the Design Indaba Expo are just starting their design businesses. The Indaba gives them invaluable exposure to local and international buyers. The Indaba has been instrumental in nurturing hundreds of embryonic businesses and helping them become sustainable and successful enterprises.
The Indaba grows and innovates every year. This year, for the first time, the event hosted design not just from South Africa but from the whole of Africa. Design Indaba is a truly remarkable event on the South African calendar. It has always attracted the brightest and most creative talent in the country. This will gradually grow to attract the brightest and most creative talent on the entire continent. Year after year it encourages this talent to innovate and improve – exhibitors generally do not display the same wares as the previous year. Then, there are the buyers who come from all over the country and the world. from a Western Cape perspective this generates income, creates jobs and sustains livelihoods. from a national, and now African perspective the Design Indaba showcases the continent and contributes significantly to export revenues.
Yet this is not just an exhibition. It is also an enlightening experience for those who attend the conference that is held in conjunction with the exhibition. Here one can be inspired by local and international creative talent. The Design Indaba raises the profile and awareness of the industry. At the conference, experienced designers share their approaches and ethos with young designers. This learning experience is widened through a simulcast of the conference. originally limited to Cape Town this simulcast is now broadcast in Johannesburg, Durban, Port Elizabeth and, for the first time in 2014, Potchefstroom.
This is the sixth report on the economic contribution of the Indaba. The report starts with a snapshot of the macroeconomic contribution of the 2014 Design Indaba. This is followed by a general description of the types of economic benefits that are generated by conventions and exhibitions and a more detailed review of the macroeconomic contribution of Design Indaba. The report ends with a comparison of the economic contribution of the Indaba since 2009.

74
The Design Indaba is a major event in Cape Town. It has, over the last twenty years, made a major contribution to growing the design industry in the Western Cape. It is also a major force for good because many of the people who exhibit at the Design Indaba Expo are just starting their design businesses. The Indaba gives them invaluable exposure to local and international buyers. The Indaba has been instrumental in nurturing hundreds of embryonic businesses and helping them become sustainable and successful enterprises. The Indaba grows and innovates every year. This year, for the first time, the event hosted design not just from South Africa but from the whole of Africa. from a national, and now African, perspective the Design Indaba showcases the continent and contributes significantly to export revenues.
The Design Indaba is a truly remarkable event on the South African calendar. It has always attracted the brightest and most creative talent in the country. This will gradually grow to attract the brightest and most creative talent on the entire continent. Year after year it forces this talent to innovate and improve – exhibitors generally do not display the same wares as the previous year. Then, coming from all over the country and the world are the buyers. This generates income, creates jobs and sustains livelihoods.
Yet this is not just an exhibition. It is also an enlightening experience for those who attend the convention that is held in conjunction with the exhibition. Here one can be inspired by local and international creative talent. The Design Indaba raises the profile and awareness of the industry. At the conference, experienced designers share their approaches and ethos with young designers. This learning experience is widened through a simulcast of the conference.
Starting from humble beginnings in 1995 the Design Indaba has grown in size and stature to be the foremost of this type of event in the country. In 2004 there were 40 exhibits and 8 000 people attended. In 2014 there were 10 events, attracting in excess of 40 000 visitors. This includes 723 design students who attended the Cape Town simulcast of the conference and 475 scholars who attended the expo.
The exposure is not limited to just Cape Town. Some of the conference presentations were simulcast to Johannesburg, Durban, Port Elizabeth and, for the first time this year, Potchefstroom. Some 831 tertiary design students and young advertising, design and marketing professionals were in attendance at these distance based simulcasts. Design Indaba is committed to broadening its creative scope. The convention and exhibition business is big business. It brings people in and boosts spending in the host province. It brings people in from other countries, boosts spending in the country and generates foreign exchange. However the business is bigger than that. Where conventions bring in delegates from other countries they showcase the city, province and country. Where the
showcasing is successful some of the delegates return as tourists. In turn some of these tourists become regular visitors to our shores. for some conventions and exhibitions the business is even bigger than tourism. Where a convention or exhibition draws business to the country or where exhibitions nurture the growth of local industry – particularly small start up business – the economic benefits are spread far and wide. The Design Indaba is an outstanding example of such an initiative.
DelegaTe anD visiTOR Days
The Design Indaba contributes in part to the provincial and national economies by attracting local and foreign delegates and visitors to Cape Town. These have increased over the years and 2014 is no exception. In 2009 there were 21 158 visitors, increasing to 24 335 in 2010, 25 735 in 2011, 33 331 in 2012 and 25 202 in 2013. In 2014 there were 30 622 visitors. The economic analysis modifies these numbers to take account of the fact that some visitors are scholars, some are multi-day visitors, some spend time in the City and country before and after the event and some have other members in their party who may not attend the event.
It is estimated that, after these adjustments, the 2014 congress and exhibition generated a total of 63 560 delegate and visitor days that have economic significance. This is an increase of 23% over the 51 849 days of 2013 and almost matches the peak of 65 467 days in 2012. of these 63 560 delegate and visitor days 46% were people from the Western Cape, 36% by people from elsewhere in South Africa and 18% from the rest of the world. The exhibition generated about three times as many visitor days as the congress. The greatest proportion of delegates to the 2014 conference was from elsewhere in South Africa (47%), followed by the Western Cape (36%). The rest were international delegates (16%).
maCROeCOnOmiC COnTRibuTiOn Of The 2014 Design inDaba
While there are a number of different types of macroeconomic effects, the two most important are contribution to gross domestic product (GDP) and creation of jobs. The importance of job creation is obvious. Increases in GDP are synonymous with increases in peoples’ economic standards of living. Increased GDP – i.e. increased production – is experienced in the form of more jobs, higher wages and reduced economic hardship. It is clearly an important measure.
COnTRibuTiOn TO gROss DOmesTiC PRODuCT
GDP is the total value of all final goods and services produced in the country. It is clearly fundamental to the economic quality of life of people in the country. It is also the most important and all-encompassing measure of the macroeconomic effect of the Indaba. Total contribution to GDP has increased annually from R191.9m in 2009 to R385.2m in 2014. The contribution to GDP in 2014 is made up of:• Host / Organiser expenditure of R78.7m. This is an increase on the R69.5m in 2013. • Exhibitor expenditure of R12.2m, which is up from R11.3m in 2013.• Delegate expenditure of R92.3m. This is an increase on the R64.8m in 2013 and also on the
2. eXeCuTive summaRy
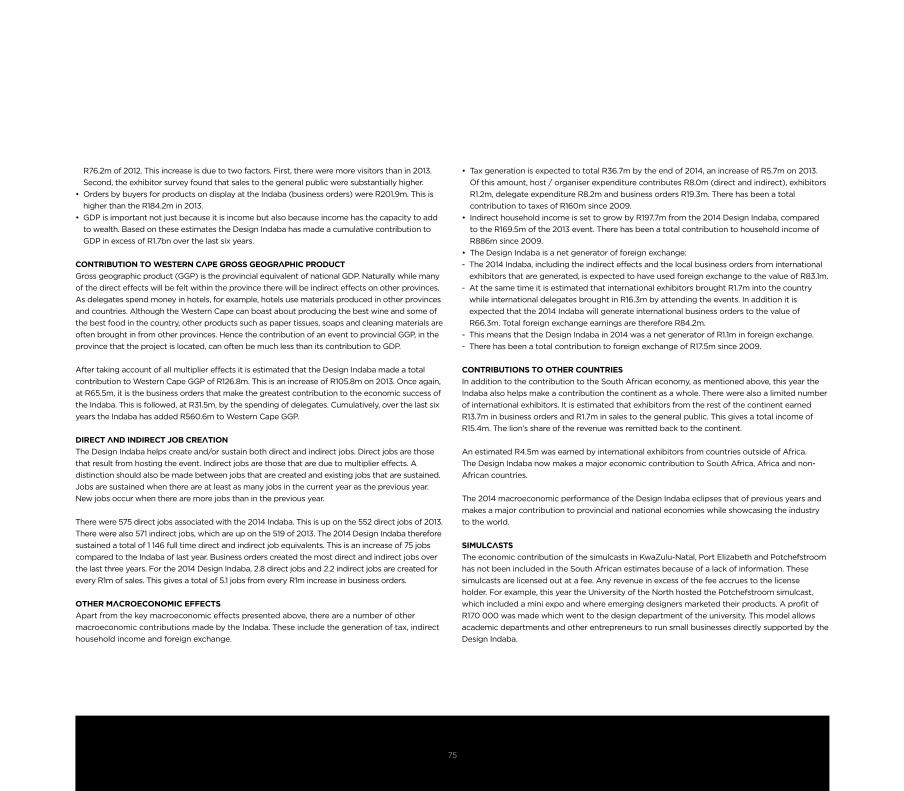
75
R76.2m of 2012. This increase is due to two factors. first, there were more visitors than in 2013. Second, the exhibitor survey found that sales to the general public were substantially higher.
• Orders by buyers for products on display at the Indaba (business orders) were R201.9m. This is higher than the R184.2m in 2013.
• GDP is important not just because it is income but also because income has the capacity to add to wealth. Based on these estimates the Design Indaba has made a cumulative contribution to GDP in excess of R1.7bn over the last six years.
COnTRibuTiOn TO WesTeRn CaPe gROss geOgRaPhiC PRODuCT
Gross geographic product (GGP) is the provincial equivalent of national GDP. naturally while many of the direct effects will be felt within the province there will be indirect effects on other provinces. As delegates spend money in hotels, for example, hotels use materials produced in other provinces and countries. Although the Western Cape can boast about producing the best wine and some of the best food in the country, other products such as paper tissues, soaps and cleaning materials are often brought in from other provinces. Hence the contribution of an event to provincial GGP, in the province that the project is located, can often be much less than its contribution to GDP.
After taking account of all multiplier effects it is estimated that the Design Indaba made a total contribution to Western Cape GGP of R126.8m. This is an increase of R105.8m on 2013. once again, at R65.5m, it is the business orders that make the greatest contribution to the economic success of the Indaba. This is followed, at R31.5m, by the spending of delegates. Cumulatively, over the last six years the Indaba has added R560.6m to Western Cape GGP.
DiReCT anD inDiReCT jOb CReaTiOn
The Design Indaba helps create and/or sustain both direct and indirect jobs. Direct jobs are those that result from hosting the event. Indirect jobs are those that are due to multiplier effects. A distinction should also be made between jobs that are created and existing jobs that are sustained. Jobs are sustained when there are at least as many jobs in the current year as the previous year. new jobs occur when there are more jobs than in the previous year.
There were 575 direct jobs associated with the 2014 Indaba. This is up on the 552 direct jobs of 2013. There were also 571 indirect jobs, which are up on the 519 of 2013. The 2014 Design Indaba therefore sustained a total of 1 146 full time direct and indirect job equivalents. This is an increase of 75 jobs compared to the Indaba of last year. Business orders created the most direct and indirect jobs over the last three years. for the 2014 Design Indaba, 2.8 direct jobs and 2.2 indirect jobs are created for every R1m of sales. This gives a total of 5.1 jobs from every R1m increase in business orders.
OTheR maCROeCOnOmiC effeCTs
Apart from the key macroeconomic effects presented above, there are a number of other macroeconomic contributions made by the Indaba. These include the generation of tax, indirect household income and foreign exchange.
• Tax generation is expected to total R36.7m by the end of 2014, an increase of R5.7m on 2013. of this amount, host / organiser expenditure contributes R8.0m (direct and indirect), exhibitors R1.2m, delegate expenditure R8.2m and business orders R19.3m. There has been a total contribution to taxes of R160m since 2009.
• Indirect household income is set to grow by R197.7m from the 2014 Design Indaba, compared to the R169.5m of the 2013 event. There has been a total contribution to household income of R886m since 2009.
• The Design Indaba is a net generator of foreign exchange: - The 2014 Indaba, including the indirect effects and the local business orders from international
exhibitors that are generated, is expected to have used foreign exchange to the value of R83.1m.- At the same time it is estimated that international exhibitors brought R1.7m into the country
while international delegates brought in R16.3m by attending the events. In addition it is expected that the 2014 Indaba will generate international business orders to the value of R66.3m. Total foreign exchange earnings are therefore R84.2m.
- This means that the Design Indaba in 2014 was a net generator of R1.1m in foreign exchange. - There has been a total contribution to foreign exchange of R17.5m since 2009.
COnTRibuTiOns TO OTheR COunTRies
In addition to the contribution to the South African economy, as mentioned above, this year the Indaba also helps make a contribution the continent as a whole. There were also a limited number of international exhibitors. It is estimated that exhibitors from the rest of the continent earned R13.7m in business orders and R1.7m in sales to the general public. This gives a total income of R15.4m. The lion’s share of the revenue was remitted back to the continent.
An estimated R4.5m was earned by international exhibitors from countries outside of Africa. The Design Indaba now makes a major economic contribution to South Africa, Africa and non-African countries.
The 2014 macroeconomic performance of the Design Indaba eclipses that of previous years and makes a major contribution to provincial and national economies while showcasing the industry to the world.
simulCasTs
The economic contribution of the simulcasts in KwaZulu-natal, Port Elizabeth and Potchefstroom has not been included in the South African estimates because of a lack of information. These simulcasts are licensed out at a fee. Any revenue in excess of the fee accrues to the license holder. for example, this year the University of the north hosted the Potchefstroom simulcast, which included a mini expo and where emerging designers marketed their products. A profit of R170 000 was made which went to the design department of the university. This model allows academic departments and other entrepreneurs to run small businesses directly supported by the Design Indaba.

76
3. maCROeCOnOmiC COnTRibuTiOn Of The 2014 Design inDaba
This section presents the macroeconomic contribution of the 2014 Design Indaba. This is reported for South African, Africa and other exhibitors, and the impact of simulcast in venues outside of Cape Town.
• There were 63 560 delegate and visitor days. This is a substantial increase on the 51 849 of last year. There was an increase in the number of visitors and delegates at each of the events staged at the Indaba.
• Spending by the organisers contributed R78.7m to gross domestic product (GDP) and R25.7m to Western Cape gross geographic product (GGP). The contribution to GDP by the organisers is 13% higher than in 2013.
• Expenditure by delegates contributed R92.3m to GDP and R31.5m to Western Cape GGP.• The major contributor was as a result of orders place by local and international buyers (business orders) with an estimated contribution to GDP of R201.9m and R65.5m to GGP by the end of 2014. • Total contribution to GDP was R385.2m and total contribution to GGP was R126.8m. The contribution to GDP was 16.8% higher than in 2013. This was an impressive increase of 10.2% in real
terms (after removing the effects of inflation). • 575 people in the Western Cape owe their employment directly to the Design Indaba while another 571 indirect jobs were sustained.• This is higher than the 552 direct jobs in 2013 and only slightly lower than the 598 of 2012. The 2014 event resulted in 571 indirect jobs compared to the 519 of 2013. The reason for the apparent
discrepancy between the large increase in GDP and smaller increase in jobs is a result of the type of merchandise ordered by buyers.• Other macroeconomic benefits are the generation of R36.7m in tax revenue and the creation of R197.7m in indirect household income.• The Design Indaba was a net generator of R1.1m in foreign exchange earnings for the country.
gDP ggP DiReCT WC jObs
inDiReCT sa jObs
inDiReCT TaXes
inDiReCT h-hOlD inCOme
neT fOReX eaRnings
DelegaTe & visiTOR Days
Host / organiser Expenditure 78.7 25.7 51 103 8.0 40.6
Exhibitor Expenditure 12.2 4.2 4 15 1.2 6.2
All Delegate Expenditure 92.3 31.5 120 140 8.2 47.2
Business orders 201.9 65.5 399 314 19.3 103.8
Total Contribution 2014 385.2 126.8 575 571 36.7 197.7 1.1 63 560
Total Contribution 2013 329.8 105.8 552 519 31.0 169.5 1.0 51 849
TABLE 1: MACRoEConoMIC ConTRIBUTIon of THE 2014 DESIGn InDABA (SoUTH AfRICAn HIGHLIGHTS)
Rand Million, 2014 Prices
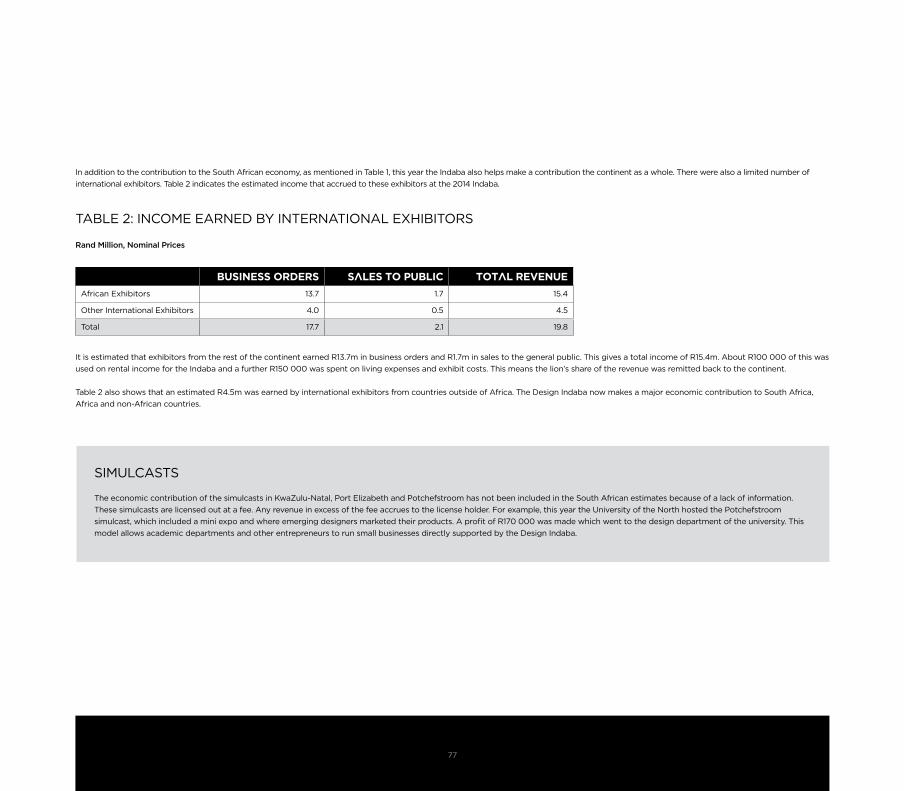
77
gDP ggP DiReCT WC jObs
inDiReCT sa jObs
inDiReCT TaXes
inDiReCT h-hOlD inCOme
neT fOReX eaRnings
DelegaTe & visiTOR Days
Host / organiser Expenditure 78.7 25.7 51 103 8.0 40.6
Exhibitor Expenditure 12.2 4.2 4 15 1.2 6.2
All Delegate Expenditure 92.3 31.5 120 140 8.2 47.2
Business orders 201.9 65.5 399 314 19.3 103.8
Total Contribution 2014 385.2 126.8 575 571 36.7 197.7 1.1 63 560
Total Contribution 2013 329.8 105.8 552 519 31.0 169.5 1.0 51 849
In addition to the contribution to the South African economy, as mentioned in Table 1, this year the Indaba also helps make a contribution the continent as a whole. There were also a limited number of international exhibitors. Table 2 indicates the estimated income that accrued to these exhibitors at the 2014 Indaba.
business ORDeRs sales TO PubliC TOTal Revenue
African Exhibitors 13.7 1.7 15.4
other International Exhibitors 4.0 0.5 4.5
Total 17.7 2.1 19.8
TABLE 2: InCoME EARnED BY InTERnATIonAL ExHIBIToRS
Rand Million, Nominal Prices
It is estimated that exhibitors from the rest of the continent earned R13.7m in business orders and R1.7m in sales to the general public. This gives a total income of R15.4m. About R100 000 of this was used on rental income for the Indaba and a further R150 000 was spent on living expenses and exhibit costs. This means the lion’s share of the revenue was remitted back to the continent.
Table 2 also shows that an estimated R4.5m was earned by international exhibitors from countries outside of Africa. The Design Indaba now makes a major economic contribution to South Africa, Africa and non-African countries.
SIMULCASTS
The economic contribution of the simulcasts in KwaZulu-natal, Port Elizabeth and Potchefstroom has not been included in the South African estimates because of a lack of information. These simulcasts are licensed out at a fee. Any revenue in excess of the fee accrues to the license holder. for example, this year the University of the north hosted the Potchefstroom simulcast, which included a mini expo and where emerging designers marketed their products. A profit of R170 000 was made which went to the design department of the university. This model allows academic departments and other entrepreneurs to run small businesses directly supported by the Design Indaba.
“ we generaTe sTraTegies ThaT enhance The designs’ final resulT – iT needs To have an added value, give someThing back To socieTY.”
miChel ROjkinD / Design inDaba 2014
79
4. COnvenTiOns, eXhibiTiOns anD eCOnOmiC benefiTs
There are a number of economic benefits that result from successful conventions and exhibitions.
The first and most obvious is the spending on setting up and running the convention and exhibition. This includes spending by convention and exhibition organisers, exhibitors at the event, delegates attending the conventions and visitors attending the exhibitions. This spending was calculated using both costs supplied by the event organisers and from a sample of exhibitors. A sample of 103 of the total 509 exhibitors was surveyed. This survey was supplemented using surveys from other events at the Cape Town International Convention Centre (CTICC).
The second is the non-convention related spending by delegates. This includes accommodation, travel, sightseeing, buying meals, souvenirs, etc. This is based on surveys of other conventions hosted at the CTICC.
There are two potential types of spending that are not identified through such surveys.
• The first is that anecdotal evidence suggests that many delegates from other countries on the continent often make large purchases of consumer durables. This could not be measured.
• The second is that some international delegates return with their family as tourists in later years. Some of these tourists become regular visitors to South Africa. This was estimated using surveys of conventions at the CTICC.
• In the case of the Design Indaba the benefits go further. Here we find at least three other economic benefits:
• Business to business benefits. Business to business conventions and exhibitions are a key meeting place for agreement to be reached on a wide range of different types of potential business agreements. These can be orders, cooperation agreements and foreign direct investment, to name a few. In turn the deals can be between business people within the Western Cape, between the Western Cape and other provinces and between South Africa and other countries. Various events supporting both the conference and the expo, such as the various workshops and Dine Around, are specifically designed to promote networking experiences. This effect could not be measured.
• SMME business development. Small business development is a key component of any poverty alleviation strategy. SMMEs offer a way out of poverty through economic empowerment that is far more efficient than reliance on hand-outs.
• Promotion of Design. Design Indaba promotes the industry and attracts people into associated professions. It is now part of the school design curriculum for scholars in Grade 11 and 12 to attend Design Indaba. The Design Indaba clearly plays a major role in developing and inspiring future business professionals in the creative industries.
one of the more difficult challenges faced in this study was to determine the value of orders that were placed both during the Indaba and those that will be placed over the rest of the year.
It is clear from discussions with both the organisers and exhibitors that, while there are some orders placed during the Indaba itself, there are more significant sales later in the year. This is particularly so in the run up to the end of year festive season. The event organisers have also found that exhibitors are not overly enthusiastic about revealing the value of orders from previous Indabas. As a result while estimates have been made about the value of orders these should be treated as indicative rather than robust.
The starting point in determining the value of orders was to use the survey sent out by Interactive Africa to the exhibitors shortly after the 2014 Design Indaba. In this survey exhibitors were asked whether national and international buyers had been in contact with them and, if so, the value of orders placed.
• The results of the exhibitors survey, to which 20.2% of exhibitors responded, was scaled up to account for all South African exhibitors. Sales by other African and international exhibitors are excluded from the analysis.
• In the surveys, respondents reported sales for a six week period after the Indaba. These results were scaled up to represent a full year equivalent. This is justified by the long buying cycles. not only do business orders increase in the run-in towards the end of year but in some instances orders take place two to three years after initial contact was made with the exhibitors.
• The survey made a distinction between national and international buyers. This was used to calculate the value of exports. The survey of exhibitors indicated that approximately 47% of orders received to date were from international buyers. This is slightly higher than in previous years.
• Sales to the general public are included in these orders. The survey found that sales to the public were R746 per visitor. This is double that of other exhibitions at the CTICC. However, sales to the other African and international exhibitors, who accounted for approximately 13% of all exhibitors, need to be excluded from the analysis because these represent outflows of money from the national economy.
Clearly there is no way of knowing, at this stage, the value of orders that will be placed over the rest of this year. This was estimated from known orders of previous Indabas during and after the event. The ratio of sales during and after the event was then used on the known sales during this year’s event to estimate potential orders for the rest of the year. It is estimated that the 2014 Design Indaba will generate orders for local exhibitors of R140m. This is 4.5% more, in nominal terms, than in 2013.
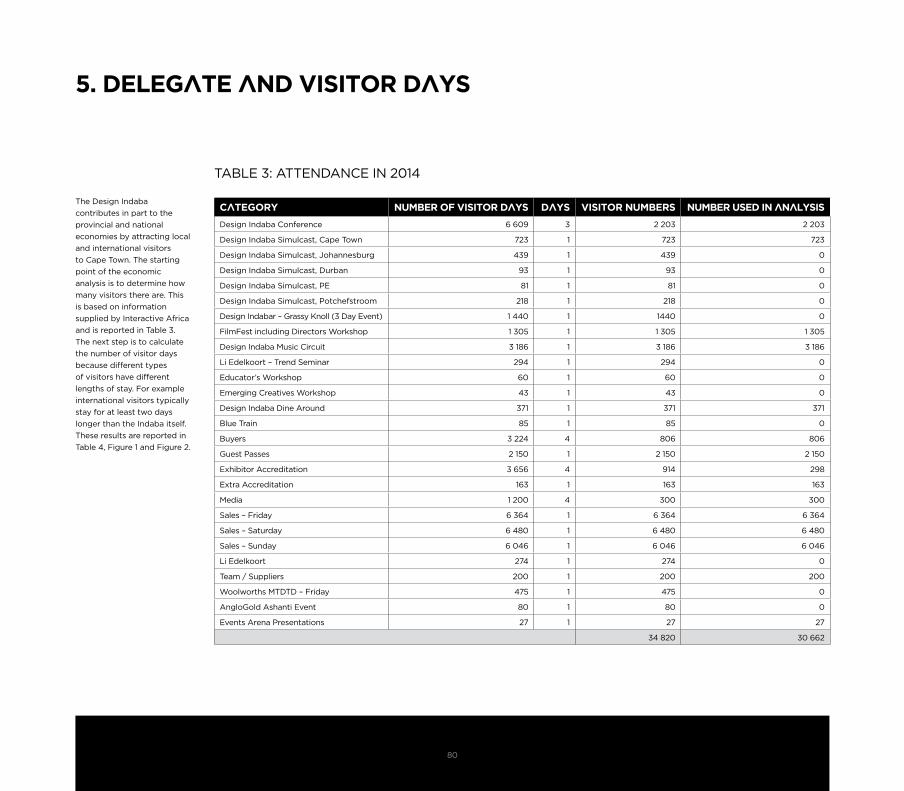
80
5. DelegaTe anD visiTOR Days
The Design Indaba contributes in part to the provincial and national economies by attracting local and international visitors to Cape Town. The starting point of the economic analysis is to determine how many visitors there are. This is based on information supplied by Interactive Africa and is reported in Table 3. The next step is to calculate the number of visitor days because different types of visitors have different lengths of stay. for example international visitors typically stay for at least two days longer than the Indaba itself. These results are reported in Table 4, figure 1 and figure 2.
CaTegORy numbeR Of visiTOR Days Days visiTOR numbeRs numbeR useD in analysis
Design Indaba Conference 6 609 3 2 203 2 203
Design Indaba Simulcast, Cape Town 723 1 723 723
Design Indaba Simulcast, Johannesburg 439 1 439 0
Design Indaba Simulcast, Durban 93 1 93 0
Design Indaba Simulcast, PE 81 1 81 0
Design Indaba Simulcast, Potchefstroom 218 1 218 0
Design Indabar – Grassy Knoll (3 Day Event) 1 440 1 1440 0
filmfest including Directors Workshop 1 305 1 1 305 1 305
Design Indaba Music Circuit 3 186 1 3 186 3 186
Li Edelkoort – Trend Seminar 294 1 294 0
Educator’s Workshop 60 1 60 0
Emerging Creatives Workshop 43 1 43 0
Design Indaba Dine Around 371 1 371 371
Blue Train 85 1 85 0
Buyers 3 224 4 806 806
Guest Passes 2 150 1 2 150 2 150
Exhibitor Accreditation 3 656 4 914 298
Extra Accreditation 163 1 163 163
Media 1 200 4 300 300
Sales – friday 6 364 1 6 364 6 364
Sales – Saturday 6 480 1 6 480 6 480
Sales – Sunday 6 046 1 6 046 6 046
Li Edelkoort 274 1 274 0
Team / Suppliers 200 1 200 200
Woolworths MTDTD – friday 475 1 475 0
AngloGold Ashanti Event 80 1 80 0
Events Arena Presentations 27 1 27 27
34 820 30 662
TABLE 3: ATTEnDAnCE In 2014
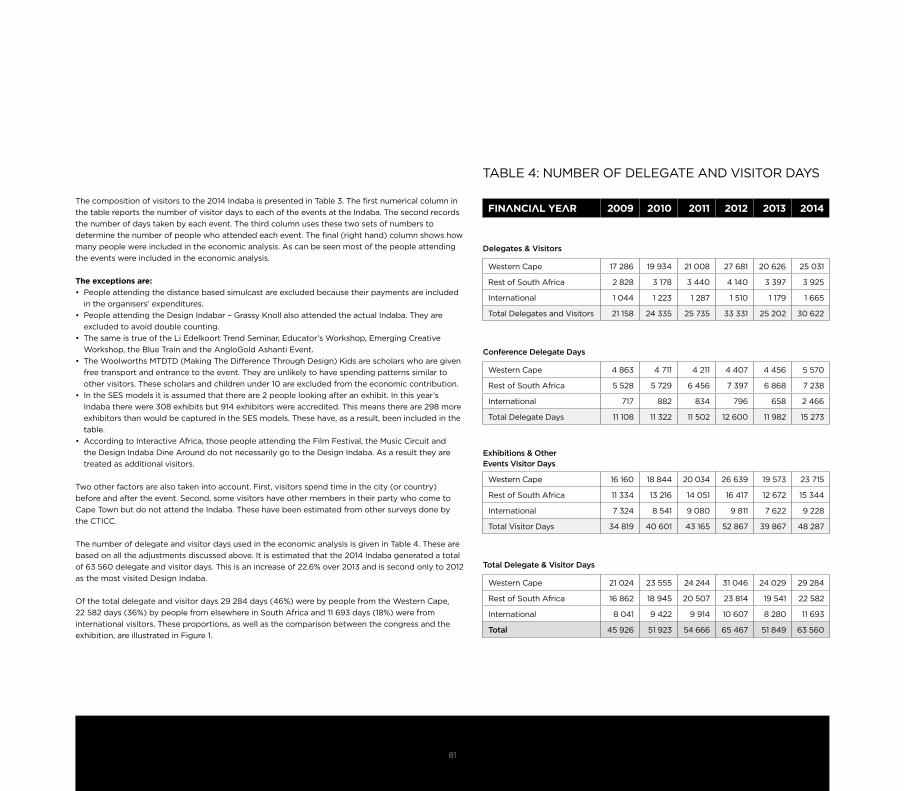
81
finanCial yeaR 2009 2010 2011 2012 2013 2014
Delegates & Visitors
Western Cape 17 286 19 934 21 008 27 681 20 626 25 031
Rest of South Africa 2 828 3 178 3 440 4 140 3 397 3 925
International 1 044 1 223 1 287 1 510 1 179 1 665
Total Delegates and Visitors 21 158 24 335 25 735 33 331 25 202 30 622
Conference Delegate Days
Western Cape 4 863 4 711 4 211 4 407 4 456 5 570
Rest of South Africa 5 528 5 729 6 456 7 397 6 868 7 238
International 717 882 834 796 658 2 466
Total Delegate Days 11 108 11 322 11 502 12 600 11 982 15 273
Exhibitions & Other Events Visitor Days
Western Cape 16 160 18 844 20 034 26 639 19 573 23 715
Rest of South Africa 11 334 13 216 14 051 16 417 12 672 15 344
International 7 324 8 541 9 080 9 811 7 622 9 228
Total Visitor Days 34 819 40 601 43 165 52 867 39 867 48 287
Total Delegate & Visitor Days
Western Cape 21 024 23 555 24 244 31 046 24 029 29 284
Rest of South Africa 16 862 18 945 20 507 23 814 19 541 22 582
International 8 041 9 422 9 914 10 607 8 280 11 693
Total 45 926 51 923 54 666 65 467 51 849 63 560
TABLE 4: nUMBER of DELEGATE AnD VISIToR DAYS
The composition of visitors to the 2014 Indaba is presented in Table 3. The first numerical column in the table reports the number of visitor days to each of the events at the Indaba. The second records the number of days taken by each event. The third column uses these two sets of numbers to determine the number of people who attended each event. The final (right hand) column shows how many people were included in the economic analysis. As can be seen most of the people attending the events were included in the economic analysis.
The exceptions are:• People attending the distance based simulcast are excluded because their payments are included
in the organisers’ expenditures. • People attending the Design Indabar – Grassy Knoll also attended the actual Indaba. They are
excluded to avoid double counting. • The same is true of the Li Edelkoort Trend Seminar, Educator’s Workshop, Emerging Creative
Workshop, the Blue Train and the AngloGold Ashanti Event. • The Woolworths MTDTD (Making The Difference Through Design) Kids are scholars who are given
free transport and entrance to the event. They are unlikely to have spending patterns similar to other visitors. These scholars and children under 10 are excluded from the economic contribution.
• In the SES models it is assumed that there are 2 people looking after an exhibit. In this year’s Indaba there were 308 exhibits but 914 exhibitors were accredited. This means there are 298 more exhibitors than would be captured in the SES models. These have, as a result, been included in the table.
• According to Interactive Africa, those people attending the Film Festival, the Music Circuit and the Design Indaba Dine Around do not necessarily go to the Design Indaba. As a result they are treated as additional visitors.
Two other factors are also taken into account. first, visitors spend time in the city (or country) before and after the event. Second, some visitors have other members in their party who come to Cape Town but do not attend the Indaba. These have been estimated from other surveys done by the CTICC.
The number of delegate and visitor days used in the economic analysis is given in Table 4. These are based on all the adjustments discussed above. It is estimated that the 2014 Indaba generated a total of 63 560 delegate and visitor days. This is an increase of 22.6% over 2013 and is second only to 2012 as the most visited Design Indaba.
of the total delegate and visitor days 29 284 days (46%) were by people from the Western Cape, 22 582 days (36%) by people from elsewhere in South Africa and 11 693 days (18%) were from international visitors. These proportions, as well as the comparison between the congress and the exhibition, are illustrated in figure 1.
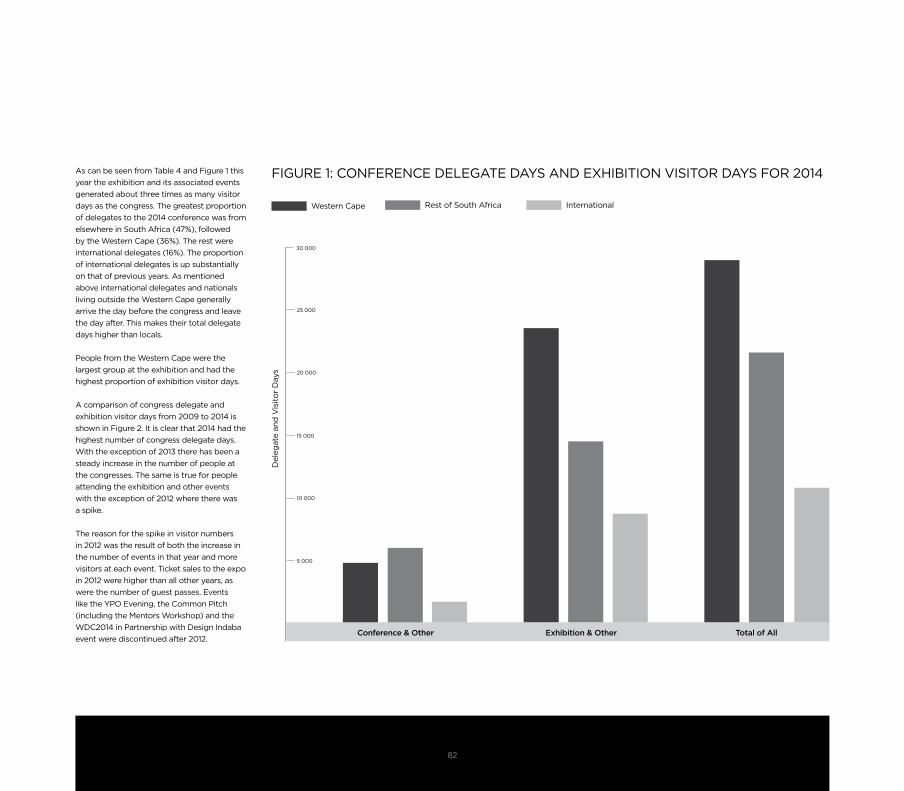
82
As can be seen from Table 4 and figure 1 this year the exhibition and its associated events generated about three times as many visitor days as the congress. The greatest proportion of delegates to the 2014 conference was from elsewhere in South Africa (47%), followed by the Western Cape (36%). The rest were international delegates (16%). The proportion of international delegates is up substantially on that of previous years. As mentioned above international delegates and nationals living outside the Western Cape generally arrive the day before the congress and leave the day after. This makes their total delegate days higher than locals.
People from the Western Cape were the largest group at the exhibition and had the highest proportion of exhibition visitor days.
A comparison of congress delegate and exhibition visitor days from 2009 to 2014 is shown in figure 2. It is clear that 2014 had the highest number of congress delegate days. With the exception of 2013 there has been a steady increase in the number of people at the congresses. The same is true for people attending the exhibition and other events with the exception of 2012 where there was a spike.
The reason for the spike in visitor numbers in 2012 was the result of both the increase in the number of events in that year and more visitors at each event. Ticket sales to the expo in 2012 were higher than all other years, as were the number of guest passes. Events like the YPo Evening, the Common Pitch (including the Mentors Workshop) and the WDC2014 in Partnership with Design Indaba event were discontinued after 2012.
fIGURE 1: ConfEREnCE DELEGATE DAYS AnD ExHIBITIon VISIToR DAYS foR 2014
5 000
10 000
15 000
20 000
25 000
30 000
Del
egat
e an
d V
isito
r D
ays
Western Cape Rest of South Africa International
Conference & Other Exhibition & Other Total of All
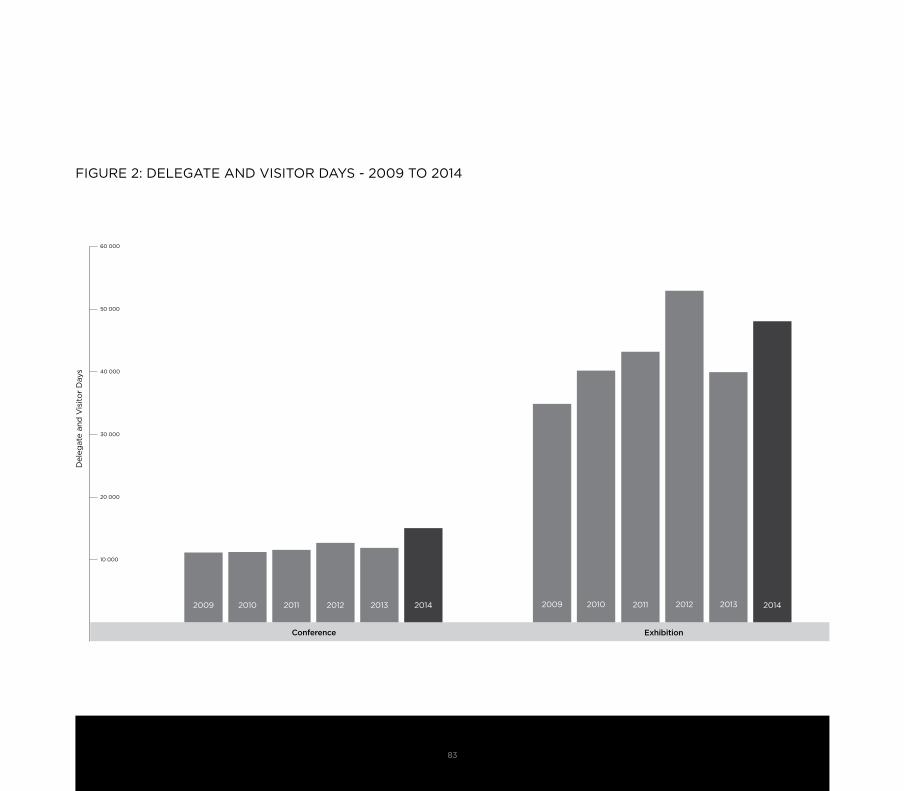
83
fIGURE 2: DELEGATE AnD VISIToR DAYS - 2009 To 2014
60 000
50 000
40 000
30 000
20 000
10 000
Del
egat
e an
d V
isito
r D
ays
Conference Exhibition
2009 2010 2011 2012 2013 2014 20142009 2010 2011 2012 2013
84
6. OveRall maCROeCOnOmiC COnTRibuTiOn Of The Design inDaba
While there are a number of different types of macroeconomic effects, the two most important are contribution to gross domestic product (GDP) and creation of jobs. The importance of job creation is obvious. Increases in GDP are synonymous with increases in peoples’ economic standards of living. Increased GDP – i.e. increased production – is experienced in the form of more jobs, higher wages and reduced economic hardship. It is clearly an important measure.
The effects of any project on the size of the GDP arise as a result of the myriad ways in which businesses, public service providers and ordinary people find their normal daily activities affected, hopefully for the better, by the changes brought about by the project.
The actual task of calculating the macroeconomic impact of the Indaba demands a detailed and multifaceted approach not least because of the so-called multiplier effects. It is well recognised that the simple act of spending – hosting an exhibition, for example, - leads to other economic effects. Demand for building supplies to construct exhibition stands can lead to increased production in those industries. Increased demand for steel and wood, in turn, leads to increased demand for mining output which uses wood, water, electricity and so on. These are the so-called multiplier effects.
While this process unfolds, each industry employs more people and pays more wages. Employees, in turn, spend their wages and cause further multiplier effects through the economy. Measuring this is further complicated by the fact that different industries demand different types of skills. This leads to different wage structures across the various industries. People at different income levels have different spending patterns. Thus, the change in overall spending patterns is dependent on which industries are affected.
Input-output analysis was used for the measurement of the macroeconomic impact of the Design Indaba. This approach demands that all expenditure in and around the event be identified and estimated. This expenditure, in turn, needs to be linked to the Standard Industrial Classification of all Economic Activity (SIC codes). In addition, if employment is part of the expenditure then estimates must be made of the likely items of expenditure as a result of wage payments.
The eXPenDiTuRe aReas ThaT WeRe iDenTifieD aRe:
• Spending by Interactive Africa, the organizers of the Design Indaba. This includes the travel costs of the speakers at the conference and what is termed “in-kind” costs. In-kind costs are budget-relieving costs to the organisers that are received on a value exchange basis;
• Spending by exhibitors at the Indaba, as well as travel costs and accommodation on expenditure by people who live outside Cape Town;
• Spending by convention delegates and exhibition visitors on hotels, travel, gifts, etc.;• The impact of business orders from buyers who attended the Indaba.• Purchases by members of the public.
five sTePs aRe ReQuiReD TO measuRe The OveRall eCOnOmiC imPaCT Of
The inDaba.
• First, to identify appropriate costs. These costs are based on surveys of events staged at the CTICC as well as information supplied by the hosts and organisers.
• Second, to determine the relative proportions of profit, labour, plant and material for each cost line item.
• Third, to assign each item of material and plant to the appropriate SIC code.• Fourth, to decompose labour and profit into income categories and apportion the total
wages and profits to each income category. following this, estimates of expenditure patterns by income category are used to determine total spending patterns.
• Finally, all the SIC coded items are brought together. The total multiplier effect is calculated as the aggregate product SIC coded spending on plant and material, as well as SIC coded spending by workers multiplied through the national multipliers. The national multipliers are calculated using the South African input output tables.
As a result the macroeconomic estimates relate directly to the actual cost of hosting the Design Indaba congress and exhibition, as well as the spending by delegates and visitors to the events and the business orders placed by buyers attending the exhibition. Included in the macroeconomic calculations are all the backward economic linkages for the event and the forward economic linkages where, for example, workers spend their salaries. not included in the economic analysis are those costs that are incurred by Interactive Africa, the organisers of Design Indaba, throughout the year while indirectly promoting the events. Such costs would include their website development, the sponsoring of community projects, the salaries and wages of their staff and other office running expenses. These projects and costs all help to raise the awareness of not only the Design Indaba but also the design industry.
Direct jobs are calculated with the use of a Social Accounting Matrix (SAM) for South Africa. from the SAM both the average salary that is paid in any one sector and the proportion of salaries to overall turnover in that sector are known. Direct jobs can then be calculated based on the spending that occurs in each economic sector as a result of the Indaba.Indirect jobs are determined following a similar process described above by making use of input output multipliers.

85
6.1 COnTRibuTiOn TO gROss DOmesTiC PRODuCT
Gross Domestic Product is the total value of all final goods and services produced in the country. It is clearly fundamental to the economic quality of life of people in the country. It is also the most important and all-encompassing measure of the macroeconomic effect of the Indaba.
Table 5 and figure 3 report on the contribution to GDP. Total contribution to GDP has increased each year from R191.9m in 2009 to R385.2m in 2014.
The COnTRibuTiOn TO gDP in 2014 is maDe uP Of:
• Host / Organiser expenditure of R78.7m. This is an increase on the R69.5m from 2013. • Exhibitor expenditure of R12.2m which is up from R11.3m in 2013.• Delegate expenditure of R92.3m. This is an increase on the R64.8m in 2013 and also on the
R76.2m of 2012. This increase is due to two factors. first, there were more visitors than in 2013. Second, the exhibitor survey found that sales to the public were substantially higher than previous years.
• Business orders of R201.9m, which is also up from R184.2m in 2013.• GDP is important not just because it is income but also because income has the capacity
to add to wealth. Based on these estimates the Design Indaba has made a cumulative contribution to GDP in excess of R1.7bn over the last six years.
• Also shown in Table 5 is the contribution to GDP of the 2014 Design Indaba expressed in 2009 values. This shows that while there has been a 16.8% increase in nominal GDP over 2013, there is also an increase in real terms (when the effect of inflation is removed). The real contribution to GDP, at R298.3m, is 10.2% higher than the R270.7m in 2013.
finanCial yeaR 2009 2010 2011 2012 2013 2014
Host / organiser Expenditure 28.1 45.2 51.3 60.2 69.5 78.7
Exhibitor Expenditure 5.1 9.1 9.3 9.5 11.3 12.2
Delegate Expenditure 45.5 54.7 59.6 76.2 64.8 92.3
Business orders 113.1 123.0 141.3 180.9 184.2 201.9
Total Contribution 191.9 232.0 261.5 326.9 329.8 385.2
Cumulative Contribution 191.9 423.8 685.3 1 012.2 1 342.0 1 727.2
Real GDP (2009 Values) 191.9 218.8 238.5 283.9 270.7 298.3
TABLE 5: ConTRIBUTIon To THE GDP
Gross Domestic Product – South Africa (Rand Million, Nominal Prices)
The comparative relative nominal contribution to GDP of each of the expenditure items over the last six years is illustrated in figure 3.
There has been a general increase in trend for all categories of expenditure. notable increases are in delegate expenditure and business orders.
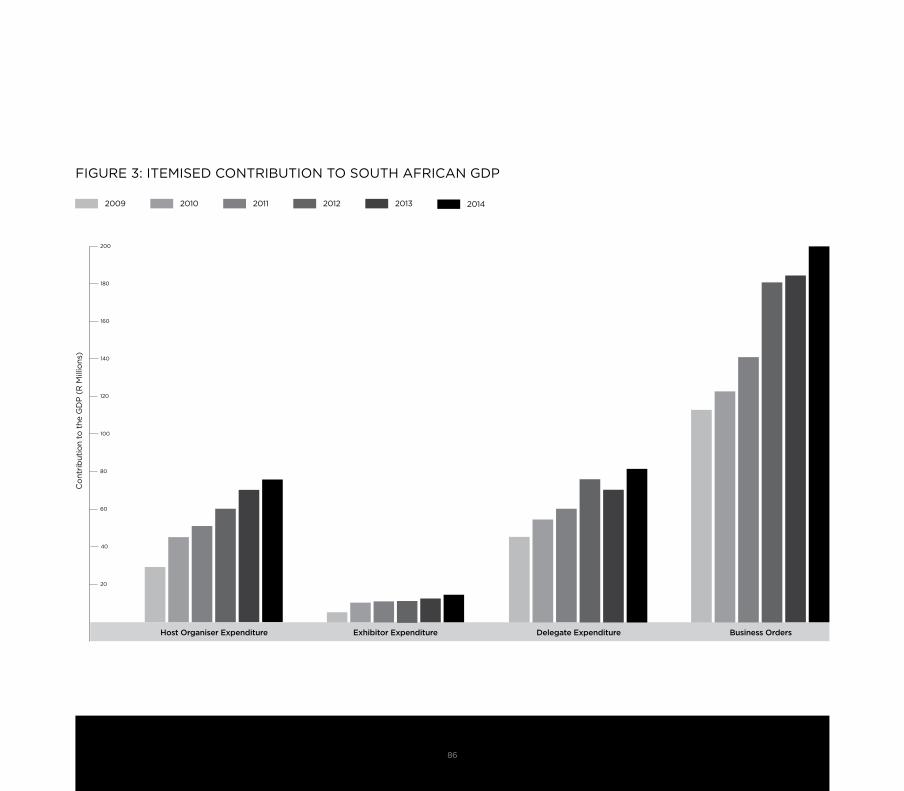
86
20
40
60
80
100
120
140
160
180
200
Co
ntri
but
ion
to t
he G
DP
(R
Mill
ions
)
Host Organiser Expenditure Exhibitor Expenditure Delegate Expenditure Business Orders
fIGURE 3: ITEMISED ConTRIBUTIon To SoUTH AfRICAn GDP
2009 2010 2011 2012 2013 2014
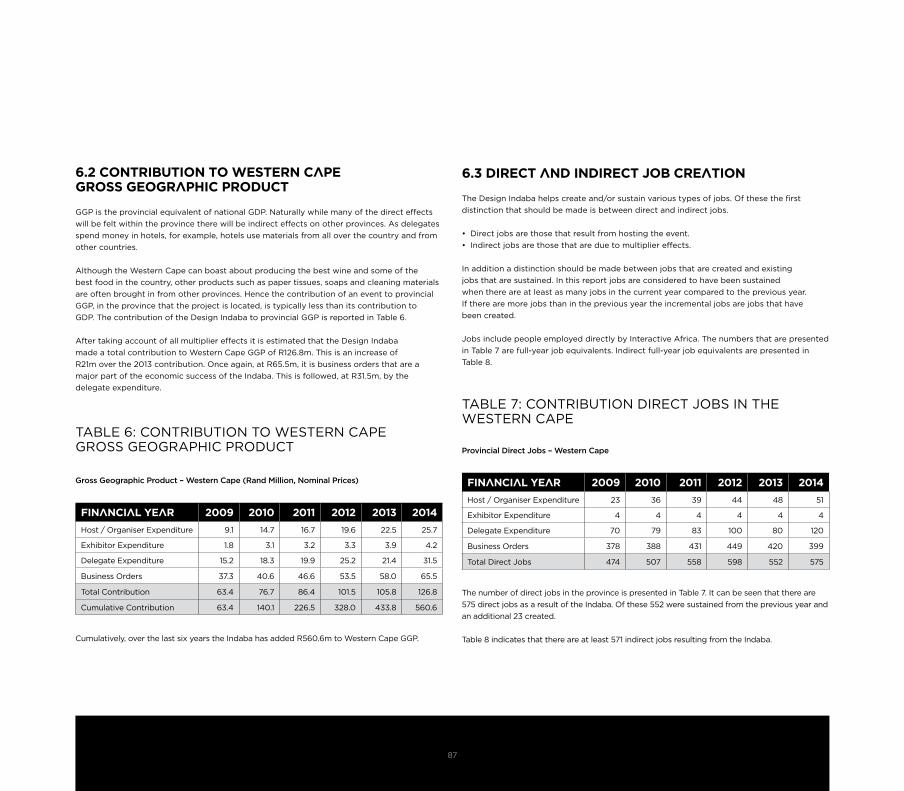
87
6.2 COnTRibuTiOn TO WesTeRn CaPe gROss geOgRaPhiC PRODuCT
GGP is the provincial equivalent of national GDP. naturally while many of the direct effects will be felt within the province there will be indirect effects on other provinces. As delegates spend money in hotels, for example, hotels use materials from all over the country and from other countries.
Although the Western Cape can boast about producing the best wine and some of the best food in the country, other products such as paper tissues, soaps and cleaning materials are often brought in from other provinces. Hence the contribution of an event to provincial GGP, in the province that the project is located, is typically less than its contribution to GDP. The contribution of the Design Indaba to provincial GGP is reported in Table 6.
After taking account of all multiplier effects it is estimated that the Design Indaba made a total contribution to Western Cape GGP of R126.8m. This is an increase of R21m over the 2013 contribution. once again, at R65.5m, it is business orders that are a major part of the economic success of the Indaba. This is followed, at R31.5m, by the delegate expenditure.
TABLE 6: ConTRIBUTIon To WESTERn CAPE GRoSS GEoGRAPHIC PRoDUCT
6.3 DiReCT anD inDiReCT jOb CReaTiOn
The Design Indaba helps create and/or sustain various types of jobs. of these the first distinction that should be made is between direct and indirect jobs.
• Direct jobs are those that result from hosting the event. • Indirect jobs are those that are due to multiplier effects.
In addition a distinction should be made between jobs that are created and existing jobs that are sustained. In this report jobs are considered to have been sustained when there are at least as many jobs in the current year compared to the previous year. If there are more jobs than in the previous year the incremental jobs are jobs that have been created.
Jobs include people employed directly by Interactive Africa. The numbers that are presented in Table 7 are full-year job equivalents. Indirect full-year job equivalents are presented in Table 8.
TABLE 7: ConTRIBUTIon DIRECT JoBS In THE WESTERn CAPE
finanCial yeaR 2009 2010 2011 2012 2013 2014
Host / organiser Expenditure 9.1 14.7 16.7 19.6 22.5 25.7
Exhibitor Expenditure 1.8 3.1 3.2 3.3 3.9 4.2
Delegate Expenditure 15.2 18.3 19.9 25.2 21.4 31.5
Business orders 37.3 40.6 46.6 53.5 58.0 65.5
Total Contribution 63.4 76.7 86.4 101.5 105.8 126.8
Cumulative Contribution 63.4 140.1 226.5 328.0 433.8 560.6
finanCial yeaR 2009 2010 2011 2012 2013 2014
Host / organiser Expenditure 23 36 39 44 48 51
Exhibitor Expenditure 4 4 4 4 4 4
Delegate Expenditure 70 79 83 100 80 120
Business orders 378 388 431 449 420 399
Total Direct Jobs 474 507 558 598 552 575
Gross Geographic Product – Western Cape (Rand Million, Nominal Prices)
Provincial Direct Jobs – Western Cape
Cumulatively, over the last six years the Indaba has added R560.6m to Western Cape GGP.
The number of direct jobs in the province is presented in Table 7. It can be seen that there are 575 direct jobs as a result of the Indaba. of these 552 were sustained from the previous year and an additional 23 created.
Table 8 indicates that there are at least 571 indirect jobs resulting from the Indaba.
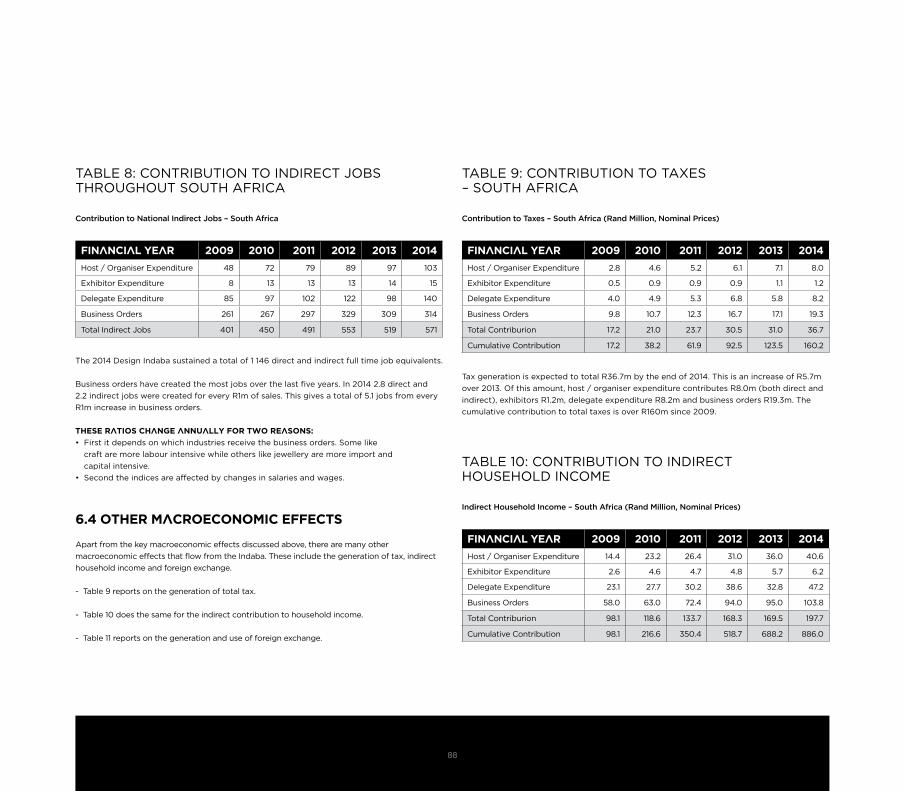
88
TABLE 8: ConTRIBUTIon To InDIRECT JoBS THRoUGHoUT SoUTH AfRICA
TABLE 9: ConTRIBUTIon To TAxES – SoUTH AfRICA
TABLE 10: ConTRIBUTIon To InDIRECT HoUSEHoLD InCoME
finanCial yeaR 2009 2010 2011 2012 2013 2014
Host / organiser Expenditure 48 72 79 89 97 103
Exhibitor Expenditure 8 13 13 13 14 15
Delegate Expenditure 85 97 102 122 98 140
Business orders 261 267 297 329 309 314
Total Indirect Jobs 401 450 491 553 519 571
finanCial yeaR 2009 2010 2011 2012 2013 2014
Host / organiser Expenditure 2.8 4.6 5.2 6.1 7.1 8.0
Exhibitor Expenditure 0.5 0.9 0.9 0.9 1.1 1.2
Delegate Expenditure 4.0 4.9 5.3 6.8 5.8 8.2
Business orders 9.8 10.7 12.3 16.7 17.1 19.3
Total Contriburion 17.2 21.0 23.7 30.5 31.0 36.7
Cumulative Contribution 17.2 38.2 61.9 92.5 123.5 160.2
finanCial yeaR 2009 2010 2011 2012 2013 2014
Host / organiser Expenditure 14.4 23.2 26.4 31.0 36.0 40.6
Exhibitor Expenditure 2.6 4.6 4.7 4.8 5.7 6.2
Delegate Expenditure 23.1 27.7 30.2 38.6 32.8 47.2
Business orders 58.0 63.0 72.4 94.0 95.0 103.8
Total Contriburion 98.1 118.6 133.7 168.3 169.5 197.7
Cumulative Contribution 98.1 216.6 350.4 518.7 688.2 886.0
Contribution to National Indirect Jobs – South Africa Contribution to Taxes – South Africa (Rand Million, Nominal Prices)
Indirect Household Income – South Africa (Rand Million, Nominal Prices)
The 2014 Design Indaba sustained a total of 1 146 direct and indirect full time job equivalents.
Business orders have created the most jobs over the last five years. In 2014 2.8 direct and 2.2 indirect jobs were created for every R1m of sales. This gives a total of 5.1 jobs from every R1m increase in business orders.
These RaTiOs Change annually fOR TWO ReasOns:
• First it depends on which industries receive the business orders. Some like craft are more labour intensive while others like jewellery are more import and capital intensive.
• Second the indices are affected by changes in salaries and wages.
6.4 OTheR maCROeCOnOmiC effeCTs
Apart from the key macroeconomic effects discussed above, there are many other macroeconomic effects that flow from the Indaba. These include the generation of tax, indirect household income and foreign exchange.
- Table 9 reports on the generation of total tax.
- Table 10 does the same for the indirect contribution to household income.
- Table 11 reports on the generation and use of foreign exchange.
Tax generation is expected to total R36.7m by the end of 2014. This is an increase of R5.7m over 2013. of this amount, host / organiser expenditure contributes R8.0m (both direct and indirect), exhibitors R1.2m, delegate expenditure R8.2m and business orders R19.3m. The cumulative contribution to total taxes is over R160m since 2009.

89
TABLE 11: GEnERATIon AnD USE of foREIGn ExCHAnGE
Foreign Exchange Earnings – South Africa (Rand Million, Nominal Prices)
Indirect household income, shown in Table 10, is set to increase by R197.7m compared to R169.5m in 2013. Cumulative household incomes have increased by R886m since 2009.
Countries like South Africa with a dangerously large current account deficit need to make every effort to generate foreign exchange. The Design Indaba makes a positive contribution to this effort. The inflow of foreign exchange comes mainly from two sources. The first is from the spending of international delegates and visitors. The second is from overseas business orders. furthermore, though, international exhibitors also bring in foreign exchange while in the country, albeit to a lesser extent.
These inflows are offset to some extent by direct and indirect imports. Direct imports are those that are needed for the hosting of the event and the import component of some of the merchandise on show. They would also include purchases by the general public and business orders from the international exhibitors, who account for approximately 13% of all exhibitors.
Indirect imports are the result of the multiplier effect. for example an order that is placed with a fabric design company might result in increased salaries in that company. The increased salaries might then be used to purchase imported clothing or shoes. Table 11 reports on the generation and use of foreign exchange.
The staging of the 2014 Design Indaba, including the indirect effects and the business orders that are generated, is expected to have used foreign exchange to the value of R83.1m. At the same time it is estimated that international exhibitors brought in R1.7m into the country and international delegates R16.3m just by attending the events. It is expected that the 2014 Indaba will generate R66.3m in international business orders. Total foreign exchange earnings are therefore R84.2m.
This means that the Design Indaba in 2014 was a net generator of R1.1m in foreign exchange. This is higher than the estimated R1.0m net generation of foreign exchange in 2013. The cumulative total in foreign exchange since 2009 is R17.5m.
finanCial yeaR 2009 2010 2011 2012 2013 2014
Foreign Exchange Earnings
International Exhibitors 0.0 0.0 0.0 0.0 0.0 1.7
International Delegate Spend 8.3 10.4 10.6 10.5 8.8 16.3
Business orders 40.0 34.8 43.7 56.9 60.7 66.3
Total forex Earnings 48.3 45.2 54.3 67.4 69.5 84.2
Foreign Exchange Use
Host / organiser Expenditure 4.6 7.3 8.3 9.7 11.3 12.6
Exhibitor Expenditure 0.8 1.4 1.4 1.5 1.7 1.9
All Delegates Expenditure 7.5 9.0 9.8 12.5 10.6 17.4
Business orders 24.9 27.1 31.1 43.0 44.9 51.2
Total Imports 37.7 44.8 50.6 66.7 68.5 83.1
net forex Earnings 10.6 0.4 3.8 0.7 1.0 1.1
Cumulative Contribution 10.6 11.0 14.8 15.4 16.4 17.5

MEdIA pARTNERS ZAR 1 000 000
MEdIA SuppoRTERS ZAR 300 000
oFFICIAl SpoNSoRS
ZAR 2 500 000
SupplIERSZAR 1 250 000
ASSoCIATESZAR 300 000
dEvElopMENTAl pARTNERS
ZAR 1 500 000

2015 sPOnsORshiPbRanDing RighTs

OffiCial sPOnsORs
BRANdING RIGHTS• Industry exclusivity in core business sector• Sponsor statement in Conference programme• Ten-second animation on Conference and Expo stage
screens• Direct marketing opportunity to delegates and media
(inserts, seat drops, promotional swag)*• Full branding rights and logo on all Design Indaba event
collateral and event branding• 9 square metres of floor space to activate at Conference or
Expo (additional space available at discounted rates)• Additional tickets to Design Indaba Conference at a
discounted rate• Receive an official activation video crafted with the main
sponsor’s team
dESIGN INdABA dIGITAl RIGHTS• Banner ad on designindaba.com content pages
(1 January – 28 february in rotation with other main sponsors)
• Sponsor statement on designindaba.com event pages• Profile, logo and hotlink on designindaba.com – all Event
releated pages (1 January – 31 December)• Logo and hotlink on Design Indaba event specific
newsletters (1/month minimum)• 1x advertorial on designindaba.com• 1x standalone activation story for sponsored content on
designindaba.com• 4x dedicated Tweets and 4x dedicated Facebook posts on
Design Indaba Social Media• 20% discount on all designindaba.com rate card items• Through the year opportunities for sponsors on
designindaba.com at discounted rates (sponsored content, advertorials, underwriting, content series, newsletters, etc.)
NETWoRKING ANd TICKET AlloCATIoN• Networking access to all international speakers through
official Design Indaba events**• Invitation to the first official Design Indaba function (should
a main principle want to address the speakers and media, they would be invited to at this gathering)
• Opportunity to host a Design Indaba Dine-Around*• 10x tickets to Design Indaba Conference• 5x tickets to Design Indaba Simulcast in either (CPT, JHB,
DBn, PE or PoTCH)• 50x tickets to Design Indaba Expo• Tickets to all Design Indaba social events (number of
tickets are related to scope and size of the event)• Access to Design Indaba Clubhouse
lEvERAGING oppoRTuNITIES*• First option on all Design Indaba associated projects and
activation opportunities• First right of refusal on leveraging opportunities• Opportunity to host Design Indaba speakers, sponsors and
media partners at an official Design Indaba function
DevelOPmenTal PaRTneRs
BRANdING RIGHTS• Sponsor statement in Conference programme• Direct marketing opportunity to delegates and media
(inserts, seat drops, promotional swag)*• Full branding rights and logo on all Design Indaba event
collateral and event branding• 9 square metres of floor space to activate at Conference or
Expo (additional space available at discounted rates)• Additional tickets to Design Indaba Conference at a
discounted rate• Receive an official activation video crafted with the main
sponsor’s team
dESIGN INdABA dIGITAl RIGHTS• Banner ad on designindaba.com content pages
(1 January – 28 february in rotation with other main sponsors)
• Sponsor statement on designindaba.com event pages• Profile, logo and hotlink on designindaba.com – all Event
releated pages (1 January – 31 December)• Logo and hotlink on Design Indaba event specific
newsletters (1/month minimum)• 1x standalone activation story for sponsored content on
designindaba.com• 2x dedicated Tweets and 2x dedicated Facebook posts on
Design Indaba Social Media• 20% discount on all designindaba.com rate card items• Through the year opportunities for sponsors on
designindaba.com at discounted rates (sponsored content, advertorials, underwriting, content series, newsletters, etc.)
NETWoRKING ANd TICKET AlloCATIoN• Networking access to all international speakers through
official Design Indaba events**• Invitation to the first official Design Indaba function (should
a main principle want to address the speakers and media, they would be invited to at this gathering)
• Opportunity to host a Design Indaba Dine-Around*• 10x tickets to Design Indaba Conference• 5x tickets to Design Indaba Simulcast in either (CPT, JHB,
DBn, PE or PoTCH)• 50x tickets to Design Indaba Expo• Tickets to Design Indaba social events (number of tickets
are related to scope and size of the event)• Access to Design Indaba Clubhouse
lEvERAGING oppoRTuNITIES*• First right of refusal on leveraging opportunities• Opportunity to host Design Indaba speakers, sponsors and
media partners at an official Design Indaba function
suPPlieRs
BRANdING RIGHTS• Category exclusivity • Direct marketing opportunity to delegates and media
(inserts, seat drops, promotional swag)*• Partial branding rights and logo on all Design Indaba event
collateral and event branding• 6 square metres of floor space to activate at Conference or
Expo (additional space available at discounted rates)• Additional tickets to Design Indaba Conference at a
discounted rate• Featured on Design Indaba official footage
dESIGN INdABA dIGITAl RIGHTS• Profile, logo and hotlink on designindaba.com – on Event
specific pages (1 January – 31 December)• Listing and hotlink on Design Indaba event specific
newsletters (1/month minimum)• 1x advertorial on designindaba.com• 2x dedicated Tweets and 2x dedicated Facebook posts on
Design Indaba Social Media• 10% discount on all designindaba.com rate card items• Through the year opportunities for sponsors on
designindaba.com at discounted rates (sponsored content, advertorials, underwriting, content series, newsletters, etc.)
NETWoRKING ANd TICKET AlloCATIoN• Networking access to all international speakers through
official Design Indaba events**• Invitation to the first official Design Indaba function• Opportunity to host a Design Indaba Dine-Around*• 5x tickets to Design Indaba Conference• 2x tickets to Design Indaba Simulcast in either (CPT, JHB,
DBn, PE or PoTCH)• 30x tickets to Design Indaba Expo• Tickets to selected Design Indaba social events (number of
tickets are related to scope and size of the event)
lEvERAGING oppoRTuNITIES*• Opportunity to host Design Indaba speakers, sponsors and
media partners at an official Design Indaba function
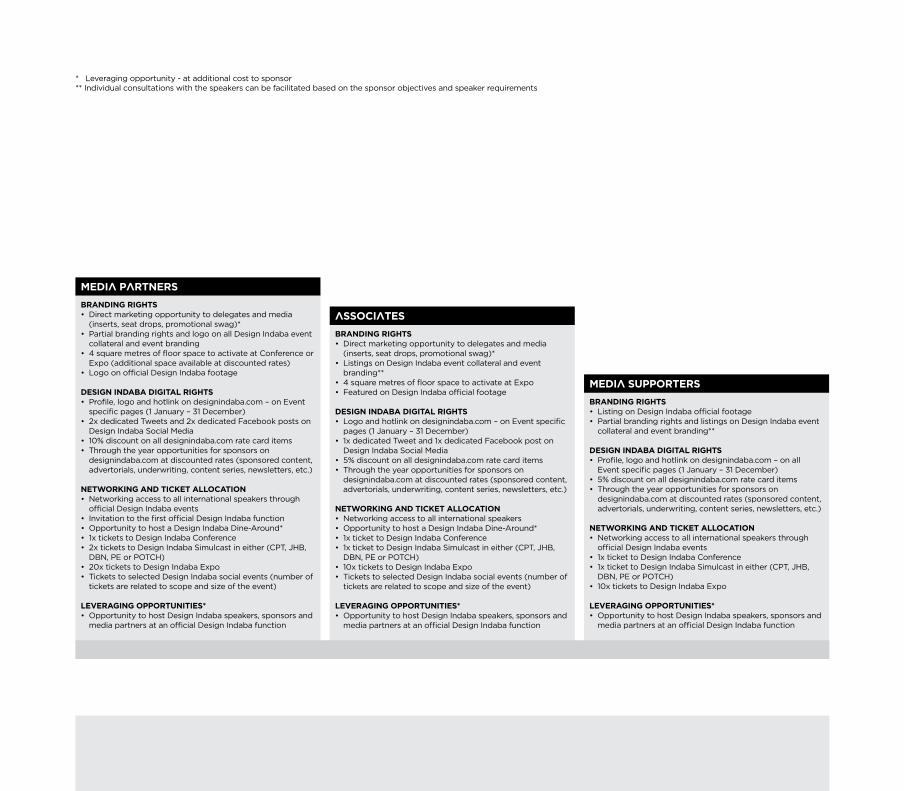
meDia PaRTneRs
BRANdING RIGHTS• Direct marketing opportunity to delegates and media
(inserts, seat drops, promotional swag)*• Partial branding rights and logo on all Design Indaba event
collateral and event branding• 4 square metres of floor space to activate at Conference or
Expo (additional space available at discounted rates)• Logo on official Design Indaba footage
dESIGN INdABA dIGITAl RIGHTS• Profile, logo and hotlink on designindaba.com – on Event
specific pages (1 January – 31 December)• 2x dedicated Tweets and 2x dedicated Facebook posts on
Design Indaba Social Media• 10% discount on all designindaba.com rate card items• Through the year opportunities for sponsors on
designindaba.com at discounted rates (sponsored content, advertorials, underwriting, content series, newsletters, etc.)
NETWoRKING ANd TICKET AlloCATIoN• Networking access to all international speakers through
official Design Indaba events • Invitation to the first official Design Indaba function• Opportunity to host a Design Indaba Dine-Around*• 1x tickets to Design Indaba Conference• 2x tickets to Design Indaba Simulcast in either (CPT, JHB,
DBn, PE or PoTCH)• 20x tickets to Design Indaba Expo• Tickets to selected Design Indaba social events (number of
tickets are related to scope and size of the event)
lEvERAGING oppoRTuNITIES*• Opportunity to host Design Indaba speakers, sponsors and
media partners at an official Design Indaba function
assOCiaTes
BRANdING RIGHTS• Direct marketing opportunity to delegates and media
(inserts, seat drops, promotional swag)*• Listings on Design Indaba event collateral and event
branding**• 4 square metres of floor space to activate at Expo• Featured on Design Indaba official footage
dESIGN INdABA dIGITAl RIGHTS• Logo and hotlink on designindaba.com – on Event specific
pages (1 January – 31 December)• 1x dedicated Tweet and 1x dedicated Facebook post on
Design Indaba Social Media• 5% discount on all designindaba.com rate card items• Through the year opportunities for sponsors on
designindaba.com at discounted rates (sponsored content, advertorials, underwriting, content series, newsletters, etc.)
NETWoRKING ANd TICKET AlloCATIoN• Networking access to all international speakers• Opportunity to host a Design Indaba Dine-Around*• 1x ticket to Design Indaba Conference• 1x ticket to Design Indaba Simulcast in either (CPT, JHB,
DBn, PE or PoTCH)• 10x tickets to Design Indaba Expo• Tickets to selected Design Indaba social events (number of
tickets are related to scope and size of the event)
lEvERAGING oppoRTuNITIES*• Opportunity to host Design Indaba speakers, sponsors and
media partners at an official Design Indaba function
meDia suPPORTeRs
BRANdING RIGHTS• Listing on Design Indaba official footage• Partial branding rights and listings on Design Indaba event
collateral and event branding**
dESIGN INdABA dIGITAl RIGHTS• Profile, logo and hotlink on designindaba.com – on all
Event specific pages (1 January – 31 December)• 5% discount on all designindaba.com rate card items• Through the year opportunities for sponsors on
designindaba.com at discounted rates (sponsored content, advertorials, underwriting, content series, newsletters, etc.)
NETWoRKING ANd TICKET AlloCATIoN• Networking access to all international speakers through
official Design Indaba events • 1x ticket to Design Indaba Conference• 1x ticket to Design Indaba Simulcast in either (CPT, JHB,
DBn, PE or PoTCH)• 10x tickets to Design Indaba Expo
lEvERAGING oppoRTuNITIES*• Opportunity to host Design Indaba speakers, sponsors and
media partners at an official Design Indaba function
* Leveraging opportunity - at additional cost to sponsor** Individual consultations with the speakers can be facilitated based on the sponsor objectives and speaker requirements
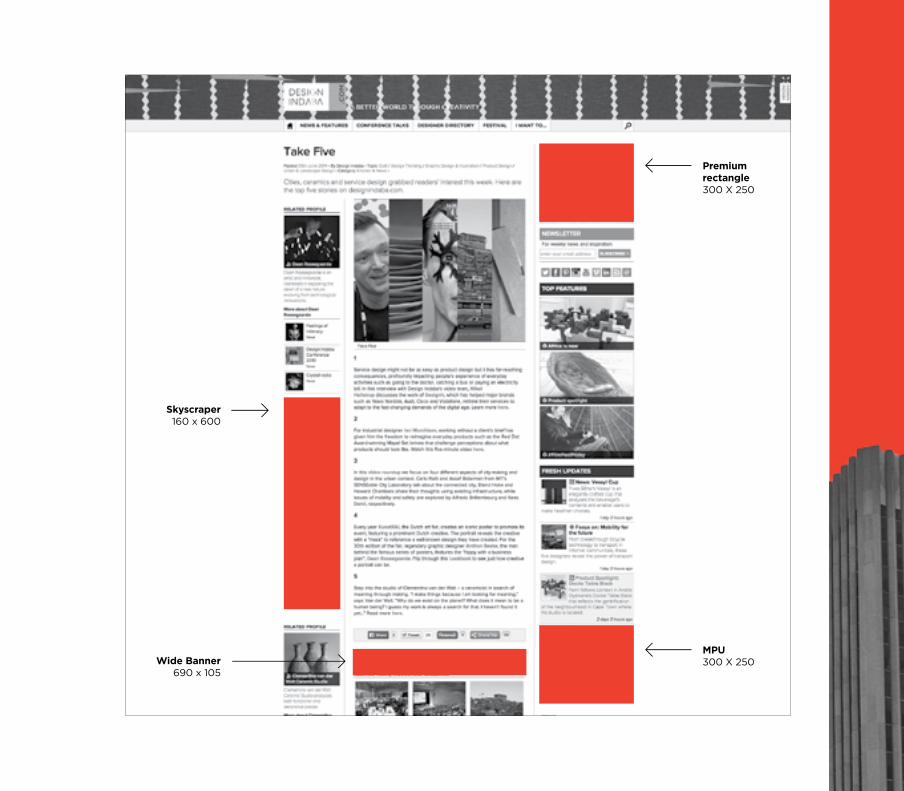
premium rectangle300 x 250
Skyscraper160 x 600
Wide Banner690 x 105
Mpu300 x 250

Design inDaba dIGITAl RATECARd
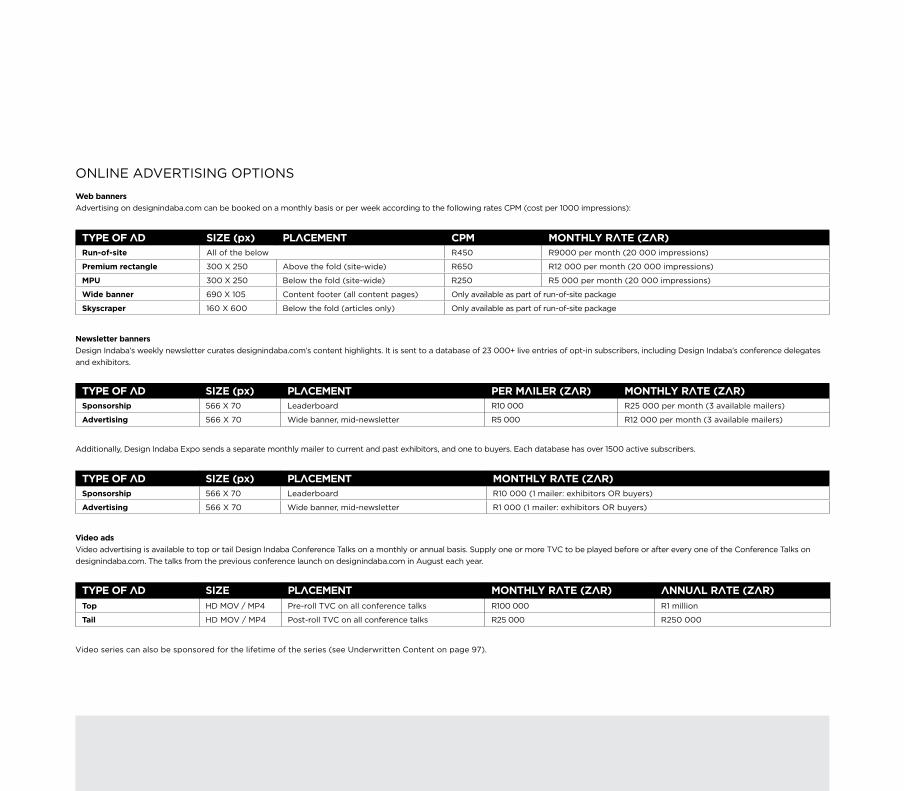
onLInE ADVERTISInG oPTIonS
Web bannersAdvertising on designindaba.com can be booked on a monthly basis or per week according to the following rates CPM (cost per 1000 impressions):
TyPe Of aD siZe (px) PlaCemenT CPm mOnThly RaTe (ZaR)Run-of-site All of the below R450 R9000 per month (20 000 impressions)
premium rectangle 300 x 250 Above the fold (site-wide) R650 R12 000 per month (20 000 impressions)
Mpu 300 x 250 Below the fold (site-wide) R250 R5 000 per month (20 000 impressions)
Wide banner 690 x 105 Content footer (all content pages) only available as part of run-of-site package
Skyscraper 160 x 600 Below the fold (articles only) only available as part of run-of-site package
Newsletter banners Design Indaba’s weekly newsletter curates designindaba.com’s content highlights. It is sent to a database of 23 000+ live entries of opt-in subscribers, including Design Indaba’s conference delegates and exhibitors.
TyPe Of aD siZe (px) PlaCemenT PeR maileR (ZaR) mOnThly RaTe (ZaR)Sponsorship 566 x 70 Leaderboard R10 000 R25 000 per month (3 available mailers)
Advertising 566 x 70 Wide banner, mid-newsletter R5 000 R12 000 per month (3 available mailers)
Additionally, Design Indaba Expo sends a separate monthly mailer to current and past exhibitors, and one to buyers. Each database has over 1500 active subscribers.
TyPe Of aD siZe (px) PlaCemenT mOnThly RaTe (ZaR)Sponsorship 566 x 70 Leaderboard R10 000 (1 mailer: exhibitors oR buyers)
Advertising 566 x 70 Wide banner, mid-newsletter R1 000 (1 mailer: exhibitors oR buyers)
TyPe Of aD siZe PlaCemenT mOnThly RaTe (ZaR) annual RaTe (ZaR)Top HD MoV / MP4 Pre-roll TVC on all conference talks R100 000 R1 million
Tail HD MoV / MP4 Post-roll TVC on all conference talks R25 000 R250 000
video adsVideo advertising is available to top or tail Design Indaba Conference Talks on a monthly or annual basis. Supply one or more TVC to be played before or after every one of the Conference Talks on designindaba.com. The talks from the previous conference launch on designindaba.com in August each year.
Video series can also be sponsored for the lifetime of the series (see Underwritten Content on page 97).

Masthead skindesignindaba.com’s masthead has a customisable skin. It includes a hotlink to sponsored content on designindaba.com. This site-wide feature at the top of the website has the highest click-through rate on the site. Because the masthead is responsive the skin cannot include text or logos (the skin resizes according to screen size). We can design you a custom skin that matches the identity of your campaign.
Rate: R20 000 per week or R60 000 per month (price includes 1 advertorial and 5 social media mentions)*
SPonSoRED ConTEnT
Editorial/video advertorialThis offering uses native advertising to promote your content on designindaba.com. Your story will be integrated into our home page feed, e-marketing and social media channels, extending your reach beyond our website visitors to include our expansive online network.
Rate: R9 500 per content item (includes 1 content item on designindaba.com, 1 newsletter feature and 5 social media mentions)
Articles: Maximum 1000 words and 10 large gallery imagesImages: To be supplied by the advertiser in jpeg, png, gif or tiff format (minimum width 960 px)Video: To be supplied by the advertiser in HD .mov or .mp4 format
underwritten contentContent marketing is the new advertising for brands that are driven by storytelling and choose to engage in dialogue with their customers or clients.
Underwritten content takes this strategy further by allowing brands to demonstrate their relevance as industry leaders beyond self-promotion. Brands aren’t buying broader exposure or messaging – they are buying an idea. Through affiliation with a series of content, the brand benefits from the “halo effect” – developing a relationship with that audience and growing the trust of potential customers.
designindaba.com offers sponsorships of video or editorial content – as a once-off, a series or a bespoke package.
Beyond having a presence on designindaba.com’s home page, all content is actively promoted in Design Indaba’s weekly and monthly newsletters and on all its social media channels. Video content is additionally featured on YouTube, Vimeo and in the Design Indaba App. The branding will appear for the lifetime of the content across all channels.
These and other tailored sponsorship packages are available on request. Please contact [email protected] to partner with us.
TyPe Of sPOnsORshiP RaTe (ZaR)once-off video R50 000
5-part video series R180 000
10-part video series R350 000
10-part article series R50 000
Package: 10 articles and one brand video R80 000
There are argumenTs boTh waYs: is iT more susTainable To use paper or digiTal TechnologY?
lynDa RelPh-knighT / Design inDaba 2009
