table of contents - azdeq.govlegacy.azdeq.gov/environ/waste/hazwaste/download/ptrl_narr.pdf ·...
TRANSCRIPT

Page i
TABLE OF CONTENTS
Volume 1 of 2
ADEQ Completeness/Technical Evaluation Checklist
Section 1 – RCRA Part A Application
Section 2 – Facility Description
Section 3 – Groundwater Monitoring
Section 4 – Procedures to Prevent Hazards
Section 5 – Contingency Plan
Section 6 – Post-Closure Plan
Section 7 – Other Federal Laws
Section 8 – Owner’s Certification
Section 9 – References
Tables
Table 1. Groundwater Monitoring Well Construction Summary
Table 2. Groundwater Elevations
Table 3. Soil Vapor Well Construction Summary
Table 4. Classes and Names of Pesticides in the Landfill
Table 5. Pesticide Properties
Table 6a. Background Groundwater Quality
Table 6b. Alert Levels for Proposed Parameters for MW-2
Table 6c. Alert Levels for Proposed Parameters for MW-3
Table 6d. Alert Levels for Proposed Parameters for MW-4
Table 6b. Alert Levels for Proposed Parameters for MW-5
Table 7. Alert Levels for VOCs, SVOCs, and Organochlorine Pesticides
Table 8. Proposed Thresholds for Additional Actions
Page ii
Figures
Figure 1. Topographic Map
Figure 2. Groundwater Flow Direction and Rate
Figure 3. Subsurface Conditions
Figure 4. 100 Year Flood Map
Figure 5. Survey Map
Figure 6a-6t. Concentration Trends at Soil Vapor Monitoring Points
Appendices
Appendix A – Construction Documentation Report for Final Cover System for Cells A and B
Appendix B – Post-Closure Period Expanded Groundwater Detection Monitoring Plan
Appendix C – Inventory of Typical Waste Materials Landfilled
Appendix D – Post-Closure Inspection and Maintenance Plan
Appendix E – Post-Closure Contingency Plan
Appendix F – Site Health and Safety Plan
Appendix G – Operation and Maintenance Manual, Soil Vapor Extraction System
Appendix H – Historical Groundwater Analytical Results
TABLE OF CONTENTS Volume 2 of 2
Appendix I – Summary of Soil Vapor and SVE System Analytical Data
Appendix J – Analytical Data for Soil
Appendix K – Human Health Risk Assessment
Appendix L – Development of Operational Parameters for SVE System
Appendix M – Certification of Closure
Appendix N – Post Closure Notices
Appendix O – Part A Permit Application 1997
Appendix P – Part A Permit Application 1984
Appendix Q – Training Plan
Appendix R – ADEQ 1995 Alert Level Guidance for Solid Waste Facilities
Appendix S – ADEQ Comments and Responses (located in full Administrative Record at ADEQ)


RCRA Part A Post Closure Permit Application
Page 1-1
SECTION 1 RCRA PART A POST CLOSURE PERMIT APPLICATION
1.1 INTRODUCTION
This section contains the RCRA Part A Post-Closure Permit Application for Page-Trowbridge Ranch (Page Ranch) landfill.


Facility Description
Page 2-1
SECTION 2 FACILITY DESCRIPTION
2.1 GENERAL DESCRIPTION
The Page Ranch Landfill is located in the Oracle/Oracle Junction area of Pinal County, Arizona, north of State Highway 77, approximately seven miles west of Oracle and 30 miles north of Tucson. Site location map is shown in Figure 1. Page Ranch is located in Township 9 South, Range 14 East, Gila and Salt River Base and Meridian, and includes the southern half of Section 27 and the northern half of Section 34.
The land to the north and northeast of the Page Ranch Landfill is owned by the State of Arizona and used as open range grazing land. The land to the north, northwest, and east is owned and used by the University of Arizona for agricultural research. The land to the southwest, south, and southeast of Page Ranch Landfill is owned by Robson Ranch Mountains, LLC, a developer, and used for residential development. Since the last permit application, approximately 103 homes and a clubhouse have been constructed in the Saddlebrooke Resort Community.
The University of Arizona (UA) used Page Ranch from 1962 to February 1, 1986 (with some isolated prior use) for disposal of low-level radioactive and chemical wastes generated by laboratories at the UA, Northern Arizona University, Arizona State University, and Veterans Hospital in Tucson. The Arizona Atomic Energy Commission [currently Arizona Radiation Regulatory Agency (ARRA)] oversaw and maintained the approval of disposed radioactive laboratory wastes.
Page Ranch Landfill site occupies a total of 3.25 acres and consists of two units: Unit A (northern unit, 200 feet by 200 feet) and Unit B (southern unit, 200 feet wide by 500 feet long). In both units, wastes were placed into individual cells (pits) that were approximately 15 feet deep. Disposal operations began at Unit B, which from early 1960's received and maintained approval from the Arizona Atomic Energy Commission for disposal of low-level radioactive laboratory wastes. Disposal of mixed wastes at Unit B started in late 1960's, and continued to 1986.
Chemical wastes disposal cells at Unit B were first utilized as open neutralization and burn pits; subsequently, they were used for direct burial of chemicals in one- and five gallon containers (bottles, cans, boxes, bags) and 55-gallon drums packed with adsorbent materials (lab-packs).
In 1982, Unit A, which was used only for disposal of chemical wastes, replaced Unit B for disposal of RCRA waste only. Unit A was designed and subsequently operated in accordance with the applicable RCRA standards for landfills. The disposal cells were individually double-lined with a chemically resistant synthetic liner. Wastes were received in sealed, 55-gallon drums (DOT 17Cl. These drums were placed into the cells in single layers, sealed with the plastic liner, and covered with soil.
From mid-1983, the quantity of materials disposed at the site was reduced due to the addition of the chemical waste incinerator and neutralization facilities at the UA campus. As a result, when
Facility Description
Page 2-2
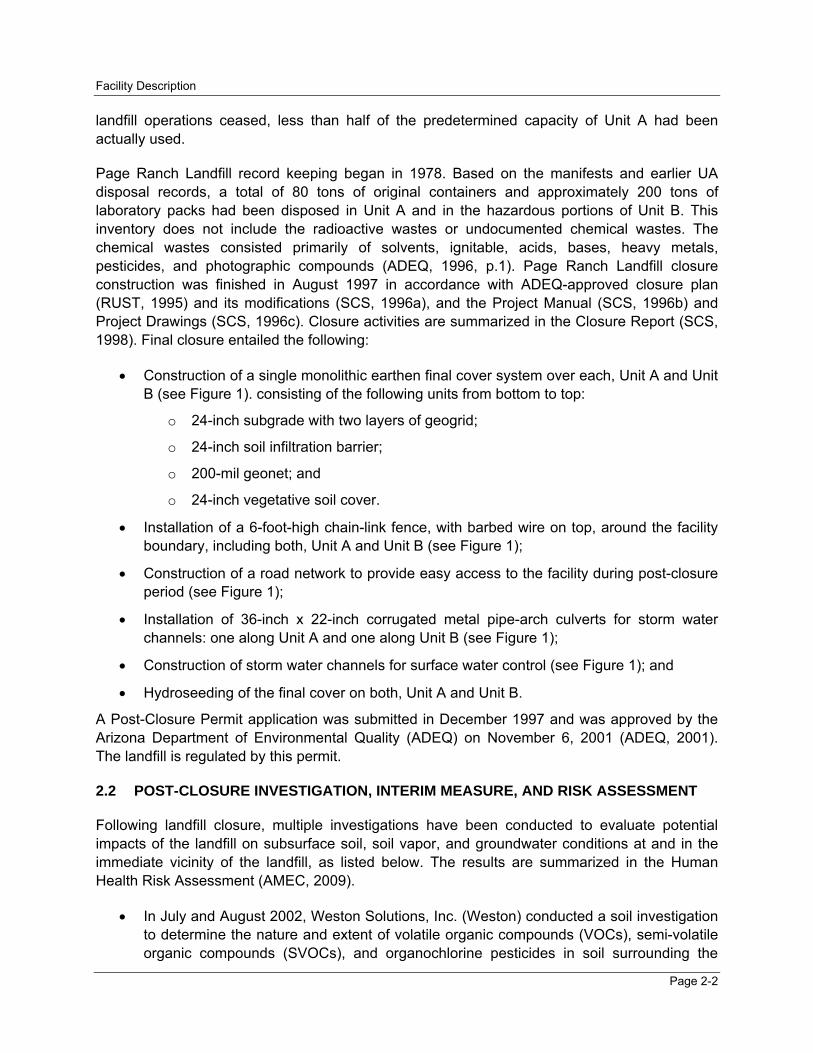
landfill operations ceased, less than half of the predetermined capacity of Unit A had been actually used.
Page Ranch Landfill record keeping began in 1978. Based on the manifests and earlier UA disposal records, a total of 80 tons of original containers and approximately 200 tons of laboratory packs had been disposed in Unit A and in the hazardous portions of Unit B. This inventory does not include the radioactive wastes or undocumented chemical wastes. The chemical wastes consisted primarily of solvents, ignitable, acids, bases, heavy metals, pesticides, and photographic compounds (ADEQ, 1996, p.1). Page Ranch Landfill closure construction was finished in August 1997 in accordance with ADEQ-approved closure plan (RUST, 1995) and its modifications (SCS, 1996a), and the Project Manual (SCS, 1996b) and Project Drawings (SCS, 1996c). Closure activities are summarized in the Closure Report (SCS, 1998). Final closure entailed the following:
• Construction of a single monolithic earthen final cover system over each, Unit A and Unit B (see Figure 1). consisting of the following units from bottom to top:
o 24-inch subgrade with two layers of geogrid;
o 24-inch soil infiltration barrier;
o 200-mil geonet; and
o 24-inch vegetative soil cover.
• Installation of a 6-foot-high chain-link fence, with barbed wire on top, around the facility boundary, including both, Unit A and Unit B (see Figure 1);
• Construction of a road network to provide easy access to the facility during post-closure period (see Figure 1);
• Installation of 36-inch x 22-inch corrugated metal pipe-arch culverts for storm water channels: one along Unit A and one along Unit B (see Figure 1);
• Construction of storm water channels for surface water control (see Figure 1); and
• Hydroseeding of the final cover on both, Unit A and Unit B.
A Post-Closure Permit application was submitted in December 1997 and was approved by the Arizona Department of Environmental Quality (ADEQ) on November 6, 2001 (ADEQ, 2001). The landfill is regulated by this permit.
2.2 POST-CLOSURE INVESTIGATION, INTERIM MEASURE, AND RISK ASSESSMENT
Following landfill closure, multiple investigations have been conducted to evaluate potential impacts of the landfill on subsurface soil, soil vapor, and groundwater conditions at and in the immediate vicinity of the landfill, as listed below. The results are summarized in the Human Health Risk Assessment (AMEC, 2009).
• In July and August 2002, Weston Solutions, Inc. (Weston) conducted a soil investigation to determine the nature and extent of volatile organic compounds (VOCs), semi-volatile organic compounds (SVOCs), and organochlorine pesticides in soil surrounding the

Facility Description
Page 2-3
landfill, and collected soil vapor samples around the perimeter of both landfill units and for analysis of target VOCs (Weston 2003).
• In November 2003, Hydro Geo Chem, Inc. (HGC) conducted interim measure investigation by installing six soil vapor monitoring points in three soil borings (two in each boring).
• A solar-powered soil vapor extraction (SVE) system was installed at the landfill as an interim measure in June 2006 and continues to be operated.
• Soil vapor samples were collected at the six soil vapor monitoring points in May 2006, November 2006, April 2007, December 2007, April 2008, October 2008, April 2009, November 2009, and October 2010.
• In December 2007, AMEC conducted a shallow soil vapor survey at twelve locations along the landfill perimeter.
• The UA Department of Risk Management Services has been collecting groundwater samples from groundwater monitoring wells MW-2 through MW-5 on a semi-annual basis.
• HGC conducted a preliminary screening risk assessment for the landfill in 2005 (HGC, 2005).
• AMEC conducted human health risk assessment in 2009 (AMEC, 2009).
2.3 TOPOGRAPHIC MAP
2.3.1 General Requirements
Site topographic map (Figure 1) contains the following information:
• Map date;
• Scale (1 inch equal 200 feet);
• Map orientation;
• Facility location and 1,000-feet surrounding area;
• Surface contours;
• Surrounding land uses;
• Facility legal boundary;
• Facility fencing and gates;
• Facility access road network;
• Location of hazardous waste disposal units (Unit A and Unit B);
• Location of storm water control structures (culverts and channels);
• Final cover limits (Unit A and Unit B);
• Wind rose.

Facility Description
Page 2-4
2.4 Additional Requirements
Site topographic map (Figure 1) also contains the following information:
• Location of groundwater monitoring wells.
• Location of soil vapor monitoring wells.
• Location of SVE system.
Representative groundwater flow direction and rate are shown on Figure 2.
Figure 3 shows the following subsurface conditions at the site:
• Lithological units from surface to depth of 840 feet (as derived from the site groundwater monitoring wells boring logs); and
• Depth to the uppermost aquifer and the lower water-bearing zone.
2.5 LOCATION INFORMATION
2.5.1 Seismic Standard
Page Ranch Landfill is located near Oracle and Oracle Junction in Pinal County, Arizona. These political jurisdictions are not listed in Appendix VI of 40 CFR Part 264. Consequently, no further information is required.
2.5.2 Floodplain Standard
The facility is not located in the 100-year floodplain (Figure 4).
Groundwater Monitoring
SECTION 3
GROUNDWATER MONITORING
This section presents general hydrogeological information, interim status period groundwater monitoring data, post-closure period groundwater monitoring data, soil vapor monitoring data, and a groundwater detection monitoring program.
3.1 GENERAL HYDROGEOLOGIC INFORMATION
3.1.1 Regional Hydrogeology
Page Ranch Landfill is located within the Falcon Valley at an elevation of approximately 3,700 feet above mean sea level. This portion of the valley is underlain by basin fill deposits with a thickness of at least 800 to 900 feet (Hargis and Montgomery, 1983). Quaternary and Tertiary age basin fill deposits consist of, from youngest to oldest, the Fort Lowell Formation, the Tinaja beds, and the Pantano Formation. The Tortolita and Santa Catalina Mountains, bounding the valley on the west and east, respectively, are underlain principally by Precambrian granitic rocks.
• The Fort Lowell Formation consists of reddish, unconsolidated to moderately consolidated material, predominantly sandy to silty gravel with some clayey gravel. Regionally this formation is generally 300 to 400 feet thick (Arizona Department of Environmental Quality [ADEQ], 1986).
• The Tinaja beds sequence consists of reddish to greyish semi-consolidated to consolidated material. Lithology is predominantly clayey and silty on a regional basis. Thickness ranges from approximately 200 to several hundred feet (ADEQ, 1986).
• The Pantano Formation is generally a reddish-brown silty sandstone to gravel. This formation ranges in thickness from approximately 1,000 to over 6,000 feet (ADEQ, 1986).
Groundwater exists at this site at approximately 645 feet below ground surface (ft bgs) and occurs within the three basin fill deposits discussed above with a thickness of at least 800 to 900 feet (HGC 2005). Regional flow of groundwater is to the south or southwest, parallel to the axis of the Falcon Valley, while estimated groundwater velocity in the vicinity of the landfill is 10 to 100 feet per year (ft/year) (HGC 2005).
Groundwater is not currently used as a source of drinking water at the landfill property or in the surrounding properties. There are no current restrictions on using groundwater at the site as a drinking water source. A registered well survey performed in September 2009 as port of the human health risk assessment suggested the following drinking water wells within 4-mile radius of the site (AMEC, 2009; Appendix Table C-5). Registered well surveys performed in 2011 does not reveal new wells installed after September 2009.
• Five wells located between 2 and 3 miles from the site are reportedly used for drinking water purposes. These five wells are located to the southwest of the site in the general direction of regional hydraulic gradient.
Page 3-1

Groundwater Monitoring
o The nearest drinking water well (registration number 209389) to the site is located approximately 2 miles to the southwest. This well is screened at a maximum depth of 1200 ft bgs, and is owned by the Arizona Water Company, which provides drinking water to customers in Oracle and Oracle Junction.
o Another well owned by the Arizona Water Company (registration number 547316) is screened at a maximum depth of 1140 ft bgs.
o The other three wells (registration numbers 210547, 590585 and 629347) belong to private owners, are screened at maximum depths of 620, 610 and 535 ft bgs, respectively, and are reportedly used for domestic supply and/or livestock.
• Five other wells (registration numbers 615720, 633715, 801251, 805003, and 805056) located between 3 and 4 miles from the site are reportedly used for drinking water purposes. Their maximum depth ranges from 200 to 975 ft bgs, while the maximum depth for one of the wells (registration number 805003) is unknown.
The nearest off-site wells to the site are two irrigation wells (registration numbers 206038 and 595243) located within a 1-mile radius on the private property to the southwest of the site. These two wells are screened at maximum depth of 1500 and 1380 ft bgs, respectively, and are reportedly used for industrial purposes.
Chemical characteristics of groundwater are presented in Hargis and Montgomery (1983). Total dissolved solids ranges from 224 to 288 mg/L (milligrams per liter). Water is of a predominantly sodium and calcium bicarbonate nature.
3.1.2 Site Hydrogeology
3.1.2.1 Monitoring Well Construction
Five groundwater monitoring wells have been installed at the site (Figure 1). These wells are located inside a fenced enclosure surrounding the two landfill units (Unit A and Unit B; Figure 1), and are individually equipped with locked wellhead covers. Monitoring well MW-1 was installed in 1984; it was replaced in 1990 by well MW-5, because well MW-1 was not screened in the appropriate zone. Monitoring wells MW-2, MW-3, and MW-4 were installed in 1985. The total depth and depth of the perforated interval for these wells are summarized in Table 1; their construction details and subsurface lithological conditions are described in the Site Hydrogeology section below. Given that regional groundwater flow is towards the south or southwest, wells MW-1 and MW-5 are considered hydraulically upgradient of the landfill units. MW-4 is located east and south of Unit B, and is considered lateral to groundwater flow. Monitoring wells MW-3 is located due west of Unit A, while MW-2 is located southwest of Unit A and west of Unit B; both are considered downgradient to both Units A and B.
Monitoring wells MW-1, MW-2, MW-3, and MW 4, which were installed between September 1984 and March 1985, are described in a report by Errol L. Montgomery and Associates (EMA, 1985). The wells were drilled using a combination of air and mud rotary methods. In addition to lithologic logs, the wells were logged geophysically. Geophysical logs, including long- and short-
Page 3-2

Groundwater Monitoring
normal electrical resistivity, natural gamma ray, gamma-gamma, neutron, and caliper, are reproduced in the 1985 EMA report. Wells are cased with 4.125-inch inside diameter carbon steel (innermost casing) and the perforated section is machine-slotted carbon steel (0.125-inch in MW-1 and 0.100-inch in MW-2, MW-3, and MW-4). Filter pack is natural. The wells were developed by pumping and each had a dedicated pump installed. The monitoring wells are approximately 800 feet deep with depths to water measured at approximately 650 ft bgs.
Monitoring well MW-5 was installed June through September 1990 (EEC, 1991). This well was drilled by a combination of air and mud rotary methods. Lithologic and geophysical (spontaneous potential, short- and long-normal electrical resistivity, caliper, sonic, gamma ray) logging was done. The well is cased with 6-inch inside diameter carbon steel (innermost casing). The well was developed by swabbing and pumping and a new dedicated pump installed.
In order to use wells MW-2 and MW-5 as soil vapor monitoring wells, inflatable packers were installed in wells MW-2 and MW-5 at depth of 575 ft and 609 ft bgs, respectively.
3.1.2.2 Stratigraphy
Lithology observed during the drilling of monitoring wells MW-1 through MW-4 was generally silty, sandy gravel (EMA, 1985). These sediments ranged from unconsolidated to moderately consolidated. Reaction to dilute acid indicated the presence of carbonate cementation. Average fines (silt plus clay) content in the upper 100 feet of section penetrated was estimated by EMA at approximately 30 percent. Average fines content in the zone below 100 feet was estimated at 15 percent. Average porosity was estimated from geophysical logs to be 0.21. Specific yield (equivalent to effective porosity) was estimated at 0.15 percent based on comparison with similar sediments. A fence diagram, developed by EEC based on lithologic log data from these wells, is attached (Figure 3). The diagram indicates a coarser grained section (sandy gravel) below a depth of approximately 450 feet.
Lithology in the water-bearing zone is predominantly sand and gravel. Geophysical logging indicates several relatively coarse-grained (high resistivity) and fine-grained (Iow resistivity) units (HGC, 1988). The only unit said to be traceable between wells is a high resistivity and presumably relatively high permeability zone occurring at a depth of approximately 700 feet. Qualitative indicators suggest increased permeability below 700 feet.
Lithology observed during the drilling of MW-5 was generally similar to that described for the other monitoring wells above (EEC, 1991).
3.1.2.3 Aquifer Testing
A single well step drawdown aquifer test was conducted in monitoring well MW-1 in 1984 (EMA, 1985). A pumping test in well MW-3 was conducted in 1987, using wells MW-1, MW-2, and MW-4 as observation points (EMA, 1987). A high degree of confidence was not placed in calculated transmissivities by authors of later reports due to some uncertainties in data collection and analysis methods.
Page 3-3

Groundwater Monitoring
Data from the 1987 test were reinterpreted by HGC. HGC indicated, among other things, that wells MW-3 and MW-1 have a relatively high permeability zone in common, but that only a fraction of the water produced from MW-3 during the test was from this high permeability zone. HGC concluded that the total transmissivity may be on the order of the 50,000 gpd/ft (gallons per day per foot) calculated earlier, however the transmissivity of the aquifer materials immediately surrounding MW-3 are lower.
A pumping test in MW-5 was conducted in 1990, using wells MW-1 and MW-3 as observation points (EEC, 1991). Observations in the pumping well and in MW-1 were used to calculate transmissivity by several methods. Results indicated transmissivity of 9,200 to 9,500 gpd/ft. Based on results of the aquifer test, storage coefficient was estimated at 0.0045. The opinion was expressed that aquifer conditions are between unconfined and semi-confined.
3.1.2.4 Hydraulic Gradient
Regional groundwater flow in the area surrounding Page Ranch Landfill, as discussed above, is to the south or southwest. Groundwater elevation measurements taken from on-site monitoring wells between 2001 and 2011 are summarized in Table 2. However, it is difficult to determine groundwater flow direction from on-site monitoring wells, for the following reasons. First, obtaining accurate depth to water measurements at wells greater than 600 ft deep is challenging due to the large depth. Second, because the spacing between monitoring wells is relatively small (400 to 800 ft), water level variations between wells are typically less than 1 ft. As a result, even relatively small inaccuracy in depth to water measurements may make groundwater flow direction appear different from its true direction. Groundwater flow directly below the site is generally to the southeast, ranging from east to south-southeast (HGC, 2005). However, there are abnormalities. For example,
• The groundwater elevation at well MW-5 on April 13, 2005 was lower than the other wells, resulting in a seemingly northeast groundwater flow direction.
• The groundwater elevation at well MW-4 on April 8, 2009 was higher than the other wells, resulting in a seemingly north-northwest groundwater flow direction.
These abnormalities were observed infrequently between 2001 and 2011, and therefore are considered due to inaccurate measurements instead of actual change in groundwater flow direction. The horizontal hydraulic gradient to the southeast, as indicated by the groundwater elevations at wells MW-3 and MW-4, ranges from 0.00030 to 0.00214, with an average of 0.00060.
3.2 TOPOGRAPHIC INFORMATION
Topographic information is discussed in Section 2 and presented in Figures 1, 2, and 3.
Page 3-4
Groundwater Monitoring
3.3 INTERIM STATUS PERIOD GROUNDWATER MONITORING DATA
3.3.1 Description of Wells
The interim status groundwater monitoring system consists of the five monitoring wells as described in the Site Hydrogeology section and illustrated on Figure 1.
3.3.2 Groundwater Sampling and Analysis Procedures
Sampling procedures used during the Interim Status Period are described in the University of Arizona (UA) Interim Status Period Groundwater Sampling and Analyses Plan (UA, 1994). This plan included:
• Steps taken prior to each sampling event:
• Equipment needed • Sample containers type/size and preservation • Laboratory scheduling • Equipment calibration
• Description of sampling procedures
• Field measurements (temperature, pH. electric conductivity, groundwater elevations) • Sample collection, labeling, preservation, and shipment
• Laboratory Analyses
• Volatile organic compounds (VOCs) • Pesticides • Phenols • Manganese and sodium • Sulfate and chloride
• Recordkeeping requirements and procedures
• Field logs • Chain-of-custody procedures • Laboratory QA/QC and reporting • Data filing and reporting.
3.3.3 Interim Period Monitoring Data
Personnel of the UA Department of Risk Management Services collected groundwater samples from the site groundwater monitoring wells for analyses during the period October 1984 through March 1997. ADEQ periodically collected split samples. A summary of the laboratory analytical results for the samples is shown in Appendix H and is discussed below.
Page 3-5

Groundwater Monitoring
3.3.3.1 Organic Constituents
The following organic constituents were detected in groundwater samples collected from one or more of the site wells during single sampling events: aldrin, chlordane, dieldrin, methoxychlor, bis (2 ethylhexyl) phthalate, diethyl phthalate, phenol, 2,4,6- trichlorophenol, bromoform, 1, 1-dichloroethane, and trichlorofluoromethane. Several of the compounds were not detected in duplicate samples, or were detected at concentrations below the method detection limit.
The following organic constituents were detected in samples from the site wells during two and three sampling events, respectively: toluene and 1,1, 1-trichloroethane (1,1-TCA). The samples in which the constituents were detected were not collected during consecutive sampling events. In three of the five sampling events, the constituents were not detected in split samples or samples that were reanalyzed.
Chloroform was detected in samples collected during four non-consecutive sampling events. Samples were collected improperly for the analysis of VOCs according to documentation for the first sampling event. Chloroform was not detected in splits or duplicate samples collected during the second and third sampling events, respectively. Chloroform was detected in sample blanks during the fourth sampling event.
Methylene chloride was detected in samples collected during seven sampling events. However, sample blanks from four of these sampling events also contained methylene chloride. In addition, split samples from two of the sampling events did not contain methylene chloride, and documentation from one sampling event stated that the samples were collected improperly for the analysis of VOCs.
In conclusion, review of the sampling results indicates that the organic constituents identified in the samples were detected at low concentrations, were seldom detected in more than one sampling event, and were not detected in more than two consecutive sampling events. In addition, many of the results were not reproduced in split or duplicate samples or the constituents were also detected in quality control blanks. Organic constituents were not detected in samples collected post 1992. Based on the above information, it appears that the detected organic constituents were inadvertently introduced into the samples, possibly due to contamination during sampling or during analysis in the laboratories (ADEQ. 1996). Therefore, the Interim Sampling Program at the site did not identify the presence of organic contaminants in groundwater at the site. This same conclusion was also reached by ADEQ (ADEQ, 1996).
3.3.3.2 Inorganic Constituents
A number of inorganic constituents were analyzed in groundwater samples from the site. Fluoride, arsenic, barium, and chromium were detected at concentrations below the Arizona Aquifer Water Quality Standards (AWQS) for drinking water.
Concentrations of nitrate were generally below or slightly above the AWQS. Total dissolved solids, chloride, sulfate, and zinc were detected at concentrations well below the EPA Secondary Maximum Contaminant Levels (SMCLs). The measured pH of the water was within the range of the SMCL, except for samples collected in 1985 and one in 1990, which measured
Page 3-6

Groundwater Monitoring
at a slightly lower pH. Iron and manganese were consistently detected at higher concentrations than the SMCL.
Groundwater samples collected at the site were analyzed for other inorganic constituents that do not have AWQS or SMCLs, including alkalinity, hardness, calcium, magnesium, and sodium. Of these, only sodium was analyzed on a regular basis. Although the concentrations of sodium fluctuated somewhat over time, the results were fairly consistent.
In conclusion, the results for the inorganic constituents indicate that they can be attributed to natural water quality (ADEQ, 1996). Statistical procedures used for the analysis of background groundwater concentration values are discussed later in this section, under General Monitoring Program Requirements.
3.4 POST CLOSURE PERIOD GROUNDWATER MONITORING DATA
3.4.1 Description of Wells
The post-closure groundwater monitoring system consists of four monitoring wells (MW-2, MW-3, MW-4, and MW-5), as discussed in the Site Hydrogeology section and illustrated on Figure 1.
3.4.2 Groundwater Sampling and Analysis Procedure
The Post Closure Period Groundwater Detection Monitoring Plan is presented in Appendix B. This plan includes the following:
• Steps to be taken prior to each sampling event:
• Equipment needed • Sample containers type/size and preservation • Laboratory scheduling • Equipment calibration
• Sampling procedures
• Field measurements (temperature, pH, electric conductivity, groundwater elevations) • Sample collection, labeling, preservation, and shipment
• Laboratory Analyses
• VOCs • Pesticides • Semi-volatile organic compounds (SVOCs) • Manganese and sodium • Sulfate and chloride
• Recordkeeping requirements and procedures
• Field logs
Page 3-7

Groundwater Monitoring
• Chain-of-custody procedures • Laboratory QA/QC and reporting • Data filing and reporting
3.4.3 Groundwater Monitoring Data
During the post-closure period (between August 1997 and October 2010), personnel of the UA Department of Risk Management Services collected groundwater samples from the site groundwater monitoring wells for analyses in November 1997, August 2000, and October 2001, and have been collected groundwater samples twice a year since 2003. A summary of the laboratory analytical results for the samples is shown in Appendix H and is discussed below.
3.4.3.1 Organic Constituents
Detections of organic constituents in groundwater samples collected from well MW-2 include the following. None of these constituents were detected in the subsequent sampling event.
• Chloromethane was detected at a concentration of 0.00079 mg/L on 10/12/2005; • Toluene was detected at a concentration of 0.014 mg/L on 11/7/2006; • Pyrene was detected at a concentration of 0.005 mg/L on 10/14/2009;
No organic constituents were detected in groundwater samples collected from well MW-3.
Detections of organic constituents in groundwater samples collected from well MW-4 include the following. None of these constituents were detected in the subsequent sampling event.
• Total trihalomethanes and chloroform were detected at concentrations of 0.00056 and 0.00056 mg/L, respectively;
• Bis(2-ethylhexyl) phthalate was detected at concentrations of 17 and 7 mg/L (primary and duplicate samples) on 8/23/2000;
Detections of organic constituents in groundwater samples collected from well MW-5 include the following. None of these constituents were detected in the subsequent sampling event.
• Benzene was detected at a concentration of 0.00054 mg/L on 4/12/2006; • Toluene was detected at concentrations of 0.0054 and 0.0026 mg/L (primary and duplicate
samples) on 11/7/2006; • Bis(2-ethylhexyl)phthalate was detected at a concentration of 17 mg/L on 8/23/2000.
Overall, detections of organic constituents, including VOCs, pesticides, and SVOCs, have been sporadic in both time and by monitoring well location. In addition, none of the detected organic constituents were detected during consecutive monitoring events. Therefore, the post-closure groundwater monitoring program did not indicate the presence of organic contaminants in groundwater at the site.
Page 3-8

Groundwater Monitoring
3.4.3.2 Inorganic Constituents
The inorganic constituents analyzed for during the post-closure period include chloride, sulfate, manganese, and sodium. Their concentrations were below their respective Alert Levels (see General Groundwater Monitoring Requirements). Therefore, the post-closure groundwater monitoring program did not indicate the presence of inorganic contaminants in groundwater at the site.
3.5 SOIL VAPOR MONITORING DATA
In order to determine the potential for contaminants in soil vapor to migrate from the landfill to surrounding areas, a number of soil vapor sampling events have been conducted. The soil gas sampling data are presented in Appendix I.
3.5.1 Soil Vapor Survey
In order to determine prior to landfill closure the potential for contaminants from the landfill to migrate to the area immediately surrounding the landfill, a near surface soil vapor survey was conducted by HGC in July 1988 (Appendix A to EEC, 1989b). A total of eight soil vapor samples were collected at the perimeter of Unit A and twelve soil vapor samples were collected at the perimeter of Unit B from a depth of approximately 5 ft bgs. An additional 9 samples were collected at approximately 100 feet beyond the two landfill units. In general, the VOCs were detected at the highest concentrations near the landfill perimeter, with concentrations decreasing substantially with increased distance from the landfill units. These data indicate that while VOCs were present in the pore space in the soil immediately surrounding the landfill, concentrations diminish substantially with increasing distance. It is noted that these data reflect site conditions prior to closure of the landfill and are therefore not representative of current, post-closure site conditions.
In September 1994, a second soil vapor investigation was conducted prior to landfill closure to again assess potential soil gas migration from the landfill in the surrounding area (Terra Tech, 1994; provided as Appendix G to Rust Environment & Infrastructure [RUST], 1995). The investigation consisted of installing vapor probes in shallow subsurface soil within 5 feet from the three perimeter sides (north, west, and south) of each landfill unit, beginning at the upper northeast edge. Soil vapor samples were collected with a geoprobe sampler and spaced every 50 feet along the landfill perimeter and to a maximum depth of 10 ft bgs. If a soil vapor sample contained detectable levels of VOCs, a second sample was collected at a distance away (e.g. 15 feet) from the first sample. This was repeated for all samples with detectable concentrations resulting in additional sample collection up to a maximum distance of 150 feet beyond the landfill perimeter. A total of 12 VOCs were detected in at least one soil vapor sample out of 109 samples analyzed, and included in order of detection frequency: chloroform (85%), trichlorofluoromethane (69%), tetrahydrofuran (31%), carbon tetrachloride (18%), 1,3-dichlorobenzene and 1,2-dichlorobenzene (each at 12%), xylenes (11%), tetrachloroethylene (PCE) and trichloroethylene (TCE) (each at 10%), 1,1,1-trichloroethane (8%), 1,1-dichloroethene (5%), and 1,2-dichloroethane (4%). Samples representing the northwest corner of Unit A (A5) and the northeast corner of Unit B (B1) contained the most number of detected VOCs. Concentrations of all VOCs decreased with distance from the landfill units. Based on this
Page 3-9

Groundwater Monitoring
investigation, it was recommended that a perimeter extraction trench was to be included in the landfill closure plan to mitigate future gas migration (RUST 1995). These data demonstrate that prior to closure, vapors from the landfill were present in shallow soil immediately surrounding the landfill units and decreased with increasing distance from the landfill units.
As part of an investigation conducted by Weston Solutions Inc. (Weston, 2003) to determine nature and extent of landfill impacts, 44 shallow soil vapor samples were collected between July 29, 2002 and August 1, 2002 from points evenly spaced approximately every 50 feet and from a distance of 10 to 15 feet from the perimeter edge of both landfill units. An additional 21 soil vapor samples were collected at a distance (100 feet) from the perimeter locations if an analyte was detected in the initial perimeter sample at a concentration greater than twice the method reporting limit. This investigation identified TCE and PCE in 21 and 7 of the 44 perimeter shallow soil vapor samples, respectively. The majority of the detections and highest concentrations of VOCs were identified in soil vapor samples collected along the western perimeters of both landfill units. There was no detection of any compound on the limited target analyte list in any soil vapor sample collected along the eastern perimeter of either unit. In addition, five soil vapor samples were collected at each of five soil boring locations representing the area immediately adjacent to the landfill site from a depth of 15 ft bgs. TCE and toluene were detected in all five samples and PCE was detected in three samples.
Based on these results, four deep soil borings were installed along the western side of the closed landfill (SB-1 through SB-4). Samples from boring SB-3 extend from ground surface to 111 ft bgs and samples from SB4 represent depths from 111 to 201 ft bgs. At all locations, soil vapor samples were collected into 1-liter Tedlar bags from each boring every 10 feet in depth to a final depth of 200 ft bgs and analyzed for VOCs by EPA Method 8260B. A total of five VOCs were detected—TCE, PCE, benzene, toluene, and xylenes. TCE was detected in 95% of the samples analyzed at SB-1 and SB-2 and in 85% of the samples analyzed from SB-3/4. PCE was also detected at a high frequency in samples from SB-2 (95%) and SB-3/4 (80%); PCE was detected in only 4 of 20 samples from SB-1. Both of these chlorinated VOCs were detected at higher concentrations in samples collected from depth intervals of 110 to 130 ft bgs and at 50 to 70 ft bgs, relative to samples collected from intervening depth intervals. During activities to install these soil borings, three apparently contiguous sand lenses were encountered at 3 depth intervals (101 to 126 ft bgs, 172 to 225 ft bgs, and 444 to 644 ft bgs; HGC, 2004a), which likely accounts for the fluctuating vapor concentrations with depth.
In order to provide soil vapor data representative of conditions at potential off-site locations surrounding the landfill, 11 shallow soil vapor samples (and one field duplicate sample) were collected in December 2007 for VOC analysis from temporary monitoring points spaced evenly along the southern perimeter (SV-1 through SV-8) and south western perimeter (SV-9 through SV-11) of the PTRL site boundary (AMEC, 2008). The detected VOC concentrations were highest among the shallow soil vapor samples closest to the landfill and dropped by an order of magnitude or more with increased distance from the landfill units.
3.5.2 Soil Vapor Monitoring Wells
As part of the interim measure investigation in 2003, six soil vapor monitoring wells were installed at the landfill in 2003, with screened intervals ranging between 75 and 80 ft bgs to
Page 3-10

Groundwater Monitoring
between 560 and 600 ft bgs (Figure 1; HGC, 2004a). Their construction details are summarized in Table 3. Groundwater monitoring wells MW-2 and MW-5 are also being used for soil vapor monitoring through the use of inflatable packers, with sampling intervals between 632 to 640 ft bgs and the water table. Soil vapor wells SGS-Well and SGD-Well are being used as part of the soil vapor extraction (SVE) system described in the Soil Vapor Extraction System section. Soil vapor sampling results at the six vapor monitoring wells are included in Appendix I. Concentration versus time plots for SGS-SP, SGS-Well, SGD-SP, SGD-MP, and SGD-DP are presented in Figures 6a through 6t. The concentrations for SGD-Well are not plotted because this well is used for air injection during SVE system and therefore infrequently sampled. On the few occasions that SGD-Well was sampled, the results are either non-detects or very low, as shown in Appendix I. The periods when the SVE system is operating in extraction/injection mode are shown on Figures 6a through 6t. Although the SVE system commenced operation in June 2006, the system started with both wells in extraction model and operated infrequently until November 2006 when the system began operation with SGS-Well in extraction mode and SGD-Well in injection mode. Therefore, Figures 6a through 6t show that the SVE system began operation in November 2006.
The conclusion of an interim measure investigation conducted in 2003 was that soil vapor concentrations from the landfill decrease rapidly with depth below the landfill and that soil vapor concentrations above the water table (approximately 640 ft bgs) are not likely to cause groundwater concentrations in excess of water quality standards (HGC 2004b). The soil vapor sampling results at these monitoring wells indicate that VOC concentrations in soil vapor have been decreasing over time.
3.5.3 Soil Vapor Extraction System
A SVE system, which consists of two soil vapor wells (SGS-Well and SGD-Well) and an activated carbon vapor treatment system, was installed at the landfill in June 2006 as an interim measure. The SVE system operated infrequently between June 2006 and April 2007, stopped operating until November 2008, and has resumed operation since then (AMEC, 2009). The system is powered by solar panels, and has been operating approximately 10 hours per day (HGC, 2009). In some months (e.g. September 2009; HGC, 2009), the SVE system was not fully operational due to equipment problems. Air is injected into well SGD-Well at a rate of approximately 40 ft3/min, while soil vapor is extracted from well SGS-Well at a rate of approximately 90 ft3/min. Samples have been collected from the influent to the treatment vessels and effluent from the treatment vessels for VOC analysis. The SVE influent sampling results are presented on the same plots as SGS-Well in Figures 6e through 6H. SVE influent sampling results are the data collected during SVE operation. The influent sampling results indicate that VOC concentrations in extracted soil vapor have been decreasing over time.
3.6 GENERAL MONITORING PROGRAM REQUIREMENTS
3.6.1 Description of Wells
Groundwater monitoring during the post-closure period will be performed using the four existing groundwater monitoring wells: MW-2, MW-3, MW-4, and MW-5.
Page 3-11

Groundwater Monitoring
3.6.2 Sampling and Analytical Procedures
The Post-Closure Period Groundwater Detection Monitoring Plan is provided in Appendix B. Revisions to the sampling and analysis procedures will be incorporated as necessary into the plan based upon the latest accepted techniques and methodologies.
Groundwater samples will be analyzed for inorganic constituents, VOCs, SVOCs, and organochlorine pesticides using the following analytical methods as specified in the Post-Closure Permit:
• Inorganic constituents:
• Manganese (Mn): EPA Method 200.7 • Sodium (Na): EPA Method 200.7 • Chloride (Cl): EPA Method 300.0 • Sulfate (SO42-): EPA Method 300.0
• VOCs: EPA Method 524.2 • SVOCs: EPA Method 8270C • Organochlorine pesticides: EPA Method 8081
Organochlorine pesticides are the only pesticide group proposed for monitoring because, among the three types of pesticides that are suspected to have been disposed in the landfill (organochlorine, organophosphate, and carbamate), organochlorine pesticides are the most persistent in the environment and can bioaccumulate. In contrast, organophosphate pesticides are usually not persistent in the environment, while carbamate pesticides only have moderate toxicity and persistence in the environment.
Groundwater samples will also be analyzed for radionuclides in accordance with Arizona Radiation Regulatory Agency (ARRA) Radioactive Material License 10-24.
For all sample analyses, electronic data deliverables (EDDs) compliant with the most recent version of the ADEQ Groundwater Data Submittal Guidance Document will be requested from the analytical laboratory at the time of sample submission. Where appropriate, the EDDs will utilize pre-defined entries identified in lookup tables referenced in the data submittal guidance document. The EDDs will be forwarded to ADEQ prior to submission of the Semi-Annual Monitoring Report, but no later than 90 days after samples were received at the laboratory.
3.6.3 Background Groundwater Quality
In the 1997/1998 permit application, well-specific background groundwater quality values (lower range indicators, upper range indicators, and alert levels) for pH, conductivity, temperature, chloride, sulfate, manganese, and sodium were calculated from historical data obtained from the most recent twelve sampling events. The tolerance interval method procedure was used, following the ADEQ, Waste Programs Division, Solid Waste Section's "Alert Level Guidance for Solid Waste Facilities - 1995" (Appendix R).
Page 3-12

Groundwater Monitoring
For each well (MW-2, MW-3, MW-4, or MW-5), the alert levels for chloride, sulfate, manganese, and sodium have been.re-calculated using all available data between 1985 and 2011. The lower and upper range indicators for pH, conductivity, and temperature are kept the same as in previous permit application. The background groundwater quality is summarized in Table 6a. Details of alert level calculations are presented in Tables 6b through 6e. These numeric values will be used for intrawell comparison. The calculation of alert levels is described below.
Consistent with the ADEQ’s 1995 guidance and previous calculations, an alert level is calculated as the 95% confidence upper tolerance level (UTL) with 95% coverage. The procedure generally follows the ADEQ’s 1995 guidance. However, instead of using statistical tables, the statistical software Scout (version 1.00.01), which is published by the U.S. EPA, was used. The Scout software contains more advanced and current statistical methods than what were available in 1995, particularly for datasets with non-detects at multiple reporting limits and datasets that do not follow known distributions. The procedure is as follows.
1. When results from duplicate samples are present, one of the results is randomly selected for use in calculating alert levels. This is necessary because including both results will lead to underestimation of sample variance.
2. The data are visually inspected for long-term temporal trends. No long-term temporal trend is identified.
3. The data are screened for suspected outliers using graphical plots and statistical tests. Unless supported by strong evidence, suspected outliers are kept in the data for alert level calculations. The only outliers that were excluded are sample results on September 20, 1985, as the data are orders of magnitude lower than the other data for all three wells (MW-2, MW-3, and MW-4), which indicated a laboratory or transcription error.
4. The data are used to calculate 95% UTLs with 95% coverage. For datasets that contain non-detects at multiple reporting limits or do not follow known distributions, the Kaplan-Meier method, which is a non-parametric method, is typically recommended. Tables 6b through 6e lists the statistical method used for each constituent.
3.6.4 Alert Levels for VOCs, SVOCs, and Organochlorine Pestcides
Alert levels for VOCs, SVOCs, and organochlorine pesticides that have federal maximum contaminant levels (MCLs) are proposed as 80% of the MCLs, as shown in Table 7.
Page 3-13

Groundwater Monitoring
During the post-closure detection monitoring, the monitoring data will be compared to the corresponding Alert Levels for the analytes discussed above to determine if a significant difference exists.
3.7 DETECTION MONITORING PROGRAM
3.7.1 Hazardous Waste Constituents
The bulk of wastes disposed of in Page Landfill consisted of laboratory wastes, low-level radioactive and chemical. Inventory of typical wastes disposed of at Page Ranch Landfill is shown in Appendix C. About 10 percent of items on the list represent approximately 90 percent of the materials disposed of at Page Ranch Landfill. The most predominant chemical wastes included ethanol, hexane, toluene, methanol, sulfuric acid, hydrochloric acid, and acetic acid (UA, 1997).
3.7.1.1 Behavior of Contaminants
The following is a discussion of environmental fate and transport of the major types of waste constituents at Page Ranch Landfill.
HEAVY METALS
Heavy metals present in the wastes disposed of at Page Ranch landfill include cadmium, chromium, copper, nickel, lead, mercury, and arsenic. These metals, with the exception of mercury, can only be transported in the aqueous phase. Precipitation, complexation, adsorption, ion exchange, and redox conditions at the site thus control transport of these metals. Primarily due to Solubility and adsorption constraints, there is very limited downward migration of heavy metals. Downward migration of heavy metals is even further reduced in subsurface systems with low permeabilities, such as clays and caliche. Mercury is the only metal that can volatilize, thus limiting the amount of material to migrate downward. In terms of potential groundwater contamination, metal movement by water is of the most practical significance.
PESTICIDES
General Properties of Pesticides
Within the broad heading of pesticides, however, are a variety of types of pesticides and chemical classes. Table 4 is a list of the pesticides, by class, representative of those that may have been disposed of in the landfill.
Transportation of pesticides in soil may occur in many forms, including migration with water in the dissolved or suspended state, with soil particles in the adsorbed state, or with soil air in the vapor state. In terms of potential groundwater contamination, however, pesticide movement by water flow is of the most practical significance (Triegel and Guo, 1994).
Page 3-14

Groundwater Monitoring
The behavior of pesticides in the soil-water system is governed by the properties of both the compounds and the soil constituents, as well as the hydrogeology of the area and climatic factors. The various chemical properties that can impact pesticide migration include chemical structure, molecular weight, melting point, solubility, ionizability, volatility, heat of solution, lipophilicity, decomposition temperature, soil retention, and soil longevity. A composite picture of all the chemical and physical properties of a pesticide would be the ideal circumstance for predicting the behavior of a given pesticide in the environment. However, in many cases these values are not available and in most cases it is essential to know only key properties, such as ionizability, water solubility, volatility, soil retention, and longevity (Weber, 1994).
Mobility of Pesticides Disposed at the Site
Table 5 presents the available chemical properties data for the pesticides present at the landfill. The following text discusses each chemical class generally.
Carbamates -- The carbamate pesticides found at the landfill range from virtually insoluble (Advantage) to moderately soluble (Temik). Volatility varies similarly. As would be expected, soil retention shows the same pattern.
Advantage and Betanal have moderate soil retention properties and will not tend to migrate far in the soil column. Furloe and especially Baygon and Temik have low soil retention and would be more likely to migrate downward with percolating water. Offsetting this somewhat are the moderate to short half-lives of these compounds. Under field conditions, these types of pesticides have been shown to persist for a few days to a few months. This is the result of both microbial transformation and chemical hydrolysis, particularly at higher pH values (alkaline soils).
Chlorinated Hydrocarbons -- The chlorinated hydrocarbon pesticides are known for their persistence in the environment. However, they tend to have very low solubility and volatilization potential. Consequently, they do not tend to migrate very far in the soil column. Rather, they tend to persist relatively near to the point of deposition. DDT is susceptible to hydrolysis under alkaline conditions (Montgomery, 1993).
Acidic and Hydroxy Acid Herbicides -- The acidic herbicides tend to be very mobile in soils, especially alkaline soils. On the other hand, these herbicides tend to have relatively short half-lives (less than one month). Consequently, if ground water is sufficiently deep and site soils such that water will move slowly through the soil column, these herbicides would be expected to degrade before ever reaching an aquifer.
Quaternary Nitrogen Pesticides -- These types of pesticides are highly soluble, but their soil retention tends to be independent of solubility due to their cationic nature. Paraquat, for instance, is readily sorbed to the cation exchange complex of soils in exchange for inorganic cations (Weber, 1994). Clay minerals are the chief binding sites. These tend to be relatively long-lived compounds, particularly when bound. However, in clay soils migration would not be expected.
Page 3-15

Groundwater Monitoring
Basic Pesticides -- These types of pesticides tend to be relatively mobile in soils. On the other hand, these herbicides tend to have relatively short half-lives (less than one month). Consequently, if ground water is sufficiently deep and site soils such that water will move slowly through the soil column, these herbicides would be expected to degrade before ever reaching an aquifer.
Organophosphate Pesticides -- As is evident from Table 5, the properties of the organophosphate pesticides vary widely. Consequently, it is impossible to generalize about mobility. Depending on the particular pesticide involved, soil mobility may range from high (Azodrin) to moderate {Dursban}. However, all of these pesticides tend to have relatively short half-lives (generally from a few days to one month). The microbial breakdown products tend to be less mobile than the parent compounds. As a result, mobility as measured in the field often is less than the chemical properties would predict (Weber, 1994).
Thiocarbamates -- The most important characteristic of the thiocarbamate herbicides is their volatility. Any significant migration of these pesticides is in the vapor phase. They are not highly water-soluble and have low soil retention. Additionally, they tend to be relatively short lived due to their susceptibility to microbial degradation.
Other Pesticides -- The other pesticides listed on Table 4, although widely different in chemical structure, show similar behavior in soil. All are practically insoluble with low volatility and high soil retention characteristics. In addition, they have short to moderate half-lives. As a result, these pesticides will tend to be retained near to their original point of deposition until degraded.
PHENOLS
Phenol is highly soluble and does not tend to adsorb onto soil. Consequently the basic phenol molecule is very mobile in soil. However, phenol is also readily biodegradable. Half-lives of 2 to 5 days in soil are not uncommon. The exception would be in the cases where spills of high concentrations of phenol destroy degrading microbial populations. Phenol is volatile, and a significant percentage of phenol spilled to soil surfaces will evaporate (Howard, 1991).
Despite the reported mobility of phenol, the molecule does not tend to move by itself. Rather, it will migrate with percolating soil water. If there is no percolating soil water, the phenol will not migrate. If the percolating water moves sufficiently slowly, as at the site, the likelihood of biodegradation prior to reaching ground water is very high. The high evaporation rate at the site would also tend to volatilize phenol, further limiting the amount of material available to migrate. Consequently, it appears unlikely that phenols would ever reach ground water at the site.
ORGANIC SOLVENTS
Major organic solvents known to have been disposed of at the landfill are primarily ethanol, hexane, toluene, acetic acid, and methanol, followed by chloroform, acetone, methylene chloride, propanol, trichloroethane, and trichloroethylene. The fate and transport of these compounds in the environment is a function of their nature, quantity/rate of release, the nature of the subsurface beneath the point of release, their biodegradability, infiltration, and water balance. Organic solvents may be transported as free liquids, dissolved in water, or as vapors.
Page 3-16

Groundwater Monitoring
Downward migration of free liquids is controlled by soil capillary actions (called residual saturation) and adsorption. The actual penetration distance for free liquids is influenced by soil heterogeneity and the amount and type of the chemical. For a free liquid to migrate in soil, the quantity of the released chemical must exceed the residual saturation. If the released volume of an organic solvent is sufficient, the liquid solvent will continue to move downward until reaching a lower-permeability layer, such as clay or caliche. At this point, the chemical will tend to move laterally, depending on the volume that reached that layer, with a minimal downward movement. In case of very small volumes, lateral spreading will also be minimal.
Some of the chemicals in the unsaturated zone may dissolve in percolating rainwater and continue to migrate downward. The concentrations of the dissolved chemical may range widely, depending on their solubility, rate of infiltration, and the time and area of contact between the chemical and the infiltrating water.
Organic solvents may also volatilize from the migrating liquid, the residual saturation, or the dissolved phase, and become part of the gas phase. These vapors migrate away from the evaporation source; depending on their densities, they can move upward, downward, and/or radially. Diffusion rates are strongly influenced by subsurface geologic heterogeneities, soil porosity, moisture conditions, vapor source concentrations, the presence of preferential pathways, and pressure and temperature gradients. Since the vapor plumes move faster than the dissolved and liquid plumes, detectable soil vapor concentrations can be found in soil beyond the area of liquid plumes. These vapors can also dissolve either in pore waters and continue to migrate as a dissolved phase or in groundwater.
3.7.1.2 Conclusions
HEAVY METALS
Transport of heavy metals is controlled primarily by their solubility, precipitation, adsorption, ion exchange, and complexation, site evapo-transpiration, and the permeability/porosity and redox potential of the site subsurface. At the site, the deposits of caliche and clay directly beneath the site, the lack of infiltration due to the final cap and high evapo-transpiration, and a depth to groundwater indicate that it is unlikely that heavy metals would ever reach the aquifer at a depth of 650 feet.
PESTICIDES
There appear to be two general types of pesticides at the site, long-lived immobile pesticides and mobile but readily degradable pesticides. The high clay content of the site soils will tend to retard migration of even the more mobile pesticides. The site evapo-transpiration rate will favor the loss of the more volatile pesticides. Furthermore, migration cannot proceed in the absence of percolating water. The final cap and the site water balance is such that very little, if any, water can routinely percolate downward from the site. In addition, the longest lived of the mobile pesticides at the site have half-lives on the order of 6 weeks. It is thus very unlikely that any of these pesticides would ever reach the aquifer at 650 feet.
Page 3-17

Groundwater Monitoring
PHENOLS
Phenols migrate with percolating soil water. If there is no percolating soil water, the phenol will not migrate. If the percolating water moves sufficiently slowly, as at the site, the likelihood of biodegradation prior to reaching ground water is very high. The high evaporation rate at the site would also tend to volatilize phenol, further limiting the amount of material available to migrate. Consequently, it appears unlikely that phenols would ever reach groundwater at the site.
ORGANIC SOLVENTS
Depending on the nature of the chemical, downward migration of organic solvents can proceed in three different forms: free liquid, dissolved phase, and/or vapors. The amount and nature of the chemical and its biodegradability, infiltration, water balance, and soil heterogeneity will influence their actual penetration distance. Of the types of chemicals discussed, VOCs are the only ones that can potentially migrate to the aquifer.
3.7.2 Subsurface Investigations
3.7.2.1 Groundwater Monitoring
Groundwater monitoring data are described in the Interim Status Groundwater Monitoring Data and Post-Closure Period Groundwater Monitoring Data sections. Groundwater monitoring data are included in Appendix H.
3.7.2.2 Soil Vapor Monitoring
Soil vapor monitoring data are described in the Soil Vapor Monitoring Data section. Soil vapor monitoring data are included in Appendix I.
3.7.2.3 Soil Data
In January 1989, prior to closure activities, an investigation of the potential for hazardous waste materials to exist outside of the landfill units was conducted (EEC, 1989b). Based on the results of a soil vapor survey in July 1988 (Appendix A to EEC, 1989b), 10 subsurface soil samples were each collected from areas with elevated vapor concentrations (see next section) from a depth of 15 feet (ft) below ground surface (bgs) at a distance of 12 ft from the perimeters of Unit A and Unit B. An additional four soil samples were collected approximately 100 feet beyond the landfill perimeter. A background soil sample was also collected approximately 500 ft beyond the northeast corner of Unit A. All soil samples were analyzed for extraction procedure (EP) leaching test for metals (arsenic, barium, cadmium, chromium, lead, mercury, selenium, silver) and VOCs by EPA Method 8010 and 8020. At four locations, additional soil samples were collected from depths of 25 and 35 ft bgs and analyzed for VOCs only (EEC 1989b). All detected concentrations of VOC and metals were below the lowest Arizona Soil Remediation Levels (SRLs), which are protective of residential exposures (R-SRLs) (Arizona Administrative Code [AAC] Title 18, Chapter 7, Article 2). No patterns of detection were observed.
Page 3-18

Groundwater Monitoring
In August 2002, following landfill closure, a soil investigation was conducted to determine the nature and extent of compounds in soil surrounding the landfill (Weston 2003). Based on the results of a soil vapor survey conducted between July and August 2002, a total of 4 soil borings were installed to the west of the landfill (SB1 to SB4) extending from ground surface to approximately 200 ft bgs. A total of 57 soil samples (and soil gas samples) were collected continuously every 10 feet and were submitted for laboratory analyses (VOCs by EPA Method 8260B, SVOCs by EPA Method 8270, and organochlorine pesticides by EPA Method 8081). All four soil borings were located along the western edge of the landfill with SB-1 representing an area south and west of Unit B, SB-2 located in an area between the two landfill units, and SB-3/4 west of Unit A (see Figure 2 in Weston 2003). No analyte was detected in any soil sample collected from a depth interval greater than 190 ft bgs and no volatile compound was detected in any soil sample collected from a depth interval greater than 140 ft bgs. All detected concentrations are below the lowest SRL.
Soil sampling data are included in Appendix J.
3.7.2.4 Summary of Subsurface Investigations
Subsurface investigations (groundwater, soil vapor, and soil data) indicated the following:
• Very low levels of VOCs in soil at shallow depths only. • Levels of heavy metals in soil representative of background concentrations. • There is no indication of groundwater contamination by organic or inorganic constituents. • VOC concentrations in soil vapors are highest below the landfill and decrease with
increasing distance from landfill and with increasing depth.
3.7.3 Indicators of Groundwater Contamination
As described in the 1997 permit application (UA, 1997), transport modeling performed by ADEQ indicated that as a class, volatile chemicals, such as methylene chloride, are far more mobile than phenols or pesticides, and therefore, if there ever is any impact to groundwater from the landfill, the volatile organics would be the first detected. Constituents that could be potentially released from the disposal units and migrate the approximately 650 feet vertical distance to groundwater include VOCs and soluble inorganics. Pesticides, SVOCs, and heavy metals are extremely unlikely to migrate this distance through soils that contain significant amounts of silt and clay particles, on whose surfaces they would become trapped. The detection monitoring program will include field and laboratory analysis for the following:
• pH - field measurements. • Temperature - field measurements. • Conductivity - field measurements. • General water quality parameters, consisting of sodium, manganese, chloride, and sulfate -
laboratory analysis. • VOCs - laboratory analysis. • SVOCs - laboratory analysis. • Organochlorine pesticides - laboratory analysis.
Page 3-19

Groundwater Monitoring
3.7.4 Groundwater Monitoring System
3.7.4.1 Description of Wells
The groundwater monitoring system is described under General Monitoring Requirements - Description of Wells. Groundwater monitoring during the post-closure period will be performed using the four existing groundwater monitoring wells: MW-2, MW-3, MW-4, and MW-5.
3.7.4.2 Background Groundwater Quality and Alert Levels
Numeric values indicating background groundwater quality and alert levels for pH, conductivity, temperature, chloride, sulfate, manganese, and sodium are presented –in Section 3.6.3 (Table 6a).
The alert levels for VOCs, SVOCs, and organochlorine pesticides are presented in Section 3.6.4 (Table 7).
3.7.4.3 Sampling and Analysis Procedures
The proposed sampling and analysis procedures are described under General Monitoring Requirements – Sampling and Analysis Procedures and in the Post-Closure Period Groundwater Detection Monitoring Plan (Appendix B). Groundwater will be collected semi-annually, typically in the spring and fall, in accordance with the requirements of the Post-Closure Permit.
3.7.4.4 Statistically Significant Increases
If analytical results for manganese, sodium, sulfate, chloride, VOCs, SVOCs, or organochlorine pesticides exceed the Alert Levels as indicated in Tables 6 and 7 in any of the on-site monitoring wells in two consecutive groundwater sampling events, monitoring for specific analyte will change from twice a year or annual, as applicable, to twice the approved frequency, until the values fall within the calculated range of the intrawell comparison for three consecutive sampling events. This investigation will include, but will not be limited to, analyzing previously collected data of other analytes. UA will also consult with ADEQ regarding this issue.
If a determination is made based on the analytical data that AWQS specified in AAC R-18-11-405 have been exceeded in groundwater samples collected from the site monitoring wells, the following actions will be taken:
• ADEQ will be notified within seven days upon receipt of laboratory results indicating an exceedence of an AWQS.
• Retesting will be performed as described above. • If laboratory analyses of verification samples indicate an exceedence of an AWQS, periodic
monitoring will be increased as stated above. • If laboratory analyses of verification samples indicate an exceedence of an AWQS, a report
will be submitted to ADEQ within 30 days upon receipt of laboratory results. The report will include at a minimum the following:
Page 3-20

Groundwater Monitoring
• AWQSs which have been exceeded; and, • The period of exceedence and remedial measures proposed.
• After a report is submitted, a meeting will be scheduled, if necessary, with ADEQ to discuss exceedence issues and alternative remedial activities.
3.7.5 Soil Vapor Monitoring System
3.7.5.1 Description of Monitoring Points
Soil vapor monitoring during the post-closure period will be performed using two existing groundwater monitoring wells, MW-2 and MW-5 (through the use of inflatable packers), six soil vapor monitoring points, SGS-Well, SGD-Well, SGS-SP, SGD-SP, SGD-MP, and SGD-DP, and the influent to the SVE system. The groundwater monitoring wells are described under General Monitoring Requirements – Description of Wells. The soil vapor monitoring points are described under Soil Vapor Monitoring Data – Soil Vapor Monitoring Wells. The SVE system is described in detail in the Operation and Maintenance Manual (Appendix G).
3.7.5.2 Sampling and Analysis Procedures
The proposed sampling and analysis procedures are described in the Post-Closure Period Expanded Groundwater Detection Monitoring Plan (Appendix B). Soil vapor samples will be collected semi-annually, typically in the spring and fall, from the groundwater monitoring wells and the soil vapor monitoring points. Soil vapor samples will be collected from the influent to the SVE system when the system is in operation, at a frequency no less than twice annually, which may be adjusted as needed to guide timing of carbon change out events. All soil vapor samples will be analyzed for VOCs using EPA Method TO-15.
3.7.5.3 Decision-making Based on Soil Vapor Sampling Results
The soil vapor sampling results will be used to:
• Supplement groundwater sampling results in assessing potential threats to groundwater quality;
• Assess whether additional actions are needed.
Summary of Soil Vapor Modeling
An existing calibrated 3D vapor diffusion model is used to evaluate the effectiveness of the existing monitoring points and SVE influent in detecting a new release from a remote location within the landfill, and to develop thresholds for additional actions. Same as previous modeling effort, the model considers only the flow of vapor and contaminant transport in the vapor phase through advection and diffusion. Liquid flow and contaminant transport in the liquid phase are beyond the scope of the modeling work. The model is first validated using observed data between 2004 and 2010. Then the model is used to develop minimum extraction and injection rates and maximum length of shutdown as minimum operational parameters for the SVE system. Simulation results show that operating the SVE system 25% of the time is equally as
Page 3-21

Groundwater Monitoring
protective of groundwater quality as operating it 100% of the time, although operating the SVE system beyond these minimum parameters would have the benefits of detecting new releases sooner, if a new release occurs. Simulation results also show that the extraction well creates pressure responses around both landfill units. The simulation work is described in detail in the revised Appendix L.
To evaluate the effectiveness of the soil vapor monitoring system and SVE influent, SGS-Well and SGD-Well are set in extraction and injection modes, respectively, in the model, while the extraction and injection rates are set at the proposed minimum operational parameters of operating 25% of the time. A constant concentration source is assigned to a model cell in the southwest corner of unit B, which is furthest away from SGS-Well, to simulate a release at a remote location. The source concentration is set at saturated vapor concentration of the indicator compound. Simulation results suggest that (1) for impact to groundwater quality to occur, source concentrations in the landfill need to be at elevated levels that are sustained over long period of time (e.g. longer than 10 to 20 years); and (2) all existing monitoring points and the SVE influent will detect a sharp increase in soil vapor concentrations at least 10 years before any potential impact to groundwater quality may occur. Therefore, these results suggest that the existing monitoring points and SVE influent can be used to monitor release at a remote location within the landfill.
For seven VOCs, thresholds for additional actions are developed for each monitoring point and the SVE influent. The purpose of the thresholds is to initiate actions to investigate whether groundwater quality may be impacted, and, if necessary, implement further actions to prevent such impact. In each simulation, constant concentration at source is set either at groundwater protection level (GPL) or at soil saturation limit when calculated GPL is higher than soil saturation limit. With a sustained source at elevated concentration, simulated concentrations at monitoring points and in SVE influent continue to increase before stabilizing at a plateau concentration in 10 to 20 years. Because the thresholds are designed to initiate actions before VOCs migrate too far downward, it is proposed to use 10 percent of the simulated plateau concentrations as the thresholds for additional actions, which typically occurs around 5 to 10 years after the simulated release. Operating the SVE system beyond the minimum requirements would reduce the time for the thresholds to be detected at the monitoring points, if substantial releases occur. The proposed thresholds are presented in Table 8.
Additional Actions
When the concentrations of one of these VOCs exceed their thresholds in Table 8 and a statistically significant upward trend (using the Mann-Kendall test or equivalent method) is present, UA will take the following actions:
• Immediately contact the analytical laboratory to confirm the results and perform data quality control reviews and validation.
• Within one week of verifying the analytical results, inspect the system and verify that the system has been in operation in accordance with normal operational requirements.
Page 3-22

Groundwater Monitoring
• If there have been no system upsets and the system has been operating normally, perform monthly sampling at all soil vapor monitoring points for three consecutive months.
• If data from the three monthly sampling events confirm the exceedance of the thresholds and the upward trend, UA will consult with ADEQ about further actions and submit a Response Action Plan within approximately three months. These further actions may include:
a. Change SVE operation such that the SVE system at higher extraction/injection rates.
b. Enhancement or modification of the existing SVE system to allow vapor extraction from additional locations or vertical zones;
c. Perform shallow soil gas survey to investigate locations of potential release.
d. Install additional soil vapor monitoring or extraction/injection well.
4. REPORTING
Results of the groundwater and soil vapor monitoring will be included in a written semi-annual groundwater monitoring report for submittal to ADEQ. The report will be prepared by UA personnel or its designee and will be due within 90 days of each semi-annual sampling event. The following will be included in each groundwater monitoring report:
• A narrative that summarizes the groundwater and soil vapor monitoring events and results in the previous six months. Summary of results will include a description of all verified detections, tentative detections, exceedance of alert levels in groundwater samples (if any), exceedance of soil vapor thresholds in soil vapor samples (if any), and results of statistical tests (if necessary). Soil vapor monitoring results will include all soil vapor samples, including monitoring points, SVE influent, between lead and lag adsorbent vessels, and SVE effluent. The narrative will also include any deviations from the EGDMP (if any) and any unusual conditions (if encountered).
• A narrative that summarizes operation of the SVE system (including runtime, downtime, flow rates)
• A description of maintenance activities, problems encountered, and corrective action implemented.
• QA/QC assessment of laboratory results and field measurements.
• Data from all groundwater and soil vapor sampling events presented in tabular or graphical format, including:
o groundwater and soil vapor field parameters (depth to groundwater, pH, temperature, specific conductance, PID readings, vacuum pressure and flow rate),
o analyses results (including all QA/QC samples),
Page 3-23

Groundwater Monitoring
Page 3-24
o graphs of concentrations at each soil vapor monitoring locations for the previous five years.
• Field documents and laboratory reports for all monitoring events.
o sampling logs,
o chain-of-custody forms,
o Laboratory analytical reports.
• Certification by UA or UA’s authorized agent.

SECTION 4
PROCEDURES TO PREVENT HAZARDS
SECURITY
Fence
The entire facility is enclosed by a 6-foot chain-link fence (with 45-degree barb wire on top), which surrounds both Units A and Unit B, all monitoring wells, and soil vapor extraction equipment. The fence posts are made of steel and are set in concrete (see Figure 1).
Gates
The access to the facility is through three 24-foot rolling gates (two on the east boundary and one on the north boundary (see Figure 1). The facility gates are kept locked at all times when UA personnel or their representatives are not at the facility.
Signage
Warning signs are posted on all sides of the perimeter enclosure and at each entrance gate. Wording includes: “Danger – Unauthorized Personnel Keep Out”, and are legible from 25 feet.

INSPECTION SCHEDULE
The post-closure period facility inspection will be performed quarterly; inspection schedule (frequency and structures/facilities to be inspected) is described in Section 6 and Appendix D.
RUN-ON AND RUN-OFF CONTROL SYSTEM
Run-On Control
Surface water drainage around the facility is generally to the west and southwest. The storm water run-on control system consists of storm water drainage channels and culverts (see Figure 1). The storm water run-on from the surrounding area to the northeast and east is controlled by storm water channels, which, in turn, convey and dissipate the flows into the surrounding area. Inspection of drainage structures is described in Section 6 and Appendix D.
Run-Off Control
The final grading of the caps drains the surfaces to the perimeters of each unit: northeast and southwest at Unit A, and north and south at Unit B (see Figure 1). Storm water then flows as sheet flow to the surrounding area.

Contingency Plan
Page 5-1
SECTION 5
CONTINGENCY PLAN
A Post-Closure Contingency Plan is included as Attachment E. The information contained in this plan provides the actions to be taken in the event of an emergency at Page Ranch Landfill. Non-emergency procedures related to monitoring, maintenance, and non-emergency first aid, can be found in Appendices B, D and F, respectively.

Post-Closure Plans
Page 6-1
SECTION 6
POST-CLOSURE PLANS
INSPECTION PLAN
The following is a summary of a proposed site inspection plan, which is contained in the Post-Closure Inspection and Maintenance Plan (see Attachment D). In addition, the inspection plan for the soil vapor extraction (SVE) system is described in the Operation and Maintenance Manual for the SVE system (Appendix G). During the post-closure period, the UA staff will perform quarterly inspections of the site. Facility inspection report forms shall be completed during each site inspection and filed in the facility files at the UA Department of Risk Management Services. Site inspection will cover the following:
Access roads
Erosion Vegetation growth
Perimeter Fencing, Gates, and Signage
Damage Integrity of locks on all gates Integrity of metal gates on the culverts Digging around the fence base Presence and legibility of signs Presence of excessive vegetation around entrance gates
Final Cover
Integrity Vegetative cover density/distressed vegetation Woody vegetation growth
Drainage Structures
Erosion Debris Excessive vegetation
Groundwater Monitoring and Soil Vapor Enclosures
Deterioration Vandalism

Post-Closure Plans
Page 6-2
Groundwater Monitoring Well and Soil Vapor Pumps (to be inspected during sampling events)
Proper functioning
Survey Monuments
Damage Evidence of tempering
GROUNDWATER MONITORING PLAN
A Post-Closure Groundwater Detection Monitoring Plan is shown in Appendix B and discussed in Section 3 of this application.
MAINTENANCE PLAN
The following is a summary of the proposed site maintenance plan, which is contained in the Post-Closure Inspection and Maintenance Plan (see Attachment D). During the post-closure period, site maintenance/repairs will be performed either by the UA staff or their subcontractors as soon as practicable after their discovery. Facility maintenance/repair report forms shall be completed for each maintenance/repair event and filed in the facility files at the UA Department of Risk Management Services. Site maintenance will include the following:
Access Roads
Road damage repairs Mowing of access roads
Perimeter Fencing, Gates, and Signage
Repairs Replacement of locks on gates Repair of metal gates on culverts Replacement of missing or unreadable signs Mowing of entrance gates
Final Cover
Integrity damage repairs Reseeding of repaired or impacted areas Removal of any woody vegetation
Drainage Structures
Maintenance of flow capability in culverts Repairing damaged slopes

Post-Closure Plans
Page 6-3
Groundwater Monitoring Wells
Repair or replacement of well covers and concrete bases Video logging of wells, if warranted by well conditions Replacement/repair of well pumps and any other equipment
Survey Monuments
Re-establishment of damaged monuments.
POST-CLOSURE SECURITY
Security of the facility during the post-closure period is discussed in Section 4 of this application.
POST-CLOSURE CONTACT
Steven C. Holland, Assistant Vice President Department of Risk Management Services University of Arizona 12561 E. Sonoran Ridge Drive Tucson, Arizona 85749 (520) 621-1790 (work) (520) 349-4273 (cell)
NOTICES
Certification of Closure
The letter of Certification of Closure is included in Appendix M.
Survey Plat
Survey Plat is included as Figure 5.
Notation in Deed
On March 9, 2012, and updated Post Closure Notice document containing the information required by 40CFR §264.119(b) was recorded with the Pinal County Recorder (Fee Number 2012-019244). This document includes a legal description and facility description of the PTRL, statements of property use restriction, the Owner’s and Engineer’s Certification of Closure from 1998, a previous closure notice recorded with the PTRL property deed in 1986, a survey plat showing the burial areas and permanent benchmarks, and an inventory of wastes buried at PTRL. The complete recorded document is included in Appendix N.
Also included in Appendix N is a certification statement from the UA Authorized Official to the Director of ADEQ documenting that the required information has been properly recorded with the zoning authority for the property, which is Pinal County.

Post-Closure Plans
Page 6-4
On May 27, 1986, the UA submitted to the Pinal County Zoning Director and the EPA Regional Administrator a notice recorded in the deed to the facility property, that burial activities had ceased and that the use of this land is restricted due to its use for hazardous waste disposal. However, it could not be verified that this notice was updated and submitted as a Post Closure Notice to the zoning authority and Regional Administrator following completion of closure construction. For this reason, the comprehensive document described above was recorded with the Pinal County Recorder’s Office as zoning authority on March 9, 2012. A certification of this filing was submitted to the ADEQ Director on March 12, 2012. This action ensures that the presence of the landfill and the property use restriction is connected to the property deed for perpetuity, and available through a simple search to any future purchaser of the PTRL property.
If during the post-closure period the UA wishes to remove wastes from the landfill, then a modification to the permit will be requested. In accordance with the requirements of 40CFR §264 Subpart G, if all wastes are removed, then deed restrictions may be removed or modified at that time to indicate removal.

Other Federal Laws
Page 7-1
SECTION 7
OTHER FEDERAL LAWS
Page Ranch Landfill is not subject to the requirements of any other applicable Federal Laws.
Owner’s Certification
Page 8-1
SECTION 8
OWNE R ’S C E R TIF IC AT ION
Owner’s Certification is attached on the following page.
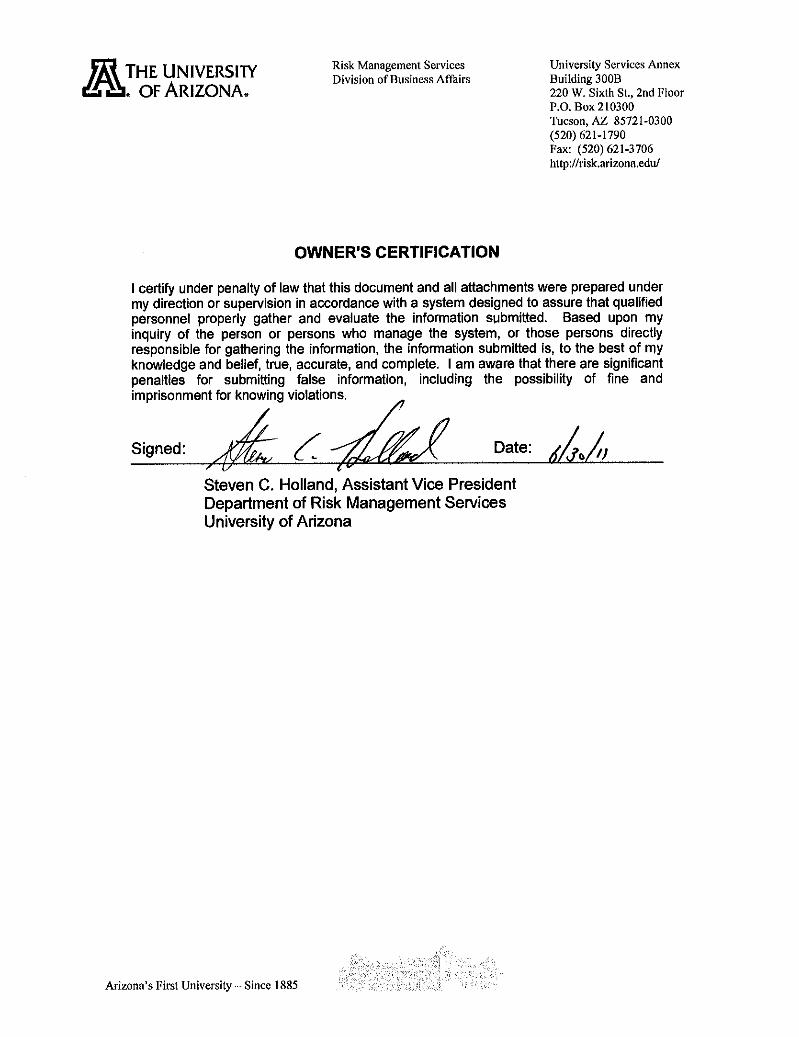
References
SECTION 9
REFERENCES
Arizona Department of Environmental Quality (ADEQ), 1986, Page-Trowbridge Ranch Disposal Facility Comprehensive Groundwater Monitoring Inspection, July.
ADEQ, 1996, Comprehensive Monitoring Evaluation of Page-Ranch Landfill Owned and Operated by the University of Arizona, Tucson, Arizona, Prepared by Kurt Zeppetello, Hydrogeologist.
ADEQ, 2001, Final Permit Decision and Response to Comments: University of Arizona Page-Trowbridge Ranch Landfill; EPA ID No. AZD980665814, November 6.
AMEC Earth & Environment (AMEC), 2008, Soil Vapor Summary for the Page-Trowbridge Ranch Landfill, December 2007 Sampling Event, January.
AMEC, 2009, Human Health Risk Assessment, November 18.
Environmental Engineering Consultants, Inc. (EEC), 1989a, Groundwater Gradient North of Page-Trowbridge Ranch landfill. December 9, 1988 (Revised March 11, 1989).
EEC, 1989b, Subsurface Soil Investigation Report, Phase Two, Page-Trowbridge Ranch Landfill, March 22, 1989 (Revised June 9, 1989).
EEC, 1990, Report on the Results of Phase 3 Subsurface Soil Sampling at the University of Arizona Page Ranch Landfill Near Oracle, Arizona, May 3.
EEC, 1991, Page Ranch Replacement Well, Monitoring Well MW-5, August 29.
Errol L. Montgomery & Associates, Inc. (EMA), 1985, Results of Monitor Well Construction, Monitor Wells MW-1, MW-2, MW-3, and MW-4, May 17.
EMA, 1987, Results of Pumping Test for Monitor Well (0-9-14)34bcc2 [MW-3], August 4.
Hargis & Montgomery, Inc., 1983, Hydrogeologic Conditions Page-Trowbridge Ranch Disposal Facility, Pinal County, Arizona, June 29.
Howard, P.H. (ed.), 1991, Handbook of Environmental Fate and Exposure Data for Organic Chemicals, Volume I, Large Production and Priority Pollutants and Volume III Pesticides. Ann Arbor: Lewis Publishers.
Hydro Geo Chem, Inc. (HGC), 1988, Evaluation of Hydrogeologic Conditions at the Page-Trowbridge Ranch Landfill. Letter Report, September 9.
HGC, 1989, Soil Gas Survey of the Page-Trowbridge Ranch Landfill, January 1.
Page 9-1

References
Page 9-2
HGC, 2003, Post-Closure Period Expanded Groundwater Detection Monitoring Plan, June 27.
HGC, 2004a, Interim Measures Investigation Report, June 8. HGC, 2004b, Expanded Groundwater Detection Monitoring Plan, October 13.
HGC, 2005, Preliminary Screening Risk Assessment, January 20.
HGC, 2009, Monthly SVE Operation Report – September 2009, October 9.
Montgomery, J.H., 1993, Agrochemicals Desk Reference: Environmental Data. Ann Arbor: Lewis Publishers.
Osterkamp, W.O., 1974, Map Showing Groundwater Velocities in the Uppermost Saturated Alluvial Deposits of the Tucson Area, Arizona. U.S. Geological Survey, Map No. 1-844-K.
Rust Environment & Infrastructure (RUST), 1995, Closure Plan, Page-Trowbridge Ranch Landfill, EPA I.D. Number AZD 980665814, March.
SCS Engineers (SCS), 1996a, Modifications to the Closure Plan for Page-Trowbridge Ranch Landfill, EPA I.D. No. 980665814, June 27.
SCS, 1996b, Project Manual for Final Cover System Installation, Page-Trowbridge Ranch Landfill, Oracle Junction, Arizona, September 3.
SCS, 1996c, University of Arizona, Page-Trowbridge Ranch Landfill, Closure Construction Plans, September 4.
SCS, 1998, Page-Trowbridge Ranch Landfill Construction Documentation Report for Final Cover System for Cells A and B, February 5.
Triegel, E.K. and L. Guo, 1994, Overview of the Fate of Pesticides in the Environment, Water Balance Runoff vs. Leaching, in Mechanisms of Pesticide Movement into Ground Water, Ann Arbor: Lewis Publishers.
University of Arizona (UA), 1994, Interim-Status Groundwater Sampling and Analysis Plan, Page-Trowbridge Ranch Disposal Facility, Revision April 4.
UA, 1997, RCRA Part B Post-Closure Permit Application, Page-Trowbridge Ranch Landfill.
Weber, J.B., 1994, Properties and Behavior of Pesticides in Soil, in Mechanisms of Pesticide Movement into Ground Water, Ann Arbor: Lewis Publishers.
Weston Solutions, Inc. (Weston), 2003, Technical Memorandum: Interim Measure Task 1, Soil and Soil Gas Sampling Investigation, March.