table 3. education indicators, by barangay, province of ... · education indicators, by barangay,...
TRANSCRIPT
412
The Many Faces of Poverty (Volume 3)
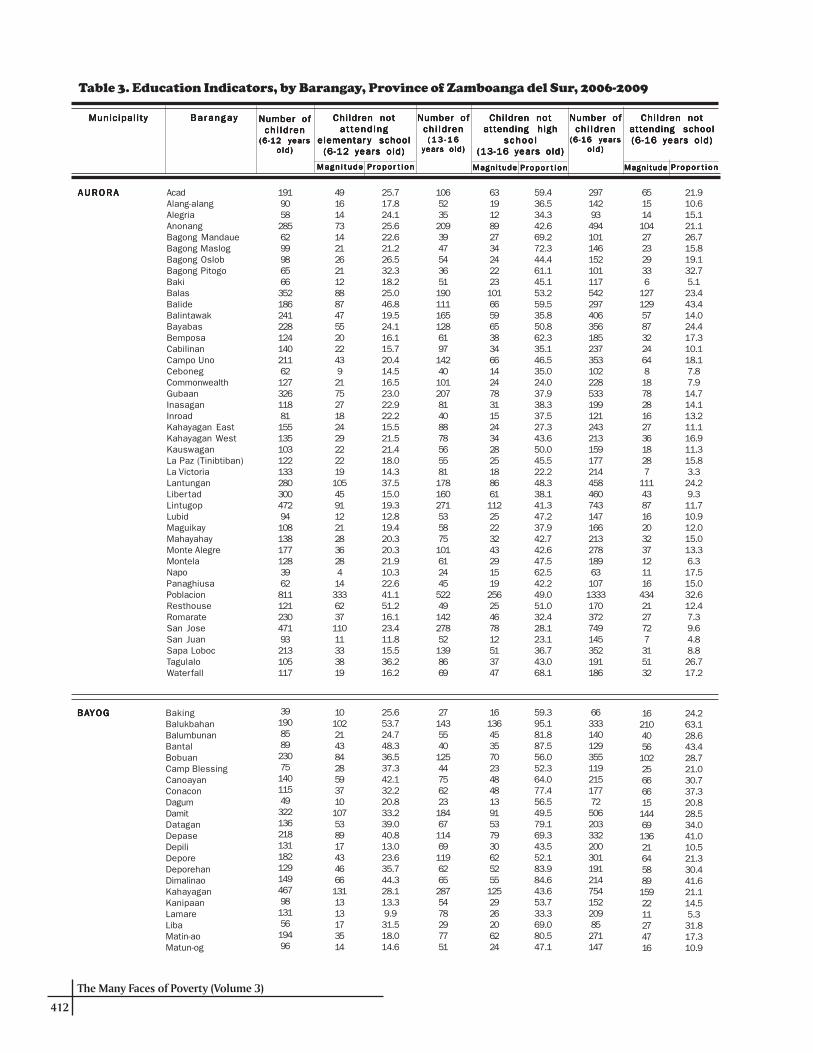
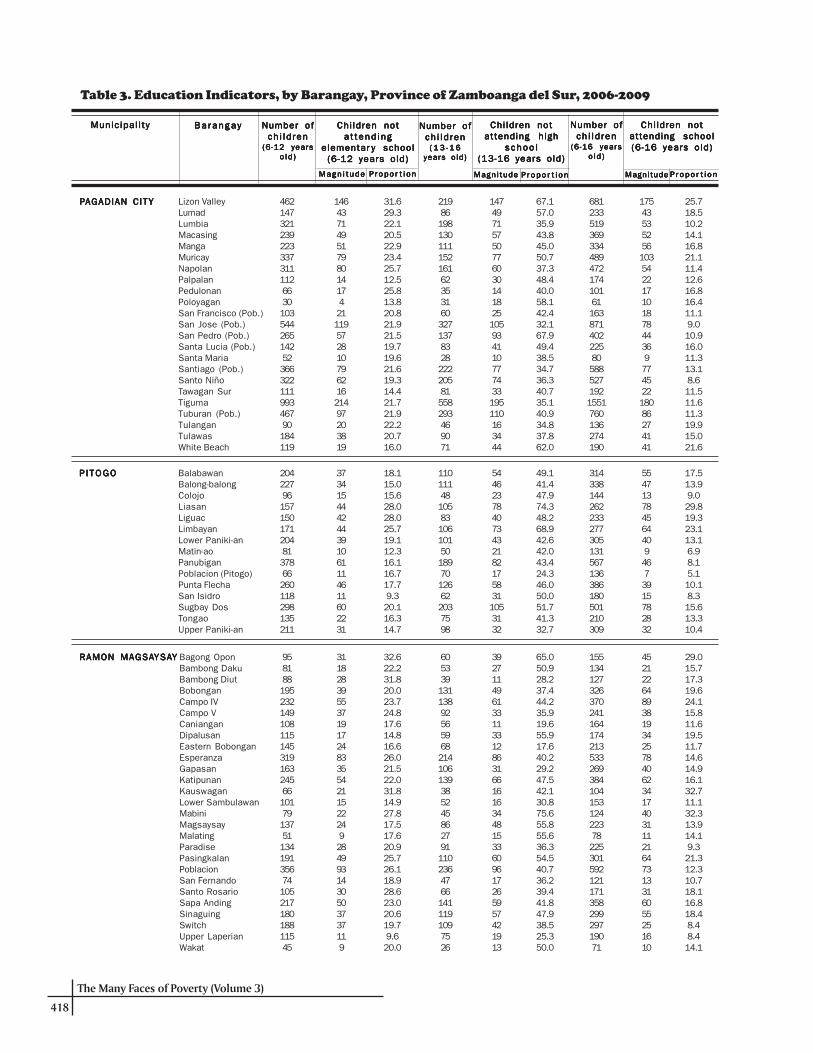
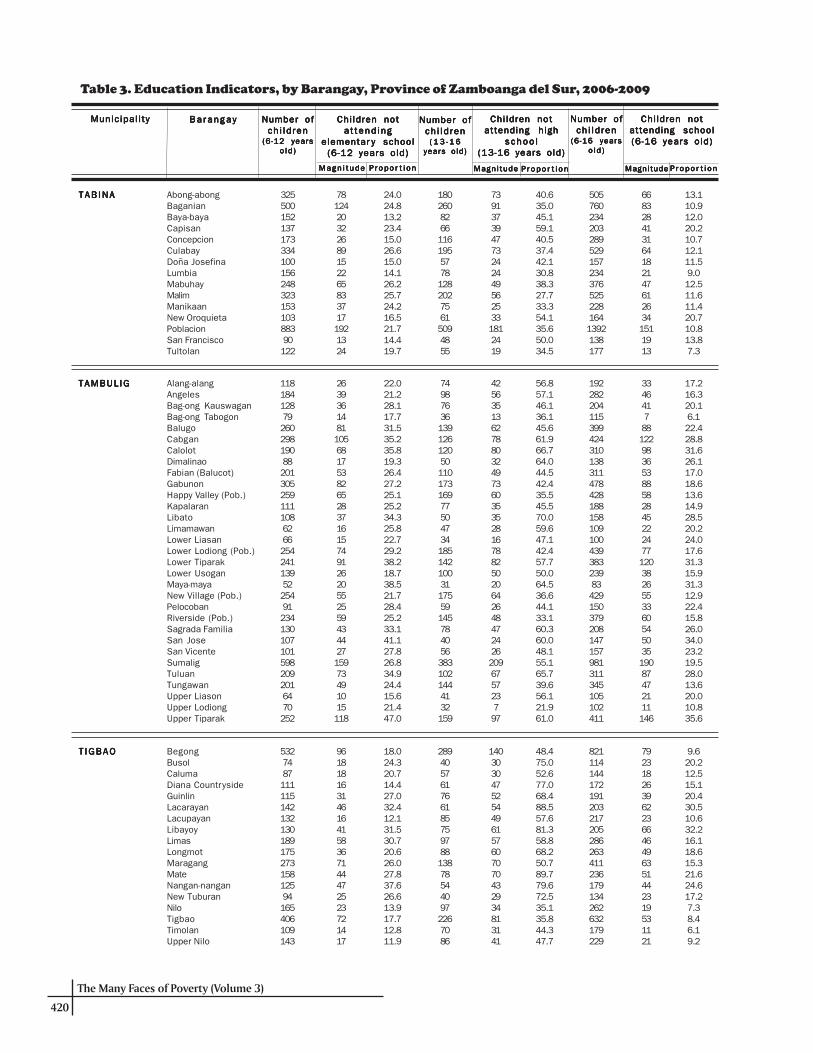
Table 3. Education Indicators, by Barangay, Province of Zamboanga del Sur, 2006-2009
Number ofNumber ofNumber ofNumber ofNumber ofch i ld rench i ld rench i ld rench i ld rench i ld ren
(6-12 years(6-12 years(6-12 years(6-12 years(6-12 yearso ld )o ld )o ld )o ld )o ld )
Chi ldren notChi ldren notChi ldren notChi ldren notChi ldren nota t tend inga t tend inga t tend inga t tend inga t tend ing
elementarelementarelementarelementarelementar y schooly schooly schooly schooly school(6-12 years old)(6-12 years old)(6-12 years old)(6-12 years old)(6-12 years old)
Number ofNumber ofNumber ofNumber ofNumber ofch i ld rench i ld rench i ld rench i ld rench i ld ren( 1 3 - 1 6( 1 3 - 1 6( 1 3 - 1 6( 1 3 - 1 6( 1 3 - 1 6
years old)years old)years old)years old)years old)
Chi ldren notChi ldren notChi ldren notChi ldren notChi ldren notattending highattending highattending highattending highattending high
schoo lschoo lschoo lschoo lschoo l(13-16 years old)(13-16 years old)(13-16 years old)(13-16 years old)(13-16 years old)
Number ofNumber ofNumber ofNumber ofNumber ofch i ld rench i ld rench i ld rench i ld rench i ld ren
(6-16 years(6-16 years(6-16 years(6-16 years(6-16 yearso ld )o ld )o ld )o ld )o ld )
Chi ldren notChi ldren notChi ldren notChi ldren notChi ldren notattending schoolattending schoolattending schoolattending schoolattending school(6-16 years old)(6-16 years old)(6-16 years old)(6-16 years old)(6-16 years old)
Ba r anga yBa ranga yBa ranga yBa ranga yBa ranga yMunic ipal i tyMunic ipal i tyMunic ipal i tyMunic ipal i tyMunic ipal i ty
Magn i t udeMagn i t udeMagn i t udeMagn i t udeMagn i t ude Magn i tudeMagn i tudeMagn i tudeMagn i tudeMagn i tude MagnitudeMagnitudeMagnitudeMagnitudeMagnitudeP rP rP rP rP r opo ropo ropo ropo ropo r t i o nt i o nt i o nt i o nt i o n P rP rP rP rP r opo ropo ropo ropo ropo r t i o nt i o nt i o nt i o nt i o n P rP rP rP rP r opo ropo ropo ropo ropo r t i o nt i o nt i o nt i o nt i o n
AURORAAURORAAURORAAURORAAURORA AcadAlang-alangAlegriaAnonangBagong MandaueBagong MaslogBagong OslobBagong PitogoBakiBalasBalideBalintawakBayabasBemposaCabilinanCampo UnoCebonegCommonwealthGubaanInasaganInroadKahayagan EastKahayagan WestKauswaganLa Paz (Tinibtiban)La VictoriaLantunganLiber tadLintugopLubidMaguikayMahayahayMonte AlegreMontelaNapoPanaghiusaPoblacionResthouseRomarateSan JoseSan JuanSapa LobocTagulaloWaterfall
BABABABABAYOGYOGYOGYOGYOG BakingBalukbahanBalumbunanBantalBobuanCamp BlessingCanoayanConaconDagumDamitDataganDepaseDepiliDeporeDeporehanDimalinaoKahayaganKanipaanLamareLibaMatin-aoMatun-og
19190582856299986566352186241228124140211621273261188115513510312213328030047294108138177128396281112123047193213105117
49161473142126211288874755202243921752718242922221910545911221283628414333623711011333819
25.717.824.125.622.621.226.532.318.225.046.819.524.116.115.720.414.516.523.022.922.215.521.521.418.014.337.515.019.312.819.420.320.321.910.322.641.151.216.123.411.815.536.216.2
106523520939475436511901111651286197142401012078140887856558117816027153587510161244552249142278521398669
6319128927342422231016659653834661424783115243428251886611122522324329151925625467812513747
59.436.534.342.669.272.344.461.145.153.259.535.850.862.335.146.535.024.037.938.337.527.343.650.045.522.248.338.141.347.237.942.742.647.562.542.249.051.032.428.123.136.743.068.1
29714293494101146152101117542297406356185237353102228533199121243213159177214458460743147166213278189631071333170372749145352191186
651514104272329336
1271295787322464818782816273618287
1114387162032371211164342127727315132
21.910.615.121.126.715.819.132.75.123.443.414.024.417.310.118.17.87.914.714.113.211.116.911.315.83.324.29.311.710.912.015.013.36.317.515.032.612.47.39.64.88.826.717.2
3919085892307514011549322136218131182129149467981315619496
10102214384285937101075389174346661311313173514
25.653.724.748.336.537.342.132.220.833.239.040.813.023.635.744.328.113.39.931.518.014.6
27143554012544756223184671146911962652875478297751
1613645357023484813915379306252551252926206224
59.395.181.887.556.052.364.077.456.549.579.169.343.552.183.984.643.653.733.369.080.547.1
663331401293551192151777250620333220030119121475415220985271147
1621040561022566661514469136216458891592211274716
24.263.128.643.428.721.030.737.320.828.534.041.010.521.330.441.621.114.55.331.817.310.9
The Many Faces of Poverty (Volume 3)
413
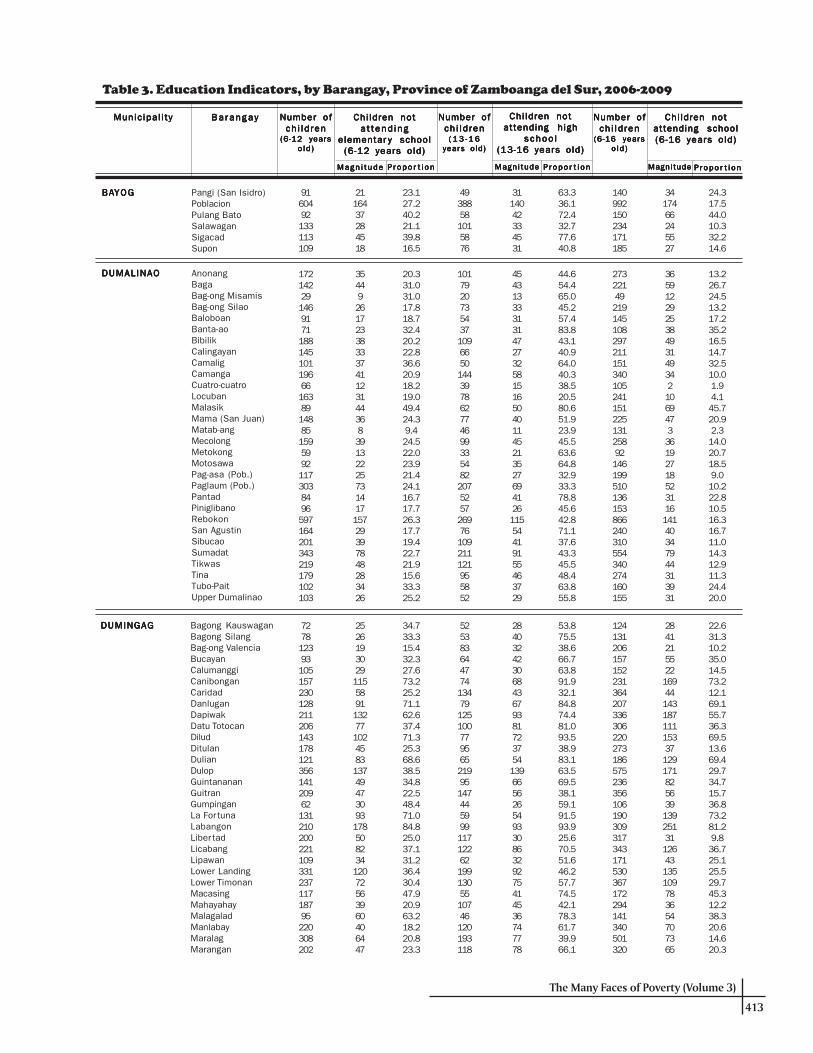
Table 3. Education Indicators, by Barangay, Province of Zamboanga del Sur, 2006-2009
Number ofNumber ofNumber ofNumber ofNumber ofch i ld rench i ld rench i ld rench i ld rench i ld ren
(6-12 years(6-12 years(6-12 years(6-12 years(6-12 yearso ld )o ld )o ld )o ld )o ld )
Chi ldren notChi ldren notChi ldren notChi ldren notChi ldren nota t tend inga t tend inga t tend inga t tend inga t tend ing
elementarelementarelementarelementarelementar y schooly schooly schooly schooly school(6-12 years old)(6-12 years old)(6-12 years old)(6-12 years old)(6-12 years old)
Number ofNumber ofNumber ofNumber ofNumber ofch i ld rench i ld rench i ld rench i ld rench i ld ren( 1 3 - 1 6( 1 3 - 1 6( 1 3 - 1 6( 1 3 - 1 6( 1 3 - 1 6
years old)years old)years old)years old)years old)
Chi ldren notChi ldren notChi ldren notChi ldren notChi ldren notattending highattending highattending highattending highattending high
schoo lschoo lschoo lschoo lschoo l(13-16 years old)(13-16 years old)(13-16 years old)(13-16 years old)(13-16 years old)
Number ofNumber ofNumber ofNumber ofNumber ofch i ld rench i ld rench i ld rench i ld rench i ld ren
(6-16 years(6-16 years(6-16 years(6-16 years(6-16 yearso ld )o ld )o ld )o ld )o ld )
Chi ldren notChi ldren notChi ldren notChi ldren notChi ldren notattending schoolattending schoolattending schoolattending schoolattending school(6-16 years old)(6-16 years old)(6-16 years old)(6-16 years old)(6-16 years old)
Ba r anga yBa ranga yBa ranga yBa ranga yBa ranga yMunic ipal i tyMunic ipal i tyMunic ipal i tyMunic ipal i tyMunic ipal i ty
Magn i t udeMagn i t udeMagn i t udeMagn i t udeMagn i t ude Magn i tudeMagn i tudeMagn i tudeMagn i tudeMagn i tude MagnitudeMagnitudeMagnitudeMagnitudeMagnitudeP rP rP rP rP r opo ropo ropo ropo ropo r t i o nt i o nt i o nt i o nt i o n P rP rP rP rP r opo ropo ropo ropo ropo r t i o nt i o nt i o nt i o nt i o n P rP rP rP rP r opo ropo ropo ropo ropo r t i o nt i o nt i o nt i o nt i o n
BABABABABAYOGYOGYOGYOGYOG Pangi (San Isidro)PoblacionPulang BatoSalawaganSigacadSupon
DUMALINAODUMALINAODUMALINAODUMALINAODUMALINAO AnonangBagaBag-ong MisamisBag-ong SilaoBaloboanBanta-aoBibilikCalingayanCamaligCamangaCuatro-cuatroLocubanMalasikMama (San Juan)Matab-angMecolongMetokongMotosawaPag-asa (Pob.)Paglaum (Pob.)PantadPiniglibanoRebokonSan AgustinSibucaoSumadatTikwasTinaTubo-PaitUpper Dumalinao
DUMINGAGDUMINGAGDUMINGAGDUMINGAGDUMINGAG Bagong KauswaganBagong SilangBag-ong ValenciaBucayanCalumanggiCanibonganCaridadDanluganDapiwakDatu TotocanDiludDitulanDulianDulopGuintanananGuitranGumpinganLa For tunaLabangonLiber tadLicabangLipawanLower LandingLower TimonanMacasingMahayahayMalagaladManlabayMaralagMarangan
9160492133113109
2116437284518
23.127.240.221.139.816.5
49388581015876
3114042334531
63.336.172.432.777.640.8
140992150234171185
3417466245527
24.317.544.010.332.214.6
17214229146917118814510119666163891488515959921173038496597164201343219179102103
35449261723383337411231443683913222573141715729397848283426
20.331.031.017.818.732.420.222.836.620.918.219.049.424.39.424.522.023.921.424.116.717.726.317.719.422.721.915.633.325.2
10179207354371096650144397862774699335482207525726976109211121955852
4543133331314727325815165040114521352769412611554419155463729
44.654.465.045.257.483.843.140.964.040.338.520.580.651.923.945.563.664.832.933.378.845.642.871.137.643.345.548.463.855.8
2732214921914510829721115134010524115122513125892146199510136153866240310554340274160155
36591229253849314934210694733619271852311614140347944313931
13.226.724.513.217.235.216.514.732.510.01.94.145.720.92.314.020.718.59.010.222.810.516.316.711.014.312.911.324.420.0
7278123931051572301282112061431781213561412096213121020022110933123711718795220308202
252619302911558911327710245831374947309317850823412072563960406447
34.733.315.432.327.673.225.271.162.637.471.325.368.638.534.822.548.471.084.825.037.131.236.430.447.920.963.218.220.823.3
5253836447741347912510077956521995147445999117122621991305510746120193118
2840324230684367938172375413966562654933086329275414536747778
53.875.538.666.763.891.932.184.874.481.093.538.983.163.569.538.159.191.593.925.670.551.646.257.774.542.178.361.739.966.1
124131206157152231364207336306220273186575236356106190309317343171530367172294141340501320
284121552216944143187111153371291718256391392513112643135109783654707365
22.631.310.235.014.573.212.169.155.736.369.513.669.429.734.715.736.873.281.29.836.725.125.529.745.312.238.320.614.620.3

414
The Many Faces of Poverty (Volume 3)
Table 3. Education Indicators, by Barangay, Province of Zamboanga del Sur, 2006-2009
Number ofNumber ofNumber ofNumber ofNumber ofch i ld rench i ld rench i ld rench i ld rench i ld ren
(6-12 years(6-12 years(6-12 years(6-12 years(6-12 yearso ld )o ld )o ld )o ld )o ld )
Chi ldren notChi ldren notChi ldren notChi ldren notChi ldren nota t tend inga t tend inga t tend inga t tend inga t tend ing
elementarelementarelementarelementarelementar y schooly schooly schooly schooly school(6-12 years old)(6-12 years old)(6-12 years old)(6-12 years old)(6-12 years old)
Number ofNumber ofNumber ofNumber ofNumber ofch i ld rench i ld rench i ld rench i ld rench i ld ren( 1 3 - 1 6( 1 3 - 1 6( 1 3 - 1 6( 1 3 - 1 6( 1 3 - 1 6
years old)years old)years old)years old)years old)
Chi ldren notChi ldren notChi ldren notChi ldren notChi ldren notattending highattending highattending highattending highattending high
schoo lschoo lschoo lschoo lschoo l(13-16 years old)(13-16 years old)(13-16 years old)(13-16 years old)(13-16 years old)
Number ofNumber ofNumber ofNumber ofNumber ofch i ld rench i ld rench i ld rench i ld rench i ld ren
(6-16 years(6-16 years(6-16 years(6-16 years(6-16 yearso ld )o ld )o ld )o ld )o ld )
Chi ldren notChi ldren notChi ldren notChi ldren notChi ldren notattending schoolattending schoolattending schoolattending schoolattending school(6-16 years old)(6-16 years old)(6-16 years old)(6-16 years old)(6-16 years old)
Ba r anga yBa ranga yBa ranga yBa ranga yBa ranga yMunic ipal i tyMunic ipal i tyMunic ipal i tyMunic ipal i tyMunic ipal i ty
Magn i t udeMagn i t udeMagn i t udeMagn i t udeMagn i t ude Magn i tudeMagn i tudeMagn i tudeMagn i tudeMagn i tude MagnitudeMagnitudeMagnitudeMagnitudeMagnitudeP rP rP rP rP r opo ropo ropo ropo ropo r t i o nt i o nt i o nt i o nt i o n P rP rP rP rP r opo ropo ropo ropo ropo r t i o nt i o nt i o nt i o nt i o n P rP rP rP rP r opo ropo ropo ropo ropo r t i o nt i o nt i o nt i o nt i o n
DUMINGAGDUMINGAGDUMINGAGDUMINGAGDUMINGAG New BasakSaadSalvadorSan JuanSan Pablo (Pob.)San Pedro (Pob.)San VicenteSenoteSinonokSunopTagunTamurayanUpper LandingUpper Timonan
GU IPOSGUIPOSGUIPOSGUIPOSGUIPOS Bagong OroquietaBaguitanBalongatingCanunanDacsolDagohoyDalapangDataganGulingKatipunanLintumLitanMagtingPoblacion (Guipos)ReglaSikatunaSingclot
JOSEF INAJOSEF INAJOSEF INAJOSEF INAJOSEF INA Bogo CalabatDawa (Diwa)EbarleGumahan (Pob.)LeonardoLitapanLower Bagong TudelaMansanasMoradjiNemeñoNopulanSebukangTagaytay HillUpper Bagong Tudela
KUMALARANGKUMALARANGKUMALARANGKUMALARANGKUMALARANG BogayoBolisongBoyugan EastBoyugan WestBualanDiploGawilGusomKitaan DagatLantawanLimamawanMahayahayPangiPicananPoblacionSalagmanokSecadeSuminalum
17413823953278533931451171045977246213
48779612691254735755818227457
27.655.840.222.624.823.550.524.164.155.830.528.630.126.8
966411530217325548556403937142119
426110017741084348483432307154
43.895.387.056.734.133.279.656.585.785.082.181.150.045.4
2702023548349585814723017314498114388332
608514315679374461017537268966
22.242.140.418.113.510.850.320.058.452.137.822.822.919.9
23220019929310595147149281189114935850214462186
17233050921293651321417107821445
7.311.515.117.18.622.119.724.218.116.912.318.317.215.514.66.524.2
16713113616660599690158123675838316843984
7153475938286569676437291897402154
42.540.534.635.563.347.567.776.742.452.055.250.047.430.747.653.864.3
39933133545916515424323943931218115196818228101270
393530392010495256413191564271739
9.810.69.08.512.16.520.221.812.813.117.16.015.67.811.816.814.4
16514372202101684011966561516544245
4639153241121026854010961
27.927.320.815.840.617.625.021.812.18.926.515.420.524.9
847643109493231752926723424157
462732342617937141045181479
54.835.574.431.253.153.129.049.348.338.562.552.958.350.3
2492191153111501007119495822239968402
42222310391392513754101056
16.910.020.03.226.013.012.712.913.78.524.210.114.713.9
1981441712081493592091301584273123135346889131147248
394569624513043275513372837117235264270
19.731.340.429.830.236.220.620.834.831.050.722.827.433.826.519.828.628.2
13583107921052771057788174972812155579890125
806471677319652505614444145116251624876
59.377.166.472.869.571.049.564.963.682.489.856.955.654.045.163.353.360.8
556168743821249294620452545135257563757
333227278300254636314207246591221952165611446229237373
16.526.924.524.715.033.315.614.018.733.936.912.820.824.117.824.515.615.3

The Many Faces of Poverty (Volume 3)
415
Table 3. Education Indicators, by Barangay, Province of Zamboanga del Sur, 2006-2009
Number ofNumber ofNumber ofNumber ofNumber ofch i ld rench i ld rench i ld rench i ld rench i ld ren
(6-12 years(6-12 years(6-12 years(6-12 years(6-12 yearso ld )o ld )o ld )o ld )o ld )
Chi ldren notChi ldren notChi ldren notChi ldren notChi ldren nota t tend inga t tend inga t tend inga t tend inga t tend ing
elementarelementarelementarelementarelementar y schooly schooly schooly schooly school(6-12 years old)(6-12 years old)(6-12 years old)(6-12 years old)(6-12 years old)
Number ofNumber ofNumber ofNumber ofNumber ofch i ld rench i ld rench i ld rench i ld rench i ld ren( 1 3 - 1 6( 1 3 - 1 6( 1 3 - 1 6( 1 3 - 1 6( 1 3 - 1 6
years old)years old)years old)years old)years old)
Chi ldren notChi ldren notChi ldren notChi ldren notChi ldren notattending highattending highattending highattending highattending high
schoo lschoo lschoo lschoo lschoo l(13-16 years old)(13-16 years old)(13-16 years old)(13-16 years old)(13-16 years old)
Number ofNumber ofNumber ofNumber ofNumber ofch i ld rench i ld rench i ld rench i ld rench i ld ren
(6-16 years(6-16 years(6-16 years(6-16 years(6-16 yearso ld )o ld )o ld )o ld )o ld )
Chi ldren notChi ldren notChi ldren notChi ldren notChi ldren notattending schoolattending schoolattending schoolattending schoolattending school(6-16 years old)(6-16 years old)(6-16 years old)(6-16 years old)(6-16 years old)
Ba r anga yBa ranga yBa ranga yBa ranga yBa ranga yMunic ipal i tyMunic ipal i tyMunic ipal i tyMunic ipal i tyMunic ipal i ty
Magn i t udeMagn i t udeMagn i t udeMagn i t udeMagn i t ude Magn i tudeMagn i tudeMagn i tudeMagn i tudeMagn i tude MagnitudeMagnitudeMagnitudeMagnitudeMagnitudeP rP rP rP rP r opo ropo ropo ropo ropo r t i o nt i o nt i o nt i o nt i o n P rP rP rP rP r opo ropo ropo ropo ropo r t i o nt i o nt i o nt i o nt i o n P rP rP rP rP r opo ropo ropo ropo ropo r t i o nt i o nt i o nt i o nt i o n
LABANGANLABANGANLABANGANLABANGANLABANGAN BagalupaBalimbinganBinayanBokongBulanitCogonanComboDalapangDimasangcaDipayaLangapodLantianLower Campo IslamLower PulacanLower Sang-anNew LabanganNoboranOld LabanganSan IsidroSanta CruzTapodocTawagan NorteUpper Campo IslamUpper PulacanUpper Sang-an
LAKEWOODLAKEWOODLAKEWOODLAKEWOODLAKEWOOD Bagong KahayagBakingBiswanganBululawanDagumGasaGatubLukuanMatalangPoblacion (Lakewood)Sapang PinolesSebugueyTiwalesTubod
LAPUYLAPUYLAPUYLAPUYLAPUYANANANANAN BulawanCarpocDangananDansalDumaraLinokmadalumLuananLubusanMahalingebMandegMaralagMaruingMolumPampangPantadPingalayPoblacionSalambuyanSan JoseSayogTabonTalababTiguhaTininghalangTipasanTugaya
147190199235317366149232115141296300196215178317265217212184220397188571233
3231425470199487428419857384251851016348295361398460
21.816.321.123.022.154.432.231.924.329.133.119.019.419.528.726.838.129.022.615.824.115.420.714.725.8
1011111121511611807311964801571751161348813513111211212298257122434119
565851608015137624734107745538427611655514642724812363
55.452.345.540.049.783.950.752.173.442.568.242.347.428.447.756.388.549.145.537.742.928.039.328.352.9
2483013113864785462223511792214534753123492664523963293243063186543101005352
4147385210527444764442135594731471001304354344739456971
16.515.612.213.522.050.219.821.724.619.029.812.415.18.917.722.132.813.116.711.114.86.014.56.920.2
303284242171139991967111883411885132545
8213799288144592180270475094153
27.148.240.916.458.344.430.129.667.832.439.858.871.228.1
20716910114572541024278465634859318
11412875696946563077254434453150
55.175.774.347.995.885.254.971.498.754.769.491.789.847.2
5104533433162111532981131961299181133191863
9116611521109565026882024357124116
17.836.633.56.751.736.616.823.044.915.623.942.964.913.4
25023913612768106951556396118306167140411259002067566697931213212567
5058477838643973174050132597614402565831233117112466138
20.024.334.661.455.960.441.147.127.041.742.443.135.354.334.132.028.428.241.334.844.921.535.934.848.856.7
139141647334584491365762154659036564959644293332150685934
529750602648386427423511635732451263623020292190504429
37.468.878.182.276.582.886.470.375.073.756.575.353.881.166.791.153.164.668.269.087.965.660.073.574.685.3
3893802002001021641392469915318046023223077181139530211995102111462200184101
371006410242873684255155177351172251270434533421696427735
9.526.332.051.041.253.025.934.125.333.330.638.515.150.928.628.219.414.237.834.741.214.420.821.041.834.7
416
The Many Faces of Poverty (Volume 3)
Bag-ong BalambanBag-ong DalagueteBoniaoDelusomDiwanGuripanKaangayanKabuhiLourmahLower Salug DakuLower Santo NiñoMaluboManguilesMarabanan (Balanan)PanagaanParaisoPedaganPoblacionPugwanSan IsidroSan JoseSan VicenteSanta CruzSicpaoTuboranTulanTumapicUpper Salug DakuUpper Santo Niño
MAHAMAHAMAHAMAHAMAHAYYYYYAGAGAGAGAG
MARGOSATUBIGMARGOSATUBIGMARGOSATUBIGMARGOSATUBIGMARGOSATUBIG BalintawakBularongDigonGuinimananIgat IslandJosefinaKalianKolotLimabatongLimamawanLumbogMagahisPoblacionSaguaTalanusaTiguianTulapoc
MIDSALIPMIDSALIPMIDSALIPMIDSALIPMIDSALIP BacahanBalonaiBibilopBuloronCabaloranCanipay NorteCanipay SurCumaronDakayakanDuelicDumalinaoEcuanGolictopGuinabotGuitalosGumaKahayaganLicuro-anLumpunid
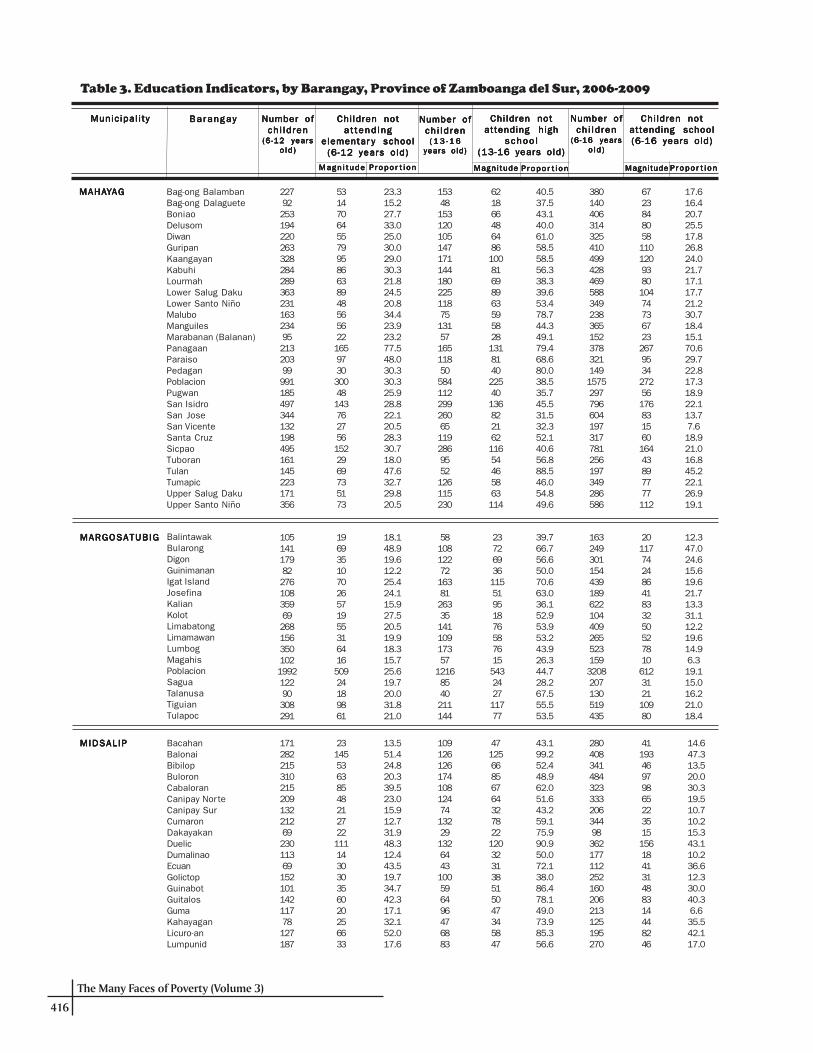
Table 3. Education Indicators, by Barangay, Province of Zamboanga del Sur, 2006-2009
Number ofNumber ofNumber ofNumber ofNumber ofch i ld rench i ld rench i ld rench i ld rench i ld ren
(6-12 years(6-12 years(6-12 years(6-12 years(6-12 yearso ld )o ld )o ld )o ld )o ld )
Chi ldren notChi ldren notChi ldren notChi ldren notChi ldren nota t tend inga t tend inga t tend inga t tend inga t tend ing
elementarelementarelementarelementarelementar y schooly schooly schooly schooly school(6-12 years old)(6-12 years old)(6-12 years old)(6-12 years old)(6-12 years old)
Number ofNumber ofNumber ofNumber ofNumber ofch i ld rench i ld rench i ld rench i ld rench i ld ren( 1 3 - 1 6( 1 3 - 1 6( 1 3 - 1 6( 1 3 - 1 6( 1 3 - 1 6
years old)years old)years old)years old)years old)
Chi ldren notChi ldren notChi ldren notChi ldren notChi ldren notattending highattending highattending highattending highattending high
schoo lschoo lschoo lschoo lschoo l(13-16 years old)(13-16 years old)(13-16 years old)(13-16 years old)(13-16 years old)
Number ofNumber ofNumber ofNumber ofNumber ofch i ld rench i ld rench i ld rench i ld rench i ld ren
(6-16 years(6-16 years(6-16 years(6-16 years(6-16 yearso ld )o ld )o ld )o ld )o ld )
Chi ldren notChi ldren notChi ldren notChi ldren notChi ldren notattending schoolattending schoolattending schoolattending schoolattending school(6-16 years old)(6-16 years old)(6-16 years old)(6-16 years old)(6-16 years old)
Ba r anga yBa ranga yBa ranga yBa ranga yBa ranga yMunic ipal i tyMunic ipal i tyMunic ipal i tyMunic ipal i tyMunic ipal i ty
Magn i t udeMagn i t udeMagn i t udeMagn i t udeMagn i t ude Magn i tudeMagn i tudeMagn i tudeMagn i tudeMagn i tude MagnitudeMagnitudeMagnitudeMagnitudeMagnitudeP rP rP rP rP r opo ropo ropo ropo ropo r t i o nt i o nt i o nt i o nt i o n P rP rP rP rP r opo ropo ropo ropo ropo r t i o nt i o nt i o nt i o nt i o n P rP rP rP rP r opo ropo ropo ropo ropo r t i o nt i o nt i o nt i o nt i o n
227922531942202633282842893632311632349521320399991185497344132198495161145223171356
53147064557995866389485656221659730300481437627561522969735173
23.315.227.733.025.030.029.030.321.824.520.834.423.923.277.548.030.330.325.928.822.120.528.330.718.047.632.729.820.5
15348153120105147171144180225118751315716511850584112299260651192869552126115230
6218664864861008169896359582813181402254013682216211654465863114
40.537.543.140.061.058.558.556.338.339.653.478.744.349.179.468.680.038.535.745.531.532.352.140.656.888.546.054.849.6
3801404063143254104994284695883492383651523783211491575297796604197317781256197349286586
672384805811012093801047473672326795342725617683156016443897777112
17.616.420.725.517.826.824.021.717.117.721.230.718.415.170.629.722.817.318.922.113.77.618.921.016.845.222.126.919.1
1051411798227610835969268156350102199212290308291
19693510702657195531641650924189861
18.148.919.612.225.424.115.927.520.519.918.315.725.619.720.031.821.0
5810812272163812633514110917357
12168540211144
2372693611551951876587615543242711777
39.766.756.650.070.663.036.152.953.953.243.926.344.728.267.555.553.5
1632493011544391896221044092655231593208207130519435
2011774248641833250527810612312110980
12.347.024.615.619.621.713.331.112.219.614.96.319.115.016.221.018.4
171282215310215209132212692301136915210114211778127187
2314553638548212722111143030356020256633
13.551.424.820.339.523.015.912.731.948.312.443.519.734.742.317.132.152.017.6
10912612617410812474132291326443100596496476883
4712566856764327822120323138515047345847
43.199.252.448.962.051.643.259.175.990.950.072.138.086.478.149.073.985.356.6
28040834148432333320634498362177112252160206213125195270
4119346979865223515156184131488314448246
14.647.313.520.030.319.510.710.215.343.110.236.612.330.040.36.635.542.117.0
The Many Faces of Poverty (Volume 3)
417
MIDSALIPMIDSALIPMIDSALIPMIDSALIPMIDSALIP MatalangNew KatipunanNew UnidosPaliliPawanPiliPisomponganPiwanPoblacion APoblacion BSigapodTimbaboyTulbongTuluan
MOLAMOLAMOLAMOLAMOLAVEVEVEVEVE
PPPPPAGADIAN CITYAGADIAN CITYAGADIAN CITYAGADIAN CITYAGADIAN CITY AlegriaBalangasan (Pob.)BalintawakBaloyboanBanaleBogoBombaBuenavistaBulatokBulawanDampalanDanluganDaoDataganDeborokDitorayDumagocGatas (Pob.)GubacGubangKagawasanKahayaganKalasanKawitLa SuerteLalaLapidianLenienza
AliciaAriosaBagong ArgaoBagong GutlangBlanciaBogo CapalaranCuloDalaonDipoloDontulanGonosanLower DimalinaoLower DimorokMabuhayMadasigon (Pob.)Makuguihon (Pob.)Maloloy-on (Pob.)MiliganParasanRizalSanto RosarioSilangitSimataSudlonUpper Dimorok
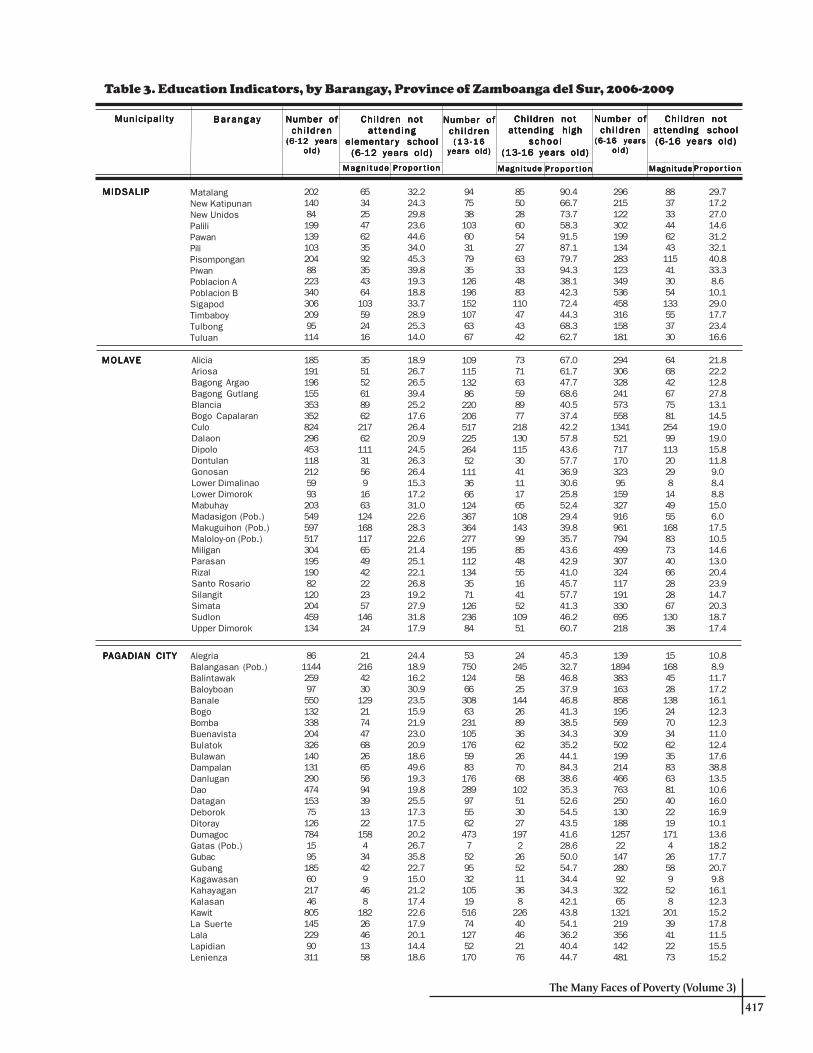
Table 3. Education Indicators, by Barangay, Province of Zamboanga del Sur, 2006-2009
Number ofNumber ofNumber ofNumber ofNumber ofch i ld rench i ld rench i ld rench i ld rench i ld ren
(6-12 years(6-12 years(6-12 years(6-12 years(6-12 yearso ld )o ld )o ld )o ld )o ld )
Chi ldren notChi ldren notChi ldren notChi ldren notChi ldren nota t tend inga t tend inga t tend inga t tend inga t tend ing
elementarelementarelementarelementarelementar y schooly schooly schooly schooly school(6-12 years old)(6-12 years old)(6-12 years old)(6-12 years old)(6-12 years old)
Number ofNumber ofNumber ofNumber ofNumber ofch i ld rench i ld rench i ld rench i ld rench i ld ren( 1 3 - 1 6( 1 3 - 1 6( 1 3 - 1 6( 1 3 - 1 6( 1 3 - 1 6
years old)years old)years old)years old)years old)
Chi ldren notChi ldren notChi ldren notChi ldren notChi ldren notattending highattending highattending highattending highattending high
schoo lschoo lschoo lschoo lschoo l(13-16 years old)(13-16 years old)(13-16 years old)(13-16 years old)(13-16 years old)
Number ofNumber ofNumber ofNumber ofNumber ofch i ld rench i ld rench i ld rench i ld rench i ld ren
(6-16 years(6-16 years(6-16 years(6-16 years(6-16 yearso ld )o ld )o ld )o ld )o ld )
Chi ldren notChi ldren notChi ldren notChi ldren notChi ldren notattending schoolattending schoolattending schoolattending schoolattending school(6-16 years old)(6-16 years old)(6-16 years old)(6-16 years old)(6-16 years old)
Ba r anga yBa ranga yBa ranga yBa ranga yBa ranga yMunic ipal i tyMunic ipal i tyMunic ipal i tyMunic ipal i tyMunic ipal i ty
Magn i t udeMagn i t udeMagn i t udeMagn i t udeMagn i t ude Magn i tudeMagn i tudeMagn i tudeMagn i tudeMagn i tude MagnitudeMagnitudeMagnitudeMagnitudeMagnitudeP rP rP rP rP r opo ropo ropo ropo ropo r t i o nt i o nt i o nt i o nt i o n P rP rP rP rP r opo ropo ropo ropo ropo r t i o nt i o nt i o nt i o nt i o n P rP rP rP rP r opo ropo ropo ropo ropo r t i o nt i o nt i o nt i o nt i o n
202140841991391032048822334030620995114
65342547623592354364103592416
32.224.329.823.644.634.045.339.819.318.833.728.925.314.0
947538103603179351261961521076367
85502860542763334883110474342
90.466.773.758.391.587.179.794.338.142.372.444.368.362.7
296215122302199134283123349536458316158181
883733446243115413054133553730
29.717.227.014.631.232.140.833.38.610.129.017.723.416.6
185191196155353352824296453118212599320354959751730419519082120204459134
3551526189622176211131569166312416811765494222235714624
18.926.726.539.425.217.626.420.924.526.326.415.317.231.022.628.322.621.425.122.126.819.227.931.817.9
10911513286220206517225264521113666124367364277195112134357112623684
73716359897721813011530411117651081439985485516415210951
67.061.747.768.640.537.442.257.843.657.736.930.625.852.429.439.835.743.642.941.045.757.741.346.260.7
294306328241573558134152171717032395159327916961794499307324117191330695218
64684267758125499113202981449551688373406628286713038
21.822.212.827.813.114.519.019.015.811.89.08.48.815.06.017.510.514.613.020.423.914.720.318.717.4
86114425997550132338204326140131290474153751267841595185602174680514522990311
2121642301292174476826655694391322158434429468
18226461358
24.418.916.230.923.515.921.923.020.918.649.619.319.825.517.317.520.226.735.822.715.021.217.422.617.920.114.418.6
53750124663086323110517659831762899755624737529532105195167412752170
45.332.746.837.946.841.338.534.335.244.184.338.635.352.654.543.541.628.650.054.734.434.342.143.854.136.240.444.7
13918943831638581955693095021992144667632501301881257221472809232265
1321219356142481
1516845281382470346235836381402219171426589528
20139412273
10.88.911.717.216.112.312.311.012.417.638.813.510.616.016.910.113.618.217.720.79.816.112.315.217.811.515.515.2
242455825144268936622670681025130271972265211368
22640462176
418
The Many Faces of Poverty (Volume 3)
PPPPPAGADIAN CITYAGADIAN CITYAGADIAN CITYAGADIAN CITYAGADIAN CITY Lizon ValleyLumadLumbiaMacasingMangaMuricayNapolanPalpalanPedulonanPoloyaganSan Francisco (Pob.)San Jose (Pob.)San Pedro (Pob.)Santa Lucia (Pob.)Santa MariaSantiago (Pob.)Santo NiñoTawagan SurTigumaTuburan (Pob.)TulanganTulawasWhite Beach
P ITOGOP ITOGOP ITOGOP ITOGOP ITOGO BalabawanBalong-balongColojoLiasanLiguacLimbayanLower Paniki-anMatin-aoPanubiganPoblacion (Pitogo)Punta FlechaSan IsidroSugbay DosTongaoUpper Paniki-an
RAMON MAGSARAMON MAGSARAMON MAGSARAMON MAGSARAMON MAGSAYSAYSAYSAYSAYSAYYYYY Bagong OponBambong DakuBambong DiutBobonganCampo IVCampo VCanianganDipalusanEastern BobonganEsperanzaGapasanKatipunanKauswaganLower SambulawanMabiniMagsaysayMalatingParadisePasingkalanPoblacionSan FernandoSanto RosarioSapa AndingSinaguingSwitchUpper LaperianWakat
Table 3. Education Indicators, by Barangay, Province of Zamboanga del Sur, 2006-2009
Number ofNumber ofNumber ofNumber ofNumber ofch i ld rench i ld rench i ld rench i ld rench i ld ren
(6-12 years(6-12 years(6-12 years(6-12 years(6-12 yearso ld )o ld )o ld )o ld )o ld )
Chi ldren notChi ldren notChi ldren notChi ldren notChi ldren nota t tend inga t tend inga t tend inga t tend inga t tend ing
elementarelementarelementarelementarelementar y schooly schooly schooly schooly school(6-12 years old)(6-12 years old)(6-12 years old)(6-12 years old)(6-12 years old)
Number ofNumber ofNumber ofNumber ofNumber ofch i ld rench i ld rench i ld rench i ld rench i ld ren( 1 3 - 1 6( 1 3 - 1 6( 1 3 - 1 6( 1 3 - 1 6( 1 3 - 1 6
years old)years old)years old)years old)years old)
Chi ldren notChi ldren notChi ldren notChi ldren notChi ldren notattending highattending highattending highattending highattending high
schoo lschoo lschoo lschoo lschoo l(13-16 years old)(13-16 years old)(13-16 years old)(13-16 years old)(13-16 years old)
Number ofNumber ofNumber ofNumber ofNumber ofch i ld rench i ld rench i ld rench i ld rench i ld ren
(6-16 years(6-16 years(6-16 years(6-16 years(6-16 yearso ld )o ld )o ld )o ld )o ld )
Chi ldren notChi ldren notChi ldren notChi ldren notChi ldren notattending schoolattending schoolattending schoolattending schoolattending school(6-16 years old)(6-16 years old)(6-16 years old)(6-16 years old)(6-16 years old)
Ba r anga yBa ranga yBa ranga yBa ranga yBa ranga yMunic ipal i tyMunic ipal i tyMunic ipal i tyMunic ipal i tyMunic ipal i ty
Magn i t udeMagn i t udeMagn i t udeMagn i t udeMagn i t ude Magn i tudeMagn i tudeMagn i tudeMagn i tudeMagn i tude MagnitudeMagnitudeMagnitudeMagnitudeMagnitudeP rP rP rP rP r opo ropo ropo ropo ropo r t i o nt i o nt i o nt i o nt i o n P rP rP rP rP r opo ropo ropo ropo ropo r t i o nt i o nt i o nt i o nt i o n P rP rP rP rP r opo ropo ropo ropo ropo r t i o nt i o nt i o nt i o nt i o n
46214732123922333731111266301035442651425236632211199346790184119
146437149517980141742111957281079621621497203819
31.629.322.120.522.923.425.712.525.813.820.821.921.519.719.621.619.314.421.721.922.220.716.0
2198619813011115216162353160327137832822220581558293469071
14749715750776030141825105934110777433195110163444
67.157.035.943.845.050.737.348.440.058.142.432.167.949.438.534.736.340.735.140.934.837.862.0
68123351936933448947217410161163871402225805885271921551760136274190
175435352561035422171018784436977452218086274141
25.718.510.214.116.821.111.412.616.816.411.19.010.916.011.313.18.611.511.611.319.915.021.6
204227961571501712048137866260118298135211
373415444244391061114611602231
18.115.015.628.028.025.719.112.316.116.717.79.320.116.314.7
11011148105831061015018970126622037598
5446237840734321821758311053132
49.141.447.974.348.268.942.642.043.424.346.050.051.741.332.7
314338144262233277305131567136386180501210309
5547137845644094673915782832
17.513.99.029.819.323.113.16.98.15.110.18.315.613.310.4
9581881952321491081151453191632456610179137511341913567410521718018811545
32.622.231.820.023.724.817.614.816.626.021.522.031.814.927.817.517.620.925.726.118.928.623.020.619.79.620.0
3118283955371917248335542115222492849931430503737119
6053391311389256596821410613938524586279111023647661411191097526
392711496133113312863166161634481533609617265957421913
65.050.928.237.444.235.919.655.917.640.229.247.542.130.875.655.855.636.354.540.736.239.441.847.938.525.350.0
1551341273263702411641742135332693841041531242237822530159212117135829929719071
452122648938193425784062341740311121647313316055251610
29.015.717.319.624.115.811.619.511.714.614.916.132.711.132.313.914.19.321.312.310.718.116.818.48.48.414.1

The Many Faces of Poverty (Volume 3)
419
SAN MIGUELSAN MIGUELSAN MIGUELSAN MIGUELSAN MIGUEL BetinanBulawanCalubeConcepcionDao-anDumalianFatimaLangilanLantawanLaperianLibugananLimonanMatiOcapanPoblacionSan IsidroSayogTapian
SAN PSAN PSAN PSAN PSAN PABLOABLOABLOABLOABLO Bag-ong MisamisBubualButonCulasianDaplayanKalilanganKapamanokKondumLumbayaoMabuhayMarcos VillageMiasinMolansongPantadPaoPayagPoblacion (San Pablo)PongapongSacbulanSagasanSan JuanSeniorSonggoyTandubuayTaniapanTicala IslandTubo-paitVillakapa
SOMINOTSOMINOTSOMINOTSOMINOTSOMINOT Bag-ong BaroyBag-ong OroquietaBarubuhanBulanayDataganEastern PoblacionLantawanLiber tadLumangoyNew CarmenPicturanPoblacionRizalSan MiguelSanto NiñoSawaTungawanUpper Sicpao
Table 3. Education Indicators, by Barangay, Province of Zamboanga del Sur, 2006-2009
Number ofNumber ofNumber ofNumber ofNumber ofch i ld rench i ld rench i ld rench i ld rench i ld ren
(6-12 years(6-12 years(6-12 years(6-12 years(6-12 yearso ld )o ld )o ld )o ld )o ld )
Chi ldren notChi ldren notChi ldren notChi ldren notChi ldren nota t tend inga t tend inga t tend inga t tend inga t tend ing
elementarelementarelementarelementarelementar y schooly schooly schooly schooly school(6-12 years old)(6-12 years old)(6-12 years old)(6-12 years old)(6-12 years old)
Number ofNumber ofNumber ofNumber ofNumber ofch i ld rench i ld rench i ld rench i ld rench i ld ren( 1 3 - 1 6( 1 3 - 1 6( 1 3 - 1 6( 1 3 - 1 6( 1 3 - 1 6
years old)years old)years old)years old)years old)
Chi ldren notChi ldren notChi ldren notChi ldren notChi ldren notattending highattending highattending highattending highattending high
schoo lschoo lschoo lschoo lschoo l(13-16 years old)(13-16 years old)(13-16 years old)(13-16 years old)(13-16 years old)
Number ofNumber ofNumber ofNumber ofNumber ofch i ld rench i ld rench i ld rench i ld rench i ld ren
(6-16 years(6-16 years(6-16 years(6-16 years(6-16 yearso ld )o ld )o ld )o ld )o ld )
Chi ldren notChi ldren notChi ldren notChi ldren notChi ldren notattending schoolattending schoolattending schoolattending schoolattending school(6-16 years old)(6-16 years old)(6-16 years old)(6-16 years old)(6-16 years old)
Ba r anga yBa ranga yBa ranga yBa ranga yBa ranga yMunic ipal i tyMunic ipal i tyMunic ipal i tyMunic ipal i tyMunic ipal i ty
Magn i t udeMagn i t udeMagn i t udeMagn i t udeMagn i t ude Magn i tudeMagn i tudeMagn i tudeMagn i tudeMagn i tude MagnitudeMagnitudeMagnitudeMagnitudeMagnitudeP rP rP rP rP r opo ropo ropo ropo ropo r t i o nt i o nt i o nt i o nt i o n P rP rP rP rP r opo ropo ropo ropo ropo r t i o nt i o nt i o nt i o nt i o n P rP rP rP rP r opo ropo ropo ropo ropo r t i o nt i o nt i o nt i o nt i o n
1061591371252551443413713887942651821544559823140
1738212446315304219196236428920456
16.023.915.319.218.021.514.721.930.421.820.223.419.827.319.620.419.515.0
81969249146731674714160177115902675013932
404149338063957582430815563100429314
49.442.753.367.354.886.356.377.081.758.550.045.847.870.037.584.066.943.8
1872552291744012175021120912815444229724472214837072
17333425445874747213290395688295811
9.112.914.814.411.026.714.022.322.516.420.820.413.123.012.219.615.715.3
65992816916960163609973109958714195108308108116143417861186173734762
132352031929101321191816312214831916387511528312677
20.023.217.911.818.315.017.816.713.128.817.418.918.422.023.213.026.917.613.826.617.165.424.615.117.935.614.911.3
41611685893310243554175674089566916959597718453478112233940
2045332542237162926223715392321843144361134202967221319
48.873.818.837.660.766.736.337.252.763.429.355.237.543.841.130.449.752.574.646.861.175.658.837.259.895.733.347.5
106160442542589326510315411418416212723015117747716717522059123952642859686102
6275262611191114192237162915128517404757426124624514
5.716.911.410.210.111.87.210.79.116.712.022.812.612.69.96.817.810.222.921.48.560.227.44.516.125.05.813.7
73711001822321408089781251314331646512143231176
1392437382121142217517126112277728
17.812.724.020.316.415.026.315.728.213.638.916.415.916.918.216.333.315.9
4437561029095583641917827092457524135117
251642605737372120626698603339229656
56.843.275.058.863.338.963.858.348.868.184.636.365.273.352.091.771.147.9
11710815628432223513812511921620970325611019667366293
21732585222322418467859492519108243
17.96.520.520.416.19.423.219.215.121.337.38.419.122.79.714.922.414.7
420
The Many Faces of Poverty (Volume 3)
TAB INATAB INATAB INATAB INATAB INA Abong-abongBaganianBaya-bayaCapisanConcepcionCulabayDoña JosefinaLumbiaMabuhayMalimManikaanNew OroquietaPoblacionSan FranciscoTultolan
TAMBUL IGTAMBUL IGTAMBUL IGTAMBUL IGTAMBUL IG Alang-alangAngelesBag-ong KauswaganBag-ong TabogonBalugoCabganCalolotDimalinaoFabian (Balucot)GabunonHappy Valley (Pob.)KapalaranLibatoLimamawanLower LiasanLower Lodiong (Pob.)Lower TiparakLower UsoganMaya-mayaNew Village (Pob.)PelocobanRiverside (Pob.)Sagrada FamiliaSan JoseSan VicenteSumaligTuluanTungawanUpper LiasonUpper LodiongUpper Tiparak
T IGBAOT IGBAOT IGBAOT IGBAOT IGBAO BegongBusolCalumaDiana CountrysideGuinlinLacarayanLacupayanLibayoyLimasLongmotMaragangMateNangan-nanganNew TuburanNiloTigbaoTimolanUpper Nilo
Table 3. Education Indicators, by Barangay, Province of Zamboanga del Sur, 2006-2009
Number ofNumber ofNumber ofNumber ofNumber ofch i ld rench i ld rench i ld rench i ld rench i ld ren
(6-12 years(6-12 years(6-12 years(6-12 years(6-12 yearso ld )o ld )o ld )o ld )o ld )
Chi ldren notChi ldren notChi ldren notChi ldren notChi ldren nota t tend inga t tend inga t tend inga t tend inga t tend ing
elementarelementarelementarelementarelementar y schooly schooly schooly schooly school(6-12 years old)(6-12 years old)(6-12 years old)(6-12 years old)(6-12 years old)
Number ofNumber ofNumber ofNumber ofNumber ofch i ld rench i ld rench i ld rench i ld rench i ld ren( 1 3 - 1 6( 1 3 - 1 6( 1 3 - 1 6( 1 3 - 1 6( 1 3 - 1 6
years old)years old)years old)years old)years old)
Chi ldren notChi ldren notChi ldren notChi ldren notChi ldren notattending highattending highattending highattending highattending high
schoo lschoo lschoo lschoo lschoo l(13-16 years old)(13-16 years old)(13-16 years old)(13-16 years old)(13-16 years old)
Number ofNumber ofNumber ofNumber ofNumber ofch i ld rench i ld rench i ld rench i ld rench i ld ren
(6-16 years(6-16 years(6-16 years(6-16 years(6-16 yearso ld )o ld )o ld )o ld )o ld )
Chi ldren notChi ldren notChi ldren notChi ldren notChi ldren notattending schoolattending schoolattending schoolattending schoolattending school(6-16 years old)(6-16 years old)(6-16 years old)(6-16 years old)(6-16 years old)
Ba r anga yBa ranga yBa ranga yBa ranga yBa ranga yMunic ipal i tyMunic ipal i tyMunic ipal i tyMunic ipal i tyMunic ipal i ty
Magn i t udeMagn i t udeMagn i t udeMagn i t udeMagn i t ude Magn i tudeMagn i tudeMagn i tudeMagn i tudeMagn i tude MagnitudeMagnitudeMagnitudeMagnitudeMagnitudeP rP rP rP rP r opo ropo ropo ropo ropo r t i o nt i o nt i o nt i o nt i o n P rP rP rP rP r opo ropo ropo ropo ropo r t i o nt i o nt i o nt i o nt i o n P rP rP rP rP r opo ropo ropo ropo ropo r t i o nt i o nt i o nt i o nt i o n
32550015213717333410015624832315310388390122
78124203226891522658337171921324
24.024.813.223.415.026.615.014.126.225.724.216.521.714.419.7
1802608266116195577812820275615094855
7391373947732424495625331812419
40.635.045.159.140.537.442.130.838.327.733.354.135.650.034.5
5057602342032895291572343765252281641392138177
6683284131641821476126341511913
13.110.912.020.210.712.111.59.012.511.611.420.710.813.87.3
1181841287926029819088201305259111108626625424113952254912341301071015982092016470252
26393614811056817538265283716157491262055255943442715973491015118
22.021.228.117.731.535.235.819.326.427.225.125.234.325.822.729.238.218.738.521.728.425.233.141.127.826.834.924.415.621.447.0
74987636139126120501101731697750473418514210031175591457840563831021444132159
42563513627880324973603535281678825020642648472426209675723797
56.857.146.136.145.661.966.764.044.542.435.545.570.059.647.142.457.750.064.536.644.133.160.360.048.155.165.739.656.121.961.0
19228220411539942431013831147842818815810910043938323983429150379208147157981311345105102411
33464178812298365388582845222477120382655336054503519087472111146
17.216.320.16.122.428.831.626.117.018.613.614.928.520.224.017.631.315.931.312.922.415.826.034.023.219.528.013.620.010.835.6
532748711111514213213018917527315812594165406109143
961818163146164158367144472523721417
18.024.320.714.427.032.412.131.530.720.626.027.837.626.613.917.712.811.9
289405761766185759788138785440972267086
1403030475254496157607070432934813141
48.475.052.677.068.488.557.681.358.868.250.789.779.672.535.135.844.347.7
821114144172191203217205286263411236179134262632179229
792318263962236646496351442319531121
9.620.212.515.120.430.510.632.216.118.615.321.624.617.27.38.46.19.2

The Many Faces of Poverty (Volume 3)
421
TUKURANTUKURANTUKURANTUKURANTUKURAN
VINCENZO SAGUNVINCENZO SAGUNVINCENZO SAGUNVINCENZO SAGUNVINCENZO SAGUN AmbulonBui-osCogonDananKabatanKapataganLimasonLinoguayanLumbalLunibMaculayMarayaSagucanWaling-waling
Table 3. Education Indicators, by Barangay, Province of Zamboanga del Sur, 2006-2009
Number ofNumber ofNumber ofNumber ofNumber ofch i ld rench i ld rench i ld rench i ld rench i ld ren
(6-12 years(6-12 years(6-12 years(6-12 years(6-12 yearso ld )o ld )o ld )o ld )o ld )
Chi ldren notChi ldren notChi ldren notChi ldren notChi ldren nota t tend inga t tend inga t tend inga t tend inga t tend ing
elementarelementarelementarelementarelementar y schooly schooly schooly schooly school(6-12 years old)(6-12 years old)(6-12 years old)(6-12 years old)(6-12 years old)
Number ofNumber ofNumber ofNumber ofNumber ofch i ld rench i ld rench i ld rench i ld rench i ld ren( 1 3 - 1 6( 1 3 - 1 6( 1 3 - 1 6( 1 3 - 1 6( 1 3 - 1 6
years old)years old)years old)years old)years old)
Chi ldren notChi ldren notChi ldren notChi ldren notChi ldren notattending highattending highattending highattending highattending high
schoo lschoo lschoo lschoo lschoo l(13-16 years old)(13-16 years old)(13-16 years old)(13-16 years old)(13-16 years old)
Number ofNumber ofNumber ofNumber ofNumber ofch i ld rench i ld rench i ld rench i ld rench i ld ren
(6-16 years(6-16 years(6-16 years(6-16 years(6-16 yearso ld )o ld )o ld )o ld )o ld )
Chi ldren notChi ldren notChi ldren notChi ldren notChi ldren notattending schoolattending schoolattending schoolattending schoolattending school(6-16 years old)(6-16 years old)(6-16 years old)(6-16 years old)(6-16 years old)
Ba r anga yBa ranga yBa ranga yBa ranga yBa ranga yMunic ipal i tyMunic ipal i tyMunic ipal i tyMunic ipal i tyMunic ipal i ty
Magn i t udeMagn i t udeMagn i t udeMagn i t udeMagn i t ude Magn i tudeMagn i tudeMagn i tudeMagn i tudeMagn i tude MagnitudeMagnitudeMagnitudeMagnitudeMagnitudeP rP rP rP rP r opo ropo ropo ropo ropo r t i o nt i o nt i o nt i o nt i o n P rP rP rP rP r opo ropo ropo ropo ropo r t i o nt i o nt i o nt i o nt i o n P rP rP rP rP r opo ropo ropo ropo ropo r t i o nt i o nt i o nt i o nt i o n
3442365913433023531411714911311314035026245823476384112839200252167179134
544411185133831524723255959893877020362941224220
AlindahawBaclayBalimbinganBuenasuerteCamangaCurvadaLaperianLiber tadLower BayaoLuy-aManilanManlayagMilitarNavalanPanduma SeniorSambulawanSan AntonioSan Carlos (Pob.)Santo Niño (Pob.)Santo RosarioSugodTabuanTaguloTinotunganUpper Bayao
15.718.618.613.415.514.026.412.816.16.220.417.916.922.519.416.29.218.218.015.414.516.313.223.514.9
18112228108191163174546362486919119127411740262683281011189611183
7549243677378925313131419667138691983241185559384238
41.440.285.733.340.322.751.146.349.250.064.659.450.335.150.459.047.531.735.364.354.550.039.637.845.8
52535887242521398488171212175161209541453732351116646181167301370263290217
66442523671912021331632411016111158865187192455144234
12.612.328.79.512.94.824.612.315.69.119.919.618.713.515.216.56.910.110.328.48.014.95.314.515.7
155207219309409206194146195249176181205253
3649517380564624844822373860
23.223.723.323.619.627.223.716.443.119.312.520.418.523.7
86120150209248120119928814199112121155
53636411489665539537852445765
61.652.542.754.535.955.046.242.460.255.352.539.347.141.9
241327369518657326313238283390275293326408
51535110879814328915724353931
21.216.213.820.812.024.813.711.832.214.68.711.912.07.6

422
The Many Faces of Poverty (Volume 3)
CBMS Poverty Maps: Zamboanga del Sur
Map 22. Proportion of Households with Income Below the Poverty Threshold,by Barangay, 2006-2009
Map 21. Proportion of Households with Income Below the Poverty Threshold,by Municipality, 2006-2009
DUMINGAG
MIDSALIP
MAHAYAG
AURORA
TUKURAN
LABANGAN
PAGADIAN CITY
SAN PABLO
GUIPOS
DINAS
TABINAPITOGO
DIMATALINGVINCENZO A. SAGUN
MARGOSATUBIG
LAPUYAN
KUMALARANG
BAYOGLAKEWOOD
RAMON MAGSAYSAY
SOMINOT
MOLAVE
JOSEFINA
TAMBULIG
DUMALINAO
TIGBAO
SAN MIGUEL
69.068.5
53.2
63.4
76.0
64.8
74.4
71.977.4
72.5
64.6
48.1
85.066.9
76.2
78.0 73.7
78.372.8
86.8
80.4
74.180.4
68.0
72.2
M unic ip a l i t y M ag ni t ud e P ro p o r t io nKumalarang 3441 86 .8
Lakewood 2869 85.0
M argosatubig 5211 80 .4
Pitogo 2693 80 .4
San Pablo 2771 78 .3
Guipos 2831 78 .0Somino t 2327 77.4Tigbao 2465 76 .2Tambulig 4729 76 .0Tukuran 5423 74 .4V incenzo Sagun 2864 74 .1Dumalinao 4035 73 .7San M iguel 2370 72 .8M idsalip 3961 72 .5Tabina 3048 72 .2Ramon M agsaysay 3527 71.9Dumingag 5372 69 .0M ahayag 5899 68 .5Lapuyan 3026 68 .0B ayog 3192 66 .9A urora 6029 64 .8Labangan 4372 64 .6Josef ina 1115 63 .4M o lave 4569 53 .2Pagad ian Cit y 8086 48.1
Ho useho ld w it h inco me b elo w p o ver t y t hresho ld
M unic ip a l it y B a r ang a y M a g ni t ud e P r o p o r t io n
Dumalinao B ibilik 2 29 10 0.0
Tamb uligB ag -ong Kauswag an 126 10 0.0
So mino t Lumango y 8 9 10 0.0
Lakewo od Sebuguey 8 2 10 0.0
San Pablo Kalilangan 75 10 0.0
Kumalarang Limamawan 6 3 10 0.0
San Pablo Ticala Island 59 10 0.0
San M ig uel Fat ima 3 4 10 0.0San Pablo Kapamanok 193 99 .5
Guip os Dalapang 171 99 .4
B o t t o m 10 B a r ang a ys
The Many Faces of Poverty (Volume 3)
423
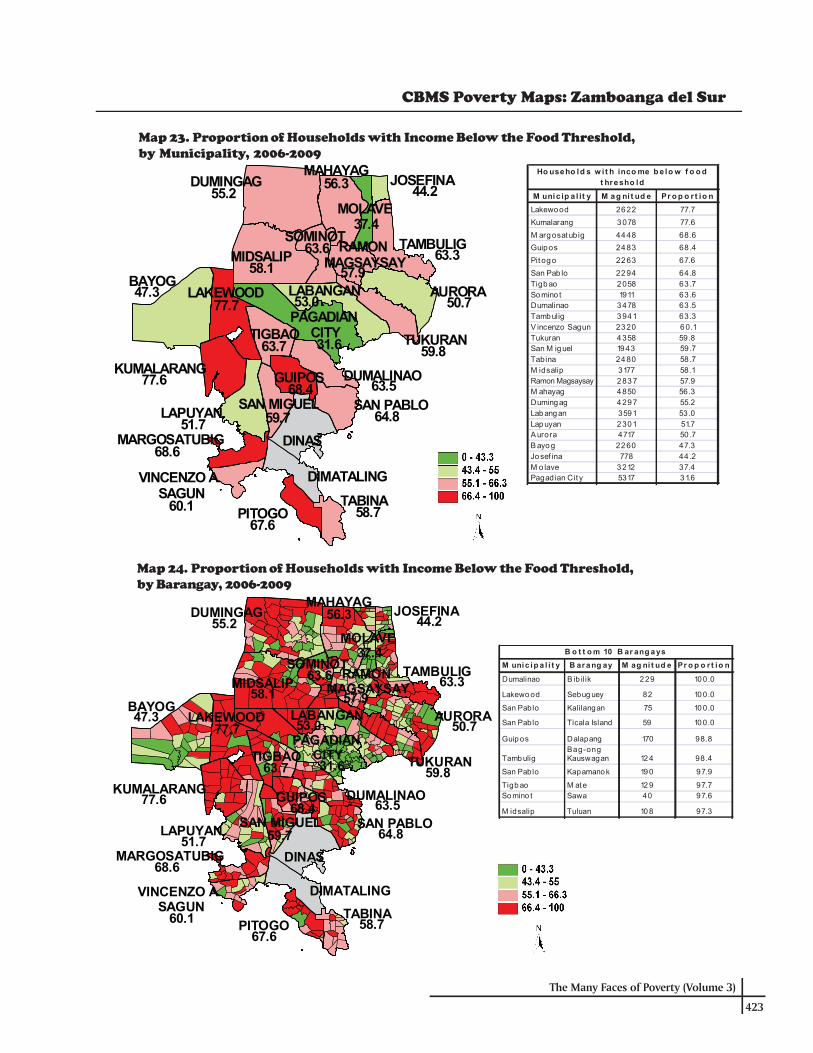
Map 23. Proportion of Households with Income Below the Food Threshold,by Municipality, 2006-2009
Map 24. Proportion of Households with Income Below the Food Threshold,by Barangay, 2006-2009
DUMINGAG
MIDSALIP
MAHAYAG
AURORA
TUKURAN
LABANGAN
PAGADIAN CITY
SAN PABLO
GUIPOS
DINAS
TABINAPITOGO
DIMATALINGVINCENZO A. SAGUN
MARGOSATUBIG
LAPUYAN
KUMALARANG
BAYOGLAKEWOOD
RAMON MAGSAYSAY
SOMINOT
MOLAVE
JOSEFINA
TAMBULIG
DUMALINAO
TIGBAO
SAN MIGUEL
55.256.3
37.4
44.2
63.3
50.7
59.8
57.963.6
58.1
53.0
31.6
77.747.3
63.7
68.4 63.5
64.859.7
77.6
51.7
68.6
60.167.6
58.7
CBMS Poverty Maps: Zamboanga del Sur
M unic ip a l it y M ag ni t ud e Pr o p o r t io nLakewood 2622 77.7
Kumalarang 3078 77.6
M argosatubig 4448 68 .6
Guipos 2483 68 .4
Pitogo 2263 67.6
San Pab lo 2294 64 .8Tigbao 2058 63 .7Somino t 1911 63 .6Dumalinao 3478 63 .5Tambulig 3941 63 .3V incenzo Sagun 2320 60.1Tukuran 4358 59.8San M iguel 1943 59 .7Tabina 2480 58 .7M idsalip 3177 58 .1
2837 57.9M ahayagRamon Magsaysay
4850 56.3Dumingag 4297 55.2Labangan 3591 53.0Lapuyan 2301 51.7A urora 4717 50 .7B ayog 2260 47.3Josef ina 778 44 .2M o lave 3212 37.4Pagad ian Cit y 5317 31.6
Ho useho ld s w i t h inco me b e lo w f o o d t hresho ld
M unic ip a l i t y B ar a ng ay M ag ni t ud e Pr o p o r t io n
Dumalinao B ib ilik 2 29 10 0.0
Lakewo od Sebug uey 82 10 0.0
San Pablo Kalilangan 75 10 0.0
San Pablo Ticala Island 59 10 0.0
Guip os DalapangBag-ong
170 98.8
Tamb ulig Kauswagan 12 4 98.4
San Pablo Kapamano k 19 0 97.9
Tigb ao M ate 12 9 97.7So mino t Sawa 40 97.6
M idsalip Tuluan 10 8 97.3
B o t t o m 10 B ar ang a ys

424
The Many Faces of Poverty (Volume 3)
Map 26. Proportion of Households who Experienced Food Shortage,by Barangay, 2006-2009
Map 25. Proportion of Households who Experienced Food Shortage,by Municipality, 2006-2009
DUMINGAG
MIDSALIP
MAHAYAG
AURORA
TUKURAN
LABANGAN
PAGADIAN CITY
SAN PABLO
GUIPOS
DINAS
TABINAPITOGO
DIMATALINGVINCENZO A. SAGUN
MARGOSATUBIG
LAPUYAN
KUMALARANG
BAYOGLAKEWOOD
RAMON MAGSAYSAY
SOMINOT
MOLAVE
JOSEFINA
TAMBULIG
DUMALINAO
TIGBAO
SAN MIGUEL
10.03.3
0.5
2.2
2.5
4.4
1.1
8.211.8
7.9
4.41.0
0.00.0
3.5
0.2 0.0
0.6
1.31.4
1.1
22.5
18.7
0.1
3.6
CBMS Poverty Maps: Zamboanga del Sur
M unic ip a l i t y M ag ni t ud e P ro p o r t io nM argosatubig 1456 22 .5
Lapuyan 833 18 .7
M idsalip 641 11.8
Dumingag 774 10 .0
Somino t 247 8.2
Labangan 537 7.9A urora 411 4.4Tukuran 320 4.4San M iguel 118 3.6Tigbao 112 3.5M ahayag 284 3.3Tambulig 152 2.5Josef ina 38 2.2Pitogo 46 1.4Tabina 57 1.3V incenzo Sagun 42 1.1Ramon M agsaysay 52 1.1Pagad ian Cit y 156 1.0San Pablo 22 0.6M o lave 46 0.5Guipos 6 0.2Kumalarang 4 0.1Dumalinao 1 0.0B ayog 0 0.0Lakewood 0 0.0
Ho useho ld s w ho exp er ienced f o o d sho r t ag e
M unicip al i t y B ar a ng ay M ag ni t ud e P r o p o r t io n
Duming ag Saad 97 85.8
M arg osatubig Jo sef ina 13 1 8 4.0
M ahayag Pedag an 63 78.8
M arg osatubig Talanusa 85 75.2
Duming ag M arangan 115 67.6
M arg osatubig Ko lo t 45 67.2
Duming ag Canibo ngan 77 65.3
M arg osatubig Dig on 14 3 61.4
San M ig uel Fatima 18 6 0.0
Duming ag Salvador 115 59.6
B o t t o m 10 B ar a ng ay s
The Many Faces of Poverty (Volume 3)
425
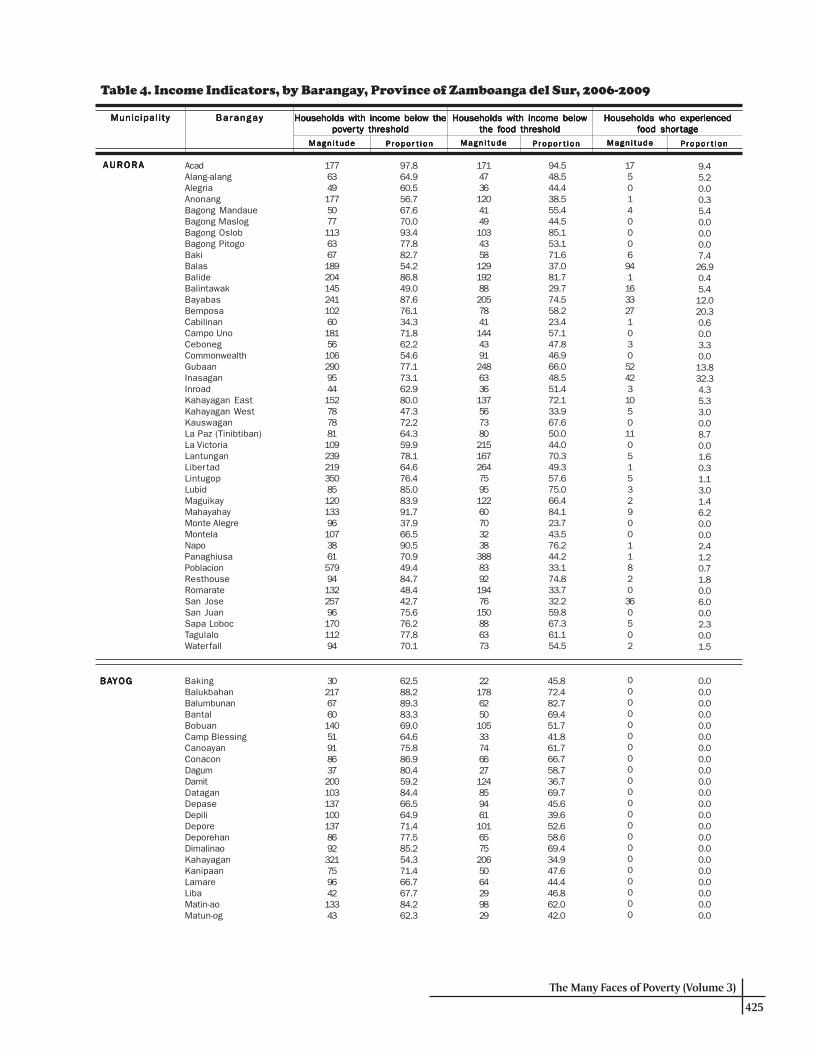
Households with income below theHouseholds with income below theHouseholds with income below theHouseholds with income below theHouseholds with income below thepoverpoverpoverpoverpover ty thrty thrty thrty thrty thresholdesholdesholdesholdeshold
Households with income belowHouseholds with income belowHouseholds with income belowHouseholds with income belowHouseholds with income belowthe food thrthe food thrthe food thrthe food thrthe food thresholdesholdesholdesholdeshold
Households who experiencedHouseholds who experiencedHouseholds who experiencedHouseholds who experiencedHouseholds who experiencedfood shorfood shorfood shorfood shorfood shor tagetagetagetagetage
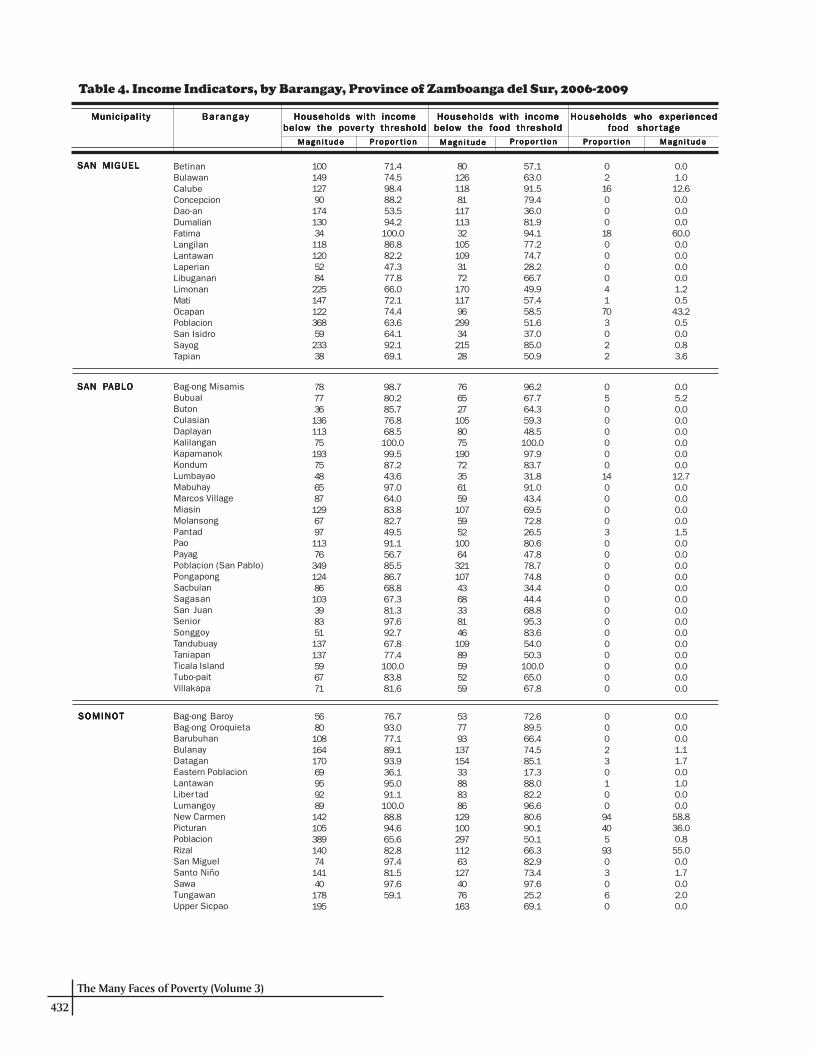
Table 4. Income Indicators, by Barangay, Province of Zamboanga del Sur, 2006-2009
Ba ranga yBa ranga yBa ranga yBa ranga yBa ranga yMunic ipal i tyMunic ipal i tyMunic ipal i tyMunic ipal i tyMunic ipal i ty
Magn i t udeMagn i t udeMagn i t udeMagn i t udeMagn i t ude Magn i t udeMagn i t udeMagn i t udeMagn i t udeMagn i t ude Magn i t udeMagn i t udeMagn i t udeMagn i t udeMagn i t udeP rP rP rP rP r opo ropo ropo ropo ropo r t i o nt i o nt i o nt i o nt i o n P rP rP rP rP r opo ropo ropo ropo ropo r t i o nt i o nt i o nt i o nt i o n P rP rP rP rP r opo ropo ropo ropo ropo r t i o nt i o nt i o nt i o nt i o n
AURORAAURORAAURORAAURORAAURORA AcadAlang-alangAlegriaAnonangBagong MandaueBagong MaslogBagong OslobBagong PitogoBakiBalasBalideBalintawakBayabasBemposaCabilinanCampo UnoCebonegCommonwealthGubaanInasaganInroadKahayagan EastKahayagan WestKauswaganLa Paz (Tinibtiban)La VictoriaLantunganLiber tadLintugopLubidMaguikayMahayahayMonte AlegreMontelaNapoPanaghiusaPoblacionResthouseRomarateSan JoseSan JuanSapa LobocTagulaloWaterfall
BABABABABAYOGYOGYOGYOGYOG BakingBalukbahanBalumbunanBantalBobuanCamp BlessingCanoayanConaconDagumDamitDataganDepaseDepiliDeporeDeporehanDimalinaoKahayaganKanipaanLamareLibaMatin-aoMatun-og
1776349177507711363671892041452411026018156106290954415278788110923921935085120133961073861579941322579617011294
97.864.960.556.767.670.093.477.882.754.286.849.087.676.134.371.862.254.677.173.162.980.047.372.264.359.978.164.676.485.083.991.737.966.590.570.949.484.748.442.775.676.277.870.1
94.548.544.438.555.444.585.153.171.637.081.729.774.558.223.457.147.846.966.048.551.472.133.967.650.044.070.349.357.675.066.484.123.743.576.244.233.174.833.732.259.867.361.154.5
175014000694116332710305242310501105153290011820360502
9.45.20.00.35.40.00.00.07.426.90.45.412.020.30.60.03.30.013.832.34.35.33.00.08.70.01.60.31.13.01.46.20.00.02.41.20.71.80.06.00.02.30.01.5
30217676014051918637200103137100137869232175964213343
62.588.289.383.369.064.675.886.980.459.284.466.564.971.477.585.254.371.466.767.784.262.3
2217862501053374662712485946110165752065064299829
45.872.482.769.451.741.861.766.758.736.769.745.639.652.658.669.434.947.644.446.862.042.0
0000000000000000000000
0.00.00.00.00.00.00.00.00.00.00.00.00.00.00.00.00.00.00.00.00.00.0
17147361204149103435812919288205784114443912486336137567380215167264759512260703238388839219476150886373

426
The Many Faces of Poverty (Volume 3)
Households with incomeHouseholds with incomeHouseholds with incomeHouseholds with incomeHouseholds with incomebelow the poverbelow the poverbelow the poverbelow the poverbelow the pover ty thrty thrty thrty thrty thresholdesholdesholdesholdeshold
Households with incomeHouseholds with incomeHouseholds with incomeHouseholds with incomeHouseholds with incomebelow the food thresholdbelow the food thresholdbelow the food thresholdbelow the food thresholdbelow the food threshold
Households who experiencedHouseholds who experiencedHouseholds who experiencedHouseholds who experiencedHouseholds who experiencedfood shorfood shorfood shorfood shorfood shor tagetagetagetagetage
Table 4. Income Indicators, by Barangay, Province of Zamboanga del Sur, 2006-2009
Ba ranga yBa ranga yBa ranga yBa ranga yBa ranga yMunic ipal i tyMunic ipal i tyMunic ipal i tyMunic ipal i tyMunic ipal i ty
Magn i t udeMagn i t udeMagn i t udeMagn i t udeMagn i t ude Magn i t udeMagn i t udeMagn i t udeMagn i t udeMagn i t ude Magn i t udeMagn i t udeMagn i t udeMagn i t udeMagn i t udeP rP rP rP rP r opo ropo ropo ropo ropo r t i o nt i o nt i o nt i o nt i o n P rP rP rP rP r opo ropo ropo ropo ropo r t i o nt i o nt i o nt i o nt i o n P rP rP rP rP r opo ropo ropo ropo ropo r t i o nt i o nt i o nt i o nt i o n
BABABABABAYOGYOGYOGYOGYOG Pangi (San Isidro)PoblacionPulang BatoSalawaganSigacadSupon
DUMALINAODUMALINAODUMALINAODUMALINAODUMALINAO AnonangBagaBag-ong MisamisBag-ong SilaoBaloboanBanta-aoBibilikCalingayanCamaligCamangaCuatro-cuatroLocubanMalasikMama (San Juan)Matab-angMecolongMetokongMotosawaPag-asa (Pob.)Paglaum (Pob.)PantadPiniglibanoRebokonSan AgustinSibucaoSumadatTikwasTinaTubo-PaitUpper Dumalinao
DUMINGAGDUMINGAGDUMINGAGDUMINGAGDUMINGAG Bagong KauswaganBagong SilangBag-ong ValenciaBucayanCalumanggiCanibonganCaridadDanluganDapiwakDatu TotocanDiludDitulanDulianDulopGuintanananGuitranGumpinganLa FortunaLabangonLiber tadLicabangLipawanLower LandingLower TimonanMacasingMahayahayMalagaladManlabayMaralagMarangan
71436841157171
82.652.877.160.870.361.7
5026968774553
58.132.662.440.744.646.1
000000
0.00.00.00.00.00.0
135147341341157322910380162691411151396613643801072067810148313820723519011491
66.586.089.586.592.091.3100.078.672.159.176.774.292.793.366.770.184.374.869.047.678.082.176.181.280.957.070.462.682.076.4
1031343111810669229926513755123107126501143967911456886412117192198159868673
50.778.481.676.184.886.3100.070.258.650.061.164.786.384.650.558.876.562.658.733.568.069.964.968.875.048.158.947.377.566.4
000100000000000000000000000000
0.00.00.00.60.00.00.00.00.00.00.00.00.00.00.00.00.00.00.00.00.00.00.00.00.00.00.00.00.00.0
564212772801111257916812712615752345811643790153139175302421506414667145223110
75.760.984.766.777.794.146.572.596.677.482.984.959.185.877.171.377.187.479.757.082.922.269.758.662.773.789.360.763.564.7
423410655671006869166101109128273157312533801361071451719911250116579515379
56.849.370.750.965.084.725.363.395.461.671.769.230.778.469.554.368.877.770.843.968.712.657.343.849.058.676.039.743.646.5
40000770703117733100027000006533855
115
5.40.00.00.00.065.30.06.40.01.80.79.28.08.31.00.00.00.01.12.90.00.00.00.00.032.844.035.61.467.6

The Many Faces of Poverty (Volume 3)
427
Households with incomeHouseholds with incomeHouseholds with incomeHouseholds with incomeHouseholds with incomebelow the poverbelow the poverbelow the poverbelow the poverbelow the pover ty thrty thrty thrty thrty thresholdesholdesholdesholdeshold
Households with incomeHouseholds with incomeHouseholds with incomeHouseholds with incomeHouseholds with incomebelow the food thresholdbelow the food thresholdbelow the food thresholdbelow the food thresholdbelow the food threshold
Households who experiencedHouseholds who experiencedHouseholds who experiencedHouseholds who experiencedHouseholds who experiencedfood shorfood shorfood shorfood shorfood shor tagetagetagetagetage
Table 4. Income Indicators, by Barangay, Province of Zamboanga del Sur, 2006-2009
Ba ranga yBa ranga yBa ranga yBa ranga yBa ranga yMunic ipal i tyMunic ipal i tyMunic ipal i tyMunic ipal i tyMunic ipal i ty
Magn i t udeMagn i t udeMagn i t udeMagn i t udeMagn i t ude Magn i t udeMagn i t udeMagn i t udeMagn i t udeMagn i t ude Magn i t udeMagn i t udeMagn i t udeMagn i t udeMagn i t udeP rP rP rP rP r opo ropo ropo ropo ropo r t i o nt i o nt i o nt i o nt i o n P rP rP rP rP r opo ropo ropo ropo ropo r t i o nt i o nt i o nt i o nt i o n P rP rP rP rP r opo ropo ropo ropo ropo r t i o nt i o nt i o nt i o nt i o n
DUMINGAGDUMINGAGDUMINGAGDUMINGAGDUMINGAG New BasakSaadSalvadorSan JuanSan Pablo (Pob.)San Pedro (Pob.)San VicenteSenoteSinonokSunopTagunTamurayanUpper LandingUpper Timonan
GU IPOSGUIPOSGUIPOSGUIPOSGUIPOS Bagong OroquietaBaguitanBalongatingCanunanDacsolDagohoyDalapangDataganGulingKatipunanLintumLitanMagtingPoblacion (Guipos)ReglaSikatunaSingclot
JOSEF INAJOSEF INAJOSEF INAJOSEF INAJOSEF INA Bogo CalabatDawa (Diwa)EbarleGumahan (Pob.)LeonardoLitapanLower Bagong TudelaMansanasMoradjiNemeñoNopulanSebukangTagaytay HillUpper Bagong Tudela
KUMALARANGKUMALARANGKUMALARANGKUMALARANGKUMALARANG BogayoBolisongBoyugan EastBoyugan WestBualanDiploGawilGusomKitaan DagatLantawanLimamawanMahayahayPangiPicananPoblacionSalagmanokSecadeSuminalum
15610718131189338707193685560153117
80.493.993.873.845.949.387.553.082.391.993.280.067.453.9
1231041622712723864348064505011793
63.491.283.964.330.834.780.025.470.886.584.766.751.542.9
09711500102328442002
0.085.859.60.00.00.10.017.224.859.53.40.00.00.9
21019426020491113171115248176117936242114475137
69.874.974.358.885.893.499.486.575.682.292.193.984.969.091.193.890.7
16913423017080104170106220158115905335113472127
56.151.765.749.075.586.098.879.767.173.890.690.972.657.584.890.084.1
00000001000000050
0.00.00.00.00.00.00.00.80.00.00.00.00.00.00.06.30.0
84845312171803711727491114436201
49.452.281.541.664.593.075.585.435.584.571.677.269.268.6
53474169536923101739813328134
31.229.263.123.748.280.246.973.79.267.252.357.953.845.7
090100000000028
0.05.60.00.30.00.00.00.00.00.00.00.00.09.6
192120163145139413137891433263111126328784143131182
88.992.398.880.695.989.067.288.198.676.2100.097.489.492.780.788.880.988.3
16911015910913837997801363057106119297695124116157
78.284.696.460.695.281.747.579.293.871.490.593.084.483.971.577.071.676.2
000000000000012100
0.00.00.00.00.00.00.00.00.00.00.00.00.00.30.20.60.00.0

428
The Many Faces of Poverty (Volume 3)
LABANGANLABANGANLABANGANLABANGANLABANGAN BagalupaBalimbinganBinayanBokongBulanitCogonanComboDalapangDimasangcaDipayaLangapodLantianLower Campo IslamLower PulacanLower Sang-anNew LabanganNoboranOld LabanganSan IsidroSanta CruzTapodocTawagan NorteUpper Campo IslamUpper PulacanUpper Sang-an
LAKEWOODLAKEWOODLAKEWOODLAKEWOODLAKEWOOD Bagong KahayagBakingBiswanganBululawanDagumGasaGatubLukuanMatalangPoblacion (Lakewood)Sapang PinolesSebugueyTiwalesTubod
LAPUYLAPUYLAPUYLAPUYLAPUYANANANANAN BulawanCarpocDangananDansalDumaraLinokmadalumLuananLubusanMahalingebMandegMaralagMaruingMolumPampangPantadPingalayPoblacionSalambuyanSan JoseSayogTabonTalababTiguhaTininghalangTipasanTugaya
Households with incomeHouseholds with incomeHouseholds with incomeHouseholds with incomeHouseholds with incomebelow the poverbelow the poverbelow the poverbelow the poverbelow the pover ty thrty thrty thrty thrty thresholdesholdesholdesholdeshold
Households with incomeHouseholds with incomeHouseholds with incomeHouseholds with incomeHouseholds with incomebelow the food thresholdbelow the food thresholdbelow the food thresholdbelow the food thresholdbelow the food threshold
Households who experiencedHouseholds who experiencedHouseholds who experiencedHouseholds who experiencedHouseholds who experiencedfood shorfood shorfood shorfood shorfood shor tagetagetagetagetage
Table 4. Income Indicators, by Barangay, Province of Zamboanga del Sur, 2006-2009
Ba ranga yBa ranga yBa ranga yBa ranga yBa ranga yMunic ipal i tyMunic ipal i tyMunic ipal i tyMunic ipal i tyMunic ipal i ty
Magn i t udeMagn i t udeMagn i t udeMagn i t udeMagn i t ude Magn i t udeMagn i t udeMagn i t udeMagn i t udeMagn i t ude Magn i t udeMagn i t udeMagn i t udeMagn i t udeMagn i t udeP rP rP rP rP r opo ropo ropo ropo ropo r t i o nt i o nt i o nt i o nt i o n P rP rP rP rP r opo ropo ropo ropo ropo r t i o nt i o nt i o nt i o nt i o n P rP rP rP rP r opo ropo ropo ropo ropo r t i o nt i o nt i o nt i o nt i o n
1271491372402232858121410682273252171112372562288718717312736715723269
71.361.165.675.072.498.363.365.487.650.684.873.571.541.322.283.491.941.674.573.060.866.772.433.431.5
10811510720918827960177100512362191468913237209501561339126612917647
60.747.151.265.361.096.246.954.182.631.573.363.861.132.87.877.284.323.962.256.143.548.459.425.321.5
18701682283081883355137132138111891490
0.635.70.05.026.69.723.42.414.94.910.21.52.14.84.20.312.90.515.14.60.516.26.51.30.0
284144183215123931666510269810682104504
84.556.784.388.595.393.979.489.098.184.492.2100.090.488.0
258981751991158813560101648978299467
76.838.680.681.989.188.964.682.297.178.484.3100.086.181.5
00000000000000
0.00.00.00.00.00.00.00.00.00.00.00.00.00.0
1401719713347837212879819024593924287545113584465552061029563
55.667.680.886.475.866.980.977.192.976.475.668.463.365.766.762.655.663.577.367.784.474.371.574.580.580.8
9613975111386758104756471183687929603788144315544155757447
38.154.962.572.161.354.065.262.788.260.459.751.146.356.446.043.238.545.558.747.771.459.553.854.762.760.3
116039691831212722740102252915255219199332334294925
4.423.732.544.829.525.023.616.32.425.533.628.517.020.723.818.05.310.725.313.842.931.111.821.241.532.1

The Many Faces of Poverty (Volume 3)
429
Bag-ong BalambanBag-ong DalagueteBoniaoDelusomDiwanGuripanKaangayanKabuhiLourmahLower Salug DakuLower Santo NiñoMaluboManguilesMarabanan (Balanan)PanagaanParaisoPedaganPoblacionPugwanSan IsidroSan JoseSan VicenteSanta CruzSicpaoTuboranTulanTumapicUpper Salug DakuUpper Santo Niño
MAHAMAHAMAHAMAHAMAHAYYYYYAGAGAGAGAG
MARGOSATUBIGMARGOSATUBIGMARGOSATUBIGMARGOSATUBIGMARGOSATUBIG BalintawakBularongDigonGuinimananIgat IslandJosefinaKalianKolotLimabatongLimamawanLumbogMagahisPoblacionSaguaTalanusaTiguianTulapoc
MIDSALIPMIDSALIPMIDSALIPMIDSALIPMIDSALIP BacahanBalonaiBibilopBuloronCabaloranCanipay NorteCanipay SurCumaronDakayakanDuelicDumalinaoEcuanGolictopGuinabotGuitalosGumaKahayaganLicuro-anLumpunid
23466210172178189247217181255179135141752351447473310641225011514535514694168135308
76.568.071.770.575.771.971.881.355.469.968.388.255.763.676.878.791.460.956.167.455.676.271.156.789.693.171.571.478.6
2075218014315015720017411720914312411258211124646247130919710212227513092133112258
67.653.661.458.663.859.758.165.235.857.354.681.044.349.269.067.879.051.937.650.643.867.559.843.979.891.156.659.365.8
104012004170300162631327360000000149
0.30.01.40.00.40.80.00.01.24.70.02.00.00.00.333.978.81.114.35.90.00.00.00.00.00.00.00.512.5
13917221311130014335760256204286113194615277385297
92.791.591.492.594.691.769.688.288.386.469.691.173.492.768.189.793.7
1351601969727512830853226182238100152914949346277
90.085.184.180.886.882.160.077.977.977.157.980.657.790.943.480.787.4
8291143591851312845115411492795508522108
54.748.461.449.258.484.05.567.239.717.436.321.83.630.775.25.134.1
10619917627716789551974617582641259995872891185
51.578.384.279.694.445.237.796.190.290.764.191.477.695.288.065.946.796.884.9
6414015622415756331763514958581099474742287160
31.155.174.664.488.728.422.685.968.677.245.382.967.790.468.556.136.792.673.4
6051312400231200819005327
29.320.11.40.313.60.00.011.22.010.40.011.60.68.70.00.08.334.03.2
Households with incomeHouseholds with incomeHouseholds with incomeHouseholds with incomeHouseholds with incomebelow the poverbelow the poverbelow the poverbelow the poverbelow the pover ty thrty thrty thrty thrty thresholdesholdesholdesholdeshold
Households with incomeHouseholds with incomeHouseholds with incomeHouseholds with incomeHouseholds with incomebelow the food thresholdbelow the food thresholdbelow the food thresholdbelow the food thresholdbelow the food threshold
Households who experiencedHouseholds who experiencedHouseholds who experiencedHouseholds who experiencedHouseholds who experiencedfood shorfood shorfood shorfood shorfood shor tagetagetagetagetage
Table 4. Income Indicators, by Barangay, Province of Province of Zamboanga del Sur, 2006-2009
Ba ranga yBa ranga yBa ranga yBa ranga yBa ranga yMunic ipal i tyMunic ipal i tyMunic ipal i tyMunic ipal i tyMunic ipal i ty
Magn i t udeMagn i t udeMagn i t udeMagn i t udeMagn i t ude Magn i t udeMagn i t udeMagn i t udeMagn i t udeMagn i t ude Magn i t udeMagn i t udeMagn i t udeMagn i t udeMagn i t udeP rP rP rP rP r opo ropo ropo ropo ropo r t i o nt i o nt i o nt i o nt i o n P rP rP rP rP r opo ropo ropo ropo ropo r t i o nt i o nt i o nt i o nt i o n P rP rP rP rP r opo ropo ropo ropo ropo r t i o nt i o nt i o nt i o nt i o n

430
The Many Faces of Poverty (Volume 3)
MIDSALIPMIDSALIPMIDSALIPMIDSALIPMIDSALIP MatalangNew KatipunanNew UnidosPaliliPawanPiliPisomponganPiwanPoblacion APoblacion BSigapodTimbaboyTulbongTuluan
MOLAMOLAMOLAMOLAMOLAVEVEVEVEVE AliciaAriosaBagong ArgaoBagong GutlangBlanciaBogo CapalaranCuloDalaonDipoloDontulanGonosanLower DimalinaoLower DimorokMabuhayMadasigon (Pob.)Makuguihon (Pob.)Maloloy-on (Pob.)MiliganParasanRizalSanto RosarioSilangitSimataSudlonUpper Dimorok
PPPPPAGADIAN CITYAGADIAN CITYAGADIAN CITYAGADIAN CITYAGADIAN CITY AlegriaBalangasan (Pob.)BalintawakBaloyboanBanaleBogoBombaBuenavistaBulatokBulawanDampalanDanluganDaoDataganDeborokDitorayDumagocGatas (Pob.)GubacGubangKagawasanKahayaganKalasanKawitLa SuerteLalaLapidianLenienza
Households with incomeHouseholds with incomeHouseholds with incomeHouseholds with incomeHouseholds with incomebelow the poverbelow the poverbelow the poverbelow the poverbelow the pover ty thrty thrty thrty thrty thresholdesholdesholdesholdeshold
Households with incomeHouseholds with incomeHouseholds with incomeHouseholds with incomeHouseholds with incomebelow the food thresholdbelow the food thresholdbelow the food thresholdbelow the food thresholdbelow the food threshold
Households who experiencedHouseholds who experiencedHouseholds who experiencedHouseholds who experiencedHouseholds who experiencedfood shorfood shorfood shorfood shorfood shor tagetagetagetagetage
Table 4. Income Indicators, by Barangay, Province of Zamboanga del Sur, 2006-2009
Ba ranga yBa ranga yBa ranga yBa ranga yBa ranga yMunic ipal i tyMunic ipal i tyMunic ipal i tyMunic ipal i tyMunic ipal i ty
Magn i t udeMagn i t udeMagn i t udeMagn i t udeMagn i t ude Magn i t udeMagn i t udeMagn i t udeMagn i t udeMagn i t ude Magn i t udeMagn i t udeMagn i t udeMagn i t udeMagn i t udeP rP rP rP rP r opo ropo ropo ropo ropo r t i o nt i o nt i o nt i o nt i o n P rP rP rP rP r opo ropo ropo ropo ropo r t i o nt i o nt i o nt i o nt i o n P rP rP rP rP r opo ropo ropo ropo ropo r t i o nt i o nt i o nt i o nt i o n
169385010910284125539120024316877109
90.429.567.664.593.693.374.466.329.149.591.080.881.998.2
15283452937499374813422614145108
81.36.245.930.885.382.258.946.315.333.284.667.847.997.3
1347082263813610
1571300
7.036.70.048.523.942.27.77.50.30.058.86.30.00.0
16612216513624310736418830086191509015630235423922414816679135173265120
86.957.569.988.949.026.837.851.660.274.175.865.881.868.736.945.837.657.367.663.484.093.861.351.769.8
14786125123174561941522216816337801151742051161661111225312512018693
77.040.653.080.435.114.020.141.844.458.664.748.772.750.721.326.518.242.550.746.656.486.842.636.354.1
000010405141040043000000010
0.00.00.00.00.20.00.40.01.012.14.05.30.00.00.50.40.00.00.00.00.00.00.00.20.0
53645168772668321315512061108209245158451075073184154501072336712017079177
48.638.165.462.643.948.547.166.029.943.990.850.940.476.063.465.253.954.476.473.054.957.248.936.387.665.477.545.0
31316130521715810612459271001391361372885288297213035739
21010213955128
28.418.750.642.328.233.923.552.814.719.484.033.822.465.939.451.830.650.965.561.638.539.019.120.874.553.553.932.6
00001000001001000123000313004
0.00.00.00.00.20.00.00.00.00.00.80.00.00.50.00.00.03.01.81.40.00.00.00.39.50.00.01.1

The Many Faces of Poverty (Volume 3)
431
PPPPPAGADIAN CITYAGADIAN CITYAGADIAN CITYAGADIAN CITYAGADIAN CITY Lizon ValleyLumadLumbiaMacasingMangaMuricayNapolanPalpalanPedulonanPoloyaganSan Francisco (Pob.)San Jose (Pob.)San Pedro (Pob.)Santa Lucia (Pob.)Santa MariaSantiago (Pob.)Santo NiñoTawagan SurTigumaTuburan (Pob.)TulanganTulawasWhite Beach
P ITOGOP ITOGOP ITOGOP ITOGOP ITOGO BalabawanBalong-balongColojoLiasanLiguacLimbayanLower Paniki-anMatin-aoPanubiganPoblacion (Pitogo)Punta FlechaSan IsidroSugbay DosTongaoUpper Paniki-an
RAMON MAGSARAMON MAGSARAMON MAGSARAMON MAGSARAMON MAGSAYSAYSAYSAYSAYSAYYYYY Bagong OponBambong DakuBambong DiutBobonganCampo IVCampo VCanianganDipalusanEastern BobonganEsperanzaGapasanKatipunanKauswaganLower SambulawanMabiniMagsaysayMalatingParadisePasingkalanPoblacionSan FernandoSanto RosarioSapa AndingSinaguingSwitchUpper LaperianWakat
Households with incomeHouseholds with incomeHouseholds with incomeHouseholds with incomeHouseholds with incomebelow the poverbelow the poverbelow the poverbelow the poverbelow the pover ty thrty thrty thrty thrty thresholdesholdesholdesholdeshold
Households with incomeHouseholds with incomeHouseholds with incomeHouseholds with incomeHouseholds with incomebelow the food thresholdbelow the food thresholdbelow the food thresholdbelow the food thresholdbelow the food threshold
Households who experiencedHouseholds who experiencedHouseholds who experiencedHouseholds who experiencedHouseholds who experiencedfood shorfood shorfood shorfood shorfood shor tagetagetagetagetage
Table 4. Income Indicators, by Barangay, Province of Province of Zamboanga del Sur, 2006-2009
Ba ranga yBa ranga yBa ranga yBa ranga yBa ranga yMunic ipal i tyMunic ipal i tyMunic ipal i tyMunic ipal i tyMunic ipal i ty
Magn i t udeMagn i t udeMagn i t udeMagn i t udeMagn i t ude Magn i t udeMagn i t udeMagn i t udeMagn i t udeMagn i t ude Magn i t udeMagn i t udeMagn i t udeMagn i t udeMagn i t udeP rP rP rP rP r opo ropo ropo ropo ropo r t i o nt i o nt i o nt i o nt i o n P rP rP rP rP r opo ropo ropo ropo ropo r t i o nt i o nt i o nt i o nt i o n P rP rP rP rP r opo ropo ropo ropo ropo r t i o nt i o nt i o nt i o nt i o n
3251211471771741521697355316532812811450224132753703317213061
84.673.830.767.063.552.643.159.374.364.633.742.748.364.455.645.729.841.028.251.065.557.549.6
2649192137139991114542215218855844215375492401854810036
68.855.519.251.950.734.328.336.656.843.826.924.520.847.546.731.216.926.818.328.543.644.229.3
753002000021600181094690
20.11.90.00.00.70.00.00.00.05.00.60.80.00.01.31.70.20.00.70.75.54.10.0
226261991741351401887139471207106302149170
81.086.784.687.088.268.682.163.479.955.576.788.381.889.881.7
2042377914612990159483274315585269140152
73.178.767.573.084.344.169.442.966.333.657.470.872.984.373.1
1027300051060300
0.40.023.11.50.00.00.04.50.20.02.20.00.80.00.0
7998581832531169079129220174197687563101551141733901048017115913411351
77.574.267.475.686.369.963.481.467.956.771.670.479.189.394.066.970.567.984.069.386.072.169.072.358.877.477.3
61754416023285667111116815414964655872428415327980621421251048843
59.856.851.266.179.251.246.573.258.443.363.453.274.477.486.647.753.850.074.349.666.155.957.356.845.660.365.2
01000020032111035010000005000
0.00.80.00.00.00.01.40.00.00.88.63.90.03.67.50.04.50.00.00.00.00.00.02.30.00.00.0
432
The Many Faces of Poverty (Volume 3)
Households with incomeHouseholds with incomeHouseholds with incomeHouseholds with incomeHouseholds with incomebelow the poverbelow the poverbelow the poverbelow the poverbelow the pover ty thrty thrty thrty thrty thresholdesholdesholdesholdeshold
Households with incomeHouseholds with incomeHouseholds with incomeHouseholds with incomeHouseholds with incomebelow the food thresholdbelow the food thresholdbelow the food thresholdbelow the food thresholdbelow the food threshold
Households who experiencedHouseholds who experiencedHouseholds who experiencedHouseholds who experiencedHouseholds who experiencedfood shorfood shorfood shorfood shorfood shor tagetagetagetagetage
Table 4. Income Indicators, by Barangay, Province of Zamboanga del Sur, 2006-2009
Ba ranga yBa ranga yBa ranga yBa ranga yBa ranga yMunic ipal i tyMunic ipal i tyMunic ipal i tyMunic ipal i tyMunic ipal i ty
Magn i t udeMagn i t udeMagn i t udeMagn i t udeMagn i t ude Magn i t udeMagn i t udeMagn i t udeMagn i t udeMagn i t ude Magn i t udeMagn i t udeMagn i t udeMagn i t udeMagn i t udeP rP rP rP rP r opo ropo ropo ropo ropo r t i o nt i o nt i o nt i o nt i o n P rP rP rP rP r opo ropo ropo ropo ropo r t i o nt i o nt i o nt i o nt i o n P rP rP rP rP r opo ropo ropo ropo ropo r t i o nt i o nt i o nt i o nt i o n
100149127901741303411812052842251471223685923338
71.474.598.488.253.594.2100.086.882.247.377.866.072.174.463.664.192.169.1
8012611881117113321051093172170117962993421528
57.163.091.579.436.081.994.177.274.728.266.749.957.458.551.637.085.050.9
021600018000041703022
0.01.012.60.00.00.060.00.00.00.00.01.20.543.20.50.00.83.6
787736136113751937548658712967971137634912486103398351137137596771
98.780.285.776.868.5100.099.587.243.697.064.083.882.749.591.156.785.586.768.867.381.397.692.767.877.4100.083.881.6
766527105807519072356159107595210064321107436833814610989595259
96.267.764.359.348.5100.097.983.731.891.043.469.572.826.580.647.878.774.834.444.468.895.383.654.050.3100.065.067.8
05000000140000300000000000000
0.05.20.00.00.00.00.00.012.70.00.00.00.01.50.00.00.00.00.00.00.00.00.00.00.00.00.00.0
5680108164170699592891421053891407414140178195
76.793.077.189.193.936.195.091.1100.088.894.665.682.897.481.597.659.1
53779313715433888386129100297112631274076163
72.689.566.474.585.117.388.082.296.680.690.150.166.382.973.497.625.269.1
000230100944059303060
0.00.00.01.11.70.01.00.00.058.836.00.855.00.01.70.02.00.0
SAN MIGUELSAN MIGUELSAN MIGUELSAN MIGUELSAN MIGUEL
SAN PSAN PSAN PSAN PSAN PABLOABLOABLOABLOABLO Bag-ong MisamisBubualButonCulasianDaplayanKalilanganKapamanokKondumLumbayaoMabuhayMarcos VillageMiasinMolansongPantadPaoPayagPoblacion (San Pablo)PongapongSacbulanSagasanSan JuanSeniorSonggoyTandubuayTaniapanTicala IslandTubo-paitVillakapa
SOMINOTSOMINOTSOMINOTSOMINOTSOMINOT Bag-ong BaroyBag-ong OroquietaBarubuhanBulanayDataganEastern PoblacionLantawanLiber tadLumangoyNew CarmenPicturanPoblacionRizalSan MiguelSanto NiñoSawaTungawanUpper Sicpao
BetinanBulawanCalubeConcepcionDao-anDumalianFatimaLangilanLantawanLaperianLibugananLimonanMatiOcapanPoblacionSan IsidroSayogTapian
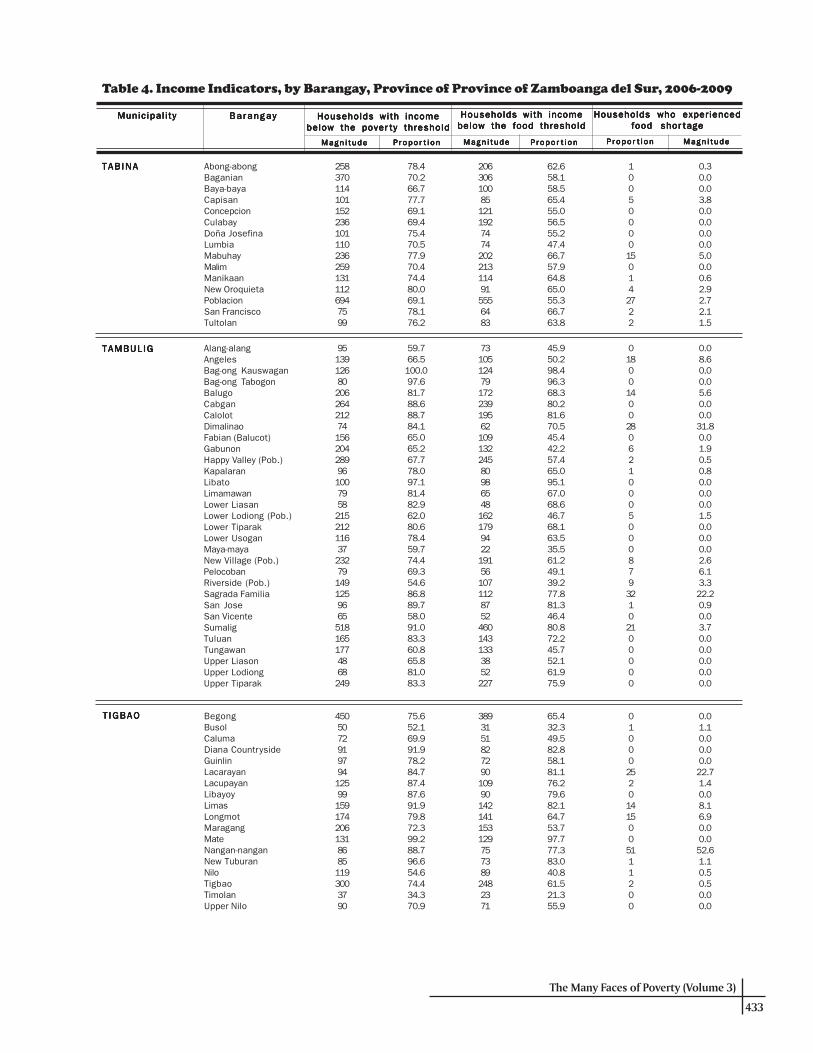
The Many Faces of Poverty (Volume 3)
433
TAB INATAB INATAB INATAB INATAB INA Abong-abongBaganianBaya-bayaCapisanConcepcionCulabayDoña JosefinaLumbiaMabuhayMalimManikaanNew OroquietaPoblacionSan FranciscoTultolan
TAMBUL IGTAMBUL IGTAMBUL IGTAMBUL IGTAMBUL IG Alang-alangAngelesBag-ong KauswaganBag-ong TabogonBalugoCabganCalolotDimalinaoFabian (Balucot)GabunonHappy Valley (Pob.)KapalaranLibatoLimamawanLower LiasanLower Lodiong (Pob.)Lower TiparakLower UsoganMaya-mayaNew Village (Pob.)PelocobanRiverside (Pob.)Sagrada FamiliaSan JoseSan VicenteSumaligTuluanTungawanUpper LiasonUpper LodiongUpper Tiparak
T IGBAOT IGBAOT IGBAOT IGBAOT IGBAO BegongBusolCalumaDiana CountrysideGuinlinLacarayanLacupayanLibayoyLimasLongmotMaragangMateNangan-nanganNew TuburanNiloTigbaoTimolanUpper Nilo
Households with incomeHouseholds with incomeHouseholds with incomeHouseholds with incomeHouseholds with incomebelow the poverbelow the poverbelow the poverbelow the poverbelow the pover ty thrty thrty thrty thrty thresholdesholdesholdesholdeshold
Households with incomeHouseholds with incomeHouseholds with incomeHouseholds with incomeHouseholds with incomebelow the food thresholdbelow the food thresholdbelow the food thresholdbelow the food thresholdbelow the food threshold
Households who experiencedHouseholds who experiencedHouseholds who experiencedHouseholds who experiencedHouseholds who experiencedfood shorfood shorfood shorfood shorfood shor tagetagetagetagetage
Table 4. Income Indicators, by Barangay, Province of Province of Zamboanga del Sur, 2006-2009
Ba ranga yBa ranga yBa ranga yBa ranga yBa ranga yMunic ipal i tyMunic ipal i tyMunic ipal i tyMunic ipal i tyMunic ipal i ty
Magn i t udeMagn i t udeMagn i t udeMagn i t udeMagn i t ude Magn i t udeMagn i t udeMagn i t udeMagn i t udeMagn i t ude Magn i t udeMagn i t udeMagn i t udeMagn i t udeMagn i t udeP rP rP rP rP r opo ropo ropo ropo ropo r t i o nt i o nt i o nt i o nt i o n P rP rP rP rP r opo ropo ropo ropo ropo r t i o nt i o nt i o nt i o nt i o n P rP rP rP rP r opo ropo ropo ropo ropo r t i o nt i o nt i o nt i o nt i o n
2583701141011522361011102362591311126947599
78.470.266.777.769.169.475.470.577.970.474.480.069.178.176.2
206306100851211927474202213114915556483
62.658.158.565.455.056.555.247.466.757.964.865.055.366.763.8
10050000150142722
0.30.00.03.80.00.00.00.05.00.00.62.92.72.11.5
951391268020626421274156204289961007958215212116372327914912596655181651774868249
59.766.5100.097.681.788.688.784.165.065.267.778.097.181.482.962.080.678.459.774.469.354.686.889.758.091.083.360.865.881.083.3
7310512479172239195621091322458098654816217994221915610711287524601431333852227
45.950.298.496.368.380.281.670.545.442.257.465.095.167.068.646.768.163.535.561.249.139.277.881.346.480.872.245.752.161.975.9
018001400280621000500087932102100000
0.08.60.00.05.60.00.031.80.01.90.50.80.00.00.01.50.00.00.02.66.13.322.20.90.03.70.00.00.00.00.0
45050729197941259915917420613186851193003790
75.652.169.991.978.284.787.487.691.979.872.399.288.796.654.674.434.370.9
3893151827290109901421411531297573892482371
65.432.349.582.858.181.176.279.682.164.753.797.777.383.040.861.521.355.9
0100025201415005111200
0.01.10.00.00.022.71.40.08.16.90.00.052.61.10.50.50.00.0

434
The Many Faces of Poverty (Volume 3)
TUKURANTUKURANTUKURANTUKURANTUKURAN
VINCENZO SAGUNVINCENZO SAGUNVINCENZO SAGUNVINCENZO SAGUNVINCENZO SAGUN AmbulonBui-osCogonDananKabatanKapataganLimasonLinoguayanLumbalLunibMaculayMarayaSagucanWaling-waling
Households with incomeHouseholds with incomeHouseholds with incomeHouseholds with incomeHouseholds with incomebelow the poverbelow the poverbelow the poverbelow the poverbelow the pover ty thrty thrty thrty thrty thresholdesholdesholdesholdeshold
Households with incomeHouseholds with incomeHouseholds with incomeHouseholds with incomeHouseholds with incomebelow the food thresholdbelow the food thresholdbelow the food thresholdbelow the food thresholdbelow the food threshold
Households who experiencedHouseholds who experiencedHouseholds who experiencedHouseholds who experiencedHouseholds who experiencedfood shorfood shorfood shorfood shorfood shor tagetagetagetagetage
Table 4. Income Indicators, by Barangay, Province of Zamboanga del Sur, 2006-2009
Ba ranga yBa ranga yBa ranga yBa ranga yBa ranga yMunic ipal i tyMunic ipal i tyMunic ipal i tyMunic ipal i tyMunic ipal i ty
Magn i t udeMagn i t udeMagn i t udeMagn i t udeMagn i t ude Magn i t udeMagn i t udeMagn i t udeMagn i t udeMagn i t ude Magn i t udeMagn i t udeMagn i t udeMagn i t udeMagn i t udeP rP rP rP rP r opo ropo ropo ropo ropo r t i o nt i o nt i o nt i o nt i o n P rP rP rP rP r opo ropo ropo ropo ropo r t i o nt i o nt i o nt i o nt i o n P rP rP rP rP r opo ropo ropo ropo ropo r t i o nt i o nt i o nt i o nt i o n
289199471702451722559312112810915631428739619866289103236167232144172106
AlindahawBaclayBalimbinganBuenasuerteCamangaCurvadaLaperianLiber tadLower BayaoLuy-aManilanManlayagMilitarNavalanPanduma SeniorSambulawanSan AntonioSan Carlos (Pob.)Santo Niño (Pob.)Santo RosarioSugodTabuanTaguloTinotunganUpper Bayao
74.576.874.686.764.150.782.089.466.575.789.394.584.990.374.076.479.555.872.766.780.781.783.280.460.9
23916738133161118229888411388150256265318173591877782514020112914178
61.664.560.367.942.134.873.684.646.266.972.190.969.283.359.466.871.136.154.846.367.670.874.665.944.8
93910034011061342117261013761253803
2.315.11.60.00.010.00.01.05.53.610.72.45.75.34.90.40.02.55.41.91.01.822.00.01.7
132163176308435169192173147217130165146311
75.473.867.465.176.261.069.887.478.281.080.266.873.089.6
11113613819738912915415512216510414199280
63.461.552.941.668.146.656.078.364.961.664.257.149.580.7
500024121174330
2.90.00.00.00.41.40.41.05.92.62.51.21.50.0
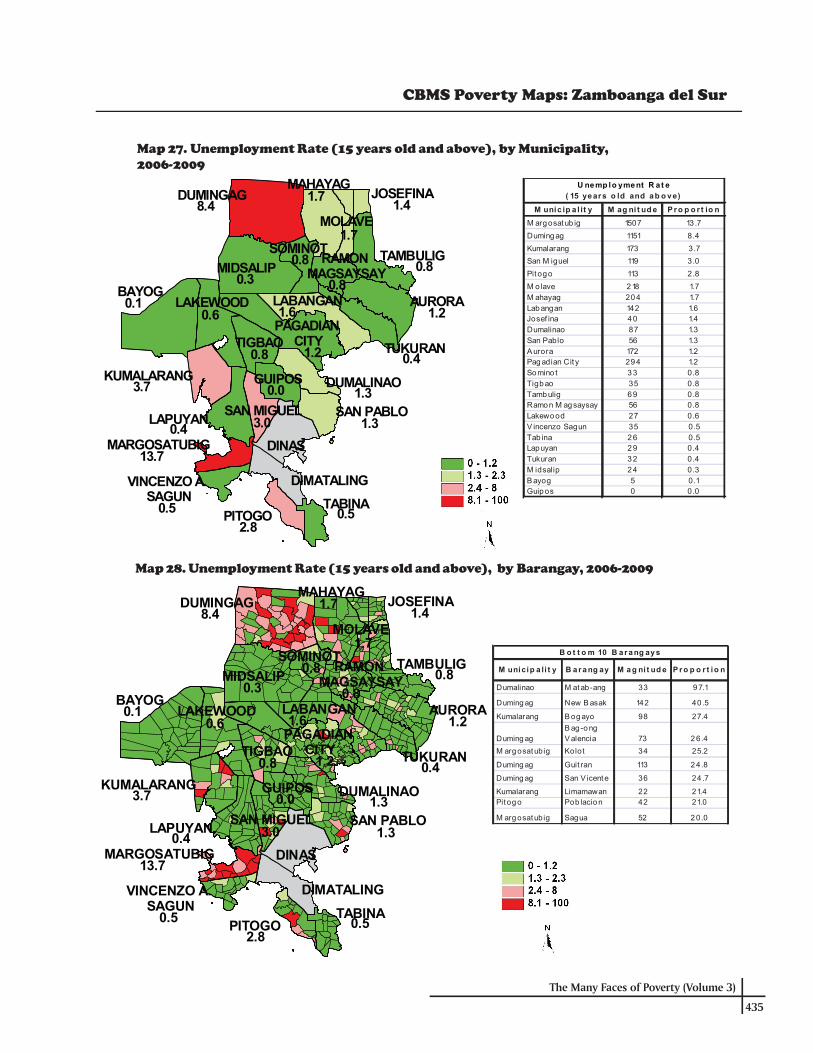
The Many Faces of Poverty (Volume 3)
435
Map 27. Unemployment Rate (15 years old and above), by Municipality,2006-2009
Map 28. Unemployment Rate (15 years old and above), by Barangay, 2006-2009
DUMINGAG
MIDSALIP
MAHAYAG
AURORA
TUKURAN
LABANGAN
PAGADIAN CITY
SAN PABLO
GUIPOS
DINAS
TABINAPITOGO
DIMATALINGVINCENZO A. SAGUN
MARGOSATUBIG
LAPUYAN
KUMALARANG
BAYOGLAKEWOOD
RAMON MAGSAYSAY
SOMINOT
MOLAVE
JOSEFINA
TAMBULIG
DUMALINAO
TIGBAO
SAN MIGUEL
8.41.7
1.7
1.4
0.8
1.2
0.4
0.80.30.8
0.60.1
0.8
0.0
1.2
1.6
1.3
1.3
2.80.5
3.00.4
13.7
0.5
3.7
CBMS Poverty Maps: Zamboanga del Sur
M unic ip a l it y M ag ni t ud e P ro p o r t io nM argosatub ig 1507 13 .7
Dumingag 1151 8.4
Kumalarang 173 3.7
San M iguel 119 3.0
Pitogo 113 2.8
M o lave 218 1.7M ahayag 204 1.7Labangan 142 1.6Josef ina 40 1.4Dumalinao 87 1.3San Pablo 56 1.3A urora 172 1.2Pagadian Cit y 294 1.2Somino t 33 0.8Tigbao 35 0.8Tambulig 69 0.8Ramon M agsaysay 56 0.8Lakewood 27 0.6V incenzo Sagun 35 0.5Tab ina 26 0.5Lapuyan 29 0.4Tukuran 32 0.4M idsalip 24 0.3B ayog 5 0.1Guipos 0 0.0
U nemp lo yment R a t e ( 15 years o ld and ab o ve)
M unicip a li t y B a r a ng ay M a g ni t ud e P r o p o r t io n
Dumalinao M atab-ang 33 9 7.1
Duming ag New B asak 142 40 .5
Kumalarang B og ayo 98 27.4
Duming agB ag -o ng V alencia 73 2 6.4
M arg osatubig Kolot 34 25.2
Duming ag Guit ran 113 2 4.8
Duming ag San Vicente 36 24 .7
Kumalarang Limamawan 22 21.4Pitog o Pob lacio n 42 21.0
M arg osatubig Sagua 52 2 0.0
B o t t o m 10 B a r a ng ay s
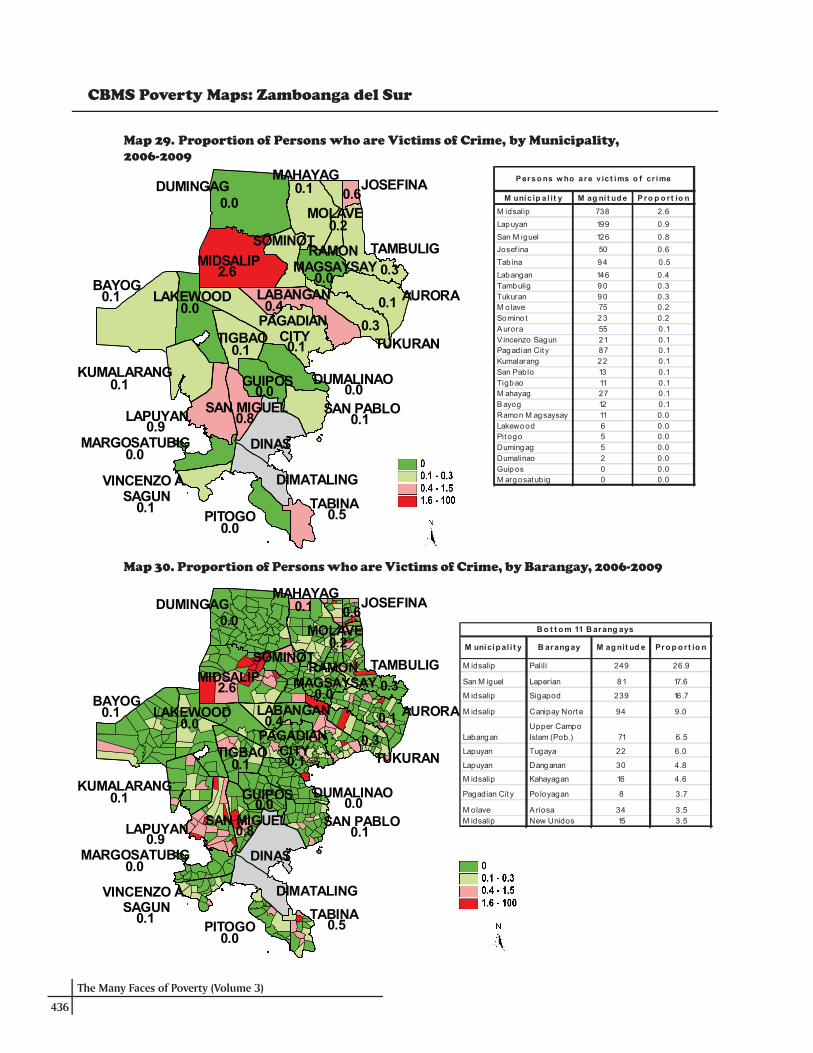
436
The Many Faces of Poverty (Volume 3)
Map 30. Proportion of Persons who are Victims of Crime, by Barangay, 2006-2009
Map 29. Proportion of Persons who are Victims of Crime, by Municipality,2006-2009
DUMINGAG
MIDSALIP
MAHAYAG
AURORA
TUKURAN
LABANGAN
PAGADIAN CITY
SAN PABLO
GUIPOS
DINAS
TABINAPITOGO
DIMATALINGVINCENZO A. SAGUN
MARGOSATUBIG
LAPUYAN
KUMALARANG
BAYOGLAKEWOOD
RAMON MAGSAYSAY
SOMINOT
MOLAVE
JOSEFINA
TAMBULIG
DUMALINAO
TIGBAO
SAN MIGUEL
0.00.1
0.2
0.6
0.3
0.10.3
0.02.6
0.10.0 0.4
0.10.1
0.0 0.0
0.10.80.9
0.1
0.0
0.10.0
0.5
CBMS Poverty Maps: Zamboanga del Sur
M unic ip a l it y M ag ni t ud e P ro p o r t io nM idsalip 738 2.6
Lapuyan 199 0.9
San M iguel 126 0.8
Josef ina 50 0.6
Tab ina 94 0.5
Labangan 146 0.4Tambulig 90 0.3Tukuran 90 0.3M o lave 75 0.2Somino t 23 0.2A urora 55 0.1V incenzo Sagun 21 0.1Pagadian Cit y 87 0.1Kumalarang 22 0.1San Pablo 13 0.1Tigbao 11 0.1M ahayag 27 0.1B ayog 12 0.1Ramon M agsaysay 11 0.0Lakewood 6 0.0Pitogo 5 0.0Dumingag 5 0.0Dumalinao 2 0.0Guipos 0 0.0M argosatub ig 0 0.0
P erso ns w ho are v ic t ims o f cr ime
M unicip al i t y B arang ay M ag nit ud e Pro p o r t io n
M idsalip Palili 249 26.9
San M iguel Laperian 81 17.6
M idsalip Sigapod 239 16.7
M idsalip Canipay Norte 94 9.0
LabanganUpper Campo Islam (Pob.) 71 6.5
Lapuyan Tugaya 22 6.0
Lapuyan Danganan 30 4.8
M idsalip Kahayagan 16 4.6
Pagadian City Po loyagan 8 3.7
M olave Ariosa 34 3.5M idsalip New Unidos 15 3.5
B o t t o m 11 B arang ays

The Many Faces of Poverty (Volume 3)
437
Table 5. Unemployment and Victims of Crime Indicators, by Barangay, Province of Zamboangadel Sur, 2006-2009
Unemployment rateUnemployment rateUnemployment rateUnemployment rateUnemployment rate(15 years old and above)(15 years old and above)(15 years old and above)(15 years old and above)(15 years old and above)
Persons who are vict ims ofPersons who are vict ims ofPersons who are vict ims ofPersons who are vict ims ofPersons who are vict ims ofc r imescr imescr imescr imescr imes
Number of persons inNumber of persons inNumber of persons inNumber of persons inNumber of persons inthe labor forcethe labor forcethe labor forcethe labor forcethe labor force
(15 years old and(15 years old and(15 years old and(15 years old and(15 years old andabo ve )abo ve )abo ve )abo ve )abo ve )
Ba r anga yBa ranga yBa ranga yBa ranga yBa ranga yMunic ipal i tyMunic ipal i tyMunic ipal i tyMunic ipal i tyMunic ipal i ty
P rP rP rP rP r opo ropo ropo ropo ropo r t i o nt i o nt i o nt i o nt i o nP rP rP rP rP r opo ropo ropo ropo ropo r t i o nt i o nt i o nt i o nt i o n Magn i t udeMagn i t udeMagn i t udeMagn i t udeMagn i t udeMagn i t udeMagn i t udeMagn i t udeMagn i t udeMagn i t ude
AURORAAURORAAURORAAURORAAURORA AcadAlang-alangAlegriaAnonangBagong MandaueBagong MaslogBagong OslobBagong PitogoBakiBalasBalideBalintawakBayabasBemposaCabilinanCampo UnoCebonegCommonwealthGubaanInasaganInroadKahayagan EastKahayagan WestKauswaganLa Paz (Tinibtiban)La VictoriaLantunganLiber tadLintugopLubidMaguikayMahayahayMonte AlegreMontelaNapoPanaghiusaPoblacionResthouseRomarateSan JoseSan JuanSapa LobocTagulaloWaterfall
BABABABABAYOGYOGYOGYOGYOG BakingBalukbahanBalumbunanBantalBobuanCamp BlessingCanoayanConaconDagumDamitDataganDepaseDepiliDeporeDeporehanDimalinaoKahayaganKanipaanLamareLibaMatin-aoMatun-og
338131139463149158243109123648184526410303330558109206512202127270257123233271333461828227171332398214561571242168347925142281247208
0104100002408010025107303016204180019221100110
0.00.80.00.90.70.00.00.00.00.32.20.02.00.00.30.00.01.01.00.50.02.61.20.01.30.00.31.30.20.02.30.32.00.00.00.67.41.20.31.10.00.40.40.0
2000000002010020000521210200000301000110000101
0.20.00.00.00.00.00.00.00.00.10.00.10.00.00.20.00.00.00.00.80.51.40.10.03.20.00.00.00.00.60.00.10.00.00.00.20.00.00.00.00.00.10.00.2
6934810378247931651545745214227119825414114279213518483209100
0000100100000000100000
0.00.00.00.00.40.00.00.60.00.00.00.00.00.00.00.00.10.00.00.00.00.0
0001000103000600000000
0.00.00.00.30.00.00.00.20.00.20.00.00.00.60.00.00.00.00.00.00.00.0
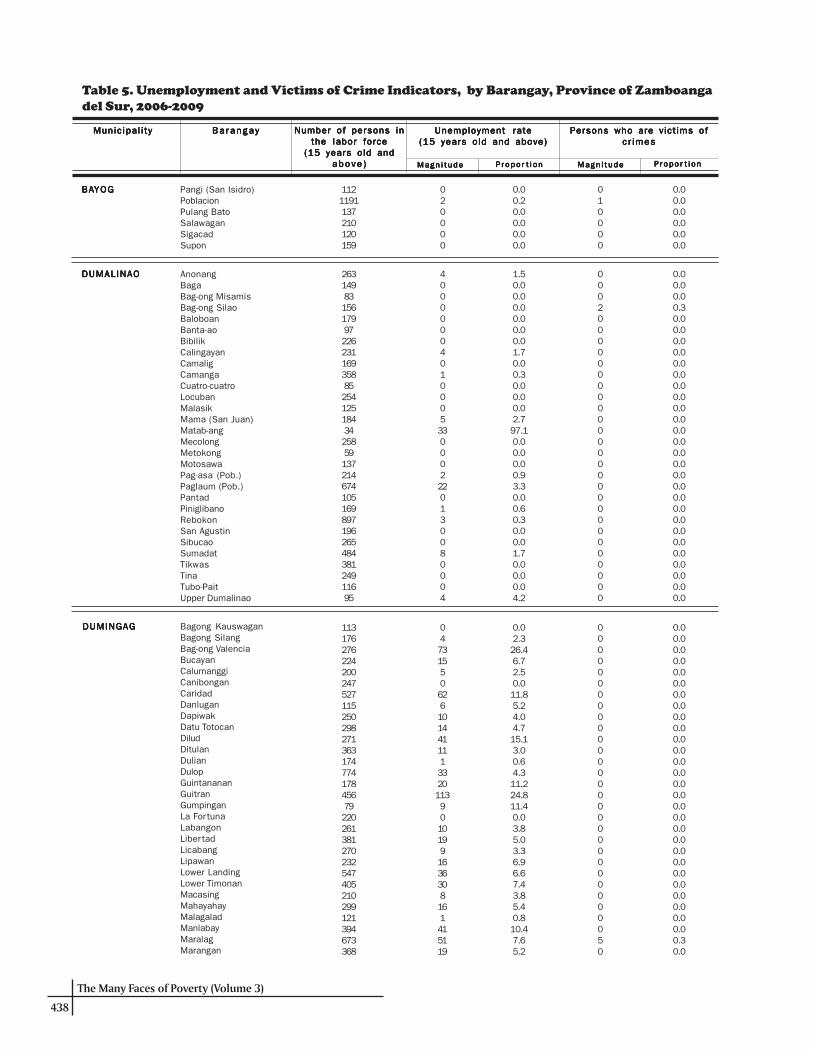
438
The Many Faces of Poverty (Volume 3)
Table 5. Unemployment and Victims of Crime Indicators, by Barangay, Province of Zamboangadel Sur, 2006-2009
Unemployment rateUnemployment rateUnemployment rateUnemployment rateUnemployment rate(15 years old and above)(15 years old and above)(15 years old and above)(15 years old and above)(15 years old and above)
Persons who are vict ims ofPersons who are vict ims ofPersons who are vict ims ofPersons who are vict ims ofPersons who are vict ims ofc r imescr imescr imescr imescr imes
Number of persons inNumber of persons inNumber of persons inNumber of persons inNumber of persons inthe labor forcethe labor forcethe labor forcethe labor forcethe labor force
(15 years old and(15 years old and(15 years old and(15 years old and(15 years old andabo ve )abo ve )abo ve )abo ve )abo ve )
Ba r anga yBa ranga yBa ranga yBa ranga yBa ranga yMunic ipal i tyMunic ipal i tyMunic ipal i tyMunic ipal i tyMunic ipal i ty
P rP rP rP rP r opo ropo ropo ropo ropo r t i o nt i o nt i o nt i o nt i o nP rP rP rP rP r opo ropo ropo ropo ropo r t i o nt i o nt i o nt i o nt i o n Magn i t udeMagn i t udeMagn i t udeMagn i t udeMagn i t udeMagn i t udeMagn i t udeMagn i t udeMagn i t udeMagn i t ude
BABABABABAYOGYOGYOGYOGYOG Pangi (San Isidro)PoblacionPulang BatoSalawaganSigacadSupon
DUMALINAODUMALINAODUMALINAODUMALINAODUMALINAO AnonangBagaBag-ong MisamisBag-ong SilaoBaloboanBanta-aoBibilikCalingayanCamaligCamangaCuatro-cuatroLocubanMalasikMama (San Juan)Matab-angMecolongMetokongMotosawaPag-asa (Pob.)Paglaum (Pob.)PantadPiniglibanoRebokonSan AgustinSibucaoSumadatTikwasTinaTubo-PaitUpper Dumalinao
DUMINGAGDUMINGAGDUMINGAGDUMINGAGDUMINGAG Bagong KauswaganBagong SilangBag-ong ValenciaBucayanCalumanggiCanibonganCaridadDanluganDapiwakDatu TotocanDiludDitulanDulianDulopGuintanananGuitranGumpinganLa For tunaLabangonLiber tadLicabangLipawanLower LandingLower TimonanMacasingMahayahayMalagaladManlabayMaralagMarangan
1121191137210120159
020000
0.00.20.00.00.00.0
010000
0.00.00.00.00.00.0
263149831561799722623116935885254125184342585913721467410516989719626548438124911695
40000004010005330002220130080004
1.50.00.00.00.00.00.01.70.00.30.00.00.02.797.10.00.00.00.93.30.00.60.30.00.01.70.00.00.04.2
000200000000000000000000000000
0.00.00.00.30.00.00.00.00.00.00.00.00.00.00.00.00.00.00.00.00.00.00.00.00.00.00.00.00.00.0
11317627622420024752711525029827136317477417845679220261381270232547405210299121394673368
04731550626101441111332011390101991636308161415119
0.02.326.46.72.50.011.85.24.04.715.13.00.64.311.224.811.40.03.85.03.36.96.67.43.85.40.810.47.65.2
000000000000000000000000000050
0.00.00.00.00.00.00.00.00.00.00.00.00.00.00.00.00.00.00.00.00.00.00.00.00.00.00.00.00.30.0

The Many Faces of Poverty (Volume 3)
439
Table 5. Unemployment and Victims of Crime Indicators, by Barangay, Province of Zamboangadel Sur, 2006-2009
Unemployment rateUnemployment rateUnemployment rateUnemployment rateUnemployment rate(15 years old and above)(15 years old and above)(15 years old and above)(15 years old and above)(15 years old and above)
Persons who are vict ims ofPersons who are vict ims ofPersons who are vict ims ofPersons who are vict ims ofPersons who are vict ims ofc r imescr imescr imescr imescr imes
Number of persons inNumber of persons inNumber of persons inNumber of persons inNumber of persons inthe labor forcethe labor forcethe labor forcethe labor forcethe labor force
(15 years old and(15 years old and(15 years old and(15 years old and(15 years old andabo ve )abo ve )abo ve )abo ve )abo ve )
Ba r anga yBa ranga yBa ranga yBa ranga yBa ranga yMunic ipal i tyMunic ipal i tyMunic ipal i tyMunic ipal i tyMunic ipal i ty
P rP rP rP rP r opo ropo ropo ropo ropo r t i o nt i o nt i o nt i o nt i o nP rP rP rP rP r opo ropo ropo ropo ropo r t i o nt i o nt i o nt i o nt i o n Magn i t udeMagn i t udeMagn i t udeMagn i t udeMagn i t udeMagn i t udeMagn i t udeMagn i t udeMagn i t udeMagn i t ude
DUMINGAGDUMINGAGDUMINGAGDUMINGAGDUMINGAG New BasakSaadSalvadorSan JuanSan Pablo (Pob.)San Pedro (Pob.)San VicenteSenoteSinonokSunopTagunTamurayanUpper LandingUpper Timonan
GU IPOSGUIPOSGUIPOSGUIPOSGUIPOS Bagong OroquietaBaguitanBalongatingCanunanDacsolDagohoyDalapangDataganGulingKatipunanLintumLitanMagtingPoblacion (Guipos)ReglaSikatunaSingclot
JOSEF INAJOSEF INAJOSEF INAJOSEF INAJOSEF INA Bogo CalabatDawa (Diwa)EbarleGumahan (Pob.)LeonardoLitapanLower Bagong TudelaMansanasMoradjiNemeñoNopulanSebukangTagaytay HillUpper Bagong Tudela
KUMALARANGKUMALARANGKUMALARANGKUMALARANGKUMALARANG BogayoBolisongBoyugan EastBoyugan WestBualanDiploGawilGusomKitaan DagatLantawanLimamawanMahayahayPangiPicananPoblacionSalagmanokSecadeSuminalum
351245376856521153146254226152130184336330
14234656585361922923428
40.51.212.25.910.07.424.77.50.91.36.91.110.18.5
00000000000000
0.00.00.00.00.00.00.00.00.00.00.00.00.00.0
5003183914571341441821965512421721299078518894177
00000000000000000
0.00.00.00.00.00.00.00.00.00.00.00.00.00.00.00.00.0
00000000000000000
0.00.00.00.00.00.00.00.00.00.00.00.00.00.00.00.00.0
3512446752315610179182136882929252428
440250000115000
1.11.60.04.80.00.00.00.00.71.11.70.00.00.0
1970950000000010
2.30.90.00.70.90.00.00.00.00.00.00.00.00.7
35819772254178398258152182711031441613321114193216251
9820124001632230116131
27.41.00.00.41.11.00.00.08.84.221.42.10.03.30.50.51.40.4
070002000000004036
0.01.00.00.00.00.10.00.00.00.00.00.00.00.00.10.00.40.6

440
The Many Faces of Poverty (Volume 3)
LABANGANLABANGANLABANGANLABANGANLABANGAN BagalupaBalimbinganBinayanBokongBulanitCogonanComboDalapangDimasangcaDipayaLangapodLantianLower Campo IslamLower PulacanLower Sang-anNew LabanganNoboranOld LabanganSan IsidroSanta CruzTapodocTawagan NorteUpper Campo IslamUpper PulacanUpper Sang-an
LAKEWOODLAKEWOODLAKEWOODLAKEWOODLAKEWOOD Bagong KahayagBakingBiswanganBululawanDagumGasaGatubLukuanMatalangPoblacion (Lakewood)Sapang PinolesSebugueyTiwalesTubod
LAPUYLAPUYLAPUYLAPUYLAPUYANANANANAN BulawanCarpocDangananDansalDumaraLinokmadalumLuananLubusanMahalingebMandegMaralagMaruingMolumPampangPantadPingalayPoblacionSalambuyanSan JoseSayogTabonTalababTiguhaTininghalangTipasanTugaya
248322285505483293186500128193399426305416251356406296306259211744263804282
102560124180715803003723131914
0.40.00.71.01.20.00.54.80.84.10.01.64.91.90.00.80.00.01.02.70.90.44.92.45.0
3001471103004492231010171190
0.40.00.00.90.40.10.10.00.50.00.00.20.30.70.20.10.20.10.00.10.00.06.50.50.0
4472232703311701392718467
1126153119223726
010400001180003
0.00.40.01.20.00.00.00.01.51.60.00.00.00.4
00030100001100
0.00.00.00.30.00.20.00.00.00.00.20.20.00.0
332395179242124162161291164172197564228224104220147025412790117113412233156137
000002002004111114100000002
0.00.00.00.00.01.20.00.01.20.00.00.70.40.41.00.51.00.40.00.00.00.00.00.00.01.5
00303103120012520646385102660822
0.00.04.80.43.30.50.20.20.00.00.21.52.80.81.51.00.80.60.30.00.61.70.40.01.46.0
Table 5. Unemployment and Victims of Crime Indicators, by Barangay, Province of Zamboangadel Sur, 2006-2009
Unemployment rateUnemployment rateUnemployment rateUnemployment rateUnemployment rate(15 years old and above)(15 years old and above)(15 years old and above)(15 years old and above)(15 years old and above)
Persons who are vict ims ofPersons who are vict ims ofPersons who are vict ims ofPersons who are vict ims ofPersons who are vict ims ofc r imescr imescr imescr imescr imes
Number of persons inNumber of persons inNumber of persons inNumber of persons inNumber of persons inthe labor forcethe labor forcethe labor forcethe labor forcethe labor force
(15 years old and(15 years old and(15 years old and(15 years old and(15 years old andabo ve )abo ve )abo ve )abo ve )abo ve )
Ba r anga yBa ranga yBa ranga yBa ranga yBa ranga yMunic ipal i tyMunic ipal i tyMunic ipal i tyMunic ipal i tyMunic ipal i ty
P rP rP rP rP r opo ropo ropo ropo ropo r t i o nt i o nt i o nt i o nt i o nP rP rP rP rP r opo ropo ropo ropo ropo r t i o nt i o nt i o nt i o nt i o n Magn i t udeMagn i t udeMagn i t udeMagn i t udeMagn i t udeMagn i t udeMagn i t udeMagn i t udeMagn i t udeMagn i t ude

The Many Faces of Poverty (Volume 3)
441
Bag-ong BalambanBag-ong DalagueteBoniaoDelusomDiwanGuripanKaangayanKabuhiLourmahLower Salug DakuLower Santo NiñoMaluboManguilesMarabanan (Balanan)PanagaanParaisoPedaganPoblacionPugwanSan IsidroSan JoseSan VicenteSanta CruzSicpaoTuboranTulanTumapicUpper Salug DakuUpper Santo Niño
MAHAMAHAMAHAMAHAMAHAYYYYYAGAGAGAGAG
MARGOSATUBIGMARGOSATUBIGMARGOSATUBIGMARGOSATUBIGMARGOSATUBIG BalintawakBularongDigonGuinimananIgat IslandJosefinaKalianKolotLimabatongLimamawanLumbogMagahisPoblacionSaguaTalanusaTiguianTulapoc
MIDSALIPMIDSALIPMIDSALIPMIDSALIPMIDSALIP BacahanBalonaiBibilopBuloronCabaloranCanipay NorteCanipay SurCumaronDakayakanDuelicDumalinaoEcuanGolictopGuinabotGuitalosGumaKahayaganLicuro-anLumpunid
3531563934412652984643154635093062414201314341821071749281873705141229897151141464244647
2307714104116104002182624030100250
6.50.019.60.21.50.30.01.30.23.10.30.01.00.00.01.10.90.50.70.73.40.01.30.00.70.00.010.20.0
10021000510010250012300100101
0.10.00.00.20.10.00.00.00.30.10.00.00.10.00.10.50.00.00.10.10.10.00.00.00.00.00.10.00.1
22832038323254325610091354433447042114534260140744554
3338281632341363436461136
8035293259
14.511.97.36.95.913.313.525.28.113.416.12.817.720.06.44.310.6
00000000000000000
0.00.00.00.00.00.00.00.00.00.00.00.00.00.00.00.00.0
33729829151220636223631681286220163218140153166108134291
6001102000100001001
1.80.00.00.20.50.00.80.00.00.00.50.00.00.00.00.60.00.00.3
2307029412001500180071603
2.30.00.70.00.29.01.70.00.01.40.00.02.30.00.01.14.60.00.3
Table 5. Unemployment and Victims of Crime Indicators, by Barangay, Province of Surigao delSur, 2008-2011
Unemployment rateUnemployment rateUnemployment rateUnemployment rateUnemployment rate(15 years old and above)(15 years old and above)(15 years old and above)(15 years old and above)(15 years old and above)
Persons who are vict ims ofPersons who are vict ims ofPersons who are vict ims ofPersons who are vict ims ofPersons who are vict ims ofc r imescr imescr imescr imescr imes
Number of persons inNumber of persons inNumber of persons inNumber of persons inNumber of persons inthe labor forcethe labor forcethe labor forcethe labor forcethe labor force
(15 years old and(15 years old and(15 years old and(15 years old and(15 years old andabo ve )abo ve )abo ve )abo ve )abo ve )
Ba r anga yBa ranga yBa ranga yBa ranga yBa ranga yMunic ipal i tyMunic ipal i tyMunic ipal i tyMunic ipal i tyMunic ipal i ty
P rP rP rP rP r opo ropo ropo ropo ropo r t i o nt i o nt i o nt i o nt i o nP rP rP rP rP r opo ropo ropo ropo ropo r t i o nt i o nt i o nt i o nt i o n Magn i t udeMagn i t udeMagn i t udeMagn i t udeMagn i t udeMagn i t udeMagn i t udeMagn i t udeMagn i t udeMagn i t ude

442
The Many Faces of Poverty (Volume 3)
MIDSALIPMIDSALIPMIDSALIPMIDSALIPMIDSALIP MatalangNew KatipunanNew UnidosPaliliPawanPiliPisomponganPiwanPoblacion APoblacion BSigapodTimbaboyTulbongTuluan
MOLAMOLAMOLAMOLAMOLAVEVEVEVEVE AliciaAriosaBagong ArgaoBagong GutlangBlanciaBogo CapalaranCuloDalaonDipoloDontulanGonosanLower DimalinaoLower DimorokMabuhayMadasigon (Pob.)Makuguihon (Pob.)Maloloy-on (Pob.)MiliganParasanRizalSanto RosarioSilangitSimataSudlonUpper Dimorok
PPPPPAGADIAN CITYAGADIAN CITYAGADIAN CITYAGADIAN CITYAGADIAN CITY AlegriaBalangasan (Pob.)BalintawakBaloyboanBanaleBogoBombaBuenavistaBulatokBulawanDampalanDanluganDaoDataganDeborokDitorayDumagocGatas (Pob.)GubacGubangKagawasanKahayaganKalasanKawitLa SuerteLalaLapidianLenienza
275211149259148208343185625599402253196247
00000000442100
0.00.00.00.00.00.00.00.00.60.70.50.40.00.0
90152491910090
239000
0.90.03.526.93.10.20.00.00.60.016.70.00.00.0
2753113271926276251421525682185397145194284122212991121559350342118217408651235
500023214417150057627113111301
1.80.00.00.03.70.31.07.81.00.51.30.00.01.80.64.80.60.20.39.10.80.50.70.00.4
034100151705100131000000501
0.03.50.10.00.00.10.10.10.30.00.40.30.00.00.00.10.30.00.00.00.00.00.40.00.1
15924903631808892446533445211652395538082809621614597815226511723957
1499226356135550
140221402402004674147434000310001
0.61.60.61.11.60.03.70.00.40.00.08.30.91.41.01.90.55.12.01.50.00.00.02.10.00.00.00.2
00002500000006000300000200231
0.00.00.00.00.80.00.00.00.00.00.00.00.20.00.00.00.10.00.00.00.00.01.00.00.00.20.60.1
Table 5. Unemployment and Victims of Crime Indicators, by Barangay, Province of Zamboangadel Sur, 2006-2009
Unemployment rateUnemployment rateUnemployment rateUnemployment rateUnemployment rate(15 years old and above)(15 years old and above)(15 years old and above)(15 years old and above)(15 years old and above)
Persons who are vict ims ofPersons who are vict ims ofPersons who are vict ims ofPersons who are vict ims ofPersons who are vict ims ofc r imescr imescr imescr imescr imes
Number of persons inNumber of persons inNumber of persons inNumber of persons inNumber of persons inthe labor forcethe labor forcethe labor forcethe labor forcethe labor force
(15 years old and(15 years old and(15 years old and(15 years old and(15 years old andabo ve )abo ve )abo ve )abo ve )abo ve )
Ba r anga yBa ranga yBa ranga yBa ranga yBa ranga yMunic ipal i tyMunic ipal i tyMunic ipal i tyMunic ipal i tyMunic ipal i ty
P rP rP rP rP r opo ropo ropo ropo ropo r t i o nt i o nt i o nt i o nt i o nP rP rP rP rP r opo ropo ropo ropo ropo r t i o nt i o nt i o nt i o nt i o n Magn i t udeMagn i t udeMagn i t udeMagn i t udeMagn i t udeMagn i t udeMagn i t udeMagn i t udeMagn i t udeMagn i t ude

The Many Faces of Poverty (Volume 3)
443
PPPPPAGADIAN CITYAGADIAN CITYAGADIAN CITYAGADIAN CITYAGADIAN CITY Lizon ValleyLumadLumbiaMacasingMangaMuricayNapolanPalpalanPedulonanPoloyaganSan Francisco (Pob.)San Jose (Pob.)San Pedro (Pob.)Santa Lucia (Pob.)Santa MariaSantiago (Pob.)Santo NiñoTawagan SurTigumaTuburan (Pob.)TulanganTulawasWhite Beach
P ITOGOP ITOGOP ITOGOP ITOGOP ITOGO BalabawanBalong-balongColojoLiasanLiguacLimbayanLower Paniki-anMatin-aoPanubiganPoblacion (Pitogo)Punta FlechaSan IsidroSugbay DosTongaoUpper Paniki-an
RAMON MAGSARAMON MAGSARAMON MAGSARAMON MAGSARAMON MAGSAYSAYSAYSAYSAYSAYYYYY Bagong OponBambong DakuBambong DiutBobonganCampo IVCampo VCanianganDipalusanEastern BobonganEsperanzaGapasanKatipunanKauswaganLower SambulawanMabiniMagsaysayMalatingParadisePasingkalanPoblacionSan FernandoSanto RosarioSapa AndingSinaguingSwitchUpper LaperianWakat
690258711356367355504171967728110043892371396866992481877902127316207
162310030004161042150183000
0.12.33.20.30.00.00.60.00.00.01.41.60.30.02.90.32.10.01.00.30.00.00.0
00500000086806101172000
0.00.00.20.00.00.00.00.00.03.70.80.20.00.70.30.00.00.10.10.10.00.00.0
326340144184164273252155617200396157430184236
3610001511942250100
0.91.80.70.00.00.06.00.63.121.06.30.00.20.00.0
012000010000010
0.00.10.40.00.00.00.00.20.00.00.00.00.00.10.0
16919713148250622119214824656131443811910312025111828233879916316932027731026684
0330011004731011020710091200
0.01.52.30.00.00.50.50.00.00.72.20.70.80.00.80.40.00.70.00.96.10.02.80.40.60.00.0
101000000400000200100000200
0.20.00.20.00.00.00.00.00.00.20.00.00.00.00.00.30.00.00.10.00.00.00.00.00.20.00.0
Table 5. Unemployment and Victims of Crime Indicators, by Barangay, Province of Zamboangadel Sur, 2006-2009
Unemployment rateUnemployment rateUnemployment rateUnemployment rateUnemployment rate(15 years old and above)(15 years old and above)(15 years old and above)(15 years old and above)(15 years old and above)
Persons who are vict ims ofPersons who are vict ims ofPersons who are vict ims ofPersons who are vict ims ofPersons who are vict ims ofc r imescr imescr imescr imescr imes
Number of persons inNumber of persons inNumber of persons inNumber of persons inNumber of persons inthe labor forcethe labor forcethe labor forcethe labor forcethe labor force
(15 years old and(15 years old and(15 years old and(15 years old and(15 years old andabo ve )abo ve )abo ve )abo ve )abo ve )
Ba r anga yBa ranga yBa ranga yBa ranga yBa ranga yMunic ipal i tyMunic ipal i tyMunic ipal i tyMunic ipal i tyMunic ipal i ty
P rP rP rP rP r opo ropo ropo ropo ropo r t i o nt i o nt i o nt i o nt i o nP rP rP rP rP r opo ropo ropo ropo ropo r t i o nt i o nt i o nt i o nt i o n Magn i t udeMagn i t udeMagn i t udeMagn i t udeMagn i t udeMagn i t udeMagn i t udeMagn i t udeMagn i t udeMagn i t ude