table 5. unemployment and victims of crime indicators, by ... · 252 the many faces of poverty...
TRANSCRIPT

252
The Many Faces of Poverty (Volume 3)
Table 5. Unemployment and Victims of Crime Indicators, by Barangay, Province of OccidentalMindoro, 2009-2011
Unemployment rateUnemployment rateUnemployment rateUnemployment rateUnemployment rate(15 years old and above)(15 years old and above)(15 years old and above)(15 years old and above)(15 years old and above)
Persons who are vict ims ofPersons who are vict ims ofPersons who are vict ims ofPersons who are vict ims ofPersons who are vict ims ofc r imescr imescr imescr imescr imes
Number of persons inNumber of persons inNumber of persons inNumber of persons inNumber of persons inthe labor forcethe labor forcethe labor forcethe labor forcethe labor force
(15 years old and(15 years old and(15 years old and(15 years old and(15 years old andabo ve )abo ve )abo ve )abo ve )abo ve )
Ba r anga yBa ranga yBa ranga yBa ranga yBa ranga yMunic ipal i tyMunic ipal i tyMunic ipal i tyMunic ipal i tyMunic ipal i ty
P rP rP rP rP r opo ropo ropo ropo ropo r t i o nt i o nt i o nt i o nt i o nP rP rP rP rP r opo ropo ropo ropo ropo r t i o nt i o nt i o nt i o nt i o n Magn i t udeMagn i t udeMagn i t udeMagn i t udeMagn i t udeMagn i t udeMagn i t udeMagn i t udeMagn i t udeMagn i t ude
SAN JOSESAN JOSESAN JOSESAN JOSESAN JOSE
SANTA CRUZSANTA CRUZSANTA CRUZSANTA CRUZSANTA CRUZ
Barangay 2 (Pob.)Barangay 3 (Pob.)Barangay 4 (Pob.)Barangay 5 (Pob.)Barangay 6 (Pob.)Barangay 7 (Pob.)Barangay 8 (Pob.)BatasanBayotbotBubogBuriCamburayCaminawitCatayunganCentralIling ProperInasakanIpilLa CurvaLabangan IlingLabangan PoblacionMabiniMagbayMangarinMapayaMurthaMonte ClaroNatandolPag-AsaPawicanSan AgustinSan IsidroSan Roque
94151193453827592
173551214661835062075210201446516014888122113728601440101819806941321445233261515904363985
0011344157010360103342142602010042053010502
138
0.00.00.52.94.95.31.10.31.40.00.50.01.70.00.57.12.514.20.50.94.42.30.70.00.20.30.01.11.31.63.10.53.5
1101960270000023000000058100000130001327
3.60.03.50.50.00.92.90.00.00.00.00.00.30.00.00.00.00.00.00.01.40.40.00.00.00.00.00.20.00.00.00.80.2
AlacaakBarahanCasagueDayapKurtingananLumangbayanMulawinPinagturilan (San Pedro)Poblacion I (Barangay 1)Poblacion II (Barangay 2)San Vicente
73418499966843487959562559565789565
91012031618103311
1.20.50.10.30.00.41.70.71.84.21.9
210902100602
0.10.20.40.00.20.00.00.00.40.00.1

The Many Faces of Poverty (Volume 3)
253
Map 32. CBMS Composite Indicator, by Barangay, 2009-2011
Map 31. CBMS Composite Indicator, by Municipality, 2009-2011
LUBANGLOOC
ABRA DE ILOG
MAMBURAOSANTA CRUZ
SABLAYAN
CALINTAANRIZAL
MAGSAYSAYSAN JOSE
PALUAN
1.41.6
2.22.9
1.22.2
2.0
1.82.0
1.5 2.4
LUBANGLOOC
ABRA DE ILOG
MAMBURAOSANTA CRUZ
SABLAYAN
CALINTAANRIZAL
MAGSAYSAYSAN JOSE
PALUAN
1.41.6
2.22.9
1.22.2
2.0
1.82.0
1.5 2.4
M unic ip a l i t y A ver ag e
Abra De Ilog 2.9
M agsaysay 2.4
Sant a Cruz 2.2
Paluan 2.2
Sablayan 2.0
Rizal 2.0Calintaan 1.8Looc 1.6San Jose 1.5Lubang 1.4M amburao 1.2
C B M S C o mp o si t e Ind ica t o r
M unic ip a l i t y B ar ang ay A ver ag eA bra de Ilog Udalo (Camurong) 4 .0
San Jose Ip il 4 .0
San Jose Inasakan 3 .8
Sab layan Pag-Asa 3 .7
San Jose Natando l 3 .7
San Jose Pawican 3 .6
San Jose B uri 3 .5
San Jose B angkal 3 .5
Santa Cruz Lumangbayan 3 .4
San Jose Labangan Iling 3 .4Calintaan M alpalon 3 .4San Jose Catayungan 3 .4
B o t t o m 12 B ar ang ays
CBMS Poverty Maps: Occidental Mindoro

254
The Many Faces of Poverty (Volume 3)
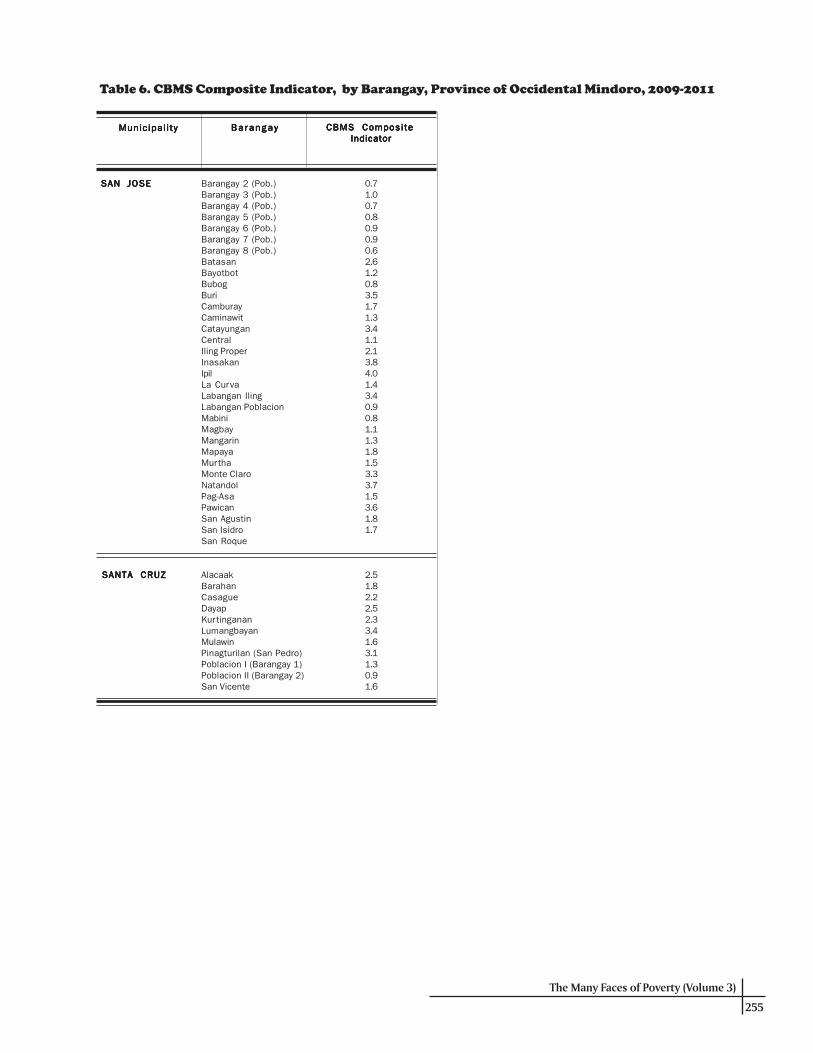
Table 6. CBMS Composite Indicator, by Barangay, Province of Occidental Mindoro, 2009-2011
Ba ranga yBa ranga yBa ranga yBa ranga yBa ranga yMunic ipal i tyMunic ipal i tyMunic ipal i tyMunic ipal i tyMunic ipal i ty CBMS CompositeCBMS CompositeCBMS CompositeCBMS CompositeCBMS Composite Indicator Indicator Indicator Indicator Indicator
Munic ipal i tyMunic ipal i tyMunic ipal i tyMunic ipal i tyMunic ipal i ty Ba r anga yBa ranga yBa ranga yBa ranga yBa ranga y CBMS CompositeCBMS CompositeCBMS CompositeCBMS CompositeCBMS Composite Indicator Indicator Indicator Indicator Indicator
ABRA DE ILOGABRA DE ILOGABRA DE ILOGABRA DE ILOGABRA DE ILOG
CAL INTAANCAL INTAANCAL INTAANCAL INTAANCAL INTAAN ConcepcionIrironMalpalonNew DagupanPoblacionPoypoyTanyag
LOOCLOOCLOOCLOOCLOOC AgkawayanAmbilBalikyasBonbon (Pob.)BulacanBurolGuitna (Pob.)Kanluran (Pob.)Talaotao
LUBANGLUBANGLUBANGLUBANGLUBANG
MAGSAMAGSAMAGSAMAGSAMAGSAYSAYSAYSAYSAYSAYYYYY AlibogCagurayCalawagGapasanLasteLourdesNicolas (Bulo)PacloloPoblacionPurnagaSanta TeresaSibalat
MAMBURAOMAMBURAOMAMBURAOMAMBURAOMAMBURAO
MAMBURAOMAMBURAOMAMBURAOMAMBURAOMAMBURAO
PPPPPALUANALUANALUANALUANALUAN
RIZALR IZALR IZALR IZALR IZAL
SABLASABLASABLASABLASABLAYYYYYANANANANAN
AmbulongAnsirayBagong SikatBangkalBarangay 1 (Pob.)
SAN JOSESAN JOSESAN JOSESAN JOSESAN JOSE
1.41.93.41.61.51.91.7
0.62.42.01.81.81.21.21.31.9
2.62.51.92.52.52.33.32.91.92.32.42.4
1.51.80.71.62.0
3.22.80.83.51.1
Araw At Bituin (Pob.)Bagong Sikat (Pob.)Banaag At Pag-Asa (Pob.)BinakasCabraLikas Ng Silangan (Pob.)Maginhawa (Pob.)MaligayaMaliigNinikat Ng Pag-Asa (Pob.)Paraiso (Pob.)Surville (Pob.)TagbacTangalTilikVigo
ArmadoBalaoCabacaoLumangbayanPoblacionSan VicenteTibagUdalo (Camurong)Wawa
BalansayFatima (Tii)PayomponPoblacion 1 (Barangay 1)Poblacion 2 (Barangay 2)
Poblacion 3 (Barangay 3)Poblacion 4 (Barangay 4)Poblacion 5 (Barangay 5)Poblacion 6 (Barangay 6)Poblacion 7 (Barangay 7)Poblacion 8 (Barangay 8)San Luis (Ligang)TalabaanTangkalanTayamaan
AlipaoyBagong Silang (Bgy 5)Handang Tumulong (Bgy 2)HarrisonLumangbayanMananaoMapalad (Bgy 1)MarikitPag-Asa Ng Bayan (Bgy 4)San Jose (Brgy 6)Silahis Ng Pag-Asa (Bgy 3)Tubili
AdelaAguasMagsikapMalawaanManootPitogoRizalRumbangSalvacionSan PedroSanto Nino
Batong BuhayBuenavistaBurgosClaudio SalgadoGeneral Emilio AguinaldoIbudIlvitaLagnasLigayaMalisbongPaetanPag-AsaPoblacion (Lumangbayan)San AgustinSan FranciscoSan NicolasSan VicenteSanta LuciaSanto NinoTagumpayTubanVictoria
2.43.33.03.31.32.22.44.03.0
0.80.90.91.41.60.70.91.51.60.70.80.91.51.71.11.7
0.70.50.70.70.71.01.62.01.71.8
2.40.81.23.01.43.01.52.01.11.01.52.8
2.01.51.91.82.52.92.01.91.81.61.9
2.51.33.12.82.50.91.52.23.01.82.03.71.12.81.32.71.61.90.82.31.71.1
The Many Faces of Poverty (Volume 3)
255
Table 6. CBMS Composite Indicator, by Barangay, Province of Occidental Mindoro, 2009-2011
Ba ranga yBa ranga yBa ranga yBa ranga yBa ranga yMunic ipal i tyMunic ipal i tyMunic ipal i tyMunic ipal i tyMunic ipal i ty CBMS CompositeCBMS CompositeCBMS CompositeCBMS CompositeCBMS Composite Indicator Indicator Indicator Indicator Indicator
SAN JOSESAN JOSESAN JOSESAN JOSESAN JOSE
SANTA CRUZSANTA CRUZSANTA CRUZSANTA CRUZSANTA CRUZ
Barangay 2 (Pob.)Barangay 3 (Pob.)Barangay 4 (Pob.)Barangay 5 (Pob.)Barangay 6 (Pob.)Barangay 7 (Pob.)Barangay 8 (Pob.)BatasanBayotbotBubogBuriCamburayCaminawitCatayunganCentralIling ProperInasakanIpilLa CurvaLabangan IlingLabangan PoblacionMabiniMagbayMangarinMapayaMurthaMonte ClaroNatandolPag-AsaPawicanSan AgustinSan IsidroSan Roque
0.71.00.70.80.90.90.62.61.20.83.51.71.33.41.12.13.84.01.43.40.90.81.11.31.81.53.33.71.53.61.81.7
AlacaakBarahanCasagueDayapKurtingananLumangbayanMulawinPinagturilan (San Pedro)Poblacion I (Barangay 1)Poblacion II (Barangay 2)San Vicente
2.51.82.22.52.33.41.63.11.30.91.6

BLANK PBLANK PBLANK PBLANK PBLANK PAGEAGEAGEAGEAGE

The Many Faces of Poverty (Volume 3)
257
Republic of the PhilippinesProvince of Surigao del Sur
Office of the Governor
Message
It makes me happy and proud to know that my province, Surigao del Sur,will be featured in the Third Volume of the book “The Many Faces of Poverty.” Myprovince is one of the growing number of LGUs that made use of the Community-Based Monitoring System (CBMS) database outputs as basis for effective localdevelopment planning and program implementation.
This is a welcome development for us because the inclusion of my provinceamong the featured LGUs will certainly give us the opportunity to see ourselves inthe mirror, so to speak, and thus see ourselves in a better perspective. I expectthat the effect on us for being featured in this publication will give us a betterappreciation of Surigao del Sur, as well as of its myriad problems and needs—and armed with a better knowledge of our province, we can deal with its problemsand provide for its needs more effectively. In other words, we can undertake theright interventions in the right areas.
The institutionalization of the Community-Based Monitoring System in the Surigao del Sur is certainly ofgreat importance to us because I firmly believe that it will lead us to the right path of development, we will be ableto enhance the effectiveness of our governance and of our anti-poverty programs, particularly in the poorest areasof our province.
My joy takes a full measure as I salute the men and women who, through patience and determination,persist in making headway in the war against poverty.
JOHNNY TJOHNNY TJOHNNY TJOHNNY TJOHNNY T. PIMENTEL. PIMENTEL. PIMENTEL. PIMENTEL. PIMENTELGovernor
GovernorJohnny T. Pimentel’s
Photo

258
The Many Faces of Poverty (Volume 3)
The Many Faces of Poverty in Surigao del Sur
POPULAPOPULAPOPULAPOPULAPOPULATIONTIONTIONTIONTIONSurigao del Sur has a total population of 475,215 covering 99,773 households based on CBMSSurigao del Sur has a total population of 475,215 covering 99,773 households based on CBMSSurigao del Sur has a total population of 475,215 covering 99,773 households based on CBMSSurigao del Sur has a total population of 475,215 covering 99,773 households based on CBMSSurigao del Sur has a total population of 475,215 covering 99,773 households based on CBMSsurveyssurveyssurveyssurveyssurveysThe CBMS surveys conducted during the period 2008–2010 covered the province’s 309 barangays in 2 cities and17 municipalities. The City of Bislig is the largest in terms of population, with its population of 61,899 accountingfor 3.0 percent of the province’s total population. This is followed by Barobo with a total population of 41,411(8.7%). The municipality of Bayabas has the smallest population with 7,340 (1.5%). Of the population in theprovince, 41.2 percent is 16 years old and below.
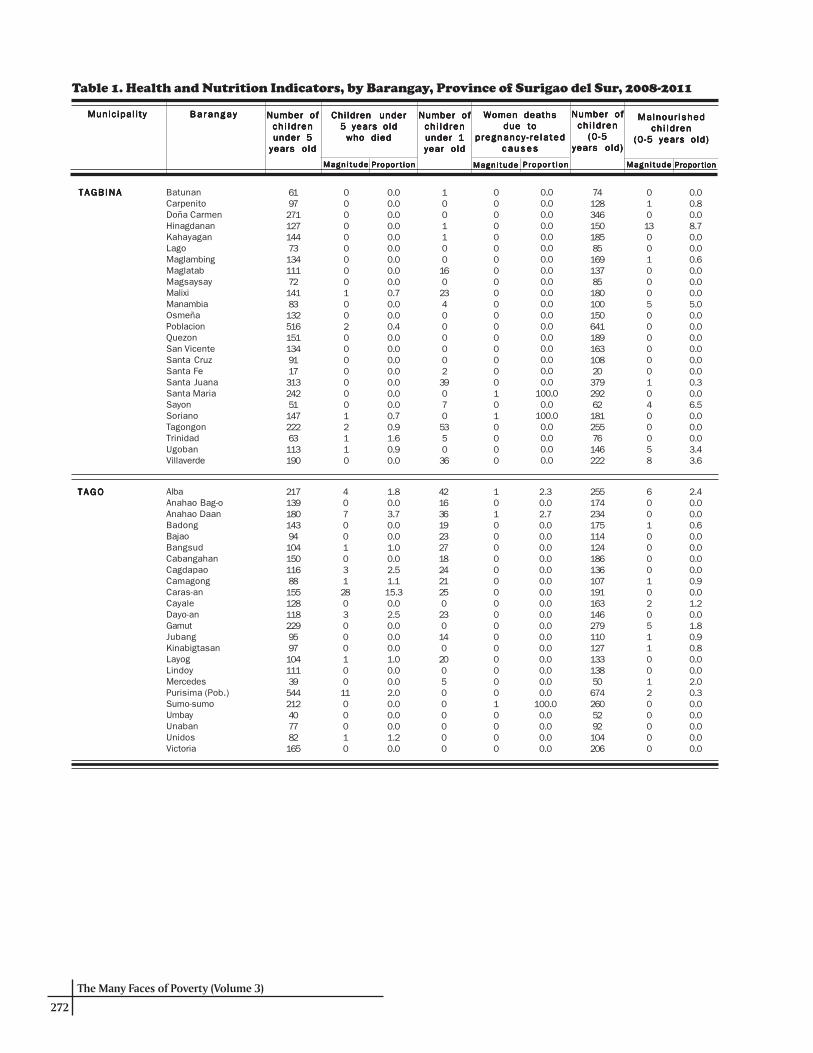
HEALHEALHEALHEALHEALTH AND NUTRITIONTH AND NUTRITIONTH AND NUTRITIONTH AND NUTRITIONTH AND NUTRITIONChild mortality in the province is 0.7 percent of children 0–4 years oldChild mortality in the province is 0.7 percent of children 0–4 years oldChild mortality in the province is 0.7 percent of children 0–4 years oldChild mortality in the province is 0.7 percent of children 0–4 years oldChild mortality in the province is 0.7 percent of children 0–4 years oldEstimates at the provincial level revealed that for every 1,000 children aged 0–4 years old, seven died during thereference period, 2008–2010. This corresponds to 37 cases of child deaths. The highest proportion of childdeaths was recorded in the municipality of Tago (1.7%), followed by Lanuza (1.4%), and Bayabas (1.3%). At thebarangay level, Barangay Caras-an in Tago had the highest proportion of child deaths at 15.3 percent. This translatesto a total of 28 cases of child deaths among children aged 0–4 years.
Three in every 1,000 pregnant women died due to pregnancy-related causesThree in every 1,000 pregnant women died due to pregnancy-related causesThree in every 1,000 pregnant women died due to pregnancy-related causesThree in every 1,000 pregnant women died due to pregnancy-related causesThree in every 1,000 pregnant women died due to pregnancy-related causesThe province has recorded 1,821 death cases of women due to pregnancy-related causes during the referenceperiod, representing 0.5 percent of all pregnant women. Among all the municipalities, Lanuza recorded the highestproportion of pregnancy-related deaths at 4.1percent. Hinatuan recorded the highest number with seven cases. Nodeaths among pregnant women were reported in the municipalities of Bayabas, Carmen, Carrascal, Madrid, and theCity of Tandag. At the barangay level, the number of women deaths due to pregnancy-related causes ranges fromone to three cases.
About 2.9 percent of children 0-5 years old were reported to be malnourishedAbout 2.9 percent of children 0-5 years old were reported to be malnourishedAbout 2.9 percent of children 0-5 years old were reported to be malnourishedAbout 2.9 percent of children 0-5 years old were reported to be malnourishedAbout 2.9 percent of children 0-5 years old were reported to be malnourishedIn terms of nutritional status, the province recorded a total of 358 malnourished children representing 2.9 percentof all children 0–5 years old. This means that there are three malnourished children in every 100 children 0–5 yearsold. The municipality of Bayabas recorded the highest proportion of malnourished children with 10.0 percent,followed by San Miguel with 9.7 percent. In terms of magnitude, the municipality of San Miguel recorded the highestnumber of malnourished children with 537 cases. At a more disaggregated level, results show several barangayswith very high incidence of malnourishment. For instance, more than half (54.9%) of children 0–5 years old inBarangay Tidman in Hinatuan were considered malnourished. About a quarter of children 0–5 years old in BarangaysSagbayan (24.8%) and Calatngan (24.8%) in San Miguel, and Barangay Roxas (24.6%) in Hinatuan were alsomalnourished.
HOUSINGHOUSINGHOUSINGHOUSINGHOUSINGAbout 4.0 percent of households were living in makeshift houses while 3.8 percent were informalAbout 4.0 percent of households were living in makeshift houses while 3.8 percent were informalAbout 4.0 percent of households were living in makeshift houses while 3.8 percent were informalAbout 4.0 percent of households were living in makeshift houses while 3.8 percent were informalAbout 4.0 percent of households were living in makeshift houses while 3.8 percent were informalsettlerssettlerssettlerssettlerssettlersResults of the CBMS survey revealed that four in every 100 households in the province were living in makeshifthouses. The municipality of San Miguel recorded the highest proportion (10.2%), followed by Lianga (8.3%), andCagwait (7.8%). However, higher rates were recorded at the barangay level with Barangay Batunan in Tagbina recordingthe highest proportion with more than half (51.5%) of its households living in makeshift houses.

The Many Faces of Poverty (Volume 3)
259
1 “Waterless” barangays refer to villages with less than 50 percent safe water supply coverage.
Meanwhile, four in every 100 households in the province are considered informal settlers. This is most prevalent inthe municipality of San Miguel where 502 households are informal settlers, representing 7.4 percent of all householdsin the municipality. The municipality of Lingig follows with 6.0 percent and Cantilan with 5.7 percent. Informalsettling is severe at the barangay level, particularly Barangay Lindoy in Tago where eight in every 10 households areconsidered informal settlers.
WWWWWAAAAATER AND SANITTER AND SANITTER AND SANITTER AND SANITTER AND SANITAAAAATIONTIONTIONTIONTIONAbout 19.9 percent of households had no access to safe water supply while 19.3 percent had noAbout 19.9 percent of households had no access to safe water supply while 19.3 percent had noAbout 19.9 percent of households had no access to safe water supply while 19.3 percent had noAbout 19.9 percent of households had no access to safe water supply while 19.3 percent had noAbout 19.9 percent of households had no access to safe water supply while 19.3 percent had noaccess to sanitary toilet facilitiesaccess to sanitary toilet facilitiesaccess to sanitary toilet facilitiesaccess to sanitary toilet facilitiesaccess to sanitary toilet facilitiesBased on CBMS survey results, a significant proportion of households do not have access to safe water supply andsanitary toilet facilities. In fact, two in every 10 households in the province do not have access to safe water. At themunicipal level, Madrid recorded the highest proportion at 74.8 percent of households without access to safe watersupply or an equivalent of seven in every 10 households, which is a huge concern for the municipality. At thebarangay level, access to safe water is even more problematic as some of the barangays recorded no access tosafe water. It was reported that all households in Barangay San Antonio (City of Tandag) and Barangay San Roque(Madrid) have no access to safe water. Several barangays also recorded a relatively high proportion of householdswithout access to safe water. It was noted that there were 53 “waterless”1 barangays in the province out of 309barangays covered during the survey.
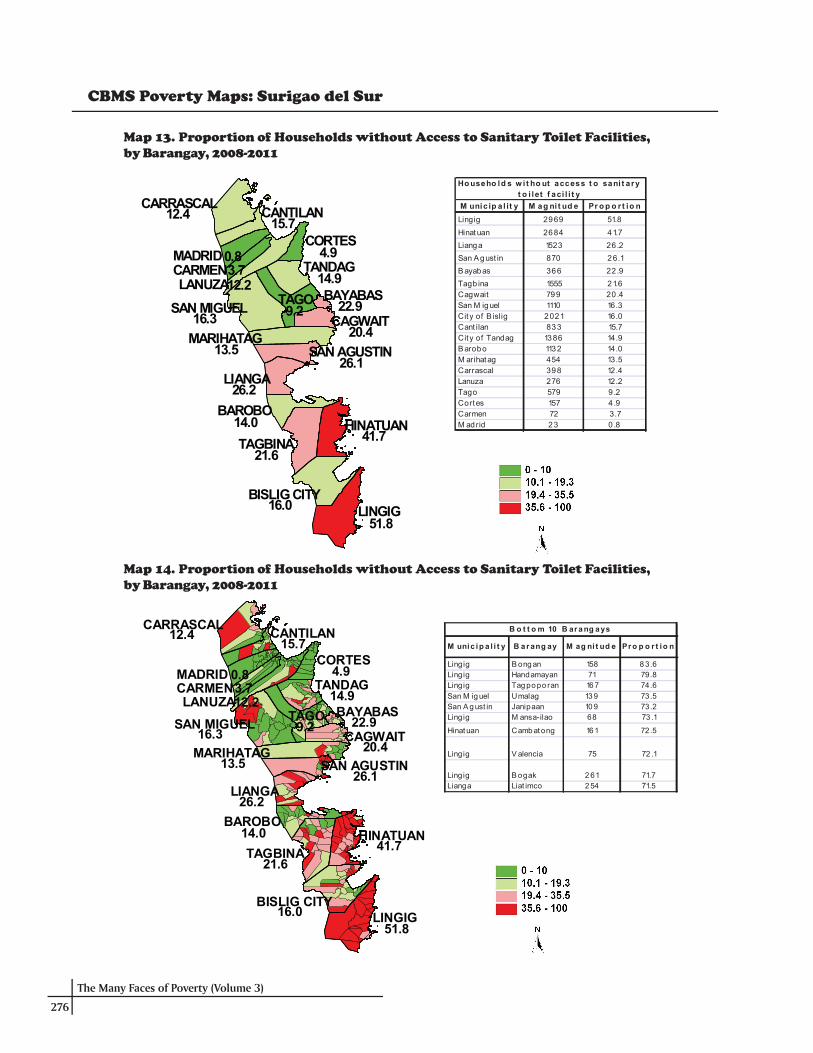
Meanwhile, two in every 10 households had no access to sanitary toilet facilities. Among all the municipalities, thisproblem was more prevalent in Lingig where 51.8 percent of the households had no access to sanitary toiletfacilities. This was followed by Hinatuan with 41.7 percent and Lianga with 26.2 percent. The barangay level datarevealed an even more severe condition as Barangay Bongan (83.6%) and Barangay Handamayan (79.8%) both ofLingig, recorded such high proportions of households without access to sanitary toilet facilities.
BASIC EDUCABASIC EDUCABASIC EDUCABASIC EDUCABASIC EDUCATIONTIONTIONTIONTIONThirteen in every 100 children 6–16 years old were not in schoolThirteen in every 100 children 6–16 years old were not in schoolThirteen in every 100 children 6–16 years old were not in schoolThirteen in every 100 children 6–16 years old were not in schoolThirteen in every 100 children 6–16 years old were not in schoolThe CBMS data on school attendance showed that 21.9 percent of children 6–12 years old were not enrolled inelementary while 42.9 percent of children 13–16 years old were not enrolled in high school. However, amongchildren 6–16 years old, 12.9 percent were not in school. This means that 13 in every 100 children 6–16 years oldwere not studying during the reference period. Among all the municipalities, the proportion of children 6–16 yearsold who were not in school was highest in the municipality of Lingig with 20.3 percent, followed by Lanuza with 17.4percent, and Cantilan with 17.1 percent. At the barangay level, results showed that school non-attendance is a hugeconcern for several barangays. For instance, 57.4 percent of households in Barangay Lobo (Cantilan) and 45.1percent in Calatngan (San Miguel) had children 6–16 years old not attending school.
INCOME AND LIVELIHOODINCOME AND LIVELIHOODINCOME AND LIVELIHOODINCOME AND LIVELIHOODINCOME AND LIVELIHOODAt least six in every 10 households were income poorAt least six in every 10 households were income poorAt least six in every 10 households were income poorAt least six in every 10 households were income poorAt least six in every 10 households were income poorPoverty rate in the province was relatively high at 63.8 percent, which corresponds to a total of 63,604 households.This means that at least six in every 10 households were living below the poverty threshold. Ten municipalitiesrecorded even higher poverty rates, i.e., higher than the provincial estimate. San Miguel was considered the poorestmunicipality in terms of household income with a poverty rate of 86.5 percent. This translates to at least eightincome poor households for every 10 households. At the barangay level, three barangays, namely Bongan,Handamayan, and Salvacion in the municipality of Lingig, recorded poverty rates of 100 percent. This means that allhouseholds in these barangays were considered income poor. Relatively high poverty rates were also recorded inseveral other barangays.
260
The Many Faces of Poverty (Volume 3)
Some 52.7 percent of households were living below the food thresholdSome 52.7 percent of households were living below the food thresholdSome 52.7 percent of households were living below the food thresholdSome 52.7 percent of households were living below the food thresholdSome 52.7 percent of households were living below the food thresholdThe province also recorded a relatively high food poverty rate. More than half of its households (52.7%) had nosufficient income to satisfy their basic nutritional requirements. At the municipal level, food poverty is a big concernfor Tagbina with food poverty rate at 80.4 percent, the highest among all the municipalities. This is followed by SanMiguel (79.7%) and Lanuza (69.3%). Furthermore, three barangays, namely Bongan, Handamayan and Salvacion,recorded a food poverty rate of 100 percent. This translates to all households in these three barangays having nosufficient income to satisfy their food nutritional requirements. Several other barangays also recorded relativelyhigh food poverty rates.
Food shortage was experienced by 8.5 percent of householdsFood shortage was experienced by 8.5 percent of householdsFood shortage was experienced by 8.5 percent of householdsFood shortage was experienced by 8.5 percent of householdsFood shortage was experienced by 8.5 percent of householdsResults of the CBMS survey also showed that nine out of every 100 households in the province experienced foodshortage. The problem of food shortage, however, was more pronounced in some municipalities including SanMiguel, which had the highest incidence. In fact, 47.3 percent of households in this municipality experiencedhunger during the three-month period prior to the survey. The municipality of Lingig came next with 26.4 percent,followed by Tago with 18.7 percent. At a more disaggregated level, Barangay Calatngan (San Miguel) and BarangayTago (Umbay) recorded the highest proportion of households that experienced hunger with 94.3 percent and 92.5percent, respectively.
The province recorded a relatively low unemployment rate at 1.5 percentThe province recorded a relatively low unemployment rate at 1.5 percentThe province recorded a relatively low unemployment rate at 1.5 percentThe province recorded a relatively low unemployment rate at 1.5 percentThe province recorded a relatively low unemployment rate at 1.5 percentBased on the CBMS survey results, 27.9 percent of the total population of the province were members of the laborforce. This corresponds to a total of 132,795 individuals. Only 1.5 percent of the population were unemployed.However, relatively higher unemployment rates were recorded in seven municipalities with the City of Bislig recordingthe highest rate at 3.6 percent. At the barangay level, double-digit unemployment rates were recorded for somebarangays with six barangays having recorded unemployment rates of at least 10 percent. The highest unemploymentrate was recorded in Barangay Magsaysay with 16.7 percent.
PEACE AND ORDERPEACE AND ORDERPEACE AND ORDERPEACE AND ORDERPEACE AND ORDEROf the total population, 0.1 percent were victims of crimeOf the total population, 0.1 percent were victims of crimeOf the total population, 0.1 percent were victims of crimeOf the total population, 0.1 percent were victims of crimeOf the total population, 0.1 percent were victims of crimeThe province had 650 individuals who had been reported as victims of crime, representing 0.1 percent of the totalpopulation. Incidence of crime is highest in the municipality of Lanuza where 0.5 percent of the population werevictims of crime. In terms of magnitude, however, the municipality of Hinatuan recorded the most number of caseswith a total of 103 victims. Based on disaggregated data, peace and order seems to be a greater concern for somebarangays. In Barangay Bocawe in Lanuza, for instance, 5.9 percent of the population were victims of crime, thehighest among all the barangays in the province. A few other barangays recorded a relatively high crime incidence.These include Barangay Mat-e in Cagwait with 3.5 percent and Songkit in Madrid with 2.5 percent.
CBMS COMPOSITE INDICACBMS COMPOSITE INDICACBMS COMPOSITE INDICACBMS COMPOSITE INDICACBMS COMPOSITE INDICATORTORTORTORTORHouseholds were not able to meet two of the 13 basic needs,Households were not able to meet two of the 13 basic needs,Households were not able to meet two of the 13 basic needs,Households were not able to meet two of the 13 basic needs,Households were not able to meet two of the 13 basic needs,22222 on the average on the average on the average on the average on the averageThe province recorded a composite index of 1.9. Among all the municipalities, Lingig recorded the highest compositeindex at 3.3 implying that it had the worst condition among all the municipalities in terms of meeting the identifiedbasic needs. Meanwhile, the City of Tandag had the smallest composite index at 1.2, which implies that it has thebest condition in the province. At the barangay level, some barangays exhibited composite indices that were evenhigher than the provincial estimate. Barangay Poblacion in Lianga had highest composite index at 4.6, implying theworst condition among all the barangays in the province in terms of meeting the basic needs.
2 This refers to household basic needs as reflected in the 13 CBMS core indicators which cover the following: (1) children 0-4 years old who died; 2) women who died due to pregnancy-related causes; (3) malnourished children 0-5 years old; (4) householdsliving in makeshift housing; 5) households who are informal settlers; (6) households without access to safe water supply; (7)households without access to sanitary toilet facilities; (8) children 6-16 years old not in school; (9) households with income belowthe poverty threshold; (10) households with income below the food threshold; (11) households that experienced food shortage; (12)unemployment; and (13) victims of crime. A higher index would mean more unmet needs and hence, worse condition for thehouseholds.
The Many Faces of Poverty (Volume 3)
261
3 A household is considered to experience multiple deprivations if it is poor in at least two in the following dimensions:health, nutrition, tenure, housing, water, toilet, education, income, job and security.
Of the households, 32.5 percent experienced multiple deprivationsOf the households, 32.5 percent experienced multiple deprivationsOf the households, 32.5 percent experienced multiple deprivationsOf the households, 32.5 percent experienced multiple deprivationsOf the households, 32.5 percent experienced multiple deprivations33333
Based on the results of the CBMS survey, 32.5 percent of the households in the province were deprived in at leasttwo dimensions. In particular, 21.9 percent were deprived in two dimensions while 8.3 percent were deprived inthree dimensions. In addition, 2.1 percent were poor in 4 dimensions and 0.3 percent suffered from deprivationsin 5–7 dimensions. On the different dimensions of poverty, results show that 12.9 percent of households weredeprived in income and sanitation simultaneously. In addition, 12.1 percent of the households suffered fromsimultaneous deprivations in terms of income and water. It was also noted that 5,541 households experienceddeprivation in income and education concurrently. In terms of three deprivations, results show that 4.0 percent ofthe households in the province were income poor, sanitation poor, and water poor at the same time. Simultaneousdeprivation in income, sanitation, and education was also reported by 3,070 households in the province.

262
The Many Faces of Poverty (Volume 3)
The Many Faces of Poverty in Surigao del Sur
INDICAINDICAINDICAINDICAINDICATORTORTORTORTOR
DEMOGRAPHYDEMOGRAPHYDEMOGRAPHYDEMOGRAPHYDEMOGRAPHYPopulationAverage household sizeChildren under 1 year oldChildren under 5 years oldChildren 0-5 years oldChildren 6-12 years oldMembers 13-16 years oldMembers 6-16 years oldMembers 10 years old and aboveMembers of the labor force
HEALHEALHEALHEALHEALTH AND NUTRITIONTH AND NUTRITIONTH AND NUTRITIONTH AND NUTRITIONTH AND NUTRITIONChildren under 5 years old who diedWomen who died due to pregnancy related-causesMalnourished children 0-5 year old
HOUSINGHOUSINGHOUSINGHOUSINGHOUSINGHouseholds living in makeshift housingHouseholds who are informal settlers
WATER AND SANITATIONWATER AND SANITATIONWATER AND SANITATIONWATER AND SANITATIONWATER AND SANITATIONHouseholds without access to safe water supplyHouseholds without access to sanitary toilet facilities
BASIC EDUCATIONBASIC EDUCATIONBASIC EDUCATIONBASIC EDUCATIONBASIC EDUCATIONChildren 6-12 years old not attending elementary schoolChildren 13-16 years old not attending high schoolChildren 6-16 years old not attending school
INCOME AND LIVELIHOODINCOME AND LIVELIHOODINCOME AND LIVELIHOODINCOME AND LIVELIHOODINCOME AND LIVELIHOODHouseholds with income below pover ty thresholdHouseholds with income below food thresholdHouseholds who experienced food shor tageUnemployment rate (15 years old and above)
PEACE AND ORDERPEACE AND ORDERPEACE AND ORDERPEACE AND ORDERPEACE AND ORDERVictims of crime
MagnitudeMagnitudeMagnitudeMagnitudeMagnitude
997735
39503803
1960619207
63604525358419
PrPrPrPrProporoporoporoporopor tiontiontiontiontion
4.03.8
19.919.3
63.852.78.5
HouseholdsHouseholdsHouseholdsHouseholdsHouseholds PopulationPopulationPopulationPopulationPopulation
CBMS CorCBMS CorCBMS CorCBMS CorCBMS Core Indicators, Pre Indicators, Pre Indicators, Pre Indicators, Pre Indicators, Province of Surigao del Surovince of Surigao del Surovince of Surigao del Surovince of Surigao del Surovince of Surigao del Sur, 2008-2011, 2008-2011, 2008-2011, 2008-2011, 2008-2011
PrP rP rP rP r oporoporoporoporopor t iont iont iont iont ionMagn i tudeMagn i tudeMagn i tudeMagn i tudeMagn i tude
746252379637468423947866
132105363518132795
475215
35837
184122034917038
21.942.512.9
650 0.1
1821
0.7
2005 1.5
0.52.9
CBMS Composite IndicatorCBMS Composite IndicatorCBMS Composite IndicatorCBMS Composite IndicatorCBMS Composite Indicator, Pr, Pr, Pr, Pr, Province of Surigao del Surovince of Surigao del Surovince of Surigao del Surovince of Surigao del Surovince of Surigao del Sur,,,,,2008-20112008-20112008-20112008-20112008-2011
CBMS Composite IndicatorA ve rageAve rageAve rageAve rageAve rage
1.9

The Many Faces of Poverty (Volume 3)
263
CBMS CorCBMS CorCBMS CorCBMS CorCBMS Core Indicators, by Municipalitye Indicators, by Municipalitye Indicators, by Municipalitye Indicators, by Municipalitye Indicators, by Municipality, Pr, Pr, Pr, Pr, Province of Surigao del Surovince of Surigao del Surovince of Surigao del Surovince of Surigao del Surovince of Surigao del Sur, 2008-2011, 2008-2011, 2008-2011, 2008-2011, 2008-2011
Number ofNumber ofNumber ofNumber ofNumber ofch i ld rench i ld rench i ld rench i ld rench i ld ren
(6-12 years(6-12 years(6-12 years(6-12 years(6-12 yearso l d )o l d )o l d )o l d )o l d )
Chi ldren not attendingChi ldren not attendingChi ldren not attendingChi ldren not attendingChi ldren not attendingelementarelementarelementarelementarelementar y schooly schooly schooly schooly school
(6-12 years old)(6-12 years old)(6-12 years old)(6-12 years old)(6-12 years old)
Chi ldren not attendingChi ldren not attendingChi ldren not attendingChi ldren not attendingChi ldren not attendinghigh schoolhigh schoolhigh schoolhigh schoolhigh school
(13-16 years old)(13-16 years old)(13-16 years old)(13-16 years old)(13-16 years old)
Number ofNumber ofNumber ofNumber ofNumber ofch i ld rench i ld rench i ld rench i ld rench i ld ren(13-16(13-16(13-16(13-16(13-16
years old)years old)years old)years old)years old)
Number ofNumber ofNumber ofNumber ofNumber ofch i ld rench i ld rench i ld rench i ld rench i ld ren
(6-16 years (6-16 years (6-16 years (6-16 years (6-16 yearso l d )o l d )o l d )o l d )o l d )
Chi ldren not attendingChi ldren not attendingChi ldren not attendingChi ldren not attendingChi ldren not attendingschoo lschoo lschoo lschoo lschoo l
(6-16 years old)(6-16 years old)(6-16 years old)(6-16 years old)(6-16 years old)
Munic ipal i tyMunic ipal i tyMunic ipal i tyMunic ipal i tyMunic ipal i ty
P rP rP rP rP r opo ropo ropo ropo ropo r t i o nt i o nt i o nt i o nt i o nP rP rP rP rP r opo ropo ropo ropo ropo r t i o nt i o nt i o nt i o nt i o nP rP rP rP rP r opo ropo ropo ropo ropo r t i o nt i o nt i o nt i o nt i o n Magn i t udeMagn i t udeMagn i t udeMagn i t udeMagn i t udeMagn i t udeMagn i t udeMagn i t udeMagn i t udeMagn i t udeMagn i t udeMagn i t udeMagn i t udeMagn i t udeMagn i t ude
Households l iv ing inHouseholds l iv ing inHouseholds l iv ing inHouseholds l iv ing inHouseholds l iv ing inmakeshift housingmakeshift housingmakeshift housingmakeshift housingmakeshift housing
Households who areHouseholds who areHouseholds who areHouseholds who areHouseholds who areinformal sett lersinformal sett lersinformal sett lersinformal sett lersinformal sett lers
Households without accessHouseholds without accessHouseholds without accessHouseholds without accessHouseholds without accessto safe water supplyto safe water supplyto safe water supplyto safe water supplyto safe water supply
Households withoutHouseholds withoutHouseholds withoutHouseholds withoutHouseholds withoutaccess to sanitaraccess to sanitaraccess to sanitaraccess to sanitaraccess to sanitar yyyyy
toi let faci l i t iestoi let faci l i t iestoi let faci l i t iestoi let faci l i t iestoi let faci l i t ies
Munic ipal i tyMunic ipal i tyMunic ipal i tyMunic ipal i tyMunic ipal i ty
P rP rP rP rP r opo ropo ropo ropo ropo r t i o nt i o nt i o nt i o nt i o nP rP rP rP rP r opo ropo ropo ropo ropo r t i o nt i o nt i o nt i o nt i o n P rP rP rP rP r opo ropo ropo ropo ropo r t i o nt i o nt i o nt i o nt i o nP rP rP rP rP r opo ropo ropo ropo ropo r t i o nt i o nt i o nt i o nt i o n Magn i t udeMagn i t udeMagn i t udeMagn i t udeMagn i t udeMagn i t udeMagn i t udeMagn i t udeMagn i t udeMagn i t udeMagn i t udeMagn i t udeMagn i t udeMagn i t udeMagn i t udeMagn i t udeMagn i t udeMagn i t udeMagn i t udeMagn i t ude
BAROBOBAYABASCAGWAITCANTILANCARMENCARRASCALCITY OF BISLIGCITY OF TANDAGCORTESHINATUANLANUZALIANGALINGIGMADRIDMARIHATAGSAN AGUSTINSAN MIGUELTAGBINATAGO
BAROBOBAYABASCAGWAITCANTILANCARMENCARRASCALCITY OF BISLIGCITY OF TANDAGCORTESHINATUANLANUZALIANGALINGIGMADRIDMARIHATAGSAN AGUSTINSAN MIGUELTAGBINATAGO
BAROBOBAYABASCAGWAITCANTILANCARMENCARRASCALCITY OF BISLIGCITY OF TANDAGCORTESHINATUANLANUZALIANGALINGIGMADRIDMARIHATAGSAN AGUSTINSAN MIGUELTAGBINATAGO
MunicipalityMunicipalityMunicipalityMunicipalityMunicipality TTTTTo ta lo ta lo ta lo ta lo ta lhouseholdshouseholdshouseholdshouseholdshouseholds
Number ofNumber ofNumber ofNumber ofNumber ofch i ld rench i ld rench i ld rench i ld rench i ld ren
(0-5(0-5(0-5(0-5(0-5years old)years old)years old)years old)years old)
Malnour ishedMalnour ishedMalnour ishedMalnour ishedMalnour ishedch i ld rench i ld rench i ld rench i ld rench i ld ren
(0-5 years old)(0-5 years old)(0-5 years old)(0-5 years old)(0-5 years old)
Chi ldren underChi ldren underChi ldren underChi ldren underChi ldren under5 years old5 years old5 years old5 years old5 years old
who diedwho diedwho diedwho diedwho died
Number ofNumber ofNumber ofNumber ofNumber ofch i ld rench i ld rench i ld rench i ld rench i ld renunder 1under 1under 1under 1under 1year oldyear oldyear oldyear oldyear old
Women deathsWomen deathsWomen deathsWomen deathsWomen deathsdue todue todue todue todue to
p regnancy - re la tedpregnancy - re la tedpregnancy - re la tedpregnancy - re la tedpregnancy - re la tedcausescausescausescausescauses
TTTTTo ta lo ta lo ta lo ta lo ta lpopu la t ionpopu la t ionpopu la t ionpopu la t ionpopu la t ion
PrPrPrPrProporoporoporoporopor tiontiontiontiontionPrPrPrPrProporoporoporoporopor tiontiontiontiontion PrPrPrPrProporoporoporoporopor tiontiontiontiontion Magn i tudeMagn i tudeMagn i tudeMagn i tudeMagn i tudeMagn i t udeMagn i t udeMagn i t udeMagn i t udeMagn i t udeMagn i t udeMagn i t udeMagn i t udeMagn i t udeMagn i t ude
Number ofNumber ofNumber ofNumber ofNumber ofch i ld rench i ld rench i ld rench i ld rench i ld renunder 5under 5under 5under 5under 5
years oldyears oldyears oldyears oldyears old
81231604392753051958323012648931731836440227158235790302933803350683972236333
414117340184442325696941499661899405671521731504105142741627229136491709916421337613467330125
52278221975234295314996068387515803452116932472975141021941783468536963427
2811841174651533171622617440860
0.51.30.40.20.11.10.80.10.90.91.40.50.70.40.80.20.80.21.7
95918636532404
86358730068547564371240397263806188313
4011003027232021423
0.40.00.30.30.00.00.30.00.71.04.10.50.50.00.50.40.51.10.9
130981131034274244333743775532104415373820
2.110.04.70.30.32.31.00.52.28.03.02.01.51.93.91.89.70.80.5
626897724202901115018397385481419224217143739043601169426582245556145234230
188583041379366293246150199314814002298369540392
2.33.67.82.64.82.12.32.64.73.11.48.36.90.70.32.510.25.61.5
7364143831464045160425099801712925505875184449635045228834473079654859395625
148824370810812535481819194052414025061133125538653767918691162879
20.216.922.526.715.821.918.627.220.523.927.422.824.916.915.622.128.619.615.6
40177251781208992014606117388214903297108927382958127218411799352838323031
173728077587928255721571471509134255312971664307787691190619621193
43.238.643.542.130.738.235.337.934.240.750.847.456.324.142.738.454.051.239.4
11381216349276134252439691591811011404091722933770180033560528848781007697718656
18222275871047854261420158636113485111239162219138356315581320742
16.010.511.917.13.410.78.914.48.914.717.416.120.35.47.211.515.513.58.6
214014847317023448396698781
12011657942188226330194312181636461
26.69.312.13.21.214.031.710.62.619.47.314.238.474.88.928.217.823.87.3
113236679983372398202113861572684276152329692345487011101555579
14.022.920.415.73.712.416.014.94.941.712.226.251.80.813.526.116.321.69.2
1917111229947783865185319646193345757162502256284
2.44.52.95.72.42.53.15.61.73.12.03.36.00.21.74.97.43.64.5

264
The Many Faces of Poverty (Volume 3)
CBMS CorCBMS CorCBMS CorCBMS CorCBMS Core Indicators, by Municipalitye Indicators, by Municipalitye Indicators, by Municipalitye Indicators, by Municipalitye Indicators, by Municipality, Pr, Pr, Pr, Pr, Province of Surigao del Surovince of Surigao del Surovince of Surigao del Surovince of Surigao del Surovince of Surigao del Sur, 2008-2011, 2008-2011, 2008-2011, 2008-2011, 2008-2011
Households with income below theHouseholds with income below theHouseholds with income below theHouseholds with income below theHouseholds with income below thepoverpoverpoverpoverpover ty thrty thrty thrty thrty thresholdesholdesholdesholdeshold
Households with income below theHouseholds with income below theHouseholds with income below theHouseholds with income below theHouseholds with income below thefood thresholdfood thresholdfood thresholdfood thresholdfood threshold
Households who experienced foodHouseholds who experienced foodHouseholds who experienced foodHouseholds who experienced foodHouseholds who experienced foodsho rsho rsho rsho rsho r t a get aget aget aget age
Munic ipal i tyMunic ipal i tyMunic ipal i tyMunic ipal i tyMunic ipal i ty
P rP rP rP rP r opo ropo ropo ropo ropo r t i o nt i o nt i o nt i o nt i o n P rP rP rP rP r opo ropo ropo ropo ropo r t i o nt i o nt i o nt i o nt i o n P rP rP rP rP r opo ropo ropo ropo ropo r t i o nt i o nt i o nt i o nt i o nMagn i t udeMagn i t udeMagn i t udeMagn i t udeMagn i t udeMagn i t udeMagn i t udeMagn i t udeMagn i t udeMagn i t udeMagn i t udeMagn i t udeMagn i t udeMagn i t udeMagn i t ude
BAROBOBAYABASCAGWAITCANTILANCARMENCARRASCALCITY OF BISLIGCITY OF TANDAGCORTESHINATUANLANUZALIANGALINGIGMADRIDMARIHATAGSAN AGUSTINSAN MIGUELTAGBINATAGO
Unemployment rateUnemployment rateUnemployment rateUnemployment rateUnemployment rate(15 years old and above)(15 years old and above)(15 years old and above)(15 years old and above)(15 years old and above)
Persons who arePersons who arePersons who arePersons who arePersons who arevict ims of cr imesvict ims of cr imesvict ims of cr imesvict ims of cr imesvict ims of cr imes
Number of persons in theNumber of persons in theNumber of persons in theNumber of persons in theNumber of persons in thelabor forcelabor forcelabor forcelabor forcelabor force
(15 years old and above)(15 years old and above)(15 years old and above)(15 years old and above)(15 years old and above)
Munic ipal i tyMunic ipal i tyMunic ipal i tyMunic ipal i tyMunic ipal i ty CBMS CompositeCBMS CompositeCBMS CompositeCBMS CompositeCBMS CompositeInd icatorInd icatorInd icatorInd icatorInd icator
P rP rP rP rP r opo ropo ropo ropo ropo r t i o nt i o nt i o nt i o nt i o nP rP rP rP rP r opo ropo ropo ropo ropo r t i o nt i o nt i o nt i o nt i o nMagn i t udeMagn i t udeMagn i t udeMagn i t udeMagn i t ude Magn i t udeMagn i t udeMagn i t udeMagn i t udeMagn i t ude
BAROBOBAYABASCAGWAITCANTILANCARMENCARRASCALCITY OF BISLIGCITY OF TANDAGCORTESHINATUANLANUZALIANGALINGIGMADRIDMARIHATAGSAN AGUSTINSAN MIGUELTAGBINATAGO
457871622302748135316307664358617664275175339284331202325041851591761324619
56.444.656.851.869.150.560.638.555.566.477.267.574.866.874.155.386.584.972.9
362352616712142113012156205237813243498157332183725151521811351544758084005
44.632.842.640.457.737.649.125.541.654.369.355.364.350.064.540.379.780.463.2
15781624307122911302
35473915221482202
32313051185
0.24.94.10.80.02.21.81.20.00.015.612.726.44.96.50.147.34.218.7
1233922215435680427794739156381208747958648259675196655509540974811950293237712
17236566192965578154128881393960153522113161
1.41.61.00.93.32.03.60.71.11.53.41.80.61.20.40.70.21.22.1
1356261878473
10355497411214605828
0.00.10.30.00.00.10.10.10.00.30.50.20.00.30.10.10.20.20.1
1.71.41.61.41.51.31.81.11.22.12.12.12.92.11.81.72.92.41.9

The Many Faces of Poverty (Volume 3)
265
Map 2. Proportion of Children under 5 Years Old who Died, by Barangay, 2008-2011
Map 1. Proportion of Children under 5 Years Old who Died, by Municipality, 2008-2011
CARRASCAL CANTILAN
MADRIDCARMENLANUZA
TANDAG
CORTES
SAN MIGUELCAGWAIT
MARIHATAGSAN AGUSTIN
LIANGA
BAROBO
TAGBINAHINATUAN
BISLIG CITYLINGIG
TAGO BAYABAS
1.1 0.2
0.40.11.4
0.9
0.1
1.70.4
1.30.8
0.80.2
0.5
0.5
0.20.9
0.80.7
CARRASCAL CANTILAN
MADRIDCARMENLANUZA
TANDAG
CORTES
SAN MIGUELCAGWAIT
MARIHATAGSAN AGUSTIN
LIANGA
BAROBO
TAGBINAHINATUAN
BISLIG CITYLINGIG
TAGO BAYABAS
1.1 0.2
0.40.11.4
0.9
0.1
1.70.4
1.30.8
0.80.2
0.5
0.5
0.20.9
0.80.7
CBMS Poverty Maps: Surigao del Sur
M unic ip a l it y M ag ni t ud e Pr o p o r t io nTago 60 1.7
Lanuza 17 1.4
B ayabas 11 1.3
Carrascal 17 1.1
Hinatuan 33 0 .9
Cortes 15 0 .9San M iguel 40 0 .8M arihatag 17 0 .8City of B islig 46 0 .8Lingig 22 0.7B arobo 28 0.5Lianga 16 0.5M adrid 6 0 .4Cagwait 8 0 .4San Agust in 4 0 .2Tagb ina 8 0 .2Cant ilan 4 0 .2City of Tandag 5 0.1Carmen 1 0.1
C hi ld ren und er 5 years o ld w ho d ied
M unicip al i t y B ar a ng ay M ag nit ud e Pr o p o r t io n
Tago Caras-an 2 8 15.3Carrascal Tag -Anit o 2 6 .3B arob o Javier 15 4 .7Lanuza Pakwan 9 4 .6Lingig Palo A lt o 3 4.1Cit y of B islig Comawas 11 3 .8
Tago A nahao Daan 7 3 .7
B arob o Cabacungan 8 3 .2
Hinatuan Loyola 7 3 .2
San M ig uel B it aug an 7 3.1Cagwait La Purisima (Palhe) 4 3.1Lanuza Zo ne II (Pob .) 1 3.1
B o t t o m 12 B a r ang ays

266
The Many Faces of Poverty (Volume 3)
Map 3. Proportion of Women who Died Due to Pregnancy-Related Causes,by Municipality, 2008-2011
Map 4. Proportion of Women who Died Due to Pregnancy-Related Causes,by Barangay, 2008-2011
CARRASCAL CANTILAN
MADRIDCARMENLANUZA
TANDAG
CORTES
SAN MIGUELCAGWAIT
MARIHATAGSAN AGUSTIN
LIANGA
BAROBO
TAGBINAHINATUAN
BISLIG CITYLINGIG
TAGO BAYABAS
0.0 0.3
0.00.0 0.0
0.7
4.1
0.50.9
0.3
0.0
0.50.4
0.5
0.4
1.11.0
0.30.5
CARRASCAL CANTILAN
MADRIDCARMENLANUZA
TANDAG
CORTES
SAN MIGUELCAGWAIT
MARIHATAGSAN AGUSTIN
LIANGA
BAROBO
TAGBINAHINATUAN
BISLIG CITYLINGIG
TAGO BAYABAS
0.0 0.3
0.00.0 0.0
0.7
4.1
0.5 0.90.3
0.0
0.50.4
0.5
0.4
1.11.0
0.30.5
CBMS Poverty Maps: Surigao del Sur
M unic ip a l it y M ag ni t ud e Pr o p o r t io nLanuza 2 4.1
Tagb ina 2 1.1
Hinatuan 7 1.0
Tago 3 0 .9
Cortes 2 0.7
Lingig 2 0.5Lianga 3 0.5M arihatag 2 0.5San M iguel 4 0.5Barobo 4 0 .4San Agust in 1 0 .4City of B islig 3 0 .3Cant ilan 1 0 .3Cagwait 1 0 .3Bayabas 0 0 .0Carmen 0 0 .0Carrascal 0 0 .0City of Tandag 0 0 .0M adrid 0 0 .0
W o men d eat hs d ue t o p reg nancy-re lat ed causes
M unic ip al i t y B ar a ng a y M a g ni t ud e P r o p o r t io n
Lanuza Zo ne I (Po b.) 1 10 0.0Tagb ina Santa M aria 1 10 0.0Tagb ina So riano 1 10 0.0Tago Sumo -sumo 1 10 0.0Lanuza A gsam 1 50.0
Cortes M ad relino 2 14.3
Cit y of B islig Kahayag 1 9.1
Hinatuan M aligaya 1 7.7
Hinatuan Tarusan 1 7.1B arob o Javier 3 5.6
B o t t o m 10 B a r a ng ay s

The Many Faces of Poverty (Volume 3)
267
Map 6. Proportion of Children 0-5 Years Old who are Malnourished,by Barangay, 2008-2011
Map 5. Proportion of Children 0-5 Years Old who are Malnourished,by Municipality, 2008-2011
CARRASCAL CANTILAN
MADRIDCARMENLANUZA
TANDAG
CORTES
SAN MIGUELCAGWAIT
MARIHATAGSAN AGUSTIN
LIANGA
BAROBO
TAGBINAHINATUAN
BISLIG CITYLINGIG
TAGO BAYABAS
2.30.3
1.90.33.0 0.5
2.2
9.7 0.54.7
10.0
3.91.8
2.0
2.1
0.88.0
1.01.5
CARRASCAL CANTILAN
MADRIDCARMENLANUZA
TANDAG
CORTES
SAN MIGUELCAGWAIT
MARIHATAGSAN AGUSTIN
LIANGA
BAROBO
TAGBINAHINATUAN
BISLIG CITYLINGIG
TAGO BAYABAS
2.30.3
1.90.33.0 0.5
2.2
9.7 0.54.7
10.0
3.91.8
2.0
2.1
0.88.0
1.01.5
CBMS Poverty Maps: Surigao del Sur
M unic ip a l it y M ag ni t ud e Pr o p o r t io nBayabas 98 10.0
San M iguel 537 9.7
Hinatuan 337 8 .0
Cagwait 113 4.7
M arihatag 104 3 .9
Lanuza 43 3 .0Carrascal 42 2 .3Cortes 43 2 .2Barobo 130 2.1Lianga 77 2 .0M adrid 32 1.9San Agust in 41 1.8Lingig 55 1.5City of B islig 74 1.0Tagb ina 38 0 .8City of Tandag 24 0.5Tago 20 0.5Cant ilan 10 0 .3Carmen 3 0 .3
M alno ur ished chi ld r en ( 0 - 5 years o ld )
M unicip al i t y B ar a ng ay M ag ni t ud e P r o p o r t io n
Hinatuan Tidman 22 0 54.9San M ig uel Sagb ayan 76 2 4.8San M ig uel Calatngan 54 2 4.8
Hinatuan Roxas 16 2 4.6San M ig uel Cast illo 44 2 3.4Lingig Handamayan 12 21.1
B arob o Wakat 49 2 0.6
B ayab as A mag 33 19.6
San M ig uel Siag ao 54 18.4San M ig uel Umalag 36 17.1
B o t t o m 10 B ar a ng ay s
268
The Many Faces of Poverty (Volume 3)
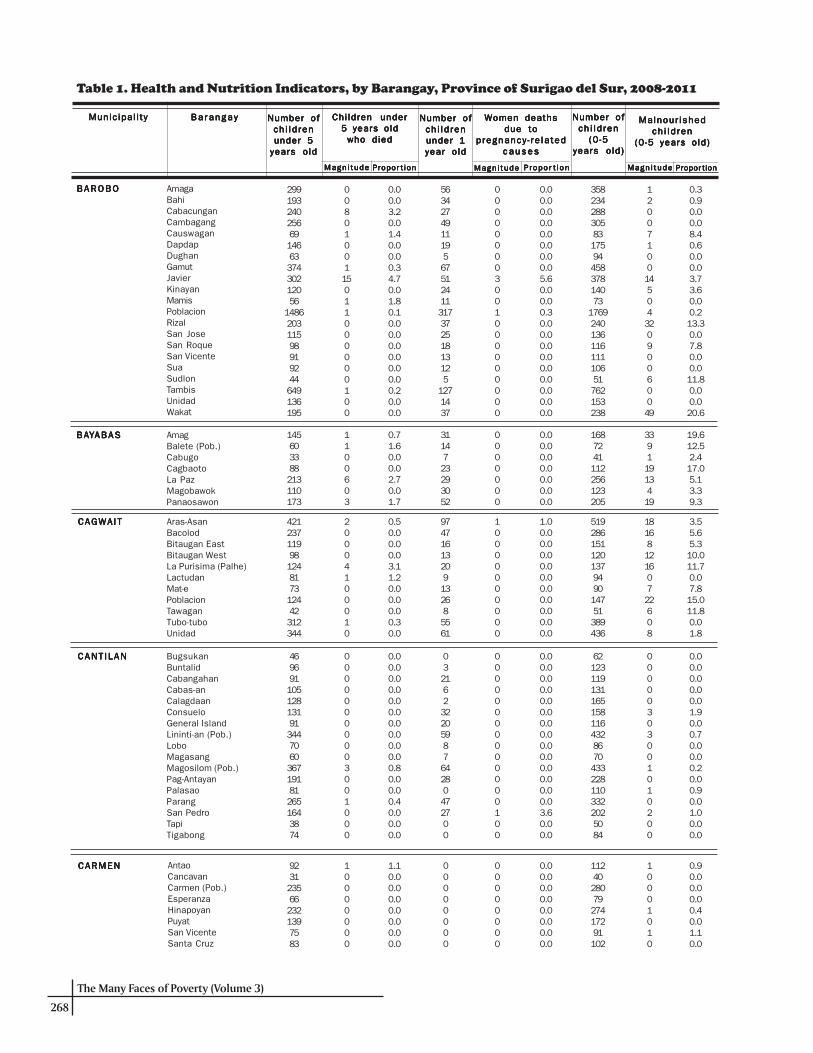
Table 1. Health and Nutrition Indicators, by Barangay, Province of Surigao del Sur, 2008-2011
B A R O B OB A R O B OB A R O B OB A R O B OB A R O B O AmagaBahiCabacunganCambagangCauswaganDapdapDughanGamutJavierKinayanMamisPoblacionRizalSan JoseSan RoqueSan VicenteSuaSudlonTambisUnidadWakat
BABABABABAYYYYYABASABASABASABASABAS AmagBalete (Pob.)CabugoCagbaotoLa PazMagobawokPanaosawon
CAGWAITCAGWAITCAGWAITCAGWAITCAGWAIT Aras-AsanBacolodBitaugan EastBitaugan WestLa Purisima (Palhe)LactudanMat-ePoblacionTawaganTubo-tuboUnidad
CANT ILANCANT ILANCANT ILANCANT ILANCANT ILAN BugsukanBuntalidCabangahanCabas-anCalagdaanConsueloGeneral IslandLininti-an (Pob.)LoboMagasangMagosilom (Pob.)Pag-AntayanPalasaoParangSan PedroTapiTigabong
CARMENCARMENCARMENCARMENCARMEN AntaoCancavanCarmen (Pob.)EsperanzaHinapoyanPuyatSan VicenteSanta Cruz
Munic ipal i tyMunic ipal i tyMunic ipal i tyMunic ipal i tyMunic ipal i ty Ba r anga yBa ranga yBa ranga yBa ranga yBa ranga y Number ofNumber ofNumber ofNumber ofNumber ofch i ld rench i ld rench i ld rench i ld rench i ld ren
(0-5(0-5(0-5(0-5(0-5years old)years old)years old)years old)years old)
Malnour ishedMalnour ishedMalnour ishedMalnour ishedMalnour ishedch i ld rench i ld rench i ld rench i ld rench i ld ren
(0-5 years old)(0-5 years old)(0-5 years old)(0-5 years old)(0-5 years old)
PrPrPrPrProporoporoporoporopor t iont iont iont iont ion
Chi ldren underChi ldren underChi ldren underChi ldren underChi ldren under5 years old5 years old5 years old5 years old5 years old
who diedwho diedwho diedwho diedwho died
Number ofNumber ofNumber ofNumber ofNumber ofch i ld rench i ld rench i ld rench i ld rench i ld renunder 1under 1under 1under 1under 1year oldyear oldyear oldyear oldyear old
Women deathsWomen deathsWomen deathsWomen deathsWomen deathsdue todue todue todue todue to
p regnancy - re la tedpregnancy - re la tedpregnancy - re la tedpregnancy - re la tedpregnancy - re la tedcausescausescausescausescauses
Magn i tudeMagn i tudeMagn i tudeMagn i tudeMagn i tude Magn i tudeMagn i tudeMagn i tudeMagn i tudeMagn i tude P rP rP rP rP ropo ropo ropo ropo ropo r t i ont iont iont iont ion Magn i tudeMagn i tudeMagn i tudeMagn i tudeMagn i tude PrPrPrPrProporoporoporoporopor tiontiontiontiontion
Number ofNumber ofNumber ofNumber ofNumber ofch i ld rench i ld rench i ld rench i ld rench i ld renunder 5under 5under 5under 5under 5
years oldyears oldyears oldyears oldyears old
299193240256691466337430212056
148620311598919244649136195
145603388213110173
42123711998124817312442312344
469691105128131913447060367191812651643874
9231235662321397583
0080100115011000000100
0.00.03.20.01.40.00.00.34.70.01.80.10.00.00.00.00.00.00.20.00.0
56342749111956751241131737251813125
1271437
000000003001000000000
0.00.00.00.00.00.00.00.05.60.00.00.30.00.00.00.00.00.00.00.00.0
358234288305831759445837814073
176924013611611110651762153238
120071001450432090060049
0.30.90.00.08.40.60.00.03.73.60.00.213.30.07.80.00.011.80.00.020.6
1100603
0.71.60.00.02.70.01.7
3114723293052
0000000
0.00.00.00.00.00.00.0
1687241112256123205
33911913419
19.612.52.417.05.13.39.3
20004100010
0.50.00.00.03.11.20.00.00.00.30.0
97471613209132685561
10000000000
1.00.00.00.00.00.00.00.00.00.00.0
519286151120137949014751389436
1816812160722608
3.55.65.310.011.70.07.815.011.80.01.8
00000000003001000
0.00.00.00.00.00.00.00.00.00.00.80.00.00.40.00.00.0
0321623220598764280472700
00000000000000100
0.00.00.00.00.00.00.00.00.00.00.00.00.00.03.60.00.0
6212311913116515811643286704332281103322025084
00000303001010200
0.00.00.00.00.01.90.00.70.00.00.20.00.90.01.00.00.0
10000000
1.10.00.00.00.00.00.00.0
00000000
00000000
0.00.00.00.00.00.00.00.0
112402807927417291102
10001010
0.90.00.00.00.40.01.10.0

The Many Faces of Poverty (Volume 3)
269
Table 1. Health and Nutrition Indicators, by Barangay, Province of Surigao del Sur, 2008-2011
CARRASCALCARRASCALCARRASCALCARRASCALCARRASCAL AdlayBabuyanBacolodBaybay (Pob.)Bon-otCaglayagDahicanDoyos (Pob.)Embarcadero (Pob.)GamutonPanikianPantukanSaca (Pob.)Tag-Anito
CITY OF BISLIGCITY OF BISLIGCITY OF BISLIGCITY OF BISLIGCITY OF BISLIG BuctoBurboananCaguyaoColetoComawasKahayagLabismaLawiganMaharlikaMangagoyMonePamanlinanPamaypayanPoblacionSan AntonioSan FernandoSan Isidro (Bagnan)San JoseSan RoqueSan VicenteSanta CruzSibaroyTabonTumanan
CITY OF TANDAGCITY OF TANDAGCITY OF TANDAGCITY OF TANDAGCITY OF TANDAG AwasianBagong Lungsod (Pob.)BiotoBongtod Pob.BuenavistaDagocdoc (Pob.)MabuaMabuhayMaitumMaticdumPandanonPangiQuezonRosarioSalvacionSan Agustin NorteSan Agustin SurSan AntonioSan IsidroSan JoseTelaje
C O R T E SC O R T E SC O R T E SC O R T E SC O R T E S BalibadonBurgosCapandanMabahinMadrelinoManlico
Munic ipal i tyMunic ipal i tyMunic ipal i tyMunic ipal i tyMunic ipal i ty Ba r anga yBa ranga yBa ranga yBa ranga yBa ranga y Number ofNumber ofNumber ofNumber ofNumber ofch i ld rench i ld rench i ld rench i ld rench i ld ren
(0-5(0-5(0-5(0-5(0-5years old)years old)years old)years old)years old)
Malnour ishedMalnour ishedMalnour ishedMalnour ishedMalnour ishedch i ld rench i ld rench i ld rench i ld rench i ld ren
(0-5 years old)(0-5 years old)(0-5 years old)(0-5 years old)(0-5 years old)
PrPrPrPrProporoporoporoporopor t iont iont iont iont ion
Chi ldren underChi ldren underChi ldren underChi ldren underChi ldren under5 years old5 years old5 years old5 years old5 years old
who diedwho diedwho diedwho diedwho died
Number ofNumber ofNumber ofNumber ofNumber ofch i ld rench i ld rench i ld rench i ld rench i ld renunder 1under 1under 1under 1under 1year oldyear oldyear oldyear oldyear old
Women deathsWomen deathsWomen deathsWomen deathsWomen deathsdue todue todue todue todue to
p regnancy - re la tedpregnancy - re la tedpregnancy - re la tedpregnancy - re la tedpregnancy - re la tedcausescausescausescausescauses
Magn i tudeMagn i tudeMagn i tudeMagn i tudeMagn i tude Magn i tudeMagn i tudeMagn i tudeMagn i tudeMagn i tude P rP rP rP rP ropo ropo ropo ropo ropo r t i ont iont iont iont ion Magn i tudeMagn i tudeMagn i tudeMagn i tudeMagn i tude PrPrPrPrProporoporoporoporopor tiontiontiontiontion
Number ofNumber ofNumber ofNumber ofNumber ofch i ld rench i ld rench i ld rench i ld rench i ld renunder 5under 5under 5under 5under 5
years oldyears oldyears oldyears oldyears old
3924679113126336613141119167876930
7714757872797110812516518758758130716127213115240336241788457973
133377875261943323295610962898911126564123372598245371
86304402665747
41103022100102
1.02.11.30.02.30.02.91.52.40.00.01.10.06.3
00001000002100
00000000000000
0.00.00.00.00.00.00.00.00.00.00.00.00.00.0
110513180105700
2.30.05.10.72.12.010.00.01.90.02.56.70.00.0
48453981451475080166521462031047635
10111102011500110000211071
1.30.01.71.13.80.01.80.00.60.80.00.00.80.10.00.00.00.00.60.41.30.01.21.4
015018451016172626817719114173525284833106890
000001001000000001000000
0.00.00.00.00.09.10.00.03.70.00.00.00.00.00.00.00.03.40.00.00.00.00.00.0
7031000013002100049151000
7.70.04.40.90.00.00.00.00.50.10.00.01.30.10.00.00.017.00.21.71.00.00.00.0
9118768109353811341552102256110701508811412651362894172889910070590
030100000000000010000
0.00.80.00.20.00.00.00.00.00.00.00.00.00.00.00.00.30.00.00.00.0
135999025575784714171549152459149537
000000000000000000000
0.00.00.00.00.00.00.00.00.00.00.00.00.00.00.00.00.00.00.00.00.0
167467107639240427396721427910710313932681145462749959483
0104111200020002000001
0.00.20.00.60.40.23.00.00.00.01.90.00.00.02.50.00.00.00.00.00.2
210310
2.30.30.01.11.70.0
1667745126
000020
0.00.00.00.014.30.0
101368513176657
693910
5.92.45.92.81.50.0

270
The Many Faces of Poverty (Volume 3)
Table 1. Health and Nutrition Indicators, by Barangay, Province of Surigao del Sur, 2008-2011
HINATUANHINATUANHINATUANHINATUANHINATUAN
LANUZALANUZALANUZALANUZALANUZA
L IANGAL IANGAL IANGAL IANGAL IANGA
L ING IGL ING IGL ING IGL ING IGL ING IG
C O R T E SC O R T E SC O R T E SC O R T E SC O R T E S MathoPoblacionTag-AnonganTigaoTuboranUba
BaculinBenigno AquinoBigaanCambatongCampaDugmanonHaripLa Casa (Pob.)LoyolaMaligayaPagtigni-an (Bitoon)PoctoPort LamonRoxasSan JuanSasaTagasakaTagbobongaTalisayTarusanTidmanTiwiZone II (Pob.)Zone III Maharlika (Pob.)
AgsamBocaweBungaGamutonHabagMampiNurciaPakwanSibahayZone I (Pob.)Zone II (Pob.)Zone III (Pob.)Zone IV (Pob.)
AnibonganBanahaoBan-asBaucaweDiatagonGanayonLiatimcoManyayayPayasanPoblacionSaint ChristineSan IsidroSan Pedro
AnibonganBarcelonaBogakBonganHandamayanMahayahayMandusMansa-ilaoPagtila-anPalo Alto
Munic ipal i tyMunic ipal i tyMunic ipal i tyMunic ipal i tyMunic ipal i ty Ba r anga yBa ranga yBa ranga yBa ranga yBa ranga y Number ofNumber ofNumber ofNumber ofNumber ofch i ld rench i ld rench i ld rench i ld rench i ld ren
(0-5(0-5(0-5(0-5(0-5years old)years old)years old)years old)years old)
Malnour ishedMalnour ishedMalnour ishedMalnour ishedMalnour ishedch i ld rench i ld rench i ld rench i ld rench i ld ren
(0-5 years old)(0-5 years old)(0-5 years old)(0-5 years old)(0-5 years old)
PrPrPrPrProporoporoporoporopor t iont iont iont iont ion
Chi ldren underChi ldren underChi ldren underChi ldren underChi ldren under5 years old5 years old5 years old5 years old5 years old
who diedwho diedwho diedwho diedwho died
Number ofNumber ofNumber ofNumber ofNumber ofch i ld rench i ld rench i ld rench i ld rench i ld renunder 1under 1under 1under 1under 1year oldyear oldyear oldyear oldyear old
Women deathsWomen deathsWomen deathsWomen deathsWomen deathsdue todue todue todue todue to
p regnancy - re la tedpregnancy - re la tedpregnancy - re la tedpregnancy - re la tedpregnancy - re la tedcausescausescausescausescauses
Magn i tudeMagn i tudeMagn i tudeMagn i tudeMagn i tude Magn i tudeMagn i tudeMagn i tudeMagn i tudeMagn i tude P rP rP rP rP r opo ropo ropo ropo ropo r t i ont iont iont iont ion Magn i tudeMagn i tudeMagn i tudeMagn i tudeMagn i tude PrPrPrPrProporoporoporoporopor tiontiontiontiontion
Number ofNumber ofNumber ofNumber ofNumber ofch i ld rench i ld rench i ld rench i ld rench i ld renunder 5under 5under 5under 5under 5
years oldyears oldyears oldyears oldyears old
113267842081791
221201
1.70.71.21.00.01.1
26451541416
000000
0.00.00.00.00.00.0
1423259926524107
242403
1.41.22.01.50.02.8
166148304148551455029321265162991444910771218711486733860206126
306102007012112010002121
1.80.01.90.70.01.40.00.03.20.00.62.00.72.01.80.00.50.00.00.00.61.61.00.8
363158246276595112312526617125022361371123618
000000010101000010011010
0.00.00.00.00.00.00.01.70.07.70.03.80.00.00.00.02.00.00.07.11.40.02.70.0
2001813731746717661351263812071191906513686263831867940170252153
4310010010036010316023407
220080
2.01.72.70.014.90.016.40.013.70.00.50.01.624.60.02.31.14.80.08.954.90.03.20.0
20776897990778418610447316732
4000102900100
1.90.00.00.01.10.02.34.60.00.03.10.00.0
101807015500100
1000000001000
50.00.00.00.00.00.00.00.00.0
100.00.00.00.0
252911131011109611121712959368339
31000141896010
1.21.10.00.00.01.03.68.37.010.20.01.20.0
118291201132709130213205232401228188199
0341003001103
0.01.02.00.80.00.01.40.00.00.20.40.01.5
147140211282143245171322424
0000100000101
0.00.00.00.00.80.00.00.00.00.03.00.04.0
135342234159858153270256290474272221240
030400137490910
0.08.81.70.00.08.52.61.63.10.03.30.50.0
7929625768471121923732871
0130010013
0.00.31.20.00.00.90.00.00.34.1
1022208112155715
0010000000
0.00.04.30.00.00.00.00.00.00.0
10035830779571362344838887
041401213017
0.01.14.60.021.10.71.30.00.38.0

The Many Faces of Poverty (Volume 3)
271
Table 1. Health and Nutrition Indicators, by Barangay, Province of Surigao del Sur, 2008-2011
L ING IGL ING IGL ING IGL ING IGL ING IG
MADRIDMADRIDMADRIDMADRIDMADRID BagsacBayogoLinibonanMagsaysayMangaPanayogonPatong PatongQuirino (Pob.)San AntonioSan JuanSan RoqueSan VicenteSongkitUnion
MARIHATAGMARIHATAGMARIHATAGMARIHATAGMARIHATAG AlegriaAmontayAntipoloAroroganBayanMahabaMararagPoblacionSan AntonioSan IsidroSan PedroSanta Cruz
SAN AGUSTINSAN AGUSTINSAN AGUSTINSAN AGUSTINSAN AGUSTIN BretaniaBuatongBuhisanGataHornasanJanipaanKauswaganOteizaPoblacionPong-onPongtodSalvacionSanto Niño
SAN MIGUELSAN MIGUELSAN MIGUELSAN MIGUELSAN MIGUEL BagyangBarasBitauganBolhoonCalatnganCarromataCastilloLibas GuaLibas SudMagroyongMahayag (Maitum)PatongPoblacionSagbayanSan RoqueSiagaoTinaUmalag
PoblacionRajah Cabungso-anSabangSalvacionSan RoqueTagpoporanUnionValencia
Munic ipal i tyMunic ipal i tyMunic ipal i tyMunic ipal i tyMunic ipal i ty Ba r anga yBa ranga yBa ranga yBa ranga yBa ranga y Number ofNumber ofNumber ofNumber ofNumber ofch i ld rench i ld rench i ld rench i ld rench i ld ren
(0-5(0-5(0-5(0-5(0-5years old)years old)years old)years old)years old)
Malnour ishedMalnour ishedMalnour ishedMalnour ishedMalnour ishedch i ld rench i ld rench i ld rench i ld rench i ld ren
(0-5 years old)(0-5 years old)(0-5 years old)(0-5 years old)(0-5 years old)
PrPrPrPrProporoporoporoporopor t iont iont iont iont ion
Chi ldren underChi ldren underChi ldren underChi ldren underChi ldren under5 years old5 years old5 years old5 years old5 years old
who diedwho diedwho diedwho diedwho died
Number ofNumber ofNumber ofNumber ofNumber ofch i ld rench i ld rench i ld rench i ld rench i ld renunder 1under 1under 1under 1under 1year oldyear oldyear oldyear oldyear old
Women deathsWomen deathsWomen deathsWomen deathsWomen deathsdue todue todue todue todue to
p regnancy - re la tedpregnancy - re la tedpregnancy - re la tedpregnancy - re la tedpregnancy - re la tedcausescausescausescausescauses
Magn i tudeMagn i tudeMagn i tudeMagn i tudeMagn i tude Magn i tudeMagn i tudeMagn i tudeMagn i tudeMagn i tude P rP rP rP rP r opo ropo ropo ropo ropo r t i ont iont iont iont ion Magn i tudeMagn i tudeMagn i tudeMagn i tudeMagn i tude PrPrPrPrProporoporoporoporopor tiontiontiontiontion
Number ofNumber ofNumber ofNumber ofNumber ofch i ld rench i ld rench i ld rench i ld rench i ld renunder 5under 5under 5under 5under 5
years oldyears oldyears oldyears oldyears old
6432301523011914011460
110000110
1.70.00.00.00.00.70.90.0
9260183245180
10000000
1.10.00.00.00.00.00.00.0
7932701913413416814374
00030640
0.00.00.08.80.03.62.80.0
34861331136957113275107116537349132
00200011000011
0.00.01.50.00.00.00.90.40.00.00.00.02.00.8
81429151414253812248131016
00000000000000
0.00.00.00.00.00.00.00.00.00.00.00.00.00.0
381051571388368133334126148659057152
313002004002314
7.912.40.00.02.40.00.01.20.00.03.13.31.82.6
9612720719830315935551730326175165
567893104329119
5.24.73.44.03.01.92.80.810.08.96.35.5
7810317116225513328942829271139136
101111130134
1.30.00.60.60.40.70.30.70.00.42.12.9
15153621361848943493527
000100000100
0.00.00.04.50.00.00.00.00.02.00.00.0
951431142723091331981629392140254240
20022001313207
2.10.00.00.76.50.00.51.91.13.31.40.02.9
71110792142571131641277273109204190
0000210000100
0.00.00.00.00.80.90.00.00.00.00.90.00.0
1023104129123713812123224
0100000000000
0.04.20.00.00.00.00.00.00.00.00.00.00.0
195147216599185361152146349181218145353257413250331187
127802200203211252
0.51.33.11.30.00.61.30.00.01.10.02.00.60.40.20.81.51.1
3525391112648382156344718664562555129
000000000010020010
0.00.00.00.00.00.00.00.00.00.02.10.00.04.30.00.01.90.0
243174249723218427188178416219245175409306495294391211
42317854694414472614283761754336
1.613.26.81.124.816.223.47.911.311.95.716.00.724.83.418.40.817.1
272
The Many Faces of Poverty (Volume 3)
Table 1. Health and Nutrition Indicators, by Barangay, Province of Surigao del Sur, 2008-2011
TAGB INATAGBINATAGBINATAGBINATAGBINA BatunanCarpenitoDoña CarmenHinagdananKahayaganLagoMaglambingMaglatabMagsaysayMalixiManambiaOsmeñaPoblacionQuezonSan VicenteSanta CruzSanta FeSanta JuanaSanta MariaSayonSorianoTagongonTrinidadUgobanVillaverde
TAGOTAGOTAGOTAGOTAGO AlbaAnahao Bag-oAnahao DaanBadongBajaoBangsudCabangahanCagdapaoCamagongCaras-anCayaleDayo-anGamutJubangKinabigtasanLayogLindoyMercedesPurisima (Pob.)Sumo-sumoUmbayUnabanUnidosVictoria
Munic ipal i tyMunic ipal i tyMunic ipal i tyMunic ipal i tyMunic ipal i ty Ba r anga yBa ranga yBa ranga yBa ranga yBa ranga y Number ofNumber ofNumber ofNumber ofNumber ofch i ld rench i ld rench i ld rench i ld rench i ld ren
(0-5(0-5(0-5(0-5(0-5years old)years old)years old)years old)years old)
Malnour ishedMalnour ishedMalnour ishedMalnour ishedMalnour ishedch i ld rench i ld rench i ld rench i ld rench i ld ren
(0-5 years old)(0-5 years old)(0-5 years old)(0-5 years old)(0-5 years old)
PrPrPrPrProporoporoporoporopor t iont iont iont iont ion
Chi ldren underChi ldren underChi ldren underChi ldren underChi ldren under5 years old5 years old5 years old5 years old5 years old
who diedwho diedwho diedwho diedwho died
Number ofNumber ofNumber ofNumber ofNumber ofch i ld rench i ld rench i ld rench i ld rench i ld renunder 1under 1under 1under 1under 1year oldyear oldyear oldyear oldyear old
Women deathsWomen deathsWomen deathsWomen deathsWomen deathsdue todue todue todue todue to
p regnancy - re la tedpregnancy - re la tedpregnancy - re la tedpregnancy - re la tedpregnancy - re la tedcausescausescausescausescauses
Magn i tudeMagn i tudeMagn i tudeMagn i tudeMagn i tude Magn i tudeMagn i tudeMagn i tudeMagn i tudeMagn i tude P rP rP rP rP r opo ropo ropo ropo ropo r t i ont iont iont iont ion Magn i tudeMagn i tudeMagn i tudeMagn i tudeMagn i tude PrPrPrPrProporoporoporoporopor tiontiontiontiontion
Number ofNumber ofNumber ofNumber ofNumber ofch i ld rench i ld rench i ld rench i ld rench i ld renunder 5under 5under 5under 5under 5
years oldyears oldyears oldyears oldyears old
741283461501858516913785180100150641189163108203792926218125576146222
01013001000500000010400058
0.00.80.08.70.00.00.60.00.00.05.00.00.00.00.00.00.00.30.06.50.00.00.03.43.6
619727112714473134111721418313251615113491173132425114722263113190
0000000001002000000012110
0.00.00.00.00.00.00.00.00.00.70.00.00.40.00.00.00.00.00.00.00.70.91.60.90.0
100110016023400000239070535036
0000000000000000001010000
0.00.00.00.00.00.00.00.00.00.00.00.00.00.00.00.00.00.0
100.00.0
100.00.00.00.00.0
255174234175114124186136107191163146279110127133138506742605292104206
600100001020511001200000
2.40.00.00.60.00.00.00.00.90.01.20.01.80.90.80.00.02.00.30.00.00.00.00.0
2171391801439410415011688155128118229959710411139544212407782165
40700103128030001001100010
1.80.03.70.00.01.00.02.51.115.30.02.50.00.00.01.00.00.02.00.00.00.01.20.0
4216361923271824212502301402005000000
101000000000000000010000
2.30.02.70.00.00.00.00.00.00.00.00.00.00.00.00.00.00.00.0
100.00.00.00.00.0

The Many Faces of Poverty (Volume 3)
273
Map 7. Proportion of Households Living in Makeshift Housing, by Municipality,2008-2011
Map 8. Proportion of Households Living in Makeshift Housing, by Barangay, 2008-2011
CARRASCAL CANTILAN
MADRIDCARMENLANUZA
TANDAG
CORTES
SAN MIGUELCAGWAIT
MARIHATAGSAN AGUSTIN
LIANGA
BAROBO
TAGBINAHINATUAN
BISLIG CITYLINGIG
TAGO BAYABAS
2.1 2.6
0.74.81.4
4.7
2.6
1.510.2
7.8
3.6
0.32.5
8.3
2.3
5.63.1
2.36.9
CARRASCAL CANTILAN
MADRIDCARMENLANUZA
TANDAG
CORTES
SAN MIGUELCAGWAIT
MARIHATAGSAN AGUSTIN
LIANGA
BAROBO
TAGBINAHINATUAN
BISLIG CITYLINGIG
TAGO BAYABAS
2.1 2.6
0.74.81.4
4.7
2.6
1.510.2
7.8
3.6
0.32.5
8.3
2.3
5.63.1
2.36.9
CBMS Poverty Maps: Surigao del Sur
M unic ip a l it y M ag ni t ud e Pr o p o r t io nSan M iguel 695 10.2
Lianga 481 8 .3
Cagwait 304 7.8
Lingig 400 6 .9
Tagb ina 403 5.6
Carmen 93 4 .8Cortes 150 4.7Bayabas 58 3 .6Hinatuan 199 3.1City of Tandag 246 2 .6Cant ilan 137 2 .6San Agust in 83 2.5City of B islig 293 2 .3Barobo 188 2 .3Carrascal 66 2.1Tago 92 1.5Lanuza 31 1.4M adrid 22 0.7M arihatag 9 0 .3
Ho useho ld s l iving in makeshi f t ho us ing
M unicip ali t y B ar ang ay M ag nit ud e Pr o p o r t io n
Tagbina Batunan 53 51.5Lingig Handamayan 41 46.1San M iguel B it augan 95 39.3San M iguel Siagao 142 37.4Tagbina Sayon 24 28.9
Lianga San Pedro 67 27.2
Cagwait Tub o-tubo 134 25.0
Tagbina Lago 39 23.4
Lingig Rajah Cabungso-an 86 21.6Lingig Union 44 21.3
B o t t o m 10 B ar ang ays

274
The Many Faces of Poverty (Volume 3)
Map 10. Proportion of Households who are Informal Settlers, by Barangay, 2008-2011
Map 9. Proportion of Households who are Informal Settlers, by Municipality,2008-2011
CARRASCAL CANTILAN
MADRIDCARMENLANUZA
TANDAG
CORTES
SAN MIGUELCAGWAIT
MARIHATAGSAN AGUSTIN
LIANGA
BAROBO
TAGBINAHINATUAN
BISLIG CITYLINGIG
TAGO BAYABAS
2.5 5.7
0.22.42.0
1.7
7.4
5.6
4.5 4.5
2.91.7
4.9
3.3
2.4
3.63.1
3.16.0
CARRASCAL CANTILAN
MADRIDCARMENLANUZA
TANDAG
CORTES
SAN MIGUELCAGWAIT
MARIHATAGSAN AGUSTIN
LIANGA
BAROBO
TAGBINAHINATUAN
BISLIG CITYLINGIG
TAGO BAYABAS
2.5 5.7
0.22.42.0
1.7
7.4
5.6
4.5 4.5
2.91.7
4.9
3.3
2.4
3.63.1
3.16.0
CBMS Poverty Maps: Surigao del Sur
M unic ip a l i t y M ag ni t ud e P ro p o r t io nSan M iguel 502 7.4
Lingig 345 6 .0
Cant ilan 299 5.7
City of Tandag 518 5.6
San A gust in 162 4 .9
Tago 284 4.5B ayabas 71 4.5Tagbina 256 3 .6Lianga 193 3 .3City of B islig 386 3.1Hinatuan 196 3.1Cagwait 112 2 .9Carrascal 78 2.5Carmen 47 2 .4B arobo 191 2 .4Lanuza 46 2 .0M arihatag 57 1.7Cortes 53 1.7M adrid 7 0 .2
Ho useho ld s w ho are inf o rmal set t le rs
M unicip al i t y B ar a ng ay M a g ni t ud e P r o p o r t io n
Tag o Lindo y 129 8 1.1
Cit y of Tand ag Pandano n 69 38 .8
Lingig B og ak 103 28 .9
Lingig B ong an 49 26 .1
San M iguel Umalag 46 24 .3
San M iguel Carromata 90 20 .9
B ayabas Cabug o 16 19.0
San A gustin B retania 25 18.2
Cant ilanM ag osilom (Po b.) 150 18.2
M arihatag San A ntonio 8 17.8
B o t t o m 10 B ar ang a ys

The Many Faces of Poverty (Volume 3)
275
Map 11. Proportion of Households without Access to Safe Water Supply,by Municipality, 2008-2011
Map 12. Proportion of Households without Access to Safe Water Supply,by Barangay, 2008-2011
CARRASCAL CANTILAN
MADRIDCARMENLANUZA
TANDAG
CORTES
SAN MIGUELCAGWAIT
MARIHATAGSAN AGUSTIN
LIANGA
BAROBO
TAGBINAHINATUAN
BISLIG CITYLINGIG
TAGO BAYABAS
14.0 3.2
74.81.27.3
2.6
10.6
7.317.8
12.1
9.3
8.928.2
14.2
26.6
23.819.4
31.738.4
CARRASCAL CANTILAN
MADRIDCARMENLANUZA
TANDAG
CORTES
SAN MIGUELCAGWAIT
MARIHATAGSAN AGUSTIN
LIANGA
BAROBO
TAGBINAHINATUAN
BISLIG CITYLINGIG
TAGO BAYABAS
14.0 3.2
74.81.27.3
2.6
10.6
7.317.8
12.1
9.3
8.928.2
14.2
26.6
23.819.4
31.738.4
CBMS Poverty Maps: Surigao del Sur
M unic ip a l it y M ag ni t ud e Pro p o r t io nM adrid 2263 74 .8
Lingig 2188 38.4
City of B islig 3966 31.7
San Agust in 943 28.2
Barobo 2140 26.6
Tagb ina 1636 23.8Hinatuan 1201 19 .4San M iguel 1218 17.8Lianga 794 14 .2Carrascal 448 14 .0Cagwait 473 12.1City of Tandag 987 10 .6Bayabas 148 9.3M arihatag 301 8.9Tago 461 7.3Lanuza 165 7.3Cant ilan 170 3.2Cortes 81 2.6Carmen 23 1.2
Ho useho ld s w i t ho ut access t o sa f e w at er sup p ly
M unicipalit y Barangay M agnit ude Proport ion
City of Tandag San Antonio 121 100.0Madrid San Roque 121 100.0City of Bislig Tumanan 147 99.3Hinatuan Maligaya 104 98.1Barobo San Roque 146 96.7Madrid Songkit 113 96.6
Madrid Panayogon 145 94.8
Barobo Cabacungan 300 94.6
Madrid Union 242 93.8Lingig Palo Alto 136 93.8
Bot t om 10 B arangays
276
The Many Faces of Poverty (Volume 3)
Map 14. Proportion of Households without Access to Sanitary Toilet Facilities,by Barangay, 2008-2011
Map 13. Proportion of Households without Access to Sanitary Toilet Facilities,by Barangay, 2008-2011
CARRASCAL CANTILAN
MADRIDCARMENLANUZA
TANDAG
CORTES
SAN MIGUELCAGWAIT
MARIHATAGSAN AGUSTIN
LIANGA
BAROBO
TAGBINAHINATUAN
BISLIG CITYLINGIG
TAGO BAYABAS
12.415.7
0.83.712.2
4.9
14.9
9.220.4
22.916.3
13.526.1
26.2
14.0
21.641.7
16.051.8
CARRASCAL CANTILAN
MADRIDCARMENLANUZA
TANDAG
CORTES
SAN MIGUELCAGWAIT
MARIHATAGSAN AGUSTIN
LIANGA
BAROBO
TAGBINAHINATUAN
BISLIG CITYLINGIG
TAGO BAYABAS
12.415.7
0.83.712.2
4.9
14.9
9.220.4
22.916.3
13.526.1
26.2
14.0
21.641.7
16.051.8
CBMS Poverty Maps: Surigao del Sur
M unic ip a l it y M ag ni t ud e Pr o p o r t io nLingig 2969 51.8
Hinatuan 2684 41.7
Lianga 1523 26 .2
San Agust in 870 26.1
Bayabas 366 22 .9
Tagb ina 1555 21.6Cagwait 799 20 .4San M iguel 1110 16.3City of B islig 2021 16.0Cant ilan 833 15.7City of Tandag 1386 14.9Barobo 1132 14.0M arihatag 454 13.5Carrascal 398 12.4Lanuza 276 12.2Tago 579 9 .2Cortes 157 4 .9Carmen 72 3.7M adrid 23 0 .8
Ho useho ld s w i t ho ut access t o sani t ary t o i let f aci l i t y
M unic ip a l i t y B a r ang ay M ag ni t ud e Pr o p o r t io n
Lingig B ong an 158 8 3.6Lingig Handamayan 71 79.8Lingig Tag po po ran 16 7 74.6
San M ig uel Umalag 13 9 73.5San A g ust in Janipaan 10 9 73.2Lingig M ansa-ilao 68 73 .1
Hinatuan Camb atong 16 1 72.5
Lingig V alencia 75 72 .1
Lingig B ogak 2 61 71.7Lianga Liat imco 2 54 71.5
B o t t o m 10 B ar a ng a ys

The Many Faces of Poverty (Volume 3)
277
Table 2. Housing, Water and Sanitation Indicators, by Barangay, Province of Surigao del Sur,2008-2011
Households l iv ing inHouseholds l iv ing inHouseholds l iv ing inHouseholds l iv ing inHouseholds l iv ing inmakeshift housingmakeshift housingmakeshift housingmakeshift housingmakeshift housing
Households who areHouseholds who areHouseholds who areHouseholds who areHouseholds who areinformal sett lersinformal sett lersinformal sett lersinformal sett lersinformal sett lers
Households withoutHouseholds withoutHouseholds withoutHouseholds withoutHouseholds withoutaccess to safe wateraccess to safe wateraccess to safe wateraccess to safe wateraccess to safe water
supp l ysupp l ysupp l ysupp l ysupp l y
Households withoutHouseholds withoutHouseholds withoutHouseholds withoutHouseholds withoutaccess to sanitaraccess to sanitaraccess to sanitaraccess to sanitaraccess to sanitar yyyyy
toi let faci l i t iestoi let faci l i t iestoi let faci l i t iestoi let faci l i t iestoi let faci l i t ies
Ba ranga yBa ranga yBa ranga yBa ranga yBa ranga yMunic ipal i tyMunic ipal i tyMunic ipal i tyMunic ipal i tyMunic ipal i ty
P rP rP rP rP r opo ropo ropo ropo ropo r t i o nt i o nt i o nt i o nt i o nP rP rP rP rP r opo ropo ropo ropo ropo r t i o nt i o nt i o nt i o nt i o n P rP rP rP rP r opo ropo ropo ropo ropo r t i o nt i o nt i o nt i o nt i o n P rP rP rP rP r opo ropo ropo ropo ropo r t i o nt i o nt i o nt i o nt i o nMagn i tudeMagn i tudeMagn i tudeMagn i tudeMagn i tude Magn i tudeMagn i tudeMagn i tudeMagn i tudeMagn i tude Magn i tudeMagn i tudeMagn i tudeMagn i tudeMagn i tude Magn i tudeMagn i tudeMagn i tudeMagn i tudeMagn i tude
B A R O B OB A R O B OB A R O B OB A R O B OB A R O B O AmagaBahiCabacunganCambagangCauswaganDapdapDughanGamutJavierKinayanMamisPoblacionRizalSan JoseSan RoqueSan VicenteSuaSudlonTambisUnidadWakat
BABABABABAYYYYYABASABASABASABASABAS AmagBalete (Pob.)CabugoCagbaotoLa PazMagobawokPanaosawon
CAGWAITCAGWAITCAGWAITCAGWAITCAGWAIT Aras-AsanBacolodBitaugan EastBitaugan WestLa Purisima (Palhe)LactudanMat-ePoblacionTawaganTubo-tuboUnidad
CANT ILANCANT ILANCANT ILANCANT ILANCANT ILAN BugsukanBuntalidCabangahanCabas-anCalagdaanConsueloGeneral IslandLininti-an (Pob.)LoboMagasangMagosilom (Pob.)Pag-AntayanPalasaoParangSan PedroTapiTigabong
CARMENCARMENCARMENCARMENCARMEN AntaoCancavanCarmen (Pob.)EsperanzaHinapoyanPuyatSan VicenteSanta Cruz
014718010600220331181815233
0.00.414.75.50.00.40.00.90.00.02.00.10.01.820.39.210.51.50.50.911.3
220
300029260
3521903394270
1161460123
437362
4.70.094.60.020.410.90.054.337.61.639.019.70.069.996.70.07.04.546.016.80.7
409
14884325214671941821988583515932260019
8.53.346.32.430.110.310.97.114.151.418.010.030.334.723.57.754.132.86.30.06.5
12101845
0.41.31.20.00.24.117.2
28350046039
10.222.00.00.010.20.014.9
481723371323772
17.510.727.421.529.119.327.5
33106444008100
13419
3.52.33.120.915.20.07.73.20.025.02.8
31641840567290
11217
0.338.40.539.80.032.76.79.40.020.92.5
11910156363451174070149126
12.823.729.517.112.929.816.713.068.027.718.6
23280281551182231731
1.81.11.73.00.011.50.56.70.70.81.00.50.70.45.32.80.6
101961330009123737042
9.07.250.81.11.00.00.00.06.50.80.20.82.60.42.20.024.3
10307217486658123105
155201252855011
9.011.460.06.316.827.230.515.07.24.118.95.445.84.217.10.06.4
315400316133
1.418.16.80.01.05.310.81.6
20818301
1.50.01.40.62.61.00.00.6
3131392401
1.41.20.50.612.58.00.00.5
51033311013140471202035618
1.13.710.30.90.74.10.50.50.22.20.02.10.31.20.01.00.04.55.90.52.7
11016418913
4.00.019.02.34.04.75.0
346151626516246
3.71.47.97.60.83.54.85.22.70.70.9
02120710163903
15052142001
0.08.01.70.02.54.18.44.80.02.518.21.47.70.66.20.00.6
1015419701
0.50.02.62.66.12.30.00.5

278
The Many Faces of Poverty (Volume 3)
Table 2. Housing, Water and Sanitation Indicators, by Barangay, Province of Surigao del Sur,2008-2011
Households l iv ing inHouseholds l iv ing inHouseholds l iv ing inHouseholds l iv ing inHouseholds l iv ing inmakeshift housingmakeshift housingmakeshift housingmakeshift housingmakeshift housing
Households who areHouseholds who areHouseholds who areHouseholds who areHouseholds who areinformal sett lersinformal sett lersinformal sett lersinformal sett lersinformal sett lers
Households withoutHouseholds withoutHouseholds withoutHouseholds withoutHouseholds withoutaccess to safe wateraccess to safe wateraccess to safe wateraccess to safe wateraccess to safe water
supp l ysupp l ysupp l ysupp l ysupp l y
Households withoutHouseholds withoutHouseholds withoutHouseholds withoutHouseholds withoutaccess to sanitaraccess to sanitaraccess to sanitaraccess to sanitaraccess to sanitar yyyyy
toi let faci l i t iestoi let faci l i t iestoi let faci l i t iestoi let faci l i t iestoi let faci l i t ies
Ba ranga yBa ranga yBa ranga yBa ranga yBa ranga yMunic ipal i tyMunic ipal i tyMunic ipal i tyMunic ipal i tyMunic ipal i ty
P rP rP rP rP r opo ropo ropo ropo ropo r t i o nt i o nt i o nt i o nt i o nP rP rP rP rP r opo ropo ropo ropo ropo r t i o nt i o nt i o nt i o nt i o n P rP rP rP rP r opo ropo ropo ropo ropo r t i o nt i o nt i o nt i o nt i o n P rP rP rP rP r opo ropo ropo ropo ropo r t i o nt i o nt i o nt i o nt i o nMagn i tudeMagn i tudeMagn i tudeMagn i tudeMagn i tude Magn i tudeMagn i tudeMagn i tudeMagn i tudeMagn i tude Magn i tudeMagn i tudeMagn i tudeMagn i tudeMagn i tude Magn i tudeMagn i tudeMagn i tudeMagn i tudeMagn i tude
CARRASCALCARRASCALCARRASCALCARRASCALCARRASCAL AdlayBabuyanBacolodBaybay (Pob.)Bon-otCaglayagDahicanDoyos (Pob.)Embarcadero (Pob.)GamutonPanikianPantukanSaca (Pob.)Tag-Anito
CITY OF BISLIGCITY OF BISLIGCITY OF BISLIGCITY OF BISLIGCITY OF BISLIG BuctoBurboananCaguyaoColetoComawasKahayagLabismaLawiganMaharlikaMangagoyMonePamanlinanPamaypayanPoblacionSan AntonioSan FernandoSan Isidro (Bagnan)San JoseSan RoqueSan VicenteSanta CruzSibaroyTabonTumanan
CITY OF TANDAGCITY OF TANDAGCITY OF TANDAGCITY OF TANDAGCITY OF TANDAG AwasianBagong Lungsod (Pob.)BiotoBongtod Pob.BuenavistaDagocdoc (Pob.)MabuaMabuhayMaitumMaticdumPandanonPangiQuezonRosarioSalvacionSan Agustin NorteSan Agustin SurSan AntonioSan IsidroSan JoseTelaje
C O R T E SC O R T E SC O R T E SC O R T E SC O R T E S BalibadonBurgosCapandanMabahinMadrelinoManlico
197301057067821
2.58.01.70.00.40.04.12.30.02.41.77.01.21.1
7941650503530164494342219
7941650503530164494342219
801511207023819828345995
10.517.06.37.727.12.631.46.45.611.18.452.25.55.4
21404917418552105417102543025200
1.75.60.02.51.60.62.91.75.01.31.01.10.03.50.61.90.40.03.59.10.016.11.30.0
77194223911863170115818771365216129103698930737823812293286147
65.377.620.025.020.436.271.449.122.621.868.355.983.41.964.018.438.092.752.950.688.460.018.799.3
526032123424191084152033407024818104458613110946744768
44.124.029.17.65.913.87.946.211.412.616.543.036.316.111.227.719.225.918.423.233.347.73.145.9
61324208958505715628811419
2.01.51.23.30.00.91.25.12.73.90.02.52.82.74.10.712.00.80.64.21.5
282014167294145401211711322481316
121483333
9.62.38.413.15.74.45.940.440.313.463.51.09.814.62.10.40.8
100.028.934.42.7
2594153461714576224912102154429288115527231962
8.610.79.027.03.315.79.922.216.39.457.37.418.35.219.229.321.222.313.919.85.0
52662746
3.94.08.35.63.05.9
2140712
1.62.10.01.40.82.0
63142674
4.74.75.65.35.33.9
3331312452036600
4.43.40.61.24.85.24.20.70.01.21.55.40.00.0
182410286585
1543664931271081227138
15.10.83.66.44.83.42.13.41.43.81.56.53.13.21.93.23.03.01.12.61.54.50.85.4
155523713481713156927473261113449
5.16.31.22.90.23.711.17.14.311.838.81.02.98.52.10.78.40.87.84.24.0
2117401
1.61.79.70.80.01.0

The Many Faces of Poverty (Volume 3)
279
Table 2. Housing, Water and Sanitation Indicators, by Barangay, Province of Surigao del Sur,2008-2011
Households l iv ing inHouseholds l iv ing inHouseholds l iv ing inHouseholds l iv ing inHouseholds l iv ing inmakeshift housingmakeshift housingmakeshift housingmakeshift housingmakeshift housing
Households who areHouseholds who areHouseholds who areHouseholds who areHouseholds who areinformal sett lersinformal sett lersinformal sett lersinformal sett lersinformal sett lers
Households withoutHouseholds withoutHouseholds withoutHouseholds withoutHouseholds withoutaccess to safe wateraccess to safe wateraccess to safe wateraccess to safe wateraccess to safe water
supp l ysupp l ysupp l ysupp l ysupp l y
Households withoutHouseholds withoutHouseholds withoutHouseholds withoutHouseholds withoutaccess to sanitaraccess to sanitaraccess to sanitaraccess to sanitaraccess to sanitar yyyyy
toi let faci l i t iestoi let faci l i t iestoi let faci l i t iestoi let faci l i t iestoi let faci l i t ies
Ba ranga yBa ranga yBa ranga yBa ranga yBa ranga yMunic ipal i tyMunic ipal i tyMunic ipal i tyMunic ipal i tyMunic ipal i ty
P rP rP rP rP r opo ropo ropo ropo ropo r t i o nt i o nt i o nt i o nt i o nP rP rP rP rP r opo ropo ropo ropo ropo r t i o nt i o nt i o nt i o nt i o n P rP rP rP rP r opo ropo ropo ropo ropo r t i o nt i o nt i o nt i o nt i o n P rP rP rP rP r opo ropo ropo ropo ropo r t i o nt i o nt i o nt i o nt i o nMagn i tudeMagn i tudeMagn i tudeMagn i tudeMagn i tude Magn i tudeMagn i tudeMagn i tudeMagn i tudeMagn i tude Magn i tudeMagn i tudeMagn i tudeMagn i tudeMagn i tude Magn i tudeMagn i tudeMagn i tudeMagn i tudeMagn i tude
C O R T E SC O R T E SC O R T E SC O R T E SC O R T E S MathoPoblacionTag-AnonganTigaoTuboranUba
HINATUANHINATUANHINATUANHINATUANHINATUAN BaculinBenigno AquinoBigaanCambatongCampaDugmanonHaripLa Casa (Pob.)LoyolaMaligayaPagtigni-an (Bitoon)PoctoPort LamonRoxasSan JuanSasaTagasakaTagbobongaTalisayTarusanTidmanTiwiZone II (Pob.)Zone III Maharlika (Pob.)
LANUZALANUZALANUZALANUZALANUZA AgsamBocaweBungaGamutonHabagMampiNurciaPakwanSibahayZone I (Pob.)Zone II (Pob.)Zone III (Pob.)Zone IV (Pob.)
L IANGAL IANGAL IANGAL IANGAL IANGA AnibonganBanahaoBan-asBaucaweDiatagonGanayonLiatimcoManyayayPayasanPoblacionSaint ChristineSan IsidroSan Pedro
L ING IGL ING IGL ING IGL ING IGL ING IG AnibonganBarcelonaBogakBonganHandamayanMahayahayMandusMansa-ilaoPagtila-anPalo Alto
131919313
0.55.06.64.55.47.6
4359520
2.05.76.61.23.60.0
4172423110
2.02.817.65.41.85.9
0301700000101850244241601000401
0.01.00.00.57.70.00.00.00.00.02.810.420.017.81.714.54.10.00.40.00.00.09.40.4
10
2511826101260961046467859720
128551502835101
0.50.046.88.128.633.632.50.025.198.118.152.34.143.730.00.032.545.80.546.34.929.42.50.4
10112116516144631028024140887016264161408345112603925211019
43.542.330.272.548.420.912.549.655.537.725.040.764.847.467.124.121.137.548.355.668.343.725.96.7
3251202511153
0.81.41.90.41.40.00.92.60.60.81.33.43.0
7019130034191833130
2.00.00.43.90.730.30.017.511.914.641.88.80.0
38101505652
1141500102
10.57.05.80.03.465.70.959.19.40.00.06.82.0
1210282
13145437130105067
5.12.49.40.99.01.815.211.60.33.419.20.027.2
996769124902
2096420788
56.32.22.033.36.210.52.50.00.623.411.790.435.8
271176295334862546455962107647
11.528.120.941.722.837.771.520.315.310.738.833.219.1
2358238418241102
14.69.16.34.146.13.86.21.11.81.4
302056582771794844136
19.032.117.942.17.948.620.352.27.893.8
7544226115871107796824745
47.569.371.783.679.857.220.373.144.031.3
0.51.02.21.78.93.5
163756
3022036116247311766711089316
1.30.00.40.90.01.09.52.01.41.91.24.01.20.77.13.61.55.84.70.015.52.50.22.1
10743151801312
2.84.91.51.30.75.10.44.30.00.83.90.72.0
11914560152711462911
0.44.74.72.24.26.67.63.51.10.75.30.40.4
63510349131116131
3.85.528.926.11.11.42.817.22.30.7

280
The Many Faces of Poverty (Volume 3)
Table 2. Housing, Water and Sanitation Indicators, by Barangay, Province of Surigao del Sur,2008-2011
Households l iv ing inHouseholds l iv ing inHouseholds l iv ing inHouseholds l iv ing inHouseholds l iv ing inmakeshift housingmakeshift housingmakeshift housingmakeshift housingmakeshift housing
Households who areHouseholds who areHouseholds who areHouseholds who areHouseholds who areinformal sett lersinformal sett lersinformal sett lersinformal sett lersinformal sett lers
Households withoutHouseholds withoutHouseholds withoutHouseholds withoutHouseholds withoutaccess to safe wateraccess to safe wateraccess to safe wateraccess to safe wateraccess to safe water
supp l ysupp l ysupp l ysupp l ysupp l y
Households withoutHouseholds withoutHouseholds withoutHouseholds withoutHouseholds withoutaccess to sanitaraccess to sanitaraccess to sanitaraccess to sanitaraccess to sanitar yyyyy
toi let faci l i t iestoi let faci l i t iestoi let faci l i t iestoi let faci l i t iestoi let faci l i t ies
Ba ranga yBa ranga yBa ranga yBa ranga yBa ranga yMunic ipal i tyMunic ipal i tyMunic ipal i tyMunic ipal i tyMunic ipal i ty
P rP rP rP rP r opo ropo ropo ropo ropo r t i o nt i o nt i o nt i o nt i o nP rP rP rP rP r opo ropo ropo ropo ropo r t i o nt i o nt i o nt i o nt i o n P rP rP rP rP r opo ropo ropo ropo ropo r t i o nt i o nt i o nt i o nt i o n P rP rP rP rP r opo ropo ropo ropo ropo r t i o nt i o nt i o nt i o nt i o nMagn i tudeMagn i tudeMagn i tudeMagn i tudeMagn i tude Magn i tudeMagn i tudeMagn i tudeMagn i tudeMagn i tude Magn i tudeMagn i tudeMagn i tudeMagn i tudeMagn i tude Magn i tudeMagn i tudeMagn i tudeMagn i tudeMagn i tude
BagyangBarasBitauganBolhoonCalatnganCarromataCastilloLibas GuaLibas SudMagroyongMahayag (Maitum)PatongPoblacionSagbayanSan RoqueSiagaoTinaUmalag
L ING IGL ING IGL ING IGL ING IGL ING IG
MADRIDMADRIDMADRIDMADRIDMADRID BagsacBayogoLinibonanMagsaysayMangaPanayogonPatong PatongQuirino (Pob.)San AntonioSan JuanSan RoqueSan VicenteSongkitUnion
MARIHATAGMARIHATAGMARIHATAGMARIHATAGMARIHATAG AlegriaAmontayAntipoloAroroganBayanMahabaMararagPoblacionSan AntonioSan IsidroSan PedroSanta Cruz
SAN AGUSTINSAN AGUSTINSAN AGUSTINSAN AGUSTINSAN AGUSTIN BretaniaBuatongBuhisanGataHornasanJanipaanKauswaganOteizaPoblacionPong-onPongtodSalvacionSanto Niño
SAN MIGUELSAN MIGUELSAN MIGUELSAN MIGUELSAN MIGUEL
PoblacionRajah Cabungso-anSabangSalvacionSan RoqueTagpoporanUnionValencia
348610278442
2.521.60.30.014.03.621.31.9
8982438913
168181
67.561.222.61.61.675.08.71.0
56019521043811678575
41.949.053.368.342.074.641.172.1
91000043020120
8.70.60.00.00.00.02.00.50.00.70.00.71.70.0
911469819516414515732818723912137113242
90.181.633.484.892.794.877.056.993.585.7100.026.696.693.8
15010002334040
1.02.80.00.40.00.00.00.31.51.13.30.03.40.0
200012001012
1.50.00.00.00.31.10.00.02.20.00.61.0
034303675269278128
0.024.310.31.21.543.15.91.24.41.850.013.4
31365819249037307493340
23.525.720.07.56.151.78.44.015.612.720.419.1
96752707380263
6.62.74.31.45.30.02.71.04.50.01.01.60.8
0337625703516113154019
204
0.014.746.369.80.023.562.44.386.00.00.52.455.1
8412866077109129204236888542
61.35.452.416.315.373.250.26.723.536.042.322.211.4
31495861374102762151850541429635
1.44.639.311.60.58.61.54.45.21.80.65.13.011.78.837.417.618.5
5887101190
151179201703329299979316577
27.228.64.116.10.035.069.18.732.90.99.93.04.823.112.98.211.940.7
149193321985181241133146101722774031139
70.06.313.629.643.842.19.24.96.44.31.93.42.85.212.610.65.773.5
48910299911
3.62.32.63.24.74.04.310.6
40002000100000
3.90.00.00.01.10.00.00.00.50.00.00.00.00.0
0098120682318
0.00.03.13.20.31.10.00.817.80.51.98.7
255107611921774428
18.22.26.11.91.20.77.40.70.67.03.411.57.6
01021534901518301723956923244546
0.03.38.77.22.120.95.87.95.85.20.613.29.32.13.86.38.324.3
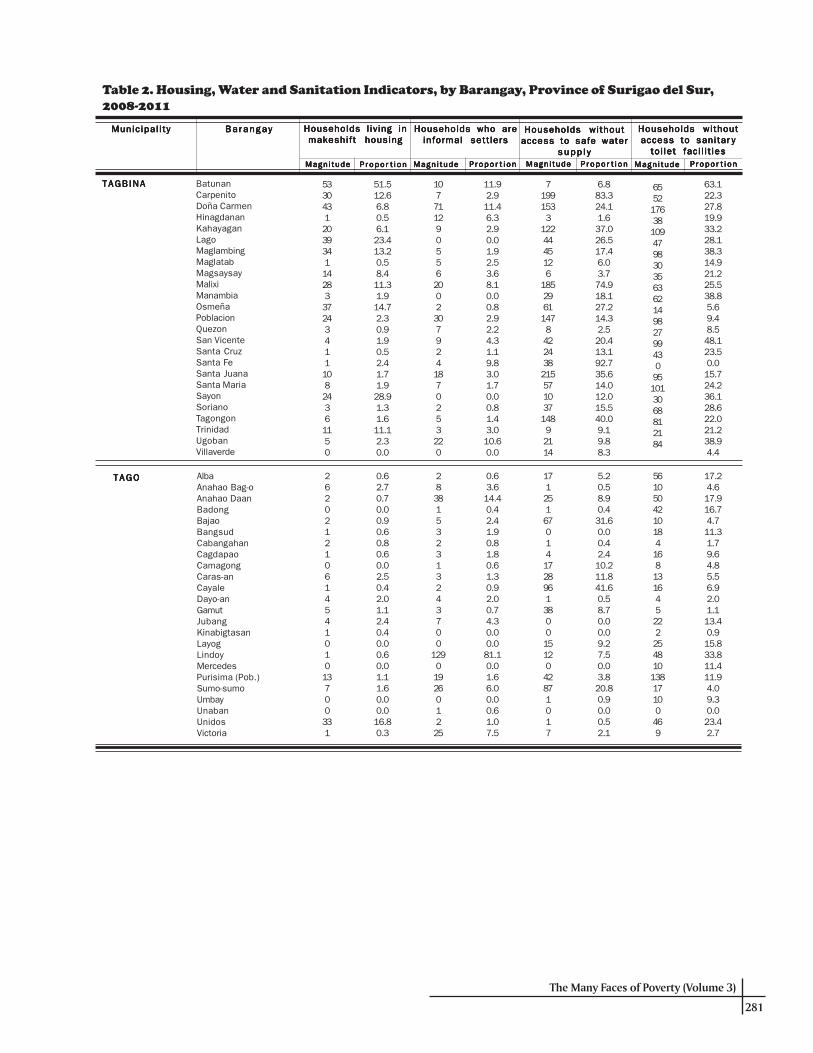
The Many Faces of Poverty (Volume 3)
281
Table 2. Housing, Water and Sanitation Indicators, by Barangay, Province of Surigao del Sur,2008-2011
Households l iv ing inHouseholds l iv ing inHouseholds l iv ing inHouseholds l iv ing inHouseholds l iv ing inmakeshift housingmakeshift housingmakeshift housingmakeshift housingmakeshift housing
Households who areHouseholds who areHouseholds who areHouseholds who areHouseholds who areinformal sett lersinformal sett lersinformal sett lersinformal sett lersinformal sett lers
Households withoutHouseholds withoutHouseholds withoutHouseholds withoutHouseholds withoutaccess to safe wateraccess to safe wateraccess to safe wateraccess to safe wateraccess to safe water
supp l ysupp l ysupp l ysupp l ysupp l y
Households withoutHouseholds withoutHouseholds withoutHouseholds withoutHouseholds withoutaccess to sanitaraccess to sanitaraccess to sanitaraccess to sanitaraccess to sanitar yyyyy
toi let faci l i t iestoi let faci l i t iestoi let faci l i t iestoi let faci l i t iestoi let faci l i t ies
Ba ranga yBa ranga yBa ranga yBa ranga yBa ranga yMunic ipal i tyMunic ipal i tyMunic ipal i tyMunic ipal i tyMunic ipal i ty
P rP rP rP rP r opo ropo ropo ropo ropo r t i o nt i o nt i o nt i o nt i o nP rP rP rP rP r opo ropo ropo ropo ropo r t i o nt i o nt i o nt i o nt i o n P rP rP rP rP r opo ropo ropo ropo ropo r t i o nt i o nt i o nt i o nt i o n P rP rP rP rP r opo ropo ropo ropo ropo r t i o nt i o nt i o nt i o nt i o nMagn i tudeMagn i tudeMagn i tudeMagn i tudeMagn i tude Magn i tudeMagn i tudeMagn i tudeMagn i tudeMagn i tude Magn i tudeMagn i tudeMagn i tudeMagn i tudeMagn i tude Magn i tudeMagn i tudeMagn i tudeMagn i tudeMagn i tude
TAGB INATAGBINATAGBINATAGBINATAGBINA BatunanCarpenitoDoña CarmenHinagdananKahayaganLagoMaglambingMaglatabMagsaysayMalixiManambiaOsmeñaPoblacionQuezonSan VicenteSanta CruzSanta FeSanta JuanaSanta MariaSayonSorianoTagongonTrinidadUgobanVillaverde
TAGOTAGOTAGOTAGOTAGO AlbaAnahao Bag-oAnahao DaanBadongBajaoBangsudCabangahanCagdapaoCamagongCaras-anCayaleDayo-anGamutJubangKinabigtasanLayogLindoyMercedesPurisima (Pob.)Sumo-sumoUmbayUnabanUnidosVictoria
53304312039341142833724341110824361150
51.512.66.80.56.123.413.20.58.411.31.914.72.30.91.90.52.41.71.928.91.31.611.12.30.0
71991533
1224445126
1852961147842243821557103714892114
6.883.324.11.637.026.517.46.03.774.918.127.214.32.520.413.192.735.614.012.015.540.09.19.88.3
65521763810947983035636214982799430951013068812184
63.122.327.819.933.228.138.314.921.225.538.85.69.48.548.123.50.015.724.236.128.622.021.238.94.4
26202121061454101013700331
0.62.70.70.00.90.60.80.60.02.50.42.01.12.40.40.00.60.01.11.60.00.016.80.3
17125167014172896138001512042871017
5.20.58.90.431.60.00.42.410.211.841.60.58.70.00.09.27.50.03.820.80.90.00.52.1
561050421018416813164522225481013817100469
17.24.617.916.74.711.31.79.64.85.56.92.01.113.40.915.833.811.411.94.09.30.023.42.7
10771129055620023079241870253220
11.92.911.46.32.90.01.92.53.68.10.00.82.92.24.31.19.83.01.70.00.81.43.010.60.0
28381532313243700
1290192601225
0.63.614.40.42.41.90.81.80.61.30.92.00.74.30.00.081.10.01.66.00.00.61.07.5

282
The Many Faces of Poverty (Volume 3)
Map 15. Proportion of Children 6-12 years old Not Attending Elementary School,by Municipality, 2008-2011
Map 16. Proportion of Children 6-12 years old Not Attending Elementary School,by Barangay, 2008-2011
CARRASCAL CANTILAN
MADRIDCARMENLANUZA
TANDAG
CORTES
SAN MIGUELCAGWAIT
MARIHATAGSAN AGUSTIN
LIANGA
BAROBO
TAGBINAHINATUAN
BISLIG CITYLINGIG
TAGO BAYABAS
21.926.7
16.915.827.4
20.5
27.2
15.6 16.9
22.528.6
15.622.1
22.8
20.2
19.623.9
18.624.9
CARRASCAL CANTILAN
MADRIDCARMENLANUZA
TANDAG
CORTES
SAN MIGUELCAGWAIT
MARIHATAGSAN AGUSTIN
LIANGA
BAROBO
TAGBINAHINATUAN
BISLIG CITYLINGIG
TAGO BAYABAS
21.926.7
16.915.827.4
20.5
27.2
15.6 16.9
22.528.6
15.622.1
22.8
20.2
19.623.9
18.624.9
CBMS Poverty Maps: Surigao del Sur
M unicip al i t y M ag ni t ud e P ro p o r t io n
San M iguel 1869 28.6
Lanuza 506 27.4
City of Tandag 1940 27.2
Cant ilan 1081 26.7
Lingig 1255 24.9
Hinatuan 1402 23.9Lianga 1133 22.8Cagwait 708 22.5San A gust in 679 22.1Carrascal 548 21.9Cortes 524 20.5B arobo 1488 20.2Tagbina 1162 19 .6City of Bislig 1819 18 .6B ayabas 243 16 .9M adrid 386 16 .9Carmen 253 15.8Tago 879 15.6M arihatag 537 15.6
C hild ren no t a t t end ing e lement ary scho o l ( 6 - 12 years o ld )
M unicip al i t y B arangay M ag nit ude Pro po rt io n
Cant ilan Lobo 74 62.7San M iguel Calatngan 133 55.6City of Tandag San Agust in Sur 328 50.4San M iguel Bitaugan 141 47.2Lanuza Habag 53 44.9Lingig Palo Alto 54 44.3
Cant ilan Calagdaan 113 44.0
San Agust in Gata 182 44.0
San M iguel Umalag 78 43.6Carrascal Pantukan 55 42.0
B o t t o m 10 B arangays

The Many Faces of Poverty (Volume 3)
283
Map 18. Proportion of Children 13-16 years old Not Attending High School,by Barangay, 2008-2011
Map 17. Proportion of Children 13-16 years old Not Attending High School,by Municipality, 2008-2011
CARRASCAL CANTILAN
MADRIDCARMENLANUZA
TANDAG
CORTES
SAN MIGUELCAGWAIT
MARIHATAGSAN AGUSTIN
LIANGA
BAROBO
TAGBINAHINATUAN
BISLIG CITYLINGIG
TAGO BAYABAS
38.242.1
24.130.750.8
34.2
37.9
39.4 38.6
43.554.0
42.738.4
47.4
43.2
51.240.7
35.356.3
CARRASCAL CANTILAN
MADRIDCARMENLANUZA
TANDAG
CORTES
SAN MIGUELCAGWAIT
MARIHATAGSAN AGUSTIN
LIANGA
BAROBO
TAGBINAHINATUAN
BISLIG CITYLINGIG
TAGO BAYABAS
38.242.1
24.130.750.8
34.2
37.9
39.4 38.6
43.554.0
42.738.4
47.4
43.2
51.240.7
35.356.3
M unic ip a l it y M ag ni t ud e Pr o p o r t io n
Lingig 1664 56.3
San M iguel 1906 54.0
Tagb ina 1962 51.2
Lanuza 553 50.8
Lianga 1297 47.4
Cagwait 775 43 .5B arobo 1737 43 .2M arihatag 787 42 .7Cant ilan 879 42.1Hinatuan 1342 40 .7Tago 1193 39 .4B ayabas 280 38 .6San A gust in 691 38 .4Carrascal 557 38 .2City of Tandag 1471 37.9City of B islig 2157 35.3Cortes 509 34 .2Carmen 282 30 .7M adrid 307 24.1
C hi ld ren no t a t t end ing hig h scho o l ( 13 - 16 years o ld )
M unicipalit y Barangay M agnit ude Proport ion
San M iguel Calatngan 96 88.1San M iguel Bagyang 121 87.7Lanuza Mampi 56 86.2San M iguel Bitaugan 142 86.1Cantilan Lobo 61 84.7Lingig Mahayahay 78 83.0
Carrascal Pantukan 52 81.3
San M iguel Umalag 74 80.4
Lingig Rajah Cabungso-an 165 77.5Lingig Bogak 154 77.0
Bot t om 10 Barangays
CBMS Poverty Maps: Surigao del Sur